marcia l. zucker, ph.d. zivd llc - point-of-care … lee-white clotting time add blood to glass...
TRANSCRIPT

1
Marcia L. Zucker, Ph.D.
ZIVD LLC

Monitoring hemostasis
Bleeding Clotting
2
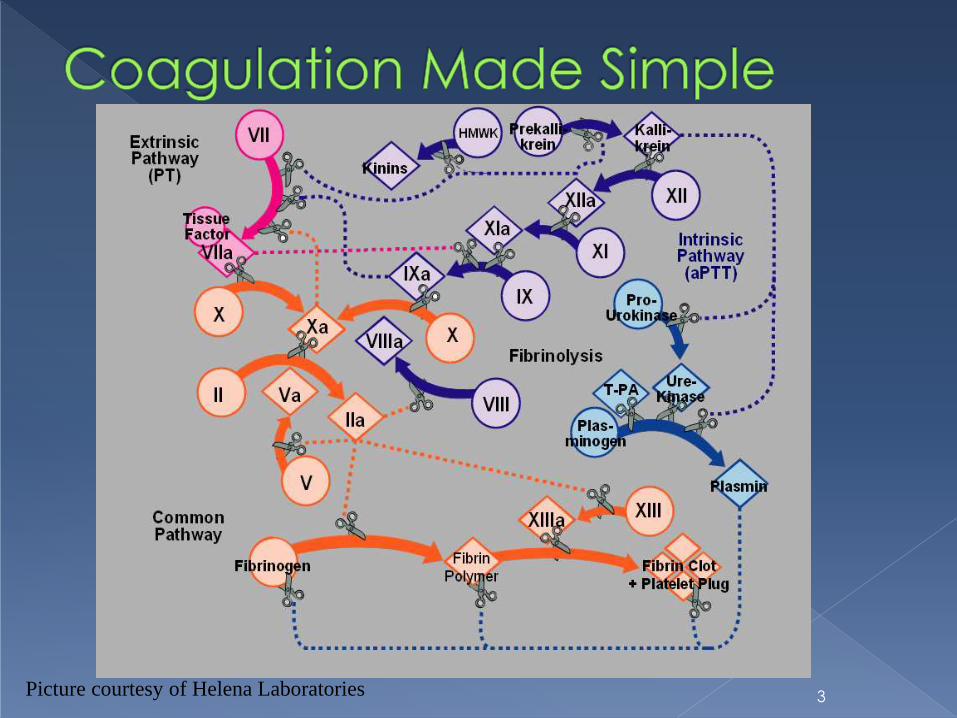
Picture courtesy of Helena Laboratories 3

Extrinsic Pathway
Common Pathway
CLOT
X Xa
II IIa (thrombin)
WARFARIN
LMWH & DXaI
Hirudin & DTI
Monitor with
ACT / aPTT
Monitor
with PT
Monitor
with ???
4

Glucopolysaccharide
MW range: 6,000 - 25,000 daltons
Only ~1/3 molecules active › Must contain specific sequence of
glucosaccharides to function
5

Heparin + AT
Heparin + AT
Heparin + AT
Heparin + AT
Heparin Activity
Prekallikrein ….. Kallikrein
D-dimers FDP
Fibrinolysis
12
11
9
8
10
5
2
7
Fibrinogen CLOT
(Fibrin)
Modified from Utley, Vol.1, 1982
Thrombin
6

Potency varies by manufacturer › Potency varies by lot
Dose response varies by patient › Half life ranges from 60 - 120 minutes
› Non-specific binding
Functions by accelerating action of antithrombin › Antithrombin level critical for appropriate
response
7

Laboratory measures of activity 𝛼 Factor Xa
𝛼 Factor IIa (thrombin)
› No clear correlation between heparin activity
and patient outcome
› TAT generally too long for peri-procedural use
Viscoelastography TEG / ROTEM
› Reflects entire coagulation process
Requires interpretation
› TAT generally too long for peri-procedural use
ACT 8

Modified Lee-White clotting time Add blood to glass tube, shake Place in heat block
Visual clot detection
First described in 1966 by Hattersley › Activated Clotting Time
Add blood to glass tube with dirt, shake Diatomaceous earth activator
Place in heat block
Visual clot detection
Proposed for both screening for coagulation
defects and for heparin monitoring
9

Extrinsic Pathway
Common Pathway
CLOT
10

Point of Care
› Immediate turn around
› Rapidly adjust anticoagulant dosing as needed
Literature supports use of ACT Poor correlation between ACT & heparin level (1981)
Hemochron and HemoTec clinically different (1988)
Differences ignored by clinicians, yet…
› Improved clinical outcome with ACT use Reviewed: 2007 NACB Laboratory medicine practice guideline for
point of care coagulation testing http://www.aacc.org/SiteCollectionDocuments/NACB/LMPG/POCTLM
PG.pdf#page=37
11

Activator
› diatomaceous earth; kaolin; glass beads; thromboplastin; combinations
Sample measurement
› Manual; automated
Sample mixing
› Manual; automated; physical; chemical
Endpoint detection
› Clot; surrogate marker
By design! 12

HEMOCHRONOMETER › Later - HEMOCHRON
› Add blood to tube, shake Manual sample treatment
› Place in test well Automated heating
Mechanical, objective fibrin clot detection
› Two different activators CA510 (later FTCA510)
Diatomaceous earth
P214 glass bead
13
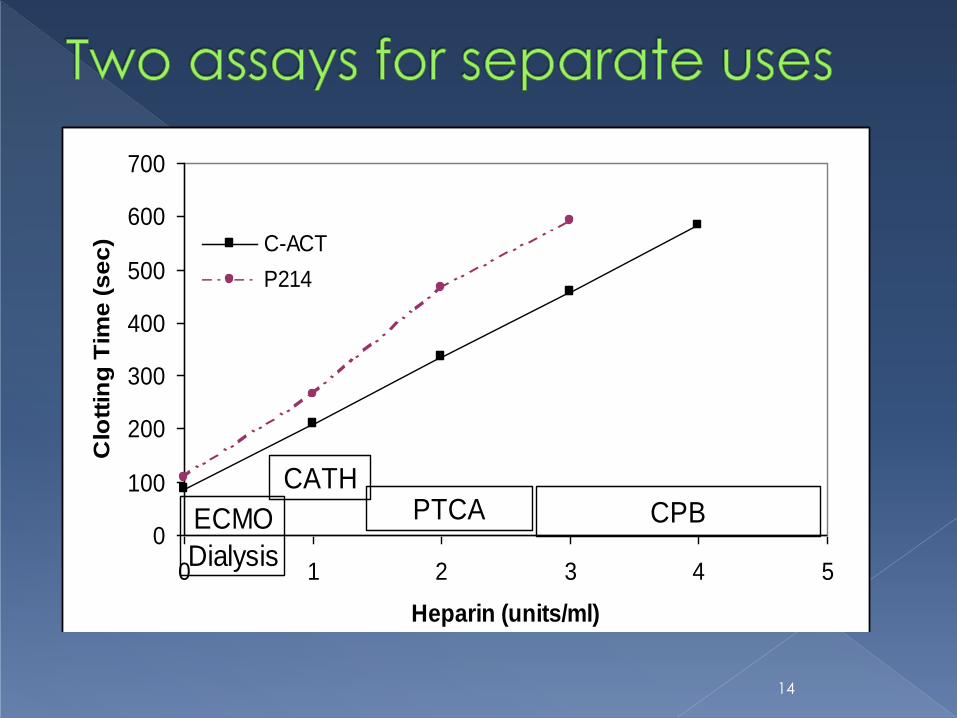
0
100
200
300
400
500
600
700
0 1 2 3 4 5
Heparin (units/ml)
Clo
ttin
g T
ime
(s
ec
) C-ACT
P214
ECMO
Dialysis
CATHPTCA CPB
14
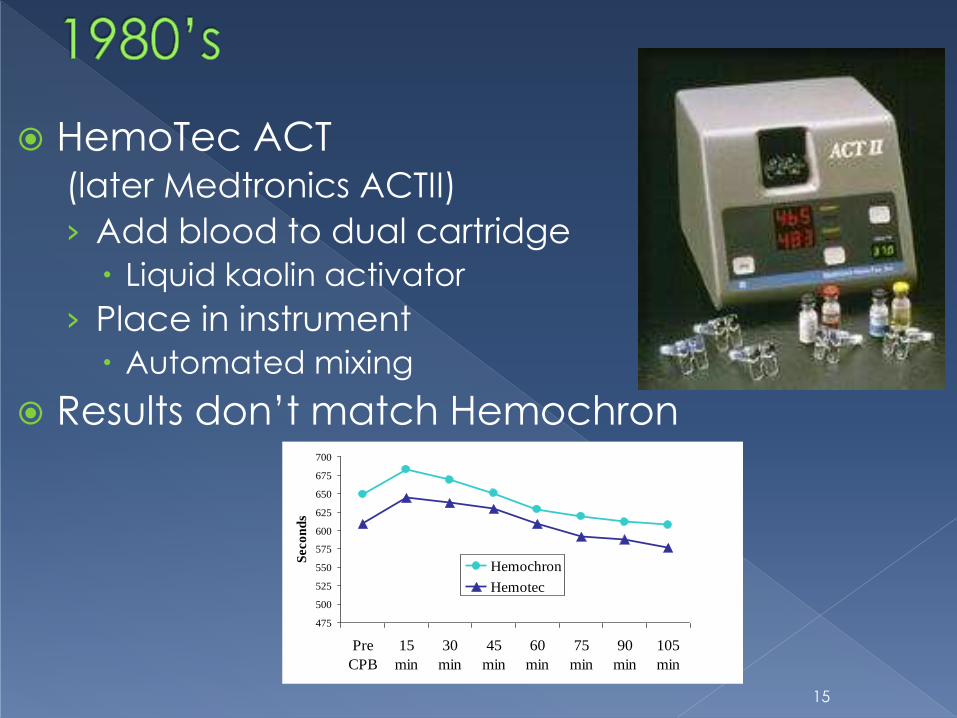
HemoTec ACT (later Medtronics ACTII)
› Add blood to dual cartridge
Liquid kaolin activator
› Place in instrument
Automated mixing
Results don’t match Hemochron
475
500
525
550
575
600
625
650
675
700
Pre
CPB
15
min
30
min
45
min
60
min
75
min
90
min
105
min
Secon
ds
Hemochron
Hemotec
15
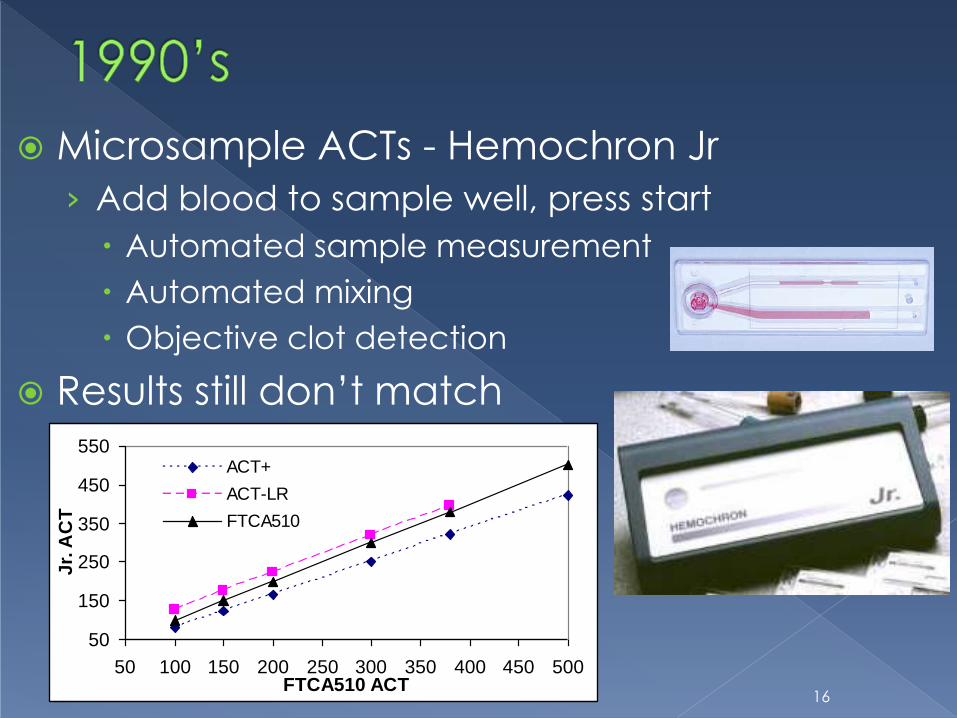
Microsample ACTs - Hemochron Jr
› Add blood to sample well, press start
Automated sample measurement
Automated mixing
Objective clot detection
Results still don’t match
50
150
250
350
450
550
50 100 150 200 250 300 350 400 450 500FTCA510 ACT
Jr.
AC
T
ACT+
ACT-LR
FTCA510
16

Abbott Point of Care - i-STAT › Thrombin detection
Synthetic thrombin substrate
Electro-active compound formed, detected amperometrically
Clotting time reported
› First non-mechanical clot detection A
› Direct chemical assessment of the
appearance of active thrombin
17

Cardiac surgery Recommended as 1o method in AmSECT guidelines
Percutaneous coronary intervention (PCI)
Interventional cardiology
ECMO
Critical care
Interventional radiology
Electrophysiology
Vascular surgery
etc. 18

“Standard” target times
› Most developed with manual ACT
› Suggested due to high variability
› No evidence for optimal ACT targets
Drug defined targets
› GPIIb/IIIa Inhibitors; Angiomax
› Drug manufacturer defines ACT target
Does not specify ACT type
Ignores “off-label” indications
19

Clinical Correlation
› In clinical setting to be used
Do not compare in CVOR to change in cath lab
› Data MUST span current target times
› Correlation coefficient
R > 0.88
20
CORRELATE DOES
NOT MEAN MATCH

Data used to predict new target time
Clinical agreement determined from
predicted target time
› Only method of value in ECMO, sheath pull
Range of values too small for correlation
analysis
21

22
CVOR example
Current New N %
> 480 > 520 72 34%
> 480 < 520 19 9%
< 480 > 520 7 3%
<480 <520 117 54%
88% agreement • 21 of 26 discrepancies
• Current value within 10% of 480
• 5 of 26 discrepancies
• New leads to additional heparin given
Source:
› Reagent differences
› Technology differences
› No standardization
Alter target times to Maintain clinical
protocols
23
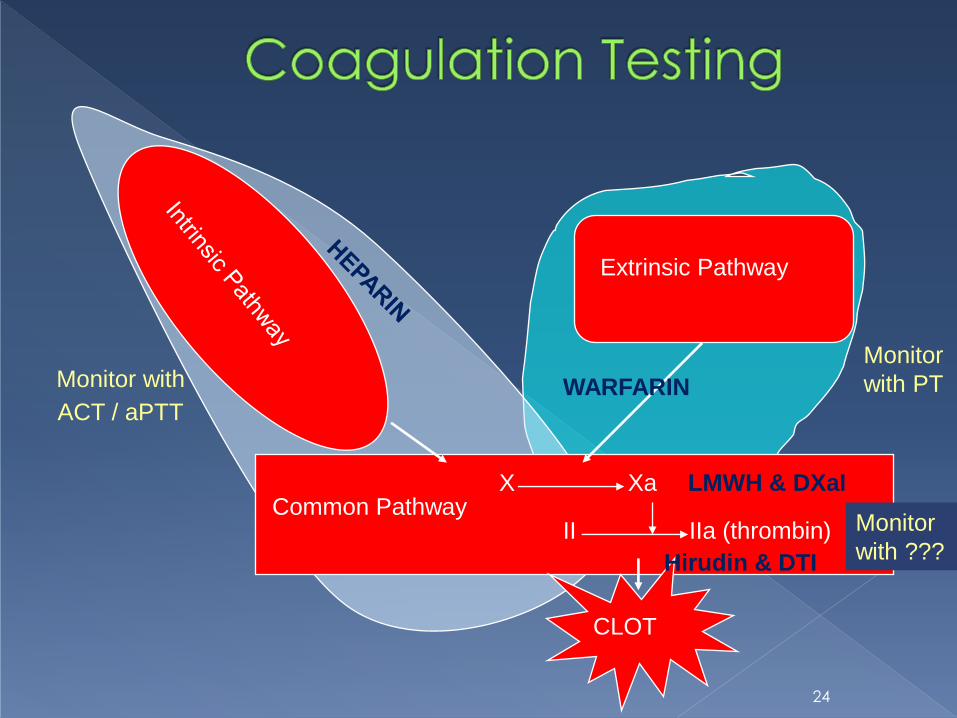
Extrinsic Pathway
Common Pathway
CLOT
X Xa
II IIa (thrombin)
WARFARIN
LMWH & DXaI
Hirudin & DTI
Monitor with
ACT / aPTT
Monitor
with PT
Monitor
with ???
24

ACT
› Activated clotting
time
› POC Only
› Low, moderate or
high dose heparin
System dependent
aPTT
› Activated partial thromboplastin time
› Laboratory or POC
› Low dose heparin only
• System dependent
upper limit
25

Extrinsic Pathway
Common Pathway
CLOT
X Xa
II IIa (thrombin)
WARFARIN
LMWH & DXaI
Hirudin & DTI
Monitor with
ACT / aPTT
Monitor
with PT
Monitor
with ???
26
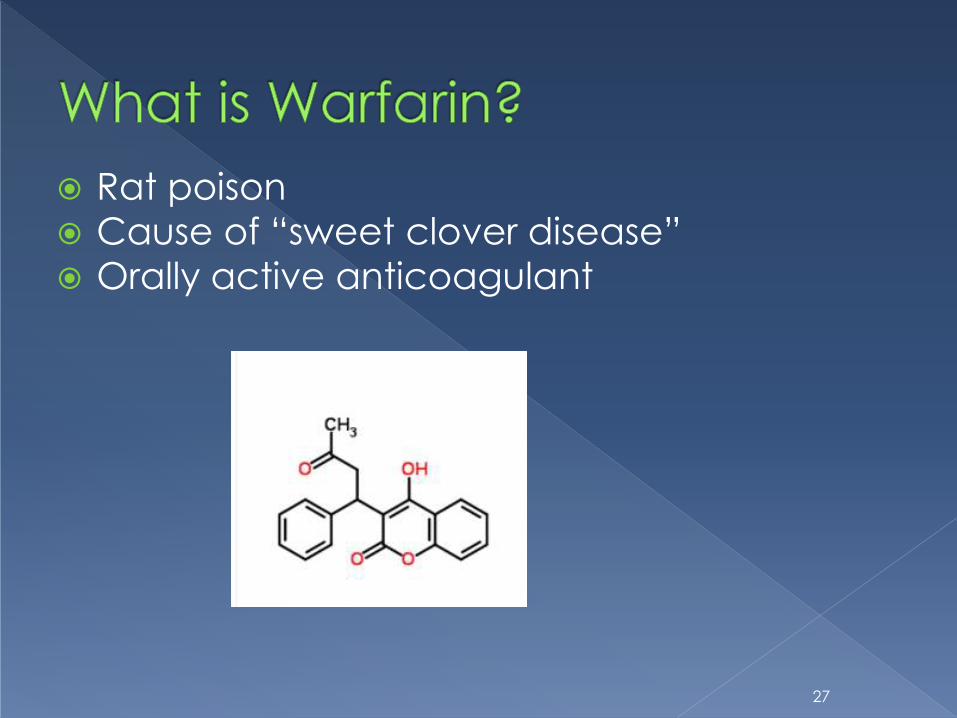
Rat poison
Cause of “sweet clover disease”
Orally active anticoagulant
27

28

Potency may vary by manufacturer
Dose response varies by patient › Dietary interactions
› Life-style influences
Functions by decreasing production of Vitamin K dependent clotting factors in liver › Delayed onset of anticoagulation
29

Quick, et. al., 1937 – Prothrombin Time
› Combine thromboplastin, calcium and patient
plasma
Measures activity of factors I, II, V, VII, X
40 – 50 years pass › Thromboplastin isolated from:
Different species Different organs
pig; cow; human; etc. brain; thymus; lung; etc.
› All yield different results Results vary by instrument system in use
Manual tilt tube “gold standard”
Fibrometer; automated coagulation systems
› PT ratios adopted to determine therapeutic range
30

1983 – WHO and ISTH recommend the use of
the INR to standardize PT result reporting
International Normalized Ratio (INR) › ISI = international Sensitivity Index
› INR target ranges are specified by patient
populations, e.g.,
DVT, Afib, Atrial MHV: INR= 2.0 - 3.0
Mitral mechanical heart valve: INR= 2.5 – 3.5
Individual variation
31

ISI › Initially determined by reagent manufacturer
› Traceable to IRP International Reference thromboplastin Preparation
› WHO defined process Calibration up to INR = 4.5
manual tilt tube method reference
› Local calibrations can be performed to determine the instrument specific ISI1
Mean normal PT › The mean normal PT should be determined for each
new batch of thromboplastin with the same instrument used to assay the PT1
32
Antithrombotic therapy and prevention of thrombosis, 9th ed: ACCP guidelines. CHEST
2012; 141(2)(Suppl):e44S–e88S

Local calibration may introduce variability
› Same sample yields different results depending
on calibration method
33
ISI and MNPT from Poller et. al., J Thromb Haemost 2012; 10: 1379–84.

Manufacturer assigns ISI and mean
normal PT (MNPT)
› Lot specific
Traceable to IRP
› Often through secondary standard
Cannot be changed by end user
› Does not vary by location of testing
34

but it WILL Correlate
35
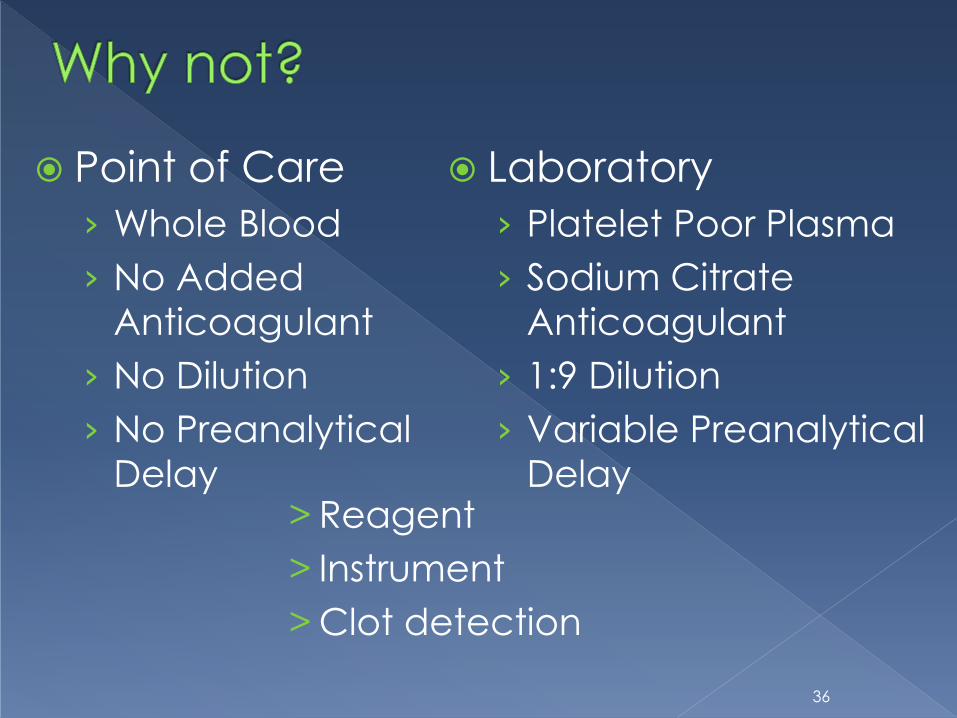
Point of Care
› Whole Blood
› No Added
Anticoagulant
› No Dilution
› No Preanalytical
Delay
Laboratory
› Platelet Poor Plasma
› Sodium Citrate
Anticoagulant
› 1:9 Dilution
› Variable Preanalytical
Delay > Reagent
> Instrument
> Clot detection
36

Correlation data from: Plesch et. al, Thromb Res 2008; 123:381–9
37
Thromboplastin Analyzer calibration Thromboplastin Analyzer calibration
Innovin CA1500 Local vs rTF/95 HepatoQuick STA-R Manufacturer
Recombiplastin MLA1800 Local vs rTF/95 Thrombotest KC10 Local vs OBT/79
Neoplastin Plus STA-R Manufacturer Thromboplastin C Plus CA1500 Manufacturer

10 OAT patients across 7 analyzer/
reagent combinations McGlasson, DL 2003: Lab Med 34: 124 – 9.
38

36 patients over 4 visits each › 3 POC; 1 lab
Solvik et. al., 2010: Clin Chem 56:1618–1626 (2010)
39
INR
% d
iff P
OC
1-S
TA
INR
% d
iff P
OC
2-S
TA
INR
% d
iff P
OC
3-S
TA

Jacobson, J Thromb Thrombolysis (2008) 25:10–11
Observed:
› + 0.4 at INR = 2.0
› + 0.8 at INR = 3.0
› + 1.2 at INR = 4.0
Standardization as with glucose is unlikely
› discrete analyte to be tested
› versus a biologic process
40

1. Understand limitations in the INR
› Whenever a patient undergoes duplicate
testing on different systems, there is the
potential for disagreement
2. Attempt to have patients managed
with a consistent methodology
Jacobson, J Thromb Thrombolysis (2008) 25:10–11
41

Lower dose?
Keep same dose?
Raise Dose?
Test Again?
Test more often?
42

Results Available While Patient is Present
› Improved Anticoagulation Management
› Improved Standard of Care
› Staff Efficiency
Immediate Retesting (if needed)
› Fingerstick Sampling
43

INR was developed to monitor effect of
vitamin K antagonists (warfarin, others)
INR is inappropriate scale for monitoring
coagulopathies
Most POC PT/INR tests cleared ONLY for
monitoring patients receiving oral
anticoagulation therapy such as
Coumadin or warfarin.
44
Monitoring hemostasis
Bleeding Clotting
45
