marco rafael linhares couto monitoring energy consumption...
TRANSCRIPT

Universidade do Minho
Escola de Engenharia
Marco Rafael Linhares Couto
Monitoring Energy Consumption
in Android Applications
September, 2014

This thesis is integrated in the project GreenSSCM - Green Software for Space MissionsControl, a project financed by the Innovation Agency, SA, Northern Regional Operatio-nal Programme, Financial Incentive Grant Agreement under the Incentive Research andDevelopment System, Project No. 38973.
Universidade do Minho
Dissertação de Mestrado
Escola de Engenharia
Departamento de Informática
Marco Rafael Linhares Couto
Monitoring Energy Consumption
in Android Applications
Mestrado em Engenharia Informática
Trabalho realizado sob orientação de
Professor João Alexandre Saraiva
Professor João Paulo Fernandes
September, 2014

Anexo 3
DECLARAÇÃO
Nome
Endereço electrónico: Telefone:
Número do Bilhete de Identidade:
Título dissertação n/tese �
Orientador(es):
Ano de conclusão:
Designação do Mestrado ou do Ramo de Conhecimento do Doutoramento:
Nos exemplares das teses de doutoramento ou de mestrado ou de outros trabalhos entregues para
prestação de provas públicas nas universidades ou outros estabelecimentos de ensino, e dos quais é
obrigatoriamente enviado um exemplar para depósito legal na Biblioteca Nacional e, pelo menos outro para
a biblioteca da universidade respectiva, deve constar uma das seguintes declarações:
1. É AUTORIZADA A REPRODUÇÃO INTEGRAL DESTA TESE/TRABALHO APENAS PARA EFEITOS DE
INVESTIGAÇÃO, MEDIANTE DECLARAÇÃO ESCRITA DO INTERESSADO, QUE A TAL SE
COMPROMETE;
2. É AUTORIZADA A REPRODUÇÃO PARCIAL DESTA TESE/TRABALHO (indicar, caso tal seja
necessário, n" máximo de páginas, ilustrações, gráficos, e tc ) , APENAS PARA EFEITOS DE
INVESTIGAÇÃO, , MEDIANTE DECLARAÇÃO ESCRITA DO INTERESSADO, QUE A TAL SE
COMPROMETE;
3. DE ACORDO COM A LEGISLAÇÃO EM VIGOR, NÃO É PERMITIDA A REPRODUÇÃO DE QUALQUER
PARTE DESTA TESE/TRABALHO
Universidade do Minho,
Assinatura:
01 09 2014
Marco Rafael Linhares Couto
[email protected] 253 811 937 93 93 96 923
Monitoring Energy Consumption in Android Applications
João Alexandre Saraiva
João Paulo Fernandes 2014
Mestrado em Engenharia Informática
13715724 0 ZY9

AC K N OW L E D G M E N T S
As all journeys must come to an end, journey towards a masters degree is finally coming to a close.
All the difficulties, struggles and failures that appeared were impossible to overcome alone, and as
such I am obligated to show my gratitude with who supported me on this effort. First of all, I would
like to thank all my family for all their patience and support they gave me. Second, I have to thanks
my supervisor, professor Joao Saraiva, and my co-supervisor, professor Joao Paulo Fernandes, since
they were the most usual source of support and advice. Their support for me never wavered, and after
this work I see them as role models. A warm thanks is also extended to professor Jacome Cunha,
another role model for me, and all the remaining members of Green Lab (Pedro Martins, Jorge
Mendes, Rui Pereira and Tiago Carcao), and to the members of the GreenSSCM1 project. Their
critics and advices were absolutely crucial in countless times. At last (but not least) I would like to
thanks professor Robert Dick, from Michigan University (USA), for his great availability when his
help was needed.
1 This work is integrated in the project GreenSSCM - Green Software for Space Missions Control, a project financed bythe Innovation Agency, SA, Northern Regional Operational Programme, Financial Incentive Grant Agreement under theIncentive Research and Development System, Project No. 38973.
5
A B S T R AC T
The use of powerful mobile devices, like smartphones, tablets and laptops, are changing the way
programmers develop software. While in the past the primary goal to optimize software was reducing
the run time, nowadays there is a growing awareness of the need to reduce energy consumption.
In this thesis we present a combination of techniques to detect anomalous energy consumption
in Android applications, and to relate it to their source code. The idea is to provide applications
developers with techniques and tools to locate in the source code of the application the code fragments
that are responsible for high energy consumption. Thus, we present a model for energy consumption
for the Android ecosystem.
The model is then used as an API to monitor the application execution. To relate program execution
and energy consumption to the application source code, the code is first instrumented with calls to the
API of the model. To execute that (instrumented) application, we use a testing framework for Android.
Finally, we use a statistically approach, based on fault-localization techniques, to localize abnormal
energy consumption in the source code.
6

R E S U M O
O uso de dispositivos moveis, como smartphones, tablets ou portateis, estao a mudar a forma como
os programadores desenvolvem software. Enquanto que no passado o principal objetivo para otimizar
software era o de diminuir o tempo de execucao, nos dias de hoje existe uma sensibilizacao crescente
para com a necessidade de reduzir o consumo de energia.
Esta dissertacao visa apresentar uma combinacao de tecnicas para detetar consumos de energia
anormais no codigo de aplicacoes Android. A ideia e fornecer aos desenvolvedores de aplicacoes An-
droid tecnicas e ferramentas que consigam localizar no codigo fonte de uma aplicacao fragmentos de
codigo que sejam responsaveis por nıves de consumo de energia mais elevados. Assim, apresentamos
um modelo de consumo de energia para o sistema Android.
Esse modelo e depois usado na forma de API para monitorizar a execucao da aplicacao. Assim
sendo, o codigo fonte de uma aplicacao e inicialmente instrumentado para podermos relacionar com
ele consumos de energia. Para executar a aplicacao (instrumentada), usamos uma framework de
testing para Android.
Finalmente, usamos uma abordagem estatica, baseada em tecnicas de localizacao de falhas, para
localizar consumos de energia anormais no codigo fonte.
7

C O N T E N T S
Contents iii
i I N T RO D U C T O RY M AT E R I A L 3
1 I N T RO D U C T I O N 4
1.1 Document structure 5
2 M OT I VAT I O N A N D O B J E C T I V E S 7
2.1 Background and Pretended Goals 7
3 S TAT E O F T H E A RT 10
3.1 Software Development: Monitoring tools 10
3.2 Green Computing and energy profiling 13
3.3 Monitoring Energy Consumption in Mobile devices 14
3.4 The selected tool: Power Tutor 18
4 T H E P RO B L E M A N D I T S C H A L L E N G E S 20
ii C O R E O F T H E D I S S E RTAT I O N 22
5 P O W E R C O N S U M P T I O N M O D E L 23
5.1 The Android Power Tutor Consumption Model 23
5.2 Static Model Calibration 25
5.3 Power Model: Dynamic Calibration 25
6 E N E R G Y C O N S U M P T I O N I N S O U R C E C O D E 28
6.1 The Model as an API 28
6.2 Source Code Instrumentation 29
6.3 Automatic Execution of the Instrumented Application 31
6.4 Green-aware Classification of Source Code Methods 32
7 G R E E N D RO I D : T H E F R A M E W O R K F O R E N E R G Y P RO F I L I N G 34
7.1 Workflow 34
7.1.1 Instrumenting the source code 35
7.1.2 Execute the tests 35
7.1.3 Pull files from the device 36
7.1.4 Classify the methods 36
7.1.5 Generate the results 37
8 R E S U LT S 38
9 C O N C L U S I O N S A N D F U T U R E W O R K 43
9.1 Achievements/Contributions 43
iii

Contents
9.2 Future Work 44
iii A P E N D I C E S 50
A S U P P O RT W O R K 51
B D E TA I L S O F R E S U LT S 52
B.1 Results for 0xBenchmark 52
B.2 Results for AppTracker 54
B.3 Results for Catlog 56
B.4 Results for ChordReader 58
B.5 Results for Connectbot 60
B.6 Results for Google Authenticator 63
B.7 Results for NewsBlur 69
C T O O L I N G 71
C.1 Power Tutor 71
C.1.1 Construction of the power model 71
C.1.2 Assign power/energy to applications 72
C.2 Java Parser 72
C.3 Java DOM Parser 72
C.4 Android JUnit Report Test Runner 73
C.5 Zoomable Sunburst 73
iv

L I S T O F F I G U R E S
Figure 1 The 3 layers of the Green Droid tool and its interactions 9
Figure 2 An example of an execution of the GDB tool 11
Figure 3 GZoltar tool inside the Eclipse IDE 11
Figure 4 A comparison of memory usage between two implementations of the same
program (in Haskell) 12
Figure 5 Power Tutor execution views (reprinted from [43]) 18
Figure 6 Caption for image 24
Figure 7 3G interface power states (reprinted from [43]) 24
Figure 8 The architecture to dynamically calibrate the power model for different de-
vices 26
Figure 9 The behavior of the instrumentation tool 29
Figure 10 The behavior of the monitoring framework 35
Figure 11 Sunburst diagram (and how to interpret it) 37
Figure 12 Main page of the 0xBenchmark application 38
Figure 13 Total consumption per test (0xBenchmark) 39
Figure 14 Consumption per second (0xBenchmark) 39
Figure 15 Execution time (0xBenchmark) 39
Figure 16 Total consumption per test (Google Authenticator) 40
Figure 17 Consumption per second (Google Authenticator) 40
Figure 18 Execution time (Google Authenticator) 41
Figure 19 Sunburst diagram for 0xBenchmark application (and how to interpret it) 42
Figure 20 Sunburst diagram for Google Authenticator application 42
Figure 21 Total consumption per test for 0xBenchmark application 53
Figure 22 Consumption per second for 0xBenchmark application 53
Figure 23 Execution time per test for 0xBenchmark application 53
Figure 24 Total consumption per test for Apptracker application 54
Figure 25 Consumption per second for Apptracker application 55
Figure 26 Execution time per test for Apptracker application 55
Figure 27 Total consumption per test for Catlog application 56
Figure 28 Consumption per second for Catlog application 56
Figure 29 Execution time per test for Catlog application 57
Figure 30 Total consumption per test for Chordreader application 59
Figure 31 Consumption per second for Chordreader application 59
v

List of Figures
Figure 32 Execution time per test for Chordreader application 59
Figure 33 Total consumption per test for Connectbot application 60
Figure 34 Consumption per second for Connectbot application 60
Figure 35 Execution time per test for Connectbot application 61
Figure 36 Total consumption per test for Google Authenticator application 67
Figure 37 Consumption per second for Google Authenticator application 67
Figure 38 Execution time per test for Google Authenticator application 68
Figure 39 Total consumption per test for NewsBlur application 69
Figure 40 Consumption per second for NewsBlur application 70
Figure 41 Execution time per test for NewsBlur application 70
vi

L I S T O F TA B L E S
Table 3 Top Smartphone Operating Systems, Shipments and Market Share in 2013
(Units in Millions) 14
Table 4 Example of a power model instance for HTC Dream smartphone (reprinted
from [43]) 19
Table 5 List and detalis of the Android applications tested 51
Table 6 Details of each test from 0xBenchmark application 52
Table 7 Details of each test from AppTracker application 54
Table 8 Details of each test from Catlog application 56
Table 9 Details of each test from ChordReader application 58
Table 10 Details of each test from Connectbot application 62
Table 11 Details of each test from Google Authenticator application 66
Table 12 Details of each test from NewsBlur application 69
vii
L I S T O F L I S T I N G S
3.1 Example of an use of nanoTime() method for performance analysis . . . . . . . . . . 12
6.1 Example of an utilization of traceMethod . . . . . . . . . . . . . . . . . . . . . . . 30
6.2 The changes made by jInst to test classes . . . . . . . . . . . . . . . . . . . . . . . . . 31
viii
AC RO N Y M S
A P I Application Programming Interface
C P U Central Processing Unit
L C D Liquid Crystal Display
U I D User Identifier
O S Operating System
M W Milliwatts
M H Z Megahertz
G P S Global Positioning System
AU T Application Under Test
X M L eXtensible Markup Language
S D K Software Development Kit
S F L Spectrum-Based Fault Localization
G C C GNU Compiler Collection
A P K Android Package

Part I
I N T RO D U C T O RY M AT E R I A L
1
I N T RO D U C T I O N
The software engineering and programming languages research communities have developed ad-
vanced and widely-used techniques to improve both programming productivity and program perfor-
mance. For example, they developed powerful type and modular systems [11, 14], model-driven
software development approaches [4, 27], integrated development environments [17, 18] that, indeed,
improve programming productivity. These communities are also concerned with providing efficient
execution models for such programs, by using compiler-specific optimizations (like, tail recursion
elimination), partial evaluation [21], incremental computation [2], just-in-time compilation [26], de-
forestation and strictification of functional programs [19, 39, 40], for example. Most of those tech-
niques aim at improving performance by reducing both execution time and memory consumption.
While in the previous century computer users were mainly looking for fast computer software, this
is nowadays changing with the advent of powerful mobile devices, like laptops, tablets and mobile
devices. This trend to mobile devices is getting evident with the statistics regarding device shipments.
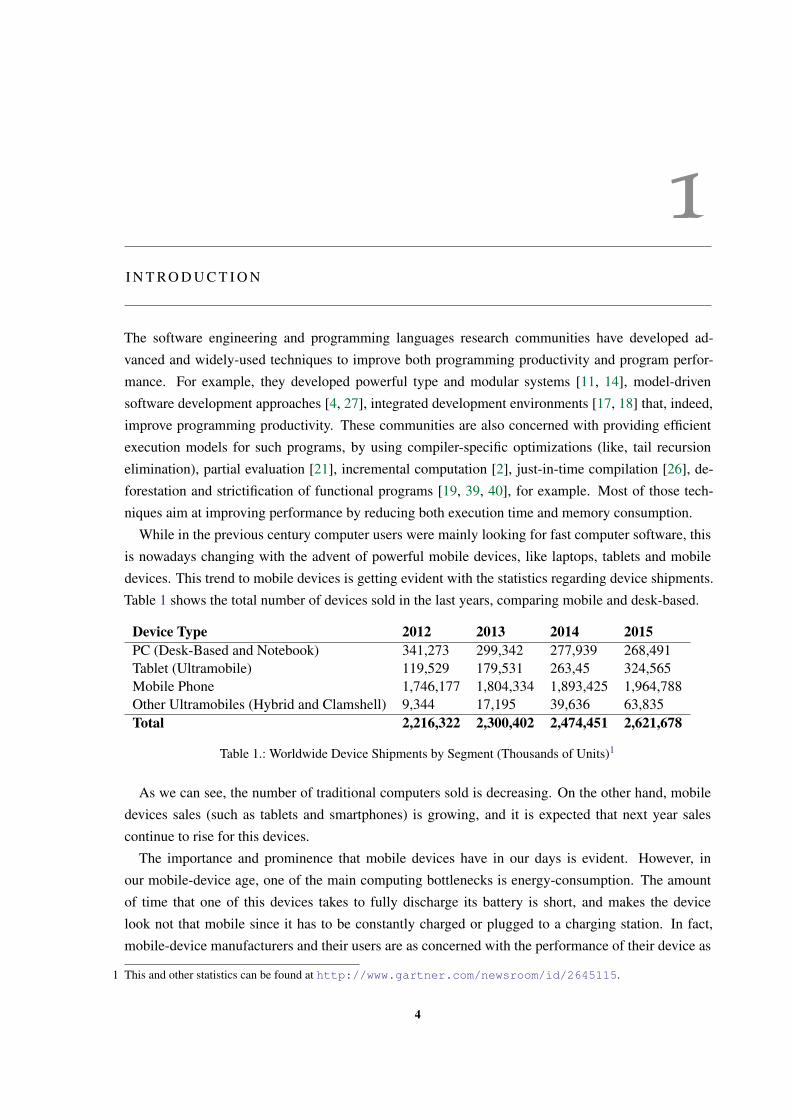
Table 1 shows the total number of devices sold in the last years, comparing mobile and desk-based.
Device Type 2012 2013 2014 2015PC (Desk-Based and Notebook) 341,273 299,342 277,939 268,491Tablet (Ultramobile) 119,529 179,531 263,45 324,565Mobile Phone 1,746,177 1,804,334 1,893,425 1,964,788Other Ultramobiles (Hybrid and Clamshell) 9,344 17,195 39,636 63,835Total 2,216,322 2,300,402 2,474,451 2,621,678
Table 1.: Worldwide Device Shipments by Segment (Thousands of Units)1
As we can see, the number of traditional computers sold is decreasing. On the other hand, mobile
devices sales (such as tablets and smartphones) is growing, and it is expected that next year sales
continue to rise for this devices.
The importance and prominence that mobile devices have in our days is evident. However, in
our mobile-device age, one of the main computing bottlenecks is energy-consumption. The amount
of time that one of this devices takes to fully discharge its battery is short, and makes the device
look not that mobile since it has to be constantly charged or plugged to a charging station. In fact,
mobile-device manufacturers and their users are as concerned with the performance of their device as
1 This and other statistics can be found at http://www.gartner.com/newsroom/id/2645115.
4

1.1. Document structure
with battery consumption/lifetime. Creating a device that takes longer to to discharge the battery is
obviously crucial and manufacturers are actually working in this front, but designing energy efficient
software is also an area needed to be explored.
This growing concern on energy efficiency may also be associated with the perspective of soft-
ware developers [35]. Unfortunately, developing energy-aware software is still a difficult task. While
programming languages provide several compiler optimizations (GCC has the optimization flags, for
example), memory profiling tools like the Heap Profiler [37] for Haskell, benchmark and time exe-
cution monitoring frameworks (in Java there is nanoTime() and timeInMillis() method calls, among
others), there are no equivalent tools/frameworks to profile/optimize energy consumption.
Another interesting point is that there is a clear gap in the works that have been done in energy
efficiency for the past years. Although there are several works aiming at reducing energy consumption
by software systems, those works are focused on optimizing the hardware [3, 5, 6], i.e. creating
hardware components such as CPUs or disks that spend less energy when executing software. The
interest in optimizing energy consumption by analyzing software is very recent. But if the software
is what triggers the hardware to work, it should be possible to design it to use the hardware in a way
that minimizes the energy consumed. The question here is how to do that, how can a developer know
what to change in the source code or what decisions he needs to make at the design phase, in order to
minimize the energy consumption at runtime. There is still no clear answer to this question, so this
area shows great research potential.
What this thesis aims to study is how software can influence the power consumption of mobile
devices, more specifically how Android applications affect the battery discharge in a device running
Android OS. If different implementations of identical software can have different values of power
consumption, as has already been showed [12], then it must be possible to identify source code in-
structions considered as energy ”threats”. For this, we intend to implement some techniques and
methodologies that can help developers to identify possible energy inefficient blocks of code (such as
methods or classes).
1.1 D O C U M E N T S T RU C T U R E
This document is organized as follows: besides the current chapter, the next one, Chapter 2, is destined
to identify the motivations we found for this work and to identify the goals we want to reach.
The state of the art in presented in Chapter 3, where we describe the work done in the past: what
have been studied and developed in this area. Here we present the different approaches that researchers
followed in order to implement their ideas, along with the work we mostly based ours in.
We clarify the problem we want to solve and identify the biggest problems and corresponding solu-
tions we had when we designed and implemented our technique/methodology, and when developing
the tool in Chapter 4.
5
1.1. Document structure
The next chapter, Chapter 5, is the start of the core of this dissertation. Here is described what a
power model is, most specifically the model we used, its different components and how it was created.
Section 5.1 is where we describe the power consumption model: what it is, how it is created and what
components does it have. In section 5.2 we start by explaining what a static model is and its limitations
for our purpose, and then in Section 5.3 we describe the methodology and algorithm to instantiate a
power model for a specific device. Chapter 6 describes the changes made to the power consumption
model so it can be used as an API to monitor power consumption at the source code level, as well as
the changes that the framework does to an application source code.
Chapter 7 shows the entire workflow of the final application. Every task is described, since the
power model calibration to the test cases execution. For every task described we identify what the
tool is expecting as input and what is expected to give as result (output).
In Chapter 8 is where we show the results and consequent conclusions we took from them. We
compare different results for different applications analyzed by our tool and explains how to interpret
them.
Finally, Chapter 9 we start by identifying the contributions and applications of our work, explaining
how we answered the questions previously identified, and then we discuss about the conclusions we
came to, as well as the future work we want to do.
6
2
M OT I VAT I O N A N D O B J E C T I V E S
In this chapter, we start by clarifying the motivation for our work, and the reasons why we think this
is an important research area. Next, we describe the goals we want to achieve with this work and the
questions we want to give an answer to.
2.1 B AC K G RO U N D A N D P R E T E N D E D G O A L S
Nowadays, the utilization of mobile devices is not restricted to sending messages and making phone
calls. In fact, the set of features and applications that mobile devices provide is increasingly varied,
from accessing the e-mail to social network integration. This aspect combined with the convenience
and easiness of use made the mobile device industry (manufacturing and applications development),
show evident signs of growth. The abundance of tasks that a mobile device allows the users to do made
the community look at them not as simple communication devices, but as a set of tools, applications
and utilities, with infinite possibilities. As a consequence of this growth, we face an increasing interest
in developing new application and adapting old ones to this new concept. But the convenience and
easiness of use that make mobile devices so attractive also creates a problem: the battery lifetime. The
fact is that the more functionality a device offers, the more energy it consumes, and as a consequence
its battery lifetime will be shorter and we have less ”mobile” use.
From the programmer’s viewpoint, we can say that, without increasing the available resources (like
memory, for example), the more efficient the application is, the less power will be consumed. But that
is an assumption that is only related to the CPU component. How to know if an applications is efficient
when using Wi-Fi or GPS? This components have significant influence in the power consumption of
the device as well, and many applications use them. A simple web search allows us to understand the
impact that these (and other) components have in the device energy consumption. Table 2 shows a
well known comparison between the battery lifetime in stand-by mode and executing different tasks:
phone calls, web browsing and video playback.
Each of these tasks need different hardware components and in different proportions. For example,
web browsing will mostly need Wi-Fi or 3G to download the information needed, and CPU to process
it, while video playback mostly needs CPU to run, for example, the decoding algorithm, and of course
1 This values and more information can be found at http://cell-phones.toptenreviews.com/mobiledevices/.
7

2.1. Background and Pretended Goals
Stand-by Talk Time Web browsing Video PlaybackSamsung Galaxy S5 390 h 21 h 10 h 12 hHTC One (M8) 496 h 20 h 9.5 h 11 hLG G2 540 h 25 h 11.5 h 12 hSamsung Galaxy Note 3 528 h 25 h 5 h 13.5 hApple iPhone 5s 250 h 10.5 h 10 h 10.5 hLG G Flex 600 h 25.5 h 9.5 h 20 hNokia Lumia Icon 432 h 16.5 h 7 h 9 hHuawei Ascend Mate2 650 h 25 h 8.5 h 12.5 hSony Xperia Z1s 600 h 15 h 6 h 7 hGoogle Nexus 5 300 h 15.3 h 4.5 h 5 h
Table 2.: Battery lifetime comparison1
the phone display. Most importantly, web browsing and video playback can be considered as software.
So this shows the enormous weight that software has in the battery duration/lifetime. So, the first
question that we face is: since the influence of software in battery lifetime is so obvious, how important
and useful can it be to optimize software in terms of energy consumption?
Taking this question as a starting point we then wanted to study the influence of software imple-
mentation in energy consumption, how different implementations of similar tasks can lead to different
(and possibly excessive) power consumption values. For that purpose, we needed to evaluate the pos-
sibility of analyzing power consumption at a more detailed level: source code level. We propose a
technique, based on an initial idea by [8], that turns the energy consumption analysis possible at the
methods level, and present a tool that brings the programmer a new and clearer vision about the effi-
ciency of an Android application, from a power consumption viewpoint. Being the battery one of the
most critical components of a mobile device, the advantages of monitoring its usage are evident.
We considered the main goal of this thesis developing a technique or methodology and then im-
plementing a tool that puts the methodology in practice. But besides that, we want to know if it can
be useful for the developers, since they are the target audience for us, and also if there are results
supporting the idea that energy consumption can be optimized by changing the source code, and so
this thesis also aims to answer to three other research questions:
• Q1: Given the source code of an Android application, is it possible to associate energy con-
sumption to different code sections?
• Q2: Is it possible to develop a tool that can automatically identify code fragments most likely
to have anomalous energy consumption, based on a power consumption model?
• Q3: Is the execution time of a code fragment directly proportional to its energy consumption?
Obviously, our tool will be used to help us answer all this questions, so we discussed and analyzed
in detail what was the best way to implement it. We decided to do it in a three layer architecture, as
8

2.1. Background and Pretended Goals
described in Figure 1. The tool is called Green Droid2, and works as a traditional tool that receives
values as parameters related to the application being tested and uses intermediate tools (such as the
instrumentation tool) as a sequence of steps to generate the results.
The calibration layer is still a work in progress. To summarize, the model can have different in-
stances for different devices, and so for more reliable results does instances need to be created. That
is what we call dynamic calibration. In this document we will present an algorithm to dynamically
calibrate the power model for different devices. Although the algorithm is correct, we could not fully
test its implementation. This is due to the fact that a set of (supposedly) available training applications
remained unavailable throughout the entire duration of this project.
Instrumentation
Calibration
Monitoring
Figure 1.: The 3 layers of the Green Droid tool and its interactions
2 The source code of this tool can be found at https://github.com/MarcoCouto/GreenDroid.
9
3
S TAT E O F T H E A RT
3.1 S O F T WA R E D E V E L O P M E N T : M O N I T O R I N G T O O L S
Over the years, software development faced a challenge that still persists nowadays: monitoring. We
can define monitoring as the act of how inspecting a piece of software executes. When monitoring
a piece of software, we may be interested in understanding, for example, the memory usage that is
made by it. The existence of monitoring tools began to be a necessity for developers, and so those
tools started to emerge.
With the aid of monitoring tools, a developer may realize how a piece of software behaves, and is
able to check if it is working as intended or not. If not, it has to be re-written or re-designed, but first
the developer needs to find the error(s) he made in the source code in order to detect what he needs to
change. This task of finding errors or faults is called debugging.
The necessity for monitoring and debugging tools has been realized several times in practice. One
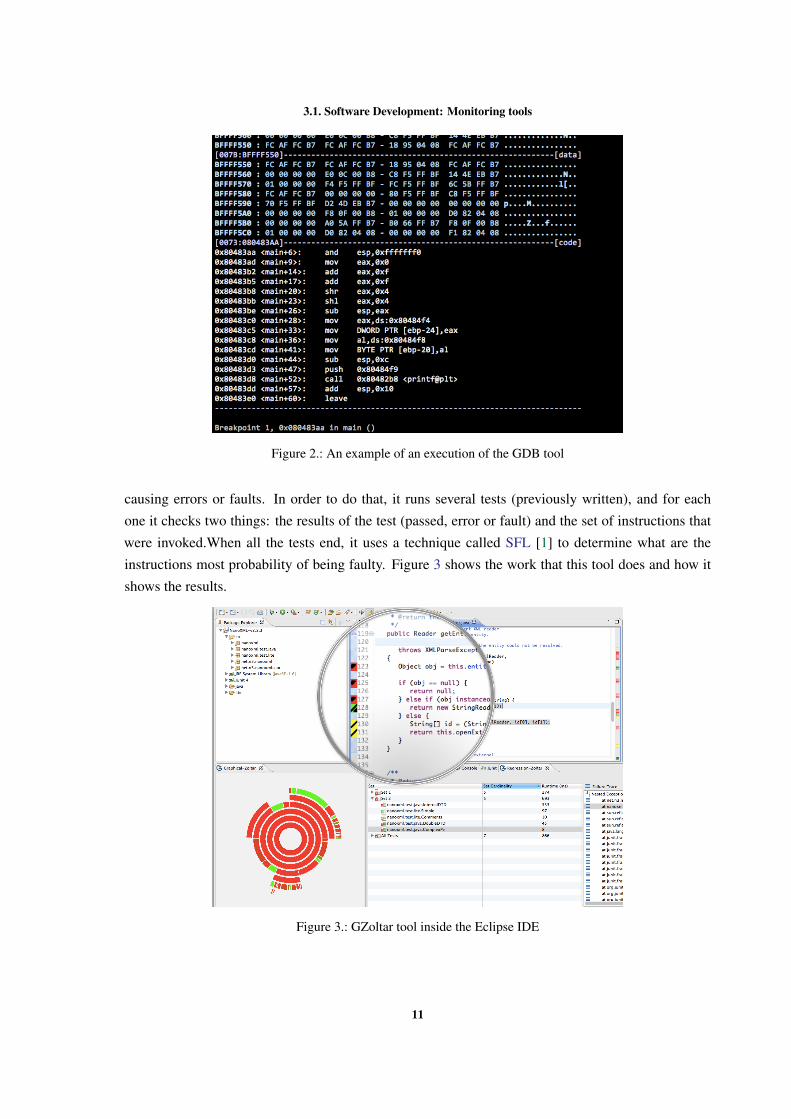
of its most well known instances is probably the GDB tool: Gnu Debugger1. This tool allows the
developer to see what is going on ”inside” another program while it executes, or how a program
executes until the moment it crashed. Figure 2 shows an example of this tool being used.
Debugging techniques can only assist developers in knowing at a specific program breakpoint. In-
deed, they do not give further help in understanding what it did not give that much help in understand-
ing what they have been wrongly written in the code when that breakpoint is achieved.
In order to provide further assistance to developers, some research works focused on creating testing
techniques and tools for different pieces of software. For example, in the context of Java programs,
JUnit2 testing framework was developed. This tool allows the developer to write unit tests, which
are methods to test a set of one or more individual units of source code (typically methods of a Javaclass).
Unit testing gained big importance in software testing, specially in large-scale applications. As a
consequence of this, several tools were developed using JUnit to run tests for one or more applications
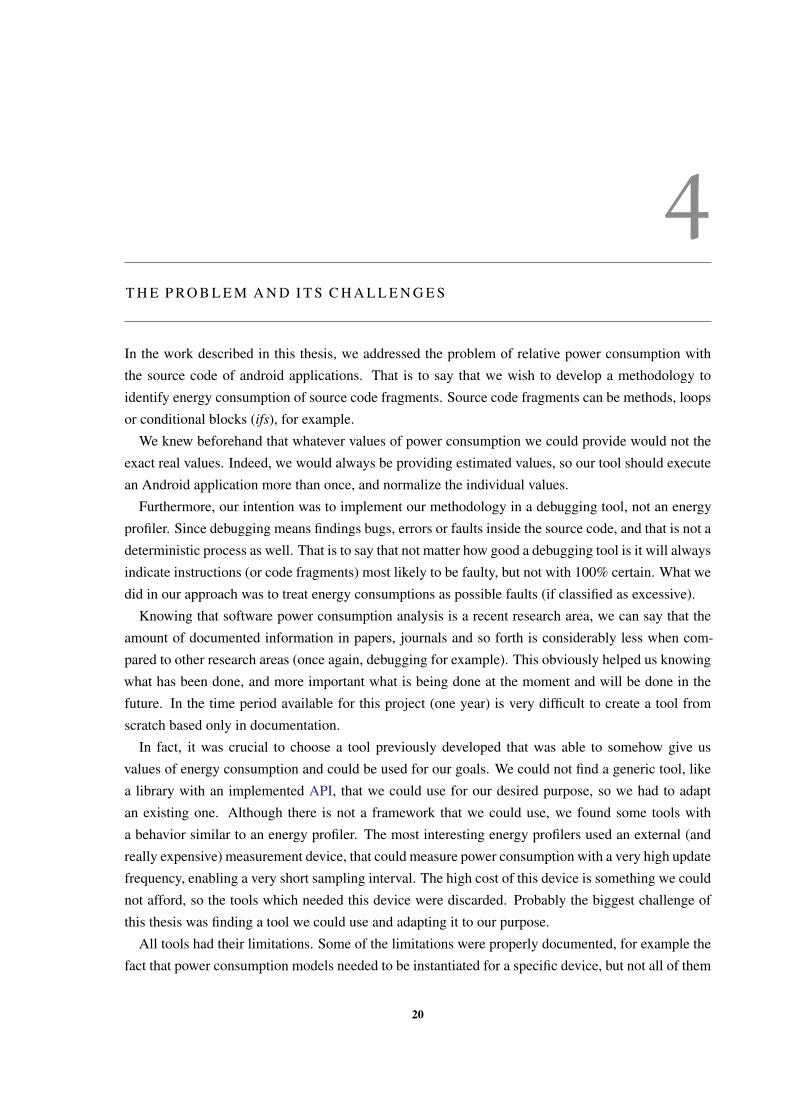
an get the results. A very good example is the GZoltar [7]. It is considered a fault localization
tool: for every application it tests, the tool is able to determine the instructions that are most likely
1 More information about this tool: http://www.gnu.org/software/gdb/.2 All the information about this framework can be found at the official website: http://junit.org/.
10
3.1. Software Development: Monitoring tools
Figure 2.: An example of an execution of the GDB tool
causing errors or faults. In order to do that, it runs several tests (previously written), and for each
one it checks two things: the results of the test (passed, error or fault) and the set of instructions that
were invoked.When all the tests end, it uses a technique called SFL [1] to determine what are the
instructions most probability of being faulty. Figure 3 shows the work that this tool does and how it
shows the results.
Figure 3.: GZoltar tool inside the Eclipse IDE
11

3.1. Software Development: Monitoring tools
Monitoring, debugging and fault localization are not the only testing interests when talking about
software testing. Sometimes developers also need to monitor the memory usage of an application.
If we take the Haskell language as an example, there is a Heap Profiling tool3 that is able to detect
memory leaks and helps the programmer to design software solutions more focused in saving memory
resources. Figure 4 shows two graphs generated by this tool that indicate the amount of memory spent
by a program. The left one shows the amount of memory spent after one modification to the code, and
the second one is related to the same program but after that modification. The gainings are evident.
Figure 4.: A comparison of memory usage between two implementations of the same program (in Haskell)
Developers also have interest in testing the performance of their applications when they are testing
them. If we look at a more abstract level, developers can simply compare alternatives for implement-
ing the same functionality. For example, in the Java language we have a large set of alternatives when
we want to save a set of objects of the same time (maps, lists or sets). There are situations when a
list is better suited than a set, and developers use the System.nanoTime() method to check if search,
insertion or removal in one of this structures is faster than the others. The structure of the code is
almost the same in every case:
public class Main(){
...
public static void main(){
long after = System.nanoTime();
//insert, remove or search something in a List, Map or Set
long final = System.nanoTime() - after;
}
...
}
Listing 3.1: Example of an use of nanoTime() method for performance analysis
The brief set of examples shown in this section already indicates that developers find monitoring
tools useful and actually use them in practice. But with the growing interest in mobile devices, de-
3 Information about this tool can be found here: http://www.cs.york.ac.uk/fp/profile.html
12

3.2. Green Computing and energy profiling
velopers are getting more interested in energy efficiency more than . In fact, this has already been
proved [35].
Most recently, a new area of monitoring is gaining interest among the scientific community, related
to software optimization in terms of energy consumption. It looks interesting at first because of
the increasingly appearance of better and more sophisticated mobile devices, but when compared to
debugging and fault localization this area shows signs that is still a lot of work to be done. Section 3.2
and Section 3.3 describe the work that has been done in the past years, and some work being done at
the moment.
3.2 G R E E N C O M P U T I N G A N D E N E R G Y P RO F I L I N G
Green Computing is a sub-area of computer science focused in use environmentally responsible of
computers and related resources. The interest of this area is to understand in which way minimizing
the power consumption of different technological components, like CPU’s, servers and peripherals, is
possible.
During the last years, the research in this area was mostly focused in the hardware and in its opti-
mization in terms of power consumption, due to the increasing necessity of managing great amounts of
data. There is currently a concern of minimize power consumption in data centers [5, 6] and telecom-
munications systems [3], for example, and at a lower level hardware components, like processors or
displays.
The software design and implementation, unfortunately, still today has not fully integrated the
adoption of Green Computing. Software optimization is still a big concern, but it is always focused
in reducing execution time (i.e., making the applications run faster). So, in addiction to the algorith-
mic efficiency and complexity, there is not much more information available about the influence of
software optimization related to energy consumption.
Nevertheless, when we talk about mobile devices the concern about energy-efficient software is
much bigger, and that concern tends to get even bigger, since the work being done in the area is
increasing. In fact, the number of accepted publications related to this research area in the last 18
months is much bigger than before that. We can say that energy-efficient software is one of the most
attractive research areas at the moment.
The interest in the area is not random. The influence of software in the power consumption is clear.
In fact according to some recent reports4, we can verify that the power consumption in a smartphone
varies with different software system distributions, even in the same machine. So, this gives us a first
(and good) indication that software has a major influence in mobile devices’ power consumption. But
that is a bit abstract. Of course software is of major importance, but with this information alone we
4 These reports can be found at http://www.huffingtonpost.com/2011/11/11/ios-5-battery-problemsapple-iphone_n_1088691.html and at http://www.fun47.com/motorola-droid-razrrazr-maxxics-bug-fix-to-release-in-mid-august/.
13

3.3. Monitoring Energy Consumption in Mobile devices
cannot quantify how much software influences the total amount of energy spent by a mobile device.
And such a quantification is crucial to qualify software in terms of energy consumption.
It seems clear that there are several decisions taken during the analysis and implementation steps of
the software development that will influence the way hardware acts. Those decisions are taken with
the purpose of ease the job of the developers’, or because they rely on very internalized concepts that
are not always the best to achieve the desired functionality of an application. These decisions do not
take into account the impact they will have on the power consumption. It would be desirable to know
the energy spent by an application at different execution times and associate those consumptions with
different software components (like methods/functions, for example).
Some research works aimed to develop tools in order to understand where is the energy being spent
in an application, some of them working as simple energy profilers and some giving information at a
more fine-grained level. Those research works, as well as their applications, are explained in the next
section. The works will be compared, and the advantages and disadvantages of using them for our
purpose will also be discussed.
3.3 M O N I T O R I N G E N E R G Y C O N S U M P T I O N I N M O B I L E D E V I C E S
Several research works that were done in the last three years managed to show some interesting results
in the mobile device energy consumption field. Almost every of them focus on the Android based
mobile devices, mostly because it is an open source OS5 and statistics reveal that the percentage of
selling is much higher for Android devices than any other6. In fact, in the second quarter of 2013
almost 80% of the market share belonged to Android devices, as Table 3 indicates.
OperatingSystem
2Q ’13 Ship-ments
2Q ’13 Mar-ket Share
2Q ’12 Ship-ments
2Q ’12 Mar-ket Share
Changeover year
Android 187.4 79.3% 108 69.1% 73.5%iOS 31.2 13.2% 26 16.6% 20.0%WindowsPhone
8.7 3.7% 4.9 3.1% 77.6%
BlackBerryOS
6.8 2.9% 7.7 4.9% -11.7%
Linux 1.8 0.8% 2.8 1.8% -35.7%Symbian 0.5 0.2% 6.5 4.2% -92.3%Others N/A 0.0% 0.3 0.2% -100.0%Total 236.4 100.0% 156.2 100.0% 51.3%
Table 3.: Top Smartphone Operating Systems, Shipments and Market Share in 2013 (Units in Millions)
5 An Android overview can be found at http://www.openhandsetalliance.com/Android_overview.html.6 Information about global smartphone shipments can be found at http://techcrunch.com/2013/08/07/Android-nears-80-market-share-in-global-smartphone-shipments-as-ios-and-blackberry-share-slides-per-idc.
14

3.3. Monitoring Energy Consumption in Mobile devices
The oldest research work we found was PowerScope [20]. This tool was able to determine what
fraction of the total energy consumed during a certain time period is due to specific processes in the
system, using a profiler and an external power measurement tool. This work inspired other ones [34,
43], and so researchers started to study how to use the energy profiling idea in order to do a similar
work in mobile devices, since they were rising in interest and usage.
There were a few different tools and studies that started to emerge in this area. Power Tutor [43]
is an example of a tool7 that came as a contribution of a research work. With this tool, it is possible
to see, in a device using the Android OS, the applications executing and the energy they are spending
using different hardware components, such as CPU or 3G.
This tool started studying a new concept named power consumption model. A model consists
in a set of components, in this case hardware components, like CPU or LCD. Is quite obvious that
each component has a different weight in the device’s total power consumption per unit of time. At
first sight, the Display (LCD) will spend much more energy than the GPS, for example, unless it is
turned off, and the CPU will spend more than the Wi-Fi in almost every case. So basically a power
consumption model manages to map this different component states to different power consumptions
values (obtained using an external tool)8, and for every different device there is a different instance
of the previously designed model. This kind of model considers something called utilization-based
power behavior (i.e the consumption related to the concrete utilization of an hardware component),
and Power Tutor [43] has three instances of it, for three different mobile devices, but also described a
way to create (not so accurate) models without using an external measurement device.
One thing to know about hardware components is that they have something called the tail power
states: they stay at a high power consumption state for a period of time after they are used. This is
often called no-utilization-based power consumption, and that is something the normal application
developer cannot manage or alter, but has a significant importance in the final power consumption.
A research work [34] studied and discussed in more detail the problem of the no-utilization-based
power consumption, and the authors of the study also came up with another tool. This tool manages to
trace system calls and relate them to power state transitions and corresponding power consumptions,
in order to tell the application developers what was consuming the most energy, in a similar way to
Power Tutor [43], but it has no power model instances for devices, so the first time someone would
like to use this tool it would be needed to have an external power measurement device in order to run
a stress application for each hardware component and instantiate the model.
The power consumption model concept has been widely explored in the context of mobile battery-
powered systems for the last years.The same authors of [34] came up with a new study [33] about a
year later, intended to help developers identify where the energy was being spent inside an application
(what hardware component was the application using in a time interval and how much energy was
spent).
7 Powertutor application website: https://powertutor.org.8 A widely known device, used for the referred tool and for most of others referred in this thesis, is available at http://www.msoon.com/LabEquipment/PowerMonitor.
15

3.3. Monitoring Energy Consumption in Mobile devices
Several other ideas have already emerged having this last two ([33, 34]) as a case study. Sesame [16]
is an example: a tool to automatically create power consumption models. It is quite accurate, since
it gives 95% accuracy in consumptions taken with 1 second sampling interval, and 88% with 10
milliseconds, although it does not consider the same components of Power Tutor and is not able to
relate energy consumption to specific applications or processes.
Although most of the previously referred works have significant resemblances between them, there
is always room for improvement, and researchers have found a way to keep exploring the power
consumption concept. By searching a little more, we have found a considerable set of other works
in this area, all of them related to power consumption modeling. DevScope[22] is another example
of a tool appearing as a contribution to a work done in relation to power consumption modeling, and
provides support to another one, AppScope [41], that works and executes in a similar way to Power
Tutor: gives information about the energy consumption of Android applications. Basically, DevScope
has a power consumption model and instantiates it for the device in use, and then AppScope uses that
model instance to give power consumption estimations, much like the relation between Power Tutor
and Power Booter [43].
Although AppScope and PowerTutor seem identical since the power models are so similar, they
have a few differences. AppScope works as a Linux kernel module, and so traces the kernel function
calls, and gets the data from the device in a process level, while Power Tutor works as a standard An-
droid application and gets the data in an application level. Besides, AppScope has different granularity
levels for each hardware component.
Several other examples of works based on power consumption models and its applications in differ-
ent areas came up ever since ([10, 24, 25, 42]), however none of them is as powerful as the remaining
ones. Another interesting example, SEMO [15], has a similar behavior to Power Tutor, but does not
use power consumption models. Instead, it is focused in battery discharge level, and its results are
less reliable and accurate.
In a more recent work (December 2013), the same authors of AppScope [41] introduced User-
Scope [23], a framework designed to collect energy usage data associated to a specific kind of user. It
works in a similar way to AppScope, but its goal is to give information about what does the normal
user of an Android mobile device does with it and where does he spends the energy.
As we could see, there is obviously a growing concern about monitoring power consumption in
mobile devices. Developers are becoming more and more interested in applications’ energy consump-
tion, as we have already referenced [35]. But even with the growing concern and interest in energy
consumption optimized software, the fact is that the available tools are too similar to each other. They
show the developer the amount of energy being spent at different execution times, and in some cases
they divide that amount of energy for different applications. But developers want more that that. They
want to test their own application, and see where they can (most likely) improve in order to optimize
the energy consumption of their application.
16

3.3. Monitoring Energy Consumption in Mobile devices
Some recent works in this area presented interesting studies and tools. Some of them [12, 32]
demonstrate that it is possible to have different values of energy consumption for different softwares
designed to do the same tasks, or even for the same software with different implementation techniques.
The idea that software running in mobile devices can eventually be optimized to consume less
energy starts to be very well assimilated at this point with the references presented until here. Based
in this assumption, other studies tried a different approach in the pursuit of energy-leaks. There is
a good example of a recent empirical study [30] that was developed in order to identify what were
the most energy-greedy APIs or their usage patterns used in Android applications, using an external
measurement device to get the most reliable values.
Some researchers began to worry about the influence that software security policies could have in
power consumption. An interesting research work [38] had the goal to understand if code obfuscation,
an approach used by mobile developers for preventing software piracy, could significantly increase
power consumption. This study proved that such policy did not affect power consumption in such a
way that it could be considered.
Many different areas are now starting to show interest in the influence that applications could have
in power consumption. Even in software testing researchers wanted to minimize the energy con-
sumed [29], by developing a technique that successfully minimizes the test suites, and makes the
testing phase consume up to 95% less energy while maintaining the coverage.
The last work [28], perhaps the most interesting, tried to go deeper and calculate source line level
energy information for Android applications. It is still an empirical study, with some flaws in precision
since they used an external device with a sampling interval considerably smaller than the precision
needed for single instructions, but shows interesting results and reflects the increasing interest this
area has.
Even with such a large set of research works identified, the feeling we get is that there is much
more we can do in this area. For example, how can one developer automatically test an application in
terms of energy consumption? How can we be sure that a code fragment used too much energy and
not exactly the one it needs? Is it somehow possible to have good and accurate results for measuring
without using an external measurement device? There is a lot of unanswered questions, and we intend
to answer as much as we can with this thesis.
One thing seems clearer than the others: developers show interest in a tool to help them design
energy efficient applications, but do not want to be obligated to use an external and really expensive
measurement device. Even Google is trying to help developers in this task9
Given the need to choose a tool that we could use for our goals and the fact that most of them only
work with an external device, we decided to choose Power Tutor so we could use its power model and
transform it into an API, as desired.
9 A tool called Project Volta will let programmers dig into application power us-age with Android’s debugging tools: http://arstechnica.com/gadgets/2014/07/examining-project-volta-we-put-Android-l-through-our-battery-test/.
17

3.4. The selected tool: Power Tutor
3.4 T H E S E L E C T E D T O O L : P O W E R T U T O R
Power Tutor is an open source Android application, developed under a PhD project at the Michigan
University, USA. It allows the user to know the power consumption values of all the applications that
are executing at the moment, divided by different hardware components, and updates the consumption
values in one second intervals. The hardware components included in the Power Tutor model are:
CPU, LCD, Wi-Fi, 3G, GPS and Audio.
This tool has three model instances created using an external measurement device, the Monsoon
Power Monitor10, but is designed in a way that including new instances can be done almost with no
difficulty at all.
In a nutshell, the tool is able to calculate the consumption of every one of those components and
show the results associated to different applications, as long as it has a power consumption model it
can use. Figure 5 shows and example of an execution of Power Tutor, and Table 4 is an example of a
power model instance. This tool and the model will be explained in more detail in Chapter 5, along
with a technique described by Power Tutor’s authors that can be used to create instances of the model
for any device, without using the external measurement device.
Figure 5.: Power Tutor execution views (reprinted from [43])
10 The device can be found here: http://www.msoon.com/LabEquipment/PowerMonitor/.
18

3.4. The selected tool: Power Tutor
Model (βuh× f reqh + βul× f reql)+util + βCPU×CPUon+ βbr× brightness+ βGon×GPSon+ βGsl×GPSsl + βWi−Fil ×Wi− Fil + βWi− Fih×Wi− Fih + β3Gidle×3Gidle + β3GF ACH × 3GFACH + β3GDCH × 3GDCH
Component Variable Range Power Coefficient
CPUutil 1-100
βuh: 4.34βul: 3.42
f reql , f reqh 0,1 n.a.CPU on 0−∞ βcpu: 121.46
Wi-Fi
npackets, Rdata 0−∞ n.a.Rchannel 1-54 βcrWi− Fil 0,1 βWi−Fi l : 20Wi− Fih 0,1 βWi−Fi h: 720
Audio Audio on 0,1 βaudio: 384.62LCD brightness 0-255 βbr: 2.40
GPS GPS on 0,1 βGon: 429.55GPS sl 0,1 βGsl: 173.55
3G
data rate 0−∞ n.a.downlink queue 0−∞ n.a.uplink queue 0−∞ n.a.3Gidle 0,1 β3G idle: 103GFACH 0,1 β3G FACH: 4013GDCH 0,1 β3G DCH
Table 4.: Example of a power model instance for HTC Dream smartphone (reprinted from [43])
19
4
T H E P RO B L E M A N D I T S C H A L L E N G E S
In the work described in this thesis, we addressed the problem of relative power consumption with
the source code of android applications. That is to say that we wish to develop a methodology to
identify energy consumption of source code fragments. Source code fragments can be methods, loops
or conditional blocks (ifs), for example.
We knew beforehand that whatever values of power consumption we could provide would not the
exact real values. Indeed, we would always be providing estimated values, so our tool should execute
an Android application more than once, and normalize the individual values.
Furthermore, our intention was to implement our methodology in a debugging tool, not an energy
profiler. Since debugging means findings bugs, errors or faults inside the source code, and that is not a
deterministic process as well. That is to say that not matter how good a debugging tool is it will always
indicate instructions (or code fragments) most likely to be faulty, but not with 100% certain. What we
did in our approach was to treat energy consumptions as possible faults (if classified as excessive).
Knowing that software power consumption analysis is a recent research area, we can say that the
amount of documented information in papers, journals and so forth is considerably less when com-
pared to other research areas (once again, debugging for example). This obviously helped us knowing
what has been done, and more important what is being done at the moment and will be done in the
future. In the time period available for this project (one year) is very difficult to create a tool from
scratch based only in documentation.
In fact, it was crucial to choose a tool previously developed that was able to somehow give us
values of energy consumption and could be used for our goals. We could not find a generic tool, like
a library with an implemented API, that we could use for our desired purpose, so we had to adapt
an existing one. Although there is not a framework that we could use, we found some tools with
a behavior similar to an energy profiler. The most interesting energy profilers used an external (and
really expensive) measurement device, that could measure power consumption with a very high update
frequency, enabling a very short sampling interval. The high cost of this device is something we could
not afford, so the tools which needed this device were discarded. Probably the biggest challenge of
this thesis was finding a tool we could use and adapting it to our purpose.
All tools had their limitations. Some of the limitations were properly documented, for example the
fact that power consumption models needed to be instantiated for a specific device, but not all of them
20

were. As we said before, we used Power Tutor for our purpose, and the biggest limitations of this tool
could only be found after we started using it.
We had to face a problem that was common to basically all of the tools: the sampling interval. This
interval is the time that the tool needs to wait until measure power consumption again. In Power Tutor,
this interval was one second, and it was something we could not overcome.
The power model coefficients were calculated per unit of time (in Power Tutor that unit of time
was one second). For example, CPU can work with a frequency of F MHz, and so there is a power
coefficient C for that frequency. That coefficient indicates that, if the CPU stays at the F frequency for
one second, it spends approximately C mW. This cannot be changed, since the tool is implemented
with this idea and was designed to give values for one second granularity. This was a huge drawback
for us, and we needed to rethink the way we wanted to implement our tool.
The decision of what code fragments we should analyze had to be made. We knew that analyz-
ing single instructions (like attributions, arithmetic or boolean expressions) was impossible with the
resources we had. If an instruction is too simple (like int a = 1;) we would not have the necessary
precision. With our one second sampling interval, we would not be able to even analyze consumption
per methods, but we still wanted to give the developer information about them. To do it, we needed to
turn our attention to consumption per test (knowing that a test is a sequence of method calls).
From the beginning we wanted to implement our methodology in a tool/framework that could auto-
matically do the analyzes. Every single task needed to be automatic represented a challenge we had
to overcome. We had to study how an application and test projects could be compiled/built into a
single APK file, how to install that file in a device and how to automatically run tests over an appli-
cation.These challenges were a bit easier to overcome. We achieved all of this simply by reading the
Android developers manual 1.
The most important (but probably easiest) challenges were to decide what metric would we use
to determine if there was as excessive consumption or not, and how save, retrieve and show the
information we get from testing an application.
All the solution we came to, as long as the different ones we tried, are explained in the following
chapters.
1 The manual can be found here: https://developer.android.com/index.html.
21

Part II
C O R E O F T H E D I S S E RTAT I O N

5
P OW E R C O N S U M P T I O N M O D E L
In this chapter, we start by discussing in Section 5.1 the Android power consumption model presented
in [43]. This is a statically calibrated model that considers the energy consumption of the main hard-
ware components of a mobile device. in Section 5.2, we describe how is it possible to create instances
of the model to different devices (calibration), and then in Section 5.3 we present an algorithm for
the automatic calibration of that model, so that it can be automatically ported to any Android based
device.
5.1 T H E A N D RO I D P O W E R T U T O R C O N S U M P T I O N M O D E L
Different hardware components have different impact in a mobile device power consumption. As a
consequence, an energy consumption model needs not only to consider the main hardware compo-
nents of the device, but also its characteristics. Mobile devices are not different from other computer
devices: they use different hardware components and computer architectures that have completely dif-
ferent impact on energy consumption. If we consider the CPU, different mobile devices can use very
different CPU architectures (not only varying in computing power, but also, for example, in the num-
ber of CPU cores), that can also run at different frequencies. The Android ecosystem was designed
to support all different mobile (and non-mobile) devices (ranging from smart-watches to TVs). As a
result, a power consumption model for Android needs to consider all the main hardware components
and their different states (for example, CPU frequency, percentage of use, etc).
There are several power consumption models for the Android ecosystem [16, 22, 25, 41, 43], that
use the hardware characteristics of the device and its possible states to provide a power model. Next,
we briefly present the Power Tutor model: a state-of-the-art power model for mobile devices [16].
This model currently considers six different hardware components: Display, CPU, GPS, Wi-Fi, 3Gand Audio, and different states of such components, as described next.
C P U : CPU power consumption is strongly influenced by its use and frequency. The processor
may run at different frequencies when it is needed, and depending on what is being computed the
percentage of utilization can vary between 1 and 100; There is a different coefficient of consumption
for each frequency available on the processor. The consumption of this component at a specific time
23
5.1. The Android Power Tutor Consumption Model
is calculated by multiplying the coefficient associated with the frequency in use with the percentage
of utilization.
L C D : The LCD display power model considers only one state: the brightness. There is only one
coefficient to be multiplied by the actual brightness level, that has 10 different values.
G P S : This component of the power model depends on its mode (active, sleep or off). The number
of available satellites or signal strength end up having little dependence on the power consumption, so
the model has two power coefficients: one to use if the mode is active and another to use if the mode
is sleep.
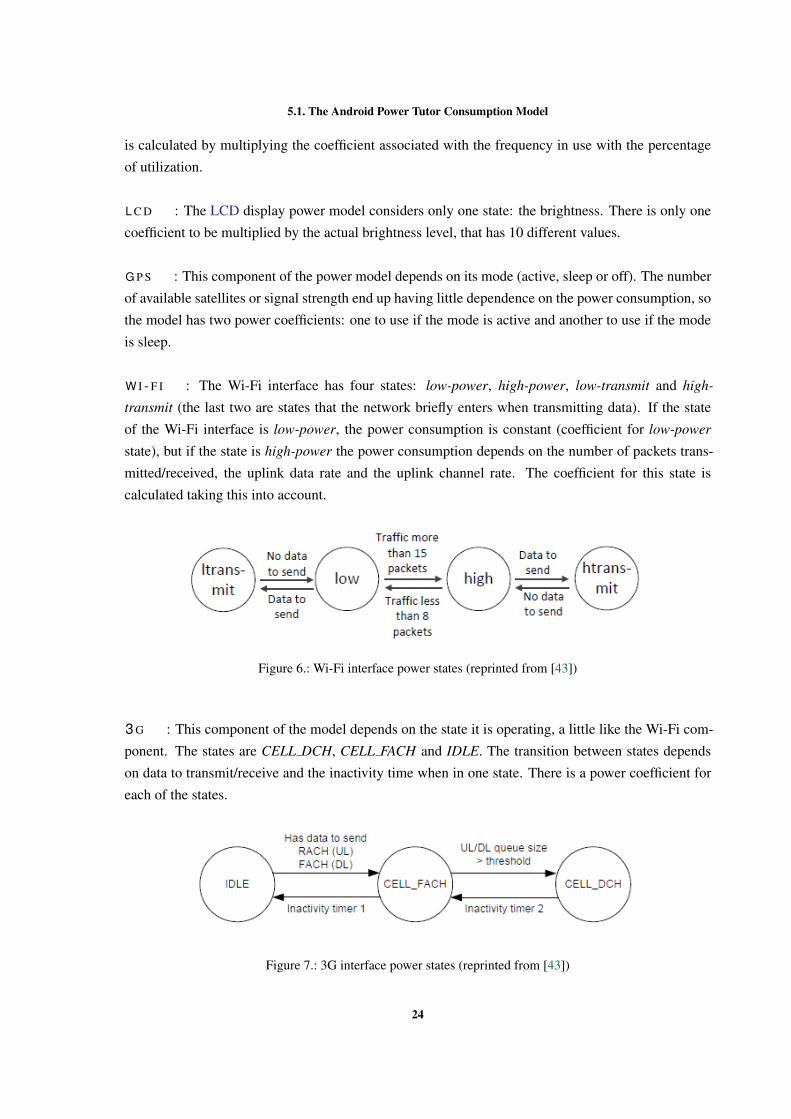
W I - F I : The Wi-Fi interface has four states: low-power, high-power, low-transmit and high-
transmit (the last two are states that the network briefly enters when transmitting data). If the state
of the Wi-Fi interface is low-power, the power consumption is constant (coefficient for low-power
state), but if the state is high-power the power consumption depends on the number of packets trans-
mitted/received, the uplink data rate and the uplink channel rate. The coefficient for this state is
calculated taking this into account.
Figure 6.: Wi-Fi interface power states (reprinted from [43])
3 G : This component of the model depends on the state it is operating, a little like the Wi-Fi com-
ponent. The states are CELL DCH, CELL FACH and IDLE. The transition between states depends
on data to transmit/receive and the inactivity time when in one state. There is a power coefficient for
each of the states.
Figure 7.: 3G interface power states (reprinted from [43])
24

5.2. Static Model Calibration
A U D I O : The audio consumption is modeled by measuring the power consumption when not in
use and when an audio file is playing at different volume, but the measures indicate that the volume
does not interfere with the consumption, so it was neglected. There is only one coefficient to take into
account if the audio interface is being used.
5.2 S TAT I C M O D E L C A L I B R AT I O N
In order to determine the power consumption of each Android device’s component the power model
needs to be “exercised”. That is to say, we need to execute programs that change the variables of
each components state, for example, by setting CPU utilization to highest and lowest values, or by
configuring GPS state to extreme values by controlling activity and visibility of GPS satellites, while
measuring the energy consumption of the device. By measuring the power consumption while varying
the state of a component, it is possible to determine the values (coefficients) to include in a specific
instantiation of the model for a device.
Power Tutor, as all other similar power models, uses a static model calibration approach: the pro-
grams are executed in a specific device (which is instrumented in terms of hardware) so that an exter-
nal energy monitoring device1 is used to measure the energy consumption. Although this approach
produces a precise model for that device [43], the fact is that with the wide adoption of the Android
ecosystem makes it impossible to be widely used2. Indeed, the model for each specific device has to
be manually calibrated! We intended to develop this functionality in the final tool.
Once again we remember that we could not fully test the dynamic calibration due to the unavail-
ability of the training applications throughout the entire duration of this project. So, Section. 5.3 will
describe our approach to implement dynamic calibration, along with the algorithm used, and the only
thing missing to include this functionality in our tool is, in deed, the test applications of each hardware
component .
5.3 P O W E R M O D E L : DY N A M I C C A L I B R AT I O N
In order to be able to automatically calibrate the power consumption model of any Android device, we
consider a set of training programs that exercises all components of the power model. The training pro-
grams also change (over its full range) the state of each component, while keeping the other constant.
In this way, we can measure the energy consumption by that particular component in that state. To
measure the energy consumption, instead of using an external monitoring device as discussed before,
we consider the battery consumed while running the training applications. The Android API provides
access to the battery capacity of the device, and to the (percentage) level of the battery of the devices.
By monitoring the battery level before and after executing a training application, we can compute the
1 A widely used device is available at http://www.msoon.com/LabEquipment/PowerMonitor.2 In fact, [43] reports the calibration of the power model for three devices, only.
25

5.3. Power Model: Dynamic Calibration
energy consumed by that application. Figure 8 shows the architecture of the dynamic calibration of
the power model.
CPULCDWIFI
...
4,3; 3,42,4121; 20...
POWERMODEL
INSTANCEβfreq1;βfreq2
βbr
βwifi_l;βwifi_h ...
POWERCONSUMPTION
MODEL
TRAINING APPS
ANDROIDDEVICE
CALIBRATION APP
CPULCD
WIFI...
Figure 8.: The architecture to dynamically calibrate the power model for different devices
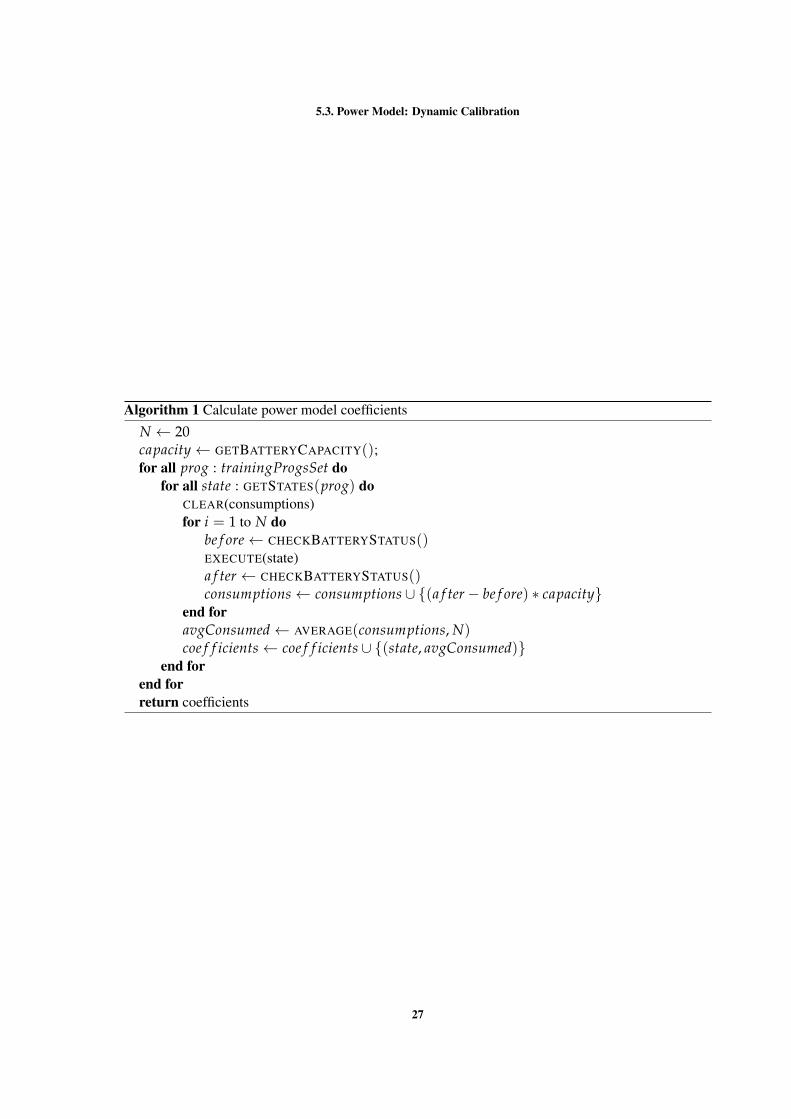
The calibration process shown in Algorithm 1 executes the set of calibration applications in a spe-
cific device. To summarize, the algorithm starts by getting the full capacity of the device’s battery.
Since every component has multiple possible states (e.g., CPU with different frequencies), every
training program has an equal number of execution states that will be executed. Then, every state
is executed N times, in order to get an arithmetic mean of the consumption. This makes the results
more reliable. This algorithm returns a collection of energy consumption coefficients, one per state
of every hardware component. The generic power model presented in the previous section is then
instantiated.
The coefficients of the power model are presented in mW since it is the energy unit considered
by Power Tutor, and are used to compute the energy consumption of an Android application. For
example, when the CPU component is in a known state (i.e., running at a certain frequency, with
a known percentage of use), then the power model computes the current energy consumption as an
equation of those coefficients.
The Android energy consumption model used by Power Tutor is implemented as stand alone ap-
plication, which indicate the (current) energy consumption of other application running in the same
device. In the next section, we present our methodology to use our models in an energy profiling tool
for Android application developers.
26
5.3. Power Model: Dynamic Calibration
Algorithm 1 Calculate power model coefficients
N ← 20capacity← GETBATTERYCAPACITY();for all prog : trainingProgsSet do
for all state : GETSTATES(prog) doCLEAR(consumptions)for i = 1 to N do
be f ore← CHECKBATTERYSTATUS()EXECUTE(state)a f ter ← CHECKBATTERYSTATUS()consumptions← consumptions ∪ {(a f ter− be f ore) ∗ capacity}
end foravgConsumed← AVERAGE(consumptions, N)coe f f icients← coe f f icients ∪ {(state, avgConsumed)}
end forend forreturn coefficients
27

6
E N E R G Y C O N S U M P T I O N I N S O U R C E C O D E
Modern programming languages offer powerful compilers, that include advanced optimizations, which
allow us to develop efficient and fast programs. Such languages also offer advanced supporting tools,
like debuggers, execution and memory profilers, so that programmers can easily detect and correct
anomalies in the source code of their applications.
In this chapter, we present one methodology that uses/adapts the (dynamic) power model defined in
the previous chapter, to be the building block of an energy profiling tool for Android applications. The
idea is to offer Android application developers an energy profiling mechanism, very much like the one
offered by traditional program profilers [36]. That is to say that we wish to provide a methodology,
and respective tool support (developed in Java), that automatically locates in the source code of the
application being developed the code fragments responsible for an abnormal energy consumption.
Our methodology consists of the following steps:
• First, the source code of the application being monitored is instrumented with calls to the cali-
brated power model. Figure 9 displays this step.
• After compiling such instrumented version of the source code, the resulting application is exe-
cuted with a set of test cases.
• The result of such executions are statistically analyzed in order to determine which packages/meth-
ods are responsible for abnormal energy consumptions.
The source code instrumentation and execution of test cases is performed automatically as we
describe in the next sections. To instrument the source code with calls to the power model, we need
to model it as an API. This is discussed first in Section 6.1.
6.1 T H E M O D E L A S A N A P I
In order to be able to instrument the source code of an application with energy profiling mechanisms,
we needed to adapt the current implementation of the power model described in Section 3.4. That
power model [43] is implemented as a stand alone tool able to monitor executing applications. Thus,
28

6.2. Source Code Instrumentation
INSTRUMENTED SOURCE CODE
ANDROID APP SOURCE CODE
mW???
DEVELOPERCPULCDWIFI
...
4,3; 3,42,4121; 20...
POWER MODELINSTANCE
jInstINSTRUMENTATION
TOOOL
<XML>
Android
Manifest File
Figure 9.: The behavior of the instrumentation tool
we needed to transform that implementation into an API-based software, so that its methods can be
reused/called in the instrumented source code.
To adapt the Power Tutor implementation, we introduced a new Java class called Estimator that
implements the methods to be used/called by other applications and respective test cases. Those
methods work as a link interface between the power consumption model and the applications source
code to be monitored.
The methods implemented in our Estimator class that are accessible to other applications are:
• traceMethod(): The implementation of the program trace. With this method we are able to
save the method every time it is invoked.
• saveResults(): store the program trace/energy profile results in persintent storage(files).
• start(): start of the energy monitoring thread.
• stop(): stop of the energy monitoring thread.
6.2 S O U R C E C O D E I N S T RU M E N TAT I O N
Having updated the implementation of the power model so that its energy profiling methods can be
called from other applications, we can now instrument an application source code to invoke them.
In order to automatically instrument the source code, we need to define the code fragments we
would like to monitor. Because we wish to do it automatically, that is by a software tool, we need
29

6.2. Source Code Instrumentation
to precisely define which fragments will be considered. If we consider too small code fragments (for
example, a line in the source code), then the precision of the power model may be drastically affected:
a neglected amount of energy would probably be consumed. In fact, there is not a tool that we can
use that is capable of giving power consumption estimates at a so fine-grained level, with reliable
results. On the other hand, we should not consider too large fragments, since this will not give a
precise indication on the source code where an abnormal energy consumption exists.
We choose to monitor application methods, since they are the logical code unit used by program-
mers to structure the functionality of their applications. To automate the instrumentation of the source
code of an application we use the Java Parser tool1: it provides a simple Java front-end with tool
support for parsing and abstract syntax tree construction, and the corresponding generic traversal and
transformation mechanisms.
We developed a simple instrumentation tool, called jInst, that instruments all methods of all Java
classes of a chosen Android application project, together with the classes of an Android test project.
This tool was later easily included in the Green Droid tool (the energy profiler we developed). When
instrumenting the source code of the application, jInst injects new code instructions, at the beginning
of the method and just before a return instruction (or as the last instruction in methods with no return),
as shown in the next code fragment:
public class Draw{
...
public void funcA(){
Estimator.traceMethod("funcA", "Draw", Estimator.BEGIN);
// Original code of funcA here
Estimator.traceMethod("funcA", "Draw", Estimator.END);
}
Listing 6.1: Example of an utilization of traceMethod
This code injection allows the final framework to monitor the application, keeping trace of the
methods invoked and energy consumed.
The instrumentation was implemented using a traditional compiler approach. Recent techniques,
like aspect oriented programming [9], seem very adequate to implement the instrumentation as well,
but we choose the traditional approach since the available technologies an techniques were better
known to us.
Its important to refer that not only the Java source code is instrumented. Since Android uses many
XML to define, among other things, the name of the project, the version of the API used, the name of
the test runner, etc., we used the standard Java XML parser (DOM parser)2 as well, in order to edit
some necessary definitions, which are:
1 Java Parser framework webpage: https://code.google.com/p/javaparser.2 More information about DOM parser can be found here: http://docs.oracle.com/javase/tutorial/jaxp/dom/readingXML.html.
30

6.3. Automatic Execution of the Instrumented Application
• The name of the project (both for application and test project): this is needed so if the instru-
mented projects are opened in Eclipse IDE they do not get name conflict with the original
projects.
• The list of permissions given to the application (for the application project): needed to execute
the Power Tutor API.
• The test runner (for the test project): the JUnit test runner needs to be different than the one by
default. In the next chapter will be explained why.
So, after instrumenting the source code of the application, jInst also edits the Android Manifest file of
both the application and test projects.
6.3 AU T O M AT I C E X E C U T I O N O F T H E I N S T RU M E N T E D A P P L I C AT I O N
After compiling the instrumented source code an Android application is produced. When executing
such application energy consumption metrics are produced. In order to automatically execute this
application with different inputs, we use the Android testing framework3 that is based on jUnit.In order to use the instrumented application and the developed Estimator energy class, the appli-
cation needs to call methods start and stop before/after every test case is executed. Both jUnit and
Android testing framework allow test developers to write a setUp() and a tearDown() methods, that
are executed after a test starts and after a test ends, respectively. So, our jInst tool only needs to instru-
ment those methods so we can measure the consumption for each test, as shown in the next example:
public class TestA{
...
@Override
public void setUp(){
Estimator.start(uid);
...
}
...
@Override
public void tearDown(){
Estimator.stop();
...
}
Listing 6.2: The changes made by jInst to test classes
With this approach, we assure that every time a test starts, the method Estimator.start(int uid) is
called. This method starts a thread that is going to collect information from the operating system and
3 Android testing web page: https://developer.Android.com/tools/testing/index.html.
31
6.4. Green-aware Classification of Source Code Methods
then apply the power consumption model to estimate the energy consumed. The uid argument of the
method is the UID of the application in test, needed to collect the right information. The tearDown()
is responsible for stopping the thread and saving the results.
6.4 G R E E N - AWA R E C L A S S I F I C AT I O N O F S O U R C E C O D E M E T H O D S
We needed to define a metric to classify the methods according to the influence they have in the
energy consumption. The goal was to find a unit that we could use as a reference for every test being
analyzed. The instrumented application presented before produces energy consumption metrics per
(instrumented) fragment. In order to reason about this metrics we need to normalize them first. That is,
we need to consider the energy consumed per second. The reasons why we did so are related with the
fact that Power Tutor can only give consumption values for one second interval and with our necessity
to prove that execution time was not always directly proportional to energy consumption, otherwise we
could just classify methods that run for a long period of time as the most energy inefficient. Besides,
with this comparable unit we could check that consumption per second could be very different from
one test to another, as will be shown in future sections.
It is important to refer that every time an application was analyzed we added the results to a base
of knowledge, most specifically the consumption per second of every test. When a new application is
to be analyzed, we compare the power consumption per second of each test with all the values saved
in our base of knowledge. Using this approach, we can compare different implementation patterns,
since one developer can use his own implementation patterns all over the source code. With this
approach, we avoid a question that came up to us when we decided how to reason about the power
consumption metrics: if an application is written entirely by the same programmer, it will be based
entirely in his/her decisions. Is it correct to compare the energy consumed between methods of them
same application (with the same implementation patterns) or should we check how other applications
spend energy as well?.
To summarize it, the methods are characterized as follows:
• Green Methods: These are the methods that have no interference in the anomalous energy
consumptions. They are never invoked when a test of the application consumes more energy
than the average.
• Red Methods: Every time they are invoked, the application has anomalous energy consump-
tion. They can be invoked when the application has bellow the average energy consumption
as well, but no more than 30% of the times. They are supposed to be the methods with bigger
influence in the anomalous energy consumption.
• Yellow Methods: The methods that are invoked in other situations: mostly invoked when the
application power consumption is bellow the average.
32
6.4. Green-aware Classification of Source Code Methods
Lets take an example, and suppose we have an application with 300 methods. Among those meth-
ods, we have methodA, methodB and methodC. Now, lets suppose our test project has 20 tests. After
analyzing them all, we can verify that tests number 1, 4, 10 and 19 have excessive power consumption.
We know that methodA is invoked in all the tests except number 1, 4, 10 and 19. By definition,
methodA is a Green Method.
If we check methodB execution trace, we know it is invoked in tests 4, 10 and 19. Besides, it
is invoked 1 more time in test number 7. So, we have 4 invocations of this method: three of them
associated with tests with anomalous power consumption, and one associated with tests with non-
anomalous energy consumption. In four invocations, 80% of them were associated with anomalous
consumptions ( 4/5= 0.8), so by definition this is a Red Method.
Considering now methodC, it is invoked 10 times. Two of them are in tests 10 and 19, so it could
not be a Green Method, neither can it be a Red Method because although it is invoked when the
power consumption is considered anomalous those invocations represent only 20% of the total. So,
methodC is considered a Yellow Method.
This representation of methods is also extensible for classes, packages and projects. In other words,
the classification of classes depends on the set of methods they have, and so packages depend on their
respective classes, as the projects are classified according to their packages. If a class has more than
50% of its methods classified as Red Methods, then it is a red class. With more 50% of them as green,
it is a Green Class. Otherwise, it is a Yellow class. Packages and projects follow the same approach.
33
7
G R E E N D RO I D : T H E F R A M E W O R K F O R E N E R G Y P RO F I L I N G
In previous sections we presented techniques to perform source code instrumentation and test exe-
cution, and how to compare power consumptions between tests/application. We also described the
possible classifications we can give to methods. In this chapter, we will describe the workflow of the
Green Droid tool: how it works in background, when and how does it perform instrumentation and
test execution, what kind of results does it produces.
7.1 W O R K F L O W
We managed to implement source code instrumentation, consumption measurement, method tracing
and automatic test execution using the Android testing framework. Now, we need to join all this
separate functionalities in one. The final result should be a tool that works automatically, and does all
this tasks incrementally. After that, it retrieves the information previously saved and shows the results
obtained. This section explains the workflow of the framework, along with the information obtained
at every point, and how the results are obtained and generated.
After the source code of the application and the tests are instrumented as described in Section 6.2,
the framework executes a set of sequential steps in order to calculate the results and show them to the
developer. These steps are independent from each other, and framework execute them sequentially,
starting by instrumenting both tests and application source code, and finishing by retrieving the results
saved in the device and generating the results.
Each one of the next sections will explain the individual tasks of the framework, starting by identi-
fying what is the expected input, the job it does and the output it gives. These steps are all represented
in Figure 10, that represents how the framework, given the instrumented application (first step), gen-
erates the tracing and energy consumption results of the test cases defined with the Android testing
framework.
34

7.1. Workflow
INSTRUMENTED SOURCE CODE
THE APP(INSTRUMENTED)
TESTINGFRAMEWORK
BASE OF KNOWLEDGE
TESTCASES
Figure 10.: The behavior of the monitoring framework
7.1.1 Instrumenting the source code
Expected input: path to the source code of the AUT (Application Under Test) and path to the tests.
Expected output: path to the instrumented AUT and path to instrumented test project.
This is the starting point for the framework.
Using the ideas and techniques defined in Section 6.2, the framework takes the path to the AUT
and flags the code as described, injecting the two enunciated method calls. Then, it takes the path to
the tests and changes the setUp() and tearDown() methods (or creates them, if they were no already
created), as explained before. The tests that do not fill the requirements (tests that do not use the
Android testing framework, and so do not execute in a device) are simply ignored and will not be
included in the instrumented test project.
The framework produces as the output in this phase the path of both the instrumented AUT and the
instrumented test project.
7.1.2 Execute the tests
Expected input: path to the source code of the instrumented AUT (Application Under Test) and path
to the instrumented test project.
Expected output: path to the folder with the testing results (in the device).
The source code at this point is instrumented. Next step is to execute the tests that will simulate
the execution of the application. They will be executed twice: the first time to get the trace (list of
35
7.1. Workflow
invoked methods) and the second one to measure power consumption. We need the application trace
so we can know exactly what methods are invoked in each test, and if we get the power consumption
at the same time we may have a problem with the tracing overhead: the more methods we trace, the
more power consumption we have, because tracing works as a part of the application. To avoid this,
we first get the trace, and then we analyze the power consumption. The tracing results will be saved
in files (one for each test), containing a list of the methods invoked, along with the number of times it
was invoked.
The execution time is also needed, and for that we used a different JUnit test runner than the usual
Android Test Runner. This new runner is called Android JUnit Report Test Runner1. With this
test runner we were able to generate a XML file containing the JUnit information for each test, and
from that we took the execution times of each test.
The total value of the energy consumed, in mW, is saved in a single file, where each line a mapping
between a test and the value of the energy consumed.
7.1.3 Pull files from the device
Expected input: path to the folder with the testing results (in the device).
Expected output: path to the folder with the testing results (locally).
All the information referring to test execution is obviously stored in the device. After the test
execution phase, they need to be pulled out from the device in order to be properly analyzed and
computed. Android SDK offers a tool that can easily do this task if we passed it two arguments:
the source folder in the device you wish to pull out, and the destination folder in your computer. We
included an instruction in our tool that simply does the invocation of the command as if it was invoked
from a shell, and it does all necessary work associated with this task.
7.1.4 Classify the methods
Expected input: path to the folder with the testing results (locally).
Expected output: list of the methods from the AUT classified.
At this point, the tool will analyze the files previously pulled out from the device.
In first place, it creates a list containing the tests executed. Each entry in that list contains the
information of the corresponding test, i.e. the methods traced, the execution time and the total power
consumption. Then, with this information it calculates the energy consumed per second (which is the
standard comparison reference for the tests). Once every test has its information complete, the tool will
1 More information and tutorials can be found at http://www.alittlemadness.com/2010/07/14/Android-testing-xml-reports-for-continuous-integration/.
36

7.1. Workflow
compare the value of the energy consumed per second to determine if a test had excessive consumption
or not. If a test is considered to have excessive energy consumption, its methods are potential energy
leak triggers. They will be classified according to the categories described in section 6.4.
7.1.5 Generate the results
Expected input: list of the methods form the AUT classified.
Expected output: a sunburst diagram and showing visually the final testing results.
At this point, all methods of the application are classified as Green, Yellow or Red methods. We
discussed what would be the best way to show the results, and we based our approach in GZoltar [7],
a debugging/fault localization tool previously discussed. The authors of this tool had different ways
to show the results of the analyzes, but according to some feedback they had the most attractive way
illustrate them is using a sunburst diagram. Figure 11 shows an example of one sunburst diagram and
its interpretation.
Figure 11.: Sunburst diagram (and how to interpret it)
37

8
R E S U LT S
This chapter shows the results of running Green Droid to analyze different open source Android
applications. We considered seven different applications.
The first one, called 0xBenchmark1, has five different types of benchmarks: Math, 2D, 3D,
Browser Simulation (VM) and Native language. It allowed us to simulate several kinds of execu-
tions by making combinations with all of the possible benchmarks. We could not find any test project
for this application, we built our own tests. This was the only application where we did this. So,
the tests we built were simply based on choosing the benchmark we wanted to run (by selecting the
corresponding checkbox), and pushing the run benchmark button. Figure 12 shows the main screen of
the application, where it is possible to choose the benchmarks to be executed. We managed to run 20
different tests. They were simple combinations of the possible benchmark types, for example Math
and 3D benchmarks. Each test runs for different time periods and , obviously, had a different set of
methods invoked (execution trace). It is important to refer that
Figure 12.: Main page of the 0xBenchmark application
1 0xbench can be found at http://0xbenchmark.appspot.com.
38
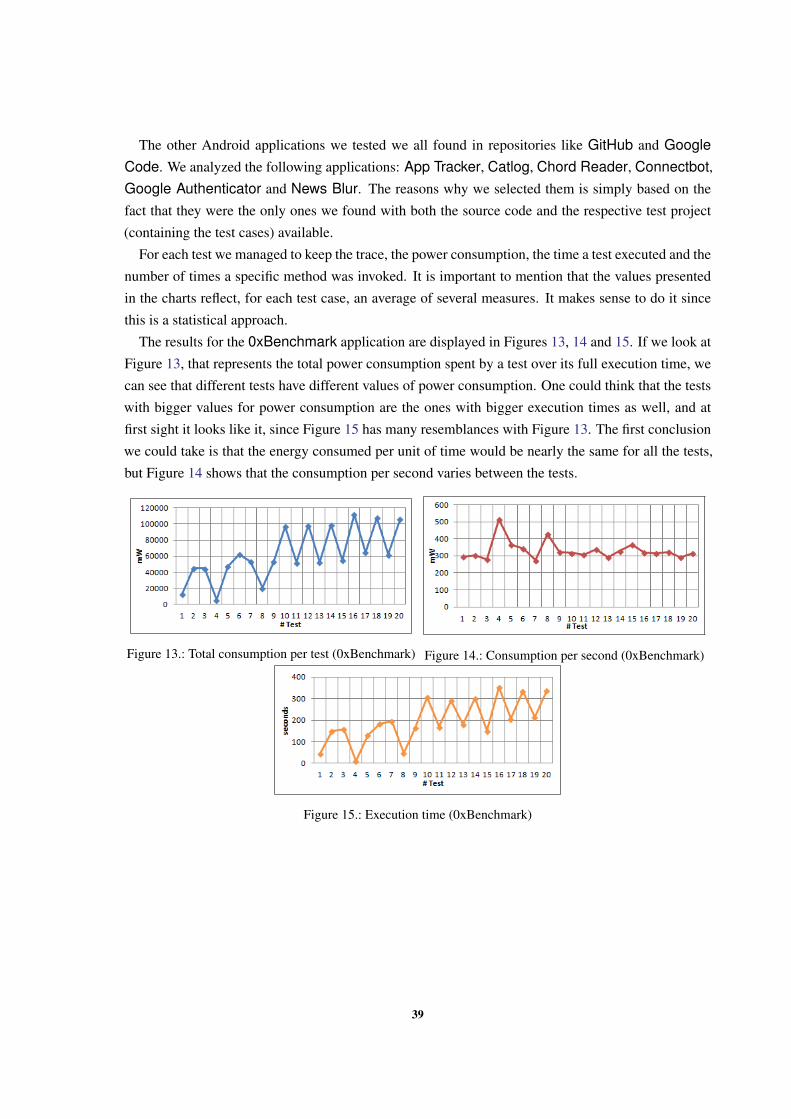
The other Android applications we tested we all found in repositories like GitHub and GoogleCode. We analyzed the following applications: App Tracker, Catlog, Chord Reader, Connectbot,Google Authenticator and News Blur. The reasons why we selected them is simply based on the
fact that they were the only ones we found with both the source code and the respective test project
(containing the test cases) available.
For each test we managed to keep the trace, the power consumption, the time a test executed and the
number of times a specific method was invoked. It is important to mention that the values presented
in the charts reflect, for each test case, an average of several measures. It makes sense to do it since
this is a statistical approach.
The results for the 0xBenchmark application are displayed in Figures 13, 14 and 15. If we look at
Figure 13, that represents the total power consumption spent by a test over its full execution time, we
can see that different tests have different values of power consumption. One could think that the tests
with bigger values for power consumption are the ones with bigger execution times as well, and at
first sight it looks like it, since Figure 15 has many resemblances with Figure 13. The first conclusion
we could take is that the energy consumed per unit of time would be nearly the same for all the tests,
but Figure 14 shows that the consumption per second varies between the tests.
Figure 13.: Total consumption per test (0xBenchmark) Figure 14.: Consumption per second (0xBenchmark)
Figure 15.: Execution time (0xBenchmark)
39

These are very good indicators, they allow us to conclude that execution time has an influence in
the power consumption, but it is not the only relevant factor. In fact, it might not be one of the most
relevant.
This was just the first application, and its behavior is different since it is a benchmark tool. The fact
is that running even the fastest benchmark in this application takes a few seconds. The slowest took
a few minutes. In any case, one could say that running tests that take too long to finish lets us have
better comparison values, but we verified that tests that run for not that long also show interesting
results.
Lets take another example from the remaining six tools we tested, called Google Authenticator2.
This application had its own test project with around two hundred tests. After our tool instrumented
them, a hundred and twenty seven were considered.
The tests for the Google Authenticator were a lot faster to end than the ones from 0xBenchmark,
and most of them take less than a second to finish. Knowing that Power Tutor can only take one
second interval samples, we had to change things a bit in order to consider as much tests as we could.
In the energy measurement stage of the test execution phase, our tool executes every test but for tests
that take less than a second to finish it delays them in order to collect information of their consumption.
With this we are assuming that a test that takes, for example, 0.3 seconds to finish actually takes 1
second. The results are still reliable. Our previous attempts to measure energy with Power Tutor
showed that using sampling intervals bigger than one second (i.e. measuring every ten seconds, for
example) leads to unreliable results, but taking sampling intervals of 1 second when the application
ran for less than that does not affect the results in such a way that needs to be considered.
To summarize it, we can run tests that are slower than one second. The total power consumption of
each test is represented in Figure 16, and Figure 18 shows the execution time of each test, just in the
same way as 0xBenchmark.
Figure 16.: Total consumption per test (GoogleAuthenticator)
Figure 17.: Consumption per second (Google Au-thenticator)
2 Google Authenticator webpage: https://code.google.com/p/google-authenticator/.
40

As we can see, the consumption still has outliers (observation points in the graphics that are distant
from other observations). The question now is: with much shorter execution times, can we affirm that
execution time is not directly proportional to energy consumption? The answer is yes. If we observe
Figure 18 we can still see a few resemblances between its outliers and the ones from Figure 16. And
if we check Figure 17 we will see that those resemblances are no longer detected. So, once again,
execution time is not directly related to energy consumption.
Figure 18.: Execution time (Google Authenticator)
This are just graphics and statistics, obviously important but not that helpful to the developer. An-
alyzing them all would take a substantial amount of time, which is not desirable. We need a way to
display the relevant information is such a way that a developer would detect at first sight what are the
methods that can be related to energy leaks.
So, with the approach described in Section 6.4 to detect tests with excessive power consumption
and classify the methods involved, we can assign a different value to each method according to its
classification. For example, Green Methods get value 0, 1 is assigned to Yellow Methods and finally
Red Methods get value 2. If we assign an obvious color to each value/method, and we show them all
together somehow, we have our desired results display.
Using the approach taken by GZoltar [7] and the classification presented in Section 6.4, we put the
methods of each project all together, organized by classes and packages. The final result is shown
41
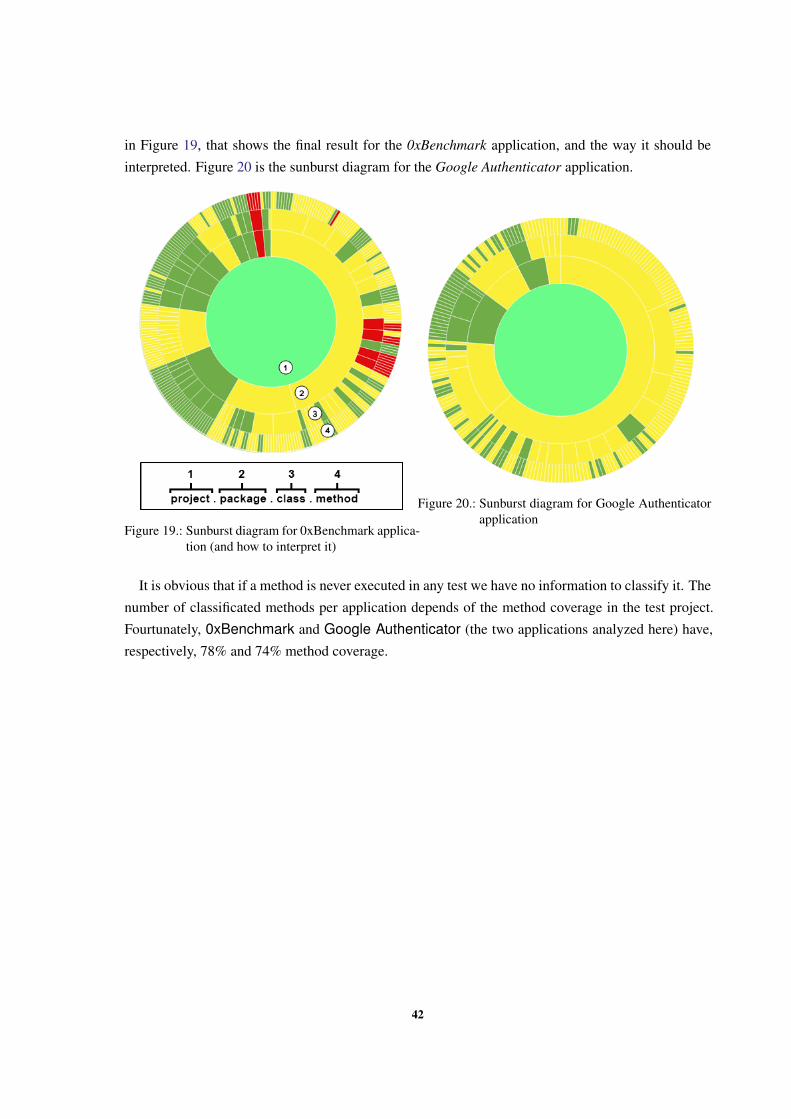
in Figure 19, that shows the final result for the 0xBenchmark application, and the way it should be
interpreted. Figure 20 is the sunburst diagram for the Google Authenticator application.
Figure 19.: Sunburst diagram for 0xBenchmark applica-tion (and how to interpret it)
Figure 20.: Sunburst diagram for Google Authenticatorapplication
It is obvious that if a method is never executed in any test we have no information to classify it. The
number of classificated methods per application depends of the method coverage in the test project.
Fourtunately, 0xBenchmark and Google Authenticator (the two applications analyzed here) have,
respectively, 78% and 74% method coverage.
42
9
C O N C L U S I O N S A N D F U T U R E W O R K
In this chapter, we start by presenting the contributions of our work, describing how we answered the
research questions first listed in Section 2.1 in the process. Then, we present the conclusions we draw
from this work and the future work intended to be be done in the near future.
9.1 AC H I E V E M E N T S / C O N T R I B U T I O N S
The contributions of this thesis go from a new view of the efficiency of Android applications to a tool
that can analyze that efficiency.
We successfully implemented our methodology in an application that allows an Android applica-
tions’ programmer to identify possible energy inefficient methods in his application(s).
For the research questions we identified before, we answer to answer them all successfully. The
answers to them are the following:
• Question 1: Given the source code of an Android application, is it possible to associate energy
consumption to different code sections?. Yes, it is. We did it by running tests that invoke several
methods of an application and measuring how much energy was spent during the test execution.
• Question 2: Is it possible to develop a tool that can automatically identify code fragments most
likely to have anomalous energy consumption, based on a power consumption model?. That is
what Green Droid is all about. It is a tool that analyzes test executions and respective power
consumption and execution time, and then classifies all the methods according to its influence
in tests that have an anomalous power consumption.
• Question 3: Is the execution time of a code fragment directly proportional to its energy consump-
tion?. Total power consumption is almost directly proportional to execution time, but when we
analyze consumption per unit of time (seconds, in our case) we can verify that longer tests do
not always lead to bigger values of consumption per second.
The work presented in this thesis was also published in an (already) accepted paper called ”De-
tecting Anomalou Energy Consumptions in Android Applications” [13], in the SBLP conference
(Simposio Brasileiro de Linguagens de Programacao), with 15 pages long.
43

9.2. Future Work
9.2 F U T U R E W O R K
The energy consumption is nowadays of paramount importance. This is also valid for software, and
specially for applications running in mobile devices. Indeed, the most used platform is clearly the
Android and thus we have devote our attention to its applications.
Given the innumerable quantity of Android versions and devices, our approach is to create a dy-
namic model that can be used in any device and any Android system, and that can give information to
the developers about the methods he/she is writing that consume the most energy. We have created a
tool that can automatically calibrate the model for every phone, and another to automatically annotate
any application source code so the programmer can have energy consumption measures with almost
no effort.
With this work we were able to show that the execution time is highly correlated to the total energy
consumption of an application. Although this seems obvious, until now it was only speculative. We
have also shown that the total time and energy the application takes to execute a set of tasks does not
indicate the worst methods. To find them, it is necessary to apply the techniques we now propose,
measuring this consumption by second and computing the worst methods, called red methods.
Nevertheless, there is still work to be done. Indeed it is still necessary to evaluate the precision
of the results of our consumption measurements. Since we do not use real measurements from the
physical device components, we still need to confirm that the results we can compute are accurate
enough. Besides, we still need to evaluate our method classification. The approach we used seems
promising, but it may not be the most accurate. Possibly there are some variables that were put aside,
like code coverage for example, that can possibly be used to improve our classification model. That is
something we can only be certain when we further validate our results.
Changing the source code sections marked as Red and checking if the gain we have from that re-
duces energy consumption is also an interesting topic. This is naturally associated with code refactor-
ing and bad smells detection. Of course that we will always have Red Methods, since it will always
exist consumptions with over the average consumptions. What we need is to try some refactoring
techniques and check if the power consumption drops significantly.
From a more practical viewpoint, we intend to extend our tool to something even more suitable for
developers. Still taking into account the work done in GZoltar [7] and MZoltar [31], we would like to
make the tool work in a similar way like an Eclipse plugin, where the developer can interact with the
sunburst diagram and go straight to the code fragment he selects.
Recent advances in mobile operating systems show the importance of energy consumption for mo-
bile devices. Mobile OS are offering more and more mechanisms to help programmers develop more
energy-efficient applications. This thesis proposes techniques that can work as a starting point for
mobile devices to have more battery time and their users more actual mobile usage time.
44

B I B L I O G R A P H Y
[1] R. Abreu, P. Zoeteweij, and A J C Van Gemund. On the accuracy of spectrum-based fault
localization. In Testing: Academic and Industrial Conference Practice and Research Techniques
- MUTATION, 2007. TAICPART-MUTATION 2007, pages 89–98, Sept 2007.
[2] Umut A. Acar, Guy E. Blelloch, and Robert Harper. Adaptive functional programming. ACM
Trans. Program. Lang. Syst., 28(6):990–1034, November 2006.
[3] Andreas Berl, Erol Gelenbe, Marco Di Girolamo, Giovanni Giuliani, Hermann De Meer,
Minh Quan Dang, and Kostas Pentikousis. Energy-efficient cloud computing. The Computer
Journal, 53(7):1045–1051, 2010.
[4] Jean Bezivin. Model driven engineering: An emerging technical space. In GTTSE’05, pages
36–64, 2005.
[5] Andreas Bieswanger, Hendrik F Hamann, and Hans-Dieter Wehle. Energy efficient data center.
it-Information Technology Methoden und innovative Anwendungen der Informatik und Informa-
tionstechnik, 54(1):17–23, 2012.
[6] Rajkumar Buyya, Anton Beloglazov, and Jemal H. Abawajy. Energy-efficient management of
data center resources for cloud computing: A vision, architectural elements, and open challenges.
CoRR, abs/1006.0308, 2010.
[7] Jose Campos, Andre Riboira, Alexandre Perez, and Rui Abreu. Gzoltar: An eclipse plug-in for
testing and debugging. pages 378–381, 2012.
[8] Tiago Carcao. Measuring and visualizing energy consumption within software code. In Pro-
ceedings of the 2014 IEEE Symposium on Visual Languages and Human-Centric Computing,
VL/HCC. IEEE, 2014.
[9] Joao M.P. Cardoso, Tiago Carvalho, Jose G.F. Coutinho, Wayne Luk, Ricardo Nobre, Pedro
Diniz, and Zlatko Petrov. Lara: an aspect-oriented programming language for embedded sys-
tems. In Proceedings of the 11th annual international conference on Aspect-oriented Software
Development, AOSD ’12, pages 179–190, New York, NY, USA, 2012. ACM.
[10] Aaron Carroll and Gernot Heiser. An analysis of power consumption in a smartphone. In Pro-
ceedings of the 2010 USENIX Conference on USENIX Annual Technical Conference, USENIX-
ATC’10, pages 21–21, Berkeley, CA, USA, 2010. USENIX Association.
45

Bibliography
[11] Manuel M. T. Chakravarty, Gabriele Keller, Simon Peyton Jones, and Simon Marlow. Associated
types with class. In Proceedings of the 32Nd ACM SIGPLAN-SIGACT Symposium on Principles
of Programming Languages, POPL ’05, pages 1–13, New York, NY, USA, 2005. ACM.
[12] Luis Corral, Anton B. Georgiev, Alberto Sillitti, and Giancarlo Succi. Method reallocation
to reduce energy consumption: An implementation in android os. In Proceedings of the 29th
Annual ACM Symposium on Applied Computing, SAC ’14, pages 1213–1218, New York, NY,
USA, 2014. ACM.
[13] Marco Couto, Tiago Carcao, Jacome Cunha, Joao Paulo Fernandes, and Joao Saraiva. In Pro-
ceedings of the 18th Brazilian Symposium on Programming Languages (SBLP), Brazil.
[14] Iavor S. Diatchki, Mark P. Jones, and Thomas Hallgren. A formal specification of the haskell 98
module system. In Proceedings of the 2002 ACM SIGPLAN Workshop on Haskell, Haskell ’02,
pages 17–28, New York, NY, USA, 2002. ACM.
[15] Fangwei Ding, Feng Xia, Wei Zhang, Xuhai Zhao, and Chengchuan Ma. Monitoring energy
consumption of smartphones. In Internet of Things (iThings/CPSCom), 2011 International Con-
ference on and 4th International Conference on Cyber, Physical and Social Computing, pages
610–613, Oct 2011.
[16] Mian Dong and Lin Zhong. Self-constructive high-rate system energy modeling for battery-
powered mobile systems. In Proceedings of the 9th International Conference on Mobile Systems,
Applications, and Services, MobiSys ’11, pages 335–348, New York, NY, USA, 2011. ACM.
[17] Sebastian Erdweg, Tijs van der Storm, Markus Volter, Meinte Boersma, Remi Bosman,
William R. Cook, Albert Gerritsen, Angelo Hulshout, Steven Kelly, Alex Loh, Gabriel D. P.
Konat, Pedro J. Molina, Martin Palatnik, Risto Pohjonen, Eugen Schindler, Klemens Schindler,
Riccardo Solmi, Vlad A. Vergu, Eelco Visser, Kevin van der Vlist, Guido Wachsmuth, and Jimi
van der Woning. The state of the art in language workbenches - conclusions from the language
workbench challenge. In Erwig et al. [18], pages 197–217.
[18] Martin Erwig, Richard F. Paige, and Eric Van Wyk, editors. Software Language Engineering -
6th International Conference, SLE 2013, Indianapolis, IN, USA, October 26-28, 2013. Proceed-
ings, volume 8225 of Lecture Notes in Computer Science. Springer, 2013.
[19] Joao Paulo Fernandes, Joao Saraiva, Daniel Seidel, and Janis Voigtlander. Strictification of
circular programs. In Proceedings of the 20th ACM SIGPLAN Workshop on Partial Evaluation
and Program Manipulation, PEPM ’11, pages 131–140. ACM, 2011.
[20] Jason Flinn and M. Satyanarayanan. Powerscope: A tool for profiling the energy usage of mobile
applications. In Proceedings of the Second IEEE Workshop on Mobile Computer Systems and
Applications, WMCSA ’99, pages 2–, Washington, DC, USA, 1999. IEEE Computer Society.
46

Bibliography
[21] Neil D. Jones. An introduction to partial evaluation. ACM Comput. Surv., 28(3):480–503,
September 1996.
[22] Wonwoo Jung, Chulkoo Kang, Chanmin Yoon, Donwon Kim, and Hojung Cha. Devscope: A
nonintrusive and online power analysis tool for smartphone hardware components. In Proceed-
ings of the Eighth IEEE/ACM/IFIP International Conference on Hardware/Software Codesign
and System Synthesis, CODES+ISSS ’12, pages 353–362, New York, NY, USA, 2012. ACM.
[23] Wonwoo Jung, Kwanghwan Kim, and Hojung Cha. ”UserScope: A Fine-grained Framework
for Collecting Energy-related Smartphone User Contexts”. IEEE International Conference on
Parallel and Distributed Systems(ICPADS 2013), December 2013.
[24] Dongwon Kim, Wonwoo Jung, and Hojung Cha. Runtime power estimation of mobile amoled
displays. In Design, Automation Test in Europe Conference Exhibition (DATE), 2013, pages
61–64, March 2013.
[25] MikkelBaun Kjærgaard and Henrik Blunck. Unsupervised power profiling for mobile devices. In
Alessandro Puiatti and Tao Gu, editors, Mobile and Ubiquitous Systems: Computing, Network-
ing, and Services, volume 104 of Lecture Notes of the Institute for Computer Sciences, Social
Informatics and Telecommunications Engineering, pages 138–149. Springer Berlin Heidelberg,
2012.
[26] Andreas Krall. Efficient javavm just-in-time compilation. In International Conference on Paral-
lel Architectures and Compilation Techniques, pages 205–212, 1998.
[27] Ralf Lammel, Joao Saraiva, and Joost Visser, editors. Generative and Transformational Tech-
niques in Software Engineering IV, International Summer School, GTTSE 2011, Braga, Portugal,
July 3-9, 2011. Revised Papers, volume 7680 of Lecture Notes in Computer Science. Springer,
2013.
[28] Ding Li, Shuai Hao, William G. J. Halfond, and Ramesh Govindan. Calculating source line
level energy information for android applications. In Proceedings of the 2013 International
Symposium on Software Testing and Analysis, ISSTA 2013, pages 78–89, New York, NY, USA,
2013. ACM.
[29] Ding Li, Yuchen Jin, Cagri Sahin, James Clause, and William G. J. Halfond. Integrated energy-
directed test suite optimization. In Proceedings of the 2014 International Symposium on Soft-
ware Testing and Analysis, ISSTA 2014, pages 339–350, New York, NY, USA, 2014. ACM.
[30] Mario Linares-Vasquez, Gabriele Bavota, Carlos Bernal-Cardenas, Rocco Oliveto, Massimil-
iano Di Penta, and Denys Poshyvanyk. Mining energy-greedy api usage patterns in android
apps: An empirical study. In Proceedings of the 11th Working Conference on Mining Software
Repositories, MSR 2014, pages 2–11, New York, NY, USA, 2014. ACM.
47

Bibliography
[31] Pedro Machado, Jose Campos, and Rui Abreu. ”MZoltar: Automatic Debugging of Android
Applications”. First international workshop on Software Development Lifecycle for Mobile (De-
Mobile), co-located with European Software Engineering Conference and the ACM SIGSOFT
Symposium on the Foundations of Software Engineering (ESEC/FSE) 2013, Saint Petersburg,
Russia, 2013.
[32] Adel Noureddine, Romain Rouvoy, and Lionel Seinturier. Unit Testing of Energy Consumption
of Software Libraries. In Symposium On Applied Computing, Gyeongju, Coree, Republique De,
March 2014.
[33] Abhinav Pathak, Y. Charlie Hu, and Ming Zhang. Where is the energy spent inside my app?:
Fine grained energy accounting on smartphones with eprof. In Proceedings of the 7th ACM
European Conference on Computer Systems, EuroSys ’12, pages 29–42, New York, NY, USA,
2012. ACM.
[34] Abhinav Pathak, Y. Charlie Hu, Ming Zhang, Paramvir Bahl, and Yi-Min Wang. Fine-grained
power modeling for smartphones using system call tracing. In Proceedings of the Sixth Confer-
ence on Computer Systems, EuroSys ’11, pages 153–168, New York, NY, USA, 2011. ACM.
[35] Gustavo Pinto, Fernando Castor, and Yu David Liu. Mining questions about software energy
consumption. In Proceedings of the 11th Working Conference on Mining Software Repositories,
MSR 2014, pages 22–31, New York, NY, USA, 2014. ACM.
[36] Colin Runciman and Niklas Rojemo. Heap Profiling for Space Efficiency. In John Launchbury,
Erik Meijer, and Tim Sheard, editors, Second International School on Advanced Functional
Programming, volume 1129 of LNCS, pages 159–183, 1996.
[37] Colin Runciman and David Wakeling. Heap profiling of a lazy functional compiler. In Proc.
1992 Glasgow Workshop on Functional Programming, pages 203–214. Springer-Verlag, 1992.
[38] Cagri Sahin, Philip Tornquist, Ryan McKenna, Zachary Pearson, and James Clause. How does
code obfuscation impact energy usage? 2014.
[39] Joao Saraiva and Doaitse Swierstra. Data Structure Free Compilation. In Stefan Jahnichen,
editor, 8th International Conference on Compiler Construction, CC/ETAPS’99, volume 1575 of
LNCS, pages 1–16, March 1999.
[40] Philip Wadler. Deforestation: transforming programs to eliminate trees. Theoretical Computer
Science, 73:231–248, 1990.
[41] Chanmin Yoon, Dongwon Kim, Wonwoo Jung, Chulkoo Kang, and Hojung Cha. Appscope:
Application energy metering framework for android smartphone using kernel activity monitoring.
In Presented as part of the 2012 USENIX Annual Technical Conference (USENIX ATC 12), pages
387–400, Boston, MA, 2012. USENIX.
48
Bibliography
[42] Lide Zhang, Mark S. Gordon, Robert P. Dick, Z. Morley Mao, Peter Dinda, and Lei Yang.
Adel: An automatic detector of energy leaks for smartphone applications. In Proceedings of the
Eighth IEEE/ACM/IFIP International Conference on Hardware/Software Codesign and System
Synthesis, CODES+ISSS ’12, pages 363–372, New York, NY, USA, 2012. ACM.
[43] Lide Zhang, Birjodh Tiwana, Zhiyun Qian, Zhaoguang Wang, Robert P. Dick, Zhuoqing Morley
Mao, and Lei Yang. Accurate online power estimation and automatic battery behavior based
power model generation for smartphones. In Proceedings of the Eighth IEEE/ACM/IFIP Inter-
national Conference on Hardware/Software Codesign and System Synthesis, CODES/ISSS ’10,
pages 105–114, New York, NY, USA, 2010. ACM.
49
Part III
A P E N D I C E S
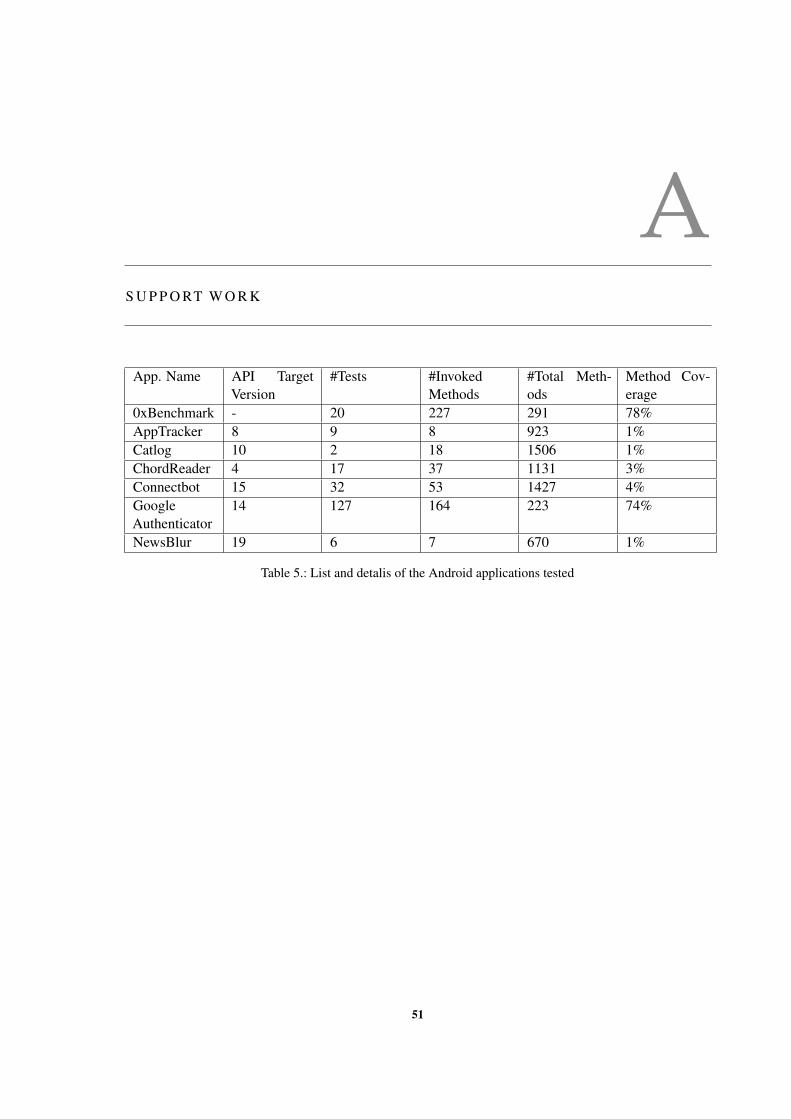
AS U P P O RT W O R K
App. Name API TargetVersion
#Tests #InvokedMethods
#Total Meth-ods
Method Cov-erage
0xBenchmark - 20 227 291 78%AppTracker 8 9 8 923 1%Catlog 10 2 18 1506 1%ChordReader 4 17 37 1131 3%Connectbot 15 32 53 1427 4%GoogleAuthenticator
14 127 164 223 74%
NewsBlur 19 6 7 670 1%
Table 5.: List and detalis of the Android applications tested
51

BD E TA I L S O F R E S U LT S
B.1 R E S U LT S F O R 0 X B E N C H M A R K
# Test Time (s) Consumption (mW) Consumption per Second (mW/s) # Method Calls1 43,63 12852 294,57 1781582 148,97 45025 302,25 227483 158,41 44591 281,49 7132324 11,74 6015 512,22 22600495 130,30 47745 366,43 1356 182,99 62425 341,13 2008137 194,69 53379 274,17 8868458 48,90 20909 427,60 24376009 165,71 53528 323,02 17819810 306,67 97271 317,18 73329311 169,42 52111 307,59 228270212 290,02 98241 338,74 2278813 180,74 52766 291,94 296916614 301,99 99225 328,57 70740715 151,17 55109 364,55 226008916 351,55 111725 317,81 91671217 206,71 65071 314,79 246076318 333,72 107635 322,53 20033919 214,41 62194 290,08 314786420 337,99 106423 314,87 889805x 331,58 62712,00 196,49 1173435,30σ 54,93 31523,24 99,18 1093527,16
Table 6.: Details of each test from 0xBenchmark application
52

B.1. Results for 0xBenchmark
Figure 21.: Total consumption per test for 0xBenchmark application
Figure 22.: Consumption per second for 0xBenchmark application
Figure 23.: Execution time per test for 0xBenchmark application
53

B.2. Results for AppTracker
B.2 R E S U LT S F O R A P P T R AC K E R
#Test Time (s) Consumption (mW) Consumption per Second (mW/s) #Method Calls1 0,501 56 111,78 92 0,138 57 413,04 93 0,107 21 196,26 94 0,142 22 154,93 95 0,136 22 161,76 96 0,113 22 194,69 97 0,229 22 96,07 98 0,111 22 198,20 99 0,167 22 131,74 9x 0,18 29,56 184,27 9,00σ 0,13 15,28 93,50 0,00
Table 7.: Details of each test from AppTracker application
Figure 24.: Total consumption per test for Apptracker application
54

B.2. Results for AppTracker
Figure 25.: Consumption per second for Apptracker application
Figure 26.: Execution time per test for Apptracker application
55

B.3. Results for Catlog
B.3 R E S U LT S F O R C AT L O G
#Test Time (s) Consumption (mW) Consumption per Second (mW/s) #Method Calls1 0,798 46 57,64 27272 1,548 84 54,26 1942x 1,17 65,00 55,95 2334,50σ 0,53 26,87 2,39 555,08
Table 8.: Details of each test from Catlog application
Figure 27.: Total consumption per test for Catlog application
Figure 28.: Consumption per second for Catlog application
56

B.3. Results for Catlog
Figure 29.: Execution time per test for Catlog application
57
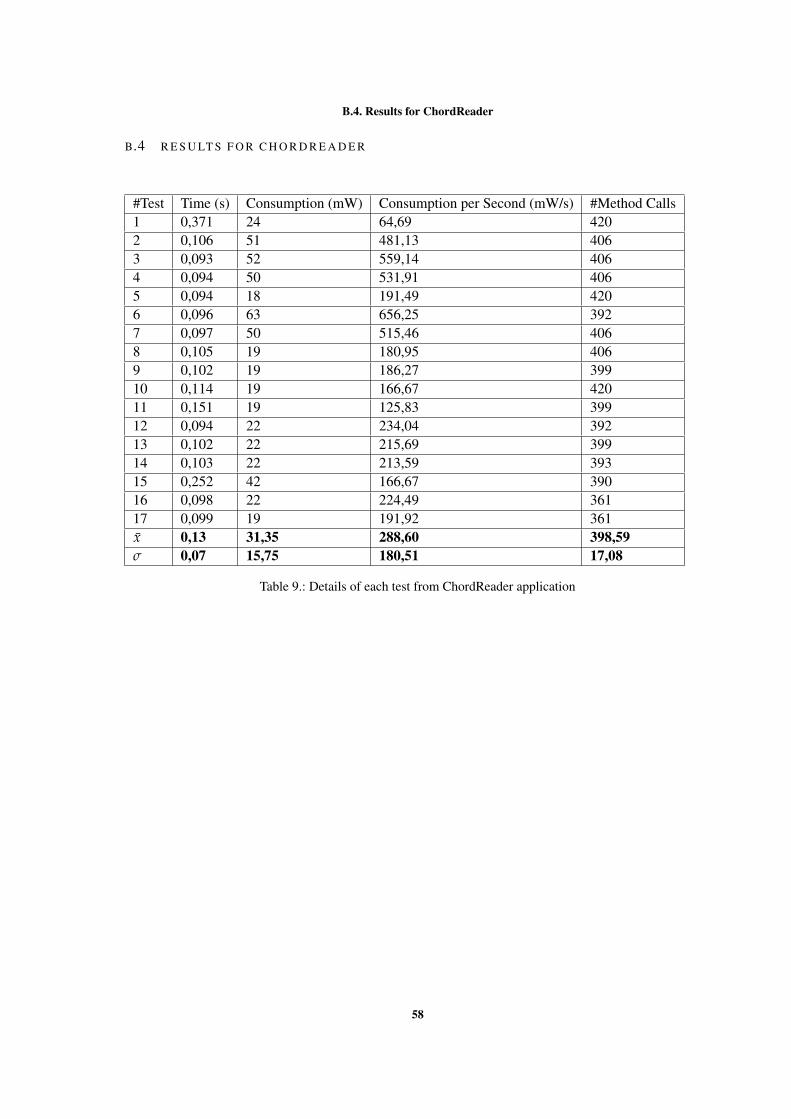
B.4. Results for ChordReader
B.4 R E S U LT S F O R C H O R D R E A D E R
#Test Time (s) Consumption (mW) Consumption per Second (mW/s) #Method Calls1 0,371 24 64,69 4202 0,106 51 481,13 4063 0,093 52 559,14 4064 0,094 50 531,91 4065 0,094 18 191,49 4206 0,096 63 656,25 3927 0,097 50 515,46 4068 0,105 19 180,95 4069 0,102 19 186,27 39910 0,114 19 166,67 42011 0,151 19 125,83 39912 0,094 22 234,04 39213 0,102 22 215,69 39914 0,103 22 213,59 39315 0,252 42 166,67 39016 0,098 22 224,49 36117 0,099 19 191,92 361x 0,13 31,35 288,60 398,59σ 0,07 15,75 180,51 17,08
Table 9.: Details of each test from ChordReader application
58

B.4. Results for ChordReader
Figure 30.: Total consumption per test for Chordreader application
Figure 31.: Consumption per second for Chordreader application
Figure 32.: Execution time per test for Chordreader application
59
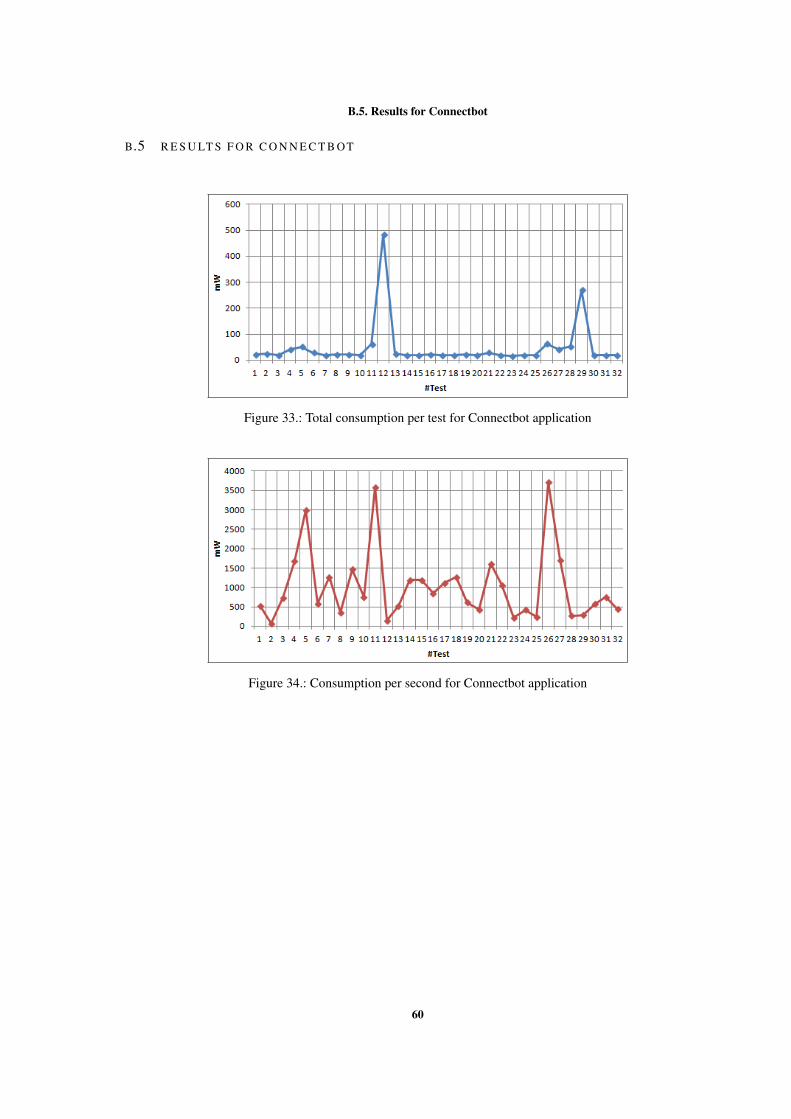
B.5. Results for Connectbot
B.5 R E S U LT S F O R C O N N E C T B OT
Figure 33.: Total consumption per test for Connectbot application
Figure 34.: Consumption per second for Connectbot application
60

B.5. Results for Connectbot
Figure 35.: Execution time per test for Connectbot application
61
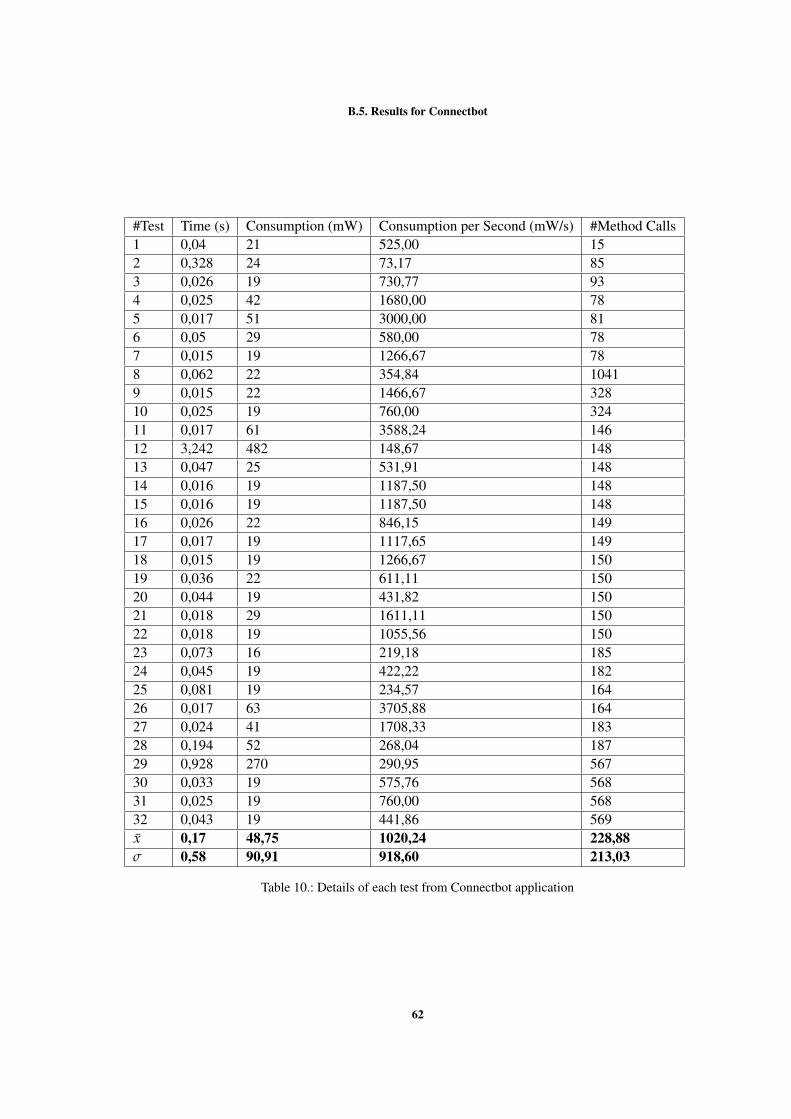
B.5. Results for Connectbot
#Test Time (s) Consumption (mW) Consumption per Second (mW/s) #Method Calls1 0,04 21 525,00 152 0,328 24 73,17 853 0,026 19 730,77 934 0,025 42 1680,00 785 0,017 51 3000,00 816 0,05 29 580,00 787 0,015 19 1266,67 788 0,062 22 354,84 10419 0,015 22 1466,67 32810 0,025 19 760,00 32411 0,017 61 3588,24 14612 3,242 482 148,67 14813 0,047 25 531,91 14814 0,016 19 1187,50 14815 0,016 19 1187,50 14816 0,026 22 846,15 14917 0,017 19 1117,65 14918 0,015 19 1266,67 15019 0,036 22 611,11 15020 0,044 19 431,82 15021 0,018 29 1611,11 15022 0,018 19 1055,56 15023 0,073 16 219,18 18524 0,045 19 422,22 18225 0,081 19 234,57 16426 0,017 63 3705,88 16427 0,024 41 1708,33 18328 0,194 52 268,04 18729 0,928 270 290,95 56730 0,033 19 575,76 56831 0,025 19 760,00 56832 0,043 19 441,86 569x 0,17 48,75 1020,24 228,88σ 0,58 90,91 918,60 213,03
Table 10.: Details of each test from Connectbot application
62

B.6. Results for Google Authenticator
B.6 R E S U LT S F O R G O O G L E AU T H E N T I C AT O R
#Test Time (s) Consumption (mW) Consumption per Second (mW/s) #Method Calls
1 0,207 58 280,19 10
2 0,242 31 128,10 26
3 0,635 57 89,76 21
4 0,216 25 115,74 39
5 0,18 82 455,56 49
6 0,219 20 91,32 61
7 0,208 28 134,62 61
8 0,161 25 155,28 57
9 0,159 21 132,08 55
10 0,275 47 170,91 88
11 0,06 22 366,67 67
12 0,15 21 140,00 72
13 0,244 31 127,05 78
14 0,19 28 147,37 71
15 1,67 293 175,45 81
16 0,741 135 182,19 84
17 1,082 265 244,92 238
18 0,795 62 77,99 311
19 0,923 55 59,59 361
20 1,153 57 49,44 344
21 1,059 47 44,38 339
22 0,914 115 125,82 239
23 1,042 155 148,75 272
24 0,934 107 114,56 265
25 1,043 53 50,81 394
26 0,94 150 159,57 344
27 1,049 47 44,80 370
28 1,156 47 40,66 426
29 1,269 61 48,07 265
30 0,895 48 53,63 345
31 0,903 44 48,73 314
32 0,935 137 146,52 369
33 1,218 160 131,36 466
34 1,025 57 55,61 379
63

B.6. Results for Google Authenticator
35 1,679 179 106,61 275
36 1,174 63 53,66 356
37 2,544 549 215,80 561
38 2,836 822 289,84 806
39 1,102 311 282,21 421
40 1,022 190 185,91 348
41 0,923 181 196,10 250
42 0,662 108 163,14 241
43 0,754 77 102,12 324
44 0,835 226 270,66 243
45 0,895 103 115,08 344
46 0,869 91 104,72 247
47 1,075 95 88,37 346
48 0,719 34 47,29 290
49 0,802 77 96,01 320
50 0,789 112 141,95 252
51 0,727 31 42,64 222
52 0,741 31 41,84 253
53 0,813 30 36,90 173
54 0,845 33 39,05 173
55 0,725 29 40,00 170
56 1,112 228 205,04 176
57 2,81 323 114,95 176
58 0,84 203 241,67 172
59 0,911 60 65,86 172
60 0,854 133 155,74 172
61 1,769 204 115,32 198
62 1,423 237 166,55 173
63 1,83 248 135,52 173
64 0,064 19 296,88 173
65 0,046 19 413,04 202
66 0,032 19 593,75 201
67 0,052 22 423,08 202
68 0,049 19 387,76 202
69 1,271 50 39,34 200
70 0,175 25 142,86 207
71 0,064 63 984,38 207
64
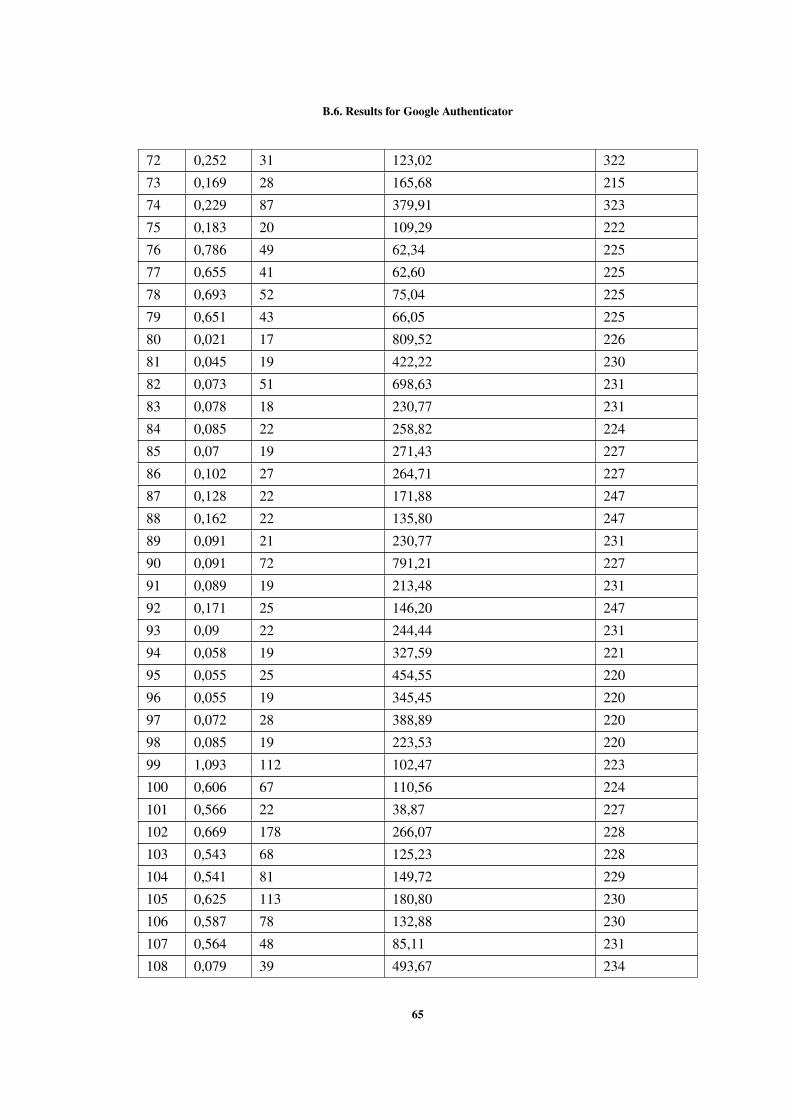
B.6. Results for Google Authenticator
72 0,252 31 123,02 322
73 0,169 28 165,68 215
74 0,229 87 379,91 323
75 0,183 20 109,29 222
76 0,786 49 62,34 225
77 0,655 41 62,60 225
78 0,693 52 75,04 225
79 0,651 43 66,05 225
80 0,021 17 809,52 226
81 0,045 19 422,22 230
82 0,073 51 698,63 231
83 0,078 18 230,77 231
84 0,085 22 258,82 224
85 0,07 19 271,43 227
86 0,102 27 264,71 227
87 0,128 22 171,88 247
88 0,162 22 135,80 247
89 0,091 21 230,77 231
90 0,091 72 791,21 227
91 0,089 19 213,48 231
92 0,171 25 146,20 247
93 0,09 22 244,44 231
94 0,058 19 327,59 221
95 0,055 25 454,55 220
96 0,055 19 345,45 220
97 0,072 28 388,89 220
98 0,085 19 223,53 220
99 1,093 112 102,47 223
100 0,606 67 110,56 224
101 0,566 22 38,87 227
102 0,669 178 266,07 228
103 0,543 68 125,23 228
104 0,541 81 149,72 229
105 0,625 113 180,80 230
106 0,587 78 132,88 230
107 0,564 48 85,11 231
108 0,079 39 493,67 234
65

B.6. Results for Google Authenticator
109 0,124 40 322,58 234
110 0,028 21 750,00 234
111 0,226 21 92,92 240
112 0,179 42 234,64 237
113 0,156 18 115,38 237
114 0,162 19 117,28 237
115 0,187 19 101,60 238
116 0,169 19 112,43 237
117 0,155 22 141,94 238
118 0,165 22 133,33 237
119 0,162 41 253,09 238
120 0,168 19 113,10 238
121 0,167 22 131,74 240
122 0,181 22 121,55 241
123 0,173 19 109,83 241
124 0,174 41 235,63 239
125 0,175 21 120,00 239
126 0,188 16 85,11 240
127 0,18 22 122,22 240
x 0,58 78,30 192,54 234,10σ 0,56 104,68 9167,72 104,33
Table 11.: Details of each test from Google Authenticator application
66

B.6. Results for Google Authenticator
Figure 36.: Total consumption per test for Google Authenticator application
Figure 37.: Consumption per second for Google Authenticator application
67

B.6. Results for Google Authenticator
Figure 38.: Execution time per test for Google Authenticator application
68

B.7. Results for NewsBlur
B.7 R E S U LT S F O R N E W S B L U R
#Test Time (s) Consumption (mW) Consumption per Second (mW/s) #Method Calls1 2,857 197 68,95 42 1,364 63 46,19 63 0,945 89 94,18 74 0,889 57 64,12 95 0,825 230 278,79 106 1,479 147 99,39 9x 1,39 130,50 108,60 7,50σ 0,77 72,49 85,68 2,26
Table 12.: Details of each test from NewsBlur application
Figure 39.: Total consumption per test for NewsBlur application
69

B.7. Results for NewsBlur
Figure 40.: Consumption per second for NewsBlur application
Figure 41.: Execution time per test for NewsBlur application
70

CT O O L I N G
C.1 P O W E R T U T O R
PowerTutor is an application for Google phones that displays the power consumed by major system
components such as CPU, network interface, display, and GPS receiver and different applications.
The application allows software developers to see the impact of design changes on power efficiency.
Application users can also use it to determine how their actions are impacting battery life. PowerTu-
tor uses a power consumption model built by direct measurements during careful control of device
power management states. A configurable display for power consumption history is provided. It also
provides users with a text-file based output containing detailed results. PowerTutor can be used to
monitor the power consumption of any application.
C.1.1 Construction of the power model
Each hardware component in a smartphone has a couple of power states that influence the phone’s
power consumption. For example, CPU has CPU utilization and frequency level, OLED/LCD has
brightness levels. The power model in PowerTutor is constructed by correlating the measured power
consumption with these hardware power states. The power states we have considered in the power
model includes:
- CPU: CPU utilization and frequency level.
- OLED/LCD: For hardware with LCD screen and OLED screen without root, we consider bright-
ness level; For hardware with OLED screen with root access, we consider brightness together with
pixel information displayed on the screen.
- Wifi: Uplink channel rate, uplink data rate and packets transmitted per second.
- 3G: Packets transmitted per second and power states.
- GPS: Number of satellites detected, power states of the GPS device (active, sleep, off).
- Audio: Power states of the Audio device (on, off).
71

C.2. Java Parser
C.1.2 Assign power/energy to applications
Power usage is assigned to applications as though it were the only app running. The reason for this
is that sometimes when two applications are running at the same time they can cause some of the
hardware components to transition into states they wouldn’t otherwise be in if only one of the apps
were running. In these sorts of cases it’s not clear how to assign power utilization on a per-app basis.
For example, consider the pathological case where two apps are transmitting a small amount of data.
Suppose if either app was running alone the wireless device would remain in the low power state (tens
of mW). However, running together they force the wireless device into the high power state (hundreds
of mW). It isn’t immediately obvious how to divide up power between the apps in a fair way that is
meaningful to users and developers using this app.
To solve this problem hardware states are simulated for each application as though the app was
running alone. With predicted hardware states it is then possible to calculate how much power each
app is would be using. In our example earlier each app would be charged for using the wireless device
in the low power state as neither would have caused the transition to the high power state by itself.
Power Tutor’s web page: http://ziyang.eecs.umich.edu/projects/powertutor/.
C.2 JAVA PA R S E R
Java Parser was created using javacc (the java compiler compiler). It provides AST generation and
visitor support. The AST records the source code structure, javadoc and comments. It is also possible
to change the AST nodes or create new ones to modify the source code. Some of the main features of
this tool:
• Light weight;
• Good performance;
• Easy to use;
• AST can be modified;
• AST can be created from scratch;
Web page of this tool: https://code.google.com/p/javaparser/
C.3 JAVA D O M PA R S E R
The Document Object Model provides APIs that let you create, modify, delete, and rearrange nodes
from a XML file. More information is available at http://docs.oracle.com/javase/tutorial/
jaxp/dom/readingXML.html.
72

C.4. Android JUnit Report Test Runner
C.4 A N D RO I D J U N I T R E P O RT T E S T RU N N E R
Android testing implies the use of a custom test runner different than the one used by JUnit. Usually,
the default test runner comes along with the Android SDK, but we needed one that could let us control
the output.
The Android JUnit Report Test Runner is a custom instrumentation test runner for Android that
creates XML test reports. These reports are in a similar format to those created by the Ant JUnit
task’s XML formatter, allowing them to be integrated with tools that support that format.
The webpage of this tool can be found here: http://www.alittlemadness.com/2010/
07/14/android-testing-xml-reports-for-continuous-integration/. The source
code is also available at https://github.com/jsankey/android-junit-report.
C.5 Z O O M A B L E S U N B U R S T
A sunburst is similar to a treemap, except it uses a radial layout. The root node of the tree is at
the center, with leaves on the circumference. We used an HTMLimplementation of the sunburst to
display the testing results. The source code of the tool can be found here: http://bl.ocks.
org/mbostock/4348373.
73