maria chantziara (s131176) acoustic loading of the vocal folds of
TRANSCRIPT

Maria Chantziara (s131176)
Acoustic loading of the vocal foldsof the singing voice
Master’s Thesis, July 2015


MARIA CHANTZIARA (S131176)
Acoustic loading of the vocal folds of
the singing voice
Master’s Thesis, July 2015
Supervisors:
Finn T. Agerkvist
Alba Granados
DTU - Technical University of Denmark, Kgs. Lyngby - 2015


Acoustic loading of the vocal folds of the singing voice
This report was prepared by:Maria Chantziara (s131176)
Advisors:Finn T. AgerkvistAlba GranadosJonas Brunskog
Project period: January 2015- July 2015
ECTS: 35
Education: MSc
Field: Engineering Acoustics
Copyrights: ©Maria Chantziara, 2015


Table of Contents
1 Introduction 1
2 Voice production 52.1 The human vocal system . . . . . . . . . . . . . . . . . . . . . . . . . . 5
2.1.1 Vocal fold vibration . . . . . . . . . . . . . . . . . . . . . . . . . 9
2.1.2 Source filter theory . . . . . . . . . . . . . . . . . . . . . . . . . 10
2.2 Complete Vocal Technique . . . . . . . . . . . . . . . . . . . . . . . . . 12
3 Computational models 173.1 The vocal tract . . . . . . . . . . . . . . . . . . . . . . . . . . . . . . . . 18
3.1.1 Frequency domain model of the vocal tract . . . . . . . . . . . . 18
3.1.2 Time domain: Wave reflection model . . . . . . . . . . . . . . . 23
3.2 The vocal folds . . . . . . . . . . . . . . . . . . . . . . . . . . . . . . . 26
3.2.1 Lumped parameter model . . . . . . . . . . . . . . . . . . . . . . 26
3.2.2 Continuum model . . . . . . . . . . . . . . . . . . . . . . . . . . 30
3.3 Summary . . . . . . . . . . . . . . . . . . . . . . . . . . . . . . . . . . 33
4 Geometry of the vocal tract 354.1 Simulations using spoken vowels . . . . . . . . . . . . . . . . . . . . . . 35
4.2 Simulations using the vocal modes . . . . . . . . . . . . . . . . . . . . . 38
4.3 Analysing the harmonics . . . . . . . . . . . . . . . . . . . . . . . . . . 41
4.4 Investigation of other possible modes . . . . . . . . . . . . . . . . . . . . 42
5 Further modelling and coupling 495.1 Losses in the vocal tract . . . . . . . . . . . . . . . . . . . . . . . . . . . 49
5.2 Results using the vocal folds model . . . . . . . . . . . . . . . . . . . . . 51
5.3 Coupling the vocal tract . . . . . . . . . . . . . . . . . . . . . . . . . . . 52
i

ii TABLE OF CONTENTS
6 Conclusion and further research 59
Appendices 63
A Matlab code used for the WR analog 65
B Solution of the equations of motion 67
C Simulated vocal modes: Spectra 69
Bibliography 73

Abstract
Ongoing scientific research concerning the mechanism of the singing voice, is conductedthe last years. The identification of the basic parameters that control the functionalityof the vocal system, would give singers the possibility to produce desirable sounds withless effort and in a healthy way. Complete Vocal Technique is a singing method which isbased on the anatomy and physiology of the vocal system. This technique suggests fourvocal modes with which the human instrument can produce sounds, independently thesinging style of the singer.
The shape of the vocal tract during the phonation of the modes and the strength of theharmonics was defined. The geometrical data were obtained from previous research us-ing Magnetic Resonance scanning. Already recorded data were processed. The resultsshowed that each vocal mode has a different epilarynx tube, which seems to influence thestrength of the coupling between the source and the filter. The analysis of the recordeddata, showed evidence that there are two possible modes between the non metallic and full
metallic modes. The fact that different vowels were used for each mode, renders the con-clusion preliminary and suggests further experimental approach. The vocal folds modelis a symmetrical mechanical system. Each vocal fold consists of two masses, springs anddampers. The system self oscillates without the presence of the vocal tract. The obtainedvocal tract configurations for four modes were coupled with the vocal folds model. Thetension parameter was adjusted to shift the fundamental frequency of the phonation andthe initial displacement of the masses triggered the oscillation. An interaction betweenthe vocal folds and the vocal tract was observed since the strength of the harmonics wasshifted when different modes were simulated. However, many of the harmonics seemunderestimated compared to the measurements. The deviation from the measurements isattributed to the simplified model that was used. Unfortunately, the time restriction didnot leave space for further analysis and the implementation of a more complex model.
iii


Preface
This report is the documentation of a master thesis in Engineering Acoustics at the Tech-nical University of Denmark (DTU). The project lasted from January 2015 to July 2015under the supervision of Assoc. Prof. Finn Agerkvist. The study includes the modellingof the mechanics of the singing voice.
The motivation for the project was the ongoing research in the field of the singing voiceand particularly the Complete Vocal Technique. Teaching techniques for singers are beingimproved and singers can understand in an easy way how to use their voice in a healthyway. Complete Vocal Technique is a singing method suggested by the Complete Vocal In-stitute and Cathrine Sadolin. The four vocal modes are introduced and analysed. Recentresearch on the modes is also discussed.
Special thanks to Cathrine Sadolin, Henrik Kjelin, Jesper Pedersen. Especially thanksto my supervisors, Finn Agerkvist and Alba Granados, for their advice, their patience andthe useful directions they gave to me during this project.
Maria Chantziara (s131176)
v


CHAPTER 1Introduction
The human voice is one of the most important means of communication. It is consideredto have a twofold meaning since, apart from using it for producing speech, it is also usedas an instrument for creating music. Theoretical models for the vocal fold oscillation andthe wave propagation in the vocal tract are already suggested but an accurate representa-tion of the phonatory system has yet to be developed. The anatomy and the physiologyof the human phonatory system is, in general, well represented but the complexity of thefunctionality of the system demands further research.
The singing voice is under research the last years. Not only does it concern the scientistsin order to create a realistic model of the singing voice, but it is important for pedagogicalpurposes that will help singing teachers to teach in a very effective way. Specifically, arealistic model would help to understand how the physical changes in the vocal tract andthe vocal folds influence the produced sound.
Many studies have been conducted concerning the singing voice. In Sundberg [1994],the differences between the spoken vowels and the sung vowels were reviewed. Two as-pects characterize the voiced sounds. The vowel quality and the voice quality. The vowelquality depends on the first two formants and give the vowel its characteristic sound. Thevoice quality depends mainly on the higher formants. In the latter study, it has beenproved that in high pitches e.g. soprano singing, the vowel identification is very difficultbecause the first two formants are very close to each other.
Vowel articulation demands particular vocal tract shapes in every singing style. Vary-ing the vocal tract, means that the resonances in the vocal tract are shifted due to themovement of the lips, the mouth and the jaw [Henrich et al., 2011]. In singing, when aharmonic of the voice is very close to a resonance of the vocal tract, this can increase
1
2 CHAPTER 1. INTRODUCTION
the sound level of the sound that is produced. This effect is known as resonance tuning
and allows singers to perform efficiently by putting less effort. However, in some cases,it is suggested that in high pitches and especially in singing, the non linear coupling ofthe vocal tract and the vocal folds is more intense and can create frequency instabilities[Titze, 2008].
Complete Vocal Technique is a recent study which is based on the anatomy and physi-ology of voice production. It proposes four vocal modes of the singing voice a) Neutral,b) Curbing, c) Overdrive and d) Edge. The definition of the modes is based on subjectiveand objective measures, which prove the different features of each mode.
A very helpful tool to define the shape and the function areas of the vocal tract is theMagnetic Resonance Imaging or MRI. [Clement et al., 2007] conducted MRI measure-ments using a male test subject phonating spoken vowels. The results show that the MRIgives satisfactory results and can be used to represent the human vocal tract during phona-tion. The vocal tract of the four vocal modes have also been analysed by conducting MRIscans [Pedersen, 2013]. During the measurements the test subject was phonating differentvowels performing the four vocal modes. The data from both MRI studies are used in thecurrent project.
A thorough literature research was performed in order to familiarize with the anatomyand the physiology of the vocal system, and how this knowledge could be used in themodelling of the vocal tract and the vocal folds. The frequency and time domain modelis used for the vocal tract analysis. For the vocal folds, the lamped parameter model andthe continuous model are discussed but the latter is not used for further investigation dueto the complexity of the system and limitations that were posed during the current study.
Great focus is given on the vocal tract shape. According to earlier research, the shapeof the vocal tract can define the degree of interaction with the vocal folds [Austin andTitze, 1997]. The linear source filter theory suggests an independent behaviour of thevocal tract filter and the vocal folds source. Though, for high frequencies of the voice it issuggested that the non linear coupling dominates. This would explain an acoustic loadingof the vocal folds and a possible change in their vibration [Titze, 2008].
The aim of the current study is to model the human vocal system and investigate theinteraction between the vocal tract and vocal folds. The four vocal modes suggested bythe Complete Vocal Technique will be used for the modelling.

3
The main parts of the theoretical background concerning the human phonatory system arepresented in the second chapter. Special attention is paid to the source filter theory andthe understanding of the four modes suggested by the Complete Vocal Technique. In thethird chapter, the techniques for modelling the vocal tract and the vocal folds are analysed.The fourth chapter focuses on the four vocal modes and the vocal tract shapes each modehas. An analysis of the spectra of recorded data is presented. MRI data from previousstudies are used for this purpose. In the fifth chapter, simulation results are analysed anddiscussed.


CHAPTER 2Voice production
2.1 The human vocal system
The human speech consists of a sequence of sounds. The classification of these soundsis controlled by linguistic rules which are not part of this research since this is a subjectof the linguistic sector. However, the knowledge of the structure of sounds is importantfor speech signal processing. Therefore, in order to analyse the speech signals a goodunderstanding of the mechanism of their production is needed [Fakotakis, 2005].
Speech production is a complex mechanism and for this purpose many organs such asthe throat, the nose, the mouth and a number of muscles are used. The speech productionmechanism consists of several parts, some of which belong to the respiratory system andothers to the digestive system. An illustration of the human phonatory system can be seenin Fig. 2.1 and it is composed by the lungs, the trachea, the larynx and the vocal tract.
5

6 CHAPTER 2. VOICE PRODUCTION
Figure 2.1: The human phonatory system [tdmu.edu, 2015].
Speech is produced when air is forced from the lungs up to the trachea past the vocalfolds as they open and close in a periodic or quasi-periodic manner. The sound energythat is produced by the flow of air is defined as the glottal source. The frequency atwhich the vocal folds vibrate gives the sound its pitch and it is called the fundamental fre-
quency or f0. The fundamental frequency differs among individuals and it is within therange of 85−150 Hz for a male, 165−255 Hz for a female and 250−300 Hz for a child.
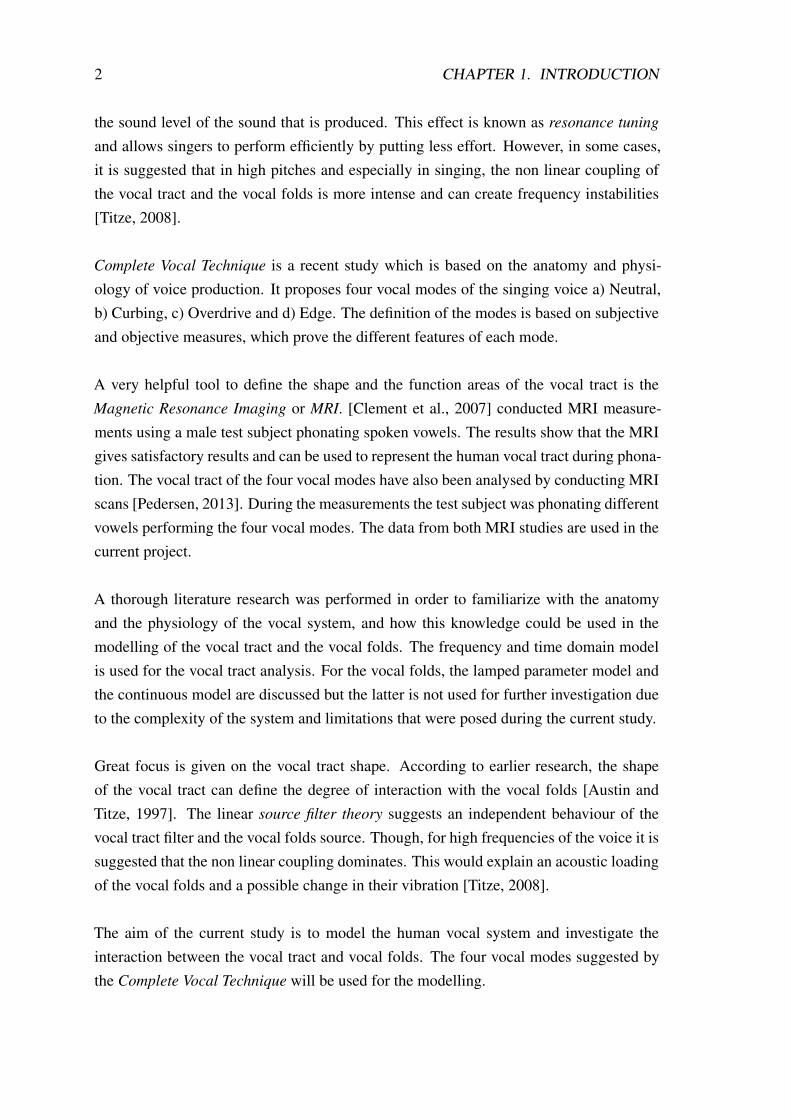
The sound wave which is produced by the vocal folds is modified by the structures ofthe vocal tract. The vocal tract includes the throat, the nasal and mouth cavities. Withthe help of the pharynx, the soft palate, the lips, the jaw and the tongue the sound obtainsits characteristic sound colour (or timbre) and by changing the position of each one ofthese structures, different vowels can be produced. When the vocal tract shape restrictsor blocks the air, then the consonants are produced [Plack, 2005]. The consonants canbe either voiced (the vocal folds vibrate) or unvoiced (the vocal folds do not vibrate). Ablock diagram of this procedure is depicted in Fig. 2.2.
2.1. THE HUMAN VOCAL SYSTEM 7
Figure 2.2: Speech production mechanism diagram [Fakotakis, 2005].
As mentioned above, the frequency at which the vocal folds vibrate is the fundamentalfrequency. However, the vocal signal is a complex signal which contains many simplesound waves which present a series of harmonics in the spectrum of the vocal signal.The harmonics are integer multiples of the fundamental frequency. For some frequencies,there are broad peaks in the spectra. These peaks are called formants and they result fromthe resonances of the vocal tract, see Fig. 2.7.
The larynx or the voice box contains the vocal folds and is composed by cartilages struc-tured together, by ligaments and intrinsic (inside the larynx) and extrinsic (outside thelarynx) muscles. At the upper part, the larynx is in direct continuity with the throat,hanging from the root of the tongue, which explains why its position is affected by themovements of the tongue. At the lower part, it lies on the top of the trachea, which con-tinues to the lower respiratory tract. A frontal section of the larynx can be seen in Fig.2.3.

8 CHAPTER 2. VOICE PRODUCTION
Figure 2.3: Frontal view of the larynx [Wikipedia, 2015].
The larynx contains nine cartilages, three single and three paired (Fig. 2.4). The largestlaryngeal cartilage is the thyroid cartilage positioned in front of the vocal folds and servesto protect the larynx. Inferior the thyroid cartilage sits the cricoid cartilage which formsthe back neck of the larynx(lamina). Along the upper edge of the cricoid lamina thearytenoid cartilages lie. They are small pyramid shaped paired cartilages and they arepart of the larynx where the vocal folds are attached. They regulate the movement of thevocalis muscles which are responsible for the adduction and abduction of the vocal folds.Above the arytenoid cartilages, the corniculate cartilages are located and reinforce thearytenoids function. The cuneiform cartilages are paired cartilages which add support tothe soft tissue. The epiglottis cartilage is attached to the back of the thyroid cartilage atthe angle just below the superior thyroid notch and above the vocal folds. Its main role isto close the larynx during the swallowing process [GetBodySmart.com, 2015].
Figure 2.4: Lateral view of the cartilages of the larynx [StudyBlue.com, 2015].
The role of the cartilages is to hold together and support the six small intrinsic laryngealmuscles while the role of the intrinsic muscles is to control the tension and orientation ofthe ligaments that produce the voice [GetBodySmart.com, 2015]. More concretely, the

2.1. THE HUMAN VOCAL SYSTEM 9
transversed arytenoid, the lateral cricoarytenoid and the posterior cricoarytenoid mus-cles help to bring the vocal folds together (adduction) and move them apart (abduction).The vocalis, the thyroatenoids and the cricothyroids change the tension of the vocal foldsand consequently their length. Outside the larynx, there is a number of extrinsic muscleswhich support the larynx and raise or lower it within the trachea.
The vocal folds or vocal cords (true vocal folds) are two paired ligaments lined by amoveable mucous membrane and are controlled by muscles and arytenoid cartilages. Ineach vocal fold a vocal ligament is fixed in and when they vibrate they produce voicedsounds [Sadolin, 2012]. The vocal folds are multi layered structures. They consist of adeep layer, an intermediate and a superficial layer. The surface of the vocal folds is cov-ered by a membranous tissue, the epithelium. The maximum length of the vocal folds isabout 16mm for a male adult and 10mm for a female adult. The inner most dense partof the vocal folds is the thyroarytenoid muscle or vocalis. Above the vocal folds thereare vestibular or false vocal folds. Each false vocal fold has a mucous ligament and asupportive vestibular ligament. An illustration of the multi layered structure of the vocalfolds can be seen in Fig. 2.5.
Figure 2.5: Frontal view of the vocal fold layers [Pedersen, 2013].
2.1.1 Vocal fold vibration
The vocal fold vibration is a sequence of multiple vibratory cycles. The vocal folds movedue to the larynx muscles, the nerves and the cartilages. In order to understand how voiceis produced, a single vibration of the vocal folds is described below in accordance withFig. 2.6.
Glottal cycleEarly studies explained the vocal fold vibration using the myoelastic aerodynamic the-
ory. Specifically, due to aerodynamic forces, the air pressure below the closed vocal folds

10 CHAPTER 2. VOICE PRODUCTION
starts increasing. When this subglottal pressure overpowers the resistance of the vocalfolds, the vocal folds start to blow open. The air continues to flow upwards and finallyopens the top of the vocal folds. The elastic nature of the body makes the bottom of thevocal folds to start closing. This induces in decrease in pressure due to the Bernoulli
effect. The adduction of the vocal folds produces a pulse of air [NCVS.org, 2015]. Then,the cycle begins again.
Figure 2.6: Vibration pattern of the vocal folds [Selamtzis, 2011].
The Bernoulli principle which is described above and is responsible for the vocal foldoscillation is defined as follows:
P + 12
ρu2 = constant (2.1)
where P is the total pressure, ρ is the air density and u is the velocity. According to Eq.2.1, an increase in the fluid velocity reduces the pressure between the folds so as theirsum is constant. When the vocal folds are about to collide the pressure is very low. Asmentioned above, during phonation the pressure below the closed glottis is higher thanthe pressure above the glottis and consequently the vocal folds open and the air starts toflow. However, the elastic forces of the vocal folds will try to close them again with theaid of the aerodynamic forces. Though, there is a region in which the Bernoulli effect isnot present during the oscillation. This occurs when the flow separates from the boundary,which is at the glottal exit. At his case, the pressure and the volume velocity are constant.Thus, the jet effect is present [Pedersen, 2013].
2.1.2 Source filter theory
Speech production in humans is considered to stem from an interaction of a source of glot-tal flow, represented by the vocal folds, modulated by a filter which is represented as anacoustic resonator and is called the vocal tract. The acoustic characteristics of vowel andvoiced consonant production are described by this model and is referred to as the Source
filter theory. This theory has generally been described in literature [Fant, 1960] [Ishizaka
2.1. THE HUMAN VOCAL SYSTEM 11
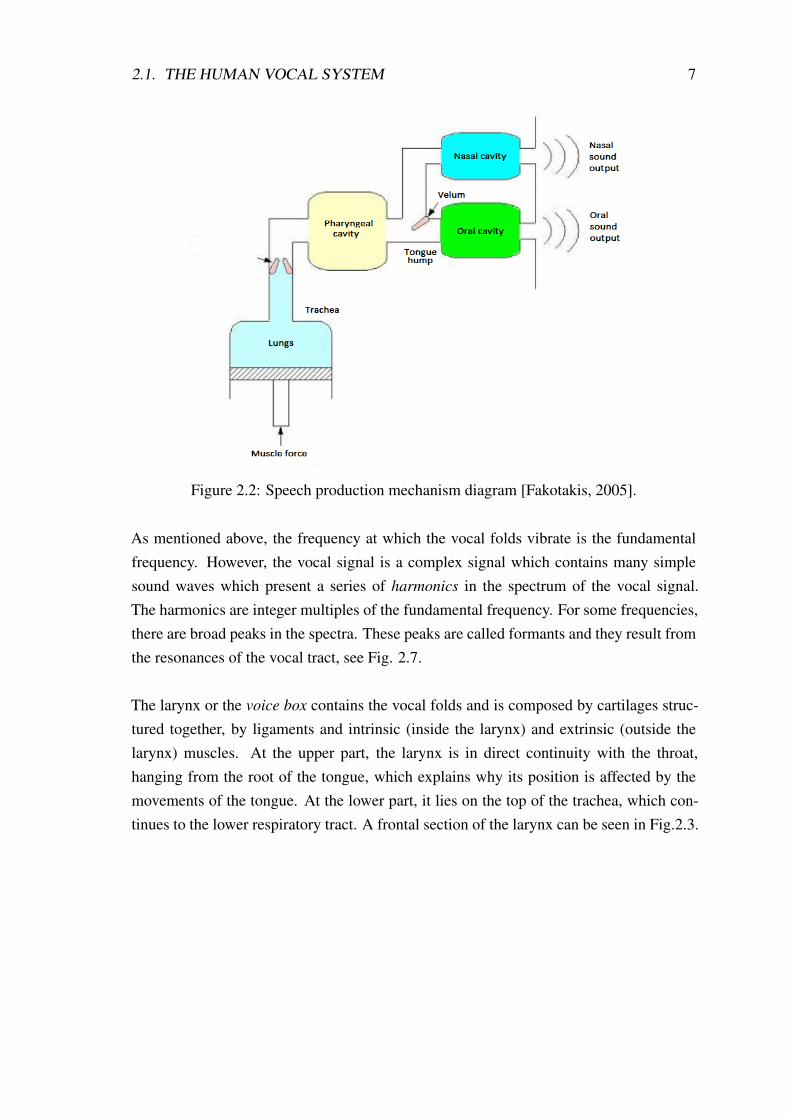
and Flanagan, 1972]. It is a linear source filter theory which assumes that the source ofsound is independent of the filter. Concretely, in frequency domain the linear source fil-ter interaction can be characterized by the multiplication of the Fourier transforms of thesource signal and the filter transfer function, while in the time domain this interaction canbe characterized by the convolution of the source and the impulse response of the filter[Titze, 2008]. The aforementioned source filter interaction is illustrated in Fig. 2.7.
Figure 2.7: Sound production in speech [Chang, 2012].
The linear source filter theory describes adequately many aspects of speech production butonly under specific conditions and simplifications. However, according to Titze [2008]the linear source filter theory describes better male speech rather than female or childspeech. In male speech the harmonics are well below the formants of the vocal tractwhich implies a weak interaction between the source and the filter. But regarding femalespeech or singing, the harmonics can have higher values than the formants. This impliesan intense interaction between the dynamics of the vocal folds vibration and the acousticenergy of the vocal tract. During this interaction, the acoustic airway pressure is respon-sible for the production of frequencies at the source. In extreme cases, the non-linearsource filter coupling can result in source instabilities and produce sudden jumps of thefundamental frequency, subharmonics generation or chaotic vocal fold vibration [Titzeand Worley, 2009] [Titze, 2008]. These results are attributed to the acoustic loading bythe vocal tract and is not taken into account by the linear source filter theory.
When singers change the length of the vocal tract by elevating or lowering the larynx theyconsequently adjust the resonances or formants of the vocal tract. According to [Henrichet al., 2011], if a harmonic of the vocal signal has a value close to a formant the strength ofthis harmonic will increase. Moreover, in high frequencies the reactive load of the vocaltract is higher, especially when the fundamental frequency is very close to a resonanceof the vocal tract [Titze, 1988] [Titze, 2008]. In particular, this formant and harmonic

12 CHAPTER 2. VOICE PRODUCTION
tuning helps the singers to sing in a very high level while putting little effort. In order toachieve the desirable resonance tuning there should be a proper combination between therange of the resonance and a harmonic [Henrich et al., 2011]. The way the singers tendto combine formants and harmonics depends on the singing style and it is suggested thatcertain vowels and singing styles fit better with certain pitches [Titze, 2008].
2.2 Complete Vocal Technique
Complete Vocal Technique or CVT is a singing method which aims to offer a good under-standing of voice production and to help singers to perform in a healthy way. Accordingto Sadolin [2012] the technique is based on three fundamental principles that every singershould adopt. These are:
• support: to learn how to use the diaphragm and the muscles of the body.
• necessary twang: the area below the vocal folds (epiglottic funnel) is narrowedwhile the arytenoid cartilages approach the lower part of epiglottis.
• avoid protruding the jaw and tightening the lips: in this way unwanted constric-tion is prevented and singers achieve an easy transition going from consonants tovowels.
The concept of the CVT is to divide the vocal sounds in groups according to howmetallic a sound is, independently of the musical style each singer has. In particular, fourvocal modes are suggested, see Table 2.1.
Table 2.1: The four modes and the amount of how metallic they are [Sadolin, 2012].
Name of mode Amount of metallic
Neutral non metallic
Curbing half metallic
Overdrive full metallic
Edge full metallic
The term metallic is a subjective measure and can be considered as a characteristic of ahigh pitch, bright, intense and direct sound. Further, the presence of metallic in a soundis usually combined with twang. Twang describes the moment when the the vocal tractbecomes very narrow in the epilaryngeal and pharyngeal area [Titze, 2002]. [Hanayamaet al., 2009] suggested that when singers perform a metallic sound they adjust their vocal
2.2. COMPLETE VOCAL TECHNIQUE 13
tract in a way that they raise the larynx, lower the velar and tighten the aryepiglottic fun-nel. Moreover, a significant shift of the second formant was observed in high frequenciesand the increase in the intensity of the sound is attributed to the increase of the amplitudeof the third and fourth formant [Hanayama et al., 2009].
NeutralNeutral is a non metallic mode and can be identified by soft notes with or without airadded. It can be performed by both males and females while singing all the vowels.The sound level of the neutral mode is, in general, low and quiet but it can be loud inhigh pitches i.e. above C2(65.4 Hz) for females and above C1(32.7 Hz) for males. Themethod of singing the mode in a correct way is to loose the jaw and keep the upper jawin front of the lower one.
The vocal tract shape in neutral is characterized by a wide epilarynx tube. When thevocal tract is wide, the degree of interaction of the vocal tract and the vocal folds is low.This can justify the wide frequency range of vowels that can be phonated by both malesand females Titze [2008] Pedersen [2013].
CurbingCurbing is the softest metallic mode and can be recognized by a holding in the breathbefore a note is sung. It reminds the sound of a moan or cry and it has a medium volume.It can be sung only for specific vowels including I (as in sit), UH (as in hungry) and O
(as in woman). As in neutral, curbing is eligible for both males and females to sing in thewhole frequency range.
The vocal tract in curbing shows a similar shape as in neutral but it is narrower. Fur-ther, according to electroglottograph recordings (EGG), the duration of the vocal foldadduction in curbing is the lowest compared to the other modes which implies the metal-lic and the tight collision of the vocal folds Pedersen [2013].
OverdriveOverdrive belongs to the metallic modes and is identified by its loudness and it resemblesa shout. In the high part of the voice the mode is restricted in two vowels, EH (as in stay)and OH (as in so). In particular, males can sing up to C2(65.4 Hz) and females up toD2(73.41 Hz). The basic method that is followed to phonate in overdrive is to use theso called "bite" technique which demands to drop the jaw while the mouth is in smilingposition, the lower jaw should be behind the upper one and the distance between the jawsis one finger length Sadolin [2012].

14 CHAPTER 2. VOICE PRODUCTION
In overdrive the vocal tract is very narrow which implies strong interaction between thevocal tract and the vocal folds. In [Titze and Worley, 2009] it is described that if the inputimpedance of the vocal tract is comparable to the impedance of the source then the energythat is stored in the vocal tract due to the reactance can reinforce the vocal fold vibrationthrough feedback (non-linear source filter interaction). This could explain the loudnessof the mode and the restriction in the vowel articulation.
EdgeEdge belongs to the full metallic modes. It is characterized by a high sound pressurelevel, reminds a scream, and it can be sang by both males and females in all frequenciesbut only in twanged vowels. Specifically, the vowels that can be articulated are I (as insit), EH (as in stay), A (as in and) and OE (as in herb).
As in overdrive, edge is characterized by a narrowed epilarynx tube which reinforcesthe acoustic loading of the source. Twang increases this interaction since it implies a nar-rowing of the epiglottic funnel and consequently a narrow vocal tract.
Even though the four vocal modes can be recognised subjectively, several studies includ-ing EGG and larynx endoscopy prove that there are significant differences among themodes. Electroglottography is a non invasive technique that permits the inspection of thevocal fold contact area during phonation [Henrich et al., 2004]. In order to conduct anEGG two electrodes are attached on the skin of the test subject on the thyroid cartilage ofthe larynx and a high frequency modulated current is applied [Henrich et al., 2004] [com-pletevocalinstitute.com, 2015]. The main parts of the EGG signal, as seen in Fig.2.8, arewhen the vocal folds a) start closing (gradual increase in amplitude), b) are fully adductedand no air passes through (maximum amplitude), c) start opening (gradual decrease inamplitude) and d) are fully abducted (flat signal).

2.2. COMPLETE VOCAL TECHNIQUE 15
Figure 2.8: Synchronised larynx stroboscopy with EGG [completevocalinstitute.com,2015].
Using the results of the EGG measurements the contact quotient Qx, which describes howlong the vocal folds remain adducted, can be estimated. Qx is calculated by measuringthe width of the waveform at a point 70% of the height from the peak of the waveform ofthe EGG signal divided by the period of the signal [completevocalinstitute.com, 2015].
Recently, the four modes are under discussion and especially the curbing mode. Betweenneutral and the two full metallic modes, overdrive and edge, two modes are introduced:half edge and half overdrive. Every sound that does not match with the aforementionedmodes is considered to be in the curbing area. Two other modes that have been identifiedthrough recordings and belong to the curbing area are medium edge and medium over-
drive.
In the current study the four modes (neutral, curbing, overdrive and edge) will be dis-cussed and analysed. In addition, the four modes will be compared with the half overdrive,half edge, medium overdrive and medium edge based on recordings from the CompleteVocal Institute.


CHAPTER 3Computational models
The focus of this chapter lies on the different concepts and techniques for modelling thevocal tract and the vocal folds.
For the vocal tract modelling, a frequency and a time domain model is discussed.The vocal tract consists of coupled tubes. The tubes have the same length but differ incross sectional area (see Fig. 3.1). Both models make use of the one-dimensional waveequation. In frequency domain, it is assumed that in each junction the output pressure andvelocity of the proceeding tube is the input pressure and velocity of the following tube. Intime domain, the wave reflection analog is implemented. The latter model makes use ofthe reflection coefficients at the junctions of the tubes in order to calculate the pressure orflow that is passes or is reflected at each junction at each time step [Story, 1995].
For the vocal folds modelling two methods are generally suggested. The lumped ele-ment model and the continuum model. The lumped parameter model represents the vocalfolds by using mechanical oscillators, springs and dampers. In this chapter, a two massmodel will be described. Even though the two mass model is a simple model, it givessatisfactory representation of the interaction between the airflow and tissue movement toproduce oscillation [Alipour et al., 2000]. However, for a more realistic realistic repre-sentation of the vocal folds continuum models have been developed. With the continuummodels, the modelling of the multi layered structure of the vocal folds is more realistic.For the solution of the equations of motion, the finite element method or other numericalanalysis is used. An introduction in the continuum model is presented at the end of thischapter. Due to time limitations, the model is not used for further analysis. The difficultyfor using the continuum model lies in the complexity of the model. For instance, detailedgeometrical data and the internal stress are needed to model the structure of the vocalfolds. Moreover, the vocal folds constitute of three layers and five parameters for eachof them are needed to be defined, as described in Section 3.2.2. These parameters areunknown and their values are based on assumptions that would lead in uncertainties.
17

18 CHAPTER 3. COMPUTATIONAL MODELS
3.1 The vocal tract
The vocal tract is an acoustical lossy non uniform tube. It is terminated by the lips andthe nose which give the vocal tract the favourable shape to produce sounds, e.g. vowelsand voiced consonants. The length of the vocal tract is approx. 17 cm.
Figure 3.1: Representation of the vocal tract constituting of coupled tubes [Story, 1995].
For the analysis, in the next section, two approximations are made. Firstly, it is assumedthat there is no bending at the back of the tongue and the vocal tract is simplified to atube with a straight axis [Story, 1995]. Therefore, the one dimensional wave equationcan be implemented [Flanagan et al., 2008]. However, the uniform tube configuration isunlikely for a human vocal tract because it demands the same width of both the larynxand the pharynx [Titze and Worley, 2009]. Second, it is considered that the largest crosssectional area of the vocal tract should be much smaller than a wavelength. This happensfor frequencies no higher than 5 kHz. The limiting frequency is given by the followingformula as mentioned in Flanagan et al. [2008]:
fc = 0.5861c
2α(3.1)
where c is the speed of sound and α is the radius of the cross sectional area [Story, 1995].
3.1.1 Frequency domain model of the vocal tract
A first approach of the vocal tract modelling was made by using the uniform tube as asimple vocal tract shape. A metric that describes the acoustic properties of a tube is the

3.1. THE VOCAL TRACT 19
acoustic impedance. The acoustic impedance is defined as the complex ratio of the soundpressure over the volume velocity. The input acoustic impedance of the vocal tract affectsboth the shaping of the glottal flow pulse and the vibrational pattern of the vocal folds[Story et al., 2000]. The real part of the acoustic impedance is the resistance while theimaginary part is the reactance. When the reactance is positive, the system behaves asa mass of air which is accelerated and decelerated. The acoustic loading of the lattersystem is characterized as inertive. When the reactance is negative, the behaviour of thesystem is springlike and the acoustic loading is characterised as compliant. For the caseof zero reactance the load is resistive. The inertive load indicates the acoustic energy thatis stored in the system as kinetic energy while the compliant load indicates the potentialenergy that is stored [Pedersen, 2013] [Titze, 1988].
(a) (b)
Figure 3.2: Input acoustic impedance of a uniform tube (a) Reactance and resistance (b)Magnitude.
In Fig. 3.2 the input acoustic impedance of a uniform tube is illustrated. The length ofthe tube is 17.6 cm and the cross sectional area S = 50 cm2.
In Flanagan et al. [2008] it is mentioned that the radiation on a piston in a sphericalbaffle is a function of frequency and the relative size of the piston and the sphere. Whenthe radius of the piston becomes smaller than that of the sphere the radiation can be ap-proximated as the radiation of a piston in an infinite baffle. The radiation impedance of apiston mounted in an infinite baffle is given by the following formula [Jacbosen, 2011]:
Zr = ρc
S
[(1 − J1(2kα)
kα
)+(
K1(2kα
2(kα)2
)](3.2)
where ρ is the density of air, S is the cross sectional area of the tube, k is the wavenumber,α is the radius of the piston, J1(x) is the first order Bessel function and K1(x) is a related

20 CHAPTER 3. COMPUTATIONAL MODELS
Bessel function [Flanagan et al., 2008]. For small values of kα, i.e. kα < 0.5, Eq.3.2 canbe approximated as:
Zr = ρc
S
(12
(kα)2 + j8
3πkα)
(3.3)
where k is the wavenumber and α is the radius of the cross sectional area at the end of thetube.
As seen in Fig. 3.2 the impedance is inertive (positive) till the first resonance. Afterthe first resonance the load becomes compliant (negative).
In order to understand how the shape of the vocal tract influences the formants, a sim-ulation of three different shapes of the vocal tract was conducted. The first shape (Fig.3.3) is a uniform tube with a cross sectional area of 4 cm2. For the second (Fig. 3.4) andthe third shape (Fig. 3.5) a two tube vocal tract was used representing an idealized shapeof the vowels /a/ and /i/ respectively. The cross sectional areas of the small and the bigtube are 0.5 cm2 and 3 cm2 respectively. For all the three configurations a zero radiationimpedance at the end of the tube was considered. As it can be seen from the graphs, the
Figure 3.3: Vocal tract shape and magnitude of the acoustic input impedance of the uni-form tube.
uniform tube, closed at one end, presents resonances at odd multiples of the quarter of thewavelength. This can be written as follows:
fres = (2k + 1) c
4l, k=0,1,2,... (3.4)
where c = 343 m/s is the speed of sound and l = 17 cm is the length of the tube. Thefirst four vocal tract resonances are at 504.4 Hz, 1513 Hz, 2522 Hz, 3530 Hz. When the

3.1. THE VOCAL TRACT 21
Figure 3.4: Idealized vocal tract shape and magnitude of the acoustic input impedance forthe vowel /i/.
Figure 3.5: Idealized vocal tract shape and magnitude of the acoustic input impedance forthe vowel /a/.

22 CHAPTER 3. COMPUTATIONAL MODELS
front tube is constricted (Fig. 3.4) the first and third formant move downward and thesecond and fourth upward. When the back tube is constricted (Fig. 3.5) the first and thethird formant move upward while the second and the fourth move downward.
Fig. 3.4 and Fig. 3.5 represent systems of coupled tubes. At low frequencies, the soundfield of each component can be considered one dimensional. Thus, at each junction theoutput sound pressure and volume velocity of the preceding component equals the in-put sound pressure and volume velocity of the following component. Consequently, in atwo tube system the input acoustic impedance of the first tube is the acoustic load of thesecond tube. Let us assume a n tubes vocal tract. According to Jacbosen [2011], sucha system can be described by its transmission matrix giving a relationship between thepressure and volume velocity at the first tube (input) and the sound pressure and volumevelocity of the nth tube (output). This system is described by the following formula:Pin
Uin
=
A B
C D
Pout
Uout
(3.5)
where Pin, Pout, Uin, Uout are the input and output pressures and volume velocities re-spectively. The transmission matrix is obtained by the multiplication of n transmissionmatrices calculated for every tube:A B
C D
=
A1 B1
C1 D1
A2 B2
C2 D2
...
An Bn
Cn Dn
(3.6)
The parameters An, Bn, Cn, Dn for each of the n tubes are defined as:
An = cos(kln) Bn = jρc
Sn
sin(kln)
Cn = jSn
ρcsin(kln) Dn = cos(kln)
(3.7)
The input acoustic impedance is defined as the ratio of the input sound pressure of theinput volume velocity. Using the transmission line parameters the input impedance of thetube is given by the following formula:
Zin = AZrad + B
CZrad + D(3.8)
where Zrad is the radiation impedance at the end of the nth. It can be written as:
Zrad = jωRL
R + jωL(3.9)
where
R = 128Zmouth
9π2 , L =8√
Smouth
πZmouth
3πc(3.10)
and Zmouth = ρc
Smouth
is the characteristic impedance of the last tube of the vocal tract
which represents the mouth, with a cross sectional area Smouth.

3.1. THE VOCAL TRACT 23
3.1.2 Time domain: Wave reflection model
In the time domain, the wave reflection model is implemented which is described by Story[1995]. The vocal tract model is considered to be a sequence of n coupled tubes. In thecurrent study the number of the coupled tubes was n = 44. It is assumed that the timeneeded for the sound wave to propagate exactly the distance from one tube to the nextone is one time step as seen in Fig. 3.6 (adapted from [Pedersen, 2013]).
Figure 3.6: Wave propagation in the vocal tract [Pedersen, 2013].
For each time step, the reflection coefficient and the scattering is calculated at every junc-tion. For the simple case of a two tube junction, and according to the solution of the onedimensional wave equation, the pressure and volume velocity of a tube can be consideredas a forward going and backward going wave system (Fig. 3.7).
Figure 3.7: Two tube junction (left) and space time diagram of partial waves (right) [Lil-jencrants, 1985].
In fig. 3.7, S1 and S2 are the cross sectional areas of the two tubes. F1 and F2 represent theforward wave and, B1 and B2 the reflected (backward) wave. At every junction the totalpressure is the sum of the forward and the reflected pressure. The total volume velocityis the difference of the forward and backward volume velocities, u+
n and u−n respectively.

24 CHAPTER 3. COMPUTATIONAL MODELS
The total pressure and the total volume velocity can be written as follows:
Pn = Fn + Bn (3.11)
Un = u+n − u−
n (3.12)
But, the characteristic impedance of a tube is the ratio of the total pressure over the totalvolume velocity. Thus, the volume velocity at the nth section of the tube can be definedas the ratio of the difference of the partial pressures over the characteristic impedanceZn = ρc
Sn
of the respective tube. Eq. 3.12 becomes:
Un = 1Zn
(Fn − Bn) (3.13)
The wave reflection model uses the reflection coefficients in order to to calculate the wavepropagation in each junction. The reflection coefficients are calculated by solving theone dimensional wave equation. At the junction of two consecutive tubes the reflectioncoefficients for each pressure wave (forward and reflected) are defined as:
rn,1 = Sn − Sn+1
Sn + Sn+1(3.14)
rn,2 = Sn+1 − Sn
Sn + Sn+1(3.15)
where Sn is the cross sectional area of the nth tube. Let us assume that the pressures andvelocities in the junctions are continuous. This can be written as follows:
Fn + Bn = Fn+1 + Bn+1 (3.16)
Fn − Bn
Sn
= Fn+1 − Bn+1
Sn+1(3.17)
After solving the system of Eq. 3.16 and Eq. 3.17, the forward pressure Fn+1 and thereflected pressures Bn are given by the following scattering equations:
Bn = Fn · rn + Bn+1 · (1 + rn,2) (3.18)
Fn+1 = Fn · (1 + rn,1) + Bn+1 · rn,2 (3.19)
In Eq. 3.18 and 3.19 the pressures Bn and Fn+1 are calculated using the pressures cal-culated one time step before. For a better understanding of the time step and the wavepropagation in the coupled tubes, part of the Matlab code used for the simulations is ap-posed in Appendix A. The propagation of Fn and Bn is due to an excitation pulse at the

3.1. THE VOCAL TRACT 25
first section of the vocal tract [Pedersen, 2013]. This pulse represents the flow throughthe glottis and is defined as follows
F1 = Uρc
S1(3.20)
The radiation impedance at the end of the the vocal tract, as explained in the frequencydomain, is given by Eq.3.3 which is the radiation impedance of the mouth. The reflectioncoefficient at the mouth can be written as:
rmouth = Zrad − Zmouth
Zrad + Zmouth
(3.21)
Though, in order to use the radiation impedance Zrad in Eg.3.9 the term jω (see Eq.3.9)should be replaced and be brought into the time domain. This is achieved by implement-ing the mathematical transformation (bilinear transform) described in Story [1995]:
jω = 2(1 − z−1)T (1 + z−1)
(3.22)
where T is the sample interval and z−1 is a sample delay. By substituting the afore-mentioned transformation in Eq.3.21, the radiation impedance is calculated in the timedomain. This radiation impedance is used for the calculation of the reflection coefficientat the mouth. The scattering equations are calculated according to Story [1995].
In Fig. 3.8 the results from the simulations using the frequency domain model and thewave reflection model are illustrated.

26 CHAPTER 3. COMPUTATIONAL MODELS
Figure 3.8: Wave reflection model and frequency domain model.
The frequency domain input acoustic impedance results from the calculation of the fastFourier transform of the logarithmic amplitude of the input acoustic impedance of thewave reflection model. According to Fig. 3.8 this is verified and suggests the properfunction of both models.
3.2 The vocal folds
This section is devoted to the vocal fold modelling. In Section 3.2.1, the lumped param-eter model is discussed in detail. The vocal folds are represented as mechanical oscil-lators based on a combination of suggested theoretical models [Ishizaka and Flanagan,1972][Steinecke and Herzel, 1995][Birkholz et al., 2011]. The theoretical backgroundof the continuous model is discussed in Section 3.2.2 and is based on the finite elementmodel developed by Alipour et al. [2000].
3.2.1 Lumped parameter model
The simplified two mass model studied in this project consists of two coupled mechanicaloscillators of masses m1 and m2 which approximate the vocal folds. The masses are

3.2. THE VOCAL FOLDS 27
placed vertically above one another [Steinecke and Herzel, 1995] [Titze, 1976]. Theelastic properties of the vocal folds are represented by the springs k1 and k2, and by thedampers r1 and r2. The displacements x1 and x2 are the time-varying positions of themasses and represent the tissue deformations. An illustration of the system can be seenin Fig. 3.9.
Figure 3.9: Two mass model of the vocal folds (Assaneo, 2013).
The main principle of the model is the phase difference between the upper and the lowerpart of the vocal folds. In order to produce oscillation the surface wave propagation in themucosa must be from bottom to top. Thus, in the two mass system the bottom mass mustalways lead the top mass in phase [Titze, 1988].
The assumptions that were considered during the modelling include a symmetric versionof the model, absence of non linear properties of the tissues and independence betweenthe vocal fold vibration and the vocal tract resonances. The vocal fold vibration is flowinduced [Steinecke and Herzel, 1995][Titze, 1988].
The equations of motion for each of the two masses are described as follows (adoptedfrom Steinecke and Herzel [1995]):
Fe1 = m1x1 + r1x1 + kx1 + kc ((x1 − x1,rest) − (x2 − x2,rest)) + F1col (3.23)
Fe2 = m2x2 + r1x2 + kx2 − kc ((x1 − x1,rest) − (x2 − x2,rest)) + F2col (3.24)
where Fe1 and Fe2 are aerodynamic forces. F1col and F2col are forces that model thecollision of the vocal folds and are defined as:
F1col = Θ(−α1)c1
(α1
2lg
)(3.25)

28 CHAPTER 3. COMPUTATIONAL MODELS
F2col = Θ(−α2)c2
(α2
2lg
)(3.26)
where α1 and α2 represent the lower and upper glottal areas and lg is the length of theglottis. Θ(x) is a function that models the activation of the collision of the masses.
Θ(x) =
1, if x > 0
0, if x ≤ 0(3.27)
The opening of the glottal areas between the lower and the upper masses are described as:
α1 = 2lg(x1 + x1,rest)
α2 = 2lg(x2 + x2,rest)(3.28)
The variables and the parameters that were used in the model were adopted from Stei-necke and Herzel [1995], Birkholz et al. [2011] and Pedersen [2013]. They are presentedin Table 3.1.
Table 3.1: Description and values of the variables used in the two mass model (adaptedfrom [Pedersen, 2013].
Variable Description Value Unit
m1 mass 1 0.125 g
m2 mass 2 0.025 g
r1 damping constant 1 0.02 Ns/m
r2 damping constant 2 0.02 Ns/m
k1 spring constant 1 80 N/m
k2 spring constant 2 8 N/m
kc coupling constant 25 N/m
d1 thickness 1 2.5 mm
d2 thickness 2 0.5 mm
c1 collision spring constant 1 3k1 N/m
c2 collision spring constant 2 3k1 N/m
The equations of motion mentioned above are connected to the aerodynamic forces throughthe glottal area [Story, 1995]. The oscillation of the system occurs due to the intraglot-tal pressure on the upper and the lower mass. The intraglottal pressure depends on theopening area of the glottis. According to Story [1995], the flow is diverging when thereis minimum glottal area. The Bernoulli flow is present only below the narrowest part ofthe glottis [Steinecke and Herzel, 1995]. Above this part, the jet flow is formed and a

3.2. THE VOCAL FOLDS 29
constant pressure is assumed. During the jet, the pressure is constant and is defined asfollows:
P = Pi (3.29)
where Pi is the supraglottal pressure. The upper mass is always subjected to Pi. Whenthe Bernoulli effect is present, the pressure is given by the following equation:
P = Ps
(1 − Θ(amin)
(amin
a1
)2)
Θ(a1) (3.30)
The lower mass is subjected to the above mentioned pressure and Ps is the subglottalpressure. The volume velocity is defined as:
U =√
2Ps
ρaminΘ(amin) (3.31)
where amin is the minimum area between the two masses. Additional forces Fe1 and Fe2
are acting on the two masses. These are aerodynamic forces which act in the intraglottalarea. They are given by the following formulas:
Fe1 = ld1P1 (3.32)
Fe2 = ld2P2 (3.33)
where P1 and P1 are the pressures exerted at the lower and upper mass respectively, l islength of the vocal folds, d1 and d2 the thickness of the mass 1 and mass 2 respectively.
Vocal tract and vocal folds coupling
The coupling of the glottal flow and the wave propagation in the vocal tract is describedby Titze [1984]. Two travelling waves act upon the glottis, one subglottal, with pressurePs and one supraglottal with pressure Pi. The aforementioned pressures are obtainedfrom calculations, using the wave reflection model of the vocal tract. Flow continuityis assumed between the subglottal and supraglottal areas, As and Ae respectively. Thesource filter interaction is presented using the following formula
ug = agc
kt
− ag
A∗ ±[(
ag
A∗
)2+ 4kt
pc2 ∗ (rsPs − rePi
] 12 (3.34)
Eq.3.34 is the analytical solution for the glottal flow where ug is the glottal flow, ag isthe time varying glottal area, c is the speed of sound and kt is a transglottal pressurecoefficient for modified Bernoulli flow through the glottis [Titze, 1984][Titze, 2008]. A∗
is an effective vocal tract area defined as
A∗ = As · Ae
As + Ae
(3.35)

30 CHAPTER 3. COMPUTATIONAL MODELS
The reflection coefficients rs and re are given by the following forms:
rs = As − ag
As + ag
(3.36)
re = Ae − ag
Ae + ag
(3.37)
3.2.2 Continuum model
The two mass model discussed in the previous section is a simple representation of thevocal folds but gives a good understanding of the mechanics of the vocal folds oscillation.Lumped element models with more masses (i.e. [Story and Titze, 1995]) have been pro-posed in order to simulate the vocal folds movement in a more realistic way. However,these models had a limitation in the degrees of freedom and could not suggest a detailedmovement of the vocal folds [Ikeda et al., 2001]. According to Alipour et al. [2000] themulti mass lumped element models cannot represent the geometry and the viscoelastic be-haviour of the vocal folds sufficiently. Therefore, continuum models were suggested anddeveloped, e.g. [Alipour et al., 2000]. The continuum model includes detailed geometri-cal data and a multilayer vocal folds structure. In Titze and Talkin [1979] a geometricalmodel of the vocal folds which illustrates the layers of the vocal folds structure is sug-gested (Fig. 3.10).

3.2. THE VOCAL FOLDS 31
Figure 3.10: Illustration of the vocal folds using the continuum model [Titze and Talkin,1979].
In Fig. 3.10 the dotted lines are used to separate the tissue compartments. The areas with-out dots represent the mucosal tissue, the densely dotted area represents the properties ofthe ligaments and the sparsely dotted area represents the muscular tissue.L is the glottallength, D the depth of the vocal folds and T is the thickness of the vocal folds [Titze andTalkin, 1979].
In order to solve the equations of motion the finite element method is used. Four mainassumptions were followed. These are [Titze and Alipour, 2006][Alipour et al., 2000]:
• during vocal folds vibration small deformations occur. Linear elasticity relationsare considered.
• single plane vibration is studied.
• the multilayer vocal folds structure is transversely istropic.
A force which is exerted on an area of the body is called stress. All the forces that areapplied on the body are represented by the Cauchy’s stress tensor σ. For small displace-ments, a constitutive equation for six strain and six stress components can be defined as:
32 CHAPTER 3. COMPUTATIONAL MODELS
σx
σy
σz
σxy
σyz
σzx
= [S]
ϵx
ϵy
ϵz
ϵxy
ϵyz
ϵzx
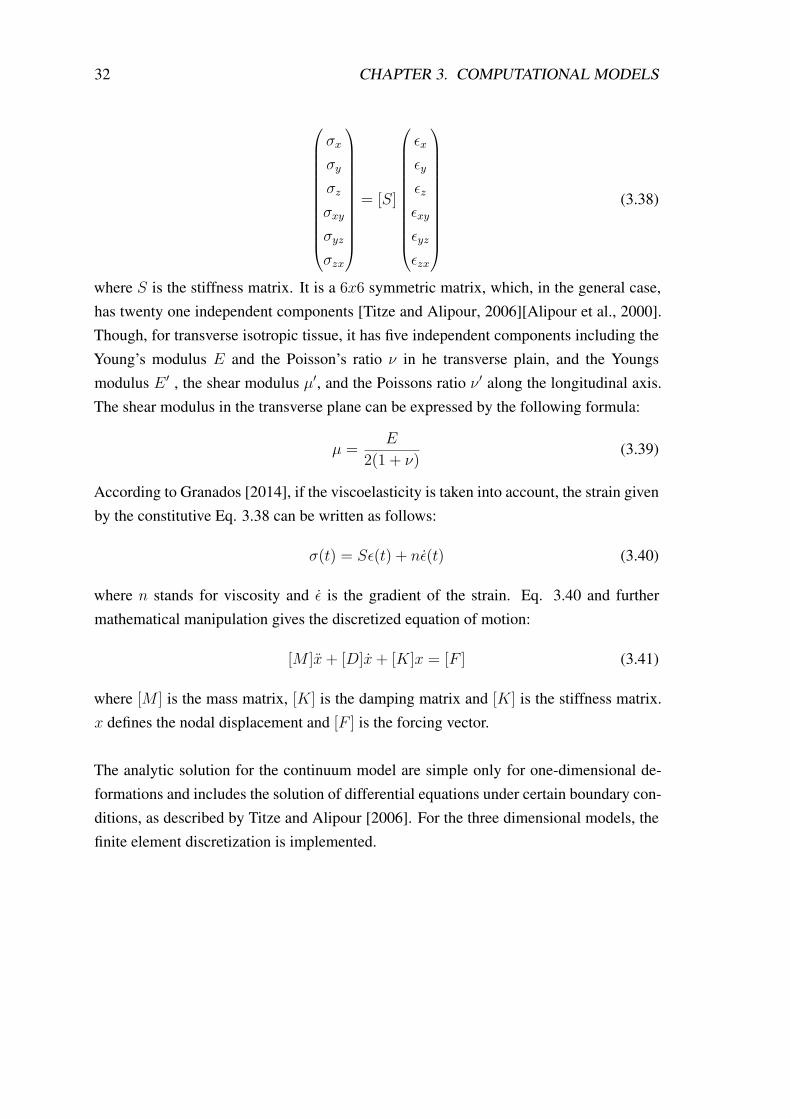
(3.38)
where S is the stiffness matrix. It is a 6x6 symmetric matrix, which, in the general case,has twenty one independent components [Titze and Alipour, 2006][Alipour et al., 2000].Though, for transverse isotropic tissue, it has five independent components including theYoung’s modulus E and the Poisson’s ratio ν in he transverse plain, and the Youngsmodulus E ′ , the shear modulus µ′, and the Poissons ratio ν ′ along the longitudinal axis.The shear modulus in the transverse plane can be expressed by the following formula:
µ = E
2(1 + ν)(3.39)
According to Granados [2014], if the viscoelasticity is taken into account, the strain givenby the constitutive Eq. 3.38 can be written as follows:
σ(t) = Sϵ(t) + nϵ(t) (3.40)
where n stands for viscosity and ϵ is the gradient of the strain. Eq. 3.40 and furthermathematical manipulation gives the discretized equation of motion:
[M ]x + [D]x + [K]x = [F ] (3.41)
where [M ] is the mass matrix, [K] is the damping matrix and [K] is the stiffness matrix.x defines the nodal displacement and [F ] is the forcing vector.
The analytic solution for the continuum model are simple only for one-dimensional de-formations and includes the solution of differential equations under certain boundary con-ditions, as described by Titze and Alipour [2006]. For the three dimensional models, thefinite element discretization is implemented.

3.3. SUMMARY 33
3.3 Summary
In this chapter, the acoustic characteristics of a tube were discussed by defining the inputimpedance and the resonances in the vocal tract. The vocal tract was presented as asequence of coupled tubes which differ in cross sectional area. The frequency domainand the time domain model were discussed. In the time domain model, the vocal tractconsists of 44 segments and the length of each segment is 0.3968 cm. The latter modelwas selected to be used for the coupling, because it is easier to couple with the vocal foldsmodel. A two mass model was suggested for the vocal folds and this will be used for thesimulations. A short description of the continuum model was also presented. The modelincludes many unknown parameters that should be defined based on assumptions whichcould lead to uncertainties. Therefore, including the time restriction, the model was notfurther analysed.


CHAPTER 4Geometry of the vocal tract
The vocal tract can be approximated as an acoustical tube constituting of multiple cou-pled segments that differ in cross sectional area. Depending on which vowel is phonated,the vocal tract has a different shape. However, the shape of the vocal tract can differeven if the same vowel is phonated. This suggests that different vocal tract shapes canproduce the same acoustic resonance structure [Story, 1995]. Detailed geometrical dataare necessary for modelling purposes. More realistic vocal tract shapes can produce aproper distribution of the acoustic pressure across the vocal tract and lead to more realis-tic formant transitions that approach human speech. For this purpose, many studies usedMagnetic Resonance Imaging or MRI to obtain detailed geometrical data. MRI is a noninvasive and non harmful technique that offers image acquisition [Clement et al., 2007].Though, there are some disadvantages including that the subject should be in a supineposition, the teeth do not appear and the acquisition times are slow. All these can alter thevowel production.
In this chapter, MRI data from Clement et al. [2007] will be used in order to obtainvocal tract shapes and resonances for three spoken vowels. Further, geometrical data ob-tained from Pedersen [2013] while phonating the four vocal modes will be used to obtainthe vocal tract shapes and the resonances for three sung vowels. All the modes wherephonated in the same pitch, 261 Hz. Moreover, recorded data will be used to investigatethe harmonics and the formants of the modes.
4.1 Simulations using spoken vowels
The vocal tract shape for three different spoken vowels will be discussed in this section.The geometrical data were obtained from Clement et al. [2007] after conducting MRIscans on a male test subject. The vowels which were phonated were /i/, /a/ and /u/.
35
36 CHAPTER 4. GEOMETRY OF THE VOCAL TRACT
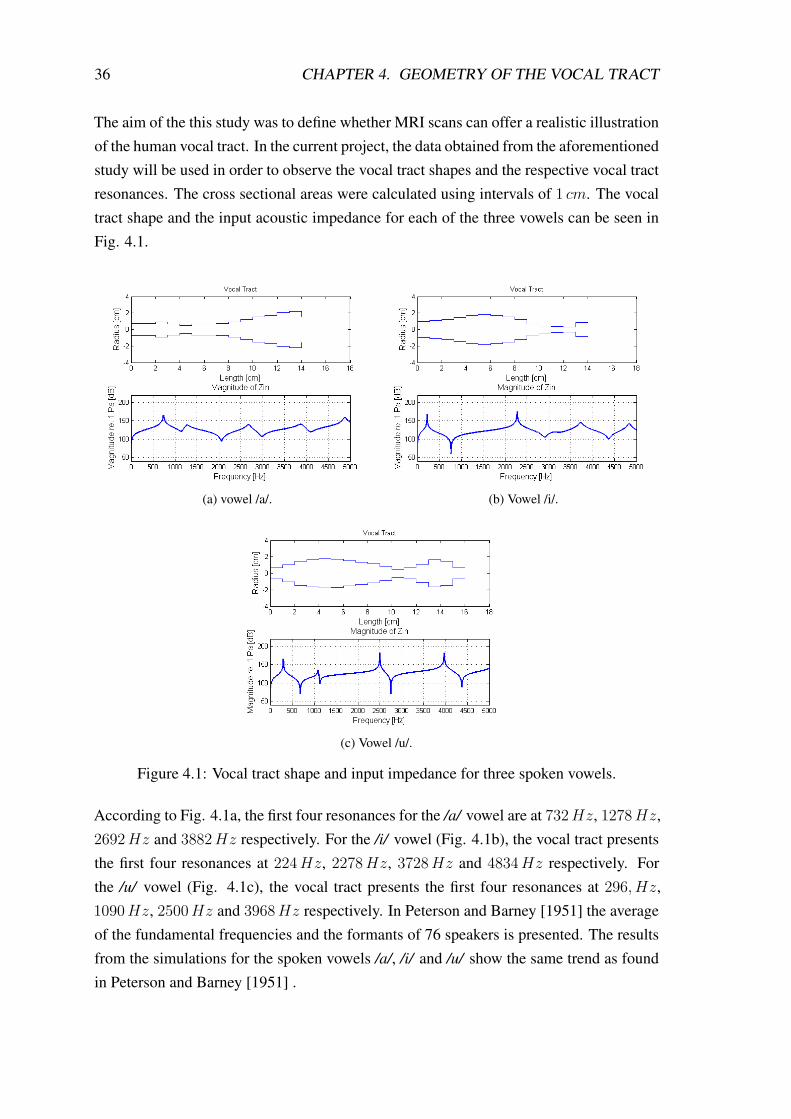
The aim of the this study was to define whether MRI scans can offer a realistic illustrationof the human vocal tract. In the current project, the data obtained from the aforementionedstudy will be used in order to observe the vocal tract shapes and the respective vocal tractresonances. The cross sectional areas were calculated using intervals of 1 cm. The vocaltract shape and the input acoustic impedance for each of the three vowels can be seen inFig. 4.1.
(a) vowel /a/. (b) Vowel /i/.
(c) Vowel /u/.
Figure 4.1: Vocal tract shape and input impedance for three spoken vowels.
According to Fig. 4.1a, the first four resonances for the /a/ vowel are at 732 Hz, 1278 Hz,2692 Hz and 3882 Hz respectively. For the /i/ vowel (Fig. 4.1b), the vocal tract presentsthe first four resonances at 224 Hz, 2278 Hz, 3728 Hz and 4834 Hz respectively. Forthe /u/ vowel (Fig. 4.1c), the vocal tract presents the first four resonances at 296, Hz,1090 Hz, 2500 Hz and 3968 Hz respectively. In Peterson and Barney [1951] the averageof the fundamental frequencies and the formants of 76 speakers is presented. The resultsfrom the simulations for the spoken vowels /a/, /i/ and /u/ show the same trend as foundin Peterson and Barney [1951] .

4.1. SIMULATIONS USING SPOKEN VOWELS 37
In order to study how the vocal tract resonances behave, the /u/ vowel configuration wasselected and compared with the uniform tube configuration. In Fig. 4.2, the vocal tractshapes and the respective resonances of the uniform tube and the /u/ vowel are presented.
Figure 4.2: Comparison of the vocal tract resonances of the uniform and /u/ vowel.
In Section 3.1.1, it was discussed how a change in the vocal tract shape affects the res-onances of the system. A widening of the back part of the /u/ vowel configuration willsuggest a shift in the frequencies, meaning a decrease in the first and the third resonances,and a rise in the second and the fourth resonances. This trend can be observed in Fig.4.1c. The cross sectional area of the uniform tube defines the shift in the resonances. Thesimulation was repeated for different cross sectional areas of the uniform tube. In allcases the first and the second formant were shifted downwards and upwards respectively.However, the configuration in Fig. 4.2, gave the expected result for all the formants.

38 CHAPTER 4. GEOMETRY OF THE VOCAL TRACT
4.2 Simulations using the vocal modes
The role of the vocal tract is to filter the signal produced from the vocal folds. The degreeof interaction between the vocal tract and the vocal folds is of great significance, becauseit gives the modes their characteristics. However, the vocal tract shape is important inorder to phonate the desirable vowel.
The vocal tract data used in this section were extracted form MRI scans conducted byPedersen [2013]. During the recordings, a trained singer phonated the four modes. Thepitch was the same for the four modes at 261 Hz. The vocal tract shapes and the inputacoustic impedance were calculated for each mode and for a certain vowel. The resultsare presented in Fig. 4.3.
(a) Neutral (b) Curbing
(c) Overdrive (d) Edge
Figure 4.3: Vocal tract shape for a) neutral, b) curbing, c) overdrive and d) edge.
The vowels which were phonated during the MRI were /i/ for neutral, /o/ for curbingand /e/ for both overdrive and edge. It is assumed that the length of the vocal tract is17, 46 cm. Thus, the acquired MRI data were processed and the vocal tract of each vowelconsists of 44 segments. Each segment has a length of 0, 3968 cm.
In Fig. 4.3, the different vocal tract shapes are attributed not only to the different modebut also, to the different vowel. Though, every mode has a different epilarynx tube shape.Furthermore, it can be observed that neutral and curbing show a narrowing at approxi-mately 9 cm and 11 cm respectively. In addition, edge shows a narrowed tube nearly atthe same vocal tract length as neutral and edge. Curbing has the most exquisite narrowing

4.2. SIMULATIONS USING THE VOCAL MODES 39
of all. According to Pedersen [2013], the narrowing occurs at the back of the tongue. Inoverdrive there is no narrowing. It can also be suggested, that a different phonated vowelcould show a less narrowed vocal tract for the neutral mode. The respective vocal tractresonances of each of the aforementioned vocal tract configurations can be seen in Fig.4.4.
Figure 4.4: Vocal tract resonances of the four vocal modes.
For the overdrive and the edge mode, the same vowel was phonated. This would suggestthat the resonant frequencies should have the same values. However, this is not the casefor two different modes. Concretely, in Fig. 4.4, it can be observed that for overdriveand edge the first resonance has nearly the same value. Even though the phonated vowelwas the same for both overdrive and edge, the different vocal tract configuration shiftsthe higher formants of edge to higher values. The same trend was observed in [Selamtzis,2011]. In the latter study, the same vowel was phonated while performing the four modes.The results showed different resonant frequencies for each one of the vocal modes. Thisverifies that the vocal tract shape is altered while the singer phonates the two differentmodes.
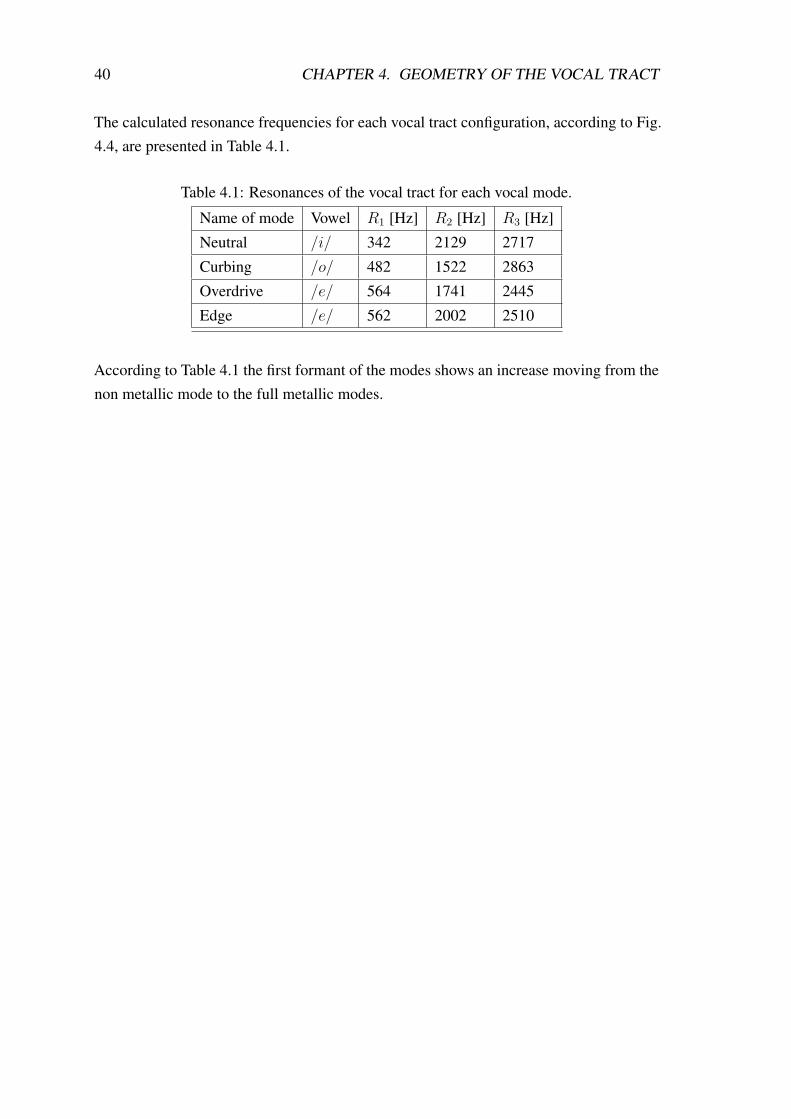
40 CHAPTER 4. GEOMETRY OF THE VOCAL TRACT
The calculated resonance frequencies for each vocal tract configuration, according to Fig.4.4, are presented in Table 4.1.
Table 4.1: Resonances of the vocal tract for each vocal mode.
Name of mode Vowel R1 [Hz] R2 [Hz] R3 [Hz]
Neutral /i/ 342 2129 2717
Curbing /o/ 482 1522 2863
Overdrive /e/ 564 1741 2445
Edge /e/ 562 2002 2510
According to Table 4.1 the first formant of the modes shows an increase moving from thenon metallic mode to the full metallic modes.

4.3. ANALYSING THE HARMONICS 41
4.3 Analysing the harmonics
An important aspect, which should be taken into account for the modelling of the fourmodes, is the harmonics of the glottal flow which are produced during the phonation ofeach of the modes. Therefore, the recorded data, will be processed in order to observethe differences in the harmonics of the modes. The data that were used for the analysisinclude 1ms recordings for every mode. The spectrogram of each mode can be seen inFig. 4.5.
(a) Neutral (b) Curbing
(c) Overdrive (d) Edge
Figure 4.5: Spectrograms of the four modes a) neutral, b) curbing, c) overdrive and d)edge.
In Fig. 4.5, the red stripes are equally spaced and they represent the harmonics which areproduced by the glottal pulse. The scale of the colorbar shows the sound pressure of theharmonics relative to 20µPa.
According to Fig. 4.5, neutral shows the less strong harmonics compared to the otherthree modes and the sound pressure of the signal is low. These characteristics verify thelow sound level of the mode and the low interaction between the vocal tract and the vocal

42 CHAPTER 4. GEOMETRY OF THE VOCAL TRACT
folds. Curbing, overdrive and edge show increased sound pressure at harmonics up toapproximately 9000 Hz. However, overdrive presents strong harmonics for frequenciesbetween approx. 12500 − 15000 Hz. The harmonics produced in curbing show a moreuniform sound pressure distribution along the spectrum. The narrowing of the epilarynxtube while phonating the three aforementioned modes, suggests a stronger coupling be-tween the vocal folds and the vocal tract. The stronger coupling is accompanied with anincrease in the metallic sound of the mode (see Section 2.2).
For a better overview of the formants of the modes, the first four formants were calcu-lated using [Praat, 2010]. The calculated formants are presented in Table 4.2.
Table 4.2: First four formants of the four vocal modes.
Name of mode Vowel F1 [Hz] F2 [Hz] F3 [Hz] F4 [Hz]
Neutral /i/ 286.73 2329.64 2839.48 4236.90
Curbing /o/ 713.35 1356.64 2824.91 3841.47
Overdrive /e/ 592.15 1871.03 2390.96 3637.73
Edge /e/ 630.88 2066.71 2781.26 3353.03
The formants for neutral, overdrive and edge show the same trend as the calculated res-onances of the vocal tracts given in Table 4.1. Though, according to Table 4.2, curbingshows increased formant values which can be considered to be in the metallic region. Ac-cording to Peterson and Barney [1951], the first formant of vowel /a/ (like in hot) inaverage is approximately 730 Hz while the first formant for /uh/ (like in but) is approx-imately 530 Hz. Since the MRI scans and the recordings were not obtained at the samemeasurement, a slight difference in the phonation of the vowel creates this deviation inthe value of the first formant of curbing, see Table 4.2 and 4.1.
4.4 Investigation of other possible modes
Recently, curbing is still under research. Half edge, half overdrive, medium edge andmedium overdrive are introduced in order to make the characteristics of the modes moreclear. Recordings of the modes were processed in order to indicate the differences intheir spectra. Half edge and half overdrive spectrograms are illustrated in Fig. 4.6, incomparison with the spectrogram of neutral. All the recordings have the same pitch,261 Hz (C4).

4.4. INVESTIGATION OF OTHER POSSIBLE MODES 43
(a) Half edge (b) Half overdrive
(c) Neutral
Figure 4.6: Spectrograms of a) half edge, b) half overdrive and c) neutral.
According to Fig. 4.6, half edge shows strong harmonics in the frequency range betweenapprox. 4000 − 9000 Hz. Half overdrive presents strong harmonics only in the very lowfrequencies and up to approx. 1000 Hz. Let us assume that in half overdrive the epilarynxtube is widened, as in overdrive, see Fig. 4.3. A more widened epilarynx tube in halfoverdrive, compared to half edge, would suggest less interaction between the vocal tractand the vocal folds, thus leading to less strong harmonics. Compared to neutral, half edgeshows stronger harmonics in the whole frequency range. Half overdrive, seems to haveless strong harmonics in the low frequency range (up to 5000 Hz) but above 7500 Hz itshows more strong harmonics compared to neutral.
Taking into account Fig. 4.6, there is evidence that half overdrive and half edge liebetween neutral and the full metallic modes, overdrive and edge. The strength of theharmonics is higher compared to neutral and lower compared to edge or overdrive, seeFig. 4.3.

44 CHAPTER 4. GEOMETRY OF THE VOCAL TRACT
The fundamental frequency and the first four formants for half edge and half overdrivewere calculated using Praat [2010]. The results are presented in Table 4.3. Neutral ispresented in comparison.
Table 4.3: Formants of half edge, half overdrive and neutral.
Name of mode F0 [Hz] F1 [Hz] F2 [Hz] F3 [Hz] F4 [Hz]
Half edge 259.49 620.01 1911.61 3563.96 4076.18
Half overdrive 261.08 537.90 1104.13 3237.93 3789.79
Neutral 260.03 286.73 2329.64 2839.48 4236.90
According to Table 4.3 neutral presents the lowest first formant, 286.73 Hz. This fre-quency is close to the pitch, thus it could explain an interaction with the fundamental andstronger harmonics in the low frequency range. For half overdrive and half edge the firstformant has higher values compared to neutral, 537.90 Hz and 620.01 Hz respectively.As it was observed in Fig. 4.4, the metallic of the sound increases as the first formantincreases.
Medium overdrive and medium edge are two modes which are considered to be in thecurbing area. The spectrograms of medium overdrive and medium edge are illustrated inFig. 4.7. Curbing is presented in comparison.

4.4. INVESTIGATION OF OTHER POSSIBLE MODES 45
(a) Medium overdrive (b) Medium edge
(c) Curbing
Figure 4.7: Spectrograms of a) medium overdrive, b) medium edge and c) curbing.
In Fig. 4.7 the three modes were phonated at the same pitch, approx. 261 Hz. It canbe observed that the strength of the harmonics in medium overdrive and medium edge isincreased compared to half overdrive and half edge. This would suggest a more metallic
sound. However, the medium modes present less strong harmonics in high frequecies(10000 − 15000 Hz) compared to the full metallic modes, overdrive and edge, see Fig.4.5. Medium overdrive and medium edge show the same trend as curbing. Though,curbing shows a more uniform distribution in the whole frequency range, as far as thestrength of harmonics is concerned.

46 CHAPTER 4. GEOMETRY OF THE VOCAL TRACT
The fundamental frequency and the first four formants for medium overdrive and mediumedge were calculated using [Praat, 2010]. The results are presented in Table 4.4. Curbingresults are presented in comparison.
Table 4.4: Fundamental frequency and first formants of medium overdrive, medium edgeand curbing.
Name of mode F0 [Hz] F1 [Hz] F2 [Hz] F3 [Hz] F4 [Hz]
Medium overdrive 261.98 540.71 1819.12 2648.11 3595.21
Medium Edge 263.00 542.61 2029.38 2885.58 4066.97
Curbing 257.15 713.35 1356.64 2824.91 3841.47
According to Table 4.3 medium overdrive and medium edge have approximately the samevalue for the first formant at 540.71 Hz and 542.61 Hz respectively. The phonated voweldefines the shape of the vocal tract and consequently the formants. The phonated vowelfor curbing was different from the two other modes and this justifies the high value forcurbing’s first formant. However, the spectrograms in Fig. 4.7 show the same trend forthe three modes. It can be suggested that medium overdrive, medium edge and curbingbelong to the same category.
Summarizing the results
In this chapter data from spoken and sung vowels were processed. It can be seen that theformants for the same spoken and sung vowel differ e.g. for /i/ vowel. In each case, thisis attributed to the different vocal tract configurations. For instance, Fig. 4.1b and Fig.4.3a show different vocal tract shapes even though the same vowel was used.
It was observed that the strength of the harmonics among the four differs. Neutralshows the less strong harmonics. This could be justified by the widened epilarynx tubethat makes the interaction between the vocal tract and the vocal folds weak. Thus, thelow sound level of the mode can be explained. The two full metallic modes, overdriveand edge, show strong harmonics in the low and medium frequency range (approx. up to9000 Hz). Curbing presents strong harmonics in the whole frequency range. Edge hasincreased sound pressure in up to 5000 Hz. The presence of increased sound pressure inthese two modes seems to be due to the narrowed epilarynx tube which implies a strongercoupling.
In the last part of this chapter, the investigation of the behaviour of four new suggestedmodes was presented. It seems that half edge and half overdrive are two transient modesbetween neutral and the two full metallic modes. Medium edge and medium overdrive

4.4. INVESTIGATION OF OTHER POSSIBLE MODES 47
present similar harmonic distribution as edge and overdrive respectively but, it could besaid, that they show less strong harmonics.
It should be noted that the results presented in this section were derived from a limitednumber of test subjects. Therefore, more recordings from different subjects would sug-gest a more representative conclusion about the differences among the modes.


CHAPTER 5Further modelling and coupling
Unlike an ideal lossless tube the yielding walls of the vocal tract impose losses on the sys-tem when they vibrate [Story, 1995]. In this chapter, the modelling of the vocal tract willbe continued including the losses due to the vibration of the yielding walls. Furthermore,the coupling of the vocal folds model with the model of the vocal tract will be discussed.The models that are used are the ones described in Chapter 3.
5.1 Losses in the vocal tract
In Chapter 3, the vocal tract was modelled as a sequence of uniform tubes with differentcross sectional areas. The only losses that were taken into account was the radiationimpedance at the end of the tube (i.e. the mouth). However, in order to create a morestable model, especially for the case of the coupled model, the losses in the vocal tractdue to the vibration of the yielding walls are important. Let us assume a two tube junction.According to Story [1995], the vibration of the walls is represented as a lumped elementcircuit, as seen in Fig. 5.1. The parameters that are used for the illustration in Fig. 5.1 arethe following:
• Lw, represents the mass-like properties of the flesh.
• Cw, represents the pressure storage capabilities.
• Rw, represents the viscosity of the tissue.
49

50 CHAPTER 5. FURTHER MODELLING AND COUPLING
Figure 5.1: Lumped element circuit representing losses due to the yielding walls [Story,1995].
In Fig. 5.1, Uw represents the flow into the lumped element circuit. The effects of theyielding walls and the derivation of the new scattering equations are mentioned in Story[1995]. The vocal tract resonances were calculated using the new scattering equationsand are illustrated in Fig. 5.2.
Figure 5.2: Input acoustic impedance of the four modes with losses.
Fig. 5.2 can be compared with Fig. 4.4. In Fig. 4.4, it can be observed that in a losslessvocal tract the resonances show infinite amplitude. However, Fig. 5.2 show smootherinput acoustic impedance curves along the frequency range. Thus, for further simulationsand modelling a lossy vocal tract will be taken into account.

5.2. RESULTS USING THE VOCAL FOLDS MODEL 51
5.2 Results using the vocal folds model
In Chapter 3 a two mass vocal fold model was suggested. In this section, the parameters ofthe model were adjusted in order to produce a desirable pitch by using a tension parameterq. an increase in the tension parameter means an increase in fundamental frequency. Forthe first simulation the tension parameter was q = 1 with a fundamental frequency at140 Hz. The sampling frequency was 44100 Hz and the pressure was kept constant at800 Pa. The displacement of the two mass were x1,rest = 0.001 m and x2,rest = 0.001 m
respectively. The results of the vocal folds model using the parameters in Table 3.1 areshown in Fig. 5.3.
Figure 5.3: Flux, acceleration and time varying glottal area of the two masses of the vocalfolds.
In Fig. 5.3 a self oscillated system of the vocal folds can be seen. This means that theoscillation of the vocal folds is self sustained without the vocal tract loading. When theglottal area takes negative values it means that the vocal folds are in the collision area.The lower and upper masses m1 and m2 show a difference in phase. The upper mass isdriven by the lower mass and this results in a phase delay of the upper mass. Accordingto Titze [1988] the wave propagation in the mucosa is from bottom to top. Reversed

52 CHAPTER 5. FURTHER MODELLING AND COUPLING
situation would not lead to oscillation. Therefore, the lower mass should always drive theupper mass.
5.3 Coupling the vocal tract
In order to couple the vocal tract with the vocal folds model a subglottal and supraglottaltract were created. The subglottal tract is a configuration consisting of multiple coupleduniform tubes with the same cross sectional area. The length of the human subglottal tractis approximately 14.3 cm. Thus, the number of the coupled tubes was set to 36 in orderto obtain a length of 0.3968 cm for each of them. The supraglottal tract, as mentioned inthe previous chapters, consists of 44 segments. Each of them has a length of 0.3968 cm inorder to obtain a total length of 17.46 cm which is approximately the length of the humansupraglottal tract.
As far as the vocal folds model is concerned, it should be noted that the latter model needsfurther improvement in order to represent the real vibration of the vocal folds. Further,during the coupling the model is very sensitive since a small shift in the initial displace-ments of the two masses can lead to a damped system. The pitch of the recordings whichwere investigated in Chapter 4 was 261 Hz. The pitch with the current vocal folds modelwas adjusted to approximately 264 Hz by selecting a tension parameter q = 1.6. Addingonly the subglottal tract the flow in the first tube of the vocal tract, as seen from the glottis,can be seen in Fig. 5.4.
Figure 5.4: Flux and acceleration at the first tube of the supraglottal tract.

5.3. COUPLING THE VOCAL TRACT 53
In Fig. 5.4 it can bee seen that neutral presents the maximum flow with overdrive, curbingand edge following respectively. This trend is attributed to the fact that neutral presents awidened epilarynx tube compared to the other modes, thus letting more air to pass throughthe vocal tract.
When the subglottal tract is included in the system the flow plays an important role. Con-cretely, first, the flow will start increasing and gradually will be stabilized. When thereflected pressures from both the subglottal and supraglottal tract show great differences,the Bernoulli effect is present. This should alter the movement of the vocal folds. In Fig.5.5 the flow and the volume acceleration during the coupling are presented.
Figure 5.5: Flux and acceleration for a pitch at 264 Hz.
In Fig. 5.5 it can be seen that in the beginning of the oscillation the flow increases andafter some seconds is stabilized. However, the shape of the flow pulses is kept the samefor the three modes. This should not be the case for the coupled system [Pedersen, 2013].Furthermore, the flow pulses in the coupled case should be amplified compared to Fig.5.4. This could be explained by the fact that the initial displacement of the two massesin the coupled case was much smaller compared to Fig. 5.4. Furthermore, according toPedersen [2013] the displacement of the masses in combination with the tension param-eter can simulate pressed or normal phonation. In order to obtain the desirable pitch in

54 CHAPTER 5. FURTHER MODELLING AND COUPLING
the coupled model, both the tension parameter and the displacement of the masses werechanged. Thus, Fig.5.4 and Fig. 5.5 present different phonation cases and this can explainthe difference in the behaviour of the two systems.
In order to see the behaviour of the system for a higher pitch, the tension parameterwas set to q = 2. The obtained pitch was 387 Hz. The displacement of the masses wasthe same as in the case for the 264 Hz simulation. The results are illustrated in Fig.5.6
Figure 5.6: Flux and acceleration for a pitch at 387 Hz.
In Fig.5.6, it can be observed that a rising in the pitch leads to less flow for all the modes.The increase in the tension parameter influences the mechanical movement of the vocalfolds. The forces that are included in the equations of motion 3.23 decrease. Additionally,the solution of the equations of motion includes these forces, as explained in AppendixB, in order to calculate the displacement of the lower and upper mass. Indicatively, thedisplacement of the two masses, as well as the minimum glottal area for the 387 Hz andthe 264 Hz pitch are presented in Fig.5.7 for the case of neutral.

5.3. COUPLING THE VOCAL TRACT 55
Figure 5.7: Displacement of the upper and lower mass for two different pitch values.
In Fig. 5.7 it can be seen that for both cases the lower mass drives the upper mass. This sat-isfies the condition for the wave propagation in the mucosa, according to Titze [1988] asmentioned in Section 5.2. The effect of the pitch shift can also be observed. In low pitchthe oscillation has a high amplitude and the minimum glottal area is higher compared tothe high pitch. The difference in the tension parameters makes the system oscillate indifferent amplitude. The higher the stiffness the more difficult for the masses to oscillate.

56 CHAPTER 5. FURTHER MODELLING AND COUPLING
The reflected pressures were calculated for the four modes and the results are illustratedin Fig. 5.8.
Figure 5.8: Reflected pressures during the coupling.
According to Fig. 5.8 the reflected pressures in the vocal tract, start from a low amplitudevalue and gradually they increase. However, neutral tends to increase in amplitude morethan the other three modes which is not the expected trend. Furthermore, in Fig. 5.8, ashift in neutral’s cycle can be seen. The same trend is observed in Pedersen [2013], whereneutral shows the same inertive behaviour but the cycle is shifted. This is related to thefact that the fundamental frequency have similar values with the first formant, where theresistive load increases [Pedersen, 2013].
It is worth noticing that the pressure at the beginning of the glottal cycle is positive. Thisindicates the inertive load of the vocal folds. According to Titze [1988], the air in thevocal tract acts like a mass of air accelerated and decelerated. During the opening phaseof the vocal folds the flow increases (see Fig. 5.5) and the air in the vocal tract increaseswith glottal air. For the acceleration a positive pressure is needed. At the closing phasethe reduced suppraglotal pressure lowers the average glottal pressure and at some pointthe average intraglottal pressure becomes negative [Titze, 1988]. The fluctuations that areobserved in the pressure curves are attributed to the higher harmonics that resonate in the

5.3. COUPLING THE VOCAL TRACT 57
vocal tract [Pedersen, 2013].
The next step of the analysis was the investigation of the harmonics and define theirspectrum. A fast Fourier transform was applied on the volume velocity of the obtainedsignals using a hamming window. The sound pressure of each harmonic was divided bythe value of the strongest harmonic in order to get the normalized amplitude. The spec-trum of the four modes are depicted in Fig. 5.9. Note that the spectra are zoomed in orderto compare the strength among the harmonics of each mode. The obtained spectra arelisted in Appendix C in comparison to the spectra calculated using the recorded data usedin Section 4.2.
(a) Neutral (b) Curbing
(c) Overdrive (d) Edge
Figure 5.9: Spectrum of a) Neutral, b) Curbing, c) Overdrive, d) Edge.
In Fig. 5.9, the strong peaks are the harmonics and are integer muliples of the funda-mental frequency. It can be observed that in neutral, the spectrum presents a strong peakbefore the fundamental frequency, approx. at 228 Hz. The presence of the overtone couldbe either due to the non-linear oscillation of the masses or due to the phase difference ofthe produced waves.

58 CHAPTER 5. FURTHER MODELLING AND COUPLING
In neutral’s spectrum, the decrease in the sound pressure as the harmonics increase is inaccordance with the results obtained in Section 4.3. Neutral show the less strong harmon-ics in the whole frequency range. The same trend is observed for curbing but this cannotconsidered a valid result since strong harmonics are expected in low and high frequencyrange. In the overdrive spectrum, the second harmonic shows an increased sound pres-sure compared to the fundamental (approx. 8.77 dB difference). In Titze [2008], it ismentioned that the amplitude of the harmonics is influenced by the reactance curve. Thefirst harmonic of overdrive according to Fig.5.9 is approximately at 529.4 Hz and at thepositive reactance area. This could increase the amplitude of the harmonic. In edge, thefourth harmonic shows a more increased sound pressure. The fourth harmonic is in thepositive reactance area for edge, which could imply an increase in the amplitude of theharmonic.
Overall, the obtained results from the model discussed in this chapter are not in completeaccordance with the results obtained from the analysis of the recorded data in Section4.3. Many of the harmonics are underestimated which would suggest a more accurateinvestigation of the system, by including more parameters. Important aspects that haveto be taken into account are the initial displacement of the masses, the tension parameter,the open quotient and the pressed phonation. In this study, the model was simplified andsome of the above mentioned parameters were not examined thoroughly. The symmetri-cal vocal folds model and the fact that the initial positions of the masses were always keptthe same could lead to deviations from the measurements.

CHAPTER 6Conclusion and further research
A vocal tract and a vocal folds model was implemented in order to examine their inter-action. A simplified two mass model was used for the modelling of the vocal folds. Thecurrent project was based on two previous studies concerning the singing voice and theinvestigation of the four vocal modes [Selamtzis, 2011] [Pedersen, 2013].
Firstly, an analysis of the resonances in the vocal tract of the four modes was conducted.For this purpose, already existing MRI data were used. Every mode shows a differentvocal tract shape. However, the different vocal tract shapes are also attributed to the dif-ferent vowels that were phonated during the measurement. The input acoustic impedancewas the main metric that was used during the simulations, and the resonances of the vocaltract were calculated. It seems that moving from the non metallic modes to the full metal-
lic modes, the first resonance of the vocal tact increases.
Furthermore, an approach to find possible differences among the modes was made byanalysing recorded data. It was observed that the strength of the harmonics is differentamong the modes. It can be assumed that, the stronger harmonics a mode has, the metal-
lic sound of the mode increases. Investigation of four new suggested modes were alsoconducted. It appears that between the non metallic modes and the full metallic modesthere are two intermediate modes. These modes could offer a soft transition from onemode to another.
It should be noted that the number of the recordings was limited. Thus, a more valid in-vestigation of the modes would include an experiment where several well trained singerswill phonate vowels using the different modes. It would be of great interest if the singersused the same vowel for each mode.
59

60 CHAPTER 6. CONCLUSION AND FURTHER RESEARCH
The final step was to model the modes. During the coupling of the two models it isevident that there is an interaction between the two models. Though, the obtained resultsdid not match with the results obtained from the recordings. A more detailed vocal foldsmodel, using more parameters, would probably yield in more representative results. Dueto time restrictions and the complexity of the physiology of the vocal system a more de-tailed approach was not performed.
Overall, it should be mentioned that a very complex system was modelled in a very sim-ple way. More focus should be given on the modelling of the vocal folds. The continuummodel that was not used for further processing in this study, can be used for a more realis-tic vocal folds model. Furthermore, EGG measurements in combination with recordingswould give more information about the open quotient of every mode, especially for thelately discovered modes. Last but not least, it would be worth investigating whether thesingers use the formant tuning technique when they perform the full metallic modes.

61


Appendices
63


APPENDIX AMatlab code used for the WR analog
1 l = 0 . 1 7 4 6 ;%l e n g t h o f v o c a l t r a c t2 n_end =43;%number o f v o c a l t r a c t segmen t s3
4 S=S_NT ;%c r o s s s e c t i o n a l a r e a5
6 rho = 1 . 2 ;%a i r d e n s i t y7 c =343;%speed of sound8 f s = ( ( n_end * c ) ) / ( l ) ;%sa m p l i n g f r e q u e n c y9 Ts =1/ f s ;%l e n g t h o f t h e sample
10
11 n_end=n_end +1;12 f o r n =1: n_end −113 r ( n ) =(S ( n )−S ( n +1) ) / ( S ( n ) +S ( n +1) ) ;14 end15
16 F= z e r o s ( 1 , n_end ) ;17 B= z e r o s ( 1 , n_end ) ;18 F_2= z e r o s ( 1 , n_end ) ;19 B_1= z e r o s ( 1 , n_end ) ;20 Fsave = z e r o s ( 1 , n_end ) ;21 Bsave= z e r o s ( 1 , n_end ) ;22
23 a= s q r t ( S ( end ) / p i ) ;24 R=128 / (9 * p i ^2 ) ;25 L=2* f s *8* a / ( 3 * p i * c ) ;26 a_2=−R−L+R*L ;
65

66 APPENDIX A. MATLAB CODE USED FOR THE WR ANALOG
27 a_1=−R+L−R*L ;28 b_2=R+L+R*L ;29 b_1=−R+L+R*L ;30
31 r _ g l o t =1 ;32 t _ e n d =32800;33 f o r t =1 : t _ e n d ;34
35 i f t ==136 u =1;37 e l s e38 u =0;39 F=F_2 ;40 B=B_1 ;41 end42
43 f o r n = 1 : 1 : n_end −144 F_2 ( n +1) =(1+ r ( n ) ) *F_2 ( n )−r ( n ) *B_1 ( n +1) ;45 B_1 ( n ) = r ( n ) *F_2 ( n ) +(1− r ( n ) ) *B_1 ( n +1) ;46 end47
48 F_2 ( 1 ) =u* rho * c / S ( 1 ) + r _ g l o t *B ( 1 ) ;49 B_1 ( n_end ) =1/ b_2 *( F_2 ( n_end ) * a_2+F_2 ( n_end ) * a_1+B_1 ( n_end ) *
b_1 ) ;50
51 Fsave ( t , : ) =F_2 ;52 Bsave ( t , : ) =B_1 ;53 end
APPENDIX BSolution of the equations of motion
In order to solve the equations of motion in Section 3.2.1 the forward Euler method wasfollowed according to Agerkvist [2013]. Let us assume that:
x1 = u1 (B.1)
x2 = u2 (B.2)
The equations of motion 3.23 and 3.24 can be written as follows:
u1 = 1m1
(Fe1 − F1col − r1u1 − kx1 − kc((x1 − x1,rest) − (x2 − x2,rest))) (B.3)
u2 = 1m2
(Fe2 − F2col − r2u2 − kx2 − kc((x1 − x1,rest) − (x2 − x2,rest))) (B.4)
The general form of the solution is written as:
x(n + 1) = x(n) + Ts(Fx(n) + G) (B.5)
where Ts is the time of the interval, F is a 4x4 matrix and G is a 4x1 that presents thenon linear part of the F matrix. F and G are matrices defined by Eq. B.3 and B.4. Let usassume that x1,rest and x2,rest are equal to zero. After proper mathematical manipulationthe matrices F and G are defined as follows:
67

68 APPENDIX B. SOLUTION OF THE EQUATIONS OF MOTION
F =
−r1/m1 1 (−k1 − kc)/m1 kc/m1
1 −r2/m2 kc/m2 (−k2 − kc)/m2
1 1 1 11 1 1 1
(B.6)
and
G =
Fe1 − Θ(−a1) ∗ c1 ∗ a12lg
m1Fe2 − Θ(−a2) ∗ c2 ∗ a2
2lg
m211
(B.7)

APPENDIX CSimulated vocal modes: Spectra
The spectra of the four vocal modes were obtained by applying a fast Fourier transformand a hamming window. The results of the simulations are presented in comparison tothe spectra of the recorded signals. They can be seen in Fig. C.2
(a) Neutral simulated (b) Neutral recorded
(c) Curbing simulated (d) Curbing recorded
Figure C.1: Spectrum of neutral a) simulation, b)recording, and curbing c) simulation, d)recording.
69

70 APPENDIX C. SIMULATED VOCAL MODES: SPECTRA
(a) Overdirve simulated (b) Overdrive recorded
(c) Edge simulated (d) Edge recorded
Figure C.2: Spectrum of overdrive a) simulation, b)recording, and edge c) simulation, d)recording.

71


Bibliography
Agerkvist, F. [2013], ‘Discrete time modelling of nonlinear loudspeakers’.
Alipour, F., Berry, D. A. and Titze, I. R. [2000], ‘A finite-element model of vocal-foldvibration’, Acoustical Society of America 108(2), 3003–3012.
Austin, S. F. and Titze, I. R. [1997], ‘The effect of subglottal resonance upon vocal foldvibration’, J Voice 11(4), 391–402.
Birkholz, P., Kroger, B. and Neuschaefer-Rube, C. [2011], ‘Synthesis of breathy, normal,and pressed phonation using a two-mass model with a triangular glottis’, Proceedings
of the Annual Conference of the International Speech Communication Association, IN-
TERSPEECH pp. 2681–2684.
Chang, K.-h. [2012], Speech Analysis Methodologies towards Unobtrusive Mental HealthMonitoring, PhD thesis, EECS Department, University of California, Berkeley.URL: http://www.eecs.berkeley.edu/Pubs/TechRpts/2012/EECS-2012-55.html
Clement, P., Hans, S., Hartl, D. M., Maeda, S., Vaissiere, J. and Brasnu, D. [2007], ‘Vocaltract area function for vowels using three-dimensional magnetic resonance imaging. Apreliminary study’, J Voice 21(5), 522–530.
completevocalinstitute.com [2015], ‘Complete vocal institute @ONLINE’.URL: http://completevocalinstitute.com/research/laryngograph/
Fakotakis, N. [2005], Speech Technology, University of Patras Press.URL: http://www.GetBodySmart.com
Fant, G. [1960], Acoustic theory of speech production, Mouton and Co.
Flanagan, J., Allen, J. and Hasegawa-Johnson, M. [2008], Speech Analysis Synthesis and
Perception.
73

74 BIBLIOGRAPHY
GetBodySmart.com [2015], ‘Getbodysmart.com @ONLINE’.URL: http://www.GetBodySmart.com
Granados, A. [2014], ‘Biomechanical models of the vocal folds (i)’, Lecture note for
course Advaced acoustics .
Hanayama, E., Camargo, Z., D.H., T. and Rebelo Pinho, S. [2009], ‘Metallic Voice: Phys-iological and Acoustic Features’, Journal of Voice 1(3), 62–70.
Henrich, N., d’Alessandro, C., Doval, B. and Castellengo, M. [2004], ‘On the use ofthe derivative of electroglottographic signals for characterization of nonpathologicalphonation’, J. Acoust. Soc. Am. 115(3), 1321–1332.
Henrich, N., Smith, J. and Wolfe, J. [2011], ‘Vocal tract resonances in singing: Strategiesused by sopranos, altos, tenors, and baritones’, J. Acoust. Soc. Am. 129(2), 1024–1035.
Ikeda, T., Matsuzaki, Y. and Aomatsu, T. [2001], ‘A Numerical Analysis of Phonation Us-ing a TwoDimensional Flexible Channel Model of the Vocal Folds’, Journal of Biome-
chanical Engineering 123, 571–579.
Ishizaka, K. and Flanagan, J. L. [1972], ‘Synthesis of voiced sounds from a two-massmodel of the vocal cords’, The Bell System Technical Journal 51(6), 1233–1268.
Jacbosen, F. [2011], ‘Greens function in a room’, Exercise guide used in the course "Ad-
vanced Acoustics" at DTU spring 2012 .
Liljencrants, J. [1985], ‘Speech synthesis with a reflection-type line analog’, Dept. of
Speech Communication and Music Acoustics, Royal Institute of Technology, Stockholm,
Sweden, .
NCVS.org [2015], ‘The national center for voice and speech @ONLINE’.URL: http://www.ncvs.org/
Pedersen, J. [2013], ‘The singing voice: A vibroacoustic problem’, DTU .
Peterson, G. and Barney, H. [1951], ‘Control Methods Used in a Study of the Vowels ’,Acoustical Society of America 24(2), 175–184.
Plack, C. [2005], The sense of hearing, Press.
Praat [2010], ‘Praat: Sound to formant @ONLINE’.URL: http://www.fon.hum.uva.nl/praat/manual/Sound__To_
Formant__burg____.html
Sadolin, C. [2012], Komplet Sangteknik, 5.edition, Shout Publications.

BIBLIOGRAPHY 75
Selamtzis, A. [2011], ‘Acoustics of the singing voice’, DTU .
Steinecke, I. and Herzel, H. [1995], ‘Bifurcations in an asymmetric vocal-fold model’, J.
Acoust. Soc. Am. 97(3), 1874–1884.
Story, B. [1995], Physiologically-based Speech Simulation Using an Enhanced Wave-
reflection Model of the Vocal Tract, University of Iowa.URL: http://books.google.dk/books?id=8PsNywAACAAJ
Story, B. H., Laukkanen, A. M. and Titze, I. R. [2000], ‘Acoustic impedance of an artifi-cially lengthened and constricted vocal tract’, J Voice 14(4), 455–469.
Story, B. H. and Titze, I. R. [1995], ‘Voice simulation with a body-cover model of thevocal folds’, J. Acoust. Soc. Am. 97(2), 1249–1260.
StudyBlue.com [2015], ‘studyblue.com @ONLINE’.URL: https://www.studyblue.com/notes/note/n/larynx/deck/12423026
Sundberg, J. [1994], ‘Perceptual Aspects of Singing’, Journal of Voice 8(2), 106–122.
tdmu.edu [2015], ‘Respiratory system: anatomy and physiology @ONLINE’.
Titze, I. and Alipour, F. [2006], The Myoelastic Aerodynamic Theory of Phonation, Na-tional Center for Voice and Speech.URL: http://books.google.dk/books?id=TdhbBAAACAAJ
Titze, I. R. [1976], ‘On the mechanics of the folds vibration.’, J. Acoust. Soc. Am.
60(6), 1366–1380.
Titze, I. R. [1984], ‘Parameterization of the glottal area, glottal flow, and vocal fold con-tact area’, J. Acoust. Soc. Am. 75(2), 570–580.
Titze, I. R. [1988], ‘The physics of small-amplitude oscillation of the vocal folds’, J.
Acoust. Soc. Am. 83(4), 1536–1552.
Titze, I. R. [2002], ‘Regulating glottal airflow in phonation: application of the maximumpower transfer theorem to a low dimensional phonation model’, J. Acoust. Soc. Am.
111(1 Pt 1), 367–376.
Titze, I. R. [2008], ‘Nonlinear source-filter coupling in phonation: theory’, J. Acoust. Soc.
Am. 123(5), 2733–2749.
Titze, I. R. and Talkin, D. [1979], ‘A theoretical study of the effects of various laryngealconfigurations on the acoustics of phonation.’, Acoustical Society of America 66(1), 60–74.

76 BIBLIOGRAPHY
Titze, I. R. and Worley, A. S. [2009], ‘Modeling source-filter interaction in belting andhigh-pitched operatic male singing’, J. Acoust. Soc. Am. 126(3), 1530.
Wikipedia [2015], ‘Larynx @ONLINE’.URL: https://en.wikipedia.org/wiki/Larynx/media/File:Illu_larynx.jpg

List of Figures
2.1 The human phonatory system [tdmu.edu, 2015]. . . . . . . . . . . . . . . . . 6
2.2 Speech production mechanism diagram [Fakotakis, 2005]. . . . . . . . . . . 7
2.3 Frontal view of the larynx [Wikipedia, 2015]. . . . . . . . . . . . . . . . . . 8
2.4 Lateral view of the cartilages of the larynx [StudyBlue.com, 2015]. . . . . . . 8
2.5 Frontal view of the vocal fold layers [Pedersen, 2013]. . . . . . . . . . . . . 9
2.6 Vibration pattern of the vocal folds [Selamtzis, 2011]. . . . . . . . . . . . . . 10
2.7 Sound production in speech [Chang, 2012]. . . . . . . . . . . . . . . . . . . 11
2.8 Synchronised larynx stroboscopy with EGG [completevocalinstitute.com, 2015]. 15
3.1 Representation of the vocal tract constituting of coupled tubes [Story, 1995]. . 18
3.2 impedance . . . . . . . . . . . . . . . . . . . . . . . . . . . . . . . . . . . . 19
3.3 Vocal tract shape and magnitude of the acoustic input impedance of the uni-form tube. . . . . . . . . . . . . . . . . . . . . . . . . . . . . . . . . . . . . 20
3.4 Idealized vocal tract shape and magnitude of the acoustic input impedancefor the vowel /i/. . . . . . . . . . . . . . . . . . . . . . . . . . . . . . . . . 21
3.5 Idealized vocal tract shape and magnitude of the acoustic input impedancefor the vowel /a/. . . . . . . . . . . . . . . . . . . . . . . . . . . . . . . . . 21
3.6 Wave propagation in the vocal tract [Pedersen, 2013]. . . . . . . . . . . . . . 23
3.7 Two tube junction (left) and space time diagram of partial waves (right) [Lil-jencrants, 1985]. . . . . . . . . . . . . . . . . . . . . . . . . . . . . . . . . . 23
3.8 Wave reflection model and frequency domain model. . . . . . . . . . . . . . 26
3.9 Two mass model of the vocal folds (Assaneo, 2013). . . . . . . . . . . . . . 27
3.10 Illustration of the vocal folds using the continuum model [Titze and Talkin,1979]. . . . . . . . . . . . . . . . . . . . . . . . . . . . . . . . . . . . . . . 31
4.2 Comparison of the vocal tract resonances of the uniform and /u/ vowel. . . . 37
4.4 Vocal tract resonances of the four vocal modes. . . . . . . . . . . . . . . . . 39
77

78 List of Figures
5.1 Lumped element circuit representing losses due to the yielding walls [Story,1995]. . . . . . . . . . . . . . . . . . . . . . . . . . . . . . . . . . . . . . . 50
5.2 Input acoustic impedance of the four modes with losses. . . . . . . . . . . . . 505.3 Flux, acceleration and time varying glottal area of the two masses of the vocal
folds. . . . . . . . . . . . . . . . . . . . . . . . . . . . . . . . . . . . . . . 515.4 Flux and acceleration at the first tube of the supraglottal tract. . . . . . . . . . 525.5 Flux and acceleration for a pitch at 264 Hz. . . . . . . . . . . . . . . . . . . 535.6 Flux and acceleration for a pitch at 387 Hz. . . . . . . . . . . . . . . . . . . 545.7 Displacement of the upper and lower mass for two different pitch values. . . . 555.8 Reflected pressures during the coupling. . . . . . . . . . . . . . . . . . . . . 56

List of Tables
2.1 The four modes and the amount of how metallic they are [Sadolin, 2012]. . . 12
3.1 Description and values of the variables used in the two mass model (adaptedfrom [Pedersen, 2013]. . . . . . . . . . . . . . . . . . . . . . . . . . . . . . 28
4.1 Resonances of the vocal tract for each vocal mode. . . . . . . . . . . . . . . 404.2 First four formants of the four vocal modes. . . . . . . . . . . . . . . . . . . 424.3 Formants of half edge, half overdrive and neutral. . . . . . . . . . . . . . . . 444.4 Fundamental frequency and first formants of medium overdrive, medium
edge and curbing. . . . . . . . . . . . . . . . . . . . . . . . . . . . . . . . . 46
79