maria l. silveira uf/ifas range cattle rec
TRANSCRIPT

CONSIDERATIONS FOR MATCHING SOILS AND FORAGES Maria L. Silveira
UF/IFAS Range Cattle REC
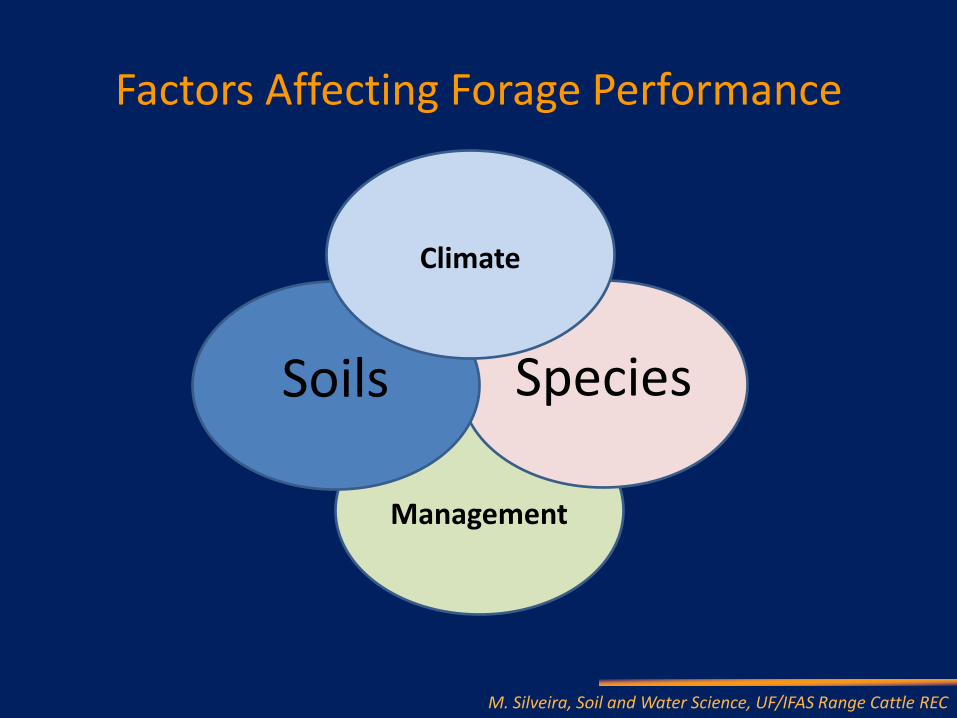
Factors Affecting Forage Performance
M. Silveira, Soil and Water Science, UF/IFAS Range Cattle REC
Management
Species Soils
Climate
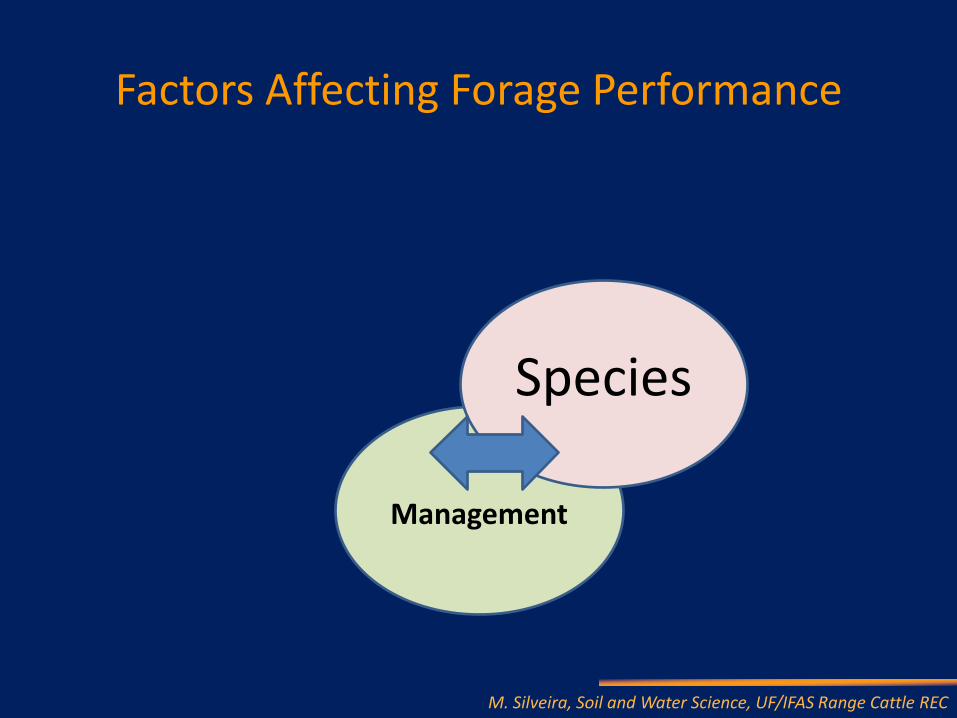
Factors Affecting Forage Performance
M. Silveira, Soil and Water Science, UF/IFAS Range Cattle REC
Management
Species

Essential Plant Nutrients
1. Plants cannot complete their life cycle without the element
2. The function of the element cannot be substitute by another substance 3. The element is directly involved in metabolic function

17 Essential Elements Element Forms absorbed
Nitrogen NH4+, NO3
-
Potassium K+
Calcium Ca2+
Magnesium Mg2+
Phosphorus H2PO4-, HPO4
2-, PO43-
Sulfur SO42-
Chlorine Cl-
Boron H3BO3
Iron Fe2+
Manganese Mn2+
Zinc Zn2+, ZnOH+, ZnCl+
Copper Cu2+
Molybdenum MoO42-
Nickel Ni2+

Total Macronutrients taken up by forage crops
M. Silveira, Soil and Water Science, UF/IFAS Range Cattle REC
Forage Crop Yield (T/A)
Uptake (lb/A)
N P2O5 K2O
Jiggs bermudagrass1 11 398 146 390
Coastal bermudagrass2
8 368 96 400
Ona stargrass1 7 316 154 306
Floralta limpograss1
6 237 137 200
Bahiagrass3 5 192 53 223
Perennial peanut3 5 288* 55 229
Red clover2 4 300* 50 265
Source: 1Silveira et al., 2013; 2Griffith and Murphy, 1996; 3Mackoviak et al., 2013. *Legumes obtain nitrogen from the air via symbiotic fixation.
Importance of Soil Test
M. Silveira, Soil and Water Science, UF/IFAS Range Cattle REC

M. Silveira, Soil and Water Science, UF/IFAS Range Cattle REC
Fertility status Range of responses
Average
% of pastureland that is soil tested 5-50 21
% of pastureland that is below pH 6 30-80 52
% of pastureland that is low in P 25-70 46
% of pastureland that is low in K 10-60 33
% of pastureland receiving annual fertilizer
10-50 28
% of hay land receiving annual fertilizer
20-95 66
Summary of soil test results and fertilization practices in the South USA1
1Adapted from Griffith and Murphy, 1996. Source: Ball et al., 1991
SOIL ACIDITY IS THE MAJOR GROWTH-LIMITING FACTOR FOR FORAGE CROPS GROWN IN THE SOUTHEASTERN USA

M. Silveira, Soil and Water Science, UF/IFAS Range Cattle REC
Test results Number of samples
Total samples submitted to the lab (03/2009 – 09/2010)
1346
Samples with pH ≤ 5.3 727 (54%)
Samples tested low in P (< 16 ppm Mehlich-1 P) 473 (35%)
Samples tested low in K (< 36 ppm Mehlich-1 K) 737 (55%)
Summary of soil test results for bahiagrass samples submitted to the UF/IFAS Extension Soil Test lab (2009-2010)

UF/IFAS Fertilizer Recommendations (SL 129)
M. Silveira, Soil and Water Science, UF/IFAS Range Cattle REC
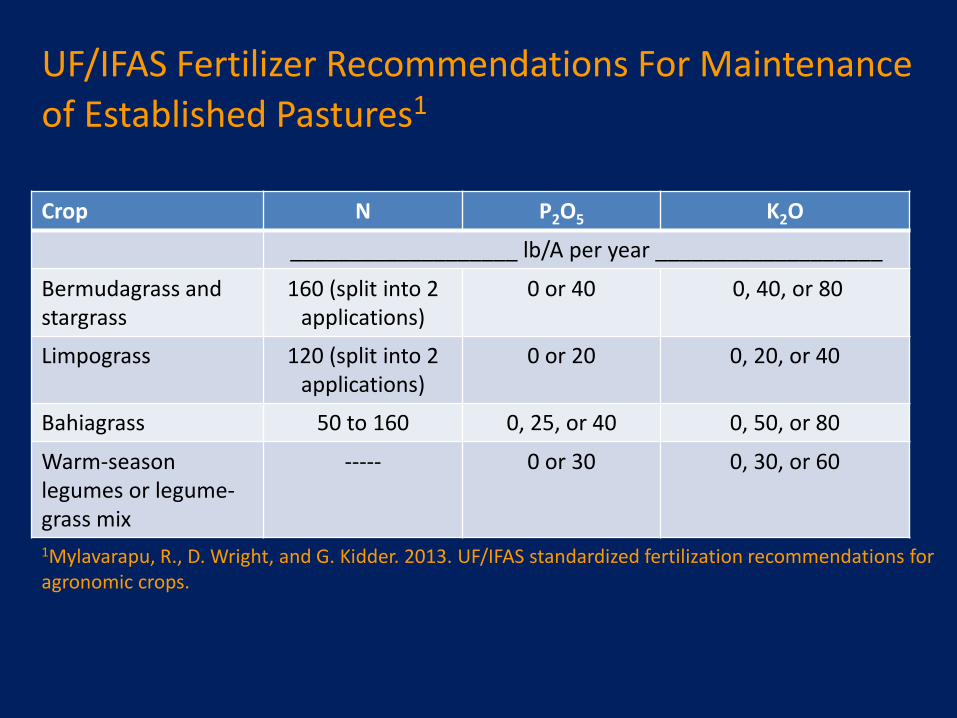
UF/IFAS Fertilizer Recommendations For Maintenance of Established Pastures1
1Mylavarapu, R., D. Wright, and G. Kidder. 2013. UF/IFAS standardized fertilization recommendations for agronomic crops.
Crop N P2O5 K2O
___________________ lb/A per year ___________________
Bermudagrass and stargrass
160 (split into 2 applications)
0 or 40 0, 40, or 80
Limpograss 120 (split into 2 applications)
0 or 20 0, 20, or 40
Bahiagrass 50 to 160 0, 25, or 40 0, 50, or 80
Warm-season legumes or legume-grass mix
----- 0 or 30 0, 30, or 60
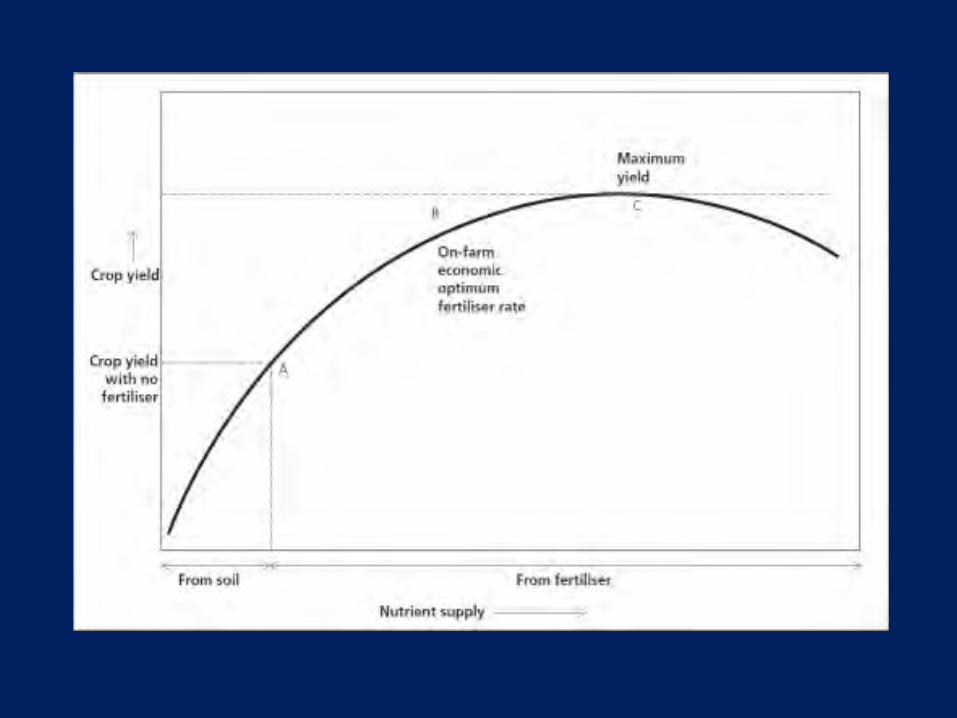

Soil A
Soil B
Fertilizer application rate
Fora
ge Y
ield

Managing Soil pH
M. Silveira, Soil and Water Science, UF/IFAS Range Cattle REC
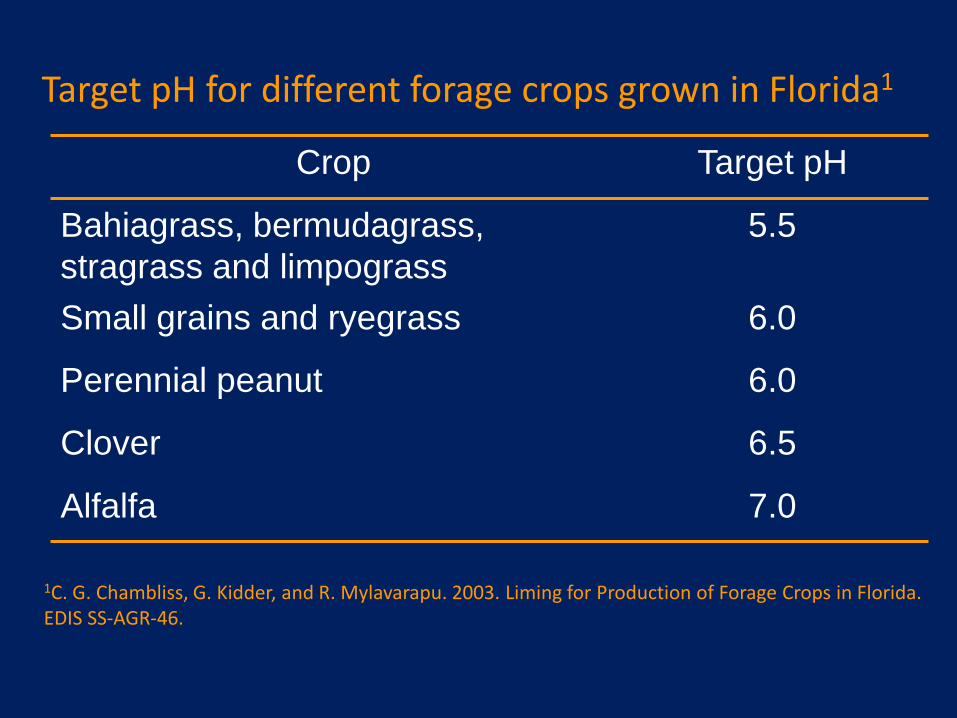
Target pH for different forage crops grown in Florida1
Crop Target pH
Bahiagrass, bermudagrass, stragrass and limpograss
5.5
Small grains and ryegrass 6.0
Perennial peanut 6.0
Clover 6.5
Alfalfa 7.0
1C. G. Chambliss, G. Kidder, and R. Mylavarapu. 2003. Liming for Production of Forage Crops in Florida. EDIS SS-AGR-46.

Effect of dolomitic lime application on bahiagrass yields1
1Rechcigl et al., 1995. Initial soil pH = 4.6.
Lime was applied in 1989. Nitrogen (50 lb N/A) and K (66 lb K/A) were applied annually
Lime rate (tons/A)
1989 1990 1991 1992
__________ Bahiagrass yields (tons/A) __________
0 3.1 3.4 3.7 3.4
1 3.0 3.7 4.5 4.1
2 3.3 3.9 4.9 4.1
3 3.2 3.5 4.9 4.3
Significance ** **
**
**

Effect of lime and fertilizer applications on bahiagrass yields (5-yr mean)1
1Adjei and Rechcigl, 2004. 4 locations; only one responded to lime application. Initial soil pH = 4.4.
Treatments - N: 67 lb N/A, NPK: 67-12-56 lb/A,NPKM: 67-12-56 lb/A + 22 kg ha-1 F503 G micronutrient mix.
Fertilizer treatment
No-lime Lime Mean
_______ Bahiagrass yields (tons/A) _______
Control 5.6 6.3 (12%) 6.0 b
N 6.8 8.5 (25%) 7.7 a
NPK 7.2 9.1 8.2 a
NPKM 6.7 9.3 7.5 a
Mean 6.6 B 8.1 A (23%)
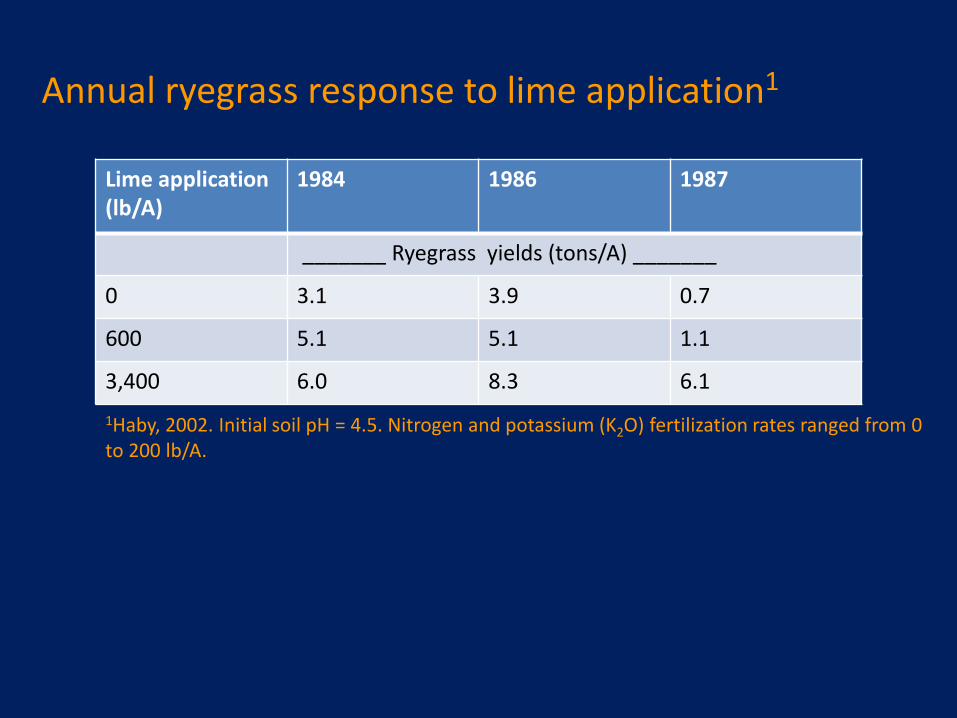
Annual ryegrass response to lime application1
1Haby, 2002. Initial soil pH = 4.5. Nitrogen and potassium (K2O) fertilization rates ranged from 0 to 200 lb/A.
Lime application (lb/A)
1984 1986 1987
_______ Ryegrass yields (tons/A) _______
0 3.1 3.9 0.7
600 5.1 5.1 1.1
3,400 6.0 8.3 6.1
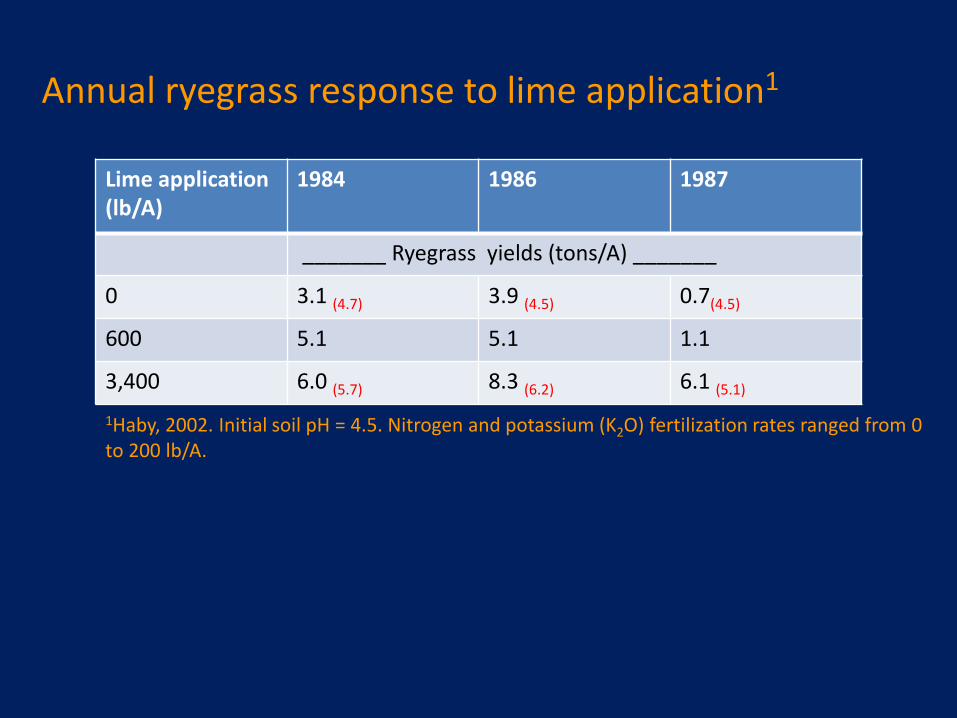
Annual ryegrass response to lime application1
1Haby, 2002. Initial soil pH = 4.5. Nitrogen and potassium (K2O) fertilization rates ranged from 0 to 200 lb/A.
Lime application (lb/A)
1984 1986 1987
_______ Ryegrass yields (tons/A) _______
0 3.1 (4.7) 3.9 (4.5) 0.7(4.5)
600 5.1 5.1 1.1
3,400 6.0 (5.7) 8.3 (6.2) 6.1 (5.1)

Photo Courtesy: Ed Jennings (UF/IFAS, multi-county livestock Agent

Managing Nitrogen Fertilizer
M. Silveira, Soil and Water Science, UF/IFAS Range Cattle REC
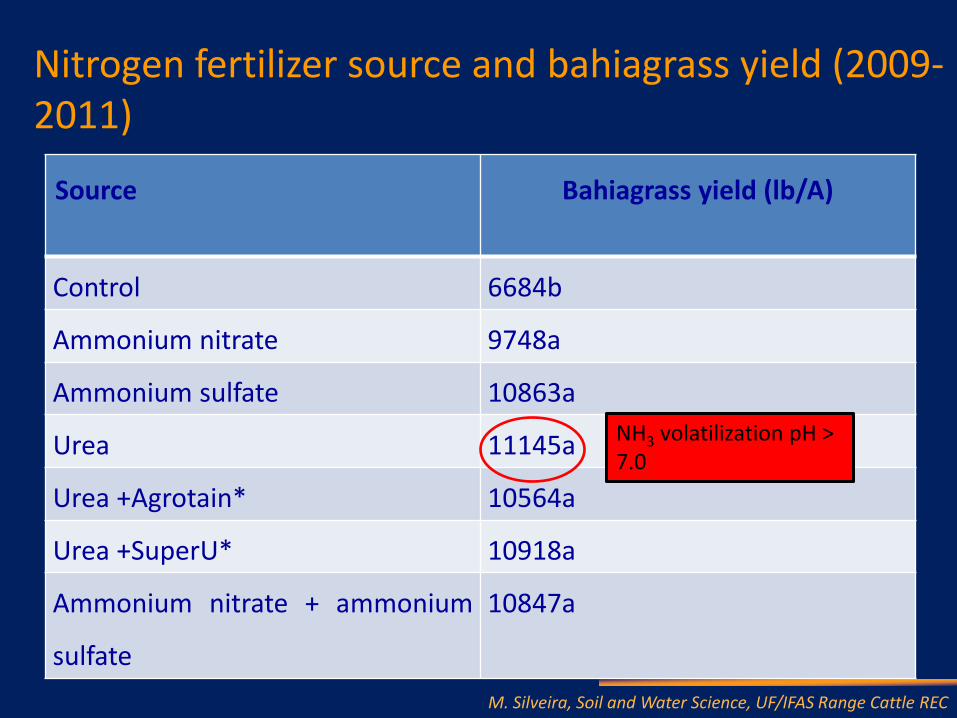
Nitrogen fertilizer source and bahiagrass yield (2009-2011)
M. Silveira, Soil and Water Science, UF/IFAS Range Cattle REC
Source Bahiagrass yield (lb/A)
Control 6684b
Ammonium nitrate 9748a
Ammonium sulfate 10863a
Urea 11145a
Urea +Agrotain* 10564a
Urea +SuperU* 10918a
Ammonium nitrate + ammonium
sulfate
10847a
NH3 volatilization pH > 7.0

Nitrogen fertilizer source and bahiagrass yield (2012-2013)
M. Silveira, Soil and Water Science, UF/IFAS Range Cattle REC
Source Bahiagrass yield (lb/A)
Control 4116c
Ammonium nitrate 7163a
Ammonium sulfate 7291a
Urea 7015a
Liquid urea 6098b
Liquid urea + Agrotain 6104b

M. Silveira, Soil and Water Science, UF/IFAS Range Cattle REC

Average bahiagrass yield and crude protein concentration as affected by N rate (5-yr data)
M. Silveira, Soil and Water Science, UF/IFAS Range Cattle REC
N rate Bahiagrass yield Crude Protein
_________ lb/Ac _________ %
Control (no N) 6977c 8.5a
50 8730 b (25%) 8.7a
100 10483 a (50%) 9.6b

Bahiagrass production efficiency as affected by year and rate of N application
M. Silveira, Soil and Water Science, UF/IFAS Range Cattle REC
N level
(lb/Ac)
2009 2010 2011 2012 2013
_______________ Production efficiency*______________
50 23 61 36 43 41
100 28 54 31 32 32
* Production efficiency (lb DM/lb applied N) = (yield fertilized plot – yield control plot) / (N application level)

Managing Potassium

Objectives
1. To evaluate Jiggs bermudagrass and limpograss responses to “minimum” potassium and phosphorus fertilization
2. Application levels: - Potassium: 0, 40, and 80 lb K2O/A (0, 50, and 100% recommended rates for established pastures) - Phosphorus: 0, 20, and 40 lb P2O5/A (0, 50, and 100% recommended rates) 3. Limpograss: 2 harvest frequencies (6- and 12-week interval) 4. Jiggs: 2 N level (80 and 160 lb N/A) (50 and 100% recommended rate for established pastures)

Effect of K fertilization on ‘Jiggs’ bermudagrass production
Annual K2O level
2012
lb A-1 _____ lb A-1_____ 0 4536
40 5719 (26%)
80 6517(44%)
Orthogonal contrast
L**
M. Silveira, Soil and Water Science, UF/IFAS Range Cattle REC

Effect of K fertilization on ‘Jiggs’ bermudagrass production
Annual K2O level
2012 2013
lb A-1 _____ lb A-1_____ 0 4536 1062
40 5719 (26%) 3201(200%)
80 6517(44%) 4319 (306%)
Orthogonal contrast
L** L**
M. Silveira, Soil and Water Science, UF/IFAS Range Cattle REC
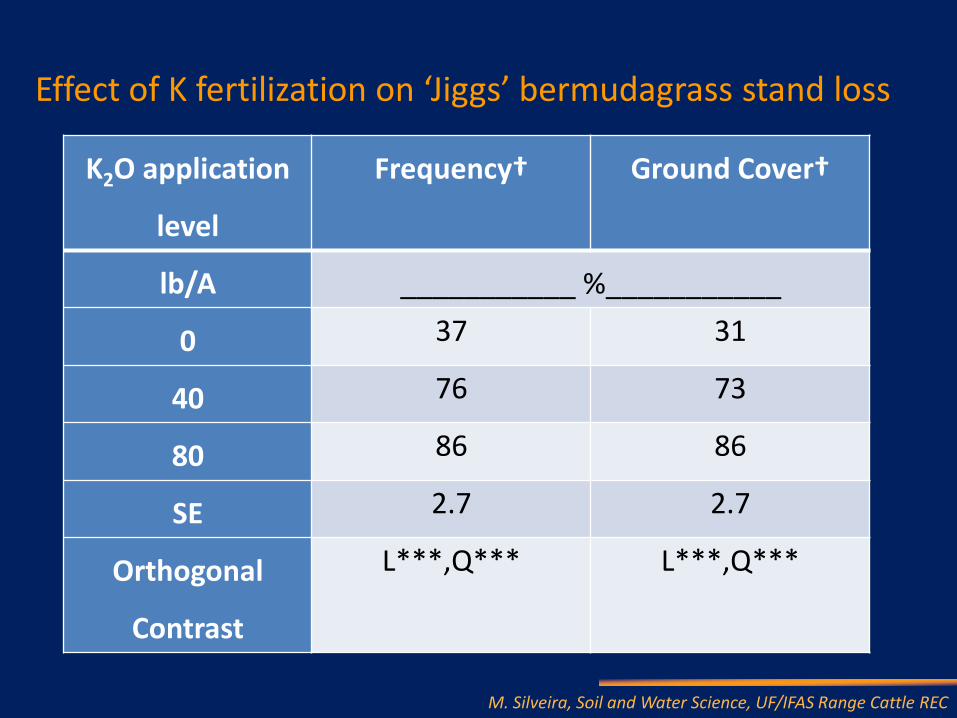
Effect of K fertilization on ‘Jiggs’ bermudagrass stand loss
M. Silveira, Soil and Water Science, UF/IFAS Range Cattle REC
K2O application
level
Frequency† Ground Cover†
lb/A ___________ %___________
0 37 31
40 76 73
80 86 86
SE 2.7 2.7
Orthogonal
Contrast
L***,Q*** L***,Q***

Jiggs – May 5, 2014

Jiggs – May 5, 2014
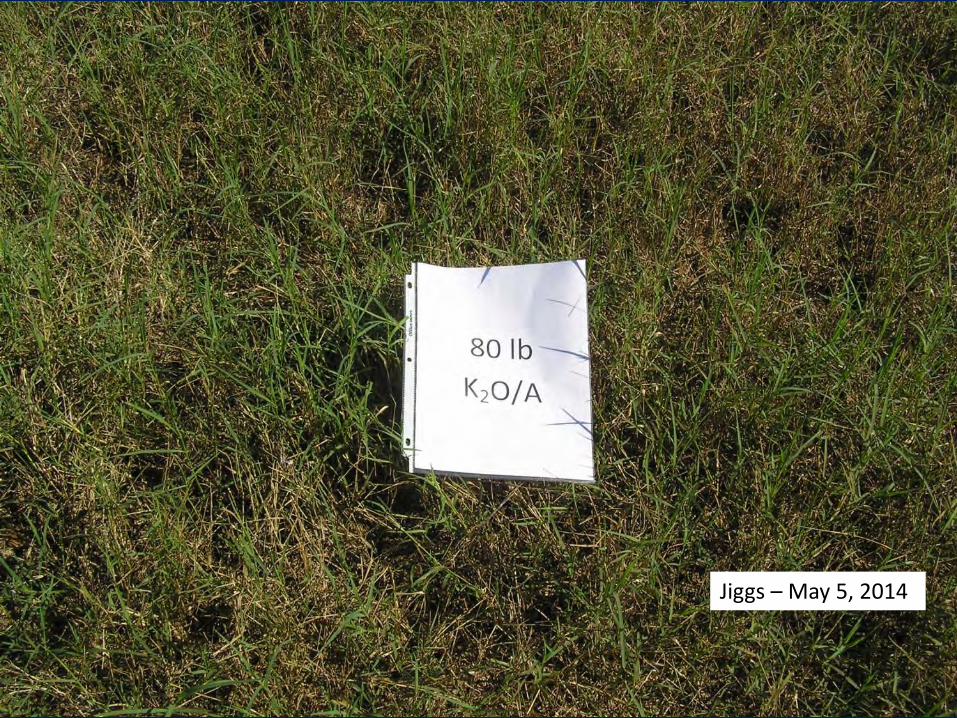
Jiggs – May 5, 2014
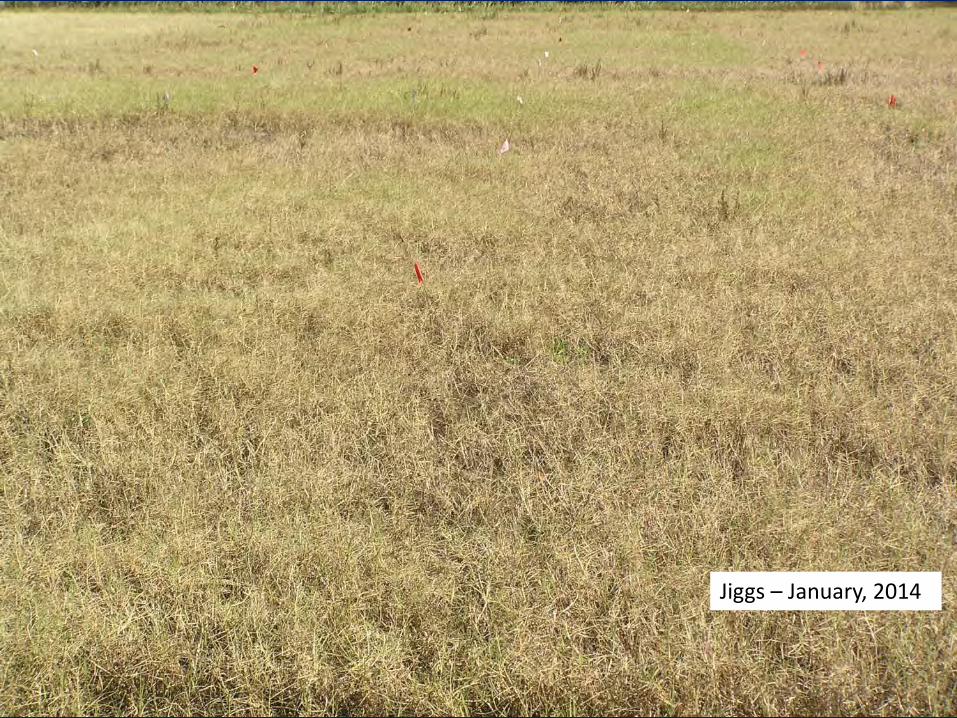
Jiggs – January, 2014
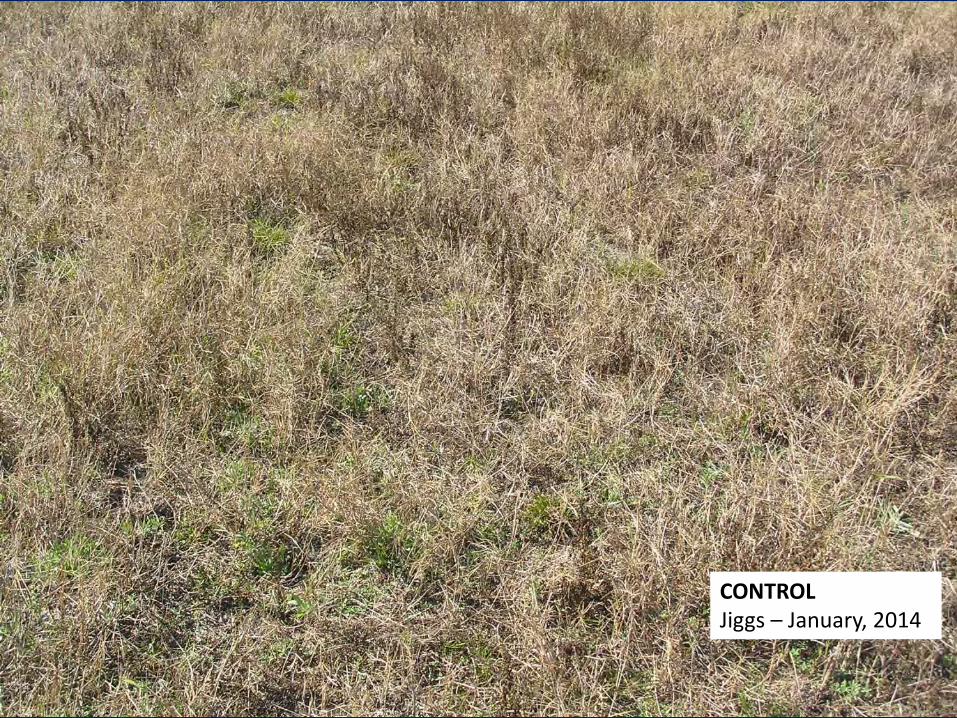
CONTROL Jiggs – January, 2014

80 lb K2O/A Jiggs – January, 2014

Effect of K fertilization on limpograss production
Annual K2O level
2012 2013
lb A-1 _____ lb A-1_____ 0 6204 4189
40 5508 4921 80 6068 5798
Orthogonal contrast
NS L***
M. Silveira, Soil and Water Science, UF/IFAS Range Cattle REC

Effect of K fertilization on limpograss stand loss
M. Silveira, Soil and Water Science, UF/IFAS Range Cattle REC
K2O application
level
Frequency† Ground Cover†
lb/A ___________ %___________
0 91 82
40 92 87
80 94 89
SE 1.2 1.4
Orthogonal
Contrast
L** L***
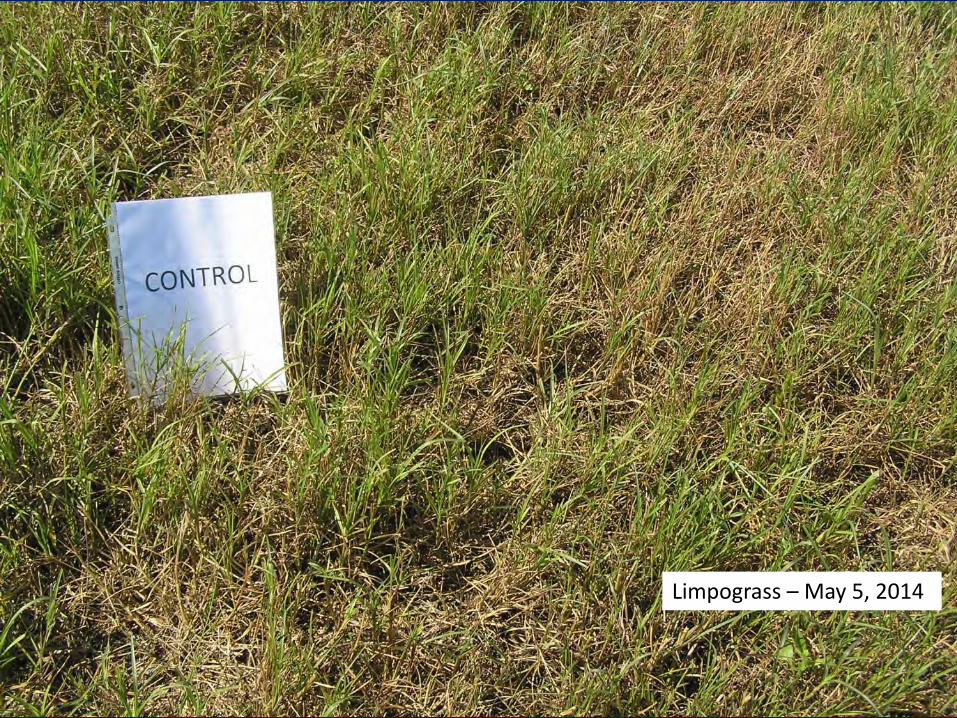
Limpograss – May 5, 2014

Limpograss – May 5, 2014

Limpograss – May 5, 2014
