marine geology, oceanography and physical processes... · table 8.10 marine geology, oceanography...
TRANSCRIPT

Norfolk Vanguard Offshore Wind Farm
Chapter 8 Marine Geology, Oceanography and Physical Processes Environmental Statement Volume 1 Applicant: Norfolk Vanguard Limited Document Reference: 6.1.8 RHDHV Reference: PB4476-005-008 Pursuant to: APFP Regulation 5(2)(a) Date: June 2018 Revision: Version 1 Author: Royal HaskoningDHV Photo: Kentish Flats Offshore Wind Farm

Environmental Statement Norfolk Vanguard Offshore Wind Farm PB4476-005-008 Page i
Environmental Impact Assessment Environmental Statement Document Reference: PB4476-005-008 June 2018
For and on behalf of Norfolk Vanguard Limited Approved by: Ruari Lean, Rebecca Sherwood
Signed: Date: 8th June 2018
For and on behalf of Royal HaskoningDHV Drafted by: David Brew and Courtney Clemence Approved by: Alistair Davison
Signed: Date: 23rd May 2018

June 2018 Norfolk Vanguard Offshore Wind Farm PB4476-005-008 Page ii
Date Issue
No.
Remarks / Reason for Issue Author Checked Approved
23/03/2018 01D First draft for Norfolk Vanguard Limited review DB/CC GK PP
20/04/2018 02D Second draft for Norfolk Vanguard Limited review DB/CC GK AD
23/05/2018 01F Final for ES submission DB GK AD
June 2018 Norfolk Vanguard Offshore Wind Farm PB4476-005-008 Page iii
Table of Contents
8 Marine Geology, Oceanography and Physical Processes ........................................... 1
Introduction ........................................................................................................... 1 8.1
Legislation, Guidance and Policy ............................................................................. 2 8.2
Consultation ........................................................................................................... 6 8.3
Assessment Methodology ..................................................................................... 19 8.4
Scope ................................................................................................................... 24 8.5
Existing Environment ............................................................................................ 27 8.6
Potential Impacts and Effects ................................................................................ 42 8.7
Cumulative Impacts ............................................................................................ 112 8.8
Inter-relationships .............................................................................................. 118 8.9
Interactions ........................................................................................................ 119 8.10
Summary ............................................................................................................ 122 8.11
References ......................................................................................................... 135 8.12

June 2018 Norfolk Vanguard Offshore Wind Farm PB4476-005-008 Page iv
Tables
Table 8.1 NPS assessment requirements 2
Table 8.2 Consultation responses 6
Table 8.3 Definitions of sensitivity levels for a morphological receptor 21
Table 8.4 Definitions of the different value levels for a morphological receptor 22
Table 8.5 Definitions of magnitude of effect levels for marine geology, oceanography and
physical processes 22
Table 8.6 Impact significance matrix 23
Table 8.7 Impact significance definitions 23
Table 8.8 Data sources 26
Table 8.9 Geological formations present under the Norfolk Vanguard West site (Fugro, 2016)
30
Table 8.10 Marine geology, oceanography and physical processes receptors relevant to
Norfolk Vanguard 42
Table 8.11 Comparison of design and marine physical processes parameters at East Anglia
ONE, NV East and NV West 46
Table 8.12 Indicative Norfolk Vanguard construction programme – single phase 53
Table 8.13 Indicative Norfolk Vanguard construction programme – two phases 53
Table 8.14 Parameters for pre-sweeping activity for the offshore export cables 54
Table 8.15 Summary of worst case scenarios for Norfolk Vanguard 60
Table 8.16 Magnitude of effect on suspended sediment concentrations due to foundation
installation under the worst case scenario 73
Table 8.17 Magnitude of effect on suspended sediment concentrations due to foundation
installation under the worst case scenario 76
Table 8.18 Magnitude of effects on seabed level changes due to sediment deposition
following foundation installation under the worst case sediment dispersal scenario 78
Table 8.19 Magnitude of effects on seabed level changes due to sediment deposition
following foundation installation under the worst case sediment dispersal scenario 82
Table 8.20 Magnitude of effects on seabed level changes due to sediment deposition
following the worst case sediment mound scenario 82
Table 8.21 Magnitude of effect on suspended sediment concentrations due to offshore
cable installation (including any sand wave levelling and landfall construction activities)
under the worst case scenario 85
Table 8.22 Magnitude of effect on seabed level changes due to disposed sediments from
sand wave levelling under the worst case scenario 88
Table 8.23 Sensitivity and value assessment of Haisborough, Hammond and Winterton SAC
88
Table 8.24 Magnitude of effect on bedload sediment transport due to sand wave levelling
under the worst case scenario 90
Table 8.25 Sensitivity and value assessment of Haisborough, Hammond and Winterton SAC
90

June 2018 Norfolk Vanguard Offshore Wind Farm PB4476-005-008 Page v
Table 8.26 Magnitude of effect on seabed level changes due to offshore cable installation
under the worst case scenario 92
Table 8.27 Sensitivity and value assessment of Haisborough, Hammond and Winterton SAC
and Cromer Shoal Chalk Beds MCZ 93
Table 8.28 Magnitude of effect on suspended sediment concentrations due to array cable
and interconnector cable installation (including sandwave levelling) under the worst case
scenario 95
Table 8.29 Magnitude of effect on seabed level changes due to array cable and
interconnector cable installation (including sandwave levelling) under the worst case
scenario 97
Table 8.30 Magnitude of effect on seabed level changes due to installation vessels under the
worst case scenario 98
Table 8.31 Magnitude of effect on tidal currents due to the presence of foundations under
the worst case scenario 100
Table 8.32 Likely wind turbine arrangements for the worst case scenario 102
Table 8.33 Magnitude of effect on the wave regime due to the presence of foundations
under the worst case scenario 102
Table 8.34 Magnitude of effect on the sediment transport regime due to the presence of
foundations under the worst case scenario 103
Table 8.35 Magnitude of effect on sea bed morphology due to the presence of foundations
and scour protection under the worst case scenario 104
Table 8.36 Magnitude of effect on seabed morphology and sediment transport due to cable
protection measures for array cables and interconnector cables under the worst case
scenario 106
Table 8.37 Magnitude of effect on seabed morphology and sediment transport due to cable
protection measures for offshore cables under the worst case scenario 108
Table 8.38 Magnitude of effect on cliff erosion due to cable operation under the worst case
scenario 108
Table 8.39 Sensitivity and value assessment for the East Anglian coast 108
Table 8.40 Magnitude of effect on the seabed due to maintenance vessels under the worst
case scenario 110
Table 8.41 Sensitivity and value assessment of Haisborough, Hammond and Winterton SAC
111
Table 8.42 Potential cumulative impacts 113
Table 8.43 Summary of projects considered for the CIA in relation to the topic 116
Table 8.44 Chapter topic inter-relationships 119
Table 8.45 Potential impacts identified for marine geology, oceanography and physical
processes 123

June 2018 Norfolk Vanguard Offshore Wind Farm PB4476-005-008 Page vi
Plates
Plate 8.1 Schematic representation of the shallow geology of NV West (Fugro, 2016) ......... 30
Plate 8.2 Shallow geology of the eastern sub-section of the offshore cable corridor (Fugro,
2017a) ...................................................................................................................................... 31
Diagrams
Diagram 8.1 Time series of current velocity measured by the AWAC in NV East between
December 2012 and December 2013 ...................................................................................... 33
Diagram 8.2 Near sea surface current rose measured in NV East between December 2012
and December 2013 ................................................................................................................. 33
Diagram 8.3 Wave rose measured in NV East between December 2012 and December 2013
.................................................................................................................................................. 34
Diagram 8.4 Time series of wave heights measured by the AWAC in NV East between
December 2012 and December 2013 ...................................................................................... 35
Diagram 8.5 Time series of suspended sediment concentrations measured at the AWAC
station in NV East between December 2012 and December 2013 ......................................... 39
Figures (Volume 2)
Figure 8.1 Bathymetry of NV West
Figure 8.2 Regional bathymetry
Figure 8.3 Bathymetry of NV East
Figure 8.4 Bathymetry of the Norfolk Vanguard offshore cable corridor
Figure 8.5 Position of the amphidromic point and co-tidal lines relative to the position of NV
West and NV East
Figure 8.6 Regional current roses
Figure 8.7 Baseline spring tidal flows modelled as part of the East Anglia ZEA
Figure 8.8 Regional wave observations
Figure 8.9 Location of seabed sediment samples in NV West and NV East
Figure 8.10 Location of seabed sediment samples along the offshore cable corridor
Figure 8.11 Regional sediment transport pathways in the vicinity of Norfolk Vanguard
(Kenyon and Cooper, 2005)
Figure 8.12 Marine physical processes receptors relevant to Norfolk Vanguard
Figure 8.13 Location of sand waves along the Norfolk Vanguard offshore cable corridor
Figure 8.14 Zones of potential influence in the tidal regimes for NV West and NV East
Figure 8.15 Zones of potential influence on the wave regimes for NV West and NV East
Figure 8.16 Zones of potential influence in the tidal regimes for Norfolk Vanguard and East
Anglia THREE
Figure 8.17 Zones of potential influence on the wave regimes for Norfolk Vanguard and East
Anglia THREE

June 2018 Norfolk Vanguard Offshore Wind Farm PB4476-005-008 Page vii
Appendices (Volume 3)
Appendix 8.1 Particle Size Characteristics

June 2018 Norfolk Vanguard Offshore Wind Farm PB4476-005-008 Page viii
Glossary 3D Three Dimensional
ADCP Acoustic Doppler Current Profiler
AWAC Acoustic Wave and Current Meter
BGS British Geological Society
CIA Cumulative Impact Assessment
cSAC Candidate Special Area of Conservation
CPT Cone Penetration Test
CWS County Wildlife Site
DCO Development Consent Order
DWR Directional Waverider Buoy
EIA Environmental Impact Assessment
EPP Evidence Plan Process
ES Environmental Statement
GBS Gravity Base Structure
GMSL Global Mean Sea Level
HDD Horizontal Directional Drilling
IPMP In Principle Monitoring Plan
km Kilometre
km2 Kilometre Squared
LAT Lowest Astronomical Tide (CD)
m Metre
m2 Metre Squared
m3 Metre Cubed
m/s Metres Per Second
MAREA Marine Aggregate Regional Environmental Assessment
MCZ Marine Conservation Zone
MESL Marine Ecological Surveys Limited
mg/l Milligrams Per Litre
mm Millimetre
MMO Marine Management Organisation
MPS Marine Policy Statement
MW Megawatt
NPS National Policy Statements
NSIP Nationally Significant Infrastructure Projects
NV Norfolk Vanguard
NV East Norfolk Vanguard East
NV West Norfolk Vanguard West
OD Ordnance Datum
O&M Operation and Maintenance
OWF Offshore Wind Farm
PEIR Preliminary Environmental Information Report
PEMP Project Environmental Management Plan
s Second (unit of time)
SAC Special Area of Conservation
SMP Shoreline Management Plan
SCI Site of Community Importance

June 2018 Norfolk Vanguard Offshore Wind Farm PB4476-005-008 Page ix
SPA Special Protection Area
S-P-R Source-Pathway-Receptor conceptual model
SSC Suspended Sediment Concentration
SSSI Site of Special Scientific Interest
UK United Kingdom of Great Britain and Northern Ireland
UKCP09 United Kingdom Climate Projections 2009
ZEA Zone Environmental Appraisal
Terminology Accretion The addition of newly deposited sediment vertically and/or horizontally
Amphidromic point The centre of an amphidromic system; a nodal point around which a standing-wave crest rotates once each tidal period
Array cables Cables which link the wind turbine generators and the offshore electrical platform.
Astronomical tide The predicted tide levels and character that would result from the gravitational effects of the earth sun and moon without any atmospheric influences
Bathymetry Topography of the sea floor
Beach A deposit of non-cohesive material (e.g. sand, gravel) situated on the interface between dry land and the sea (or other large expanse of water) and actively ‘worked’ by present-day hydrodynamic processes (i.e. waves, tides and currents) and sometimes by winds
Bedforms Features on the sea bed (e.g. sand waves, ripples) resulting from the movement of sediment over it
Bedload Sediment particles that travel near or on the bed
Clay Fine-grained sediment with a typical particle size of less than 0.002 mm
Climate change Refers to any long-term trend in mean sea level, wave height, wind speed etc.
Closure depth The depth that represents the ‘seaward limit of significant depth change’, but is not an absolute boundary across which there is no cross-shore sediment transport
Coastal processes Collective term covering the action of natural forces on the shoreline and nearshore sea bed
Cohesive sediment Sediment containing a significant proportion of clays, the electromagnetic properties of which causes the particles to bind together
Crest Highest point on a bedform or wave
Cross-shore Perpendicular to the shoreline. Also referred to as shore normal
Current Flow of water generated by a variety of forcing mechanisms (e.g. waves, tides, wind)
Ebb tide The falling tide, immediately following the period of high water and preceding the period of low water
Episodic Composed of a series of discrete events rather than as a continual process
Erosion Wearing away of the land or sea bed by natural forces (e.g. wind, waves, currents, chemical weathering)
Flood tide The rising tide, immediately following the period of low water and preceding the period of high water
Foreshore A morphological term for the lower shore zone/area on the beach that lies between mean low and high water
Glacial till Poorly-sorted, non-stratified and unconsolidated sediment carried or deposited by a glacier
June 2018 Norfolk Vanguard Offshore Wind Farm PB4476-005-008 Page x
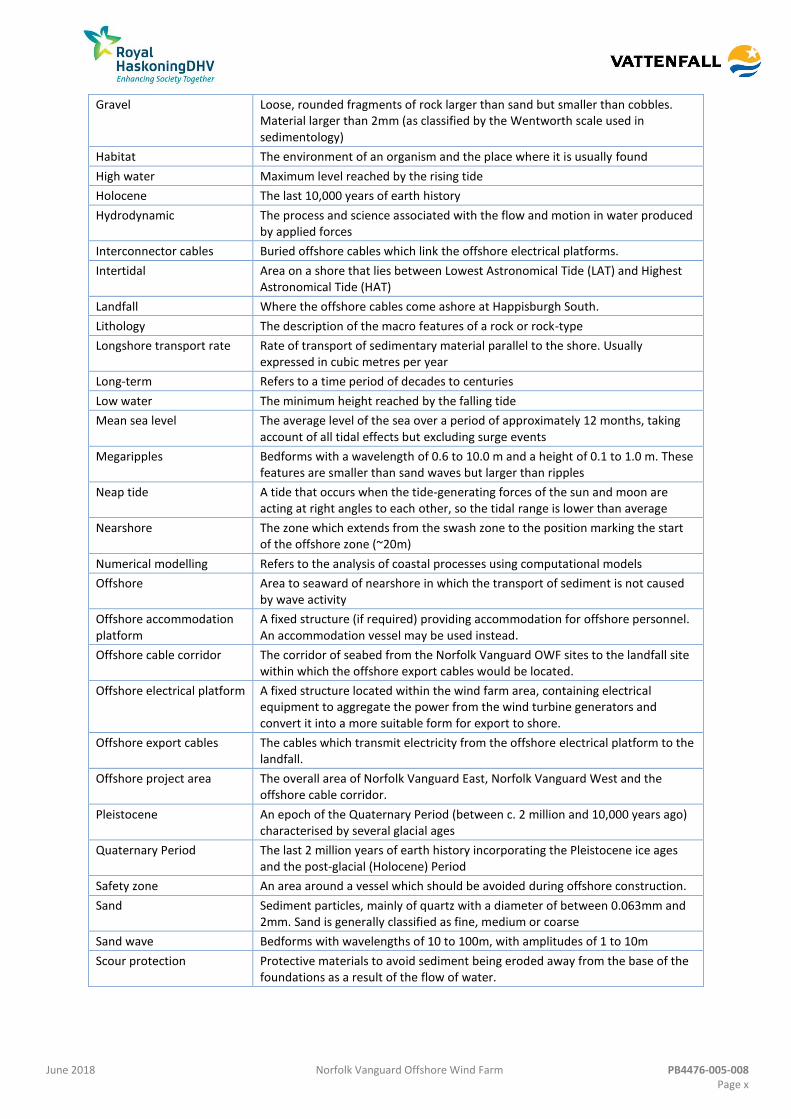
Gravel Loose, rounded fragments of rock larger than sand but smaller than cobbles. Material larger than 2mm (as classified by the Wentworth scale used in sedimentology)
Habitat The environment of an organism and the place where it is usually found
High water Maximum level reached by the rising tide
Holocene The last 10,000 years of earth history
Hydrodynamic The process and science associated with the flow and motion in water produced by applied forces
Interconnector cables Buried offshore cables which link the offshore electrical platforms.
Intertidal Area on a shore that lies between Lowest Astronomical Tide (LAT) and Highest Astronomical Tide (HAT)
Landfall Where the offshore cables come ashore at Happisburgh South.
Lithology The description of the macro features of a rock or rock-type
Longshore transport rate Rate of transport of sedimentary material parallel to the shore. Usually expressed in cubic metres per year
Long-term Refers to a time period of decades to centuries
Low water The minimum height reached by the falling tide
Mean sea level The average level of the sea over a period of approximately 12 months, taking account of all tidal effects but excluding surge events
Megaripples Bedforms with a wavelength of 0.6 to 10.0 m and a height of 0.1 to 1.0 m. These features are smaller than sand waves but larger than ripples
Neap tide A tide that occurs when the tide-generating forces of the sun and moon are acting at right angles to each other, so the tidal range is lower than average
Nearshore The zone which extends from the swash zone to the position marking the start of the offshore zone (~20m)
Numerical modelling Refers to the analysis of coastal processes using computational models
Offshore Area to seaward of nearshore in which the transport of sediment is not caused by wave activity
Offshore accommodation platform
A fixed structure (if required) providing accommodation for offshore personnel. An accommodation vessel may be used instead.
Offshore cable corridor The corridor of seabed from the Norfolk Vanguard OWF sites to the landfall site within which the offshore export cables would be located.
Offshore electrical platform A fixed structure located within the wind farm area, containing electrical equipment to aggregate the power from the wind turbine generators and convert it into a more suitable form for export to shore.
Offshore export cables The cables which transmit electricity from the offshore electrical platform to the landfall.
Offshore project area The overall area of Norfolk Vanguard East, Norfolk Vanguard West and the offshore cable corridor.
Pleistocene An epoch of the Quaternary Period (between c. 2 million and 10,000 years ago) characterised by several glacial ages
Quaternary Period The last 2 million years of earth history incorporating the Pleistocene ice ages and the post-glacial (Holocene) Period
Safety zone An area around a vessel which should be avoided during offshore construction.
Sand Sediment particles, mainly of quartz with a diameter of between 0.063mm and 2mm. Sand is generally classified as fine, medium or coarse
Sand wave Bedforms with wavelengths of 10 to 100m, with amplitudes of 1 to 10m
Scour protection Protective materials to avoid sediment being eroded away from the base of the foundations as a result of the flow of water.
June 2018 Norfolk Vanguard Offshore Wind Farm PB4476-005-008 Page xi
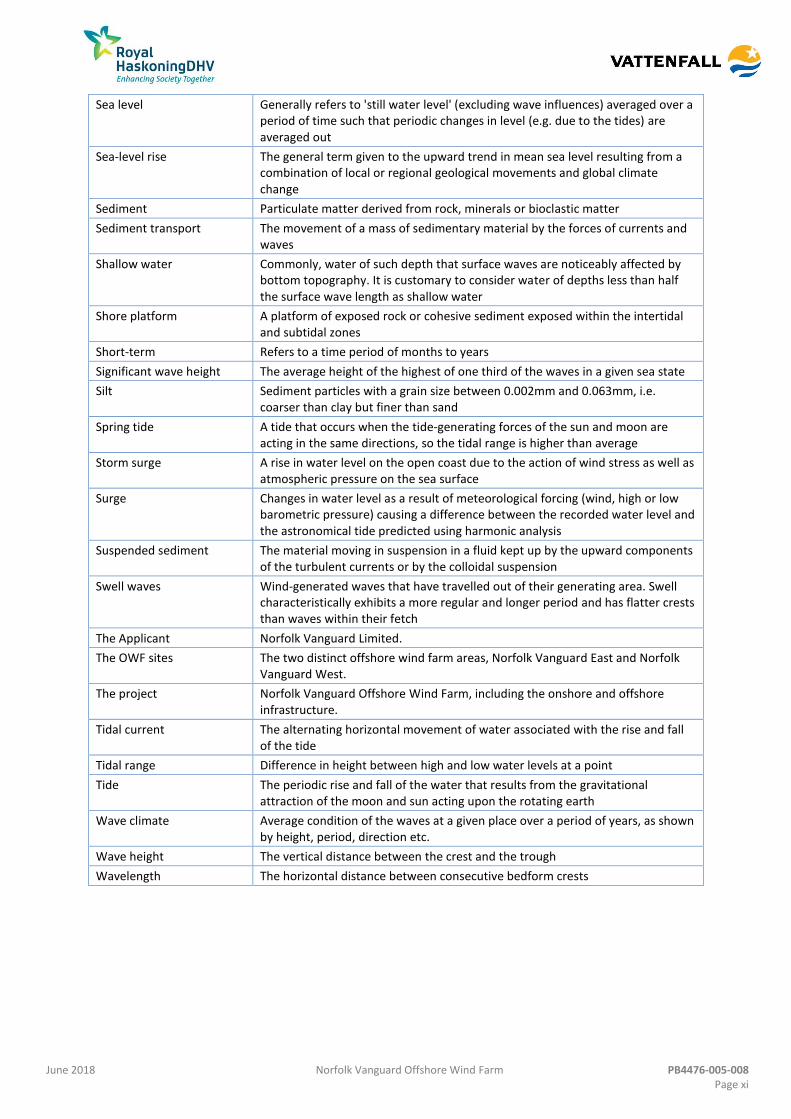
Sea level Generally refers to 'still water level' (excluding wave influences) averaged over a period of time such that periodic changes in level (e.g. due to the tides) are averaged out
Sea-level rise The general term given to the upward trend in mean sea level resulting from a combination of local or regional geological movements and global climate change
Sediment Particulate matter derived from rock, minerals or bioclastic matter
Sediment transport The movement of a mass of sedimentary material by the forces of currents and waves
Shallow water Commonly, water of such depth that surface waves are noticeably affected by bottom topography. It is customary to consider water of depths less than half the surface wave length as shallow water
Shore platform A platform of exposed rock or cohesive sediment exposed within the intertidal and subtidal zones
Short-term Refers to a time period of months to years
Significant wave height The average height of the highest of one third of the waves in a given sea state
Silt Sediment particles with a grain size between 0.002mm and 0.063mm, i.e. coarser than clay but finer than sand
Spring tide A tide that occurs when the tide-generating forces of the sun and moon are acting in the same directions, so the tidal range is higher than average
Storm surge A rise in water level on the open coast due to the action of wind stress as well as atmospheric pressure on the sea surface
Surge Changes in water level as a result of meteorological forcing (wind, high or low barometric pressure) causing a difference between the recorded water level and the astronomical tide predicted using harmonic analysis
Suspended sediment The material moving in suspension in a fluid kept up by the upward components of the turbulent currents or by the colloidal suspension
Swell waves Wind-generated waves that have travelled out of their generating area. Swell characteristically exhibits a more regular and longer period and has flatter crests than waves within their fetch
The Applicant Norfolk Vanguard Limited.
The OWF sites The two distinct offshore wind farm areas, Norfolk Vanguard East and Norfolk Vanguard West.
The project Norfolk Vanguard Offshore Wind Farm, including the onshore and offshore infrastructure.
Tidal current The alternating horizontal movement of water associated with the rise and fall of the tide
Tidal range Difference in height between high and low water levels at a point
Tide The periodic rise and fall of the water that results from the gravitational attraction of the moon and sun acting upon the rotating earth
Wave climate Average condition of the waves at a given place over a period of years, as shown by height, period, direction etc.
Wave height The vertical distance between the crest and the trough
Wavelength The horizontal distance between consecutive bedform crests
June 2018 Norfolk Vanguard Offshore Wind Farm PB4476-005-008 Page 1
8 MARINE GEOLOGY, OCEANOGRAPHY AND PHYSICAL PROCESSES
Introduction 8.1
This chapter of the Environmental Statement (ES) describes the marine physical 1.
environment of the Norfolk Vanguard Offshore Wind Farm (OWF) (herein ‘the
project’ or ‘Norfolk Vanguard’).
Norfolk Vanguard comprises two distinct areas, Norfolk Vanguard West (NV West) 2.
and Norfolk Vanguard East (NV East) (“the OWF sites”) as well as the offshore cable
corridor from the OWF sites to the landfall at Happisburgh South.
This chapter provides a summary description of key aspects relating to existing 3.
marine geology, oceanography and physical processes followed by an assessment of
the magnitude and significance of the effects upon the baseline conditions resulting
from the construction, operation and decommissioning of the project, as well as
those effects resulting from cumulative interactions with other existing or planned
projects.
This chapter of the ES was written by Royal HaskoningDHV marine geology, 4.
oceanography and physical processes specialists, and incorporates survey data
collected by Fugro and Marine Ecological Surveys Limited (MESL). In addition,
ABPmer has undertaken a Sand Wave Study (Appendix 7.1 of the Information to
Support HRA report, document reference 5.3) in relation to cable installation
activities in the Haisborough, Hammond and Winterton SAC which has informed the
impact assessments in this chapter.
The assessment process has been informed by the following: 5.
Interpretation of survey data specifically collected for the project including
bathymetry, geophysical, geotechnical, environmental and metocean;
Interpretation of survey data collected for the previous East Anglia FOUR
project (located in a similar position to Norfolk Vanguard East);
Consideration of the existing evidence base regarding the effects of offshore
wind farm developments on the physical environment;
Appendix 7.1 of the Information to Support HRA report (document reference
5.3) provides a sand wave study by APBmer, assessing potential impacts of
cable installation activities on the Annex 1 Sandbanks features of the
Haisborough, Hammond and Winterton SAC;
Cross-reference to previous detailed numerical modelling studies undertaken
for both the East Anglia Zone Environmental Appraisal (ZEA) and the ES of East
Anglia ONE and desk-based assessments undertaken for the ES of East Anglia
THREE;
Discussion and agreement with key stakeholders; and
June 2018 Norfolk Vanguard Offshore Wind Farm PB4476-005-008 Page 2
Application of expert-based assessment and judgement by Royal
HaskoningDHV.
The potential effects on marine geology, oceanography and physical processes have 6.
been assessed conservatively using realistic ‘worst case’ scenarios for the project.
All figures referred to in this chapter are provided in Volume 2 of the ES. 7.
Legislation, Guidance and Policy 8.2
The assessment of potential effects has been made with specific reference to the 8.
relevant National Policy Statements (NPS) (discussed further in Chapter 3, Policy and
Legislative Context). These are the principal decision-making documents for
Nationally Significant Infrastructure Projects (NSIP). Those relevant to marine
geology, oceanography and physical processes are:
Overarching NPS for Energy (EN-1) (July 2011); and
NPS for Renewable Energy Infrastructure (EN-3) (July 2011).
Relevant aspects of EN-1 and EN-3 are presented below in Table 8.1. This chapter of 9.
the ES either directly addresses these issues or provides information which enables
these issues to be directly addressed in other, more relevant chapters, most notably
Chapter 9 Marine Water and Sediment Quality, Chapter 10 Benthic and Intertidal
Ecology, Chapter 11 Fish and Shellfish Ecology, Chapter 14 Commercial Fisheries, and
Chapter 17 Offshore and Intertidal Archaeology and Cultural Heritage.
Table 8.1 NPS assessment requirements
NPS Requirement NPS Reference ES Reference
EN-1 NPS for Energy (EN-1)
‘where relevant, applicants should undertake
coastal geomorphological and sediment transfer
modelling to predict and understand impacts and
help identify relevant mitigating or compensatory
measures’
Section 5.5, paragraph 5.5.6
The approach adopted in this ES
is a conceptual model based on
expert judgement.
‘the ES should include an assessment of the
effects on the coast. In particular, applicants
should assess:
• The impact of the proposed project on
coastal processes and geomorphology, including
by taking account of potential impacts from
climate change. If the development will have an
impact on coastal processes the applicant must
demonstrate how the impacts will be managed to
minimise adverse impacts on other parts of the
coast.
• The implications of the proposed project
on strategies for managing the coast as set out in
Section 5.5,
paragraph 5.5.7
The assessment of potential
construction and operation and
maintenance impacts are
described in sections 8.7.7.5 and
8.7.8.6, respectively.
The project will not affect the
Shoreline Management Plan and
allowance has been made for
natural erosion during the project
design. Embedded mitigation to
minimise potential impacts at the
coast of cable installation and
operation are described in section

June 2018 Norfolk Vanguard Offshore Wind Farm PB4476-005-008 Page 3
NPS Requirement NPS Reference ES Reference
Shoreline Management Plans (SMPs) … and any
relevant Marine Plans (Objective 10 of the East
Inshore and East Offshore Marine Plans is “To
ensure integration with other plans, and in the
regulation and management of key activities and
issues, in the East Marine Plans, and adjacent
areas” this therefore refers back to the objectives
of the SMPs)… and capital programmes for
maintaining flood and coastal defences.
• The effects of the proposed project on
marine ecology, biodiversity and protected sites.
• The effects of the proposed project on
maintaining coastal recreation sites and features.
• The vulnerability of the proposed
development to coastal change, taking account of
climate change, during the project’s operational
life and any decommissioning period.’
8.7.4.
‘the applicant should be particularly careful to
identify any effects of physical changes on the
integrity and special features of Marine
Conservation Zones, candidate marine Special
Areas of Conservation (SACs), coastal SACs and
candidate coastal SACs, coastal Special Protection
Areas (SPAs) and potential SCIs and Sites of
Special Scientific Interest (SSSI).’
Section 5.5,
paragraph 5.5.9
The potential receptors to
morphological change are
considered to be Haisborough,
Hammond and Winterton SAC,
North Norfolk Sandbanks and
Saturn Reef cSAC/SCI, Cromer
Shoal Chalk Beds MCZ and the
East Anglian coast. The potential
to affect their integrity is assessed
with respect to changes in seabed
level caused by foundation and
cable installation (sections
8.7.7.3, 8.7.6.4, 8.7.7.6 and
8.7.7.10) and interruption to
bedload sediment transport by
sand wave levelling for cable
installation (section 8.7.7.7).
NPS for Renewable Energy Infrastructure (EN-3)
‘The assessment should include predictions of
physical effect that will result from the
construction and operation of the required
infrastructure and include effects such as the
scouring that may result from the proposed
development.’
Section 2.6,
paragraph 2.6.193
and 2.6.194
Each of the impacts in section 8.7
cover the potential magnitude
and significance of the physical
(waves, tides and sediments)
effects upon the baseline
conditions resulting from the
construction and operation of
Norfolk Vanguard. Scour
resulting from the proposed
development is not assessed
because scour protection will be
used, reducing sediment release
to negligible quantities.
‘where necessary, assessment of the effects on Section 2.6, See above for scour. The
June 2018 Norfolk Vanguard Offshore Wind Farm PB4476-005-008 Page 4
NPS Requirement NPS Reference ES Reference
the subtidal environment should include:
• Loss of habitat due to foundation type
including associated seabed preparation,
predicted scour, scour protection and altered
sedimentary processes.
• Environmental appraisal of inter-array
and cable routes and installation methods.
• Habitat disturbance from construction
vessels extendible legs and anchors.
• Increased suspended sediment loads
during construction.
• Predicted rates at which the subtidal
zone might recover from temporary effects.’
paragraph 2.6.113 quantification and potential
impact of seabed loss due to the
footprints of the project
infrastructure is covered in
section 8.7.8.4. A worst case
scenario of all foundations having
scour protection is considered in
order to provide a conservative
assessment.
The worst case scenario cable-
laying technique is considered to
be jetting and is considered as
such in all the cable construction
assessments.
The disturbance to the subtidal
seabed caused by indentations
due to installation vessels is
assessed in section 8.7.7.11.
The potential increase in
suspended sediment
concentrations and change in
seabed level is assessed in
sections 8.7.6.2 and 8.7.6.6 to
8.7.6.7.
The recoverability of receptors is
assessed for all the relevant
impacts, particularly those
related to changes in seabed level
due to export cable installation
(section 8.7.7.6), interruptions to
bedload sediment transport due
to sand wave levelling in the
offshore cable corridor (section
8.7.7.7) and morphological and
sediment transport effects due to
cable protection measures for
offshore cables (section 8.7.8.6).
‘an assessment of the effects of installing cable
across the intertidal zone should include
information, where relevant, about:
• Any alternative landfall sites that have
been considered by the applicant during the
design phase and an explanation of the final
choice.
• Any alternative cable installation
methods that have been considered by the
applicant during the design phase and an
explanation of the final choice.
• Potential loss of habitat.
Section 2.6,
paragraph 2.6.81
Landfall Site Selection and
Assessment of Alternatives is
provided in Chapter 4.
A range of cable installation
methods are required and these
are detailed in Chapter 5 Project
Description. The worst case
scenario for marine geology,
oceanography and physical
processes is provided in section
8.7.6.
Potential habitat loss in the
intertidal zone is covered in
June 2018 Norfolk Vanguard Offshore Wind Farm PB4476-005-008 Page 5
NPS Requirement NPS Reference ES Reference
• Disturbance during cable installation and
removal (decommissioning).
• Increased suspended sediment loads in
the intertidal zone during installation.
• Predicted rates at which the intertidal
zone might recover from temporary effects.’
Chapter 10 Benthic and Intertidal
Ecology.
Assessment of the potential
disturbance and increased
suspended sediment
concentrations in the nearshore
(including the intertidal zone) due
to cable installation is provided in
sections 8.7.7.6 and 8.7.8.6.
The recoverability of the coastal
receptor (East Anglia coastline) is
assessed for morphological and
sediment transport effects due to
cable protection measures at the
coast (section 8.7.8.6).
The Marine Policy Statement (MPS, HM Government, 2011; discussed further in 10.
Chapter 3, Policy and Legislative Context) provides the high-level approach to marine
planning and general principles for decision making that contribute to achieving this
vision. It also sets out the framework for environmental, social and economic
considerations that need to be taken into account in marine planning. With regard to
the topics covered by this chapter the key reference is in section 2.6.8.6 of the MPS
which states
“…Marine plan authorities should not consider development which may affect
areas at high risk and probability of coastal change unless the impacts upon it
can be managed. Marine plan authorities should seek to minimise and mitigate
any geomorphological changes that an activity or development will have on
coastal processes, including sediment movement.”
The MPS is also the framework for preparing individual Marine Plans and taking 11.
decisions affecting the marine environment. England currently has nine marine
plans; those relevant to Norfolk Vanguard are the East Inshore and the East Offshore
Marine Plans (HM Government, 2014; discussed further in Chapter 3, Policy and
Legislative Context). Objective 6 “To have a healthy, resilient and adaptable marine
ecosystem in the East Marine Plan areas” is of relevance to this Chapter as this
covers policies and commitments on the wider ecosystem, set out in the MPS
including those to do with the Marine Strategy Framework Directive and the Water
Framework Directive (see Chapter 3 Policy and Legislative Context), as well as other
environmental, social and economic considerations. Elements of the ecosystem
considered by this objective include “coastal processes and the hydrological and
geomorphological processes in water bodies and how these support ecological
features”.

June 2018 Norfolk Vanguard Offshore Wind Farm PB4476-005-008 Page 6
In addition to NPS, MPS and East Inshore and East Offshore Marine Plans, guidance 12.
on the generic requirements, including spatial and temporal scales, for physical
processes studies associated with offshore wind farm developments is provided in
seven main documents:
‘Offshore wind farms: guidance note for Environmental Impact Assessment in
respect of Food and Environmental Protection Act (FEPA) and Coast Protection
Act (CPA) requirements: Version 2’ (Cefas, 2004).
‘Coastal Process Modelling for Offshore Wind farm Environmental Impact
Assessment’ (COWRIE, 2009).
‘Review of Cabling Techniques and Environmental Effects applicable to the
Offshore Wind farm Industry’ (BERR, 2008).
‘General advice on assessing potential impacts of and mitigation for human
activities on Marine Conservation Zone (MCZ) features, using existing regulation
and legislation’ (JNCC & Natural England, 2011).
‘Guidelines for data acquisition to support marine environmental assessments
of offshore renewable energy projects’ (Cefas, 2011).
‘East Inshore and East Offshore Marine Plan Areas: Evidence and Issues’ (MMO,
2012).
Consultation 8.3
Consultation is a key part of the Development Consent Order (DCO) application 13.
process. To date, consultation regarding marine geology, oceanography and physical
processes has been conducted through:
Expert Topic Group meetings as part of the Evidence Plan Process (EPP) and
review of documents (e.g. Method Statements and draft chapter);
Scoping Report (Royal HaskoningDHV, 2016); and
Section 42 consultation on the Preliminary Environmental Information Report
(PEIR, Norfolk Vanguard Limited, 2017).
An outline of the project consultation process is presented within Chapter 7 14.
Technical Consultation.
Detailed minutes and logs of the EPP meetings are provided in Appendices 9.16 15.
and25.6 of the Norfolk Vanguard Consultation Report.
Table 8.2 Consultation responses
Consultee Date /Document Comment Response / where addressed in
the ES
Stiffkey Parish
Council
Scoping Opinion
November 2016
Will coastal process modelling be
used and made available to the
public for the proposed wind farm
The approach adopted in this ES is
expert-based assessment and
judgement by Royal
HaskoningDHV including use of the

June 2018 Norfolk Vanguard Offshore Wind Farm PB4476-005-008 Page 7
Consultee Date /Document Comment Response / where addressed in
the ES
development? results of previous numerical
modelling for East Anglia ONE.
Conceptual modelling is being
undertaken only for Norfolk
Vanguard.
Stiffkey Parish
Council
Scoping Opinion November 2016
Impact of onshore locations and
routes both during construction
and then operation and how
these impacts will be addressed /
mitigated on the following:
Compatibility with the Shoreline
Management Plan (SMP) and the
position that the area around
Mundesley/Bacton will be a
managed retreat.
The project is compatible with the
SMP as there will be no impact on
existing or planned coastal
defences.
Secretary of
State
Scoping Opinion
November 2016
Paragraph 304 of the Scoping
Report notes that there is rapid
cliff erosion on the coast of north-
east Norfolk. The ES should
explain how erosion rates have
been taken into account in
determining the depth of cable
burial at the landfall, the depths
of transition pits and the set-back
distance of the cable relay station
from the coastline.
A coastal erosion study (Appendix
4.1) informed the landfall site
selection and design of the
horizontal directional drilling
(HDD) works. This work supports
identification of where the landfall
infrastructure would need to be
located, taking into account
estimates of natural erosion rates
in this area.
Secretary of
State
Scoping Opinion
November 2016
The Scoping Report makes
numerous references to the use
of modelling (both conceptual
and empirical) to undertake the
assessments; however, has not
provided details of these
therefore, the Secretary of State
cannot provide any meaningful
comments at this time. The ES
should provide details of all
models used including any
assumptions and limitations and
how these have been factored in
to the assessment.
The detailed methodology has
been discussed with stakeholders
during the EPP and is outlined in
sections 8.4.1 and 8.7.3
Secretary of
State
Scoping Opinion
November 2016
Scour mitigation measures should
be detailed within the ES; the EIA
should outline a clear justification
for the quantity and area to be
covered, in addition to the total
area of seabed likely to be
covered by hard substrata.
Scour protection is explained in
Chapter 5 Project Description and
taken into account in defining the
worst case scenarios for this
assessment (section 8.7.4).
Secretary of Scoping Opinion The Secretary of State welcomes Noted, these are assessed in

June 2018 Norfolk Vanguard Offshore Wind Farm PB4476-005-008 Page 8
Consultee Date /Document Comment Response / where addressed in
the ES
State November 2016 the consideration of the potential
effects of sedimentary processes
on Haisborough, Hammond and
Winterton SCI.
section 8.7.
Secretary of
State
Scoping Opinion
November 2016
Paragraph 304 of the Scoping
Report notes there is rapid cliff
erosion on the coast of north-east
Norfolk. The potential impacts of
landfall works on coastal
processes, including erosion and
deposition, should be addressed
with appropriate cross reference
to other technical reports
including landscape and visual
impacts. Reference should be
made to the Kelling to Lowestoft
Ness Shoreline Management Plan,
where appropriate.
A coastal erosion study (Appendix
4.1) informed the assessment of
the potential impacts at the
landfall. Section 8.7.7 discusses
this element of the assessment.
Norfolk
County
Council
Scoping Opinion
November 2016
The ES/EIA will need to address
the potential impact on Ecology,
including in particular, impact on
the following interests:
designated sites e.g. Sites of
Special Scientific Interest (SSSI),
National Nature Reserves, Special
Protection Areas (SPA), Special
Area for Conservation (SAC),
County Wildlife Sites (CWS) etc.;
Coastal and sedimentary
processes.
The impacts of changes to marine
physical processes on ecological
features are assessed in Chapter
10 Benthic and Intertidal Ecology
and Chapter 11 Fish and Shellfish.
In addition, changes to these
ecology receptors are assessed in
Chapter 12 Marine Mammals and
Chapter 13 Offshore Ornithology.
Consideration is given to
designated sites, where
appropriate.
MMO Scoping Opinion
November 2016
The scoping report is overall
considered adequate and has
scoped in the correct impacts. The
following points should be noted
and addressed through the EIA.
Wave data presented in the
scoping report is contradictory to
paragraphs 297, 298 and 299.
Wave date or wind-stress in the
form of wave or wind roses are
not used to show the measured
wave climate and proportions of
wave height, periods or directions
across the Vanguard East and
West Sites. Vanguard East is
shallower on the extreme east
flank, where depths may be down
to 15m. Under moderate storm
The bathymetry indicates that in
NV West and NV East, the water
depths are never less than 20m. So
water depths are considered large
enough to limit the effect of wave
action on seabed sediments and
scour

June 2018 Norfolk Vanguard Offshore Wind Farm PB4476-005-008 Page 9
Consultee Date /Document Comment Response / where addressed in
the ES
conditions bed sediments will be
suspended under orbital wave
currents, with a potential to
generate scour. With various
water depths involved the effects
of orbital wave currents and their
potential to create scour in these
shallower locations will need to
be assessed in the ES.
MMO Scoping Opinion
November 2016
Ebb tidal asymmetry, the
existence of sandbanks and a
continuous net flux of bedload
transport through the Vanguard
site has been noted in paragraph
308. Where cable routes cross the
banks, the impact on the banks in
terms of hiatus or disruption to
sediment transport processes will
need to be considered. The ability
to install and maintain cable, the
potential use of cable protection,
and the need for seabed
preparation and the resulting
impacts should also be
considered.
A detailed assessment of the
construction footprint and degree
of coverage is needed to assess
the likely scale and area of impact
of deposition of sediments from
construction activities.
Note: - Should disposal be
required, the Applicant should
engage with the MMO on OSPAR
disposal site characterisation and
sampling requirements.
The impacts associated with the
offshore cable corridor passing
through the Norfolk Bank system
are addressed in the following
sections:
Section 8.7.7.5, section 8.7.7.6 and
section 8.7.7.7 include impacts of
offshore cable installation.
Section 8.7.8.5 - impacts of cable
protection.
The impact of construction on
deposition of sediment from
foundation installation is covered
in section 8.7.7.3 and section
8.7.7.4.
The operational impact of the
direct footprint is considered in
section 8.7.8.4.
Norfolk Vanguard Limited will seek
to designate the Norfolk Vanguard
OWF sites and the section of the
offshore cable corridor that
overlaps the SAC as a disposal site,
subject to agreement from the
MMO.
Cefas EPP Meeting 16th
February 2017
Cefas require more justification
on how similar the sites are to be
able to use analogous studies
from other sites.
This information was outlined in
the draft PEIR chapter provided to
the Expert Topic Group in June
2017 and discussed further at the
subsequent EPP meeting
(05/07/17). Section 8.7.3 of this ES
chapter discusses in detail the
justification for using the
modelling results of East Anglia
ONE as analogies for the potential
effects/impacts of Norfolk
Vanguard

June 2018 Norfolk Vanguard Offshore Wind Farm PB4476-005-008 Page 10
Consultee Date /Document Comment Response / where addressed in
the ES
Cefas EPP Meeting 16th
February 2017
At the EIA stage, some wind farms
have underestimated the volume
of scour protection required
Norfolk Vanguard Limited has
assumed scour protection will be
used at all wind turbines where it
is required, and the assessment
uses 100% of locations as the
worst case scenario.
Cefas EPP Meeting 16th
February 2017
Need to consider secondary effects of scour protection
The Marine Aggregate Regional
Environmental Assessment
(MAREA) could be a helpful
source of information for seabed
characterization, however the
data should be used with caution
given the uncertainty provided for
some bathymetry data e.g. in the
south region of the UK.
Discussed at the subsequent EPP
meeting (05/07/17) and agreed
that this impact does not require
further consideration.
Cefas EPP Meeting 16th
February 2017
Discussion of transboundary impacts
Transboundary impacts have been
scoped out. Tidal ellipses show
that all movement is in a north
south direction so will not be
across the international boundary.
Cefas EPP Meeting 5th
July 2017
Discussion of comments
subsequently provided as written
feedback (06/07/17)
See responses below.
Cefas Written feedback
dated 1st
July
2017 (provided 6th
July 2017) in
response to an
early draft of the
PEIR chapter
dated 21st
June
2017
The draft PEIR repeats throughout
that marine physical process
impacts have been generated by
‘expert-based assessment and
judgement’ (8.1, p1). As there is
no identification of the experts
nor their specific expertise it is
assumed that this refers to ‘the
authors’.
Expert-based assessment and
judgement has been undertaken
by Royal HaskoningDHV. This is
clarified in sections 8.1 and 8.4.
Cefas Written feedback
dated 1st
July
2017 (provided 6th
July 2017) in
response to an
early draft of the
PEIR chapter
dated 21st
June
2017
Paragraph 139 states that the
modelling simulations undertaken
for the East Anglia ONE confirm
the expert-based assessment of
suspended sediment
concentrations arising from
seabed preparation. However it is
not clear that the expert-based
assessment is entirely
independent of this evidence i.e.,
it can’t confirm the opinion if the
opinion has been based on it in
the first place.
The emphasis has been changed to
demonstrate that the East Anglia
ONE modelling was used as part of
the expert-based assessment and
judgement (various sections).

June 2018 Norfolk Vanguard Offshore Wind Farm PB4476-005-008 Page 11
Consultee Date /Document Comment Response / where addressed in
the ES
Cefas Written feedback
dated 1st
July
2017 (provided 6th
July 2017) in
response to an
early draft of the
PEIR chapter
dated 21st
June
2017
The draft section 8.7.4 stated that
minimum turbine separation is
616m to minimise interaction and
wake effects. Table 8.12 defines
near-field effects (of suspended
sediment concentrations) as
affecting up to 1km from each
foundation i.e., potential effects
effectively extend over the whole
area. There is no significant other
mention of wake effects/plume in
this report but the descriptions of
impact indicate that there is
potential for wake effects and
plumes of sediment suspension to
be generated. This should be
discussed as a separate potential
source of environmental effect.
Norfolk Vanguard Limited has
revised the minimum spacing to
680m.
This statement still stands in that
680m is the minimum separation
between turbines in order to
minimise any effects, not
completely eradicate them. The
wake effect that is referred to is
for the changes to tidal currents
and waves during the operation
and maintenance phase of the
wind farm. The wake effect is
discussed in the individual
operational impact sections for
tidal currents and waves and a
zone of influence is defined for
each of these (i.e. extending over
the whole OWF sites as
commented on). Plumes created
by scour during the operation and
maintenance phase are not
discussed because scour
protection would be used,
reducing sediment release to
negligible quantities. Table 8.15
refers to the plume that would be
generated for drill arisings during
construction and so there would
not be the ‘cumulative’ effect (i.e.
over the whole area) that might
occur for all the turbines in place
during operation and
maintenance.
Cefas Written feedback
dated 1st
July
2017 (provided 6th
July 2017) in
response to an
early draft of the
PEIR chapter
dated 21st
June
2017
The draft Impact 2A noted that
mounds of sediment up to several
metres high may be formed, and
considers these small compared
to the absolute depth of water
>20m. However, water depth is
less than that in some parts of the
area and ‘several metres’ may
amount to 30% or more. The
applicant would not be justified in
saying that the change in
elevation is within the natural
change caused by sand waves and
ridges and that hence blockage is
negligible, because the mounds
would be separate to the natural
The bathymetry indicates that in
NV West and NV East, the water
depths are never less than 20m.
Hence, the statement in the ES
remains valid. The plume
assessment is construction only
and is not related to wakes around
turbines but to simple release of
sediment into the water column
through drill arisings or seabed
preparation and its re-distribution
by tidal currents (without creation
of wakes).
Due to Norfolk Vanguard Limited’s
commitment to use scour
June 2018 Norfolk Vanguard Offshore Wind Farm PB4476-005-008 Page 12
Consultee Date /Document Comment Response / where addressed in
the ES
features and represent an
additional blockage.
However, Cefas concur with the
final statement in this paragraph
– “The mound will be mobile and
be driven by the physical
processes, rather than the
physical processes being driven by
it”. This is a key point in the
assessment – that the majority of
effects on physical processes are
temporary redistribution of
sediment, largely confined within
the area of the OWF which is
therefore the maximum extent of
initial seabed disturbance, and
that processes will re-equilibrate
with the bed relatively quickly.
protection where required, this
will minimise any potential plumes
due to wakes around turbines
during operation and maintenance
and so this has not been assessed
further (also see response above).
The potential for secondary scour
around scour protection was also
discussed during the EPP but was
agreed in July 2017 that this is not
a potential issue.
Cefas Written feedback
dated 1st
July
2017 (provided 6th
July 2017) in
response to an
early draft of the
PEIR chapter
dated 21st
June
2017
Draft Impact 5 - The applicant
indicates that some of the
removed bed sand could be
disposed on the (residual)
upstream side of the cable such
that natural processes could
redistribute the sand back over
the levelled areas to reform the
natural bed sand waves. This is an
approach which should, be
encouraged and, over the works
as a whole, a similar approach
would minimise disturbance of
the natural processes i.e. timing
works to encourage the
redistribution of disturbed
sediment in an initial (residual)
upstream direction would see the
natural process restore the
residual downstream bed over
time.
The potential re-distribution of
sediment after disposal within
Norfolk Vanguard is discussed in
section 8.7.7.9.1.
Cefas Written feedback
dated 1st
July
2017 (provided 6th
July 2017) in
response to an
early draft of the
PEIR chapter
dated 21st
June
2017
Draft section 8.7.5.10 notes that
suspended sediments may exceed
prevailing levels but remain
within background levels range –
this should be supported by
justified quantitative estimates.
Reliable quantitative assessments
of suspended sediment
concentrations close to the coast
are difficult to obtain and so a
qualitative conceptual approach
has been adopted in section
8.7.7.5
Cefas Written feedback The statement in paragraph 189 Removed. In this impact section

June 2018 Norfolk Vanguard Offshore Wind Farm PB4476-005-008 Page 13
Consultee Date /Document Comment Response / where addressed in
the ES
dated 1st
July
2017 (provided 6th
July 2017) in
response to an
early draft of the
PEIR chapter
dated 21st
June
2017
of the draft PEIR “As there is a
large separation distance (well
beyond one tidal ellipse) there is
no evidence to support the
existence of a pathway between
the source and the receptor
groups for marine physical
processes” appears to be out of
place in this location - as a general
assessment of physical process
impacts, this should be
introduced where supported by
the physical evidence it is based
on (i.e., the wave, tidal and
transport information given in
sections 8.5 and 8.6, and so in
conjunction with the suggested
illustration of the sediment
transport system).
Paragraph 189 of the draft PEIR is
not justifiable in its present form -
the size of the tidal ellipse does
not limit the range over which
changes to the transport regime
may propagate over multiple tidal
cycles and so should probably be
removed from this sentence (the
same could also apply to
paragraph 241).
and the previous seabed
preparation impact section it is
shown that there is the potential
for the plume to extend
approximately 50km from the
release point (based on East Anglia
ONE modelling). It is also stated
that at these large distances the
thickness of deposition from the
plume would be very small (less
than 0.15mm thick). So, although
removal of the tidal ellipse
statement is justified, the overall
conclusion of negligible impact in
the far-field is also justified.
Cefas Written feedback
dated 1st
July
2017 (provided 6th
July 2017) in
response to an
early draft of the
PEIR chapter
dated 21st
June
2017
Paragraph 251 of the draft PEIR
could be supported quantitatively
and potentially also relocated to
form part of a defined section
outlining the support and
justification for considering EA
OWF as primary evidence for NV
assessment.
A section was added to the PEIR
(section 8.7.3 in this ES) that
discusses in detail the justification
for using the modelling results of
East Anglia ONE as analogies for
the potential effects/impacts of
Norfolk Vanguard
Cefas Written feedback
dated 1st
July
2017 (provided 6th
July 2017) in
response to an
early draft of the
PEIR chapter
dated 21st
June
2017
The applicant has made the case
for sufficient similarity between
the East Anglia and Norfolk
Vanguard OWFs, but the case
could be made more effectively
and easier to assess with more
considered presentation.
Evidence is presented in the
Sections dealing with the
assessment of impact e.g., draft
PEIR paragraphs 139-140. This
A section was added to PEIR
(section 8.7.3 in this ES) that
discusses in detail the justification
for using the modelling results of
East Anglia ONE as analogies for
the potential effects/impacts of
Norfolk Vanguard
June 2018 Norfolk Vanguard Offshore Wind Farm PB4476-005-008 Page 14
Consultee Date /Document Comment Response / where addressed in
the ES
comparison should be made in
advance, immediately following
the description of the regional
physical environment (sections
8.5, 8.6; see next comments).
Cefas Written feedback
dated 1st
July
2017 (provided 6th
July 2017) in
response to an
early draft of the
PEIR chapter
dated 21st
June
2017
A regional sediment transport
map should be provided (to
accompany sections 8.6.8 and
8.6.9). Not only would this be
useful in respect of statements
made later in the report (e.g., that
there is no pathway for changes
offshore to affect the shoreline),
but it would be a major piece of
evidence in support of the
assumption that the physical
contexts of the East Anglia OWF
are sufficiently similar to Norfolk
Vanguard to justify their use as
primary evidence for impact
assessment of the latter. It would
also clarify the step to section
8.6.11 (coastal process at the
landfall / shoreline), and thence
to the impact receptors defined in
8.7.
Figure and explanation added to
section 8.6.8
Cefas Written feedback
dated 1st
July
2017 (provided 6th
July 2017) in
response to an
early draft of the
PEIR chapter
dated 21st
June
2017
Section 8.7.1 of the draft PEIR
indicates ‘receptor groupings’
relevant to Norfolk Vanguard, and
references Figure 8.11, but the
text and figure refer to different
named areas, with no indication
of how the two are related. This
information is provided
afterwards – paragraph 104 and
Table 8.9 should precede the
Figure.
Section 8.7.1 re-arranged to clarify
Cefas Written feedback
dated 1st
July
2017 (provided 6th
July 2017) in
response to an
early draft of the
PEIR chapter
dated 21st
June
2017
The cable corridor bridges the
offshore-inshore transition and
will require consideration of
nearshore processes in addition
to offshore processes at the
turbine site, with the possibility of
affecting the defined receptors by
a different pathway – this too will
benefit from mapping what is
understood of the regional
transport systems.
Offshore cable construction
activities including the inshore
transition are covered in sections
8.7.7.5 to 8.7.7.8. The supporting
information on regional transport
pathways is included in section
8.6.8

June 2018 Norfolk Vanguard Offshore Wind Farm PB4476-005-008 Page 15
Consultee Date /Document Comment Response / where addressed in
the ES
Cefas Written feedback
dated 1st
July
2017 (provided 6th
July 2017) in
response to an
early draft of the
PEIR chapter
dated 21st
June
2017
Cefas is unsure of the intention
behind the statement made in
paragraph 228 – that “the value
of the East Anglia coast is deemed
medium; it … is of regional
importance for coastal
processes”.
This was removed from the PEIR
and does not appear in this ES.
Happisburgh Parish Council
12th
September 2017 PEIR Response
There is a worrying lack of understanding of coastal process given the short tidal window to manage and complete work on one the most dynamic full tidal beaches in the UK. No methodology has been given to the management of the beach or public safety. The Parish Council is concerned that Vattenfall does not seem to understand that one metre of beach can be lost during a storm - that is the depth at which the cable would be buried with a short drill!
A decision has been made, based
on consultation feedback, to use
long HDD at the landfall with an
exit point in the subtidal zone
beyond -5.5m LAT (approximately
1km from the onshore drilling
location).
Therefore these concerns have
been addressed, as potential
intertidal impacts would be
avoided.
North Norfolk District Council
8th
December 2017 PEIR Response
In respect of the Construction Phase, the Council’s Coastal Manager considers that the horizontal directional drilling (HDD) long exit option is preferred as it would prevent any clear interference with coastal processes.
A decision has been made, based on consultation feedback, to use the long HDD option at the landfall so impacts on coastal processes are minimised.
North Norfolk District Council
8th
December 2017 PEIR Response
In respect of the Operation Phase, the Council’s Coastal Manager considers that as there is a preference for buried cabling in the seabed in the nearshore, there are limited concerns with regards to wider impacts to coastal erosion/processes during operation. The PEIR suggests that buried cabling is preferred in all but incompatible circumstances, if it was not possible to bury cabling in the nearshore environment, further consideration would be required. One area where issues could arise is ensuring the depth of cable under the foreshore is sufficient to prevent uncovering as the cliff, beach and shore platform erodes (and lowers) over time. This may be more likely
This impact is covered in section
8.7.8.6.
An Outline Scour Protection and
Cable Management Plan
(document reference 8.16) as well
as an Offshore In Principle
Monitoring Plan (document
reference 8.12) are provided with
the DCO application to outline the
approach to monitoring and
management of cables. Details of
required monitoring will be agreed
with Marine Management
Organisation (MMO) in advance of
construction.
June 2018 Norfolk Vanguard Offshore Wind Farm PB4476-005-008 Page 16
Consultee Date /Document Comment Response / where addressed in
the ES
under the short HDD exit option. A post construction monitoring plan should identify such risks and ensure appropriate coastal monitoring of coastal processes to ensure early identification of issues and timely remediation should they occur.
North Norfolk District Council
8th
December 2017 PEIR Response
In terms of cable decommissioning, the PEIR identifies that the cabling can simply be pulled from the ducting for disposal, however, there should be recognition that as the coast erodes, there is a risk that the seaward, and, over the long term, landward duct and infrastructure will be exposed and will require removal. Currently there are no funded mechanisms for the removal of historical/redundant infrastructure as it is exposed via erosion and as such these burdens often fall to the Local Authority. Long term arrangements would be beneficial to ensure that such implications do not, through default, fall to future generations of local government.
A Decommissioning Plan will be produced for the project prior to construction.
North Norfolk District Council
8th
December 2017 PEIR Response
The horizontal directional drilling (HDD) long exit option is preferred when bringing the offshore cable onto land.
A decision has been made, based on consultation feedback, to use the long HDD option at the landfall.
Environment Agency
11th
December 2017 PEIR Response
Our preferred option would be to use long HDD to minimise impact on the shore face and emerged beach.
A decision has been made, based on consultation feedback, to use the long HDD option at the landfall.
Environment Agency
11th
December 2017 PEIR Response
An idea of error introduced from geo-referencing and digitisation from the desktop survey of historic erosion rates would be useful (see Appendix 4.1 in the draft PEIR).
This was discussed with the Environment Agency during an Expert Topic Group meeting on the 31
st Jan 2018. It was accepted that
the majority of the coastal erosion study is based on interpretation of rates published in the SMP and coastal study. Digitisation is a limited part of the assessment, and its uncertainty is captured in the broader uncertainty that has been reported.
MMO 11th
December 2017 PEIR Response
No specific surveys have been carried out for this report, essentially only a transfer of
New surveys, specific to the project, have been carried out for bathymetry, geology and
June 2018 Norfolk Vanguard Offshore Wind Farm PB4476-005-008 Page 17
Consultee Date /Document Comment Response / where addressed in
the ES
previous analyses of modelling results for other similar works to this context (principally the East Anglia ONE OWF). The original analyses have not been reviewed here and will have been subject to assessment as part of the relevant application.
metocean (see Table 8.8).
MMO 11th
December 2017 PEIR Response
This study does show considerable overlap between the envelope of effects on hydrodynamics (in terms of wave height) for an adjacent development (East Anglia Three) and Norfolk Vanguard East. The assessment essentially concludes that effects of each individual development are negligible, and that the cumulative impacts are negligible also. However, the method used (simple extension of modelling results for a third individual development) does not convincingly support this conclusion since the original results did not assess in-combination effects.
The approach to cumulative operational effects on waves was based on expert assessment (overlapping of zones of potential influence) as described in section 8.8.3. The modelling results of East Anglia ONE were used in the expert assessment merely to show that changes to waves due to the presence of foundation structures would be small in magnitude and localised in spatial extent (i.e. restricted to the vicinity of each foundation), and that this applies to cumulative layouts as well as for individual wind farm layouts.
MMO 11th
December 2017 PEIR Response
The assessment has not considered the actual function of wave action within the regional sediment transport system. Physical process impacts are presented as the percentage changes to currents and wave height but these are not quantified in terms of the receptors i.e., the percentage change in sediment transport this would cause.
The reasoning behind there being no impact on sediment transport is related to scaling. The larger scale processes of the southern North Sea (altered albeit locally by the changes to waves and tidal currents) would continue undisturbed and effectively immeasurable. This is described in more detail in section 8.7.8.3.
MMO 11th
December 2017 PEIR Response
Table 8.1 in the PEIR indicates that the applicant was advised that coastal geomorphology and sediment transport modelling should be performed, and that (it was agreed that) the PEIR would do so on the basis of a conceptual model and expert judgment. This approach is weakest in the nearshore zone as no specific information has been presented only assumptions, such as higher suspended sediment concentration. The PEIR mentions an installation
Data on suspended sediment in the nearshore zone has been requested from the Environment Agency or MMO through the EPP. It was discussed and agreed during the Expert Topic Group meeting on the 31
st Jan 2018 that no data are
available and that the approach taken to the assessment is appropriate. The CWind study (2017 unpublished, provided in Volume 3 Appendix 4.2) was provided to the Expert Topic Group in January

June 2018 Norfolk Vanguard Offshore Wind Farm PB4476-005-008 Page 18
Consultee Date /Document Comment Response / where addressed in
the ES
study (CWind, 2017), which is unpublished and not provided, that may contain some relevant details, but there is no specific presentation of this information. Please provide that information in the Environmental Statement.
2017. This contains no information on the nearshore zone.
MMO 11th
December 2017 PEIR Response
Proactive mitigation of engineering risk has been indicated, in the form of widespread scour protection around assets. This is not mitigating for impact on Marine Processes as such, as this is simply replacing one impact for another. I.e. a scour hole being replaced by a complete change of substrate. The total area of seabed disruptions is not really amenable to mitigation. The impact on the designated areas in particular is a fixed quantity caused by the construction process. Thus, no mitigation is possible for the disruption of seabed sediment (the reason for designation of Haisborough, Hammond and Winterton SAC). Also the choice of scour protection (concrete mattresses or plastic fronts, for example) is not significant in these terms. Please reflect this in the Environmental Statement.
This ES chapter has removed reference to scour protection as mitigation; rather it is the reason why the impact of scour has not been assessed. The impact of habitat loss associated with scour protection is assessed in full in section 8.7.8 of this ES chapter. The direct loss of habitat caused by scour protection around the foundation structures will have no impact on Haisborough, Hammond and Winterton SAC because they are outside the SAC boundary. Embedded mitigation associated with minimising disruption to sediment in the SAC are outlined in section 8.7.4. The effect on sediment transport processes in the SAC of sand wave levelling along the export cable corridor is addressed in section 8.7.7.6.
MMO 11th
December 2017 PEIR Response
Monitoring is necessary to verify the assumptions of localised impact. i.e. bathymetry to demonstrate recovery of the sand waves and that the sea bed level changes associated with trenches, mounds and depression created do not spread but are gradually erased.
An Offshore In Principle Monitoring Plan (document reference 8.12) is provided with the DCO application to outline the approach to monitoring. Details of required monitoring will be developed in consultation with the MMO in advance of construction.
MMO 11th
December 2017 PEIR Response
Monitoring of the nearshore geomorphology, where temporarily affected by works, should be carried out around the period of development. This is to demonstrate that no major changes have occurred due to the development since this area has been assessed in very vague terms only.
An Offshore In Principle Monitoring Plan (document reference 8.12) is provided with the DCO application to outline the approach to monitoring. Details of required monitoring will be developed in consultation with the MMO in advance of construction.
Natural England
31st
January 2018 EPP meeting
Further information required in relation to sand wave
These are addressed in Appendix 7.1 of the Information to Support

June 2018 Norfolk Vanguard Offshore Wind Farm PB4476-005-008 Page 19
Consultee Date /Document Comment Response / where addressed in
the ES
levelling in the SAC in relation to:
Confirm that the sediment would remain within the SAC
What difference it would make if the sediment is disposed of at the water surface or near the seabed
Consider the effects of phasing
Incorporate evidence from other projects where possible
HRA report (document reference 5.3).
Assessment Methodology 8.4
In order to meet the requirements of the guidance documents described in section 16.
8.2, the assessment approach has adopted the following stages:
Review of existing relevant data;
Acquisition of additional project-specific data to fill any gaps;
Formulation of a conceptual understanding of baseline conditions;
Consultation and agreement with the regulators regarding proposed
assessment approaches;
Determination of the worst case scenarios;
Consideration of embedded mitigation measures; and
Assessment of effects using analytical tools, empirical methods, results from
previous numerical modelling (East Anglia ZEA and East Anglia ONE) and expert-
based judgements by Royal HaskoningDHV.
Impact Assessment Methodology 8.4.1
The assessment of effects on marine geology, oceanography and physical processes 17.
is predicated on a Source-Pathway-Receptor (S-P-R) conceptual model, whereby the
source is the initiator event, the pathway is the link between the source and the
receptor impacted by the effect, and the receptor is the receiving entity.
An example of the S-P-R conceptual model is provided by cable installation which 18.
disturbs sediment on the seabed (source). This sediment is then transported by tidal
currents until it settles back to the seabed (pathway). The deposited sediment could
change the composition and elevation of the seabed (receptor).
Consideration of the potential effects of Norfolk Vanguard on the marine geology, 19.
oceanography and physical processes is carried out over the following spatial scales:
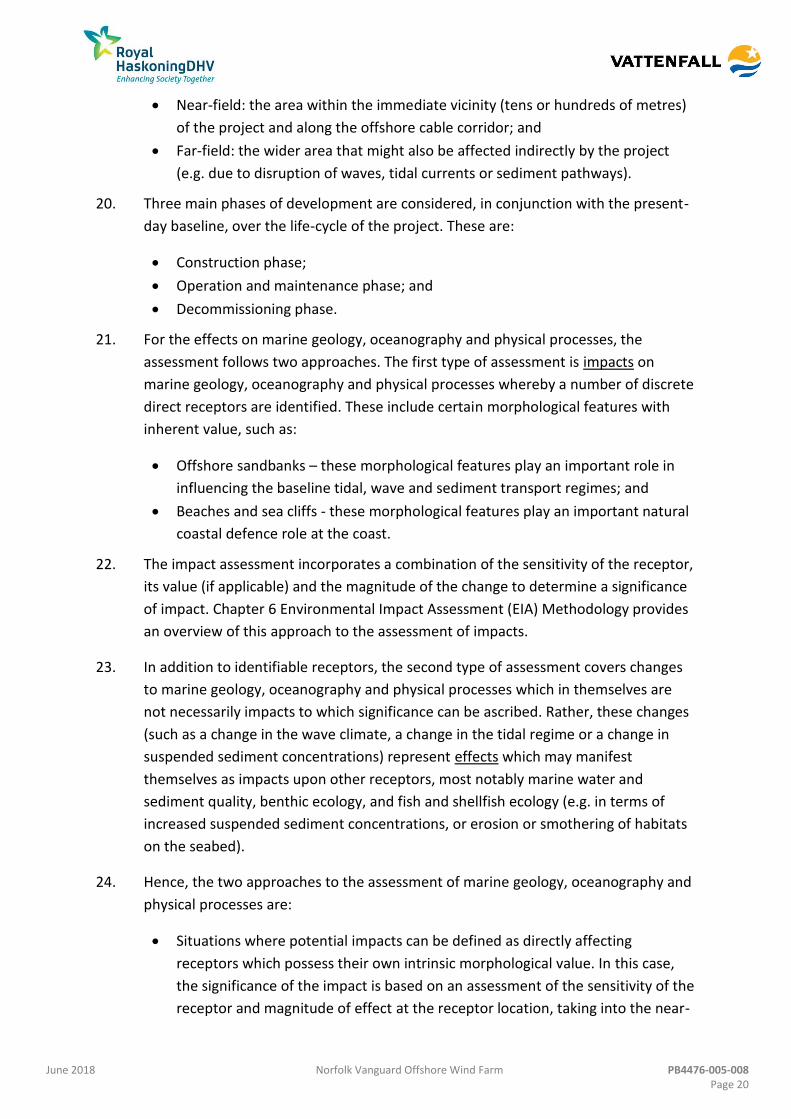
June 2018 Norfolk Vanguard Offshore Wind Farm PB4476-005-008 Page 20
Near-field: the area within the immediate vicinity (tens or hundreds of metres)
of the project and along the offshore cable corridor; and
Far-field: the wider area that might also be affected indirectly by the project
(e.g. due to disruption of waves, tidal currents or sediment pathways).
Three main phases of development are considered, in conjunction with the present-20.
day baseline, over the life-cycle of the project. These are:
Construction phase;
Operation and maintenance phase; and
Decommissioning phase.
For the effects on marine geology, oceanography and physical processes, the 21.
assessment follows two approaches. The first type of assessment is impacts on
marine geology, oceanography and physical processes whereby a number of discrete
direct receptors are identified. These include certain morphological features with
inherent value, such as:
Offshore sandbanks – these morphological features play an important role in
influencing the baseline tidal, wave and sediment transport regimes; and
Beaches and sea cliffs - these morphological features play an important natural
coastal defence role at the coast.
The impact assessment incorporates a combination of the sensitivity of the receptor, 22.
its value (if applicable) and the magnitude of the change to determine a significance
of impact. Chapter 6 Environmental Impact Assessment (EIA) Methodology provides
an overview of this approach to the assessment of impacts.
In addition to identifiable receptors, the second type of assessment covers changes 23.
to marine geology, oceanography and physical processes which in themselves are
not necessarily impacts to which significance can be ascribed. Rather, these changes
(such as a change in the wave climate, a change in the tidal regime or a change in
suspended sediment concentrations) represent effects which may manifest
themselves as impacts upon other receptors, most notably marine water and
sediment quality, benthic ecology, and fish and shellfish ecology (e.g. in terms of
increased suspended sediment concentrations, or erosion or smothering of habitats
on the seabed).
Hence, the two approaches to the assessment of marine geology, oceanography and 24.
physical processes are:
Situations where potential impacts can be defined as directly affecting
receptors which possess their own intrinsic morphological value. In this case,
the significance of the impact is based on an assessment of the sensitivity of the
receptor and magnitude of effect at the receptor location, taking into the near-
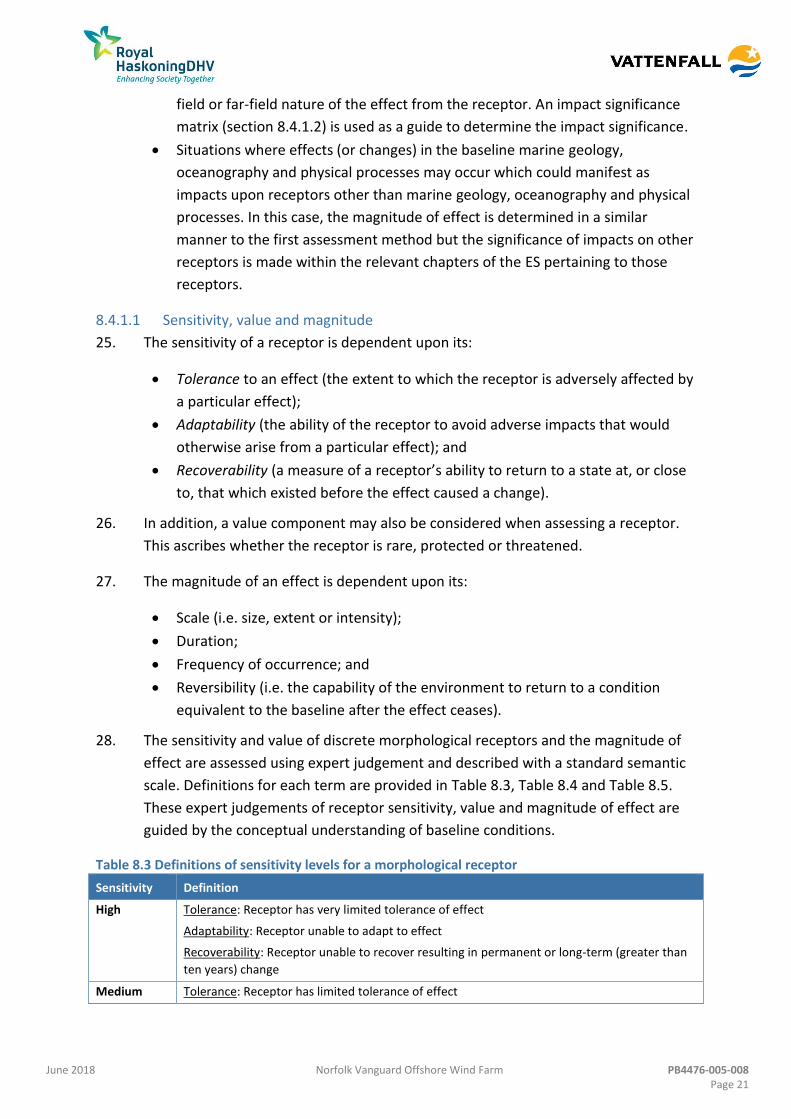
June 2018 Norfolk Vanguard Offshore Wind Farm PB4476-005-008 Page 21
field or far-field nature of the effect from the receptor. An impact significance
matrix (section 8.4.1.2) is used as a guide to determine the impact significance.
Situations where effects (or changes) in the baseline marine geology,
oceanography and physical processes may occur which could manifest as
impacts upon receptors other than marine geology, oceanography and physical
processes. In this case, the magnitude of effect is determined in a similar
manner to the first assessment method but the significance of impacts on other
receptors is made within the relevant chapters of the ES pertaining to those
receptors.
Sensitivity, value and magnitude 8.4.1.1
The sensitivity of a receptor is dependent upon its: 25.
Tolerance to an effect (the extent to which the receptor is adversely affected by
a particular effect);
Adaptability (the ability of the receptor to avoid adverse impacts that would
otherwise arise from a particular effect); and
Recoverability (a measure of a receptor’s ability to return to a state at, or close
to, that which existed before the effect caused a change).
In addition, a value component may also be considered when assessing a receptor. 26.
This ascribes whether the receptor is rare, protected or threatened.
The magnitude of an effect is dependent upon its: 27.
Scale (i.e. size, extent or intensity);
Duration;
Frequency of occurrence; and
Reversibility (i.e. the capability of the environment to return to a condition
equivalent to the baseline after the effect ceases).
The sensitivity and value of discrete morphological receptors and the magnitude of 28.
effect are assessed using expert judgement and described with a standard semantic
scale. Definitions for each term are provided in Table 8.3, Table 8.4 and Table 8.5.
These expert judgements of receptor sensitivity, value and magnitude of effect are
guided by the conceptual understanding of baseline conditions.
Table 8.3 Definitions of sensitivity levels for a morphological receptor
Sensitivity Definition
High Tolerance: Receptor has very limited tolerance of effect
Adaptability: Receptor unable to adapt to effect
Recoverability: Receptor unable to recover resulting in permanent or long-term (greater than
ten years) change
Medium Tolerance: Receptor has limited tolerance of effect
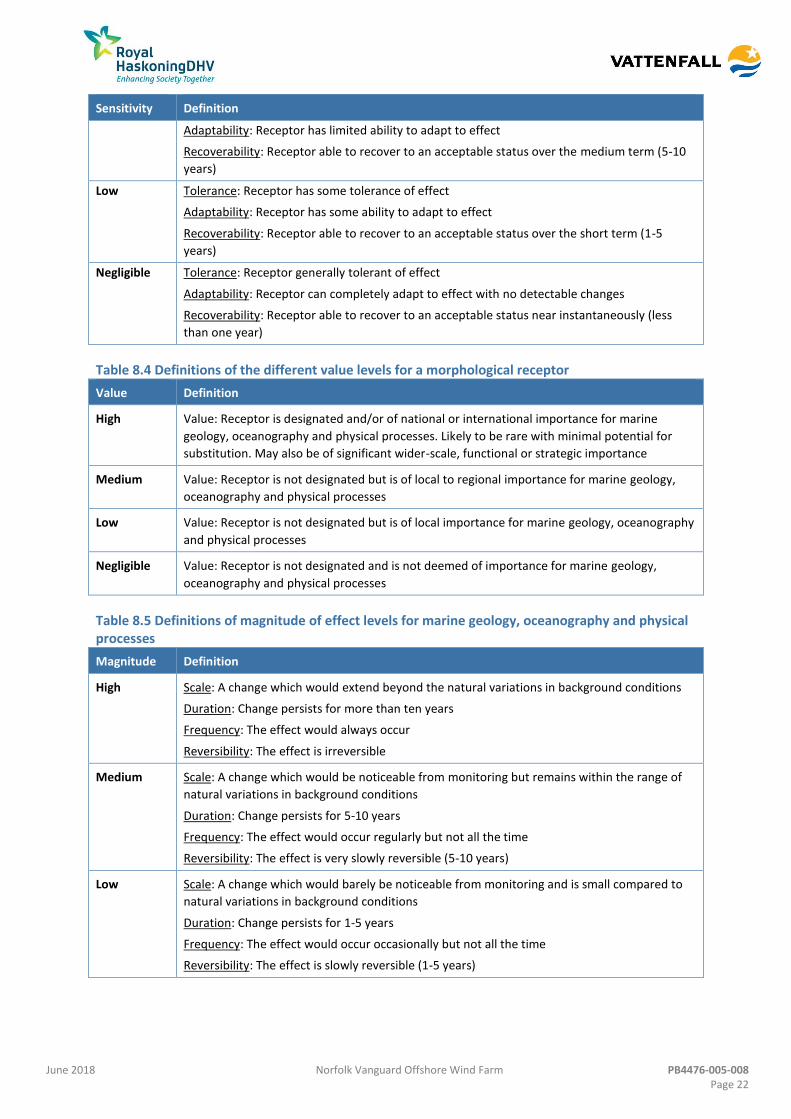
June 2018 Norfolk Vanguard Offshore Wind Farm PB4476-005-008 Page 22
Sensitivity Definition
Adaptability: Receptor has limited ability to adapt to effect
Recoverability: Receptor able to recover to an acceptable status over the medium term (5-10
years)
Low Tolerance: Receptor has some tolerance of effect
Adaptability: Receptor has some ability to adapt to effect
Recoverability: Receptor able to recover to an acceptable status over the short term (1-5
years)
Negligible Tolerance: Receptor generally tolerant of effect
Adaptability: Receptor can completely adapt to effect with no detectable changes
Recoverability: Receptor able to recover to an acceptable status near instantaneously (less
than one year)
Table 8.4 Definitions of the different value levels for a morphological receptor
Value Definition
High Value: Receptor is designated and/or of national or international importance for marine
geology, oceanography and physical processes. Likely to be rare with minimal potential for
substitution. May also be of significant wider-scale, functional or strategic importance
Medium Value: Receptor is not designated but is of local to regional importance for marine geology,
oceanography and physical processes
Low Value: Receptor is not designated but is of local importance for marine geology, oceanography
and physical processes
Negligible Value: Receptor is not designated and is not deemed of importance for marine geology,
oceanography and physical processes
Table 8.5 Definitions of magnitude of effect levels for marine geology, oceanography and physical processes
Magnitude Definition
High Scale: A change which would extend beyond the natural variations in background conditions
Duration: Change persists for more than ten years
Frequency: The effect would always occur
Reversibility: The effect is irreversible
Medium Scale: A change which would be noticeable from monitoring but remains within the range of
natural variations in background conditions
Duration: Change persists for 5-10 years
Frequency: The effect would occur regularly but not all the time
Reversibility: The effect is very slowly reversible (5-10 years)
Low Scale: A change which would barely be noticeable from monitoring and is small compared to
natural variations in background conditions
Duration: Change persists for 1-5 years
Frequency: The effect would occur occasionally but not all the time
Reversibility: The effect is slowly reversible (1-5 years)

June 2018 Norfolk Vanguard Offshore Wind Farm PB4476-005-008 Page 23
Magnitude Definition
Negligible Scale: A change which would not be noticeable from monitoring and is extremely small
compared to natural variations in background conditions
Duration: Change persists for less than one year
Frequency: The effect would occur highly infrequently
Reversibility: The effect is quickly reversible (less than one year)
Impact significance 8.4.1.2
Following the identification of receptor sensitivity and value, and magnitude of 29.
effect, it is possible to determine the significance of the impact. A matrix is
presented in Table 8.6 as a framework to guide how a judgement of the significance
is determined.
Table 8.6 Impact significance matrix Negative Magnitude Beneficial Magnitude
High Medium Low Negligible Negligible Low Medium High
Sen
siti
vity
High Major Major Moderate Minor Minor Moderate Major Major
Medium Major Moderate Minor Minor Minor Minor Moderate Major
Low Moderate Minor Minor Negligible Negligible Minor Minor Moderate
Negligible Minor Negligible Negligible Negligible Negligible Negligible Negligible Minor
Through use of the matrix shown in Table 8.6, an assessment of the significance of 30.
an impact can be made in accordance with the definitions in Table 8.7.
Table 8.7 Impact significance definitions
Impact Significance Definition
Major Very large or large change in receptor condition, both adverse or beneficial, which are
likely to be important considerations at a regional or district level because they
contribute to achieving national, regional or local objectives, or, could result in
exceedance of statutory objectives and / or breaches of legislation
Moderate Intermediate change in receptor condition, which is likely to be an important
consideration at a local level
Minor Small change in receptor condition, which may be raised as a local issue but is unlikely
to be important in the decision making process
Negligible No discernible change in receptor condition
For the purposes of this ES, ‘major’ and ‘moderate’ impacts are deemed to be 31.
significant (in EIA terms). In addition, whilst ‘minor’ impacts may not be significant in
their own right, it is important to distinguish these from other non-significant
(negligible) impacts as they may contribute to significant impacts cumulatively.

June 2018 Norfolk Vanguard Offshore Wind Farm PB4476-005-008 Page 24
Cumulative Impact Assessment 8.4.2
Cumulative impacts are assessed through consideration of the extent of influence of 32.
changes to marine geology, oceanography and physical processes arising from the
project alone and those arising from the project cumulatively or in combination with
other offshore wind farm developments (particularly East Anglia THREE, East Anglia
ONE and Norfolk Boreas) but also giving consideration to any other nearby seabed
activities, including marine aggregate extraction and marine disposal.
The cumulative impact assessment draws from findings of earlier studies undertaken 33.
to inform the East Anglia ZEA (ABPmer, 2012a) which considered cumulative effects
arising from development of the whole of the former East Anglia zone, the ES for
East Anglia THREE (EATL, 2015) and the ES for East Anglia ONE (EAOW, 2012b) which
considered cumulative effects from those projects and other project activities in
close proximity.
Transboundary Impact Assessment 8.4.3
Transboundary impacts have been assessed through consideration of the extent of 34.
influence of changes or effects and their potential to impact upon marine geology,
oceanography and physical processes receptor groups that are located within other
European Union (EU) member states.
Transboundary impacts were considered in the Scoping Report for this topic and it 35.
was concluded that “transboundary impacts are unlikely to occur or are unlikely to
be significant.” (Royal HaskoningDHV, 2016). This statement is supported by the
assessments that have been completed for the East Anglia ZEA (ABPmer, 2012a), the
ES of East Anglia THREE (EATL, 2015), and the ES of East Anglia ONE (EAOW, 2012b),
as well as this document. Therefore, transboundary impacts are scoped out and will
not be considered further in this chapter. This approach was confirmed during the
scoping process (Royal HaskoningDHV, 2016; the Planning Inspectorate, 2016) and
Evidence Plan Process (meeting 16th February 2017).
Scope 8.5
Study Area 8.5.1
Norfolk Vanguard is located in the southern North Sea, encompassing a seabed area 36.
of approximately 592km2. Norfolk Vanguard comprises two distinct areas, NV West
and NV East, which at their nearest points are located approximately, 47km and
70km from the coast of Norfolk, respectively. An offshore cable corridor joins the
OWF sites to the landfall at Happisburgh South. The offshore infrastructure required
for Norfolk Vanguard is outlined in section 8.7.4.

June 2018 Norfolk Vanguard Offshore Wind Farm PB4476-005-008 Page 25
Norfolk Vanguard Limited has committed to using long Horizontal Directional Drilling 37.
(HDD) from an onshore location to the subtidal zone (at least -5.5m LAT). Therefore,
there will be no impacts on the intertidal zone.
Data Sources 8.5.2
Information to support this ES has come from a series of previous surveys and 38.
studies, including numerical modelling studies, which were undertaken to inform the
ZEA for the former East Anglia Zone (EAOW, 2012a) as well as the ES for East Anglia
THREE (EATL, 2015) and the ES for East Anglia ONE (EAOW, 2012b) (Table 8.8).
A geophysical survey was completed between 7th September and 14th November 39.
2016 (Fugro, 2016). For NV East, geophysical data are available from a survey of the
former East Anglia FOUR site (completed between 19th June and 4th September
2012) (Fugro EMU, 2013). This approach was agreed with the Marine Management
Organisation, Cefas and Natural England (meeting 21st March 2016).
Appendix 7.1 of the Information to Support HRA report (document reference 5.3) 40.
provides a sand wave study which has informed the assessment of potential impacts
from cable installation activities on the Annex 1 Sandbanks features of the
Haisborough, Hammond and Winterton SAC.
In addition, a range of information sources is available, many of which were collated 41.
for the ZEA, including:
Marine Renewable Atlas (BERR, 2008);
Wavenet (Cefas);
National Tide and Sea Level Forecasting Service;
Extreme sea levels database (Environment Agency., 2015);
United Kingdom Hydrographic Office (UKHO) tidal diamonds;
British Oceanographic Data Centre;
National Oceanographic Laboratory Class A tide gauges;
Baseline numerical model runs (ABPmer, 2012a, 2012b);
Numerical metocean studies (Deltares, 2012, 2015a, 2015b);
United Kingdom Climate Projections ’09 (UKCP09) (Lowe et al., 2009);
British Geological Survey 1:250,000 seabed sediment mapping;
British Geological Survey bathymetric contours and paper maps; and
Admiralty Charts and United Kingdom Hydrographic Office survey data.
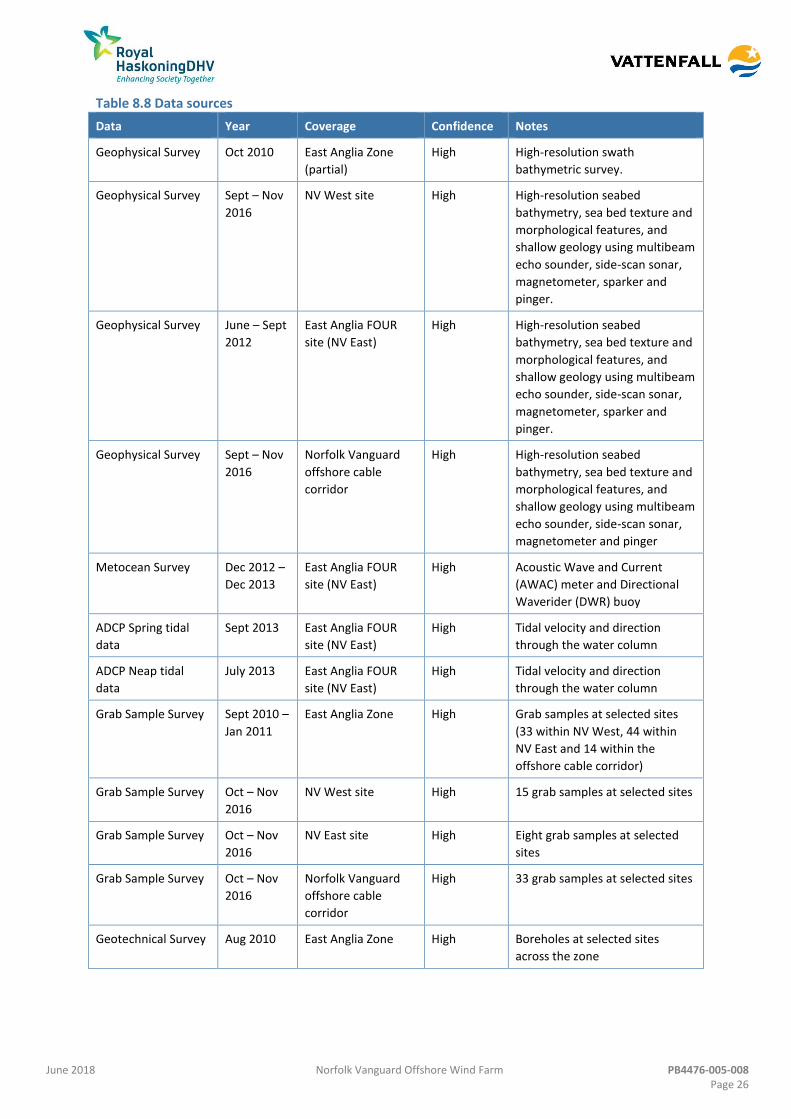
June 2018 Norfolk Vanguard Offshore Wind Farm PB4476-005-008 Page 26
Table 8.8 Data sources
Data Year Coverage Confidence Notes
Geophysical Survey Oct 2010 East Anglia Zone
(partial)
High High-resolution swath
bathymetric survey.
Geophysical Survey Sept – Nov
2016
NV West site High High-resolution seabed
bathymetry, sea bed texture and
morphological features, and
shallow geology using multibeam
echo sounder, side-scan sonar,
magnetometer, sparker and
pinger.
Geophysical Survey June – Sept
2012
East Anglia FOUR
site (NV East)
High High-resolution seabed
bathymetry, sea bed texture and
morphological features, and
shallow geology using multibeam
echo sounder, side-scan sonar,
magnetometer, sparker and
pinger.
Geophysical Survey Sept – Nov
2016
Norfolk Vanguard
offshore cable
corridor
High High-resolution seabed
bathymetry, sea bed texture and
morphological features, and
shallow geology using multibeam
echo sounder, side-scan sonar,
magnetometer and pinger
Metocean Survey Dec 2012 –
Dec 2013
East Anglia FOUR
site (NV East)
High Acoustic Wave and Current
(AWAC) meter and Directional
Waverider (DWR) buoy
ADCP Spring tidal
data
Sept 2013 East Anglia FOUR
site (NV East)
High Tidal velocity and direction
through the water column
ADCP Neap tidal
data
July 2013 East Anglia FOUR
site (NV East)
High Tidal velocity and direction
through the water column
Grab Sample Survey Sept 2010 –
Jan 2011
East Anglia Zone High Grab samples at selected sites
(33 within NV West, 44 within
NV East and 14 within the
offshore cable corridor)
Grab Sample Survey Oct – Nov
2016
NV West site High 15 grab samples at selected sites
Grab Sample Survey Oct – Nov
2016
NV East site High Eight grab samples at selected
sites
Grab Sample Survey Oct – Nov
2016
Norfolk Vanguard
offshore cable
corridor
High 33 grab samples at selected sites
Geotechnical Survey Aug 2010 East Anglia Zone High Boreholes at selected sites
across the zone
June 2018 Norfolk Vanguard Offshore Wind Farm PB4476-005-008 Page 27
Assumptions and Limitations 8.5.3
Due to the large amount of data that has been collected during the ZEA and site 42.
specific surveys, as well as other available data (Table 8.8), there is a good
understanding of the existing marine geology, oceanography and physical processes
environment at Norfolk Vanguard and its adjacent areas.
Although seabed surveys for the ZEA and Norfolk Vanguard were six years apart, this 43.
does not create any problems with respect to their compatibility and comparability
because conditions at the offshore seabed at a regional scale will have changed little
over this time period. Local changes may have taken place (due to migration of
bedforms) but these will not be significant for the purposes of site characterisation.
Similarly, regional metocean conditions have been measured over different time 44.
periods and different lengths of time and there may be some site specific bias
towards more or less energetic conditions depending on the season in which they
were collected. However, given the large geographical spread of the deployments, it
is likely that the potential site-specific differences will be accounted for at a regional
level.
Data for the ambient suspended sediment concentrations at the Happisburgh coast 45.
is not available (as discussed with the Expert Topic Group through the Evidence Plan
Process), and therefore this assessment is solely based on expert geomorphological
assessment of the likely magnitudes at the coast, based on the perceived energy
conditions. Regional suspended sediment data was available from the southern
North Sea Sediment Transport Study, but estimates at the coast are extrapolated
from a couple of locations further offshore. Hence, there is doubt as to the validity of
this extrapolation inshore where physical conditions are different (e.g. more
energetic).
Existing Environment 8.6
Bathymetry 8.6.1
Norfolk Vanguard West 8.6.1.1
Water depths across NV West vary between approximately 25 and 50m below LAT. 46.
The minimum water depth is along the north-central edge of the site and the
maximum water depth is within the south-west corner of the site (Figure 8.1).
The primary bathymetric features are broad (2.5 to 3.0km apart) but low (typically 47.
5m high) sandbanks which trend north-south through the site and represent the
south-east limit of the Norfolk Bank System. The westernmost sandbank is slightly
higher (up to 7m), broader (up to 4km wide) and continues past the southern
boundary of NV West.

June 2018 Norfolk Vanguard Offshore Wind Farm PB4476-005-008 Page 28
At a more local scale the seabed is uneven due to the presence of bedforms of 48.
various sizes. Sand waves within NV West are up to 6m high with crests oriented
approximately east-west, indicative of north-south tidal currents. The majority of the
sand waves are asymmetric with their steeper sides facing north, indicating
migration towards the north.
The sand waves are overlain by megaripples which also blanket the site where sand 49.
waves are not present. Where megaripples are present on a relatively smooth or
only mildly undulating seabed, such as the centre of the site, their crests are linear
with a consistent spacing of about 8 to 10m, and typical heights of 0.5m.
To the north of NV West are a series of sandbanks collectively called the Norfolk 50.
Bank System (Figure 8.2). They represent the most extensive example of offshore
linear ridge type sandbanks in UK waters. The proposed offshore cable corridor has a
route through the banks within the south-west part of the system.
Norfolk Vanguard East 8.6.1.2
The bathymetry within NV East varies from a maximum depth of 42m below LAT 51.
across the north-east part of the site to a minimum depth of 22m below LAT on the
crest of a sand ridge in the north-east part of the site (Figure 8.3).
The bathymetry is dominated by a series of four north-south oriented sandbanks 52.
with widths of 2 to 3km and heights up to 17m above the surrounding seabed.
Smaller bedforms include sand waves (greater than 2m high), megaripples (less than
2m high) and sand ridges.
Asymmetric sand waves occur across much of the seabed of NV East. Where they are 53.
present along the tops of the sandbanks, their crests are oriented predominantly
north-west to south-east. In deeper locations, the crests are oriented more west to
east. The sand waves have wavelengths of 200 to 300m and heights of 2 to 7m and
their flanks are generally covered by megaripples, which are also common
throughout the site. The megaripples have typical wavelengths of 5 to 20m and
heights of 0.3 to 2m, with crests oriented west to east.
Offshore cable corridor 8.6.1.3
Water depths within the offshore portion of the cable corridor, in the region of the 54.
NV West and NV East sites, are typically 40 to 50m below LAT (Figure 8.4).
Progressing towards the coast, water depths decrease progressively from around
50m below LAT to 10m below LAT about 500 to 1000m from the coast. The 2m
below LAT contour is typically 200m to 30m from the coast.
Superimposed on the general reduction in water depth shoreward are a series of 55.
broad, elongate, north-south aligned sandbanks and shoals which cross or extend
into the offshore cable corridor. The sandbank furthest offshore is the southern limit

June 2018 Norfolk Vanguard Offshore Wind Farm PB4476-005-008 Page 29
of Smith’s Knoll with a minimum water depth of approximately 25m below LAT.
Subsequent sandbanks progressing towards the coast, such as Hearty Knoll and
Newarp Banks, have minimum water depths of approximately 15m below LAT.
Secondary bedforms within the offshore cable corridor include sand waves, 56.
megaripples and sand ridges. The sand waves are up to 9m high with crests typically
oriented west-east to south-west to north-east, perpendicular to the tidal currents.
They have symmetric or asymmetric profiles, the latter implying net migration
towards either the north or south.
Megaripples cover the sand waves, and also blanket the seabed where sand waves 57.
are absent and the seabed is mobile. They are 5 to 10m in wavelength, 0.2 to 0.6m
high, and can be symmetric or asymmetric.
Low continuous sand ridges (typically 0.5 to 1m high and spaced 100 to 200m apart) 58.
formed parallel to tidal current flows occur in the eastern part of the offshore cable
corridor.
8.6.1.3.1 Haisborough, Hammond and Winterton SAC
The offshore cable corridor passes through the southern end of the Annex I 59.
sandbank system located within the Haisborough, Hammond and Winterton SAC.
The Haisborough sandbank system comprises of a series of north-west to south-east 60.
oriented en-echelon (approximately parallel to the coast) alternating ridge headland
associated sandbanks, which have evolved over the last 5,000 years in response to
shoreline recession and sea-level rise (Cooper et al., 2007). The sandbank system
consists of Haisborough Sand, Haisborough Tail, Hammond Knoll, Winterton Ridge
and Hearty Knoll (Figure 8.2).
Water depths within the sandbank system range from approximately 12 to 52m 61.
below LAT. Approximately two thirds of the sandbank habitat occurs in greater than
20m below LAT. The crests of the sandbanks are in water shallower than 20m below
LAT with their flanks extending into water depths up to 40m below LAT (ABPmer,
2018). Although the Annex I qualifying habitat is Sandbanks which are ‘slightly’
covered by seawater all the time, indicating shallow sandbanks only, those
sandbanks in water depths greater than 20m are also considered to fall within the
Annex I criteria of the Haisborough, Hammond and Winterton SAC.
Geology 8.6.2
The geology of Norfolk Vanguard generally consists of Holocene sand deposits 62.
overlying a series of Pleistocene sands and clays. The thickness of the Holocene
sediment varies from less than 1m to greater than 20m in the sand wave fields and
sandbanks.

June 2018 Norfolk Vanguard Offshore Wind Farm PB4476-005-008 Page 30
Norfolk Vanguard West 8.6.2.1
Fugro (2016) described nine geological formations (Table 8.9). The sequence 63.
between the Westkapelle Ground Formation and the Twente Formation is
Pleistocene in age, whereas the Elbow Formation and Bligh Bank Formation are
Holocene.
Table 8.9 Geological formations present under the Norfolk Vanguard West site (Fugro, 2016)
Formation1 Lithology (BGS Lexicon http://www.bgs.ac.uk/lexicon)
Bligh Bank Marine, medium- or fine- to medium-grained, clean, yellow-brown sands
Elbow Brackish-marine, fine-grained sands and clays with discontinuous basal peat bed
Twente Fine-grained, well-sorted, wind-blown periglacial sands
Brown Bank Brackish-marine, grey-brown silty clays. Pass upwards into lacustrine clays in the east, include interbeds gravelly sand towards base in west
Swarte Bank Infilled glacial tunnel valleys
Yarmouth Roads Mainly riverine, fine or medium-grained grey-green sands, typically non-calcareous, with variable clay lamination and local intercalations of reworked peat
Winterton Shoal Fine- or medium-grained sands with minor clay laminations
Smith’s Knoll Fine to medium-grained, muddy marine sands, with clay intercalations in the east
Westkapelle Ground Marine clays with thin sandy laminae passing gradationally upwards to sand with thin clay laminae
The Bligh Bank Formation blankets the majority of the site as a thin seabed veneer 64.
and represents the sediment currently being reworked into sandbanks, sand waves
and megaripples (Plate 8.1). The formation is present across most of the NV West
site, except along the western margin where Holocene sand is absent or only a
patchy veneer and Pleistocene formations outcrop at the seabed.
Plate 8.1 Schematic representation of the shallow geology of NV West (Fugro, 2016)
Norfolk Vanguard East 8.6.2.2
Fugro EMU (2013) described three geological formations within NV East. In 65.
ascending order, these are the Pleistocene Yarmouth Roads Formation comprising 0
to 100m of sands and channel infills, overlain by the Pleistocene Brown Bank
Formation comprising 5 to 10m of silty clay, capped by 0 to 20m of Bligh Bank
1 Eem formation was not recorded within NV West during
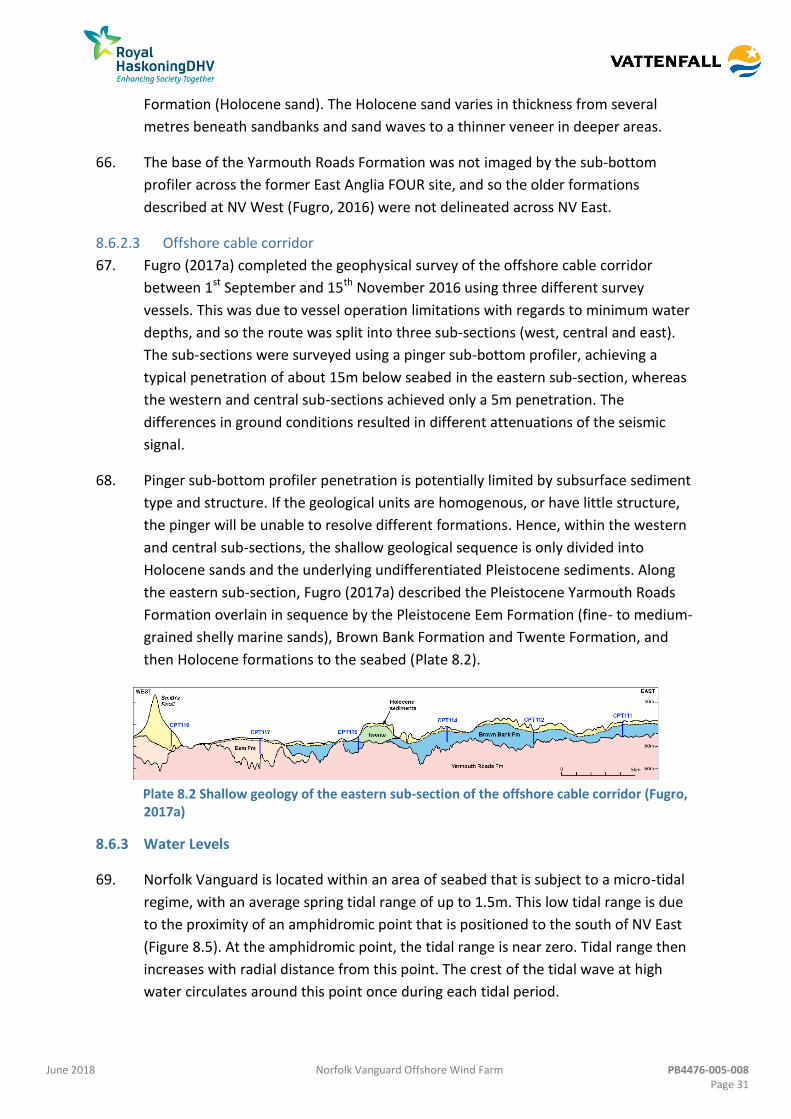
June 2018 Norfolk Vanguard Offshore Wind Farm PB4476-005-008 Page 31
Formation (Holocene sand). The Holocene sand varies in thickness from several
metres beneath sandbanks and sand waves to a thinner veneer in deeper areas.
The base of the Yarmouth Roads Formation was not imaged by the sub-bottom 66.
profiler across the former East Anglia FOUR site, and so the older formations
described at NV West (Fugro, 2016) were not delineated across NV East.
Offshore cable corridor 8.6.2.3
Fugro (2017a) completed the geophysical survey of the offshore cable corridor 67.
between 1st September and 15th November 2016 using three different survey
vessels. This was due to vessel operation limitations with regards to minimum water
depths, and so the route was split into three sub-sections (west, central and east).
The sub-sections were surveyed using a pinger sub-bottom profiler, achieving a
typical penetration of about 15m below seabed in the eastern sub-section, whereas
the western and central sub-sections achieved only a 5m penetration. The
differences in ground conditions resulted in different attenuations of the seismic
signal.
Pinger sub-bottom profiler penetration is potentially limited by subsurface sediment 68.
type and structure. If the geological units are homogenous, or have little structure,
the pinger will be unable to resolve different formations. Hence, within the western
and central sub-sections, the shallow geological sequence is only divided into
Holocene sands and the underlying undifferentiated Pleistocene sediments. Along
the eastern sub-section, Fugro (2017a) described the Pleistocene Yarmouth Roads
Formation overlain in sequence by the Pleistocene Eem Formation (fine- to medium-
grained shelly marine sands), Brown Bank Formation and Twente Formation, and
then Holocene formations to the seabed (Plate 8.2).
Plate 8.2 Shallow geology of the eastern sub-section of the offshore cable corridor (Fugro, 2017a)
Water Levels 8.6.3
Norfolk Vanguard is located within an area of seabed that is subject to a micro-tidal 69.
regime, with an average spring tidal range of up to 1.5m. This low tidal range is due
to the proximity of an amphidromic point that is positioned to the south of NV East
(Figure 8.5). At the amphidromic point, the tidal range is near zero. Tidal range then
increases with radial distance from this point. The crest of the tidal wave at high
water circulates around this point once during each tidal period.

June 2018 Norfolk Vanguard Offshore Wind Farm PB4476-005-008 Page 32
The southern boundary of NV West is about 40km from the amphidromic point, but 70.
is still only subject to tidal ranges less than 1.5m. The southern boundary of NV East
is located about 30km north of the amphidromic point and subject to a tidal range of
approximately 1m (Figure 8.5).
Due to the regional tidal regime being influenced by an amphidromic point in the 71.
southern North Sea, the tidal range increases with progression west along the
offshore cable corridor. At the Happisburgh South landfall, the tidal range is
approximately 2.6m on mean spring tides.
Storm surge 8.6.3.1
The North Sea is particularly susceptible to storm surges and water levels at Norfolk 72.
Vanguard could become elevated to between 1.5 and 1.6m above mean sea level
during a 1 in 1 year return period surge event and between 2.3 and 2.4m above
mean sea level during a 1 in 100-year return period surge event (Deltares, 2015b).
The coast can also be subject to significant surge activity which may raise water 73.
levels above those of the predicted tide. Predicted extreme water levels can exceed
predicted mean high water spring levels by more than 1m. Environment Agency
(2011) calculated 1 in 1 year water levels of 1.1m above MHWS at Lowestoft and
1.16m above MHWS at Cromer. The 1 in 50 year water levels are predicted to be
1.98m above MHWS at Lowestoft and 1.67m above MHWS at Cromer.
Tidal Currents 8.6.4
Regional tidal current velocity and direction are influenced by the presence of the 74.
amphidromic point and the anti-clockwise circulation around it. Figure 8.6 shows
current roses from a number of previous observations (ABPmer, 2012a) and shows
that in the vicinity of NV West and NV East, currents are generally aligned along a
north to south axis. South of the projects, a stronger north-north-east to south-
south-west axis is evident. Tidal currents generally flow north to south on the
flooding tide and south to north on the ebbing tide. This orientation is relatively
uniform throughout most of the offshore project area, with some small, localised
variations caused by flow around sandbanks (ABPmer, 2018). The highest current
velocities occur during spring tides.
Regional tidal current velocities show spatial variation, with stronger currents in the 75.
south and west. NV West and NV East experience tidal velocities of up to 1.2m/s
associated with the ebb tide (Deltares, 2015a, 2015b). Despite the low tidal range,
the regional tidal currents remain strong due to the rapid, anti-clockwise circulation
of the tide around the amphidromic point.
Tidal currents modelled as part of the East Anglia ZEA (ABPmer, 2012a) replicate the 76.
recorded directional and velocity data (Figure 8.7).

June 2018 Norfolk Vanguard Offshore Wind Farm PB4476-005-008 Page 33
Tidal current data measured by the Acoustic Wave and Current Meter (AWAC) 77.
located in 40m water depth within the NV East site between 4th December 2012 and
4th December 2013 (Table 8.8) describes the dominant current velocities and
directions. Diagram 8.1 shows a time series of tidal current velocities and Diagram
8.2 shows a current rose for the sea surface (where the currents are greatest). The
majority of the currents flow along a north-south aligned axis, with velocities up to
about 1m/s during spring tides and up to 0.6m/s during neap tides.
Diagram 8.1 Time series of current velocity measured by the AWAC in NV East between December 2012 and December 2013
Diagram 8.2 Near sea surface current rose measured in NV East between December 2012 and December 2013

June 2018 Norfolk Vanguard Offshore Wind Farm PB4476-005-008 Page 34
Tidal currents increase in the shallower waters nearer to the coast, especially across 78.
the offshore cable corridor as it approaches north-east Norfolk. Current velocities
here can exceed 1.5m/s.
Waves 8.6.5
The regional wave climate is composed of a combination of swell waves generated 79.
offshore and locally-generated wind-waves. Data from observation campaigns shows
that the predominant waves close to Norfolk Vanguard arrive from the south-south-
west with subordinate waves from the north (ABPmer, 2012a) (Figure 8.8).
The 1 in 50 year return period significant wave height is 7m in NV West (Deltares, 80.
2015b) and 8.2m in NV East (Deltares, 2012).
Across the majority of Norfolk Vanguard, water depths are likely to be sufficient to 81.
limit the effect of wave action on seabed sediments, apart from during exceptionally
stormy seas or over shallower areas.
Wave data measured by the AWAC in 40m water depth located within the NV East 82.
site between 4th December 2012 and 4th December 2013 (Table 8.8) describes the
dominant wave heights, periods and directions.
Diagram 8.3 shows the wave rose derived from the AWAC data. The waves mimic, to 83.
some extent, the dominant regional wave climate (ABPmer, 2012a), with the
majority of waves arriving from the south and south-south-west and the north and
north-north-west. Waves can, however, approach from all directions and there is a
small, but notable, proportion also arriving from the north-north-east.
Diagram 8.3 Wave rose measured in NV East between December 2012 and December 2013

June 2018 Norfolk Vanguard Offshore Wind Farm PB4476-005-008 Page 35
Diagram 8.4 shows a time series of significant wave heights recorded by the AWAC in 84.
NV East. The minimum significant wave height recorded during this period was
0.18m, with a maximum value of 5.94m. The mean significant wave height was
1.41m.
There were only six unique periods within the time series when wave heights 85.
exceeded 4m. In general, the waves appear to be confined to less than 3m, apart
from during storm events when the wave height significantly increases.
Diagram 8.4 Time series of wave heights measured by the AWAC in NV East between December 2012 and December 2013
Closer to the coast, water depths reduce and wave effects become more important 86.
in governing sediment transport. At shallow water locations off the north-east
Norfolk coast, waves are dominated by short-period wind-generated waves and
generally reveal a predominant wave direction from the north-east. Along the coast
itself the wave energy varies significantly and in places is heavily influenced by the
sheltering effect of nearshore banks.
Climate Change 8.6.6
Historical data show that the global temperature has risen significantly due to 87.
anthropogenic influences since the beginning of the 20th century, and predictions are
for an accelerated rise, the magnitude of which is dependent on the magnitude of
future emissions of greenhouse gases and aerosols.
As a result of future global warming, sea-level is predicted to rise at accelerated 88.
rates. Estimates of mean annual Global Mean Sea Level (GMSL) rise since 1993 are
2.4 to 3.2mm/year, an increase in the mean annual GMSL for the 20th century
(European Environment Agency, 2017). The rise in GMSL by 2100 is projected to be

June 2018 Norfolk Vanguard Offshore Wind Farm PB4476-005-008 Page 36
in the range of 0.53 to 0.97m, with the rate during 2081-2100 of 7 to 15mm per year.
Due to global climate change and local land level changes, mean sea level at the UK
coast is expected to be between 0.19 and 0.27m higher by 2050 than 1990 values
(Lowe et al., 2009).
As the indicative design life of the project is 35 years, and both onshore and offshore 89.
infrastructure is set far enough from the coast, this rise in sea level will not change
significantly through the design life of the project.
With respect to waves, climate projections indicate that wave heights in the 90.
southern North Sea will only increase by between 0 and 0.05m by 2100 and there is
predicted to be an insignificant effect on storm surges over the lifetime of Norfolk
Vanguard (Lowe et al., 2009).
One of the most important long-term implications of climate change is the physical 91.
response of the shoreline to future sea-level rise. Predicting shoreline erosion rates
is critical to forecasting future problem areas. It is likely that the future erosion rate
of the cliffs at Happisburgh South will be affected by the higher rates of sea-level rise
than historically. Higher baseline water levels would result in a greater occurrence of
waves impacting the toes of the cliffs, increasing their susceptibility to erosion.
Seabed Sediment Distribution 8.6.7
A regional seabed sediment grab sampling campaign was completed between 92.
September 2010 and January 2011, recovering 33 samples from NV West and 44
samples from NV East (MESL, 2011) (Figure 8.9). A total of 14 samples also fell within
the bounds of the offshore cable corridor (Figure 8.10). Additional surveys were
undertaken by Fugro (2017b) between 29th October and 10th November 2016 to fill
gaps in NV West and NV East, and to cover the entire length of the offshore cable
corridor. In total, 15 grab samples were collected from NV West, eight from NV East
(Figure 8.9) and 33 from the offshore cable corridor (Figure 8.10).
In 2016, Fugro undertook a shallow geotechnical investigation within the OWF sites 93.
(Fugro, 2017c). This included cone penetration test (CPT) sampling to a maximum
depth of 50m below the seabed, and vibrocores with a maximum recovery of 6.5m
below the seabed. Within the offshore cable corridor, CPT sampling was undertaken
to a maximum of 7m below the seabed and vibrocore recovery to a maximum of
6.5m below seafloor. A total of 64 vibrocores were recovered during the
geotechnical site investigation.
Norfolk Vanguard West 8.6.7.1
The particle size characteristics of all the seabed sediment samples collected in NV 94.
West (a total of 48) are presented in Appendix 8.1, Table 8.1. The dominant
sediment type is medium-grained sand with median particle sizes mainly between

June 2018 Norfolk Vanguard Offshore Wind Farm PB4476-005-008 Page 37
0.32 and 0.39mm. The mud content is less than 5% in 75% of the samples. However,
15% of the samples contain greater than 10% mud, ranging from 10% to 77%. The
gravel content varies from zero to 10% in 98% of the samples.
The vibrocores recovered an upper unit of silty fine to medium or coarse sand across 95.
most of NV West (Fugro, 2017c). The thickness of this layer varied between several
centimetres to approximately 3m. Below the sand, the sediment composition varied
across the site, with pockets of organic material at a number of sample sites. The
depth of this organic material varied between sites, with a number of sites having
several pockets throughout the core. The majority of NV West consisted of clayey
sediment below the sand to the full depth of the vibrocores, interspersed with
laminae of shell fragments, gravel, or fibrous material.
Norfolk Vanguard East 8.6.7.2
The particle size characteristics of all the seabed sediment samples collected in NV 96.
East (a total of 52) are presented in Appendix 8.1, Table 8.2. The dominant sediment
type is medium-grained sand (90-100% sand) with median particle sizes between
0.20mm and 0.35mm, with most samples (90%) containing less than 4% mud. The
gravel content varies from zero to 5% in 95% of the samples.
The vibrocores across NV East recovered a similar stratigraphy to those across NV 97.
West, with an upper unit of silty fine to medium sand at all sample locations. The
layer of sand extends to a depth of up to 6m below the seabed with occasional
pockets of fragmented shell. Below this layer (at the majority of locations) is slightly
sandy clay to depth. As with NV West, there were small pockets and laminae of
blackish material in a number of samples, with varying depths and amounts. This is a
possible indicator of organics. With many locations also having laminae of very dark
grey sand and/or decomposed plant material.
Offshore cable corridor 8.6.7.3
The particle size characteristics of all the seabed samples collected along the 98.
offshore cable corridor (a total of 47) are presented in Appendix 8.1, Table 8.3.
Sediment distribution is variable depending on location. However, the dominant
sediment size is sand. Higher proportions of mud (greater than 10%) were found in
25% of samples with two samples containing greater than 60% mud. A number of
samples closer to the coast contained greater than 50% gravel.
Along the offshore cable corridor, the majority of the vibrocores recovered an upper 99.
unit of slightly silty fine to medium sand. However, unlike the OWF sites, there are
some sample sites where clay material is at the seabed. The majority of cores
described some laminae and pockets of black material both close to the surface and
deeper in the core, as well as interspersed pockets of shell fragments (Fugro, 2017c).

June 2018 Norfolk Vanguard Offshore Wind Farm PB4476-005-008 Page 38
Bedload Sediment Transport 8.6.8
Regional bedload sediment transport pathways in the southern North Sea have been 100.
investigated by Kenyon and Cooper (2005) (Figure 8.11). They analysed the results of
modelling studies and bedform indicators and showed that tidal currents are the
dominant mechanism responsible for bedload transport. The dominant transport
vectors are to the north across the Norfolk Vanguard OWF sites and to the south and
north closer to the coast. There are very few transport vectors directed to the west
or the east either in the vicinity of Norfolk Vanguard or between the project and the
coast.
Sediment transport pathways within Norfolk Vanguard have been analysed using the 101.
orientation of bedforms. Sand waves are present across parts of NV West and NV
East, and exhibit a consistent asymmetry that indicates a net direction of transport
to the north. Tidal currents are the main driving force of sediment transport and,
due to the tidal asymmetry, move sediments in a northerly direction.
More complex patterns of sediment transport occur around the Haisborough 102.
sandbank system along the offshore cable corridor to the west of NV West and these
are described in section 8.6.10.
Suspended Sediment Transport 8.6.9
Suspended sediment concentrations across Norfolk Vanguard could range from 1 to 103.
35mg/l. During the Land Ocean Interaction Study (NERC, 2016), measurements in the
vicinity of Norfolk Vanguard recorded a maximum concentration of 83mg/l, but a
mean value of only 15mg/l during an 18 month deployment.
Eisma and Kalf (1987) carried out a water sampling programme in the North Sea in 104.
January 1980 and differentiated general surface concentrations from bottom
concentrations. They showed that in the vicinity of Norfolk Vanguard, the
concentrations were similar at both elevations, ranging from 5 to 10mg/l.
Measurements of suspended sediment concentrations were carried out at the AWAC 105.
station in NV East between December 2012 and December 2013 (Diagram 8.5).
Overall, suspended sediment concentrations were between 0.3 and 108mg/l
throughout that year. Concentrations were less than 30mg/l for 95% of the time and
less than 10mg/l for 70% of the time.

June 2018 Norfolk Vanguard Offshore Wind Farm PB4476-005-008 Page 39
Diagram 8.5 Time series of suspended sediment concentrations measured at the AWAC station in NV East between December 2012 and December 2013
Morphological Change of the Haisborough Sandbank System 8.6.10
The key driving mechanisms for the formation and maintenance of the sandbanks in 106.
the Haisborough, Hammond and Winterton SAC include tidal currents, waves and
sea-level change, whilst sediment transport (supply to/loss from) is also important in
enabling growth or decay. The offshore cable corridor for Norfolk Vanguard passes
through the southern end of this sandbank system.
The seabed within the Haisborough, Hammond and Winterton SAC can be broadly 107.
characterised as sand, with small areas of slightly gravelly sand and gravelly sand
(ABPmer, 2018). Fugro (2017b) completed grab sampling in this area which indicated
that the seabed sediment is mainly slightly gravelly sand with local areas of gravelly
sand, gravelly sandy mud and sandy gravel.
Morphological change of the Haisborough sandbank system and their 108.
interconnecting seabed was analysed by Burningham and French (2016) using
historical charts from six distinct time periods; 1840s, 1880s, 1910s, 1930s, 1950s
and 1990s. The results show that the gross morphology of the banks has remained
relatively consistent over the 160-year period. However, net change of seabed
bathymetry describes erosion and accretion around the banks with a dominance of
erosion over the wider seabed.
The patterns of erosion and accretion around Haisborough Sand describe a small 109.
clockwise rotation (accretion at its north-east and south-west ends with associated
erosion on the opposite sides of the bank from the accretion) of its along-bank

June 2018 Norfolk Vanguard Offshore Wind Farm PB4476-005-008 Page 40
orientation. The southern part of the bank has moved shoreward and the northern
part has moved seaward by similar average rates of 9m/year over 160 years
(Burningham and French, 2016).
Volumetric analysis of Haisborough Sand showed that the volume of the sandbank 110.
(1990s) above the -16m, -17m, -18m, -19m and -20m Ordnance Datum (OD)
contours was 227x106m3, 259x106m3, 294x106m3, 330x106m3 and 369x106m3,
respectively. Using an ‘optimal’ -18m OD bounding contour, the volume of
Haisborough Sand increased to a peak in the 1930s before losing volume (about
24%) up to the 1990s (Burningham and French, 2016).
The analysis of Burningham and French (2016) shows that Haisborough Sand is an 111.
active and very dynamic feature, with historic large-scale natural changes having
occurred over decadal periods.
The area within which the offshore cable corridor sits is an active and highly dynamic 112.
environment with development and maintenance of sand waves. Individual sand
wave migration rates vary between 5m and 30m/year with both northerly and
southerly migrating sand waves present within the cable corridor (Appendix 7.1 of
the Information to Support HRA report, document reference 5.3).
Coastal Processes at the Landfall 8.6.11
The coast of north-east Norfolk is an almost continuous line of cliffs composed of 113.
glacial sediments. The coast is exposed and rapid cliff erosion is occurring in places
including at Happisburgh South, and foreshore steepening is an issue throughout this
frontage. Severe storm events can rapidly change beach levels and the degree of
exposure of the natural or defended coastline.
Along the north-east Norfolk coastline, net sediment transport is to the south-east 114.
and the potential for transport increases with distance south as the coastline curves
from a west to east alignment to a north to south alignment (AECOM, 2012). During
storm surges, large waves predominantly approach from the north and north-east,
and combined with strong nearshore currents, transport sediment offshore and
alongshore.
At Happisburgh, more sediment is leaving from the south than is entering from the 115.
north-west, due in part to the updrift coastal defences and the change in orientation
of the coastline. The cliffs between Walcott and Happisburgh consist of fine
sediment, containing a mixture of silt/clay and fine sand, and therefore contribute
only small volumes of sediment to the beach system. The foreshore along this
stretch of coast primarily relies on supply of sediment from the north-west.

June 2018 Norfolk Vanguard Offshore Wind Farm PB4476-005-008 Page 41
The cliffs at the Happisburgh South landfall are eroding (see Appendix 4.1). The 116.
shoreline has shown a history of net retreat and pre-defence maps (1900 – 1937)
show the average erosion rate was between 0.4 and 2.1m/year. In 1959 and 1960
groynes were constructed at Happisburgh to increase the thickness of the beach. At
the same time revetments were installed to protect the upper foreshore and lower
cliff. An analysis of post-defence erosion rates (1937 – 1999) concluded that erosion
rates varied between 0.4 (north of the landfall site) and 0.8m/year.
Due to undermining and deterioration, some of these structures failed in 1991 and 117.
1996. The initial erosion was remarkably rapid and has resulted in the formation of a
bay (between defences to its north and south), which is located at the position of the
landfall site. Between 1994 and 2003, the average retreat rate at the widest part of
the bay was around 9m/year. However, subsequently, the cliff and shore platform
profiles have developed a near–equilibrium with the physical processes drivers and
cliff-top analysis in 2017 showed negligible retreat. The shore platform is
lithologically and geotechnically closely related to the lower layers of the cliff. There
is a dynamic relationship between cliff erosion and shore platform lowering.
The shoreline management plan (AECOM, 2012) states that the intended 118.
management at Happisburgh South is Managed Realignment over the next 100
years, meaning that beach and cliff erosion will be allowed to occur but in a
controlled manner (i.e. minimising the rate of coastal erosion in the short term using
appropriate temporary measures with a view to allowing time for measures to be
introduced to allow people to adapt to the changes in the medium and long term).
Any impacts of climate change on coastal erosion (including those to be managed as 119.
part of the managed realignment) have been taken into account in the embedded
mitigation for the project including selection and design of the long HDD, cable burial
depth and position of the onshore transition pit, which will avoid works on the
eroding cliffs. The onshore landfall works would be positioned far enough back from
the cliffs, and offshore works would be below -5.5m LAT, so as to not interact with
the coast.
Anticipated Trends in Baseline Conditions 8.6.12
The baseline conditions for marine geology, oceanography and physical processes 120.
will continue to be controlled by waves and tidal currents driving changes in
sediment transport and then seabed morphology. Natural feedback processes will
lead to changes in the physical drivers as the morphology changes, and vice versa,
leading to a pseudo-dynamic equilibrium. In addition to the long-term established
performance of these drivers, the future baseline will be affected by environmental
changes including climate change driven sea-level rise (see Section 8.6.6). This will
have the greatest impact at the coast where more waves will impinge on the cliffs,

June 2018 Norfolk Vanguard Offshore Wind Farm PB4476-005-008 Page 42
potentially increasing their rate of erosion. Climate change will have little effect in
the marine sector where landscape scale changes in water levels (water depths) far
outweigh the effect of minor changes due to sea-level rise.
Potential Impacts and Effects 8.7
Impact Receptors 8.7.1
The principal receptors with respect to marine geology, oceanography and physical 121.
processes are those features with an inherent geological or geomorphological value
or function which may potentially be affected by the project. For individual projects,
the East Anglia ZEA recommended that the potential impacts on marine geology,
oceanography and physical processes should be considered for four receptor
groupings, two of which are relevant to Norfolk Vanguard; the sensitive ‘East Anglia’
coastline and the ‘Norfolk’ Natura 2000 site. These receptor groups have been
retained for Norfolk Vanguard to allow comparability with previous work and
cumulative impact assessment. The other two receptors (‘Suffolk’ Natura 2000 site
and ‘non-designated sandbanks’) are considered to be too distant from the project
to be influenced. The specific features defined within these two receptor groupings
as requiring assessment are listed in Table 8.10 and shown in Figure 8.12.
Table 8.10 Marine geology, oceanography and physical processes receptors relevant to Norfolk Vanguard
Receptor group (Figure
8.18) Extent of coverage Description of features
Distance from Norfolk
Vanguard
East Anglian coast
(waves and sediment
transport)
King’s Lynn to Felixstowe Sand and gravel beaches,
dunes and cliffs
47km from the nearest
point of NV West with
the export cable
making landfall on the
East Anglian coast (at
Happisburgh South)
Norfolk designated
sites (waves, currents
and sediment
transport)
Haisborough, Hammond
and Winterton SAC Offshore sandbanks
Offshore cable corridor
passes through the SAC.
NV West is 6.5km from
the SAC at the closest
point.
Cromer Shoal Chalk Beds
MCZ Chalk reef
The offshore cable
corridor is
approximately 60m
from the southern
boundary of the MCZ.
North Norfolk Sandbanks
and Saturn Reef SAC
Offshore sandbanks and
reef
The SAC is 2km to the
north of NV West

June 2018 Norfolk Vanguard Offshore Wind Farm PB4476-005-008 Page 43
This section assesses the significance of potential impacts on the wave and/or 122.
current and/or sediment transport regimes on the receptor groups of the sensitive
‘East Anglia’ coastline and the ‘Norfolk’ Natura 2000 site.
Haisborough, Hammond and Winterton SAC 8.7.1.1
The Haisborough, Hammond and Winterton SAC is highly dependent upon the 123.
prevailing marine physical processes. This SAC is located off the north-east coast of
Norfolk and presents marine features which meet the descriptions for the two Annex
I habitats ‘Sandbanks slightly covered by sea water all the time’ and ‘Reefs‘ formed
by Sabellaria spinulosa. The Conservation Objectives for this SAC are:
Maintain the Annex I Sandbanks in Favourable Condition, implying that existing
evidence suggests the feature to be in favourable condition; and
Maintain or restore the Annex I reefs in Favourable Condition, implying that the
feature is degraded to some degree.
In 2010, Annex I sandbank habitat occupied a maximum area of 66,900ha (6.69km2) 124.
of the Haisborough, Hammond and Winterton SAC. This is equivalent to 0.84% of the
UK total Annex I sandbank resource (Natura 2000, 2015).
North Norfolk Sandbanks and Saturn Reef SAC 8.7.1.2
North Norfolk Sandbanks and Saturn Reef SAC is located off the north-east coast of 125.
Norfolk approximately 2km north of NV West. The marine features and conservation
objectives are the same as those for Haisborough, Hammond and Winterton SAC
above.
Cromer Shoal Chalk Beds MCZ 8.7.1.3
Closer to the coast, is the Cromer Shoal Chalk Beds MCZ. The site was designated as 126.
a MCZ in January 2016. It is located up to 200m off the north Norfolk coast, covering
an area of 321km2, with maximum depth of 20m.
The Conservation Objectives for this MCZ are: 127.
Maintain favourable conditions for moderate energy infralittoral rock, high
energy infralittoral rock, moderate energy circalittoral rock, high energy
circalittoral rock, subtidal chalk, subtidal coarse sediment, subtidal mixed
sediments, subtidal sand, peat and clay exposures and north Norfolk coast
(subtidal geological feature).
The offshore cable corridor is routed to the south of this MCZ to avoid potential 128.
impacts on the MCZ.

June 2018 Norfolk Vanguard Offshore Wind Farm PB4476-005-008 Page 44
Effects 8.7.2
In addition to the receptor groups listed in Table 8.10, there are other potential 129.
changes (effects) to marine physical processes associated with Norfolk Vanguard
which may manifest themselves as impacts upon a wider grouping of receptors.
These include marine water and sediment quality, benthic and intertidal ecology, fish
and shellfish ecology, commercial fisheries, and offshore and intertidal archaeology
and cultural heritage.
In respect of these effects, the assessment only defines the magnitude of change. 130.
The assessments of the significance of impacts arising from these effects or changes
on other receptors are made within the relevant chapters of this ES pertaining
directly to those receptor types.
Justification of the Use of Existing Numerical Modelling at East Anglia ONE 8.7.3
Considerable previous numerical modelling work has been undertaken specifically 131.
for the adjacent East Anglia ONE project to assess the potential effects of the
offshore wind farm on the marine physical environment. The results of the modelling
from East Anglia ONE (within the East Anglia Zone) are used as part of the expert-
based assessment and judgement of potential construction and operation and
maintenance effects/impacts at Norfolk Vanguard described later in this ES chapter.
The physical basis for using the modelling results is that the East Anglia ONE wind
farm design and marine physical processes operating at the site are similar to NV
West and NV East and therefore provide suitable evidence (and is a suitable
analogue) to support the assessment of effects/impacts at Norfolk Vanguard.
Justification for using the modelling results at East Anglia ONE as the principal 132.
evidence of potential effects/impacts at Norfolk Vanguard is provided in Table 8.11,
which describes the designs and the existing physical and sedimentary conditions
(water depths, tidal currents, waves, seabed sediments, sediment transport,
bedforms and suspended sediment concentrations) at each of the sites.
The similarities (and dissimilarities) between the characteristics of each site are: 133.
Water depths at East Anglia ONE (30-53m LAT) are slightly greater than those at
NV West (25-50m LAT) and NV East (22-42m LAT), but are predominantly
comparable;
Tidal currents demonstrate similar directions on the flood tide (to the south or
south-south-west) and ebb tide (to the north or north-north-east);
Tidal currents have similar asymmetries with stronger ebb flows than flood
flows;
Peak spring tidal current velocities are about 1.2m/s at East Anglia ONE, and
1.1-1.2m/s at NV West and NV East;

June 2018 Norfolk Vanguard Offshore Wind Farm PB4476-005-008 Page 45
Predominant waves approach all sites from similar directions (from the south-
south-west in East Anglia ONE and NV West and from the south-west in NV
East);
The mean and maximum significant wave heights at NV East were 1.4m and
5.9m, respectively, between December 2012 and December 2013, and 1.3m
and 5.5m, respectively, at East Anglia ONE over the same period; and
Seabed sediments at all three sites are predominantly medium-grained sand
with mud comprising less than 5%.
As a result of the above characteristics, the following marine physical processes are 134.
similar at each site:
Tidal currents are the main driver of sediment transport and water depths are
large enough to limit the effect of wave action on seabed sediments;
Net sediment transport is towards the north as a result of the asymmetry in
tidal currents;
Sand waves of similar dimensions (6-8m high and wavelengths of 200-500m)
occur across all three sites with crests oriented perpendicular to the
predominant current direction;
The majority of the sand waves are asymmetric with their steeper sides
predominantly facing north, indicating migration towards the north; and
Baseline suspended sediment concentrations are typically in the range 0 to
40mg/l.
Whilst it is recognised that there are small differences in water depth and metocean 135.
conditions, and likely gravity base structure (GBS) sizes between the East Anglia ONE
and Norfolk Vanguard projects, the highly conservative nature of the previous
numerical modelling (discussed further throughout the impact assessments) more
than covers any differences in the effect that may arise due to these factors.

June 2018 Norfolk Vanguard Offshore Wind Farm PB4476-005-008 Page 46
Table 8.11 Comparison of design and marine physical processes parameters at East Anglia ONE, NV East and NV West
Parameter East Anglia ONE NV West NV East
Area 300km2 295km
2 297km
2
Distance from shore 43.4km at closest point 47km at closest point 70km at closest point
Indicative capacity Up to 1200MW Up to 1800MW Up to 1800MW
Combined maximum capacity of 1800MW
Maximum number of largest turbine
foundations
150 (8MW) 90 (20MW).
Maximum number of smallest turbine
foundations
240 (5MW) 200 (9MW)
Maximum GBS foundation diameter 50m (240 turbines with 50m
diameter GBS foundations were
modelled)
50m (20MW)
Maximum foundation dimensions for a
floating platform
N/A 70 x 70m (20MW)
Offshore cable corridor length 73km 85km 100km
Cable landfall Bawdsey Happisburgh South
Minimum water depth (LAT) 30.5m 25m 22m
Maximum water depth (LAT) 53.4m 50m 42m
Current regime The flood tide is to the south to south
south-west and the ebb tide is to the
north to north north-east.
Peak spring depth-averaged tidal
current speeds within the East Anglia
ONE site are around 1.15 to 1.25m/s,
with the fastest velocities recorded in
the north of the site. Mean neap
In the vicinity of NV West, currents are
generally aligned along a north-south
axis. Tidal currents generally flow north
to south on the flooding tide and south
to north on the ebbing tide.
The fastest flows across NV West are
typically associated with the ebb tide,
with velocities up to 1.2m/s.
In the vicinity of NV East, currents are
generally aligned along a north-south
axis. Tidal currents generally flow north
to south on the flooding tide and south
to north on the ebbing tide.
Maximum velocities at NV East are up to
about 1.2m/s during spring tides and up
to 0.6m/s during neap tides.
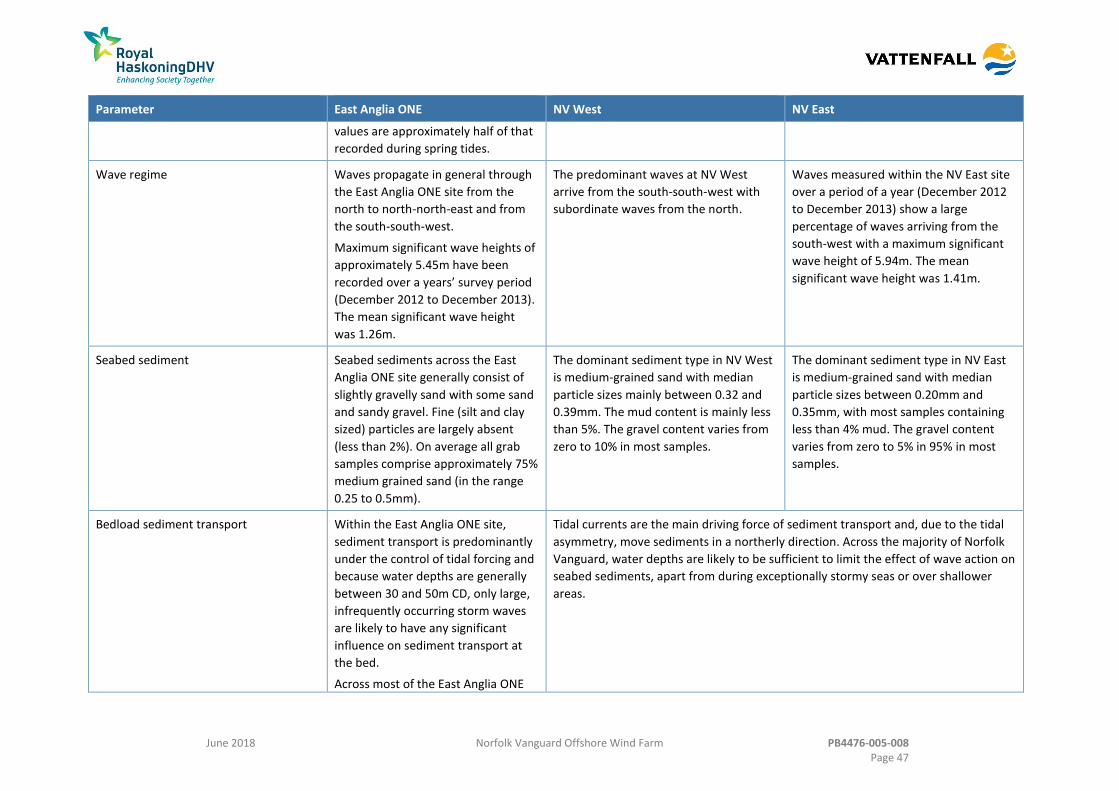
June 2018 Norfolk Vanguard Offshore Wind Farm PB4476-005-008 Page 47
Parameter East Anglia ONE NV West NV East
values are approximately half of that
recorded during spring tides.
Wave regime Waves propagate in general through
the East Anglia ONE site from the
north to north-north-east and from
the south-south-west.
Maximum significant wave heights of
approximately 5.45m have been
recorded over a years’ survey period
(December 2012 to December 2013).
The mean significant wave height
was 1.26m.
The predominant waves at NV West
arrive from the south-south-west with
subordinate waves from the north.
Waves measured within the NV East site
over a period of a year (December 2012
to December 2013) show a large
percentage of waves arriving from the
south-west with a maximum significant
wave height of 5.94m. The mean
significant wave height was 1.41m.
Seabed sediment Seabed sediments across the East
Anglia ONE site generally consist of
slightly gravelly sand with some sand
and sandy gravel. Fine (silt and clay
sized) particles are largely absent
(less than 2%). On average all grab
samples comprise approximately 75%
medium grained sand (in the range
0.25 to 0.5mm).
The dominant sediment type in NV West
is medium-grained sand with median
particle sizes mainly between 0.32 and
0.39mm. The mud content is mainly less
than 5%. The gravel content varies from
zero to 10% in most samples.
The dominant sediment type in NV East
is medium-grained sand with median
particle sizes between 0.20mm and
0.35mm, with most samples containing
less than 4% mud. The gravel content
varies from zero to 5% in 95% in most
samples.
Bedload sediment transport Within the East Anglia ONE site,
sediment transport is predominantly
under the control of tidal forcing and
because water depths are generally
between 30 and 50m CD, only large,
infrequently occurring storm waves
are likely to have any significant
influence on sediment transport at
the bed.
Across most of the East Anglia ONE
Tidal currents are the main driving force of sediment transport and, due to the tidal
asymmetry, move sediments in a northerly direction. Across the majority of Norfolk
Vanguard, water depths are likely to be sufficient to limit the effect of wave action on
seabed sediments, apart from during exceptionally stormy seas or over shallower
areas.

June 2018 Norfolk Vanguard Offshore Wind Farm PB4476-005-008 Page 48
Parameter East Anglia ONE NV West NV East
site, net sediment transport is
towards the north as a result of the
asymmetry in tidal currents.
Bedforms Dense fields of active migrating sand
waves are extensive in the southern
third of the East Anglia ONE site, as
well as in the east and the northern
corner of the site. These sand waves
can have heights of over 8m and
wavelengths of up to 500m, whilst
many of the sand waves show some
degree of asymmetry.
Sand waves within NV West are up to 6m
high with crests oriented approximately
east-west, indicative of north-south tidal
currents. The majority of the sand waves
are asymmetric with their steeper sides
facing north, indicating migration
towards the north.
Asymmetric sand waves occur across
much of the seabed of NV East with
crests oriented north-west to south-east
or west to east. The sand waves have
wavelengths of 200 to 300m and heights
of 2 to 7m.
Suspended sediment concentrations Late winter and spring (near-bed)
suspended sediment concentration
values are typically in the range 0 to
40mg/l and finer material held in
suspension will generally be
transported in a northerly direction
across the East Anglia ONE site.
Measurements of suspended sediment concentrations in NV East over a period of a
year recorded values between 0.3 and 108mg/l throughout that year. Concentrations
were less than 30mg/l for 95% of the time and less than 10mg/l for 70% of the time.

June 2018 Norfolk Vanguard Offshore Wind Farm PB4476-005-008 Page 49
Embedded Mitigation 8.7.4
Norfolk Vanguard Limited has committed to a number of techniques and engineering 136.
designs/modifications inherent as part of the project, during the pre-application
phase, in order to avoid a number of impacts or reduce impacts as far as possible.
Embedding mitigation into the project design is a type of primary mitigation and is
an inherent aspect of the EIA process.
A range of different information sources has been considered as part of embedding 137.
mitigation into the design of the project (for further details see Chapter 5 Project
Description, Chapter 4 Site Selection and Assessment of Alternatives) including
engineering preference, ongoing discussions with stakeholders and regulators,
commercial considerations and environmental best practice.
Embedded Mitigation Relevant to Marine Geology, Oceanography and Physical 8.7.4.1
Processes
A minimum separation of 680m has been defined between adjacent wind turbines 138.
(based on four times the rotor diameter of the smallest 9MW turbines which is
170m) within each row and between rows. This is required in order to minimise
aerodynamic wake effects from the wind turbine generators but also servers to
minimise the potential for marine physical process interactions between adjacent
wind turbine foundations.
The selection of appropriate foundation designs and sizes at each wind turbine 139.
location would be made post consent based on further site investigation and best
available technology at the time of construction.
For piled foundation types, such as monopiles and jackets with pin piles, pile-driving 140.
would be used in preference to drilling where it is practicable to do so (i.e. where
ground conditions allow). This would minimise the quantity of sub-surface sediment
that is released into the water column from the installation process. It is estimated
that drilling may be required at 50% of the locations in order to provide a
conservative assessment.
Micro-siting would be used where possible to minimise the requirements for seabed 141.
preparation prior to foundation installation.
Cables would be buried where possible, minimising the requirement for cable 142.
protection measures and thus potential effects on sediment transport. Cable
protection would be minimised in the nearshore zone (within the 10m depth
contour), and is expected to be used only at the HDD exit point.
A long HDD would be used to install the cables at the landfall, exiting in water 143.
deeper than -5.5m LAT. Cables would be installed at sufficient depth below the

June 2018 Norfolk Vanguard Offshore Wind Farm PB4476-005-008 Page 50
coastal shore platform and cliff base by the HDD, in order to have no effect on
coastal erosion. Erosion would continue as a natural phenomenon driven by waves
and subaerial processes, which would not be affected by Norfolk Vanguard. Natural
coastal erosion throughout the lifetime of the project has been allowed for within
the project design by ensuring appropriate set back distances from the coast for the
HDD entry point.
Norfolk Vanguard Limited has committed to routing the offshore cable corridor to 144.
the south of the Cromer Shoal Chalk Beds MCZ to avoid potential impacts on the
MCZ.
All seabed material arising from cable installation activities in the Haisborough, 145.
Hammond and Winterton SAC would be placed back into the SAC using an approach,
to be agreed with Natural England and the MMO, which would ensure that the
sediment is available to replenish the sandbank features and remain within the SAC.
Monitoring 8.7.5
An In Principle Monitoring Plan (document reference 8.12) and outline PEMP 146.
(document reference 8.14) is submitted with the DCO application. The development
of the detailed design and final PEMP will refine the worst case impacts assessed in
this EIA. It is recognised that monitoring is an important element in the
management and verification of the actual project impacts. The requirement for
appropriate design and scope of monitoring would be agreed with the MMO in
consultation with the relevant SNCB prior to construction works commencing.
Worst Case Scenarios 8.7.6
The offshore project area consists of: 147.
The offshore cable corridor with landfall at Happisburgh South;
Norfolk Vanguard West (NV West); and
Norfolk Vanguard East (NV East).
The detailed design of Norfolk Vanguard (including numbers of wind turbines, layout 148.
configuration, requirement for scour protection etc.) will not be determined until
after the DCO has been determined. Therefore, realistic worst case scenarios in
terms of potential impacts/effects on marine geology, oceanography and physical
processes are adopted to undertake a precautionary and robust impact assessment.
The realistic worst case scenarios used are described in the sections below.
Foundations 8.7.6.1
Within Norfolk Vanguard, several different sizes of wind turbine are being 149.
considered in the range between 9MW and 20MW. In order to achieve the
June 2018 Norfolk Vanguard Offshore Wind Farm PB4476-005-008 Page 51
maximum 1,800MW export capacity, there would be between 90 (20MW) and 200
(9MW) wind turbines.
In addition, up to two offshore electrical platforms, two accommodation platforms, 150.
two meteorological (met) masts, two LiDAR platforms and two wave buoys, plus
offshore cables are considered as part of the worst case scenario.
A range of foundation options are currently being considered, these include: 151.
Wind turbines – jacket (pin-pile or suction caisson), GBS, monopile (piled or
suction caisson) and tension leg floating platforms;
Offshore electrical platforms – GBS, pin-pile or suction caisson;
Accommodation platforms – GBS, pin-pile or suction caisson;
Met masts - GBS, monopile or pin-pile;
LiDAR - floating with anchors or monopile; and
Wave buoys – floating with anchors.
The largest disturbance areas are associated with gravity anchors for floating 152.
foundations.
Layout 8.7.6.2
The layout of the wind turbines would be defined post consent but would be based 153.
on the following maxima:
1800MW in NV East, 0MW in NV West; or
0MW in NV East, 1800MW in NV West.
Any other potential layouts that are considered up to a maximum of 1800MW (e.g. 154.
900MW in NV West and 900MW in NV East) lie within the envelope of these
scenarios and will have a smaller effect on marine geology, oceanography and
physical processes than the two potential worst cases.
Phasing 8.7.6.3
Norfolk Vanguard Limited is currently considering constructing the project in one of 155.
the following phase options.
A single phase of up to 1800MW; or
Two phases of up to a combined 1800MW capacity.
Phasing is only applicable to the assessment of construction and decommissioning 156.
impacts and not the assessment of impacts during the O&M phase. Where
appropriate, each construction impact is assessed for the one and two phase
scenarios to take account of the different temporal aspects of each option and to
clearly demonstrate which one is the worst case scenario. For certain impacts,

June 2018 Norfolk Vanguard Offshore Wind Farm PB4476-005-008 Page 52
phasing is not relevant and this is explained in the assessment. The infrastructure
would be the same for each phasing scenario.
Construction programme 8.7.6.4
The maximum construction window is five years, with an indicative offshore 157.
construction window of four years is anticipated for the full 1800MW capacity. Table
8.12 and Table 8.13 provide indicative construction programmes for the single phase
and two phase options, respectively.
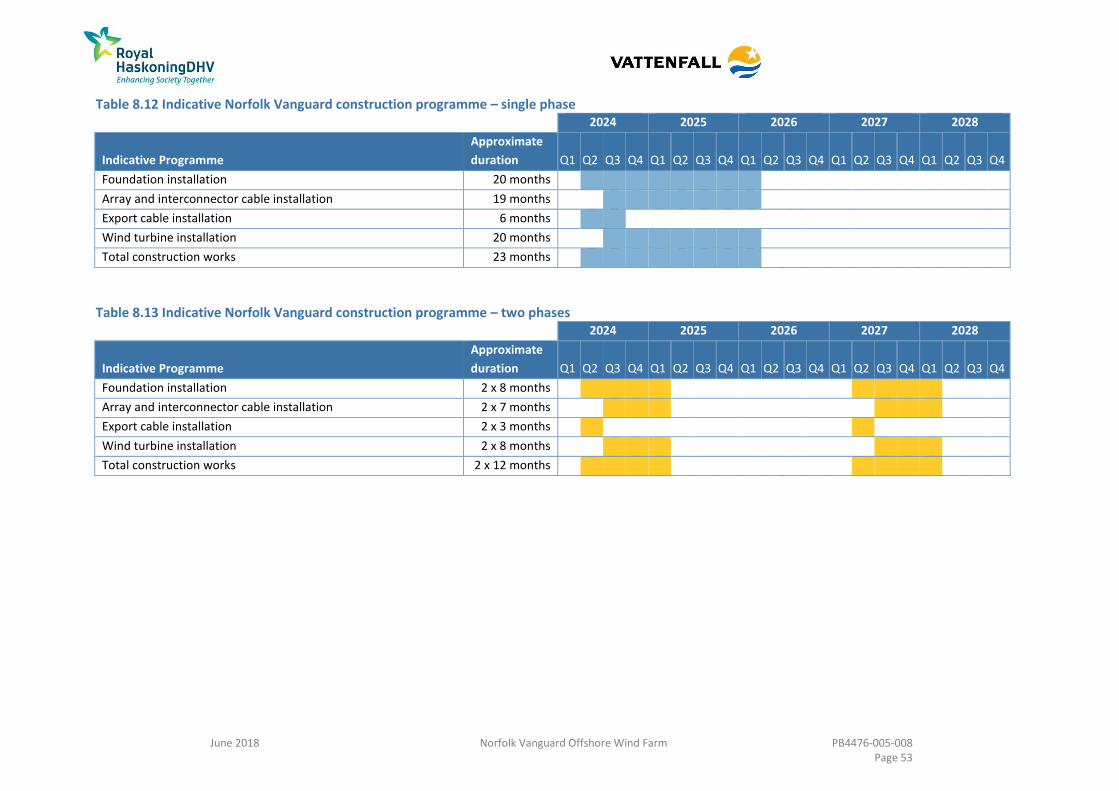
June 2018 Norfolk Vanguard Offshore Wind Farm PB4476-005-008 Page 53
Table 8.12 Indicative Norfolk Vanguard construction programme – single phase
2024 2025 2026 2027 2028
Indicative Programme
Approximate
duration Q1 Q2 Q3 Q4 Q1 Q2 Q3 Q4 Q1 Q2 Q3 Q4 Q1 Q2 Q3 Q4 Q1 Q2 Q3 Q4
Foundation installation 20 months
Array and interconnector cable installation 19 months
Export cable installation 6 months
Wind turbine installation 20 months
Total construction works 23 months
Table 8.13 Indicative Norfolk Vanguard construction programme – two phases
2024 2025 2026 2027 2028
Indicative Programme
Approximate
duration Q1 Q2 Q3 Q4 Q1 Q2 Q3 Q4 Q1 Q2 Q3 Q4 Q1 Q2 Q3 Q4 Q1 Q2 Q3 Q4
Foundation installation 2 x 8 months
Array and interconnector cable installation 2 x 7 months
Export cable installation 2 x 3 months
Wind turbine installation 2 x 8 months
Total construction works 2 x 12 months

June 2018 Norfolk Vanguard Offshore Wind Farm PB4476-005-008 Page 54
Cable installation 8.7.6.5
8.7.6.5.1 Pre-installation works
Boulder clearance
Pre-construction surveys will identify any requirement for boulder clearance within 158.
the offshore project area. Boulder clearance would involve localised relocation of
boulders which would have no overall impact on marine geology, oceanography and
physical processes and is therefore not considered further.
Pre-lay grapnel run
A pre-lay grapnel run would be undertaken to clear any identified debris in advance 159.
of each phase of installation. The maximum width of seabed disturbance along the
pre-grapnel run would be 20m. This is encompassed by the maximum footprint of
cable installation works associated with ploughing (30m disturbance width).
Pre-sweeping
The potential for sand wave levelling (pre-sweeping) has been assessed as a 160.
potential strategy for cable installation to ensure the cables are installed at a depth
below the seabed surface that is unlikely to require reburial throughout the life of
the project. Sand wave levelling may also be required to create a suitable surface for
foundation installation. A final decision on this would be made after consent, in the
Cable Specification, Installation and Monitoring Plan (required under [condition
14(1)(g) (DCO Schedules 9 and 20) and condition 9.(1) (g) (DCO Schedules 11 and
12)]) following pre-construction surveys.
Indicative pre-sweeping volumes and areas for the offshore cable corridor are 161.
outlined in Table 8.14. The sediment released at any one time would depend on the
capacity of the dredger. The maximum width of pre-sweeping in the offshore cable
corridor would be approximately 37m depending on the depth of sand waves. The
37m pre-sweeping width is based on sand wave depth of approximately 5m with a
slope gradient of 1:3 and a width of 7m at the base of the dredged area. This would
be in discrete areas only and not along the full length of the corridor.
Table 8.14 Parameters for pre-sweeping activity for the offshore export cables Parameter Maximum volume for the section
of offshore cable corridor within the Haisborough, Hammond and Winterton SAC (m
3)
Maximum volume for the entire offshore export cables (including the SAC volume) (m
3)
Per trench (pair of export cables) 250,000 1,200,000
Total for two trenches 500,000 2,400,000
Sediment arising from pre-sweeping in the Haisborough, Hammond and Winterton 162.
SAC would be disposed within the section of the offshore cable corridor overlapping
the SAC. The exact location(s) for disposal of sediment would be determined in

June 2018 Norfolk Vanguard Offshore Wind Farm PB4476-005-008 Page 55
consultation with Natural England and the MMO following the pre-construction
surveys. Sediment arising from pre-sweeping in the offshore cable corridor to the
east of the SAC would be deposited in this section of the offshore cable corridor or in
the OWF sites. Figure 2 of Chapter 5 Project Description displays the disposal sites.
No pre-sweeping or disposal is anticipated in the nearshore section of the offshore
cable corridor.
The worst case scenario for the volume of sediment arising from seabed preparation 163.
in the OWF sites would be associated with levelling the seabed for 90 20MW floating
tension leg platforms with gravity anchors (approximately 90m x 90m preparation
area) resulting in a total footprint of 729,000m2 (8,100m2 per foundation) and a
potential sediment volume of 3,645,000m3 (based on a maximum thickness of 5m of
sediment levelled). In addition, levelling of 7,500m2 per offshore accommodation
and electrical platform and 1,257m2 per met mast may be required resulting in a
footprint of 32,513m2 and sediment volume of 162,566m3. Sediment arising within
the OWF sites would be deposited back into the OWF sites (Figure 2 of Chapter 5
Project Description).
Removal of existing disused cables
There are seven out-of-service cables in the offshore cable corridor (all in the 164.
Haisborough, Hammond and Winterton SAC). Four are intact and span the offshore
cable corridor; it is assumed that these will be crossed subject to agreement with the
cable owners. Two appear to have been cut previously and stop within the offshore
cable corridor; it is proposed that these will be further cut subject to agreement with
the cable owners and clump weights will be placed on the cut ends. Finally, one
enters and exits the southern edge of the cable corridor which would be avoided,
where possible.
8.7.6.5.2 Cable burial
Following the cable pre-installation works as described in section 8.7.6.5.1, the 165.
cables would be installed and buried. The following methods may be used for cable
burial and the final burial technique would be dependent on the results of the pre-
construction surveys and post-consent procurement of the cable installation
contractor:
Ploughing (worst case scenario with a trench width of 10m and disturbance
width of 30m);
Trenching or cutting; or
Jetting.
The maximum length of export cable trenches is 200km from the offshore electrical 166.
platforms in NV East to landfall, based on an average length of 100km per trench for
a total of two trenches, each containing a pair of cables. The maximum volume of

June 2018 Norfolk Vanguard Offshore Wind Farm PB4476-005-008 Page 56
sediment arising from cable burial (using ploughing as the worst case method) would
therefore be 3,000,000m3 based on a realistic worst case average burial depth of 3m
with a V-shaped cross-section of 10m width at the seabed surface (see section
5.4.13.2.4 of Chapter 5 Project Description). Ploughing would create temporary
mounds either side of the trench and therefore it is expected that only a small
proportion of the 3,000,000m3 would result in sediment plumes during cable
installation.
The length of the offshore cable corridor within the SAC is approximately 40km and 167.
therefore the total length of trenches would be 80km in the SAC.
8.7.6.5.3 Landfall
As previously discussed, the export cable landfall would be at Happisburgh South 168.
using long HDD and duct installation, with cable burial on the seaward side of the
drilling exit point. The landfall ducts will exit in the subtidal zone beyond -5.5m LAT
and approximately 1km from the onshore drilling location.
8.7.6.5.4 Cable protection
Unburied cable
Cable burial is expected to be possible throughout the offshore cable corridor, with 169.
the exception of cable crossing locations. In order to provide a conservative impact
assessment, a contingency estimate is included, should cable burial not be possible
due to unexpected hard substrate. The assessment includes up to 10km of seabed
protection per cable pair (20km in total) for the whole offshore cable corridor, of
which, 4km per pair (8km in total) could be within the SAC. The maximum width and
height of cable protection for unburied cable (per pair of cables) would be 5m and
0.5m, respectively.
Cable or pipeline crossings
There are nine existing cables and two pipelines which the Norfolk Vanguard export 170.
cables would need to cross (five cables and one pipeline within the SAC). Each
crossing would require a carefully agreed procedure between the respective
cable/pipeline owners.
At each crossing, protection would be installed to protect the existing pipeline or 171.
cable being crossed. Each Norfolk Vanguard cable would then be placed on top of
the layer of protection with a further layer of cable protection placed on top.
The maximum width and length of cable protection for cable crossings would be 10m 172.
and 100m, respectively. The maximum height of cable crossings would be 0.9m.

June 2018 Norfolk Vanguard Offshore Wind Farm PB4476-005-008 Page 57
Types of cable protection
The following cable protection options may be used and this would be determined 173.
during the final design of the project:
Rock placement - the laying of rocks on top of the cable;
Concrete mattresses - prefabricated flexible concrete coverings that are laid on
top of the cable. The placement of mattresses is slow and as such is only used
for short sections of cable;
Grout or sand bags - bags filled with grout or sand could be placed over the
cable. This method is also generally applied on smaller scale applications;
Frond mattresses - used to provide protection by stimulating the settlement of
sediment over the cable. This method develops a sandbank over time
protecting the cable but is only suitable in certain water conditions. This
method may be used in close proximity to offshore structures; and
Uraduct or similar - a protective shell which can be fixed around the cable to
provide mechanical protection. Uraduct is generally used for short spans at
crossings or near offshore structures where there is a high risk from falling
objects. Uraduct does not provide protection from damage due to fishing trawls
or anchor drags.
Vessel footprints 8.7.6.6
Anchor placement may be required during jointing of the export cable and during 174.
foundation installation. As a worst case scenario it is estimated that there may be
two joints per export cable pair (one of which may be in the SAC). An average of one
vessel placing anchor at each wind turbine has also been assessed. The seabed
footprint associated with anchor placement would be approximately 150m2 (based
on six anchors per vessel).
In addition, jack-up vessels may be used during foundation installation and an 175.
estimate of two jack-up placements per turbine during construction has been
assessed as a worst case. A jack-up footprint of 792m2 has been assessed based on
up to six legs per vessel.
Maintenance 8.7.6.7
8.7.6.7.1 Turbines
Regular maintenance of the wind turbines will be required during operation. These 176.
works will have minimal impact on marine geology, oceanography and physical
processes. However, the placement of anchors or jack-up vessels during
maintenance activity has been considered in order to provide a comprehensive
assessment. A maximum average of two turbine locations per day, visited by a jack-
up vessel has been assessed.
June 2018 Norfolk Vanguard Offshore Wind Farm PB4476-005-008 Page 58
8.7.6.7.2 Cable repairs
During the life of the project, there should be no need for scheduled repair or 177.
replacement of the subsea cables. However, periodic inspection would be required
and where necessary, reactive repairs and reburial would be undertaken.
While it is not possible to determine the number and location of repair works that 178.
may be required during the life of the project, an estimate of one export cable repair
every year (one repair every five years within the SAC) is included in the assessment.
In addition, one inter-connector cable and two array cable repairs every five years
has been assessed.
In most cases a cable failure would lead to the following operation: 179.
Vessel anchor placement (150m2 footprint)
Exposing/unburying the damaged part of the cable using jetting (3m
disturbance width)
Cutting the cable, assumed to be approximately 300m of export cable or inter-
connector cable subject to the nature of the repair, or the whole length of an
array cable (approximately 2km);
Lifting the cable ends to the repair vessel;
Jointing a new segment of cable to the old cable;
Lowering the cable (and joints) back to the seabed; and
Cable burial, where possible.
8.7.6.7.3 Cable reburial
Cables could become exposed due to migrating sand waves, although this is unlikely 180.
if pre-sweeping is used to bury the cables below the reference seabed level. An In
Principle Monitoring Plan (document 8.12) is submitted with the DCO application
which outlines the types of monitoring that may be required, including a cable burial
survey to ensure the cables remain buried and if they do become exposed, re-burial
works would be undertaken. The details of any monitoring would be determined
post consent in consultation with the relevant Regulators and stakeholders.
For the export cables installed without pre-sweeping, a worst case scenario of 181.
reburial of up to 20km length per export cable pair at approximately 5 year intervals
is assumed in order to provide a conservative assessment. Of this 20km, reburial of
up to 10km per cable within the SAC at five year intervals has been estimated based
on the worst case scenario that no pre-sweeping is undertaken. However, re-burial
requirements would be substantially lower if pre-sweeping is carried out prior to
cable installation.
Given the small scale of the predicted repairs, the changes to suspended sediment 182.
concentrations and seabed level as a result of repair work would be negligible in
June 2018 Norfolk Vanguard Offshore Wind Farm PB4476-005-008 Page 59
magnitude and short-lived, with no potential significant impact and therefore this is
not assessed further.
Table 8.15 describes the relevant worst case scenarios for marine geology, 183.
oceanography and physical processes.
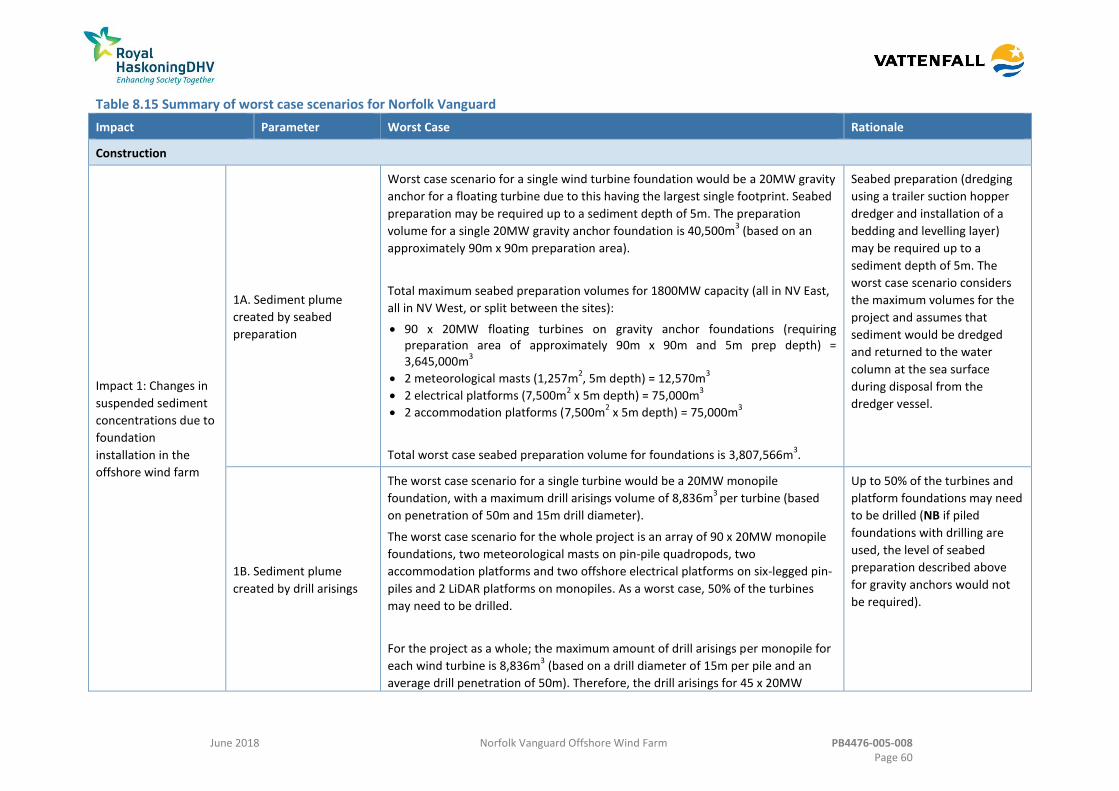
June 2018 Norfolk Vanguard Offshore Wind Farm PB4476-005-008 Page 60
Table 8.15 Summary of worst case scenarios for Norfolk Vanguard
Impact Parameter Worst Case Rationale
Construction
Impact 1: Changes in
suspended sediment
concentrations due to
foundation
installation in the
offshore wind farm
1A. Sediment plume
created by seabed
preparation
Worst case scenario for a single wind turbine foundation would be a 20MW gravity
anchor for a floating turbine due to this having the largest single footprint. Seabed
preparation may be required up to a sediment depth of 5m. The preparation
volume for a single 20MW gravity anchor foundation is 40,500m3 (based on an
approximately 90m x 90m preparation area).
Total maximum seabed preparation volumes for 1800MW capacity (all in NV East,
all in NV West, or split between the sites):
90 x 20MW floating turbines on gravity anchor foundations (requiring preparation area of approximately 90m x 90m and 5m prep depth) = 3,645,000m
3
2 meteorological masts (1,257m2, 5m depth) = 12,570m
3
2 electrical platforms (7,500m2 x 5m depth) = 75,000m
3
2 accommodation platforms (7,500m2 x 5m depth) = 75,000m
3
Total worst case seabed preparation volume for foundations is 3,807,566m3.
Seabed preparation (dredging
using a trailer suction hopper
dredger and installation of a
bedding and levelling layer)
may be required up to a
sediment depth of 5m. The
worst case scenario considers
the maximum volumes for the
project and assumes that
sediment would be dredged
and returned to the water
column at the sea surface
during disposal from the
dredger vessel.
1B. Sediment plume
created by drill arisings
The worst case scenario for a single turbine would be a 20MW monopile
foundation, with a maximum drill arisings volume of 8,836m3
per turbine (based
on penetration of 50m and 15m drill diameter).
The worst case scenario for the whole project is an array of 90 x 20MW monopile
foundations, two meteorological masts on pin-pile quadropods, two
accommodation platforms and two offshore electrical platforms on six-legged pin-
piles and 2 LiDAR platforms on monopiles. As a worst case, 50% of the turbines
may need to be drilled.
For the project as a whole; the maximum amount of drill arisings per monopile for
each wind turbine is 8,836m3 (based on a drill diameter of 15m per pile and an
average drill penetration of 50m). Therefore, the drill arisings for 45 x 20MW
Up to 50% of the turbines and
platform foundations may need
to be drilled (NB if piled
foundations with drilling are
used, the level of seabed
preparation described above
for gravity anchors would not
be required).

June 2018 Norfolk Vanguard Offshore Wind Farm PB4476-005-008 Page 61
Impact Parameter Worst Case Rationale
quadropod foundations is 397,608m3.
Drill arisings from other platforms:
Meteorological masts - 2 x pin-pile quadropod = 1,131m3
Accommodation platforms - 2 x six legged pin-pile = 1,696m3
Offshore electrical platforms - 2 x six legged pin-pile = 1,696m3
LiDAR - 2 x monopiles = 189m3
Total drill arisings volume for foundations in the OWF sites is 402,320m3
Impact 2: Changes in
seabed level
(morphology) due to
foundation
installation in the
offshore wind farm
2A. Sediment deposited
from plume created by
seabed preparation
As Impact 1A. As Impact 1A.
2B. Sediment deposited
from plume created by
drill arisings and fate of
aggregated drill arisings
that are not suspended
during foundation
installation
As Impact 1B for deposition from the plume.
For non-suspended sediment, the worst case assumes that the sediment that is
released from drilling is wholly in the form of aggregated ‘clasts’ of finer sediment
that remain on the seabed (at least initially) in the form of a mound, rather than
being disaggregated into individual fine sediment components immediately upon
release.
Footprint of an individual mound arising from a 20MW quadropod foundation
would be 8,836m2 (or 450,636m
2 total for the whole site including 50% of the 90
20MW wind turbines plus accommodation platforms, met masts and offshore
electrical platform foundations).
Up to 50% of the turbines may
need to be drilled (NB if piled
foundations with drilling are
used, the level of seabed
preparation described above
would not be required).
Impact 3: Changes in
suspended sediment
concentrations during
offshore export cable
installation (including
nearshore)
3. Sediment plume
created by offshore
export cable installation
Pre-sweeping (dredging) of the offshore export cable route may be required for up
to 2,400,000m3 of dredged sediment, including:
Up to 500,000m3 pre-sweeping within the Haisborough, Hammond and
Winterton SAC based on calculations by CWind (2017);
Up to 100,000m3 for the rest of the offshore cable corridor based on
calculations by CWind (2017); and
Maximum offshore export
cable trench length is 200km
based on four HVDC cables in 2
trenches (either 2 trenches
from West, 2 from East or 1
from each site) and 100%

June 2018 Norfolk Vanguard Offshore Wind Farm PB4476-005-008 Page 62
Impact Parameter Worst Case Rationale
Up to 1,800,000m3 based on 30km export cable length in the OWF sites that
may require pre-sweeping (assuming a width of 20m and average depth of 3m).
Following pre-sweeping, trenching (e.g. by jetting or ploughing) would be required
to bury the cables. Trenches would have a ‘V’-shaped profile with a top width of
10m. The worst case average burial depth for the export cables would be 3m and
therefore 3,000,000m3 of sediment would be disturbed.
The offshore cable will make landfall at Happisburgh South. Cable ducts would be
installed at the landfall so that the ends of the offshore cables can be pulled
through from the landward side. The HDD will exit an offshore location, away from
the beach (up to 1000m in drill length from the onshore HDD location). Cable
burial will be undertaken from the HDD exit point.
Disturbance volumes within the Haisborough, Hammond and Winterton SAC.
Note these areas are included in the calculations above
The sediment released due to disposal of pre-swept sediment in the SAC would
equate to approximately 500,000m3. The sediment released at any one time would
be subject to the capacity of the dredger. Disposal would be at least 50m from
Sabellaria reef identified during pre-construction surveys.
The sediment released due to trenching for the offshore export cables would
equate to approximately 1,200,000m3 within the SAC (based on 10m trench width
with a V shaped profile x 3m maximum average depth x 2 trenches x 40km length
in the SAC). This would be back filled naturally or manually.
burial.
80km of this will be within the
Haisborough, Hammond and
Winterton SAC (based on 40km
x 2 trenches).
Impact 4: Changes in
seabed level due to
offshore export cable
installation
4A. Changes in seabed
level due to disposal of
sediment from sand wave
levelling
As Impact 3.
4B. Interruptions to
bedload transport caused
by sand wave levelling
The disposal of any sediment that would be disturbed or removed during sand wave levelling would occur within the
Norfolk Vanguard offshore cable corridor. Sediment from the Haisborough, Hammond and Winterton SAC would be
deposited back within the SAC.

June 2018 Norfolk Vanguard Offshore Wind Farm PB4476-005-008 Page 63
Impact Parameter Worst Case Rationale
4C. Changes in seabed
level due to deposition
from the suspended
sediment plume during
offshore export cable
installation
As Impact 3.
Impact 5: Changes in
suspended sediment
concentrations during
array and
interconnector cable
installation
5A. Sediment plume
created by array cable
installation
Worst case scenario is 600km of array cables with 100% burial.
Potential for pre-sweeping a 20m wide corridor to clear debris or level sand waves
prior to excavation of trenches.
Average depth of 3m.
Total volume 36,000,000m3.
5B. Sediment plume
created by
interconnector cable
installation
Maximum parameters for interconnector cables between offshore electrical
platforms are:
150km trench length based on up to three trenches (50km length) with 100% burial.
Average burial depth of 3m.
Potential for pre-sweeping a 20m wide corridor to clear debris or level sand waves prior to excavation of trenches.
Total volume = 9,000,000m3
In the OWF sites and/or in the
offshore cable corridor
between NV East and NV West
depending on the location of
the offshore electrical
platforms.
Impact 6: Changes in
seabed level due to
array and
interconnector cable
installation
6A. Sediment deposited
from plume created by
array cable installation
As Impact 5A. As Impact 5A.
6B. Sediment deposited
from plume created by
interconnector cable
installation
As Impact 5B.
The disposal of any sediment
that would be disturbed or
removed during seabed
preparation would occur within
the Norfolk Vanguard OWF

June 2018 Norfolk Vanguard Offshore Wind Farm PB4476-005-008 Page 64
Impact Parameter Worst Case Rationale
sites.
Impact 7: Indentations
on the seabed due to
installation vessels
7A. Jack-up footprints Total footprint is 316,800m
2 (based on two jacking operations per platform (6
total) and two per wind turbine for 200 x 9MW turbines).
Worst case scenario is jack-up
barges with six legs per barge
(792m2 combined leg area).
7B. Anchor footprints Total impacted volume of 91,800m
3 (1,800m
3 of which is within the export cable
corridor).
Worst case scenario is six
anchors each with a footprint
of 25m2 equating to a total
footprint of 150m2 per
installation.
Operation and Maintenance
Impact 1: Changes to
the Tidal Regime due
to the Presence of
Structures in the OWF
sites (wind turbines
and platforms)
1. Changes to tidal
currents created by
presence of wind
turbines
A larger number of GBS with minimum wind turbine spacing is the worst case
(1800MW in one site). This equates to a worst case scenario of 200 9MW GBS
wind turbine foundations (based on a 40m base diameter plus scour protection of
200m diameter) totalling 6,283,186m2 of obstructions with a foundation height of
12m and minimum spacing of 680m.
The worst case scenario also includes two meteorological masts on GBS, two
accommodation platforms and two electrical platforms on GBS.
GBS are the worst case
foundation types for effects on
tidal currents. This is based on
GBS having the greatest cross-
sectional area within the water
column (compared to other
foundation types) representing
the greatest physical blockage
to tidal currents.
The worst case scenario for
changes to the tidal regime
does not include effects caused
by cable protection. This is
because, although flows would
tend to accelerate over the
protection and then decelerate
on the ‘down-flow’ side, they
would return to baseline values
a very short distance from the
structure. Hence, the effect on
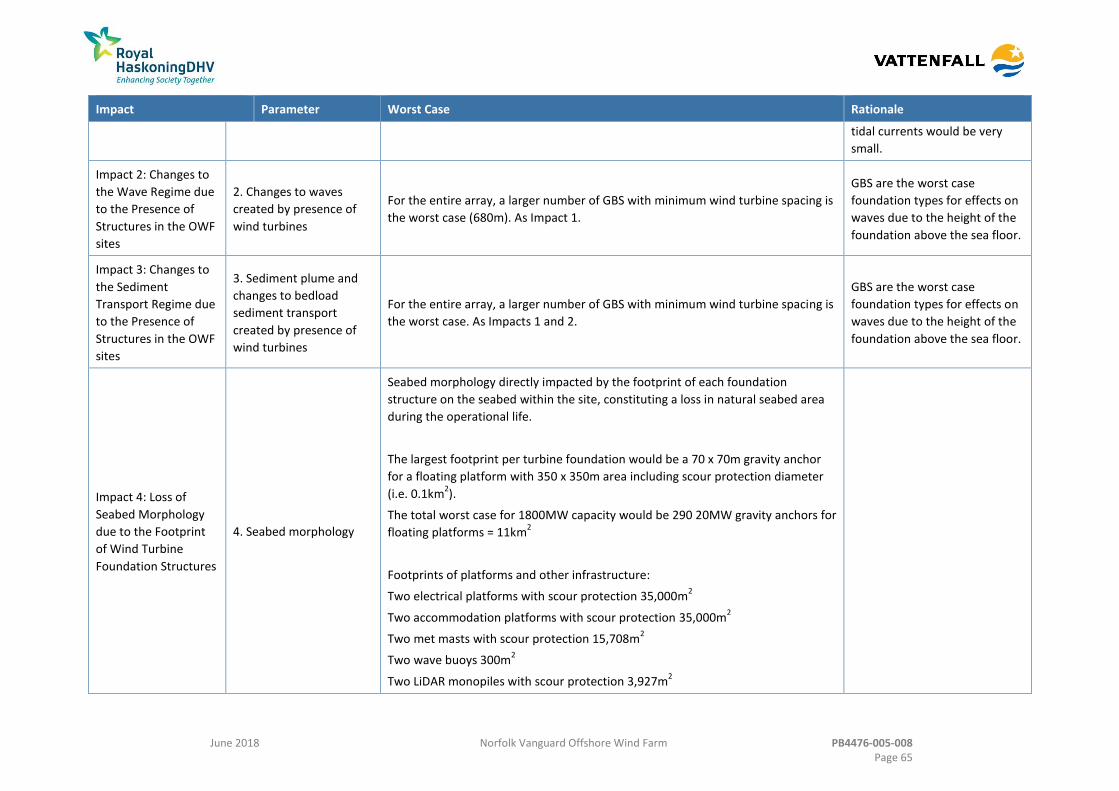
June 2018 Norfolk Vanguard Offshore Wind Farm PB4476-005-008 Page 65
Impact Parameter Worst Case Rationale
tidal currents would be very
small.
Impact 2: Changes to
the Wave Regime due
to the Presence of
Structures in the OWF
sites
2. Changes to waves
created by presence of
wind turbines
For the entire array, a larger number of GBS with minimum wind turbine spacing is
the worst case (680m). As Impact 1.
GBS are the worst case
foundation types for effects on
waves due to the height of the
foundation above the sea floor.
Impact 3: Changes to
the Sediment
Transport Regime due
to the Presence of
Structures in the OWF
sites
3. Sediment plume and
changes to bedload
sediment transport
created by presence of
wind turbines
For the entire array, a larger number of GBS with minimum wind turbine spacing is
the worst case. As Impacts 1 and 2.
GBS are the worst case
foundation types for effects on
waves due to the height of the
foundation above the sea floor.
Impact 4: Loss of
Seabed Morphology
due to the Footprint
of Wind Turbine
Foundation Structures
4. Seabed morphology
Seabed morphology directly impacted by the footprint of each foundation
structure on the seabed within the site, constituting a loss in natural seabed area
during the operational life.
The largest footprint per turbine foundation would be a 70 x 70m gravity anchor
for a floating platform with 350 x 350m area including scour protection diameter
(i.e. 0.1km2).
The total worst case for 1800MW capacity would be 290 20MW gravity anchors for
floating platforms = 11km2
Footprints of platforms and other infrastructure:
Two electrical platforms with scour protection 35,000m2
Two accommodation platforms with scour protection 35,000m2
Two met masts with scour protection 15,708m2
Two wave buoys 300m2
Two LiDAR monopiles with scour protection 3,927m2

June 2018 Norfolk Vanguard Offshore Wind Farm PB4476-005-008 Page 66
Impact Parameter Worst Case Rationale
Total footprint due to foundations: 11.6km2
Impact 5:
Morphological and
Sediment Transport
Effects due to Cable
Protection Measures
for Array and
Interconnector Cables
5A. Seabed morphology
and sediment transport
along array cables
Up to 60km of cable protection may be required in the unlikely event that array
cables cannot be buried (based on 10% of the length) resulting in a footprint of
300,000m2 and volume 150,000m
3 (based on 0.5m height).
Array cable protection at turbines 100m cable length x 5m width x 200 turbines =
100,000m2 (50,000m
3).
Array cable crossings protection: 10 crossings x 100m x 10m = 10,000m2. Total
volume of rock berm cable protection will be 9,000m3
(based on 0.9m height).
Cable protection for unburied
cables will be up to 0.5m in
height and 5m wide in a
trapezoid shape.
Cable protection for crossings
will require 250m3 per crossing.
5B. Seabed morphology
and sediment transport
along interconnector
cables
Interconnector cable protection approaching platforms 100m cable length x 5m
width x 2 platforms = 1,000m2 footprint, with volume 500m
3 (based on 0.5m
height).
Surface laid interconnector cable protection 5m width x 15,000m (10% of the
length) = 75,000m2 (volume 37,500m
3).
Interconnector cable crossings protection crossings – captured within export
cable/array cable crossing total.
Cable protection for unburied
cables will be up to 0.5m in
height and 5m wide in a
trapezoid shape.
Impact 6:
Morphological and
Sediment Transport
Effects due to Cable
Protection Measures
for Offshore Export
Cables (including
nearshore and at the
coastal landfall)
6. Seabed morphology
and sediment transport
along offshore export
cables
Cable protection would be required at locations where the export cables cross other cables or pipelines; at the
landfall HDD exit points; in the unlikely event that cable burial is not possible; and/or during the operation and
maintenance phase should cables become unburied.
Crossings
A total of eleven crossings are required for each cable pair (up to 22 crossings) resulting in a total footprint of
22,000m2
(based on a width of 10m and length of 100m of cable protection per crossing).
The volume of cable protection would be 19,800m3 (based on 0.9m height).
Nearshore (within 10m depth contour)
Cable protection may be required at each of the landfall HDD exit points. This would entail one mattress (6m length x
3m width x 0.3m height) plus rock dumping (5m length x 5m width x 0.5m height) at each exit point (up to two cable
pairs) resulting in a footprint of 86m2 and volume of 36m
3
Unburied cables

June 2018 Norfolk Vanguard Offshore Wind Farm PB4476-005-008 Page 67
Impact Parameter Worst Case Rationale
In the unlikely event that cable burial is not possible due to hard substrate being encountered, up to 10km per cable
pair outside the SAC and 4km inside the SAC per cable pair (28km in total) could require additional protection
resulting in a footprint of 140,000m2 and volume of 7000m
3.
Impact 7: Cable
repairs/reburial and
maintenance vessel
footprints
Repairs/Reburial
Unplanned repairs and reburial of cables may be required during O&M:
Reburial of all sections of array cable is estimated once every 5 years – 3m disturbance width x 600km = 1,800,000m
2.
Two array cable repairs per year are estimated. An array cable may be up to 6km (based on turbine spacing) – 3m disturbance width x 6,000m x 2 = 36,360m
2.
One interconnector repair per year is estimated – 10m disturbance width x
300m repair length = 3,000m2.
1 x export cable repair per year with 300m sections removed and replaced.
Disturbance width of 3m = 900m2 per year.
Reburial of up to 20km length per export cable (10km in the Haisborough,
Hammond and Winterton SAC and 10km outside the SAC) = 120,000m2
based
on two cables and a disturbance width of 3m = 1,200,000m2 (1.2km
2)
The need for reburial would be significantly less where pre-sweeping is used.
In Haisborough, Hammond and Winterton SAC (encompassed within the above
parameters)
One export cable repair every 5 years is estimated within the SAC.
It is estimated that 300m sections would be removed and replaced per repair.
Disturbance width of 3m = 900m2 every 5 years
Anchor placement associated with repair works – 150m2
based on 6 anchors per
vessel
Reburial of up to up to 10km per export cable pair may be required should pre-
sweeping not be undertaken. The disturbance width would be approximately 3m
and therefore the total disturbance would be 60,000m2. If reburial is required, it is
likely that this would be in relatively short sections (e.g. 1km) at any one time.

June 2018 Norfolk Vanguard Offshore Wind Farm PB4476-005-008 Page 68
Impact Parameter Worst Case Rationale
Jack-up footprints
Maintenance of wind turbine generators will be required during O&M. An
estimate of up to two locations visited per day during O&M using a jack up vessel
with a footprint of 792m2 which would lead to a total area of up to 0.58km
2 per
year (assumes large jack up with six legs each).
Anchor footprints
Anchored vessels placed temporarily on site to maintain the wind turbines. Worst
case scenario is six anchors each with a footprint of 25m2 equating to a maximum
total footprint of 150m2 per installation (450m
3 footprint volume based on an
indicative anchor penetration depth of 3m).
Decommissioning
Impact 1: Changes in
Suspended Sediment
Concentrations due to
Wind Turbine
Foundation Removal
1. Suspended sediment
concentrations
Removal of foundations is likely to be limited to parts that are above the seabed. Impacts will be less than during the
construction phase. Scour protection would likely be left in situ.
Impact 2: Changes in
Seabed Level due to
Wind Turbine
Foundation Removal
2. Seabed morphology Removal of foundations is likely to be limited to parts that are above the seabed. Impacts will be less than during the
construction phase. Scour protection would likely be left in situ.
Impact 3: Changes in
Suspended Sediment
Concentrations during
Removal of parts of
the Array and
Interconnector Cables
3. Suspended sediment
concentrations
Removal of some or all of the array cables, interconnector cables, and offshore export cables. Cable protection would
likely be left in situ.
Impact 4: Changes in
Seabed Level due to
Removal of parts of
the Array and
Interconnector Cables
4. Seabed morphology Removal of some or all of the array cables, interconnector cables, and offshore export cables. Cable protection would
likely be left in situ.

June 2018 Norfolk Vanguard Offshore Wind Farm PB4476-005-008 Page 69
Impact Parameter Worst Case Rationale
Impact 5: Changes in
Suspended Sediment
Concentrations during
Offshore Export Cable
Removal (including
nearshore and at the
coastal landfall)
5. Suspended sediment
concentrations
Removal of some or all of the array cables, interconnector cables, and offshore export cables. Cable protection would
likely be left in situ.
Impact 6: Indentations
on the Seabed due to
Decommissioning
Vessels
6. Seabed morphology
As with construction the, worst case scenario is jack-up barges with six legs per barge (792m2 combined leg area).
Total footprint is 316,800m2 (based on two jacking operations per wind turbine and per platform for 200 x 9MW
turbine sites).
Worst case scenario for vessel anchors is six anchors at each with a footprint of 25m2 equating to a total footprint of
150m2 per installation.

June 2018 Norfolk Vanguard Offshore Wind Farm PB4476-005-008 Page 70
Potential Impacts during Construction 8.7.7
During the construction phase of Norfolk Vanguard, there is the potential for 184.
foundations and cable installation activities to disturb sediment, potentially resulting
in changes in suspended sediment concentrations and/or seabed levels or, in the
case of nearshore cable installation, shoreline morphology due to deposition or
erosion.
The two worst case layout scenarios (discussed in section 8.7.6.2) are assessed with 185.
construction carried out in either one or two phases. A detailed assessment of the
single-phase approach is presented and then highlights are given of any pertinent
differences associated with NV East and NV West as well as the two-phase approach.
Impact 1A: Changes in suspended sediment concentrations due to seabed 8.7.7.1
preparation for wind turbine gravity anchor foundation installation
Seabed sediments and shallow near-bed sediments within Norfolk Vanguard would 186.
be disturbed during any levelling or dredging activities to create a suitable base prior
to foundation installation. The worst case scenario assumes that sediment would be
dredged and returned to the water column at the sea surface as overflow from a
dredger vessel. This process would cause localised and short-term increases in
suspended sediment concentrations both at the point of dredging at the seabed and,
more importantly, at the point of its discharge back into the water column. The
disposal of any sediment that would be disturbed or removed during foundation
installation would occur within the Norfolk Vanguard OWF sites.
Mobilised sediment from these activities may be transported by wave and tidal 187.
action in suspension in the water column. The disturbance effects at each wind
turbine location are likely to last for no more than a few days, within an overall
single-phase foundation installation programme of approximately 20 months.
The median particle sizes of seabed sediments across NV West and NV East are 188.
predominantly 0.32mm to 0.39mm (medium-grained sand) and 0.20mm to 0.35mm
(medium-grained sand), respectively. Most seabed samples contained less than 5%
mud and less than 10% gravel. Baseline suspended sediment concentrations in NV
East are typically between 0.3 and 108mg/l throughout a year. Concentrations are
less than 30mg/l for 95% of the time and less than 10mg/l for 70% of the time.
For a sediment release from an individual wind turbine foundation, the worst case 189.
scenario is associated with the dredging volume for each 20MW gravity anchor
foundation, with a maximum preparation area of 8,100m2. This yields a worst case
dredging volume of 40,500m3 per foundation based on levelling up to 5m of
sediment.
June 2018 Norfolk Vanguard Offshore Wind Farm PB4476-005-008 Page 71
For the total volume released during the construction phase, the worst case scenario 190.
is associated with the maximum number (90) of 20MW gravity anchor foundations
with a maximum preparation area of 8,100m2. This yields a total dredging volume of
3,645,000m3. Also, using a worst case approach the following platforms would be
installed:
Up to two meteorological masts yielding a dredging volume of 12,570m3
Up to two offshore electrical platforms yielding a dredging volume of 75,000m3;
and
Up to two accommodation platforms yielding a dredging volume of 75,000m3.
Therefore, the total maximum seabed preparation volume under the single-phase 191.
approach would be 3,807,566m3 of excavated sediment. All of this volume would be
from NV East or NV West (if all 1800MW is located in a single site) or would be split
between the sites for the two-phased approach.
Expert-based assessment suggests that, due to the predominance of medium-192.
grained sand across the Norfolk Vanguard OWF sites, the sediment disturbed by the
drag head of the dredger at the seabed would remain close to the bed and settle
back to the bed rapidly. The majority of the sediment released at the water surface
from the dredger vessel would fall rapidly (minutes or tens of minutes) to the seabed
as a highly turbid dynamic plume immediately upon its discharge (within a few tens
of metres along the axis of tidal flow).
Some of the finer sand fraction from this release and the very small proportion of 193.
mud that is present are likely to stay in suspension for longer and form a passive
plume which would become advected by tidal currents. Due to the sediment sizes
present, this is likely to exist as a measurable but modest concentration plume (tens
of mg/l) for around half a tidal cycle (up to six hours). Sediment would eventually
settle to the seabed in proximity to its release (within a few hundred metres up to
around a kilometre along the axis of tidal flow) within a short period of time (hours).
Whilst lower suspended sediment concentrations would extend further from the
dredged area, along the axis of predominant tidal flows, the magnitudes would be
indistinguishable from background levels.
This expert-based assessment is supported by the findings of a review of the 194.
evidence base into the physical impacts of marine aggregate dredging on sediment
plumes and seabed deposits (Whiteside et al., 1995; John et al., 2000; Hiscock and
Bell, 2004; Newell et al., 2004; Tillin et al., 2011; Cooper and Brew, 2013).
Modelling simulations undertaken for the East Anglia ONE site using the Delft3D 195.
plume model (ABPmer, 2012b) were used as part of the expert-based assessment of
suspended sediment concentrations arising from seabed preparation. The sediment
June 2018 Norfolk Vanguard Offshore Wind Farm PB4476-005-008 Page 72
types across East Anglia ONE (5% gravel, 93% sand and 2% mud) are similar to those
across NV West and NV East (10% gravel, 85% sand and 5% mud).
Also, NV West, NV East and East Anglia ONE are similar distances from the 196.
amphidromic point, and therefore the tidal currents and hence sediment dispersion
patterns would be similar. Given these similarities, the earlier modelling studies for
East Anglia ONE are considered to represent a suitable analogue for verifying the
conclusions of the more qualitative expert-based assessment described in this ES.
In the East Anglia ONE modelling studies (ABPmer, 2012b), consecutive daily releases 197.
of 22,500m3 of sediment (mostly medium-grained sand, but also with small
proportions of gravel, other sand fractions and mud) were simulated at the water
surface at 15 wind turbine locations. Although, this sediment release is about half
the release volume from each of the 20MW wind turbine foundations (40,500m3), it
can still be used as a comparative analogue for a single or two concurrent foundation
installations (in NV West or in NV East) to establish the broad magnitude of effect.
The ABPmer (2012b) model predicted that close to the release locations, suspended 198.
sediment concentrations would be very high (orders of magnitude in excess of
natural background levels), but of very short duration (seconds to minutes) as the
dynamic plume falls to the seabed. Within the passive plume, suspended sediment
concentrations above background levels were low (less than 10mg/l) and within the
range of natural variability. Net movement of fine-grained sediment retained within
the passive plume was to the north, in accordance with the direction of residual tidal
flow. Suspended sediment concentrations rapidly returned to background levels
after cessation of the release into the water column.
Given this finding from the modelled consecutive installation of 15 wind turbine 199.
foundations (ABPmer, 2012b), it is expected that effects from installation of 90
foundations across the whole of Norfolk Vanguard would be greater. Given that the
maximum sediment volume released through seabed preparation at Norfolk
Vanguard would be greater than the modelled release at East Anglia ONE; the worst
case suspended sediment concentrations will also be greater (given similar
hydrodynamic conditions). Hence, it is anticipated that the worst case suspended
sediment concentrations at Norfolk Vanguard would not likely exceed a maximum of
20mg/l within the passive plume, with northward movement and reduced
concentrations within a dynamic plume and rapid dissipation to background levels
after release into the water column has stopped.
The point of release would move across the site with progression of the construction 200.
sequence. There would be little additional effect of scaling-up from the modelled 15
foundations to the 90 foundations proposed across Norfolk Vanguard. This is
because the modelled results show that after completion of installation of a

June 2018 Norfolk Vanguard Offshore Wind Farm PB4476-005-008 Page 73
foundation, the suspended sediment concentrations do not persist but rapidly return
to background levels. Hence, the release of sediment from one foundation
installation would not last for a long enough time to interact with the next
installation. This would be the case regardless of the number of foundations that
were installed and so the cumulative effects of 15 and 90 installations would be
similarly small.
8.7.7.1.1 Assessment of effect magnitude and/or impact significance – Single phase for
NV West and/or NV East
The expert-based assessment of the dynamic and passive plume effects on 201.
suspended sediment concentrations for Norfolk Vanguard are consistent with the
findings of the earlier modelling studies for the East Anglia ONE project. This means
there is high confidence in the assessment of effects.
The worst case changes in suspended sediment concentrations due to seabed 202.
preparation for GBS foundation installation are likely to have the magnitudes of
effect shown in Table 8.16. These magnitudes of effect are the same regardless of
whether all the foundations are in NV West or in NV East (the two worst case layout
options). There are no cumulative effects associated with concurrent installations of
foundations in the two sites, as individual plumes from concurrent installations
would not overlap spatially.
Table 8.16 Magnitude of effect on suspended sediment concentrations due to foundation installation under the worst case scenario
Location Scale Duration Frequency Reversibility Magnitude of
Effect
Near-field* High Negligible Negligible Negligible Medium
Far-field Low Negligible Negligible Negligible Low
*The near-field effects are confined to a small area, likely to be several hundred metres up to a kilometre from
each foundation location.
The effects on suspended sediment concentrations due to foundation installation for 203.
Norfolk Vanguard do not directly impact upon the identified receptor groups for
marine geology, oceanography and physical processes (i.e. the offshore SACs and
East Anglia coast). This is because the designated features of North Norfolk
Sandbanks and Saturn Reef SAC/ (2km north of NV West) and the Haisborough,
Hammond and Winterton SAC (6.5km west of Norfolk Vanguard) are related to
processes operating on the seabed and not in the water column. Also, regional
sediment transport directions are directed along a north-south axis with no east to
west component, and so there is no pathway for suspended sediment to reach the
East Anglian coast. Hence, there is no impact on the identified receptors groups
associated with the suspended sediment generated by the project. However, the

June 2018 Norfolk Vanguard Offshore Wind Farm PB4476-005-008 Page 74
effects have the potential to impact upon other receptors and the assessment of
impact significance is addressed within the relevant chapters of this ES.
8.7.7.1.2 Assessment of effect magnitude and/or impact significance – Two phases for
NV West and/or NV East
The worst-case release of sediments through seabed preparation would occur over 204.
two distinct phases, each lasting up to eight months (rather than a single 20 month
period), for the installation of the foundations. Whilst this scenario would mean that
the effects are caused in two separate periods, with a longer additive duration of
disturbance, this would not materially change the assessment of significance
compared with a single-phase approach. Any potential implications for receptors will
be considered in the relevant chapters.
Impact 1B: Changes in suspended sediment concentrations due to drill arisings for 8.7.7.2
installation of piled foundations for wind turbines
Sub-seabed sediments within Norfolk Vanguard would become disturbed during any 205.
drilling activities that may be needed at the location of piled foundations. The
disposal of any sediment that would be disturbed or removed during foundation
installation would occur within the Norfolk Vanguard OWF sites. The worst case
scenario for a release from an individual wind turbine assumes a monopile
foundation for the largest 20MW wind turbine. In this case, a 15m drill diameter
would be used from the seabed to a depth of 50m, releasing a maximum of 8,836m3
of sediment into the water column. This compares with a maximum volume of
1,155m3 for each monopile foundation for an individual 9MW wind turbine with a
maximum diameter of 7m drilled to a maximum depth of 30m.
Norfolk Vanguard Limited estimates that the maximum number of foundations that 206.
would require drilling would be 50%. Hence, for the total volume released during the
construction phase, the worst case scenario for drilling is associated with the
maximum number of 20MW monopiles. This yields a total sediment volume of
397,608m3 (45 x 20MW) compared with 115,454m3 for 100 9MW wind turbines.
Also, piled quadropod foundations with a diameter of 3m would represent the worst 207.
case scenario for the two meteorological masts, yielding up to 1,131m3 of sediment.
As a worst case, the two accommodation platforms and two offshore electrical
platforms, both on six-legged pin pile foundations, would yield up to 3,392m3 of
sediment in total. Two LiDAR monopiles may also be required, yielding up to 189m3
of sediment.
The total volume of drill arisings under the single-phase approach would therefore 208.
be 402,320m3. This volume would all be from NV West or NV East if all 1,800MW is
in one site. In the two-phased approach, this volume would be split 50% in each site.
June 2018 Norfolk Vanguard Offshore Wind Farm PB4476-005-008 Page 75
The drilling process would cause localised and short-term increases in suspended 209.
sediment concentrations at the point of discharge of the drill arisings. Released
sediment may then be transported by tidal currents in suspension in the water
column. Due to the small quantities of fine-sediment released (most of the sediment
will be sand or aggregated clasts, see section 8.6.7), the fine-sediment is likely to be
widely and rapidly dispersed. This would result in only low suspended sediment
concentrations and low changes in seabed level when the sediments ultimately
come to deposit. The disturbance effects at each wind turbine location are only likely
to last for a few days of construction activity within the overall construction
programme lasting up to 20 months for foundation installation (single phase).
In the East Anglia ONE modelling studies (ABPmer, 2012b), 982m3 of variably graded 210.
fine sediment (sand, clay and silt), released into the water column once every two
days was assessed to simulate the construction of eight consecutively drilled
foundations over a 15-day simulation period. The release volume is approximately
nine times less than that of the individual worst case scenario for the 20MW
monopile foundations being considered for Norfolk Vanguard (8,836m3).
The larger release volumes associated with the worst case scenario for Norfolk 211.
Vanguard and similar tidal currents compared to East Anglia ONE may combine to
result in larger concentrations above background levels than previously modelled.
However, these are likely to still be modest (tens of mg/l) due to the low volumes of
disaggregated fine-grained in the drill arisings. Hence, the principle of wide
dispersion in relatively low concentrations remains valid. Also, a conservative
assumption was made in the modelling that all drilled sediment would disperse.
However, in reality some of the drill arisings would arrive at the sea surface as larger
aggregated clasts which would settle rapidly (see construction impact 2B, section
8.7.7.4).
The previous modelling results support the general principles of the expert-based 212.
assessment in that, away from the immediate release locations, elevations in
suspended sediment concentration above background levels were low (less than
10mg/l) and within the range of natural variability. Indeed, modelling indicated that
concentrations would generally be no greater than 5mg/l above background levels at
a distance of 5km from the release location, indicating wide dispersion in low
concentrations. Net movement of fine-grained sediment retained within a plume
was to the north, in accordance with the direction of residual tidal flow, although
gross movement to both the north and south was possible depending on timing of
release. Sediment concentrations arising from one foundation installation were
deemed unlikely to persist for sufficiently long for them to interact with subsequent
operations, and therefore no cumulative effect was anticipated from multiple
installations.
June 2018 Norfolk Vanguard Offshore Wind Farm PB4476-005-008 Page 76
The changes in suspended sediment concentrations (magnitudes, geographical 213.
extents and durations of effect) that are anticipated at Norfolk Vanguard would
move across the site with progression of the construction sequence as the point of
sediment release (and hence geographic location of the zone of effect) changes with
the installation of foundations at different wind turbine locations.
8.7.7.2.1 Assessment of effect magnitude and/or impact significance – Single phase for
NV West and/or NV East
The worst case changes in suspended sediment concentrations due to dispersal of 214.
drill arisings for foundation installation would have the same magnitudes of effect as
those for seabed preparation (see Impact 1A, section 8.7.7.1), and are shown in
Table 8.17.
Table 8.17 Magnitude of effect on suspended sediment concentrations due to foundation installation under the worst case scenario
Location Scale Duration Frequency Reversibility Magnitude of
Effect
Near-field* High Negligible Negligible Negligible Medium
Far-field Low Negligible Negligible Negligible Low
*The near-field effects are confined to a small area, likely to be several hundred metres up to a kilometre from
each foundation location.
In a similar way to seabed preparation (section 8.7.7.1) there is no impact on the 215.
identified receptors groups associated with the suspended sediment generated by
the project. However, the effects have the potential to impact upon other receptors
and the assessment of impact significance is addressed within the relevant chapters
of this ES.
8.7.7.2.2 Assessment of effect magnitude and/or impact significance – Two phases for
NV West and/or NV East
The worst-case release of sediments through drilling would occur over two distinct 216.
phases, each lasting up to eight months, respectively (rather than a single 20 month
period), for the installation of the monopiles. Whilst these scenarios would mean
that the effects are caused in two separate periods, with a longer additive duration
of disturbance, this would not materially change the assessment of significance
compared with a single-phase approach.
Impact 2A: Changes in seabed level due to seabed preparation for wind turbine 8.7.7.3
gravity anchor foundation installation
The increased suspended sediment concentrations associated with construction 217.
impact 1A (section 8.7.7.1) have the potential to deposit sediment and raise the
seabed elevation slightly.

June 2018 Norfolk Vanguard Offshore Wind Farm PB4476-005-008 Page 77
Expert-based assessment suggests that coarser sediment disturbed during seabed 218.
preparation would fall rapidly to the seabed (minutes or tens of minutes) as a highly
turbid dynamic plume immediately after it is discharged. Deposition of this sediment
would form a ‘mound’ local to the point of release. Due to the coarser sediment
particle sizes observed across the site (predominantly medium-grained sand), a large
proportion of the disturbed sediment would behave in this manner.
The resulting mound would be a measurable protrusion above the existing seabed 219.
(likely to be tens of centimetres to a few metres high) but would remain local to the
release point. The geometry of each of these produced mounds would vary across
Norfolk Vanguard, depending on the prevailing physical conditions, but in all cases
the sediment within the mound would be similar to the surrounding seabed. This
would mean that there would be no significant change in seabed sediment type.
Also, the overall change in elevation of the seabed is small compared to the absolute
depth of water (greater than 20m). The change in seabed elevation is within the
natural change to the bed caused by sand waves and sand ridges and hence the
blockage effect on physical processes would be negligible.
The mound will be mobile and be driven by the physical processes, rather than the 220.
physical processes being driven by it. This means that over time the sediment
comprising the mound will gradually be re-distributed by the prevailing waves and
tidal currents.
In addition to the local mounds, the very small proportion of mud would form a 221.
passive plume and become more widely dispersed before settling on the seabed.
The East Anglia ONE modelling (ABPmer, 2012b) considered seabed level changes
resulting from deposition of sediments from the passive plume due to seabed
preparation for 15 foundations. This involved a worst case sediment release of
22,500m3 per foundation (i.e. around half the volume considered as the worst case
for an individual wind turbine foundation in Norfolk Vanguard). For the most part,
the deposited sediment layer across the wider seabed was found to be less than
0.2mm thick and did not exceed 2mm anywhere. The area of seabed upon which
deposition occurred (at these low values) extended a considerable distance from the
site boundary (around 50km), but in doing so only covered a very narrow width of
seabed (a few hundred metres). This is because the dispersion of the plume followed
the axis of tidal flow. The previous assessment also concluded that this deposited
sediment has the potential to become re-mobilised and therefore would rapidly
become incorporated into the mobile seabed sediment layer, thus further reducing
any potential effect.
Using the plume modelling studies for East Anglia ONE as part of the expert-based 222.
assessment suggests that deposition of sediment from the Norfolk Vanguard plume
would occur across a wide area of seabed and would be very thin (millimetres).
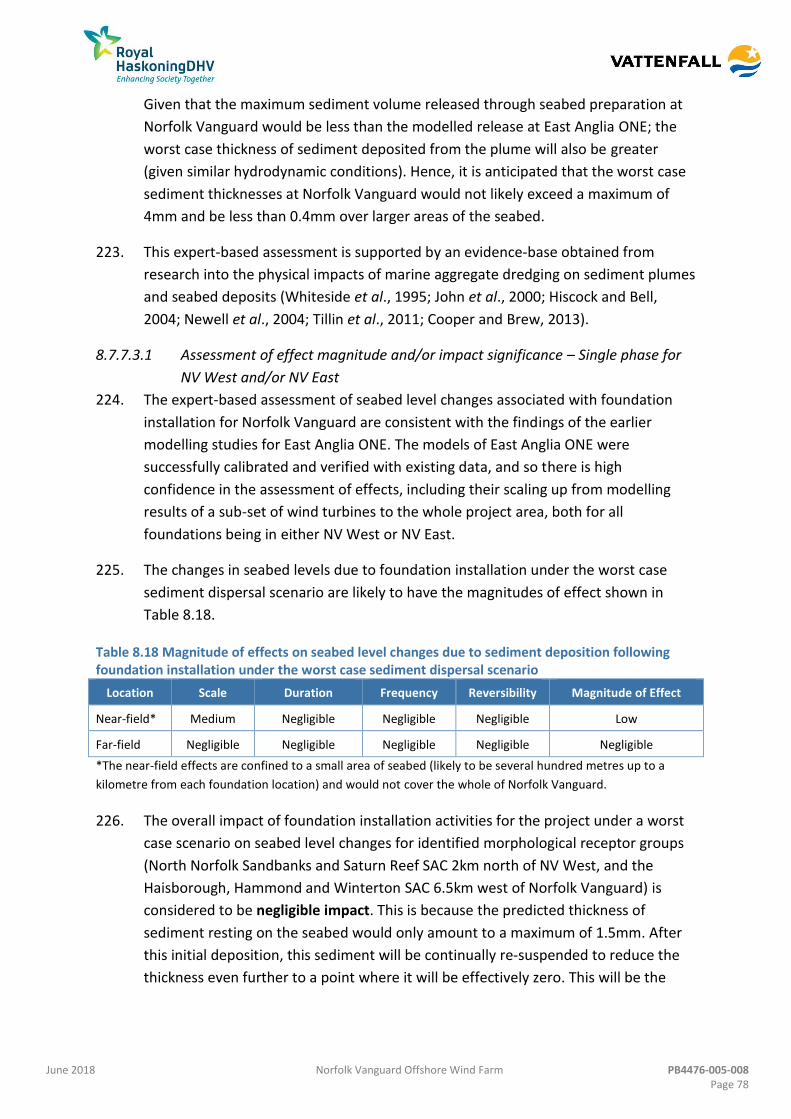
June 2018 Norfolk Vanguard Offshore Wind Farm PB4476-005-008 Page 78
Given that the maximum sediment volume released through seabed preparation at
Norfolk Vanguard would be less than the modelled release at East Anglia ONE; the
worst case thickness of sediment deposited from the plume will also be greater
(given similar hydrodynamic conditions). Hence, it is anticipated that the worst case
sediment thicknesses at Norfolk Vanguard would not likely exceed a maximum of
4mm and be less than 0.4mm over larger areas of the seabed.
This expert-based assessment is supported by an evidence-base obtained from 223.
research into the physical impacts of marine aggregate dredging on sediment plumes
and seabed deposits (Whiteside et al., 1995; John et al., 2000; Hiscock and Bell,
2004; Newell et al., 2004; Tillin et al., 2011; Cooper and Brew, 2013).
8.7.7.3.1 Assessment of effect magnitude and/or impact significance – Single phase for
NV West and/or NV East
The expert-based assessment of seabed level changes associated with foundation 224.
installation for Norfolk Vanguard are consistent with the findings of the earlier
modelling studies for East Anglia ONE. The models of East Anglia ONE were
successfully calibrated and verified with existing data, and so there is high
confidence in the assessment of effects, including their scaling up from modelling
results of a sub-set of wind turbines to the whole project area, both for all
foundations being in either NV West or NV East.
The changes in seabed levels due to foundation installation under the worst case 225.
sediment dispersal scenario are likely to have the magnitudes of effect shown in
Table 8.18.
Table 8.18 Magnitude of effects on seabed level changes due to sediment deposition following foundation installation under the worst case sediment dispersal scenario
Location Scale Duration Frequency Reversibility Magnitude of Effect
Near-field* Medium Negligible Negligible Negligible Low
Far-field Negligible Negligible Negligible Negligible Negligible
*The near-field effects are confined to a small area of seabed (likely to be several hundred metres up to a
kilometre from each foundation location) and would not cover the whole of Norfolk Vanguard.
The overall impact of foundation installation activities for the project under a worst 226.
case scenario on seabed level changes for identified morphological receptor groups
(North Norfolk Sandbanks and Saturn Reef SAC 2km north of NV West, and the
Haisborough, Hammond and Winterton SAC 6.5km west of Norfolk Vanguard) is
considered to be negligible impact. This is because the predicted thickness of
sediment resting on the seabed would only amount to a maximum of 1.5mm. After
this initial deposition, this sediment will be continually re-suspended to reduce the
thickness even further to a point where it will be effectively zero. This will be the
June 2018 Norfolk Vanguard Offshore Wind Farm PB4476-005-008 Page 79
longer-term outcome, once the sediment supply from foundation installation has
ceased.
The worst case scenario assumes that seabed preparation activities would be the 227.
maximum for the given water depth. In practice, the volumes of sediment released
would be lower than the worst case at many wind turbine locations because the
detailed design process would optimise the foundation type and installation method
to the site conditions.
The effects on seabed level have the potential to impact upon other receptors and 228.
the assessment of impact significance is addressed within the relevant chapters of
this ES.
8.7.7.3.2 Assessment of effect magnitude and/or impact significance – Two phases for
NV West and/or NV East
Under a two-phase approach, the principal differences compared to the single-phase 229.
assessment are those described previously for construction impact 1A (i.e. the effect
of distinct construction periods). Consequently, there would be no material change
to the assessment of significance for construction impact 2A for two phases
compared with that for a single phase.
Impact 2B: Changes in seabed level due to drill arisings for installation of piled 8.7.7.4
foundations for wind turbines
The increased suspended sediment concentrations associated with construction 230.
impact 1B (section 8.7.7.2) have the potential to deposit sediment and raise the
seabed elevation slightly.
Drilling of piled foundations could potentially occur through two different geological 231.
units; sand similar to that at the seabed and the underlying mud deposits of the
Brown Bank Formation. Expert-based assessment suggests that the coarser sediment
fractions (medium and coarse sands and gravels) and aggregated ‘clasts’ of mud of
the Brown Bank Formation would settle out of suspension in proximity to each
foundation location.
If drilling takes place through 100% sand, expert-based assessment suggests that the 232.
coarser sediment from the drilling process would fall rapidly (within minutes or tens
of minutes) to the seabed to form a ‘mound’ in a similar way to the disturbed
sediment during seabed preparation. The very small proportion of mud within the
dominantly sand deposit would be released into the water column and dispersed
before settling on the seabed.
The plume modelling studies for East Anglia ONE (ABPmer, 2012b) considered the 233.
seabed level changes resulting from deposition of sediments from drilling eight piled
quadropod foundations. The coarser sediment was deposited near to the point of

June 2018 Norfolk Vanguard Offshore Wind Farm PB4476-005-008 Page 80
release up to thicknesses of a few centimetres and over a seabed area local to each
foundation (within a few hundred metres). For the most part, the deposited
sediment layer across the wider seabed area was less than 0.025mm thick.
Although the modelling used a smaller volume of sediment (982m3) than the worst 234.
case for Norfolk Vanguard (8,836m3 for an individual turbine) it does support the
principles of the expert-based assessment that the envisaged scale of seabed level
change would be small. Using the assumption that an increase in sediment release
would lead to a proportional increase of the sediment thickness, then the worst case
thicknesses for Norfolk Vanguard near each foundation would be a few tens of
centimetres with thickness up to 0.23mm across the wider seabed.
The seabed level changes that are anticipated would move across Norfolk Vanguard 235.
with progression of the construction sequence as the point of sediment release (and
hence geographic location of the zone of effect) changes with the installation of
foundations at different wind turbine locations.
If the drilling reaches depths where it penetrates the underlying mud deposits 236.
(Brown Bank Formation), then a worst case scenario is considered whereby the
sediment released from the drilling is assumed to be wholly in the form of
aggregated ‘clasts’. These clasts would remain on the seabed (at least initially),
rather than being disaggregated into individual fine-grained sediment components
immediately upon release. Under this scenario, the worst case scenario assumes that
a ‘mound’ would reside on the seabed near the site of its release.
For an individual wind turbine, the worst case is associated with a 20MW monopile 237.
and assumes that each mound would contain a maximum volume of 8,836m3 of
sediment (assumes that all the drill arisings are in the form of aggregated clasts).
For drill arisings from the project as a whole, the worst case is for 45 20MW 238.
quadropods (i.e. 50% of turbine locations) along with two LiDAR, two meteorological
masts, two accommodation platforms and two offshore electrical platforms,
amounting to total volume of 402,320m3 of sediment. These mounds would be
composed of sediment with a different particle size and would behave differently
(they would be cohesive) to the surrounding sandy seabed, and therefore represent
the worst case scenario for mound formation during construction.
The method for calculating the footprint of each mound follows that which was 239.
developed and agreed with Natural England for earlier major offshore wind projects
at Dogger Bank Creyke Beck (Forewind, 2013), Dogger Bank Teesside (Forewind,
2014) and East Anglia THREE (EATL, 2015). The methodology involves the following
stages:
June 2018 Norfolk Vanguard Offshore Wind Farm PB4476-005-008 Page 81
Calculate the maximum potential width of a mound (for the given volume) on
the basis of the diameter of an assumed idealised cone on the seabed. This was
based on simple geometric relationships between volume, height, radius and
side-slope angle of a cone. The latter parameter was taken as 30°, which is a
suitable representation for an angle of friction of clasts of sediment.
Calculating the maximum potential length of the mound (for the given volume
and maximum potential width). The assumed height of the mound was ‘fixed’ in
the calculation as being equivalent to the average height of the naturally
occurring sand waves on the seabed within the site. This calculation was based
on simple geometric relationships between volume, height, width and length
and assumed that, when viewed in side elevation, the mound would be
triangular in profile but that its length is greater than its width, thus forming a
‘ramp’ shape.
Based on the newly-calculated width and length of the mound, a footprint area
on the seabed could then be calculated.
Based on this approach, the footprint of an individual 2m-high mound arising from 240.
the 15m diameter drill used for 20MW wind turbine monopiles would be 8,836m2
(or 450,636m2 for the whole of Norfolk Vanguard under the single-phase approach,
assuming a worst case scenario of 45 wind turbines and six platforms are drilled).
When compared to Norfolk Vanguard as a whole (592km2), the worst case mound
footprint is only 0.08% of the seabed within the wind farm area.
This footprint would all be from NV West or NV East if all 1,800MW is located in one 241.
site. If the numbers of turbines are split, the footprint will be 225,318m2 in each site
(assumes a worst case scenario of 22 or 23 wind turbines and three other structures
drilled in each site).
8.7.7.4.1 Assessment of effect magnitude and/or impact significance – Single phase for
NV West and/or NV East
The expert-based assessment of seabed level changes associated with foundation 242.
installation for Norfolk Vanguard are consistent with the findings of the earlier
modelling studies for East Anglia ONE. The models that were used for East Anglia
ONE had been successfully calibrated and verified with existing data, and so there is
high confidence in the assessment of effects, including their scaling up from
modelling results of a sub-set of wind turbines to the whole project area.
The changes in seabed levels due to foundation installation under the worst case 243.
sediment dispersal scenario and sediment mound scenario are likely to have the
magnitudes of effect shown in Table 8.19 and Table 8.20, respectively.
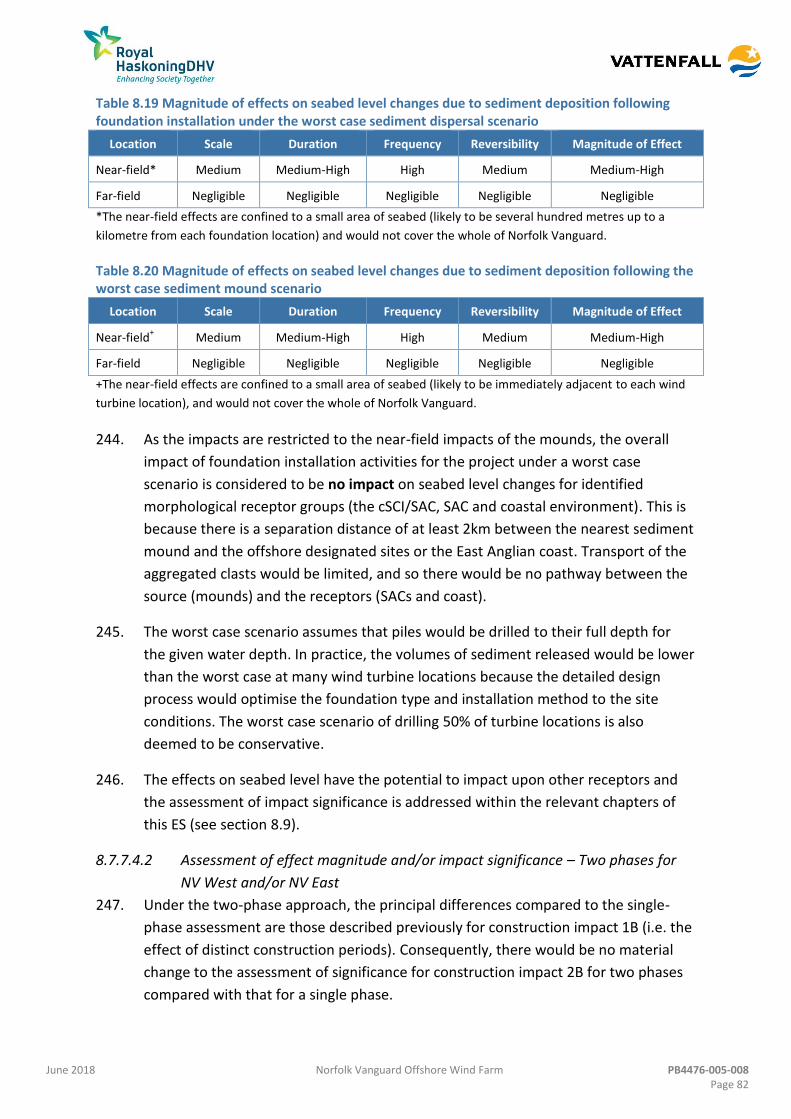
June 2018 Norfolk Vanguard Offshore Wind Farm PB4476-005-008 Page 82
Table 8.19 Magnitude of effects on seabed level changes due to sediment deposition following foundation installation under the worst case sediment dispersal scenario
Location Scale Duration Frequency Reversibility Magnitude of Effect
Near-field* Medium Medium-High High Medium Medium-High
Far-field Negligible Negligible Negligible Negligible Negligible
*The near-field effects are confined to a small area of seabed (likely to be several hundred metres up to a
kilometre from each foundation location) and would not cover the whole of Norfolk Vanguard.
Table 8.20 Magnitude of effects on seabed level changes due to sediment deposition following the worst case sediment mound scenario
Location Scale Duration Frequency Reversibility Magnitude of Effect
Near-field+ Medium Medium-High High Medium Medium-High
Far-field Negligible Negligible Negligible Negligible Negligible
+The near-field effects are confined to a small area of seabed (likely to be immediately adjacent to each wind
turbine location), and would not cover the whole of Norfolk Vanguard.
As the impacts are restricted to the near-field impacts of the mounds, the overall 244.
impact of foundation installation activities for the project under a worst case
scenario is considered to be no impact on seabed level changes for identified
morphological receptor groups (the cSCI/SAC, SAC and coastal environment). This is
because there is a separation distance of at least 2km between the nearest sediment
mound and the offshore designated sites or the East Anglian coast. Transport of the
aggregated clasts would be limited, and so there would be no pathway between the
source (mounds) and the receptors (SACs and coast).
The worst case scenario assumes that piles would be drilled to their full depth for 245.
the given water depth. In practice, the volumes of sediment released would be lower
than the worst case at many wind turbine locations because the detailed design
process would optimise the foundation type and installation method to the site
conditions. The worst case scenario of drilling 50% of turbine locations is also
deemed to be conservative.
The effects on seabed level have the potential to impact upon other receptors and 246.
the assessment of impact significance is addressed within the relevant chapters of
this ES (see section 8.9).
8.7.7.4.2 Assessment of effect magnitude and/or impact significance – Two phases for
NV West and/or NV East
Under the two-phase approach, the principal differences compared to the single-247.
phase assessment are those described previously for construction impact 1B (i.e. the
effect of distinct construction periods). Consequently, there would be no material
change to the assessment of significance for construction impact 2B for two phases
compared with that for a single phase.

June 2018 Norfolk Vanguard Offshore Wind Farm PB4476-005-008 Page 83
Impact 3: Changes in suspended sediment concentrations during export cable 8.7.7.5
installation
The details of how the offshore cable would be installed depend on the final project 248.
design and are discussed in Chapter 5 Project Description. The total maximum length
of offshore cable trenches would be 200km.
The installation of the offshore cables has the potential to disturb the seabed 249.
sediment to an average depth of 3m, either directly through the installation method
chosen, or through seabed levelling of any large sand waves that may be present
along the cable corridor prior to cable installation. The worst case scenario cable-
laying technique is considered to be jetting. At the Happisburgh South landfall,
cables would be installed via long HDD. The potential release of suspended sediment
from all of these construction phase activities, with the release points along different
parts of the offshore cable corridor, is considered here.
The types and magnitudes of effects that could be caused have previously been 250.
assessed within an industry best-practice document on cabling techniques (BERR,
2008). This document has been used alongside expert-based judgement and analysis
of site conditions to inform the assessments presented below.
8.7.7.5.1 Cable installation (trenching and sand wave levelling)
The sediment released due to pre-sweeping for the export cables would equate to 251.
about 2,400,000m3 of sediment. Approximately 500,000m3 would be within the
Haisborough, Hammond and Winterton SAC; 100,000m3 would be within the rest of
the offshore cable corridor (excluding the nearshore (10m water depth contour)
where no pre-sweeping is proposed); and 1,800,000m3 would be associated with up
to 30km of export cable within the OWF sites. The latter is assessed in Impact 5
(section 8.7.7.9).
Following pre-sweeping, the sediment disturbed due to trenching for the export 252.
cables would equate to a maximum of 3,000,000m3 of sediment. Approximately
1,200,000m3 would be within the Haisborough, Hammond and Winterton SAC, and
the remainder from the rest of the offshore cable corridor. Ploughing would create
temporary mounds either side of the trench and therefore it is expected that only a
small proportion of the 3,000,000m3 would result in sediment plumes during cable
installation.
There are similarities in water depth, sediment types and metocean conditions 253.
between the offshore cable corridor for East Anglia ONE and Norfolk Vanguard.
Hence, the earlier modelling studies provide a suitable analogue for the present
assessments. Plume modelling simulations undertaken for East Anglia ONE (ABPmer,
2012b) were used in the above expert-based assessments and provided the
June 2018 Norfolk Vanguard Offshore Wind Farm PB4476-005-008 Page 84
following quantification of magnitude of change of suspended sediment
concentrations:
In water depths greater than -20m LAT, peak suspended sediment
concentrations would be typically less than 100mg/l, except in the immediate
vicinity (a few tens of metres) of the release location.
In shallow water depths nearer to shore (less than -5m LAT) the potential for
dispersion is more limited and therefore the concentrations are likely to be
greater, approaching 400mg/l at their peak. However, these plumes would be
localised to within less than 1km of the location of installation and would
persist for no longer than a few hours.
Following cessation of installation activities, any plume would have been fully
dispersed as a result of advection and diffusion. Sediments arisings from the
offshore cable corridor would tend to be advected to the north helping to keep
it within the Haisborough, Hammond and Winterton SAC for some parts of the
offshore cable corridor.
The residual plume concentrations resulting from the East Anglia ONE model
(and hence as an analogue for Norfolk Vanguard) are likely to be overly
conservative. This is because the plume dispersion model takes into
consideration the potential for re-mobilisation of the sediment arisings once
they have settled to the bed.
This assessment is based on the overall sediment release volumes being low and 254.
confined to near the seabed (rather than higher in the water column) along the
alignment of the offshore cable corridor, and the rate at which the sediment is
released into the water column from the jetting process would be relatively slow.
The results show that concentrations would be enhanced by the greatest amount in 255.
the shallowest sections of the offshore cable corridor. However, in these locations
the background concentrations are also greater than in deeper waters.
8.7.7.5.2 Landfall construction activities
At the Happisburgh South landfall, cables would be installed via long HDD. The key 256.
components of the construction methodology for the offshore cable close to shore
with the potential to affect coastal processes are:
The connection of the landfall to the nearshore portion of the offshore cables;
The placement of structures on the shore to achieve the connection; and
The sequencing of activities.
The HDD exit point will be in the subtidal zone, seaward of the low water mark and 257.
at least -5.5m LAT. The exit point would require excavation of a trench to bury the
nearshore portion of the offshore cable on the seaward side of the landfall HDD. This

June 2018 Norfolk Vanguard Offshore Wind Farm PB4476-005-008 Page 85
excavation has the potential to increase suspended sediment concentrations close to
shore.
As discussed in section 0, nearshore ambient suspended sediment data is limited. 258.
During the landfall excavation process the suspended sediment concentrations will
be elevated above prevailing conditions, but are likely to remain within the range of
background nearshore levels (which will be high close to the coast because of
increased wave activity) and lower than those concentrations that would develop
during storm conditions. Also, once trenching is completed, the high energy
nearshore zone is likely to rapidly disperse the suspended sediment (i.e. over a
period of a few hours) in the absence of any further sediment input.
Excavated sediment would be backfilled into the trench by mechanical means 259.
(within a few days of excavation) and re-instated close to its original morphology.
This activity would result in some localised and short-term disturbance, but there
would be no long-term effect on sediment transport processes.
8.7.7.5.3 Assessment of effect magnitude and/or impact significance – Single phase for
Offshore Cable Corridor
The worst case changes in suspended sediment concentrations due to offshore cable 260.
installation are likely to have the magnitudes of effect shown in Table 8.21.
Table 8.21 Magnitude of effect on suspended sediment concentrations due to offshore cable installation (including any sand wave levelling and landfall construction activities) under the worst case scenario
Location Scale Duration Frequency Reversibility Magnitude of Effect
Near-field* (nearshore and landfall)
Low Negligible Negligible Negligible Low
Near-field* (offshore) Low Negligible Negligible Negligible Low
Far-field Negligible Negligible Negligible Negligible Negligible
*The near-field effects are confined to a small area (likely to be of the order of several hundred metres up to a
kilometre from the offshore cable corridor), and would not cover the whole offshore cable corridor
These effects on suspended sediment concentrations due to offshore cable 261.
installation (including that from any sand wave levelling) would have no impact upon
the identified receptors groups for marine geology, oceanography and physical
processes. This is because the receptors are dominated by processes that are active
along the seabed and are not affected by sediment suspended in the water column.
However, there may be impacts arising from subsequent deposition of the
suspended sediment on the seabed and these are discussed under construction
impact 4A (section 8.7.7.6).
June 2018 Norfolk Vanguard Offshore Wind Farm PB4476-005-008 Page 86
The effects do have the potential to impact upon other receptors and the 262.
assessment of impact significance is addressed within the relevant chapters of this
ES.
8.7.7.5.4 Assessment of effect magnitude and/or impact significance – Two phases for
Offshore Cable Corridor
Under the two-phase approach, the principal difference compared to the single 263.
phase assessment is associated with the installation programme. There is no
difference in the worst case length of cable to be installed.
For the two-phase approach, the worst case installation period for the export cables 264.
would either be installation separately or in parallel with other elements of the
offshore wind farm. However, due to the remaining low near-field and negligible far-
field magnitude of effect, the overall assessment of significance remains in keeping
with that for a single phase.
At the landfall, the only difference would be that the landfall operations would be 265.
undertaken as two discrete events rather than a single event. Whilst this would
increase the occurrences of disturbance events, there would be less volume
disturbed during each event compared to the single-phase approach.
Impact 4A: Changes in seabed level due to disposal of sediment from sand wave 8.7.7.6
levelling in the offshore cable corridor
There is potential for temporary physical disturbance to Annex I Sandbank in the 266.
offshore cable corridor due to disposal of dredged material from sand wave levelling
for cable laying.
The maximum volume of sediment arising as a result of pre-sweeping for export 267.
cables would equate to approximately 2,400,000m3; 500,000m3 of which would be
deposited within the SAC and 1,900,000m3 would be deposited in the OWF sites. The
impact of sediment deposited in the OWF sites is assessed in Impact 6 (section
8.7.7.10).
As discussed in section 8.7.4, Norfolk Vanguard is committed to depositing all 268.
sediment arising from the SAC during cable installation placed back into the SAC as
embedded mitigation, ensuring that the sediment is not lost from the system.
The thickness of the disposed sediment would depend on the volume deposited at 269.
any one time, the disposal method, footprint of the placement and the ambient
environmental conditions at the time of the event. ABPmer (2018) used a given
volume of sediment to calculate a range of potential alternative combinations of
extent, thickness and shape. These included localised deposition that is assumed to
form naturally into a cone shape, uniformly distributed thicknesses of 0.5m, 0.25m
and 0.05m (making no assumptions about the shape of the area), and deposition

June 2018 Norfolk Vanguard Offshore Wind Farm PB4476-005-008 Page 87
thickness associated with a uniform disposal across the whole indicative spoil zone.
With respect to local deposition, a steeper sided cone would have a greater
thickness and a smaller area of change than a less steep sided cone.
For the proposed disposal, a range of deposition scenarios were assessed, which 270.
included:
The maximum possible thickness, associated with the smallest footprint or
extent of impact;
The different thicknesses and footprints associated with varying spoil
deposition ‘cones’;
The maximum thickness from a single disposal from the hopper compared with
the cumulative thickness associated with multiple disposal events; and
The most extensive accumulation over the entire indicative spoil zone and the
resulting thickness.
On initial release from the dredger, ABPmer (2018) assumed that around 90% of the 271.
material released will fall directly to the seabed as a single mass.
The results show that if the total volume of sediment (500,000m3) is returned to the 272.
seabed with an average uniform thickness of 0.5m, an area of about 900,000m2
would be covered.
A disposal event, could theoretically range from 4.2m to 0.25m depending on the 273.
environmental conditions and nature of disposal (Table 8 of Appendix 7.1 of the
Information to Support HRA report, document reference 5.3), however as described
in the Appendix 7.1 of the Information to Support HRA report (document reference
5.3), the actual thickness of the deposited layer is more likely to range between 0.3m
and 0.02m based on typical conditions for the site including water depth of 31m (the
depth within an indicative disposal location), a current speed of 0.5m/s and grain
size of 350μm (which would be expected to have a settling rate of 0.05m/s).
The absolute width, length, shape and thickness of sediment deposition as a result of 274.
individual and all (combined) disposal events cannot be predicted with certainty.
Irrespective of the deposition scenario, the sand waves within the indicative spoil
zone typically have amplitudes of over 3m and wavelengths of about 100m.
Therefore, there is already some variation in seabed depths within the indicative
spoil zone and depending on the deposition characteristics (i.e. location, thickness
and extent) the result would potentially be within the range already encountered
within the indicative spoil zone. It is considered that if sediment mounds (cones) are
formed during disposal, they would be quickly (within a matter of days to a year)
winnowed down to levels resembling the nearby bedforms.

June 2018 Norfolk Vanguard Offshore Wind Farm PB4476-005-008 Page 88
8.7.7.6.1 Assessment of effect magnitude and/or impact significance – Single phase for
offshore cable corridor
The worst case changes in seabed levels due to disposed sediment from sand wave 275.
levelling are likely to have the magnitudes of effect described in Table 8.26.
Table 8.22 Magnitude of effect on seabed level changes due to disposed sediments from sand wave levelling under the worst case scenario
Location Scale Duration Frequency Reversibility Magnitude of Effect
Near-field* Low Negligible Negligible Negligible Low
Far-field Negligible Negligible Negligible Negligible Negligible
*The near-field effects are confined to a small area of sea bed (likely to be of the order of several hundred
metres up to a kilometre from the offshore cable corridor), and would not cover the whole offshore cable
corridor.
The main area of sand wave levelling for the offshore cable corridor will be within 276.
the southern part of the Haisborough, Hammond and Winterton SAC. The sensitivity
and value of the SAC is presented in Table 8.27.
No sand wave levelling is expected along the western, nearshore end of the cable 277.
corridor. Therefore, there would be no impact on the nearshore Cromer Shoal Chalk
Beds MCZ as a result of disposal of sediment from sand wave levelling. Any sediment
arising from the eastern end of the offshore cable corridor outside the SAC would be
deposited in this section of the offshore cable corridor or within the OWF sites.
Table 8.23 Sensitivity and value assessment of Haisborough, Hammond and Winterton SAC
Receptor Tolerance Adaptability Recoverability Value Sensitivity
Haisborough,
Hammond and
Winterton SAC
Negligible Negligible Negligible High Negligible
The overall impact of sand wave levelling activities under a worst case scenario on 278.
bed level changes due to sediment disposal for the identified morphological receptor
groups is considered to be negligible impact for Haisborough, Hammond and
Winterton SAC.
The effects on seabed level also have the potential to impact upon other receptors 279.
and therefore the assessment of impact significance is addressed within relevant
chapters of this ES.
8.7.7.6.2 Assessment of effect magnitude and/or impact significance – Two phases for
offshore cable corridor
Phasing the disposal would increase the likelihood that the initial disposed sediment 280.
would be incorporated back into the natural system within the Haisborough,
Hammond and Winterton SAC before the sediment from the next phase of

June 2018 Norfolk Vanguard Offshore Wind Farm PB4476-005-008 Page 89
installation is deposited. Whilst this would increase the occurrence of disturbance
events, there would be less volume disturbed during each event compared to the
single-phase approach.
Consequently, there would be no material change to the assessment of significance 281.
for construction impact 4A for two phases compared to a single-phase approach.
Impact 4B: Interruptions to bedload sediment transport due to sand wave 8.7.7.7
levelling in the offshore cable corridor
The removal of sand waves could potentially interfere with sediment transport 282.
pathways that supply sediment to the sandbank system. Sand wave levelling for the
offshore export cables is estimated to require excavation of 2,400,000m3 of
sediment, of which up to 500,000m3 would be within the Haisborough Hammond
and Winterton SAC.
As previously discussed the 500,000m3 of sediment arising from the SAC would be 283.
disposed back into the SAC; the 100,000m3 of sediment arising from the rest of the
offshore cable corridor would be deposited in the corridor or within the OWF sites
and the 1,800,000m3 from the export cable installation within the OWF sites would
be deposited in the OWF sites. As the excavated sediment would be disposed of
within the SAC there would be no net loss of sediment within the designated site.
The total area of sandbanks within the SAC is 678km2 and the area of the SAC as a 284.
whole is 1,468km2, so the area of sand wave levelling in the SAC equates to 0.04% of
the sandbanks and 0.02% of the total area of the SAC. Hence, the effects on the
surrounding environment are anticipated to be small because it is likely that the
natural changes to the sand waves, through the active physical processes, are far
greater than the quantities of sand that are to be extracted.
ABPmer 2018) (provided in Appendix 7.1 of the Information to Support HRA report, 285.
document 5.3) also concludes that in most cases, the cable corridor is oriented
transverse to the sand wave crests which require levelling; therefore, only a small
width (up to approximately 37m) of each sand wave is disturbed and it can continue
to evolve and migrate along most of its length. As a result, the overall form and
functioning of any particular sand wave, or the SAC sandbank system as a whole, is
not disrupted.
Where sand wave crests occur that run roughly parallel to the cable corridor, 286.
broader sections of the longitudinal form of individual sand waves would require
levelling. However, the area and volume of sediment affected would be minimal in
the context of the sandbank system of the SAC as a whole. In addition, the cable
corridor is in an active and highly dynamic environment, governed by current flow
speeds, water depth and sediment supply, all of which are conducive to the

June 2018 Norfolk Vanguard Offshore Wind Farm PB4476-005-008 Page 90
development and maintenance of sandbanks. Therefore, despite the disturbance to
sand waves intersecting the cable corridor, the Haisborough, Hammond and
Winterton SAC sandbank system will remain undisturbed as new sand waves will
continue to be formed.
Analysis by Burningham and French (2016) (see section 8.6.10) shows that 287.
Haisborough Sand is an active and very dynamic feature, with historic large-scale
natural changes having occurred over decadal periods. Given this dynamism, it is
likely that the volumetric changes to the bank system that would occur due to
installation of the export cables will be significantly smaller in magnitude than the
natural changes. Hence, the potential for recovery of the bank after the physical
changes due to construction would be high.
8.7.7.7.1 Assessment of effect magnitude and/or impact significance – Single phase for
offshore cable corridor
The worst case changes in bedload sediment transport due to sand wave levelling 288.
are likely to have the magnitudes of effect described in Table 8.24.
Table 8.24 Magnitude of effect on bedload sediment transport due to sand wave levelling under the worst case scenario
Location Scale Duration Frequency Reversibility Magnitude of Effect
Near-field Low Negligible Negligible Negligible Low
Far-field Negligible Negligible Negligible Negligible Negligible
Importantly, the offshore cable corridor crosses through the southern part of the 289.
Haisborough, Hammond and Winterton SAC. The sensitivity and value of the SAC are
presented in Table 8.25.
Table 8.25 Sensitivity and value assessment of Haisborough, Hammond and Winterton SAC
Receptor Tolerance Adaptability Recoverability Value Sensitivity
Haisborough,
Hammond and
Winterton SAC
Negligible Negligible Negligible High Negligible
Keeping the dredged sand within the sandbank system enables the sand to become 290.
re-established within the local sediment transport system by natural processes and
encourages the re-establishment of the SAC bedform features. ABPmer (2018)
estimated potential transport rates for sand (0.25-0.5mm) within the SAC of
between 0.01m3/m/ hr to 3.4m3/m/ hr (using representative annual average waves
combined with current speeds ranging from 0.5m/s to 1.29m/s), which are also
within the range modelled for the wider region of the Southern North Sea (HR
Wallingford, 2012).
June 2018 Norfolk Vanguard Offshore Wind Farm PB4476-005-008 Page 91
The ABPmer (2018) study (Appendix 7.1 of the Information to Support HRA report, 291.
document reference 5.3) also found that the sediment would be naturally
transported back into the dredged area within a short period of time given the local
favourable conditions that enable sandwave development. The dredged area will
naturally act as a sink for sediment in transport and will be replenished in the order
of a few days to a year.
The offshore cable corridor is in an active and highly dynamic seabed environment, 292.
governed by current flow speeds, water depth and sediment supply. These
governing processes within the SAC occur at a much larger scale than the temporary
physical disturbance which would occur as a result of cable installation. The
sediment volume that would be affected is small in comparison to the volume of
sediment within the local sandbank systems (i.e. the Newarp Banks system) and the
SAC as a whole. As all the sediment will remain within the boundaries of the SAC,
presenting minimal impacts on local sediment availability, there will be no significant
change to sandbank extent, topography and sediment composition.
Hence, the overall impact of sand wave levelling activities under a worst case 293.
scenario for the identified morphological receptor groups is considered to be no
impact, except for Haisborough, Hammond and Winterton SAC which is assessed as
negligible impact.
The effects on bedload sediment transport also have the potential to impact upon 294.
other receptors and therefore the assessment of impact significance is addressed
within relevant chapters of this ES.
8.7.7.7.2 Assessment of effect magnitude and/or impact significance – Two phases for
offshore cable corridor
Under the two-phase approach, the principal difference compared to the single 295.
phase assessment is that described previously for construction impact 4A and
consequently there would be no material change to the assessment of significance
for construction impact 4B for two phases compared to a single-phase approach.
Impact 4C: Changes in seabed level due to deposition from the suspended 8.7.7.8
sediment plume during export cable installation
The increases in suspended sediment concentrations associated with cable 296.
installation have the potential to result in changes in seabed levels as the suspended
sediment deposits. Ploughing represents the worst case burial method due to having
the greatest disturbance volume.
The maximum potential disturbance width of 30m (for ploughing) along the length of 297.
the trenching provides a footprint of 2.4km2 based on two 40km cable trenches
within the SAC. The maximum volume associated with trenching for the export

June 2018 Norfolk Vanguard Offshore Wind Farm PB4476-005-008 Page 92
cables would be 3,000,000m3 (1,200,000m3 within the SAC, based on 10m trench
width with a V shaped profile x 3m maximum average depth x 2 trenches x average
100km trench length or 40km length in the SAC). This would be back filled naturally
or manually. As previously discussed, the plough would create temporary mounds
either side of the trench and so only a small proportion of the 3,000,000m3 would
result in sediment plumes.
The East Anglia ONE plume modelling simulations (ABPmer, 2012b) suggest that any 298.
suspended sand-sized material (which represents most of the potentially disturbed
sediment) would settle out of suspension within less than 1km from the point of
installation within the offshore cable corridor and persist in the water column for
less than a few tens of minutes. Due to the coarser sediment particle sizes observed
across the site (predominantly medium-grained sand), a large proportion of the
disturbed sediment would behave in this manner.
Mud-sized material (which represents only a very small proportion of the disturbed 299.
sediment) would be advected a greater distance and persist in the water column for
hours to days. According to the East Anglia ONE modelling, following completion of
the cable installation activity, theoretical bed level changes in excess of 0.2mm (and
up to 0.8mm) are predicted at a distance of approximately 20km from the cable
trench and changes of up to 2mm within a few hundred metres of the inshore
release locations. However, it is anticipated that under the prevailing hydrodynamic
conditions, this material would be readily re-mobilised, especially in the shallow
inshore area where waves would regularly agitate the bed. Accordingly, outside the
immediate vicinity of the offshore cable trench, bed level changes and any changes
to seabed character are expected to be not measurable in practice.
8.7.7.8.1 Assessment of effect magnitude and/or impact significance – Single phase for
offshore cable corridor
The worst case changes in seabed levels due to offshore cable installation are likely 300.
to have the magnitudes of effect described in Table 8.26.
Table 8.26 Magnitude of effect on seabed level changes due to offshore cable installation under the worst case scenario
Location Scale Duration Frequency Reversibility Magnitude of Effect
Near-field* Low Negligible Negligible Negligible Low
Far-field Negligible Negligible Negligible Negligible Negligible
*The near-field effects are confined to a small area of sea bed (likely to be of the order of several hundred
metres up to a kilometre from the offshore cable corridor), and would not cover the whole offshore cable
corridor.
Importantly, the offshore cable corridor crosses through the southern part of the 301.
Haisborough, Hammond and Winterton SAC and its western end is approximately
June 2018 Norfolk Vanguard Offshore Wind Farm PB4476-005-008 Page 93
60m from the Cromer Shoal Chalk Beds MCZ (at the nearest point). The sensitivity
and value of the SAC and MCZ are presented in Table 8.27.
Table 8.27 Sensitivity and value assessment of Haisborough, Hammond and Winterton SAC and Cromer Shoal Chalk Beds MCZ
Receptor Tolerance Adaptability Recoverability Value Sensitivity
Haisborough,
Hammond and
Winterton SAC
Negligible Negligible Negligible High Negligible
Cromer Shoal Chalk
Beds MCZ Negligible Negligible Negligible High Negligible
As the North Norfolk and Saturn Reef SAC is approximately 2km from the offshore 302.
cable corridor, there would be no discernible impact associated with deposition of
suspended sediment as a result of cable installation.
Based on the East Anglia ONE plume modelling simulations discussed above, expert-303.
based assessment of deposition from the plume generated from cable installation
indicates that the changes in seabed elevation are effectively immeasurable within
the accuracy of any numerical model or bathymetric survey. This means that given
these very small magnitude changes in seabed level arising from offshore cable
installation the impacts on the Haisborough, Hammond and Winterton SAC and
Cromer Shoal Chalk Beds MCZ receptors would not be significant.
The overall impact of offshore cable installation activities under a worst case 304.
scenario on bed level changes due to deposition from the suspended sediment
plume for the identified morphological receptor groups is considered to be no
impact for North Norfolk Sandbanks and Saturn Reef SAC and negligible impact for
Haisborough, Hammond and Winterton SAC and Cromer Shoal Chalk Beds MCZ.
The effects on seabed level have the potential to impact upon other receptors and 305.
therefore the assessment of impact significance is addressed within relevant
chapters of this ES.
8.7.7.8.2 Assessment of effect magnitude and/or impact significance – Two phases for
offshore cable corridor
Under the two-phase approach, the principal difference compared to the single 306.
phase assessment is that described previously for construction impact 3.
Consequently, there would be no material change to the assessment of significance 307.
for construction impact 4C compared to a single-phase approach.

June 2018 Norfolk Vanguard Offshore Wind Farm PB4476-005-008 Page 94
Impact 5: Changes in suspended sediment concentrations during cable installation 8.7.7.9
in the OWF sites
Disturbance of suspended sediment in the OWF sites could arise through levelling of 308.
sandwaves that may be present along the cable routes prior to installation and
directly through installation of the cable (worst case scenario is jetting).
The details of the array and interconnector cabling are dependent upon the final 309.
project design, but present estimates for a single-phase approach are that the total
length of the array cables would be up to 600km and the total length of the
interconnector cable trenches would be up to 150km. As discussed in section
8.7.7.5.1, up to 30km of offshore export cables in the OWF sites is included in this
assessment.
8.7.7.9.1 Sandwave levelling
For the worst case scenario, it is assumed that sandwave levelling may be required 310.
for 100% of the array cables and interconnector cables to an average depth of 3m
and with an average width of 20m. This equates to a total of 15km2 of seabed or
excavation of 45,000,000m3 of sediment. As discussed in section 8.7.7.5.1, up to
1,900,000m3 of sediment may be released in the OWF sites as a result of pre-
sweeping of up to 30km of offshore export cables in the OWF sites plus 100,000m3
from the offshore cable corridor. This would equate to approximately 3,000,000m3
per square kilometre of seabed in the OWF sites.
The dynamic nature of the sand waves in this area means that any direct changes to 311.
the seabed associated with sand wave levelling are likely to recover over a short
period of time due to natural sand transport pathways.
Any excavated sediment due to sand wave levelling for the array and interconnector 312.
cables would be disposed of within the Norfolk Vanguard OWF site itself. This means
there will be no net loss of sand within the site. It is likely that some of this sand
could be disposed on the upstream side of the cable where tidal currents would,
over time, re-distribute the sand back over the levelled area (as re-formed sand
waves). The overall effect of changes to the seabed would therefore be minimal.
Also, in many parts of Norfolk Vanguard there would not be the need for release of 313.
sediment volumes as considered under this worst case scenario and optimisation of
array cable and interconnector cable alignment, depth and installation methods
during detailed design would ensure that effects are minimised.
8.7.7.9.2 Installation of the cable
The worst case scenario cable-laying technique is considered to be jetting. The 314.
plume modelling simulations undertaken for East Anglia ONE (ABPmer, 2012b)
described in section 8.7.7.5 are used as a basis for the expert-based assessment
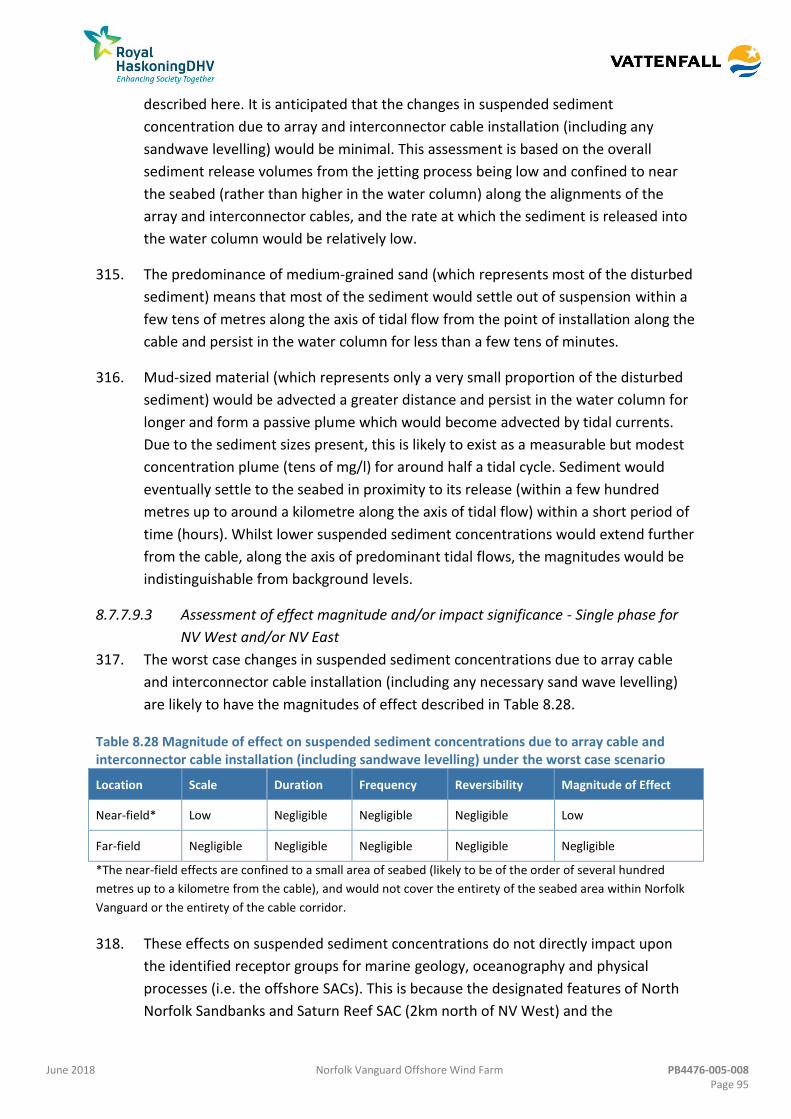
June 2018 Norfolk Vanguard Offshore Wind Farm PB4476-005-008 Page 95
described here. It is anticipated that the changes in suspended sediment
concentration due to array and interconnector cable installation (including any
sandwave levelling) would be minimal. This assessment is based on the overall
sediment release volumes from the jetting process being low and confined to near
the seabed (rather than higher in the water column) along the alignments of the
array and interconnector cables, and the rate at which the sediment is released into
the water column would be relatively low.
The predominance of medium-grained sand (which represents most of the disturbed 315.
sediment) means that most of the sediment would settle out of suspension within a
few tens of metres along the axis of tidal flow from the point of installation along the
cable and persist in the water column for less than a few tens of minutes.
Mud-sized material (which represents only a very small proportion of the disturbed 316.
sediment) would be advected a greater distance and persist in the water column for
longer and form a passive plume which would become advected by tidal currents.
Due to the sediment sizes present, this is likely to exist as a measurable but modest
concentration plume (tens of mg/l) for around half a tidal cycle. Sediment would
eventually settle to the seabed in proximity to its release (within a few hundred
metres up to around a kilometre along the axis of tidal flow) within a short period of
time (hours). Whilst lower suspended sediment concentrations would extend further
from the cable, along the axis of predominant tidal flows, the magnitudes would be
indistinguishable from background levels.
8.7.7.9.3 Assessment of effect magnitude and/or impact significance - Single phase for
NV West and/or NV East
The worst case changes in suspended sediment concentrations due to array cable 317.
and interconnector cable installation (including any necessary sand wave levelling)
are likely to have the magnitudes of effect described in Table 8.28.
Table 8.28 Magnitude of effect on suspended sediment concentrations due to array cable and interconnector cable installation (including sandwave levelling) under the worst case scenario
Location Scale Duration Frequency Reversibility Magnitude of Effect
Near-field* Low Negligible Negligible Negligible Low
Far-field Negligible Negligible Negligible Negligible Negligible
*The near-field effects are confined to a small area of seabed (likely to be of the order of several hundred
metres up to a kilometre from the cable), and would not cover the entirety of the seabed area within Norfolk
Vanguard or the entirety of the cable corridor.
These effects on suspended sediment concentrations do not directly impact upon 318.
the identified receptor groups for marine geology, oceanography and physical
processes (i.e. the offshore SACs). This is because the designated features of North
Norfolk Sandbanks and Saturn Reef SAC (2km north of NV West) and the
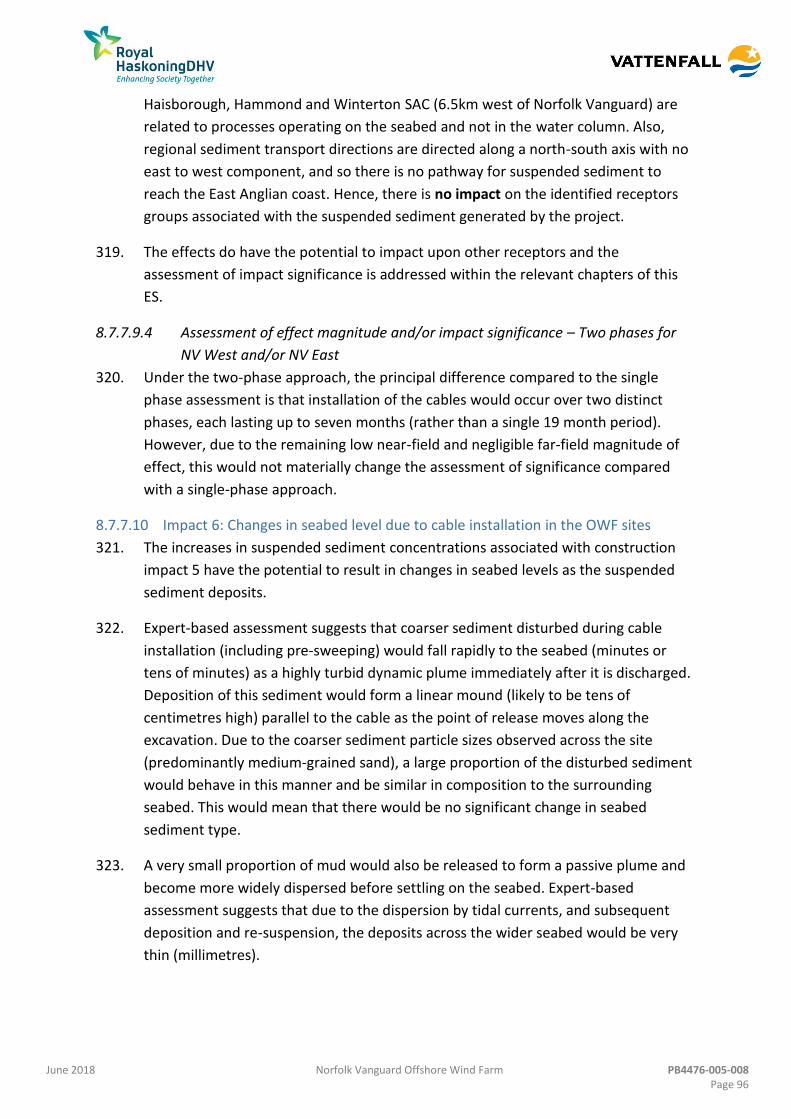
June 2018 Norfolk Vanguard Offshore Wind Farm PB4476-005-008 Page 96
Haisborough, Hammond and Winterton SAC (6.5km west of Norfolk Vanguard) are
related to processes operating on the seabed and not in the water column. Also,
regional sediment transport directions are directed along a north-south axis with no
east to west component, and so there is no pathway for suspended sediment to
reach the East Anglian coast. Hence, there is no impact on the identified receptors
groups associated with the suspended sediment generated by the project.
The effects do have the potential to impact upon other receptors and the 319.
assessment of impact significance is addressed within the relevant chapters of this
ES.
8.7.7.9.4 Assessment of effect magnitude and/or impact significance – Two phases for
NV West and/or NV East
Under the two-phase approach, the principal difference compared to the single 320.
phase assessment is that installation of the cables would occur over two distinct
phases, each lasting up to seven months (rather than a single 19 month period).
However, due to the remaining low near-field and negligible far-field magnitude of
effect, this would not materially change the assessment of significance compared
with a single-phase approach.
Impact 6: Changes in seabed level due to cable installation in the OWF sites 8.7.7.10
The increases in suspended sediment concentrations associated with construction 321.
impact 5 have the potential to result in changes in seabed levels as the suspended
sediment deposits.
Expert-based assessment suggests that coarser sediment disturbed during cable 322.
installation (including pre-sweeping) would fall rapidly to the seabed (minutes or
tens of minutes) as a highly turbid dynamic plume immediately after it is discharged.
Deposition of this sediment would form a linear mound (likely to be tens of
centimetres high) parallel to the cable as the point of release moves along the
excavation. Due to the coarser sediment particle sizes observed across the site
(predominantly medium-grained sand), a large proportion of the disturbed sediment
would behave in this manner and be similar in composition to the surrounding
seabed. This would mean that there would be no significant change in seabed
sediment type.
A very small proportion of mud would also be released to form a passive plume and 323.
become more widely dispersed before settling on the seabed. Expert-based
assessment suggests that due to the dispersion by tidal currents, and subsequent
deposition and re-suspension, the deposits across the wider seabed would be very
thin (millimetres).

June 2018 Norfolk Vanguard Offshore Wind Farm PB4476-005-008 Page 97
8.7.7.10.1 Assessment of effect magnitude and/or impact significance – Single phase for
NV West and/or NV East
Expert-based assessment indicates that changes in suspended sediment 324.
concentration due to array cable and interconnector cable installation (including any
deposition arising from spilled sediment from sand wave levelling) would be minor
and are likely to have the magnitudes of effect shown in Table 8.29.
Table 8.29 Magnitude of effect on seabed level changes due to array cable and interconnector cable installation (including sandwave levelling) under the worst case scenario
Location Scale Duration Frequency Reversibility Magnitude of Effect
Near-field* Low Negligible Negligible Negligible Low
Far-field Negligible Negligible Negligible Negligible Negligible
*The near-field effects are confined to a small area of seabed (likely to be of the order of several hundred
metres up to a kilometre from the cable), and would not cover the whole of Norfolk Vanguard.
These effects on seabed level are considered highly unlikely to have the potential to 325.
impact directly upon the identified receptor groups for marine geology,
oceanography and physical processes. Any impacts will be of a significantly lower
magnitude than those seabed level impacts already considered for the installation of
foundations. Consequently, the overall impact of cable installation in the OWF sites
under a worst case scenario on seabed level changes for identified morphological
receptor groups is therefore considered to be negligible impact.
The effects on seabed level also have the potential to impact upon other receptors 326.
and the assessment of impact significance is addressed within the relevant chapters
of this ES.
8.7.7.10.2 Assessment of effect magnitude and/or impact significance – Two phases for
NV West and/or NV East
Under the two-phase approach, the principal differences compared to the single-327.
phase assessment are those described previously for construction impact 5.
Consequently, there would be no material change to the assessment of significance
for construction impact 6 compared with that for a single-phase approach.
Impact 7: Indentations on the seabed due to installation vessels 8.7.7.11
There is potential for certain vessels used during the installation of Norfolk Vanguard 328.
to directly impact the seabed. This applies for those vessels that utilise jack-up legs
or a number of anchors to hold station and to provide stability for a working
platform. Where legs or anchors (and associated chains) have been inserted into the
seabed and then removed, there is potential for an indentation to remain,
proportional in size to the dimensions of the object. The worst case scenario is

June 2018 Norfolk Vanguard Offshore Wind Farm PB4476-005-008 Page 98
considered to correspond to the use of jack-up vessels, since the depressions would
be greater than the anchor scars.
As the leg is inserted, the seabed sediments would primarily be compressed 329.
vertically downwards and displaced laterally. This may cause the seabed around the
inserted leg to be raised in a series of concentric pressure ridges. As the leg is
retracted, some of the sediment would return to the hole via mass slumping under
gravity until a stable slope angle is achieved. Over the longer term, the hole would
become shallower and less distinct due to infilling with mobile seabed sediments.
A single jack-up barge leg would have a footprint of 177m2 and a jack-up vessel 330.
would have up to four legs (707m2 combined footprint). Each leg could penetrate 5
to 15m into the seabed and may be cylindrical, triangular, truss leg or lattice.
The worst case assumes that legs could be deployed on up to two different occasions 331.
around a single foundation as the jack-up barge manoeuvres into different positions.
8.7.7.11.1 Assessment of effect magnitude and/or impact significance – Single phase for
NV West and/or NV East
The worst case changes in terms of indentations on the seabed due to installation 332.
vessels are likely to have the magnitudes of effect described in Table 8.30.
Table 8.30 Magnitude of effect on seabed level changes due to installation vessels under the worst case scenario
Location Scale Duration Frequency Reversibility Magnitude of Effect
Near-field (immediate
vicinity of leg) High Negligible Negligible Medium Medium
Near-field (beyond
immediate vicinity of leg) No change - - - No change
Far-field No change - - - No change
There is no impact under a worst case scenario on the identified morphological 333.
receptor groups since they are remote from the immediate vicinity of each leg.
The impact significance of these effects on other receptors is addressed within the 334.
relevant chapters of this ES.
8.7.7.11.2 Assessment of effect magnitude and/or impact significance – Two or three
phases for NV West and/or NV East
Under the two-phased approach, the construction phase would occur over two 335.
distinct periods, totalling longer overall durations. In the context of this impact, the
phasing and duration of construction does not materially change the assessment of
significance previously made for the single-phase approach.

June 2018 Norfolk Vanguard Offshore Wind Farm PB4476-005-008 Page 99
Potential Impacts during Operation 8.7.8
During the operational phase of Norfolk Vanguard, there is potential for the 336.
presence of the foundations to cause changes to the tidal and wave regimes due to
physical blockage effects. These changes could potentially affect the sediment
regime and/or seabed morphology. These potential effects are considered as
operational impacts 1 to 6. In addition, there is potential for the temporary presence
of engineering equipment, such as jack-up barges or anchored vessels, to have local
effects on the hydrodynamic and sediment regimes during maintenance activities.
These potential effects are considered as operational impact 7.
Note that the qualitative consideration of impacts will not be affected by the 337.
number of phases that are taken to construct Norfolk Vanguard, and hence the
effects of one-phase and two-phase approaches are considered to be the same.
Impact 1: Changes to the tidal regime due to the presence of wind turbine 8.7.8.1
structures
The presence of foundation structures within Norfolk Vanguard has the potential to 338.
alter the baseline tidal regime, particularly tidal currents. Any changes in the tidal
regime may have the potential to contribute to changes in seabed morphology due
to alteration of sediment transport patterns (see operational impact 3, section
8.7.8.3).
There is a pre-existing scientific evidence base which demonstrates that changes in 339.
the tidal regime due to the presence of foundation structures are both small in
magnitude and localised in spatial extent. This is confirmed by existing guidance
documents (ETSU, 2000; ETSU, 2002; COWRIE, 2009) and numerous Environmental
Statements for offshore wind farms (e.g. Dogger Bank Creyke Beck, Forewind, 2013).
Numerical modelling of changes in hydrodynamics associated with the East Anglia 340.
ONE project (ABPmer, 2012b) also describe small magnitude and localised changes in
tidal currents. This modelling was based on a worst case of 240 GBS (50m base
diameter and height up to 10m off the seabed) and predicted maximum reductions
in peak flow speeds of 0.05m/s to 0.1m/s and maximum increases in peak flow
speeds of 0.05m/s, from peak baseline values of around 1m/s. The geographical
extent of these maximum changes was largely confined to the near-field
environment (a wake zone local to each wind turbine foundation).
The application of the East Anglia ONE results and other pre-existing evidence in 341.
expert-based assessment suggests that each foundation would present an obstacle
to the passage of currents locally, causing a wake in the current flow. Flow would be
decelerated immediately upstream and downstream of each foundation and
accelerated around their sides. Current speeds return to baseline conditions with
June 2018 Norfolk Vanguard Offshore Wind Farm PB4476-005-008 Page 100
progression downstream of each foundation and generally do not interact with
wakes from adjacent foundations due to the large separation distances.
8.7.8.1.1 Assessment of effect magnitude and/or impact significance
The expert-based assessments of the changes in tidal currents associated with the 342.
presence of foundation structures for the proposed Norfolk Vanguard are consistent
with the findings of the earlier modelling studies for the East Anglia ONE project. The
models used in East Anglia ONE had been successfully calibrated and verified with
existing data, and so there is high confidence in the assessment of effects.
The worst case changes to tidal currents due to the presence of GBS foundations are 343.
likely to have the magnitudes of effect described in Table 8.31.
Table 8.31 Magnitude of effect on tidal currents due to the presence of foundations under the worst case scenario
Location Scale Duration Frequency Reversibility Magnitude of Effect
Near-field Low High Medium Negligible Low
Far-field Negligible High Medium Negligible Negligible
These effects on the tidal regime have been translated into a ‘zone of potential 344.
influence’ based on an understanding of the tidal ellipses. It is expected that changes
to the tidal regime would have returned to background levels well within the
excursion of one tidal ellipse, and this threshold has been used to produce the
maximum ‘zone of potential influence’ on the tidal regime, as presented in Figure
8.14.
The majority of the identified receptor groups for marine geology, oceanography and 345.
physical processes is remote from the ‘zone of potential influence’ on the tidal
regime. Due to this, no pathway exists between the source and the receptor in these
areas, and so in terms of impacts on these receptor groups there is no impact
associated with the project. However, the first tidal ellipses from the northern part
of NV West encroach about 15km into the southern part of the North Norfolk
Sandbanks and Saturn Reef SAC. Given that the largest changes are confined to wake
zones local to each wind turbine foundation, the change in overall current velocity in
the SAC would be negligible impact.
Impact 2: Changes to the wave regime due to the presence of wind turbine 8.7.8.2
structures
The presence of foundation structures within Norfolk Vanguard has the potential to 346.
alter the baseline wave regime, particularly in respect of wave heights and
directions. Any changes in the wave regime may have the potential to contribute to
changes in the seabed morphology due to alteration of sediment transport patterns
(see operational impact 3, section 8.7.8.3).

June 2018 Norfolk Vanguard Offshore Wind Farm PB4476-005-008 Page 101
Expert-based assessment suggests that each foundation would present an obstacle 347.
to the passage of waves locally, causing a small modification to the height and/or
direction of the waves as they pass. Generally, this causes a small wave shadow
effect to be created by each foundation. Wave heights return to baseline conditions
with progression downstream of each foundation and generally do not interact with
effects from adjacent foundations due to the separation distances.
There is a strong evidence base which demonstrates that the changes in the wave 348.
regime due to the presence of foundation structures, even under a worst case
scenario of the largest diameter GBS, are relatively small in magnitude. Changes are
typically less than 10% of baseline wave heights in close proximity to each wind
turbine, reducing with greater distance from each wind turbine. Effects are relatively
localised in spatial extent, extending as a shadow zone typically up to several tens of
kilometres from the site along the axis of wave approach, but with low magnitudes
(only a few percent change across this wider area). This is confirmed by a review of
modelling studies from around 30 wind farms in the UK and European waters
(Seagreen, 2012), existing guidance documents (ETSU, 2000; ETSU, 2002; COWRIE,
2009), published research (Ohl et al., 2001) and post-installation monitoring (Cefas,
2005).
Numerical modelling of changes in the wave regime under return period events of 1 349.
in 0.1 year, 1 in 1 year and 1 in 10 years, associated with the East Anglia ONE project
(ABPmer, 2012b) also describe small magnitude and localised changes in waves. This
wave modelling incorporated a worst case of 240 GBS with a basal diameter of 50m
and up to 10m in height off the seabed. The results were:
Maximum percentage reductions in baseline wave height occur within or along
the boundary of the East Anglia ONE site;
During 1 in 10 year storm events, the percentage reductions in wave heights
may be up to approximately 20% within the East Anglia ONE site;
At a distance of approximately 40km from the East Anglia ONE site, maximum
reductions in wave height are typically less than about 2%; and
Regardless of return period or direction of the incoming wave conditions, the
presence of an array of foundations within the East Anglia ONE site does not
cause a measurable change in wave characteristics at the coast.
The likely envelope of wind turbine numbers and GBS foundation sizes for Norfolk 350.
Vanguard is presented in Table 8.32. The modelling for the East Anglia ONE project is
similar in terms of the number and size of foundations being considered for the
proposed Norfolk Vanguard project (see section 8.7.3).

June 2018 Norfolk Vanguard Offshore Wind Farm PB4476-005-008 Page 102
Table 8.32 Likely wind turbine arrangements for the worst case scenario
Turbine rating (MW) Maximum number of wind turbines Maximum basal diameter of GBS (m)
9 200 40 (200m with scour protection)
20 90 50 (250m with scour protection)
8.7.8.2.1 Assessment of effect magnitude and/or impact significance
The worst case changes in wave regime due to the presence of GBS foundations are 351.
likely to have the magnitudes of effect shown in Table 8.33.
Table 8.33 Magnitude of effect on the wave regime due to the presence of foundations under the worst case scenario
Location Scale Duration Frequency Reversibility Magnitude of Effect
Near-field Low High Medium Negligible Low
Far-field Negligible High Medium Negligible Negligible
These effects on the wave regime have been translated into a ‘zone of potential 352.
influence’ based on an understanding of the wave roses, previous numerical
modelling of effects, and using expert-based assessment (Figure 8.15).
Figure 8.8 shows the regional wave roses and describes waves that are likely to be 353.
aligned north to south at NV West and Diagram 8.3 indicates that waves are
predominantly from the north/north-west and south/south-west at NV East. These
would be the axes of greatest potential influence at these two sites.
In addition, wave modelling of the effect of the East Anglia ONE project on the wave 354.
regime has been used as an analogue for delineating the ‘zone of potential
influence’. In that previous modelling assessment, the greatest change along the
defined axis of greatest potential influence arose under a 1 in 10 year wave
condition. The spatial extent of measurable changes (≥ ±5% of the baseline
conditions) under such an event was mapped and superimposed over the NV West
and NV East sites. The resulting ‘zone of influence’ on the wave regime is presented
in Figure 8.15.
The majority of the area of identified receptor groups for marine geology, 355.
oceanography and physical processes is remote from the zone of influence. Due to
this, no pathway exists between the source and the receptor in these areas, and so
in terms of impacts on these receptor groups there is no impact associated with the
project.
However, the first tidal ellipses from the northern and southern parts of NV West 356.
encroach into the extreme south-east part of the North Norfolk Sandbanks and
Saturn Reef SAC and the extreme south-east corner of the Haisborough, Hammond

June 2018 Norfolk Vanguard Offshore Wind Farm PB4476-005-008 Page 103
and Winterton SAC, respectively. The change in wave height would only be a few
percent within these zones of encroachment. Hence, the impact on this very small
part of the designated area would be negligible impact.
Impact 3: Changes to the sediment transport regime due to the presence of wind 8.7.8.3
turbine foundation structures
Modifications to the tidal regime and/or the wave regime due to the presence of the 357.
foundation structures during the operational phase may affect the sediment regime.
This section addresses the broader patterns of suspended and bedload sediment 358.
transport across, and beyond, the Norfolk Vanguard site and sediment transport at
the coast.
8.7.8.3.1 Assessment of effect magnitude and/or impact significance
The predicted reductions in tidal flow (operational impact 1) and wave height 359.
(operational impact 2) associated with the presence of the worst case GBS during the
operational phase would result in a reduction in the sediment transport potential
across the areas where such changes are observed. Conversely, the areas of
increased tidal flow around each wind turbine would result in increased sediment
transport potential.
These changes to the physical processes would be both low in magnitude and largely 360.
confined to local wake or wave shadow effects attributable to individual wind
turbine foundations and, therefore, would be small in geographical extent. In the
case of wave effects, there would also be reductions due to a shadow effect across a
greater seabed area, but the changes in wave heights across this wider area would
be notably lower (a few percent) than the changes local to each wind turbine
foundation (tens of percent). Since it is expected that the changes in tidal flow and
wave heights during the operational phase would have no significant far-field
effects, then the changes in sediment transport would be similar, with the likely
magnitudes of effects described in Table 8.34.
Table 8.34 Magnitude of effect on the sediment transport regime due to the presence of foundations under the worst case scenario
Location Scale Duration Frequency Reversibility Magnitude of Effect
Near-field Low High Medium Negligible Low
Far-field Negligible High Medium Negligible Negligible
The impacts on the sediment transport regime would not extend beyond the zones 361.
of influence previously illustrated for the changes to the tidal and wave regimes
(Figure 8.14 and Figure 8.15) and therefore, there is no impact associated with
Norfolk Vanguard on a very large area of the marine geology, oceanography and
physical processes receptor groups, with negligible impact on very small areas of the

June 2018 Norfolk Vanguard Offshore Wind Farm PB4476-005-008 Page 104
Haisborough, Hammond and Winterton SAC and North Norfolk Sandbanks and
Saturn Reef SAC.
Impact 4: Loss of seabed morphology due to the footprint of wind turbine 8.7.8.4
foundation structures
The seabed morphology would directly be impacted by the footprint of each 362.
foundation structure within Norfolk Vanguard. This would constitute a ‘loss’ in
natural seabed area during the operational life of the project. This direct footprint
due to the presence of foundation structures could occur in one of two ways;
without and with scour protection. Scour protection will be installed at all required
locations, as determined by pre-construction surveys. A worst case scenario of all
foundations having scour protection is considered in order to provide a conservative
assessment.
Under the worst case scenario of scour protection being provided for all foundations, 363.
the seabed would be further occupied by material that is ‘alien’ to the baseline
environment, such as concrete mattresses, fronded concrete mattresses, rock
dumping, bridging or positioning of gravel bags. The diameter of scour protection
would be approximately five times the diameter of the associated foundation. The
total worst case direct wind turbine foundation footprint (for tension leg floating
foundation with gravity anchor) across the project would be 11km2. This represents
1.86% of the total seabed area within the OWF sites (3.7% of either NV East or NV
West).
The total worst case footprint of all foundations (including wind turbine foundations, 364.
platforms, met masts and other infrastructure) would be approximately 11.5km2
(1.96% of the OWF sites or 3.9% of either NV East or NV West).
8.7.8.4.1 Assessment of effect magnitude and/or impact significance
The worst case loss of seabed morphology due to the presence of foundation 365.
structures with scour protection is likely to have the following magnitudes of effect
(Table 8.35). It is likely that any secondary scour effects associated scour protection
would be confined to within a few meters of the direct footprint of that scour
protection material.
Table 8.35 Magnitude of effect on sea bed morphology due to the presence of foundations and scour protection under the worst case scenario
Location Scale Duration Frequency Reversibility Magnitude of Effect
Near-field* High High High Negligible High
Far-field No change - - - No change
*The near-field effects are confined to the footprint of each foundation structure.

June 2018 Norfolk Vanguard Offshore Wind Farm PB4476-005-008 Page 105
The near-field effects are confined to the footprint of each foundation structure, and 366.
therefore have no pathway to the relevant impact receptors.
The significance of these effects on other receptors is addressed within relevant 367.
chapters of this ES.
Impact 5: Morphological and sediment transport effects due to cable protection 8.7.8.5
measures for array and interconnector cables
The preferred method for cable protection would be burial, however where this is 368.
not possible due to substrate type or requirements for cable crossings, cable
protection will be used, including rock placement, concrete mattresses, frond.
The effects that such works may have on marine geology, oceanography and physical 369.
processes primarily relate to the potential for interruption of sediment transport
processes and the footprint they present on the seabed.
In areas of active sediment transport, any linear protrusion on the seabed may 370.
interrupt bedload sediment transport processes during the operational phase of the
project. There is unlikely to be any significant effect on suspended sediment
processes since most of the proposed cable protection works are relatively low
above the seabed (up to a maximum of 0.5m). However, there would be additional
cable protection requirements where the cables cross existing cables or pipelines.
The maximum height of cable crossing protection measures from the seabed would
be 0.9m.
The presence and asymmetry of sand waves across both NV West and NV East 371.
indicates that some bedload sediment transport exists, with a net direction towards
the north. Protrusions from the seabed are unlikely to significantly affect the
migration of sand waves, since sand wave heights (2-7m) in most areas would
exceed the height of cable protection works, and would simply pass over them.
If the protection does present an obstruction to bedload transport the sand would 372.
first accumulate one side or both sides of the obstacle (depending on the gross and
net transport at that particular location) to the height of the protrusion (up to 0.5m
in most cases). With continued build-up, it would then form a ‘ramp’ over which
sand transport would eventually occur by bedload processes, thereby bypassing the
protection. The gross patterns of bedload transport across Norfolk Vanguard would
therefore not be affected significantly.
The presence of cable protection works on the seabed would represent the worst 373.
case in terms of a direct loss of seabed area, but this footprint would be lower than
that of the wind turbine foundations (and associated scour protection works) within
Norfolk Vanguard.

June 2018 Norfolk Vanguard Offshore Wind Farm PB4476-005-008 Page 106
8.7.8.5.1 Assessment of effect magnitude and/or impact significance
The worst case changes to the seabed morphology and sediment transport due to 374.
cable protection measures for array cables and interconnector cables are likely to
have the following magnitudes of effect (Table 8.36).
Table 8.36 Magnitude of effect on seabed morphology and sediment transport due to cable protection measures for array cables and interconnector cables under the worst case scenario
Location Scale Duration Frequency Reversibility Magnitude of Effect
Near-field* High High High Negligible High
Far-field Negligible Negligible Negligible Negligible Negligible
*The near-field effects are confined to a small area (likely to be within the footprint of cable protection works),
and would not cover the whole Norfolk Vanguard site.
The effects on seabed morphology and sediment transport arising from the presence 375.
of array cable and interconnector cable protection measures would not extend far
beyond the direct footprint. Therefore, there is no impact associated with the
project on the identified marine geology, oceanography and physical processes
receptor groups since these are located remotely from this zone of potential effect.
The significance of these effects on other receptors is addressed within the relevant 376.
chapters of this ES.
Impact 6: Morphological and sediment transport effects due to cable protection 8.7.8.6
measures for offshore cables
As a worst case scenario, it has been assumed that burial of the offshore cables 377.
would not practicably be achievable within some areas of the cable corridor and,
instead, cable protection measures would need to be provided to surface-laid cables
in these areas. The effects that cable protection may have on marine geology,
oceanography and physical processes primarily relate to the potential for
interruption of sediment transport and the footprint they present on the seabed.
In the nearshore zone and landfall, an assumption is made that cable protection will 378.
only be used at the HDD exit point for each of the two cable pairs. This would entail
one mattress (6m long, 3m wide and 0.3m high) plus rock dumping (5m long, 5m
wide and 0.5m high) at each exit point.
This means that cable protection in the nearshore zone where the water is shallow 379.
and sediment transport is most active along the coast driven by waves (landward of
the closure depth) would be limited to very short lengths at each of the HDD exit
points. However, protection further offshore (seaward of the closure depth) would
potentially affect sediment transport across the seabed.

June 2018 Norfolk Vanguard Offshore Wind Farm PB4476-005-008 Page 107
This approach ensures that the requirement for cable protection along the sections 380.
of offshore cable that are located inshore of the closure depth are significantly
reduced as a form of mitigation that has been embedded into the design.
The locations where cable protection measures are most likely to be required in 381.
deeper water are those areas of seabed characterised by exposed bedrock. The
preferred method for cable protection would be concrete mattresses, although
other methods may be used.
Given that there would be very limited protrusions from the seabed associated with 382.
cable protection measures inshore of the 10m bathymetric contour (most of the
inshore cable will be buried beneath the seabed), there would be minimal effect on
sediment transport and hence geomorphological change (erosion and accretion) in
the nearshore.
Norfolk Vanguard Limited commissioned an HDD feasibility study (Riggall, 2016 383.
unpublished) which investigated a number of possible locations along the Norfolk
Coast and identified Happisburgh South as a viable landfall option using HDD. The
study used available information to assess feasibility, including suitable geology to
maintain stability during HDD works. A coastal erosion study (Appendix 4.1) was
undertaken by Royal HaskoningDHV, and considered the likely impact of climate
change on the coastal erosion in the area. This study informed the landfall site
selection and design of the HDD works. In addition, ground investigation boreholes
were undertaken at Happisburgh South in 2017. The analysis of these data informed
the decision to use long HDD at the landfall.
The HDD will be secured beneath the surface of the shore platform and the base of 384.
the cliff, drilled from a location greater than 150m landward of the cliff edge. The
material through which the HDD will pass, and through which the cables will
ultimately be located, is consolidated and will have sufficient strength to maintain its
integrity during the construction process and during operation. Also, the cable will
be located at sufficient depth to account for shore platform steepening
(downcutting) as cliff erosion progresses, and so will not become exposed during the
design life of the project (approximately 30 years). Hence, the continued integrity of
the geological materials and the continued depth of burial of the cables mean that
they will have no impact on coastal erosion during both construction and operation.
Along the sections of the offshore cable corridor that are located seaward of 10m 385.
water depth, any protrusions from the seabed associated with cable protection
measures could affect sediment transport. However, in a similar way to array cables,
the sand would accumulate against the cable protection, eventually forming a ‘ramp’
over which the transport would eventually continue.

June 2018 Norfolk Vanguard Offshore Wind Farm PB4476-005-008 Page 108
The protection is also unlikely to significantly affect the migration of sand waves, 386.
since their heights (2-7m) would exceed the likely height of cable protection works
(0.5m along most of the cable up to 0.9m at cable and pipeline crossings). There may
be localised interruptions to bedload transport in some areas, but the gross patterns
of bedload transport would not be affected significantly.
Up to 0.05km2 of cable protection may be required in the Haisborough, Hammond 387.
and Winterton SAC, based on the following:
Six crossings for each of the two cable pairs within the SAC with a total footprint
of 12,000m2 (0.012km2) (100m length and 10m width of protection); and
A contingency of up to 4km of cable protection per cable pair, resulting in a
footprint of 40,000m2 (0.04km2) based on 5m wide cable protection.
8.7.8.6.1 Assessment of effect magnitude and/or impact significance
The worst case changes to the seabed morphology and sediment transport due to 388.
cable protection measures for offshore cables are likely to have the magnitudes of
effect described in Table 8.37. The worst case changes to erosion are likely to have
the magnitudes of effect described in Table 8.38.
Table 8.37 Magnitude of effect on seabed morphology and sediment transport due to cable protection measures for offshore cables under the worst case scenario
Location Scale Duration Frequency Reversibility Magnitude of Effect
Landfall Negligible High High Negligible Negligible
Shallower than 10m water depth (excluding landfall)
No change - - - No change
Deeper than 10m water depth
Low High High Negligible Low
Table 8.38 Magnitude of effect on cliff erosion due to cable operation under the worst case scenario
Location Scale Duration Frequency Reversibility Magnitude of Effect
Landfall No change - - - No change
The seabed morphology and sediment transport effects could potentially directly 389.
affect parts of the East Anglian coast and so its sensitivity and value is presented in
Table 8.39.
Table 8.39 Sensitivity and value assessment for the East Anglian coast
Receptor Tolerance Adaptability Recoverability Value Sensitivity
East Anglian coast Low Low Negligible High Medium
The significance of impacts relating to seabed and coastal morphology and sediment 390.
transport arising from the presence of cable protection measures for offshore cables
June 2018 Norfolk Vanguard Offshore Wind Farm PB4476-005-008 Page 109
would differ depending on the location of the works and the identified receptor
groups under consideration.
It is considered that the extremely small areas associated with cable protection 391.
(0.001% of the total area of the Haisborough, Hammond and Winterton SAC and
0.002% of the area of sandbanks within the SAC) would have no significant effect on
the governing processes of the SAC. Therefore, there would be negligible impact on
the Haisborough, Hammond and Winterton SAC.
As no cable protection is expected to be required in the nearshore area of the cable 392.
corridor no morphological effects would take place and so there would be no impact
on coastline morphology at the cable landfall during the operational phase of
Norfolk Vanguard.
The significance of these effects on other receptors is addressed within relevant 393.
chapters of this ES.
Impact 7: Cable repairs/reburial and maintenance vessel footprints 8.7.8.7
Cable repairs and reburial could be needed, as outlined in section 8.7.6.7 and in 394.
Table 8.15. Turbine repairs may also need to be carried out as required. The
disturbance areas for reburial and repairs of cables are extremely small in
comparison to construction.
There is potential for temporary physical disturbance to Annex I Sandbanks in the 395.
offshore cable corridor due to cable maintenance and repair operations. The
maximum disturbance area would be 3,150m2 (0.003km2) for each cable repair
(including anchor placement associated with repair works). This equates to less than
0.001% of the total SAC area (1,468km2) and the sandbank area (678km2). The
sandbank would have recovered from any temporary disturbance from one repair
before any further repairs are required.
The maximum disturbance area for cable reburial activities within the SAC has been 396.
estimated as 0.4km2 over the life of the project (0.03% of the total area of the SAC or
0.06% of the sandbank area). This is estimated from 4km per cable pair within the
SAC, with a disturbance width of 10m. However, if reburial is required, it is likely
that this would be for shorter sections (e.g. 1km) at any one time.
There is potential for certain vessels used during the maintenance of the wind 397.
turbines to directly impact the seabed during the operational phase. This applies for
those vessels that utilise jack-up legs or a number of anchors to hold station and to
provide stability for a working platform. Where legs or anchors are temporarily
placed on the seabed, there is potential for an indentation to remain proportional in
size to the dimensions of the object. There is also potential for local effects on
waves, tides and sediment transport and also for local scour-hole formation around

June 2018 Norfolk Vanguard Offshore Wind Farm PB4476-005-008 Page 110
the legs or anchors while they remain in place for the duration of the maintenance
works.
The worst case scenario is considered to correspond to the use of jack-up vessels for 398.
wind turbine repairs since the depressions and potential for effects on physical
processes and scour-hole formation would be greater than the anchor scars.
For purposes of a worst case, it has been assumed that the total area of seabed that 399.
may be affected by these activities is 0.58km2 per year (based on up to two visits per
day by jack-up vessels with a footprint of 792m2). It is possible that different areas
would be affected in each year of the operational phase.
The effects of the jack-up legs on waves, tides and sediment transport would be 400.
localised since the legs are small and would only be temporary. Once the
maintenance activities are complete the jack-up barges would be moved on and no
permanent effects on marine geology, oceanography and physical processes would
remain.
The legs of the jack-up barge would be small in diameter and this would place a 401.
physical limit on the depth and plan area of any scour-hole formation (and hence the
volume of scour material that would be released into the water column). This
process would be further influenced by the physical conditions at each site (e.g.
waves, currents, seabed sediments, strength of underlying geology, etc.). The scour
volumes arising would therefore be small in magnitude and cause an insignificant
effect in terms of enhanced suspended sediment concentrations and deposition of
sediments elsewhere.
8.7.8.7.1 Assessment of effect magnitude and/or impact significance of vessel footprints
The worst case changes in terms of indentations on the seabed due to maintenance 402.
vessels are likely to have the magnitudes of effect shown in Table 8.40.
Table 8.40 Magnitude of effect on the seabed due to maintenance vessels under the worst case scenario
Location Scale Duration Frequency Reversibility Magnitude of Effect
Near-field (immediate
vicinity of leg) High Negligible Negligible Medium Medium
Near-field (beyond
immediate vicinity of leg) No change - - - No change
Far-field No change - - - No change
There is no impact under a worst case scenario on the identified morphological 403.
receptor groups since they are remote from the immediate vicinity of each leg.
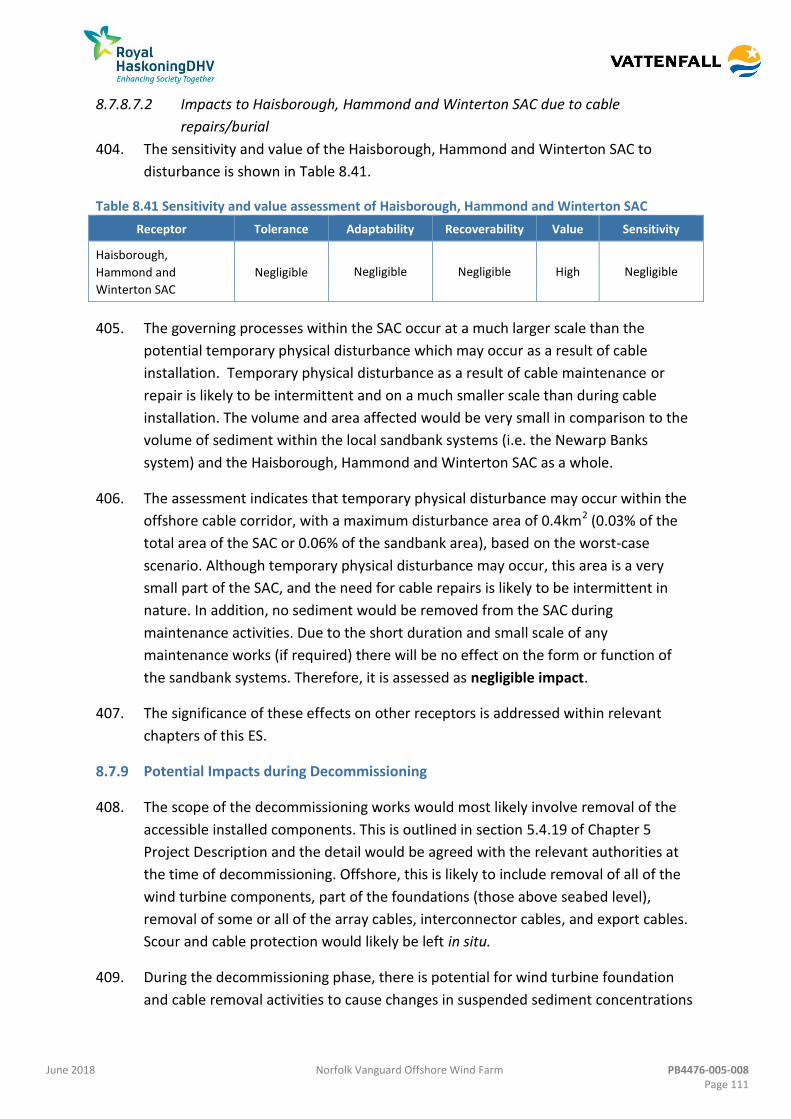
June 2018 Norfolk Vanguard Offshore Wind Farm PB4476-005-008 Page 111
8.7.8.7.2 Impacts to Haisborough, Hammond and Winterton SAC due to cable
repairs/burial
The sensitivity and value of the Haisborough, Hammond and Winterton SAC to 404.
disturbance is shown in Table 8.41.
Table 8.41 Sensitivity and value assessment of Haisborough, Hammond and Winterton SAC
Receptor Tolerance Adaptability Recoverability Value Sensitivity
Haisborough,
Hammond and
Winterton SAC
Negligible Negligible Negligible High Negligible
The governing processes within the SAC occur at a much larger scale than the 405.
potential temporary physical disturbance which may occur as a result of cable
installation. Temporary physical disturbance as a result of cable maintenance or
repair is likely to be intermittent and on a much smaller scale than during cable
installation. The volume and area affected would be very small in comparison to the
volume of sediment within the local sandbank systems (i.e. the Newarp Banks
system) and the Haisborough, Hammond and Winterton SAC as a whole.
The assessment indicates that temporary physical disturbance may occur within the 406.
offshore cable corridor, with a maximum disturbance area of 0.4km2 (0.03% of the
total area of the SAC or 0.06% of the sandbank area), based on the worst-case
scenario. Although temporary physical disturbance may occur, this area is a very
small part of the SAC, and the need for cable repairs is likely to be intermittent in
nature. In addition, no sediment would be removed from the SAC during
maintenance activities. Due to the short duration and small scale of any
maintenance works (if required) there will be no effect on the form or function of
the sandbank systems. Therefore, it is assessed as negligible impact.
The significance of these effects on other receptors is addressed within relevant 407.
chapters of this ES.
Potential Impacts during Decommissioning 8.7.9
The scope of the decommissioning works would most likely involve removal of the 408.
accessible installed components. This is outlined in section 5.4.19 of Chapter 5
Project Description and the detail would be agreed with the relevant authorities at
the time of decommissioning. Offshore, this is likely to include removal of all of the
wind turbine components, part of the foundations (those above seabed level),
removal of some or all of the array cables, interconnector cables, and export cables.
Scour and cable protection would likely be left in situ.
During the decommissioning phase, there is potential for wind turbine foundation 409.
and cable removal activities to cause changes in suspended sediment concentrations

June 2018 Norfolk Vanguard Offshore Wind Farm PB4476-005-008 Page 112
and/or seabed or shoreline levels as a result of sediment disturbance effects. The
types of effect would be comparable to those identified for the construction phase:
Impact 1: Changes in suspended sediment concentrations due to wind turbine
foundation removal;
Impact 2: Changes in seabed level (morphology) due to wind turbine foundation
removal;
Impact 3: Changes in suspended sediment concentrations due to removal of
parts of the array and interconnector cables;
Impact 4: Changes in seabed level due to removal of parts of the array and
interconnector cables;
Impact 5: Changes in suspended sediment concentrations due to removal of
parts of the offshore export cables (including nearshore and at the coastal
landfall); and
Impact 6: Indentations on the seabed due to decommissioning vessels.
The magnitude of effects would be comparable to or less than those identified for 410.
the construction phase. Accordingly, given that negligible adverse or no impact was
identified for the marine geology, oceanography and physical processes receptors
during the construction phase, it is anticipated that the same would be valid for the
decommissioning phase.
The significance of effects on other receptors is addressed within relevant chapters 411.
of this ES (see section 8.9).
Cumulative Impacts 8.8
The receptors that have been specifically identified in relation to marine geology, 412.
oceanography and physical processes are the ‘East Anglia’ coastline, the
Haisborough, Hammond and Winterton SAC, the Cromer Shoal Chalk Beds MCZ and
the North Norfolk Sandbanks and Saturn Reef SAC. Impacts (including Cumulative
Impacts) to the relevant designated features of these sites are assessed in Chapter 9
Marine Water and Sediment Quality, Chapter 10 Benthic and Intertidal Ecology,
Chapter 11 Fish and Shellfish Ecology, Chapter 14 Commercial Fisheries, and Chapter
17 Offshore and Intertidal Archaeology and Cultural Heritage.
The marine geology, oceanography and physical processes effects that have been 413.
assessed for the proposed Norfolk Vanguard project alone are mostly anticipated to
result in no impact or negligible impact to the above-mentioned receptors. This is
primarily because these receptors are located remotely from the zones of influence
arising from most of the effects and no pathway has been identified that can link the
source to the receptor in most cases. This assessment remains valid for both the
single-phase and two-phase construction approaches considered.

June 2018 Norfolk Vanguard Offshore Wind Farm PB4476-005-008 Page 113
However, there may be potential cumulative effects on some of the identified 414.
receptor groups arising due to:
Installation of foundation structures for Norfolk Vanguard with the proposed
East Anglia THREE and Norfolk Boreas projects;
Installation or decommissioning of the export cable (including works at the
landfall) for Norfolk Vanguard with the proposed Norfolk Boreas project;
Installation or decommissioning of the export cable (including works at the
landfall) for Norfolk Vanguard and marine aggregate dredging activities in
adjacent areas of the seabed; and
Operation and maintenance of Norfolk Vanguard with the proposed East Anglia
THREE and Norfolk Boreas projects.
A summary of the screening of potential impacts is set out in Table 8.42. 415.
Table 8.42 Potential cumulative impacts
Impact Potential for
cumulative impact
Rationale
Construction
1 Changes in Suspended Sediment
Concentrations due to Seabed
Preparation and drill arisings
associated with foundations
Yes Where construction windows could
overlap for projects adjacent to
Norfolk Vanguard i.e. Norfolk Boreas
and East Anglia THREE there is
potential for cumulative impact.
2 Changes in Seabed Level due to
Seabed Preparation and drill arisings
associated with foundations
Yes Where construction windows could
overlap for projects adjacent to
Norfolk Vanguard i.e. Norfolk Boreas
and East Anglia THREE there is
potential for cumulative impact.
3 Changes in Suspended Sediment
Concentrations during Offshore
Export Cable Installation
Yes Norfolk Vanguard and Norfolk Boreas
share an offshore cable corridor and
therefore there is potential for
cumulative impacts. Consideration is
also given to Marine Aggregate
Dredging
4 Changes in Seabed Level and
interruptions to bed load due to
Offshore Export Cable Installation
Yes Norfolk Vanguard and Norfolk Boreas
share an offshore cable corridor and
therefore there is potential for
cumulative impacts. Consideration is
also given to Marine Aggregate
Dredging
5 Changes in Suspended Sediment
Concentrations during Array and
Interconnector Cable Installation
Yes Where construction windows could
overlap for projects adjacent to
Norfolk Vanguard i.e. Norfolk Boreas
and East Anglia THREE there is
potential for cumulative impact.

June 2018 Norfolk Vanguard Offshore Wind Farm PB4476-005-008 Page 114
Impact Potential for
cumulative impact
Rationale
6 Changes in Seabed Level due to
Array and Interconnector Cable
Installation
Yes Where construction windows could
overlap for projects adjacent to
Norfolk Vanguard i.e. Norfolk Boreas
and East Anglia THREE there is
potential for cumulative impact.
7 Indentations on the Seabed due to
Installation Vessels
No Impacts will be localised to the area
of seabed affected by the installation
vessel legs/anchors and therefore
there will be no cumulative impact
beyond this area.
Operation
1 Changes to the Tidal Regime due to
the Presence of Wind Turbine
Structures
Yes Additive changes to the tidal regime
of Norfolk Vanguard, Norfolk Boreas
and East Anglia THREE due to their
proximity.
2 Changes to the Wave Regime due to
the Presence of Wind Turbine
Structures
Yes Additive changes to the wave regime
of Norfolk Vanguard, Norfolk Boreas
and East Anglia THREE due to their
proximity.
3 Changes to the Sediment Transport
Regime due to the Presence of
Foundation Structures
No Impacts will be highly localised
around the foundations and therefore
there will be no cumulative impact.
4 Loss of Seabed Morphology due to
the Footprint of Wind Turbine
Foundation Structures
No Impacts will be highly localised
around the foundations and therefore
there will be no cumulative impact.
5 Morphological and Sediment
Transport Effects due to Cable
Protection Measures for Array and
Interconnector Cables
No Impacts will be highly localised
around the cable protection
measures and therefore there will be
no cumulative impact.
6 Morphological and Sediment
Transport Effects due to Cable
Protection Measures for Offshore
Cables
No There is no impact predicated from
Impacts will be highly localised
around the cable protection
measures and therefore there will be
no cumulative impact.
7 Cable repairs/reburial and
maintenance vessel footprints
No Impacts will be highly localised
around the foundations and cables
and therefore there will be no
cumulative impact.
Decommissioning
The detail and scope of the decommissioning works will be determined by the relevant legislation and
guidance at the time of decommissioning and agreed with the regulator. A decommissioning plan will be
provided. As such, cumulative impacts during the decommissioning stage are assumed to be the same as those
identified during the construction stage.
June 2018 Norfolk Vanguard Offshore Wind Farm PB4476-005-008 Page 115
These potential interactions are included in the Cumulative Impact Assessment (CIA) 416.
(Table 8.43). Interaction with the proposed East Anglia ONE project is excluded from
the CIA. This is because the EIA for East Anglia THREE (EATL, 2015) provided evidence
for no operational interaction between East Anglia ONE and East Anglia THREE. The
assessment showed that there was no overlap of the zones of influence arising
cumulatively from the East Anglia ONE and East Anglia THREE projects in relation to
changes on the tidal and wave regimes.
Given that Norfolk Vanguard is further away from East Anglia ONE, then there will 417.
also be no interactions from this or any other offshore wind farms of comparable or
greater distance to Norfolk Vanguard. In addition, the cable corridor for East Anglia
ONE is directed west-south-west towards Bawdsey, whereas the cable corridor for
Norfolk Vanguard is directed west to Happisburgh, and the distance between the
two corridors is sufficient for there to be no marine geology, oceanography and
physical processes interactions during the construction phases of the two projects.
The proposed landfall at Happisburgh South is to the south of the proposed sand 418.
engine (very large scale beach nourishment) for a coastal protection scheme in front
of Bacton Gas Terminal. The effect of the beach nourishment is likely to be felt at
Happisburgh South (i.e. some of the nourished sand will migrate from the main sand
engine driven by longshore sediment transport). However, as the Norfolk Vanguard
HDD would have no impact on coastal erosion and the nearshore cable protection
would have negligible impact on sediment transport processes at the coast; there
will be no cumulative impacts between Norfolk Vanguard and Bacton sand engine.
The offshore cable for the proposed Norfolk Vanguard project passes north of a 419.
series of marine aggregate extraction areas offshore from Great Yarmouth. The
southern edge of the cable corridor is within 10km of the most northern extraction
areas and there is the potential for some interaction between their dredging plumes
and plumes from cable installation. This is because they are within one spring tidal
excursion distance from each other.

June 2018 Norfolk Vanguard Offshore Wind Farm PB4476-005-008 Page 116
Table 8.43 Summary of projects considered for the CIA in relation to the topic
Project Status Indicative
development
period
Distance from
Norfolk
Vanguard (km)
Project
definition
Project data
status
Included
in CIA
Rationale
East Anglia THREE OWF Consented 2022-2026 0 PDS available Complete/high Yes This project would be adjacent to
NV East. It has potential for
interaction during the
construction of foundations and
their operation and maintenance
Norfolk Boreas OWF Pre-Application 2024-2028 1 Outline only Incomplete/low Yes This project would be adjacent to
NV East and may share the
offshore cable corridor. It has
potential for interaction during
the construction and operation
and maintenance phases
Marine aggregate dredging Licenced In operation Nearest 27km Complete/high Yes The offshore cable for Norfolk
Vanguard passes north of marine
aggregate extraction areas
offshore from Great Yarmouth.
There is potential for some
interaction between their
dredging plumes and plumes
from cable installation

June 2018 Norfolk Vanguard Offshore Wind Farm PB4476-005-008 Page 117
Cumulative Construction and Decommissioning Impacts with Adjacent Wind Farms 8.8.1
The impacts of the foundation and offshore cable installation and decommissioning 420.
activities (including works at the landfall) on the identified receptors were identified
to be of negligible impact for the proposed Norfolk Vanguard project alone.
The construction programmes of NV East, East Anglia THREE, and/or Norfolk Boreas 421.
may overlap depending on the final construction programmes. The Norfolk Vanguard
cable corridor and its landfall would be common to the future Norfolk Boreas project
and so there is potential for cumulative impacts to arise during the construction and
decommissioning stages.
The worst case scenario from a marine geology, oceanography and physical 422.
processes perspective would be for all projects to be constructed at the same time.
This would provide the greatest opportunity for interaction of sediment plumes and
a larger change in seabed level during their construction. The combined change in
seabed level sediment plume from foundation and cable installation could have a
greater spatial extent and be greater in a vertical sense than each individual project.
As for Norfolk Vanguard alone, the majority of suspended sediment arising from 423.
each project would fall rapidly to the seabed after the start of construction and
therefore the potential cumulative impact would be of negligible magnitude. The
receptor sensitivity would also be negligible and therefore it is considered that the
cumulative impact of two or three projects constructing in this area at the same time
would be negligible.
Cumulative Construction and Decommissioning Impacts with Marine Aggregate 8.8.2
Dredging
In order to assess the potential for cumulative effects between the installation of the 424.
offshore cable and marine aggregate dredging activities in adjacent areas of the
seabed, reference has been made to the EIA for the East Anglia ONE project.
Although the cable corridor route is different the results provide a useful and
appropriate analogy for Norfolk Vanguard.
The East Anglia ONE EIA was supported by numerical modelling, using Delft3D plume 425.
modelling software, of the potential for interactions of sediment plumes arising from
offshore cable installation with those arising from marine aggregate dredging sites
(and indeed other seabed activities) located within one spring tidal excursion
distance from the East Anglia ONE offshore cable corridor. The modelling showed
that some interaction could potentially occur between dredging plumes and plumes
from cable installation and that the spatial extent of the combined plume is slightly
greater than for the plumes originating from the offshore cable installation only.

June 2018 Norfolk Vanguard Offshore Wind Farm PB4476-005-008 Page 118
Whilst maximum plume concentrations would be no greater under the cumulative
scenario, a larger geographical area might experience increases in suspended
sediment concentrations than for the offshore cable installation only scenario.
Following cessation of cable burial and aggregate dredging activities, a few hundred
metres away from the immediate release locations maximum theoretical bed level
changes of up to 2mm were identified by the model, with maximum levels of around
0.8mm at greater distances.
Norfolk Vanguard is located over 5km from the nearest aggregate extraction site 426.
(North Cross Sands). Considering the results from East Anglia ONE described above,
the potential cumulative impacts between offshore cable installation for Norfolk
Vanguard and nearby marine aggregate dredging activities would be negligible as a
conservative estimate.
Cumulative Operation and Maintenance Impacts with Adjacent Wind Farms 8.8.3
From an operation and maintenance perspective, Figure 8.16 and Figure 8.17 show 427.
overlap of the ‘zones of influence’ arising from the proposed East Anglia THREE and
Norfolk Vanguard projects in relation to changes on the tidal and wave regimes,
respectively. In addition, the ‘zone of influence’ of the yet to be assessed Norfolk
Boreas may also overlap with those of NV East and East Anglia THREE.
The overlap of the ‘zones of influence’ effectively represents the enlargement of 428.
three separate zones into a single ‘zone of influence’ of a much larger wind farm. In
this respect, the pre-existing scientific evidence base and the results of the East
Anglia ONE modelling (sections 8.7.8.1 and 8.7.8.2), which demonstrate that changes
in tidal currents and waves due to the presence of foundation structures are both
small in magnitude and localised in spatial extent, applies cumulatively. Hence, the
potential cumulative impact between Norfolk Vanguard, East Anglia THREE and
Norfolk Boreas is considered to be negligible.
Inter-relationships 8.9
The range of effects on marine geology, oceanography and physical processes of the 429.
proposed Norfolk Vanguard project not only have the potential to directly affect the
identified marine geology, oceanography and physical processes receptors but may
also manifest as impacts upon receptors other than those considered within the
context of marine geology, oceanography and physical processes. The assessments
of significance of these impacts on other receptors are provided in the chapters
listed in Table 8.44.

June 2018 Norfolk Vanguard Offshore Wind Farm PB4476-005-008 Page 119
Table 8.44 Chapter topic inter-relationships
Topic and
description
Related Chapter Where addressed in this
Chapter
Rationale
Effects on water column (suspended sediment concentrations)
9 – Marine water and sediment quality 11 – Fish and shellfish ecology 12 – Marine mammals 14 – Commercial fisheries
8.7.7.1 and 8.7.7.2 (foundation installation) 8.7.7.5 (offshore cables installation)
8.7.7.9 (array cables
installation)
Suspended sediment concentrations are a measure of water quality and therefore changes are assessed in chapter 9. The receptors of changes in suspended sediment are fish and marine mammals and therefore these are assessed in Chapters 11 and 12. Changes to fish ecology could have impacts on commercial fisheries (assessed in Chapter 14).
Effects on seabed (morphology / sediment transport / sediment composition)
10 – Benthic and intertidal ecology 11 – Fish and shellfish ecology 14 – Commercial fisheries 17 – Offshore and intertidal archaeology and cultural heritage
8.6.6.1 and 8.6.6.2 (foundation installation) 8.7.7.5 (offshore cables installation) 8.7.7.9 (array cables installation) 8.7.7.11 (installation vessels) 8.7.8.3 (sediment transport regime) 8.7.8.5 (array cable protection) 8.7.8.6 (offshore cable protection)
Changes to seabed morphology/sediment transport could affect the habitat of benthic, fish and shellfish receptors. Changes to fish ecology could have impacts on commercial fisheries (assessed in Chapter 14). Changes to sediment transport could affect the exposure of, and therefore impacts on archaeological features.
Effects on shoreline (morphology / sediment transport / sediment composition)
10 – Benthic and intertidal ecology
8.7.7.5 (cable landfall) 8.7.8.6 (offshore cable protection in nearshore and intertidal zone)
Changes to seabed morphology/sediment transport at the coast could affect the intertidal habitat.
Interactions 8.10
The impacts identified and assessed in this chapter have the potential to interact 430.
with each other, which could give rise to synergistic impacts as a result of that
interaction. The worst case impacts assessed within the chapter take these
interactions into account and for the impact assessments are considered
conservative and robust. For clarity the areas of interaction between impacts are
presented in Table 8.45 along with an indication as to whether the interaction may
give rise to synergistic impacts.

June 2018 Norfolk Vanguard Offshore Wind Farm PB4476-005-008 Page 120
Table 8.45. Interaction between impacts
Construction
Impact 1A:
Changes in
Suspended
Sediment
Concentrations
due to Seabed
Preparation for
Wind Turbine
Gravity Anchor
Foundation
Installation
Impact 1B:
Changes in
Suspended
Sediment
Concentrations
due to Drill
Arisings for
Installation of
Piled Foundations
for Wind Turbines
Impact 2A:
Changes in
Seabed Level
due to Seabed
Preparation for
Wind Turbine
Gravity Anchor
Foundation
Installation
Impact 2B:
Changes in
Seabed Level
due to Drill
Arisings for
Installation of
Piled
Foundations
for Wind
Turbines
Impact 3:
Changes in
Suspended
Sediment
Concentrations
during
Offshore
Export Cable
Installation
Impact 4A:
Changes in
seabed level
due to disposal
of sediment
from sand
wave levelling
in the offshore
cable corridor
Impact 4B:
Interruptions to
Bedload
Sediment
Transport due to
Sand Wave
Levelling in the
offshore cable
corridor
Impact 4C:
Changes in
Seabed Level
due to
deposition
from the
suspended
sediment
plume during
export cable
installation
Impact 5:
Changes in
Suspended
Sediment
Concentrations
during Array and
Interconnector
Cable Installation
Impact 6:
Changes in
Seabed Level due
to Array and
Interconnector
Cable Installation
Impact 7:
Indentations
on the Seabed
due to
Installation
Vessels
Impact 1A: Changes in Suspended Sediment
Concentrations due to Seabed Preparation
for Wind Turbine Gravity Anchor Foundation
Installation
- No Yes No Yes No No Yes Yes Yes Yes
Impact 1B: Changes in Suspended Sediment
Concentrations due to Drill Arisings for
Installation of Piled Foundations for Wind
Turbines
No - No Yes Yes No No Yes Yes Yes Yes
Impact 2A: Changes in Seabed Level due to
Seabed Preparation for Wind Turbine
Gravity Anchor Foundation Installation
Yes No - No Yes No No Yes Yes Yes Yes
Impact 2B: Changes in Seabed Level due to
Drill Arisings for Installation of Piled
Foundations for Wind Turbines
No Yes No - Yes No No Yes Yes Yes Yes
Impact 3: Changes in Suspended Sediment
Concentrations during Offshore Export
Cable Installation
Yes Yes Yes Yes - Yes Yes Yes Yes Yes Yes
Impact 4A: Changes in seabed level due to
disposal of sediment from sand wave
levelling in the offshore cable corridor
No No No No Yes - Yes Yes Yes Yes Yes
Impact 4B: Interruptions to Bedload
Sediment Transport due to Sand Wave
Levelling in the offshore cable corridor
No No No No Yes Yes - Yes No No No
Impact 4C: Changes in Seabed Level due to
Offshore Export Cable Installation due to
deposition from the suspended sediment
plume during export cable installation
Yes Yes Yes Yes Yes Yes Yes - No Yes No
Impact 5: Changes in Suspended Sediment
Concentrations during Array and
Interconnector Cable Installation
Yes Yes Yes Yes Yes Yes No No - No No
Impact 6: Changes in Seabed Level due to
Array and Interconnector Cable Installation
Yes Yes Yes Yes Yes Yes No Yes No - No
Impact 7: Indentations on the Seabed due to
Installation Vessels
Yes Yes Yes Yes Yes Yes No No No No -

June 2018 Norfolk Vanguard Offshore Wind Farm PB4476-005-008 Page 121
Operation
Impact 1: Changes to the Tidal
Regime due to the Presence
of Wind Turbine Structures
Impact 2: Changes to the Wave
Regime due to the Presence of
Wind Turbine Structures
Impact 3: Changes to the
Sediment Transport Regime due
to the Presence of Wind Turbine
Foundation Structures
Impact 4: Loss of Seabed
Morphology due to the
Footprint of Wind Turbine
Foundation Structures
Impact 5: Morphological and
Sediment Transport Effects
due to Cable Protection
Measures for Array and
Interconnector Cables
Impact 6: Morphological and
Sediment Transport Effects
due to Cable Protection
Measures for Offshore Cables
Impact 7: Cable
repairs/reburial and
maintenance vessel
footprints
Impact 1: Changes to the
Tidal Regime due to the
Presence of Wind Turbine
Structures
- Yes No No No No No
Impact 2: Changes to the
Wave Regime due to the
Presence of Wind Turbine
Structures
Yes - No No No No No
Impact 3: Changes to the
Sediment Transport
Regime due to the
Presence of Wind Turbine
Foundation Structures
No No - No No Yes No
Impact 4: Loss of Seabed
Morphology due to the
Footprint of Wind Turbine
Foundation Structures
No No No No No No No
Impact 5: Morphological
and Sediment Transport
Effects due to Cable
Protection Measures for
Array and Interconnector
Cables
No No Yes No - Yes No
Impact 6: Morphological
and Sediment Transport
Effects due to Cable
Protection Measures for
Offshore Cables
No No Yes No Yes - No
Impact 7: Cable
repairs/reburial and
maintenance vessel
footprints
No No No No No No -

June 2018 Norfolk Vanguard Offshore Wind Farm PB4476-005-008 Page 122
Summary 8.11
The construction, operation and decommissioning phases of the proposed Norfolk 431.
Vanguard project would cause a range of effects on the marine geology,
oceanography and physical processes. The magnitude of these effects has been
assessed using expert assessment, drawing from a wide science base that includes
project-specific surveys and previous numerical modelling activities.
The receptors that have been specifically identified in relation to marine geology, 432.
oceanography and physical processes are the sensitive ‘East Anglia’ coastline,
Haisborough, Hammond and Winterton SAC, North Norfolk Sandbanks and Saturn
Reef SAC and Cromer Shoal Chalk Beds MCZ.
The effects that have been assessed are mostly anticipated to result in no impact to 433.
the above-mentioned receptors because they are located remotely from the zones
of influence and no pathway has been identified that can link the source to the
receptor. A summary of impacts to these receptors are listed in Table 8.45.

June 2018 Norfolk Vanguard Offshore Wind Farm PB4476-005-008 Page 123
Table 8.45 Potential impacts identified for marine geology, oceanography and physical processes
Potential Impact Receptor Sensitivity Magnitude Significance Mitigation Residual Impact
Construction
Impact 1A: Changes in
Suspended Sediment
Concentrations due to
Seabed Preparation for
Wind Turbine Gravity
Anchor Foundation
Installation
Haisborough,
Hammond and
Winterton SAC
N/A N/A
No impact
N/A
No impact
North Norfolk
Sandbanks and Saturn
Reef SAC
N/A N/A
No impact
N/A
No impact
Cromer Shoal Chalk
Beds MCZ
N/A N/A No impact
N/A No impact
East Anglian coast N/A N/A No impact N/A No impact
Impact 1B: Changes in
Suspended Sediment
Concentrations due to
Drill Arisings for
Installation of Piled
Foundations for Wind
Turbines
Haisborough,
Hammond and
Winterton SAC
N/A N/A
No impact
N/A
No impact
North Norfolk
Sandbanks and Saturn
Reef SAC
N/A N/A
No impact
N/A
No impact
Cromer Shoal Chalk
Beds MCZ
N/A N/A No impact
N/A No impact
East Anglian coast N/A N/A No impact N/A No impact
Impact 2A: Changes in
Seabed Level due to
Seabed Preparation for
Haisborough,
Hammond and
Winterton SAC
Negligible Negligible (far-field) Negligible None proposed Negligible

June 2018 Norfolk Vanguard Offshore Wind Farm PB4476-005-008 Page 124
Potential Impact Receptor Sensitivity Magnitude Significance Mitigation Residual Impact
Wind Turbine Gravity
Anchor Foundation
Installation
North Norfolk
Sandbanks and Saturn
Reef SAC
Negligible Negligible (far-field) Negligible None proposed Negligible
Cromer Shoal Chalk
Beds MCZ
N/A N/A No impact
N/A No impact
East Anglian coast N/A N/A No impact N/A No impact
Impact 2B: Changes in
Seabed Level due to
Drill Arisings for
Installation of Piled
Foundations for Wind
Turbines
Haisborough,
Hammond and
Winterton SAC
N/A N/A
No impact
N/A
No impact
North Norfolk
Sandbanks and Saturn
Reef SAC
N/A N/A
No impact
N/A
No impact
Cromer Shoal Chalk
Beds MCZ
N/A N/A No impact
N/A No impact
East Anglian coast N/A N/A No impact N/A No impact
Impact 3: Changes in
Suspended Sediment
Concentrations during
Offshore Export Cable
Installation
Haisborough,
Hammond and
Winterton SAC
N/A N/A
No impact
N/A
No impact
North Norfolk
Sandbanks and Saturn
Reef SAC
N/A N/A
No impact
N/A
No impact
Cromer Shoal Chalk
Beds MCZ
N/A N/A No impact
N/A No impact
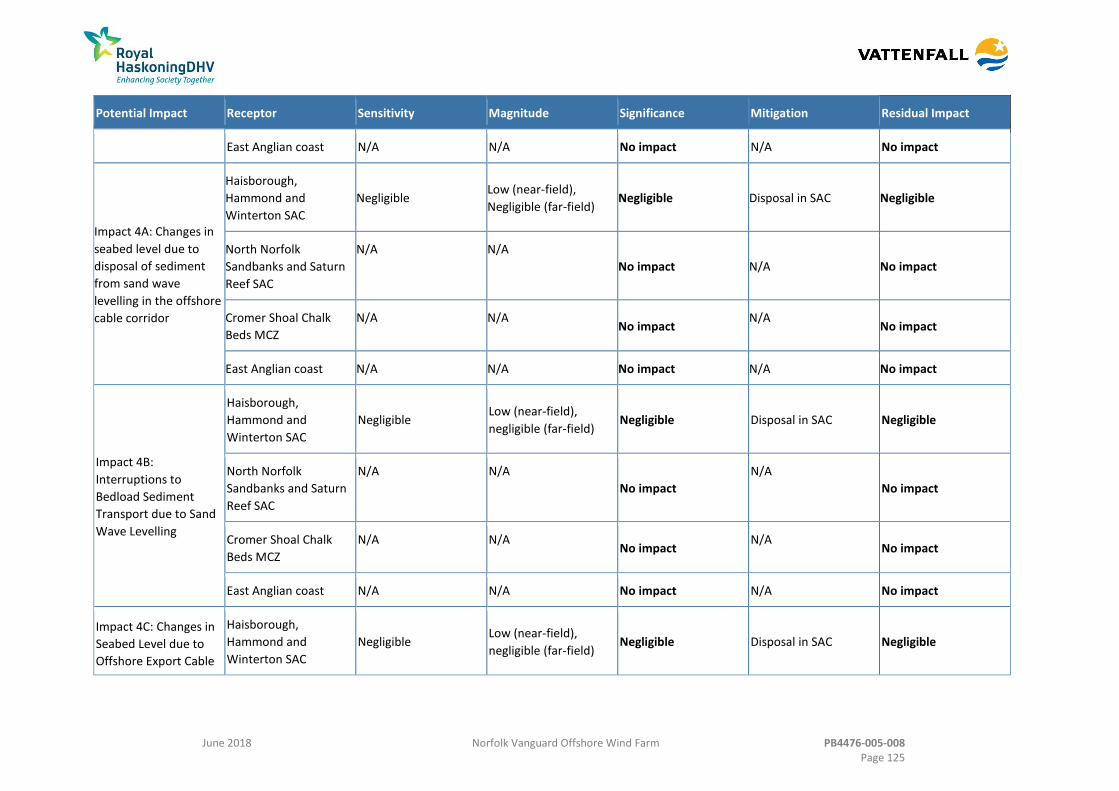
June 2018 Norfolk Vanguard Offshore Wind Farm PB4476-005-008 Page 125
Potential Impact Receptor Sensitivity Magnitude Significance Mitigation Residual Impact
East Anglian coast N/A N/A No impact N/A No impact
Impact 4A: Changes in
seabed level due to
disposal of sediment
from sand wave
levelling in the offshore
cable corridor
Haisborough,
Hammond and
Winterton SAC
Negligible Low (near-field),
Negligible (far-field) Negligible Disposal in SAC Negligible
North Norfolk
Sandbanks and Saturn
Reef SAC
N/A N/A
No impact N/A No impact
Cromer Shoal Chalk
Beds MCZ
N/A N/A No impact
N/A No impact
East Anglian coast N/A N/A No impact N/A No impact
Impact 4B:
Interruptions to
Bedload Sediment
Transport due to Sand
Wave Levelling
Haisborough,
Hammond and
Winterton SAC
Negligible Low (near-field),
negligible (far-field) Negligible Disposal in SAC Negligible
North Norfolk
Sandbanks and Saturn
Reef SAC
N/A N/A
No impact
N/A
No impact
Cromer Shoal Chalk
Beds MCZ
N/A N/A No impact
N/A No impact
East Anglian coast N/A N/A No impact N/A No impact
Impact 4C: Changes in
Seabed Level due to
Offshore Export Cable
Haisborough,
Hammond and
Winterton SAC
Negligible Low (near-field),
negligible (far-field) Negligible Disposal in SAC Negligible

June 2018 Norfolk Vanguard Offshore Wind Farm PB4476-005-008 Page 126
Potential Impact Receptor Sensitivity Magnitude Significance Mitigation Residual Impact
Installation North Norfolk
Sandbanks and Saturn
Reef SAC
N/A N/A
No impact
N/A N/A
Cromer Shoal Chalk
Beds MCZ Negligible
Low (near-field),
negligible (far-field) Negligible None proposed Negligible
East Anglian coast N/A N/A No impact N/A No impact
Impact 5: Changes in
Suspended Sediment
Concentrations during
cable installation in the
OWF sites
Haisborough,
Hammond and
Winterton SAC
N/A N/A
No impact
N/A
No impact
North Norfolk
Sandbanks and Saturn
Reef SAC
N/A N/A
No impact
N/A
No impact
Cromer Shoal Chalk
Beds MCZ
N/A N/A No impact
N/A No impact
East Anglian coast N/A N/A No impact N/A No impact
Impact 6: Changes in
Seabed Level due to
Cable Installation in
the OWF sites
Haisborough,
Hammond and
Winterton SAC
Negligible Negligible (far-field) Negligible None proposed Negligible
North Norfolk
Sandbanks and Saturn
Reef SAC
Negligible Negligible (far-field) Negligible None proposed Negligible
Cromer Shoal Chalk
Beds MCZ
N/A N/A No impact
N/A No impact
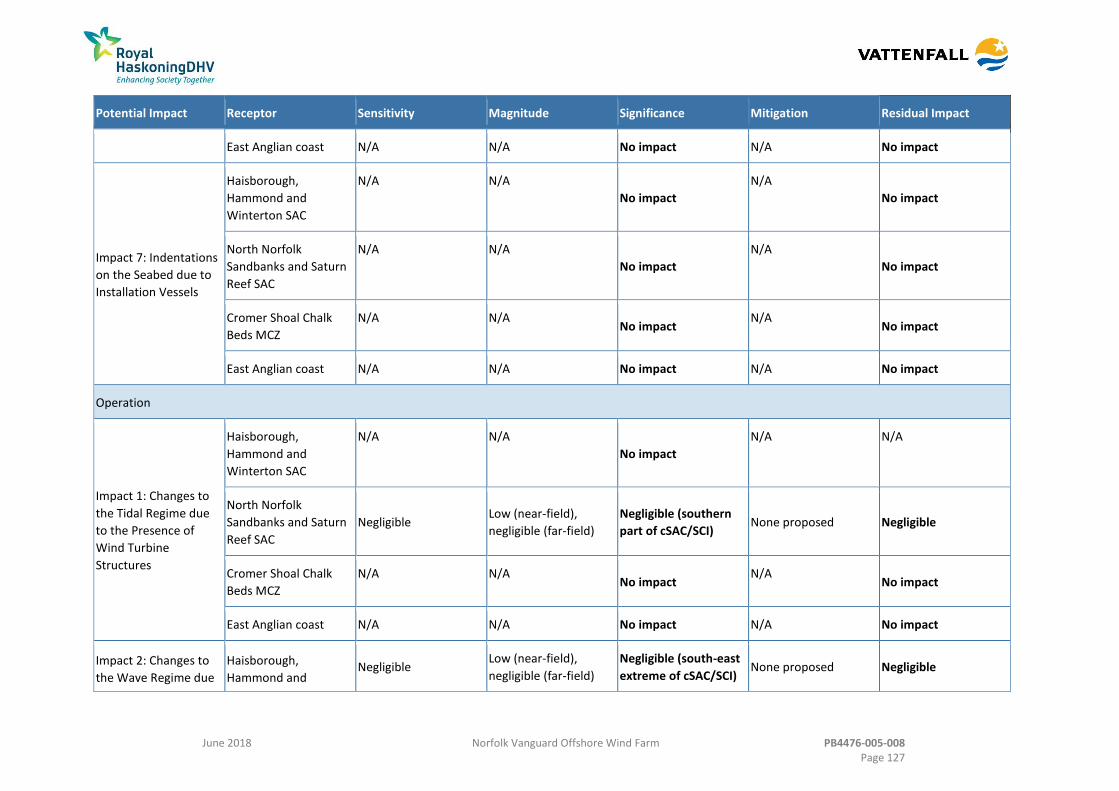
June 2018 Norfolk Vanguard Offshore Wind Farm PB4476-005-008 Page 127
Potential Impact Receptor Sensitivity Magnitude Significance Mitigation Residual Impact
East Anglian coast N/A N/A No impact N/A No impact
Impact 7: Indentations
on the Seabed due to
Installation Vessels
Haisborough,
Hammond and
Winterton SAC
N/A N/A
No impact
N/A
No impact
North Norfolk
Sandbanks and Saturn
Reef SAC
N/A N/A
No impact
N/A
No impact
Cromer Shoal Chalk
Beds MCZ
N/A N/A No impact
N/A No impact
East Anglian coast N/A N/A No impact N/A No impact
Operation
Impact 1: Changes to
the Tidal Regime due
to the Presence of
Wind Turbine
Structures
Haisborough,
Hammond and
Winterton SAC
N/A N/A
No impact
N/A N/A
North Norfolk
Sandbanks and Saturn
Reef SAC
Negligible Low (near-field),
negligible (far-field)
Negligible (southern
part of cSAC/SCI) None proposed Negligible
Cromer Shoal Chalk
Beds MCZ
N/A N/A No impact
N/A No impact
East Anglian coast N/A N/A No impact N/A No impact
Impact 2: Changes to
the Wave Regime due
Haisborough,
Hammond and Negligible
Low (near-field),
negligible (far-field)
Negligible (south-east
extreme of cSAC/SCI) None proposed Negligible
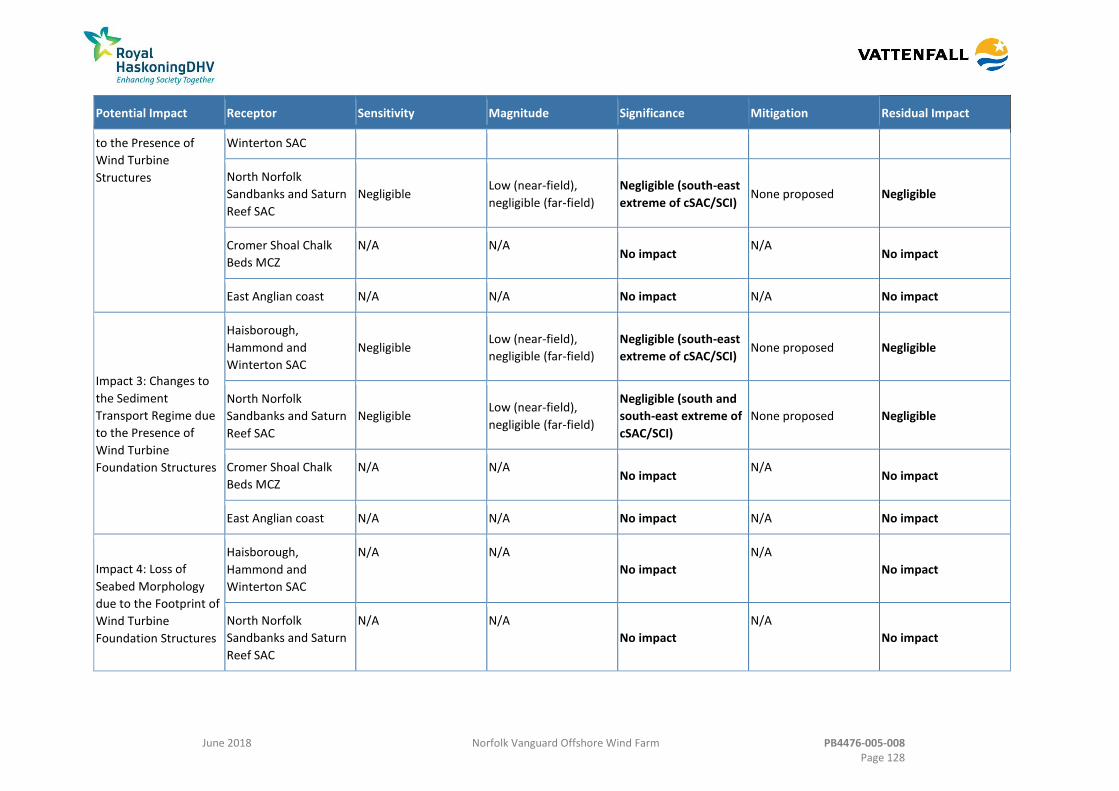
June 2018 Norfolk Vanguard Offshore Wind Farm PB4476-005-008 Page 128
Potential Impact Receptor Sensitivity Magnitude Significance Mitigation Residual Impact
to the Presence of
Wind Turbine
Structures
Winterton SAC
North Norfolk
Sandbanks and Saturn
Reef SAC
Negligible Low (near-field),
negligible (far-field)
Negligible (south-east
extreme of cSAC/SCI) None proposed Negligible
Cromer Shoal Chalk
Beds MCZ
N/A N/A No impact
N/A No impact
East Anglian coast N/A N/A No impact N/A No impact
Impact 3: Changes to
the Sediment
Transport Regime due
to the Presence of
Wind Turbine
Foundation Structures
Haisborough,
Hammond and
Winterton SAC
Negligible Low (near-field),
negligible (far-field)
Negligible (south-east
extreme of cSAC/SCI) None proposed Negligible
North Norfolk
Sandbanks and Saturn
Reef SAC
Negligible Low (near-field),
negligible (far-field)
Negligible (south and
south-east extreme of
cSAC/SCI)
None proposed Negligible
Cromer Shoal Chalk
Beds MCZ
N/A N/A No impact
N/A No impact
East Anglian coast N/A N/A No impact N/A No impact
Impact 4: Loss of
Seabed Morphology
due to the Footprint of
Wind Turbine
Foundation Structures
Haisborough,
Hammond and
Winterton SAC
N/A N/A
No impact
N/A
No impact
North Norfolk
Sandbanks and Saturn
Reef SAC
N/A N/A
No impact
N/A
No impact

June 2018 Norfolk Vanguard Offshore Wind Farm PB4476-005-008 Page 129
Potential Impact Receptor Sensitivity Magnitude Significance Mitigation Residual Impact
Cromer Shoal Chalk
Beds MCZ
N/A N/A No impact
N/A No impact
East Anglian coast N/A N/A No impact N/A No impact
Impact 5:
Morphological and
Sediment Transport
Effects due to Cable
Protection Measures
for Array and
Interconnector Cables
Haisborough,
Hammond and
Winterton SAC
N/A N/A
No impact
N/A
No impact
North Norfolk
Sandbanks and Saturn
Reef SAC
N/A N/A
No impact
N/A
No impact
Cromer Shoal Chalk
Beds MCZ
N/A N/A No impact
N/A No impact
East Anglian coast N/A N/A No impact N/A No impact
Impact 6:
Morphological and
Sediment Transport
Effects due to Cable
Protection Measures
for Offshore Cables
Haisborough,
Hammond and
Winterton SAC
N/A N/A
No impact
N/A
No impact
North Norfolk
Sandbanks and Saturn
Reef SAC
N/A N/A
No impact
N/A
No impact
Cromer Shoal Chalk
Beds MCZ
N/A N/A No impact
N/A No impact
East Anglian coast N/A N/A No impact N/A No impact
Impact 7: Cable Haisborough, Negligible Low (near-field), Negligible None proposed Negligible

June 2018 Norfolk Vanguard Offshore Wind Farm PB4476-005-008 Page 130
Potential Impact Receptor Sensitivity Magnitude Significance Mitigation Residual Impact
repairs/reburial and
maintenance vessel
footprints
Hammond and
Winterton SAC
negligible (far-field)
North Norfolk
Sandbanks and Saturn
Reef SAC
N/A N/A
No impact
N/A
No impact
Cromer Shoal Chalk
Beds MCZ
N/A N/A No impact
N/A No impact
East Anglian coast N/A N/A No impact N/A No impact
Decommissioning
Impact 1: Changes in
Suspended Sediment
Concentrations due to
Wind Turbine
Foundation Removal
Haisborough,
Hammond and
Winterton SAC
N/A N/A
No impact
N/A
No impact
North Norfolk
Sandbanks and Saturn
Reef SAC
N/A N/A
No impact
N/A
No impact
Cromer Shoal Chalk
Beds MCZ
N/A N/A No impact
N/A No impact
East Anglian coast N/A N/A No impact N/A No impact
Impact 2: Changes in
seabed level
(morphology) due to
wind turbine
Haisborough,
Hammond and
Winterton SAC
Negligible Negligible (far-field) Negligible None proposed Negligible
North Norfolk Negligible Negligible (far-field) Negligible None proposed Negligible

June 2018 Norfolk Vanguard Offshore Wind Farm PB4476-005-008 Page 131
Potential Impact Receptor Sensitivity Magnitude Significance Mitigation Residual Impact
foundation removal Sandbanks and Saturn
Reef SAC
Cromer Shoal Chalk
Beds MCZ
N/A N/A No impact
N/A No impact
East Anglian coast N/A N/A No impact N/A No impact
Impact 3: Changes in
Suspended Sediment
Concentrations due to
Removal of parts of the
Cables in the OWF sites
Haisborough,
Hammond and
Winterton SAC
N/A N/A
No impact
N/A
No impact
North Norfolk
Sandbanks and Saturn
Reef SAC
N/A N/A
No impact
N/A
No impact
Cromer Shoal Chalk
Beds MCZ
N/A N/A No impact
N/A No impact
East Anglian coast N/A N/A No impact N/A No impact
Impact 4: Changes in
seabed level due to
removal of parts of the
cables in the OWF sites
Haisborough,
Hammond and
Winterton SAC
Negligible Negligible (far-field) Negligible None proposed Negligible
North Norfolk
Sandbanks and Saturn
Reef SAC
Negligible Negligible (far-field) Negligible None proposed Negligible
Cromer Shoal Chalk
Beds MCZ
N/A N/A No impact
N/A No impact

June 2018 Norfolk Vanguard Offshore Wind Farm PB4476-005-008 Page 132
Potential Impact Receptor Sensitivity Magnitude Significance Mitigation Residual Impact
East Anglian coast N/A N/A No impact N/A No impact
Impact 5: Changes in
suspended sediment
concentrations due to
removal of parts of the
offshore export cable
(including nearshore
and at the coastal
landfall)
Haisborough,
Hammond and
Winterton SAC
Negligible Low (near-field),
negligible (far-field) Negligible None proposed Negligible
North Norfolk
Sandbanks and Saturn
Reef SAC
N/A N/A
No impact
N/A N/A
Cromer Shoal Chalk
Beds MCZ Negligible
Low (near-field),
negligible (far-field) Negligible None proposed Negligible
East Anglian coast N/A N/A No impact N/A N/A
Impact 6: Indentations
on the Seabed due to
Decommissioning
Activities
Haisborough,
Hammond and
Winterton SAC
N/A N/A
No impact
N/A
No impact
North Norfolk
Sandbanks and Saturn
Reef cSAC/SCI
N/A N/A
No impact
N/A
No impact
Cromer Shoal Chalk
Beds MCZ
N/A N/A No impact
N/A No impact
East Anglian coast N/A N/A No impact N/A No impact
Cumulative
Cumulative
Construction and
Haisborough,
Hammond and Negligible
Low (near-field),
negligible (far-field) Negligible None proposed Negligible
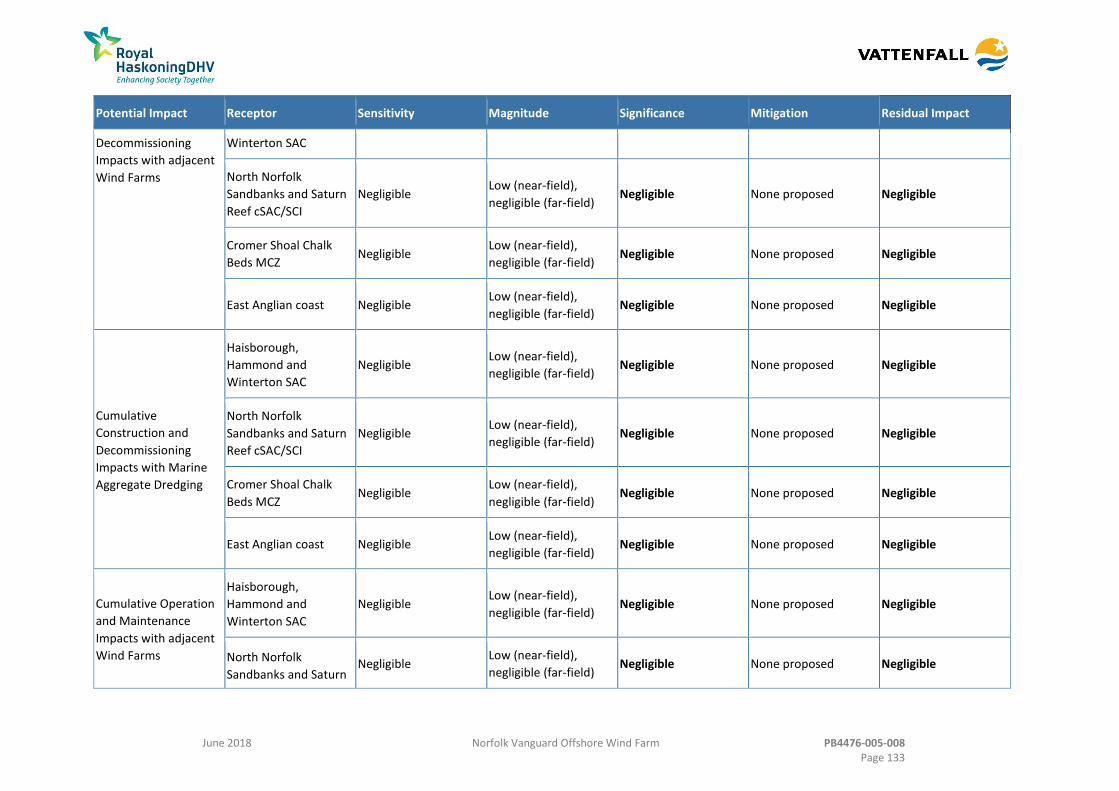
June 2018 Norfolk Vanguard Offshore Wind Farm PB4476-005-008 Page 133
Potential Impact Receptor Sensitivity Magnitude Significance Mitigation Residual Impact
Decommissioning
Impacts with adjacent
Wind Farms
Winterton SAC
North Norfolk
Sandbanks and Saturn
Reef cSAC/SCI
Negligible Low (near-field),
negligible (far-field) Negligible None proposed Negligible
Cromer Shoal Chalk
Beds MCZ Negligible
Low (near-field),
negligible (far-field) Negligible None proposed Negligible
East Anglian coast Negligible Low (near-field),
negligible (far-field) Negligible None proposed Negligible
Cumulative
Construction and
Decommissioning
Impacts with Marine
Aggregate Dredging
Haisborough,
Hammond and
Winterton SAC
Negligible Low (near-field),
negligible (far-field) Negligible None proposed Negligible
North Norfolk
Sandbanks and Saturn
Reef cSAC/SCI
Negligible Low (near-field),
negligible (far-field) Negligible None proposed Negligible
Cromer Shoal Chalk
Beds MCZ Negligible
Low (near-field),
negligible (far-field) Negligible None proposed Negligible
East Anglian coast Negligible Low (near-field),
negligible (far-field) Negligible None proposed Negligible
Cumulative Operation
and Maintenance
Impacts with adjacent
Wind Farms
Haisborough,
Hammond and
Winterton SAC
Negligible Low (near-field),
negligible (far-field) Negligible None proposed Negligible
North Norfolk
Sandbanks and Saturn Negligible
Low (near-field),
negligible (far-field) Negligible None proposed Negligible

June 2018 Norfolk Vanguard Offshore Wind Farm PB4476-005-008 Page 134
Potential Impact Receptor Sensitivity Magnitude Significance Mitigation Residual Impact
Reef cSAC/SCI
Cromer Shoal Chalk
Beds MCZ Negligible
Low (near-field),
negligible (far-field) Negligible None proposed Negligible
East Anglian coast Negligible Low (near-field),
negligible (far-field) Negligible None proposed Negligible

June 2018 Norfolk Vanguard Offshore Wind Farm PB4476-005-008 Page 135
References 8.12
ABPmer. (2012a). East Anglia Offshore Wind Zonal Environmental Appraisal Report. Appendix G – Physical Processes Baseline and References.
ABPmer. (2012b). East Anglia Offshore Wind Project ONE Windfarm: Marine geology, oceanography and physical processes environmental baseline. Report R3945. May 2012.
ABPmer. (2018). Norfolk Vanguard and Norfolk Boreas Export Cable Route, Sandwave bed-levelling. ABPmer Report No Report R 2920. A report produced by ABPmer for Royal HaskoningDHV, April 2018.
AECOM. (2012). Kelling to Lowestoft Ness Shoreline Management Plan.
BERR. (2008). Review of Cabling Techniques and Environmental Effects applicable to the Offshore Windfarm Industry.
Burningham, H. and French, J. (2016). Historical morphodynamics of the Haisborough Sand bank system. Draft CERU Report No. 162-1. February 2016.
Cameron, T.D.J., Crosby, A., Balson, P.S., Jeffrey, D.H., Lott, G.K., Bulat, J. and Harrison, D.J. (1992). United Kingdom offshore regional report: the geology of the southern North Sea. HMSO, London, 152pp
Centre for Environment, Fisheries and Aquaculture Science (Cefas). (2004). Offshore wind farms: guidance note for Environmental Impact Assessment in respect of Food and Environmental Protection Act (FEPA) and Coast Protection Act (CPA) requirements: Version 2. Available at: https://www.cefas.co.uk/publications/files/windfarm-guidance.pdf
Cefas. (2011). Guidelines for data acquisition to support marine environmental assessments of offshore renewable energy projects. Cefas contract report: ME5403 – Module 15
Cooper N. J. and Brew, D.S. (2013). Impacts on the physical environment. In: R.C. Newell and T.A. Woodcock (Eds.): Aggregate dredging and the marine environment: an overview of recent research and current industry practice. The Crown Estate.
Cooper, K., Boyd, S., Eggleton, J., Limpenny, D., Rees, H. & Vanstaen, K. (2007). Recovery of the seabed following marine aggregate dredging on the Hastings Shingle Bank off the southeast coast of England. Estuarine, Coastal and Shelf Science 75:547-558.
CWind (2017) unpublished. Norfolk Vanguard Offshore Windfarm Export Cable Installation Study
Deltares, (2012). East Anglia Offshore Wind Farm – Metocean Study. 1205361-000-HYE-0006, Version 1.1, November 2012
Deltares, (2015a). Memo: EAOW additional metocean study - Analyses of extreme water level, current and wind parameters. 1205361-000-HYE-0014, Version 3.0, March 2015.
Deltares, (2015b). Memo: Extreme design criteria at C-East and H. 1220301-000-HYE-0003, Version 1.0, March 2015.
Department of Energy and Climate Change (DECC) (2011a) Overarching National Policy Statement for Energy (EN-1). Available at:
https://assets.publishing.service.gov.uk/government/uploads/system/uploads/attachment_

June 2018 Norfolk Vanguard Offshore Wind Farm PB4476-005-008 Page 136
data/file/47854/1938-overarching-nps-for-energy-en1.pdf
Department of Energy and Climate Change (DECC) (2011b) National Policy Statement for Renewable Energy Infrastructure (EN-3). Available at:
https://www.gov.uk/government/uploads/system/uploads/attachment_data/file/47856/1940-nps-renewable-energy-en3.pdf
East Anglia Offshore Wind (EAOW). (2012a). East Anglia Offshore Wind Zonal Environmental Appraisal Report March 2012
East Anglia Offshore Wind (EAOW). (2012b). East Anglia ONE Environmental Statement. Report to East Anglia Offshore Wind, November 2012
East Anglia Three Ltd (EATL). (2015). East Anglia THREE Environmental Statement. Report to East Anglia Offshore Wind, November 2015
Eisma, D. and Kalf, J. (1987). Dispersal, concentration and deposition of suspended matter in the North Sea. Journal of the Geological Society of London, 144, 161-178.
Energy Technology Support Unit (ETSU) (2000) Wind Information Needs for Planners. ETSU W/14/00564/REP. DTI/Pubb URN 01/779. Available at: http://webarchive.nationalarchives.gov.uk/+/http:/www.berr.gov.uk/files/file18033.pdf
Energy Technology Support Unit (ETSU) (2002) Potential Effects of Offshore Wind Developments on Coastal Processes. ETSU W/35/00596/00/REP. URN 02/1336. Available at: https://tethys.pnnl.gov/sites/default/files/publications/Potential_Effects_of_Offshore_Wind_Developments_on_Coastal_Processes.pdf
Environment Agency. (2011). Coastal flood boundary conditions for UK mainland and islands. Project: SC060064/TR2: Design sea levels. February 2011.
Environment Agency. (2015). Coastal Design Sea Levels - Coastal Flood Boundary Extreme Sea Levels. Available at: https://data.gov.uk/dataset/coastal-design-sea-levels-coastal-flood-boundary-extreme-sea-levels
European Environment Agency. (2017). Global and European Sea Level. Available at: https://www.eea.europa.eu/data-and-maps/indicators/sea-level-rise-5/assessment [Accessed on 13/04/2018]
Forewind. (2013). Dogger Bank Creyke Beck Environmental Statement.
Forewind. (2014). Dogger Bank Teesside A & B Environmental Statement.
Fugro EMU. (2013). East Anglia FOUR Offshore Wind Farm Geophysical Survey. Report to Scottish Power Renewables, February 2013.
Fugro (2016). Norfolk Vanguard Offshore Wind Farm. United Kingdom Continental Shelf, North Sea. Report 1 of 3: Geophysical Investigation Report. Volume 2 of 3: Geophysical Site Survey September to November 2016. Report to Vattenfall Wind Power Ltd. Fugro (FSBV) Report No.: GE050-R1.
Fugro. (2017a). Norfolk Vanguard Offshore Wind Farm. United Kingdom Continental Shelf, North Sea. Report 1 of 3: Geophysical Investigation Report. Volume 3 of 3: Geophysical Route Survey September to November 2016. Report to Vattenfall Wind Power Ltd. Fugro
June 2018 Norfolk Vanguard Offshore Wind Farm PB4476-005-008 Page 137
(FSBV) Report No.: GE050-R1.
Fugro. (2017b). Environmental Investigation Report. Norfolk Vanguard Benthic Characterisation Report. UK Continental Shelf, North Sea. Report 3 of 3. Fugro (FSBV) Report No.: GE050-R3. Final (for review) Report to Vattenfall Wind Power Ltd, February 2017.
Fugro. (2017c). Norfolk Vanguard Offshore Wind Farm. United Kingdom Continental Shelf, North Sea. Report 2 of 3: Geotechnical Investigation Report. Measured and Derived Geotechnical Parameters and Final Results. Report to Vattenfall Wind Power Ltd. Fugro (FSBV) Report No.: GE050-R2.
Hiscock, D.R. and Bell, S. (2004). Physical impacts of aggregate dredging on sea bed resources in coastal deposits. Journal of Coastal Research, 20 (10), 101-114.
HM Government. (2011). UK Marine Policy Statement
HM Government. (2014). East Inshore and East Offshore Marine Plan
HR Wallingford, Posford Haskoning, Cefas and D’Olier, B. (2002). Southern North Sea Sediment Transport Study Phase 2: Sediment Transport Report. Report No. EX4526, August 2002.
JNCC and Natural England. (2010). Special Area of Conservation (SAC): Haisborough, Hammond and Winterton. SAC Selection Assessment, Version 6.0, August 2010.
JNCC and Natural England. (2011). General advice on assessing potential impacts of and mitigation for human activities on Marine Conservation Zone (MCZ) features, using existing regulation and legislation. Available at: http://jncc.defra.gov.uk/pdf/MCZ_ActivitiesAdvice_Final.pdf
John, S.A., Challinor, S.L. Simpson, M. Burt, T.N. and Spearman, J. (2000). Scoping the assessment of sediment plumes from dredging. CIRIA Publication.
Kenyon, N.H. and Cooper, W.S. (2005). Sand banks, sand transport and offshore wind farms. DTI SEA 6 Technical Report
Lambkin, D.O., Harris, J.M., Cooper, W.S., Coates, T., (2009). Coastal Process Modelling for Offshore Wind Farm Environment Impact Assessment: Best Practice Guide. COWRIE. Available at: https://www.thecrownestate.co.uk/media/5903/2009-09%20Coastal%20process%20modelling%20for%20offshore%20wind%20farm%20EIA%20-%20best%20practice%20guide.pdf
Lowe, J.A., Howard, T.P., Pardaens, A., Tinker, J., Holt, J., Wakelin, S., Milne, G., Leake, J., Wolf, J., Horsburgh, K., Reeder, T., Jenkins, G., Ridley, J., Dye, S., Bradley, S. (2009). UK Climate Projections science report: Marine and coastal projections. Met Office Hadley Centre, Exeter, UK.
Masselink, G. and Russell, P. (2013). Impacts of climate change on coastal erosion. Marine Climate Change Impacts Partnership: Science Review. 2013: 71-86
Marine Management Organisation (MMO). (2012). East Inshore and East Offshore Marine Plan Areas: Evidence and Issues. Available at: https://assets.publishing.service.gov.uk/government/uploads/system/uploads/attachment_data/file/312393/east_evidence_issues_overview.pdf
MESL (Marine Ecological Surveys Ltd). (2011). East Anglia Offshore Windfarm Zonal

June 2018 Norfolk Vanguard Offshore Wind Farm PB4476-005-008 Page 138
Environmental Appraisal: Benthic Biological characterisation Report.
Natura 2000. (2015). Haisborough, Hammond and Winterton Natura 2000 Standard Data Form. Available at <http://natura2000.eea.europa.eu/Natura2000/SDF.aspx?site=UK0030369>
Natural Environment Research Council. (2016). Land-Ocean Interaction Study (LOIS). Found at https://www.bodc.ac.uk/projects/data_management/uk/lois/.
Newell, R.C., Seiderer, L.J., Robinson, J.E., Simpson, N.M., Pearce, B and Reeds, K.A., (2004). Impacts of overboard screening on sea bed and associated benthic biology community structure in relation to marine aggregate extraction. Technical Report to the Office of the Deputy Prime Minister and Minerals Industry Research Organisation. Project No. SAMP 1.022, Marine Ecological Surveys Ltd, St. Ives, Cornwall.
Norfolk Vanguard Ltd. (2017). Norfolk Vanguard Preliminary Environmental Information Report. Available at: https://corporate.vattenfall.co.uk/projects/wind-energy-projects/vattenfall-in-norfolk/norfolkvanguard/documents/preliminary-environmental-information-report/
Riggall. (2016). HDD Feasibility Report. Cable Landfalls for East Anglia North Tranche 1 (EAN) U.K. Report Reference No.:2015001RA-FR01.
Royal HaskoningDHV. (2016). Norfolk Vanguard Offshore Wind Farm Environmental Impact Assessment Scoping Report.
The Planning Inspectorate. (2016). Scoping Opinion Proposed Norfolk Vanguard Offshore Wind Farm.
Tillin, H.M., Houghton, A.J., Saunders, J.E. Drabble, R. and Hull S. C. (2011). Direct and indirect impacts of aggregate dredging. Science Monograph Series No. 1. MEPF 10/P144.
Vincent, C.E., McCave, I.N. and Clayton, K.M. (1983). The establishment of a sand budget for the East Anglian Coast and its implications for coastal stability. Shoreline Protection, Thomas Telford Ltd, London.
Whiteside. P.G.D., Ooms, K. and Postma, G.M. (1995). Generation and decay of sediment plumes from sand dredging overflow. Proceedings of the 14th World Dredging Congress. Amsterdam, The Netherlands. World Dredging Association, 877 – 892.