marine gps search and rescue system - web.wpi.edu · system has two primary purposes: first, to...
TRANSCRIPT
Marine GPS Search and Rescue System
A Major Qualifying Project Report:
submitted to the Faculty
of the
WORCESTER POLYTECHNIC INSTITUTE
in partial fulfillment of the requirements for the
Degree of Bachelor of Science
By
_____________________________ Alexander Kindle
_____________________________
Justin Stocker
Date:
Approved:
_____________________________ R. James Duckworth, Major Advisor
_____________________________ David Cyganski, Co-Advisor
i
Abstract
When a person falls off of a large ship, it takes several minutes to assemble a rescue team, during which
the person may be lost forever. To maximize the likelihood of rescue, a GPS-based rescue system was
designed that could be automatically deployed. This system includes a small, battery-powered victim
locating unit, designed to be installed on lifejackets; a rescue vehicle, which autonomously navigates to
the victim using GPS; and a mothership host system, which provides navigation vectors to steer the
rescue vehicle to the victim and back to the mothership successfully.
ii
Acknowledgements
This project could not have succeeded without the help of several people. First, Professor
Duckworth and Professor Cyganski, whose guidance kept us focused on the project’s goals. Next, Joe St.
Germain and Kevin Harrington gave us advice on the robotics aspects of the project. We would also like
to thank the rest of the Electrical and Computer Engineering and Robotics Engineering staff for all their
aid. Finally, we would like to thank Andy Stocker of Emerson College for assistance in video editing.
iii
Executive Summary
When a person falls overboard from a large ship, such as an oil tanker or an aircraft carrier, the
ship can take upwards of five miles to stop to rescue the victim. Because of this, rescue teams are
assembled and sent after the victim. Rescue teams can take as little as five minutes to assemble, but
even five minutes can be the difference between life and death. To minimize the time-to-deployment,
we developed an autonomous search and rescue system that does not require the assembly of a human
rescue team and can therefore be dispatched as soon as a victim has fallen overboard.
This search and rescue system is built around the use of GPS for positioning, and features three
primary actors: the victim in the water, the autonomous rescue vehicle, and the mothership from which
it is deployed. These three components are tied together with an ad-hoc packet-based wireless network.
The victim unit features a custom-designed PCB, which is designed to fit onto the lifejacket of a
person. This unit’s primary purpose is to relay GPS information of the victim to the mothership over the
wireless network; to do so, it uses a microcontroller to interface a GPS receiver with a wireless radio.
Additionally, the system is designed to be efficiently powered from a single, compact battery.
The rescue vehicle features an off-the-shelf remote control boat, converted for autonomous
use. This conversion process involved replacing the boat’s stock remote control unit with a development
board to allow for autonomous control; this development board interfaces with a servo, which controls
the rudder position, an H-bridge, to control motor speed, a GPS receiver, and a wireless radio. This
system has two primary purposes: first, to relay the vehicle’s GPS position to the mothership, much like
the victim unit, and second, to receive commands from the mothership for navigation.
Closed-loop control is provided for the rescue vehicle by a Java application running on a
computer on the mothership. This computer was connected to a wireless radio, from which the
software receives GPS information from both the rescue vehicle and the victim unit. From this
information, the software then extracts the current locations of the rescue vehicle and the victim, as
well as the bearing of the rescue vehicle. It calculates a vector from the current position of the rescue
vehicle to the victim, and calculates the angle between this vector and the bearing of the boat. This
angle is then used to determine the angle the rescue vehicle should set its rudder to, and this control
information is transmitted. The vehicle-victim vector and vehicle bearing vector are continuously
displayed graphically on the computer’s display.
iv
Every component of this system was tested extensively and individually before system
integration occurred; after integration, several full-system tests were performed in Elm Park. These
system tests simulated a scenario in which victim had fallen from a simulated mothership and drifted
away. The rescue vehicle was then deployed in the water to navigate to the victim, approach the victim
within a safe distance, and then return to its original location at the simulated mothership. The initial
goal was to be able to reliably get the rescue vehicle within 5 meters of the victim before returning to
the mothership; during the final testing phase, it was found that the rescue vehicle could be reliably
navigated to within 2 meters of the victim before returning. This project has successfully demonstrated
the feasibility of a GPS-based autonomous marine search and rescue system; further work, primarily in
the direction of a full-scale implementation, is recommended.
v
Table of Contents Abstract .......................................................................................................................................................................... i
Acknowledgements ................................................................................................................................................. ii
Executive Summary ............................................................................................................................................... iii
Table of Figures ..................................................................................................................................................... viii
Table of Tables ........................................................................................................................................................... x
1 Introduction .................................................................................................................................................. 1
2 Background ................................................................................................................................................... 3
2.1 Existing Man Overboard Rescue Systems ......................................................................... 3
2.1.1 ORCA Man Overboard Identification ........................................................................... 3
2.1.2 Sci-Tech MOB Tracking System .................................................................................... 5
2.1.3 Sea Marshall AU9 ......................................................................................................... 6
2.1.4 Existing Search & Rescue Systems Summary ............................................................... 7
2.2 Localization ....................................................................................................................... 8
2.2.1 Global Positioning System ........................................................................................... 8
2.2.2 VOR-Inspired Positioning System ................................................................................ 9
2.2.3 Ultrasonic Positioning System ..................................................................................... 9
2.2.4 Other Systems ............................................................................................................ 10
2.2.5 Location and Tracking Summary ................................................................................ 10
2.3 Background Conclusion ................................................................................................... 10
3 Requirements ............................................................................................................................................. 11
3.1 Explicit Requirements ..................................................................................................... 11
3.1.1 Autonomous Operation ............................................................................................. 11
3.1.2 GPS Navigation ........................................................................................................... 11
3.1.3 Full Rescue Scenario .................................................................................................. 11
3.2 Implicit Requirements ..................................................................................................... 12
vi
3.2.1 Cost ............................................................................................................................ 12
3.2.2 Control Circuitry Size.................................................................................................. 12
3.2.3 Victim Circuitry .......................................................................................................... 12
3.2.4 Watertight .................................................................................................................. 12
3.2.5 Buoyancy .................................................................................................................... 12
3.3 Conclusion ....................................................................................................................... 12
4 Design and Implementation ................................................................................................................. 14
4.1 Ad-Hoc Wireless Network ............................................................................................... 15
4.1.1 ZigBee Protocol and Radios ....................................................................................... 15
4.2 Victim Unit ...................................................................................................................... 17
4.2.1 Hardware Design ........................................................................................................ 18
4.2.2 Firmware Design ........................................................................................................ 21
4.3 Rescue Vehicle ................................................................................................................ 23
4.3.1 Rescue Vehicle Hardware .......................................................................................... 23
4.3.2 Rescue Vehicle Firmware ........................................................................................... 25
4.4 Navigation Software ........................................................................................................ 26
4.4.1 First Revision – As a Simulator ................................................................................... 27
4.4.2 Simulator, Revision B ................................................................................................. 28
4.4.3 Full Control Application ............................................................................................. 29
4.5 Full System Implementation ........................................................................................... 32
5 Testing and Results .................................................................................................................................. 33
5.1 Unit Testing ..................................................................................................................... 33
5.1.1 GPS Testing ................................................................................................................ 33
5.1.2 Wireless Network Testing .......................................................................................... 43
5.1.3 Navigation Software Testing ...................................................................................... 45
5.1.4 Rescue vehicle Control Testing .................................................................................. 47
vii
5.2 System Testing ................................................................................................................ 48
5.2.1 Land Testing ............................................................................................................... 48
5.2.2 Water Testing ............................................................................................................. 51
5.3 Testing Results and Conclusions ..................................................................................... 55
6 Conclusions and Recommendations ................................................................................................. 56
6.1 Explicit Requirements ..................................................................................................... 56
6.1.1 Autonomous Operation ............................................................................................. 56
6.1.2 GPS Navigation ........................................................................................................... 57
6.1.3 Full Rescue Scenario .................................................................................................. 57
6.2 Implicit Requirements ..................................................................................................... 57
6.3 Future Recommendations............................................................................................... 58
7 Works Cited ................................................................................................................................................. 60
8 Appendix A – Error Vectors for Stationary GPS Testing .......................................................... 61
9 Appendix B – Min, Max, Mean Error Vectors for GPS Test ...................................................... 66
10 Appendix C – Victim Unit ....................................................................................................................... 71
10.1 Schematics .................................................................................................................. 71
10.1.1 Microcontroller ........................................................................................................ 71
10.1.2 Power Regulation ..................................................................................................... 72
10.2 Layout .......................................................................................................................... 73
10.2.1 Bottom – Microcontroller, Regulators, and GPS ..................................................... 73
10.2.2 Top – XBee ............................................................................................................... 74
10.3 Bill of Materials ........................................................................................................... 75
11 Appendix D – Expenditures .................................................................................................................. 76

viii
Table of Figures
Figure 2-1: ORCA Transmitter, Pendant-Style ................................................................................. 3
Figure 2-2: ORCA Direction Finder Antenna Array ........................................................................... 4
Figure 2-3: ORCA Direction Finder Display Unit ............................................................................... 4
Figure 2-4: Sea Marshall Rescue Sequence ..................................................................................... 6
Figure 2-5: SeaMarshall Locator Antenna Figure 2-6: SeaMarshall Navigation Display .............. 7
Figure 4-1: System Design Options ................................................................................................ 14
Figure 4-2: XBEE Pro Wireless Radio .............................................................................................. 16
Figure 4-3: EM406a GPS Receiver .................................................................................................. 18
Figure 4-4: Victim Unit Block Diagram ........................................................................................... 19
Figure 4-5: Top of Victim Unit: GPS & XBEE Connections .............................................................. 19
Figure 4-6: Bottom of Victim Unit: CPU & Power Regulation ........................................................ 20
Figure 4-7: GPS Data Buffer Flowchart .......................................................................................... 22
Figure 4-8: Development board: Digilent Cerebot Plus ................................................................. 23
Figure 4-9: Rescue Vehicle Chassis: Mini Rio ................................................................................. 23
Figure 4-10: MC33887 H-Bridge .................................................................................................... 24
Figure 4-11: Rescue Vehicle with Waterproof Box ........................................................................ 24
Figure 4-12: Rescue Vehicle Flowchart .......................................................................................... 25
Figure 4-13: Navigation Simulator, Rev A ...................................................................................... 27
Figure 4-14: Navigation Software, Final Revision .......................................................................... 28
Figure 4-15: Navigation Software Flowchart ................................................................................. 31
Figure 4-16: Full System Block Diagram ......................................................................................... 32
Figure 5-1: GPS Unit Ready for Testing .......................................................................................... 34
Figure 5-2: Path Data for Test 1 ..................................................................................................... 35
Figure 5-3: Path Data for Test 2 ..................................................................................................... 36
Figure 5-4: Path Data for Test 3 ..................................................................................................... 37
Figure 5-5: Land-based Test Setup ................................................................................................. 38
Figure 5-6: Error Vectors for the 12 ft Test .................................................................................... 39
Figure 5-7: Min, Max, and Mean Error Vectors for 12 ft Test ....................................................... 39
Figure 5-8: Configuration for Water-Based GPS Test .................................................................... 41
Figure 5-9: Land vs. Water GPS Test Error Vectors ........................................................................ 42
ix
Figure 5-10: Transparent Wireless Connectivity Test .................................................................... 44
Figure 5-11: X-CTU Send Packet ..................................................................................................... 45
Figure 5-12: Navigation Simulator, Rev A ...................................................................................... 46
Figure 5-13: Navigation Software, Final Revision .......................................................................... 46
Figure 5-14: Map of Navigation Demo ........................................................................................... 47
Figure 5-15: Path to Victim ............................................................................................................ 49
Figure 5-16: Initial Control Loop Correction .................................................................................. 49
Figure 5-17: Rescue Vehicle Return Trip ........................................................................................ 50
Figure 5-18: Rescue Vehicle Return to Origin ................................................................................ 50
Figure 5-19: Full System Test, Water 1 .......................................................................................... 52
Figure 5-20: Victim in Water .......................................................................................................... 53
Figure 5-21: Water Test 2 Results .................................................................................................. 53
Figure 5-22: Minimal Drift of Victim .............................................................................................. 54
Figure 5-23: Full System Water Test 3 ........................................................................................... 55
Figure 6-1: Added Lifejacket Loop for Ease of Aid7 ........................................................................ 58
Figure 8-1: Error Vectors for 3 ft Test ............................................................................................ 61
Figure 8-2: Error Vectors for 6 ft Test ............................................................................................ 61
Figure 8-3: Error Vectors for 9 ft Test ............................................................................................ 62
Figure 8-4: Error Vectors for 12 ft Test .......................................................................................... 62
Figure 8-5: Error Vectors for 15 ft Test .......................................................................................... 63
Figure 8-6: Error Vectors for 18 ft Test .......................................................................................... 63
Figure 8-7: Error Vectors for 21 ft Test .......................................................................................... 64
Figure 8-8: Error Vectors for 24 ft Test .......................................................................................... 64
Figure 8-9: Error Vectors for 27 ft Test .......................................................................................... 65
Figure 8-10: Error Vectors for 30 ft Test ........................................................................................ 65
Figure 8-11: Min, Max, Mean Errors for 3 ft Test .......................................................................... 66
Figure 8-12: Min, Max, Mean Errors for 6 ft Test .......................................................................... 66
Figure 8-13: Min, Max, Mean Errors for 9 ft Test .......................................................................... 67
Figure 8-14: Min, Max, Mean Errors for 12 ft Test ........................................................................ 67
Figure 8-15: Min, Max, Mean Errors for 15 ft Test ........................................................................ 68
Figure 8-16: Min, Max, Mean Errors for 18 ft Test ........................................................................ 68
Figure 8-17: Min, Max, Mean Errors for 21 ft Test ........................................................................ 69
x
Figure 8-18: Min, Max, Mean Errors for 24ft Test ......................................................................... 69
Figure 8-19: Min, Max, Mean Errors for 27 ft Test ........................................................................ 70
Figure 8-20: Min, Max, Mean Errors for 30 ft Test ........................................................................ 70
Table of Tables
Table 7-1: Land-based error vectors for the 3ft-9ft tests .............................................................. 40
Table 7-2: Land-based error vectors for the 12ft-18ft tests .......................................................... 40
Table 7-3: Land-based error vectors 21-30ft tests ........................................................................ 40
Table 7-4: Water Test Errors .......................................................................................................... 42
1
1 Introduction
A man overboard is defined as anyone who has fallen from a boat or ship and is in need of rescue.
Sailors in the military and the civilian sector are both at risk of falling overboard. Falling overboard can
be very dangerous, and the overboard sailor needs to be rescued quickly and efficiently. According to
the US Search and Rescue Task Force, in waters less than sixty degrees Fahrenheit, sailors can become
unconscious or even die in as little as one hour [1]. In the Navy, between 1980 and 2002, over 1,000
sailors fell overboard, 133 of which did not survive [2]. In the commercial fishing sector, falling
overboard accounted for 46% of fishing fatalities between 2000 and 2009 [3]. Currently, the best way to
rescue a man overboard is to assemble a search and rescue team and to look for the victim via
helicopter and/or rescue boat. The goal of this project was to design an autonomous rescue vehicle to
search for and retrieve the victim without the need of a human rescue team.
A search and rescue mission begins when a sailor falls overboard, and it concludes with one of
three outcomes: the sailor is successfully found alive and is then rescued; the sailor is found dead; or the
sailor is never found, and the search must discontinue after exhausting all other options. In May of 2003,
a sailor fell overboard from a Navy amphibious assault ship off the coast of Virginia. Crew members
immediately threw him a float coat (a Navy-issued coat for both warmth and buoyancy) to stay afloat,
and the crew was alerted of a man overboard. Within five minutes, a rescue boat was deployed, and
within ten minutes, a rescue helicopter had taken off. Unfortunately, in the five minutes it took to
deploy a rescue team, the sailor had disappeared. After nine hours of searching, it became too dark,
and the team had to return to the ship. One particular goal of this project is to eliminate the delay of
assembling a rescue team by dropping the autonomous rescue vehicle into the water as soon as the
alert is activated.
In March of 2007, a sailor fell overboard from a US aircraft carrier into the Atlantic. The crew
onboard was alerted of the overboard sailor, and an onboard helicopter rescue team was dispatched.
The sailor was found and rescued in under an hour [4]. Fortunately, most Navy vessels have the
advantage of carrying a helicopter and crew, but commercial vessels can rarely afford such means of
rescue. A goal in this project was to design a system for rescuing the overboard sailor without the need
for line-of-sight to the victim, a search and rescue requirement that is typically improved by the military
or the coast guard using a helicopter.
2
The main goals of this project revolve around developing a search and rescue system that can
rescue a man overboard, and are outlined as follows. The system needs to:
Locate the overboard person,
Drive a rescue vehicle to the person,
Return the rescue vehicle to the ship once it has acquired the person, and
Complete all of the above objectives without the use of a rescue team.
Eliminating the human factor is important for a variety of reasons. For instance, as explained in a
previous example, a human rescue team takes time to assemble before deploying. Even a delay of five
minutes can be the difference between life and death of the overboard person. With an autonomous
rescue vehicle, the rescue team is no longer necessary. The autonomous system outlined above can
navigate the rescue vehicle to and from the person on its own, and therefore needs no team to
assemble before it is deployed. As soon as the system is alerted (which can be automatic when the
victim enters the water), the rescue vehicle can be deployed, and the rescue can commence without
delay.
Eliminating the rescue team can also prevent more lives from being risked. If the person fell
overboard because of a storm, then in normal circumstances, a rescue team would also have to put
themselves in harm’s way to rescue the victim. If the system is autonomous, the rescue vehicle can be
deployed without any other sailors risking their lives in a storm.
In this project, the team successfully built a prototype rescue system that can navigate a rescue
vehicle to a victim and return the rescue vehicle to its origin. The following chapter discusses
background research conducted to learn more about current implementations of man overboard rescue
systems, as well as various means of localization that could potentially be used to locate the victim. The
next chapter establishes a group of requirements that must be met in order to fulfill the objective. Then
the system design and implementation is discussed, including the localization and navigation of the
system, the wireless network, and the three units into which the system was divided: the rescue vehicle,
the victim unit, and the mothership unit. The Testing and Results chapter includes the results obtained
through unit and system testing. The final chapter includes the conclusions for the project and provides
recommendations for further development.
3
2 Background
In order to develop a search and rescue system that not only identified the location of a victim,
but also autonomously navigated to the victim, it was important to research the current efforts towards
overboard victim rescue. The potential inability to stop or turn the ship around when an individual has
fallen overboard was taken into account, and the simple solution of throwing a buoy to the victim was
ruled out. Three systems were researched in particular. Also, many forms of location and tracking were
researched, including GPS localization, VHF omnidirectional ranging, sound-based navigation,
electromagnetic localization, and aerial navigation.
2.1 Existing Man Overboard Rescue Systems
To learn more about existing methods of rescuing a man overboard, three different rescue systems
were researched. The ORCA Man Overboard Identification (MOBI), the Sci-Tech MOB tracking system,
and the Sea Marshall AU9 Personal Locator Beacon all had ways of notifying the proper authorities of
the victim’s situation, as well as directing a rescuer to the victim’s location.
2.1.1 ORCA Man Overboard Identification
BriarTek Incorporated created a Man Overboard Identification system called the ORCA MOBI [5],
which is currently being used in every American aircraft carrier [6]. The MOBI is divided into three parts:
the ORCA transmitter is attached to the sailor and notifies the ship when the sailor has fallen overboard,
the ORCA receiver alarms the ship when the sailor falls overboard and identifies which sailor is in the
water, and the ORCA direction finder directs the rescue team
towards the location of the victim.
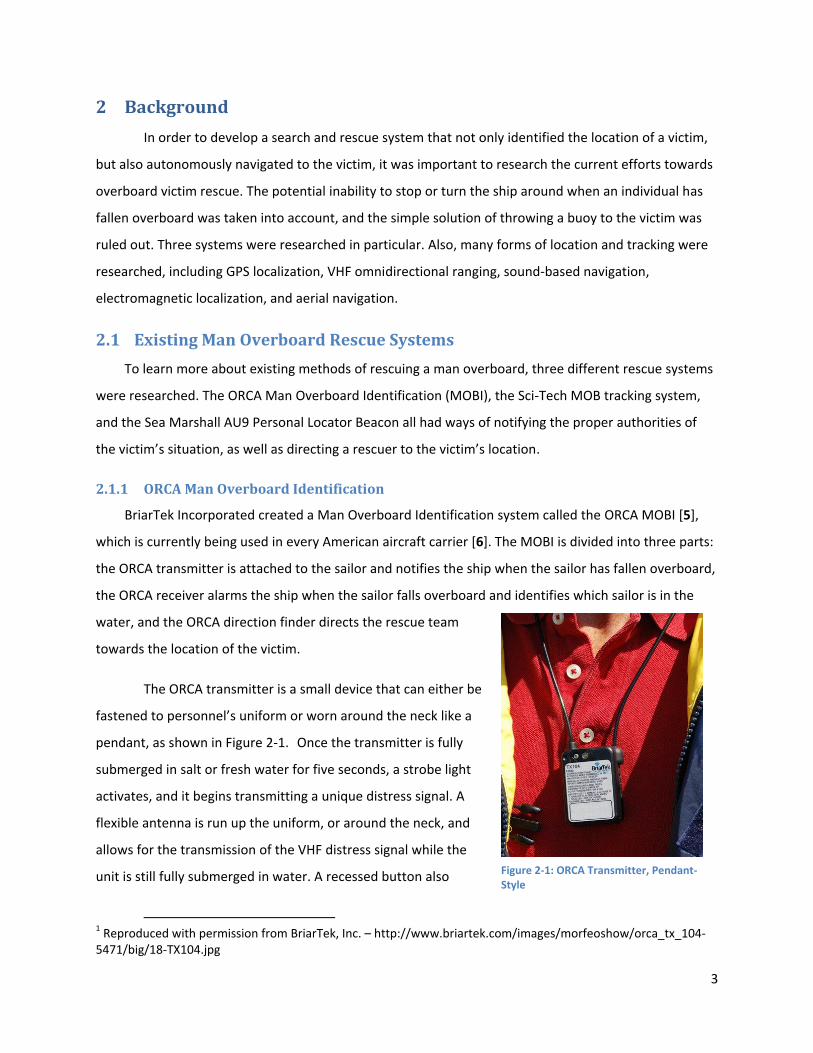
The ORCA transmitter is a small device that can either be
fastened to personnel’s uniform or worn around the neck like a
pendant, as shown in Figure 2-1.1 Once the transmitter is fully
submerged in salt or fresh water for five seconds, a strobe light
activates, and it begins transmitting a unique distress signal. A
flexible antenna is run up the uniform, or around the neck, and
allows for the transmission of the VHF distress signal while the
unit is still fully submerged in water. A recessed button also
1 Reproduced with permission from BriarTek, Inc. – http://www.briartek.com/images/morfeoshow/orca_tx_104-5471/big/18-TX104.jpg
Figure 2-1: ORCA Transmitter, Pendant-Style
4
allows for manual activation or deactivation in the case of a malfunction or false alarm.
Once the ORCA victim-side transmitter begins transmitting a distress signal, the on-board ORCA
receiver will then activate, audibly alerting the crew of the ship of the overboard person. The receiver
can be programmed to identify each transmitter, and when alerted, it will display the name of the
overboard individual. In case of operation among a fleet of ships, the receiver will also identify the ship
from which they fell. Once the crew has been alerted, a rescue can then be initiated. The rescue team
can then be deployed via helicopter or rigid inflatable boat.
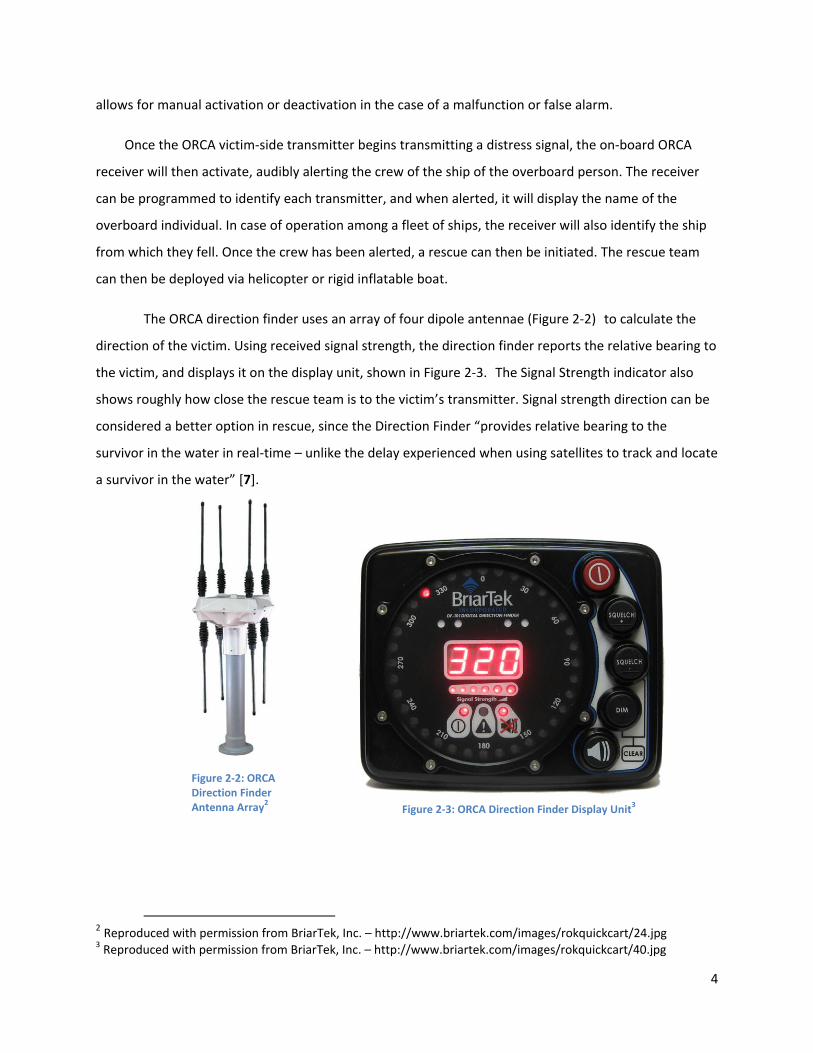
The ORCA direction finder uses an array of four dipole antennae (Figure 2-2)2 to calculate the
direction of the victim. Using received signal strength, the direction finder reports the relative bearing to
the victim, and displays it on the display unit, shown in Figure 2-3.3 The Signal Strength indicator also
shows roughly how close the rescue team is to the victim’s transmitter. Signal strength direction can be
considered a better option in rescue, since the Direction Finder “provides relative bearing to the
survivor in the water in real-time – unlike the delay experienced when using satellites to track and locate
a survivor in the water” [7].
2 Reproduced with permission from BriarTek, Inc. – http://www.briartek.com/images/rokquickcart/24.jpg 3 Reproduced with permission from BriarTek, Inc. – http://www.briartek.com/images/rokquickcart/40.jpg
Figure 2-2: ORCA Direction Finder Antenna Array2 Figure 2-3: ORCA Direction Finder Display Unit3
5
The ORCA system demonstrates many promising qualities when looking for a man overboard
rescue system. First of all, the immediate notification of overboard personnel allows for rescue to be
dispatched quickly. Also, given the correct conditions, the direction finder can be accurate to within ±5O.
However, in order to obtain an accurate reading, a direct line of sight is necessary between the antenna
array and the transmitter. High waves and poor weather conditions can negatively impact the signal.
Because the transmitter operates on 121.5MHz, the direction finder is also susceptible to other radios
and emitters, on the ship or otherwise. The instruction manual also notes that immediate results from
the direction finder can be inaccurate due to signal reflections off of the side of the ship. The problem
also arises if the rescue vehicle is deployed on the opposite side of the ship, giving the rescue team a
very small chance to receive the transmitter’s signal. Overall, the ORCA MOBI is a highly regarded rescue
system; however, it is open to some of the previously mentioned flaws.
2.1.2 Sci-Tech MOB Tracking System
While not readily commercially available, the Sci-Tech Man Overboard (MOB) system won first
prize at the 2008 European Satellite Navigation Competition [8]. Rather than applying overboard rescue
to a military ship scale, the Sci-Tech system was targeted towards smaller, private boats, but the system
can easily be implemented in a rescue vehicle situation. Positioning is achieved via GPS satellites instead
of received radio signal strength like the ORCA. The system is only comprised of two parts: the
personnel-side mobile unit and a central unit installed within the ship’s navigation system.
The mobile unit is attached to the person’s life jacket. When the victim falls in the water, and
the life jacket inflates, the mobile unit is automatically activated and detached from the victim to float
on the surface. The mobile unit’s GPS unit provides the MOB’s location, which is then transmitted on an
open radio channel, which can be received by the central unit, as well as any other nearby ships. The
central unit on the ship receives the MOB’s distress signal and plots the MOB’s position on the boat’s
navigation device. The boat can then navigate back to the MOB using its own navigation system.
Sci-Tech’s MOB system uses GPS to locate the victim, which can prove to be better in most
aquatic conditions. GPS signal is not affected by weather conditions as much as received-signal-strength
system, such as the ORCA, and while GPS still relies on line-of-sight, it only needs to see the sky. In the
open ocean, very rarely is something solid blocking the MOB unit from the whole sky. The caveat to Sci-
Tech’s system is that it relies on a rescue boat with a GPS navigation system installed. This isn’t a
problem if the ship in question is a smaller, personal-sized boat, but if the ship is a large ship or military
6
aircraft carrier that would need to deploy a rescue vehicle, GPS navigation needs to be installed in the
rescue vehicle in order to integrate the central unit.
2.1.3 Sea Marshall AU9
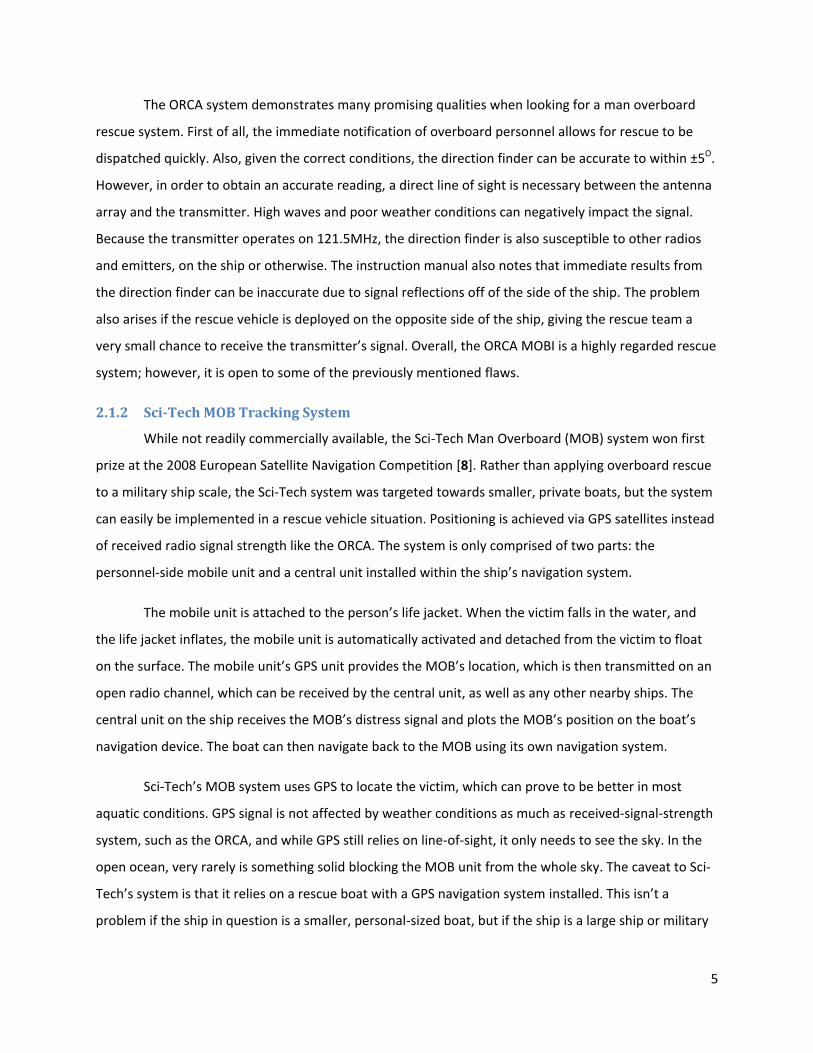
The Sea Marshall AU9 is a very similar system to the ORCA MOBI system. It, too, uses three units
to alert the crew of an overboard sailor and then direct rescue crews to the victim [9]. As shown in the
diagram below, the rescue format is similar to that of the ORCA MOBI as well. First, the victim falls
overboard (1), and after five seconds of submersion, the alerting unit (transmitter) starts transmitting
the SOS signal. Upon receiving the SOS signal (2), the ship immediately alerts the crew, while also
transmitting its own SOS signal and GPS location. The ship can then use the onboard locator unit, which
is again an array of antennas (Figure 2-5) and an LED directional display (Figure 2-6) to navigate back to
the victim (3). If more help is needed, rescue authorities can locate the ship by the GPS coordinates it
transmitted, and then can locate the victim from the SOS signal.
Figure 2-4: Sea Marshall Rescue Sequence4
While the Sea Marshall AU9 system is intended for commercial boats that would be capable of
rescuing their own victims, the antenna and locator display could be easily mounted on a rigid inflatable.
As with the ORCA system, the antennae need to be mounted as high as possible and rely on line-of-sight
between the antennae and the victim. While the Sea Marshall system has a significantly lower price
(<$3000) than the ORCA MOBI system, the location finder can only guarantee a direction of up to ±15O.
4 Reproduced with permission from Marine Rescue Technologies Ltd -
http://www.seamarshall.com/images/storyboards/sarfinder_2.jpg
7
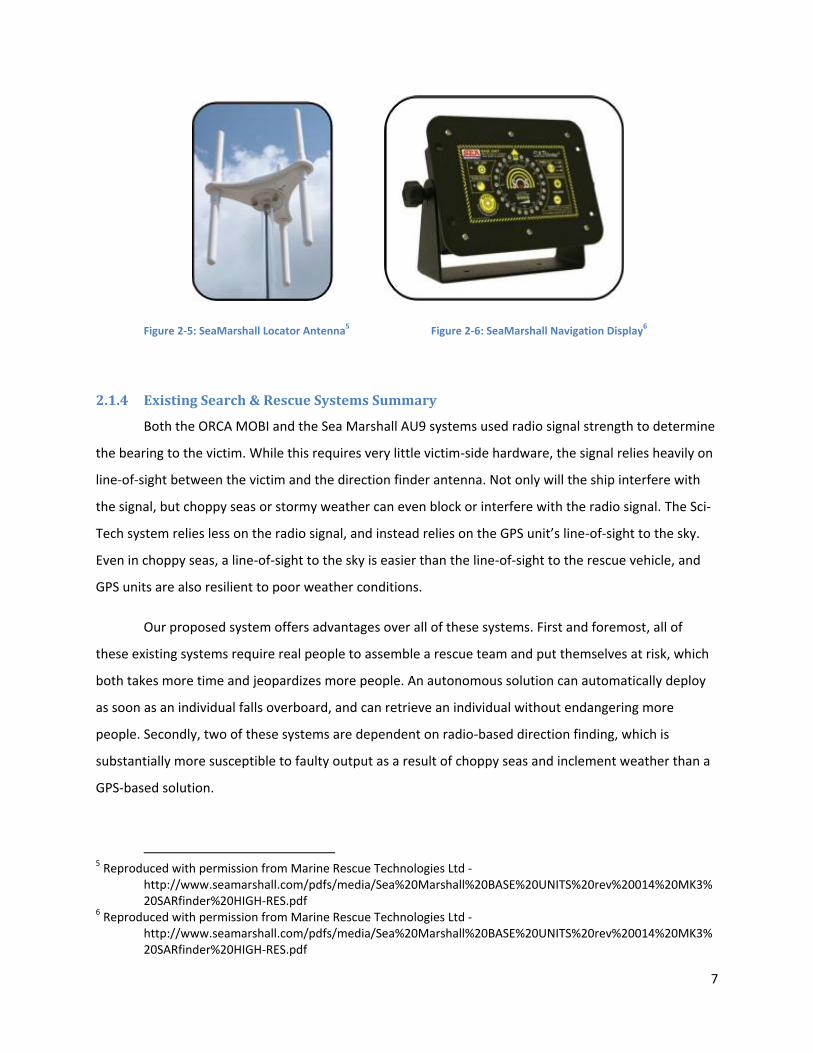
Figure 2-5: SeaMarshall Locator Antenna5 Figure 2-6: SeaMarshall Navigation Display6
2.1.4 Existing Search & Rescue Systems Summary
Both the ORCA MOBI and the Sea Marshall AU9 systems used radio signal strength to determine
the bearing to the victim. While this requires very little victim-side hardware, the signal relies heavily on
line-of-sight between the victim and the direction finder antenna. Not only will the ship interfere with
the signal, but choppy seas or stormy weather can even block or interfere with the radio signal. The Sci-
Tech system relies less on the radio signal, and instead relies on the GPS unit’s line-of-sight to the sky.
Even in choppy seas, a line-of-sight to the sky is easier than the line-of-sight to the rescue vehicle, and
GPS units are also resilient to poor weather conditions.
Our proposed system offers advantages over all of these systems. First and foremost, all of
these existing systems require real people to assemble a rescue team and put themselves at risk, which
both takes more time and jeopardizes more people. An autonomous solution can automatically deploy
as soon as an individual falls overboard, and can retrieve an individual without endangering more
people. Secondly, two of these systems are dependent on radio-based direction finding, which is
substantially more susceptible to faulty output as a result of choppy seas and inclement weather than a
GPS-based solution.
5 Reproduced with permission from Marine Rescue Technologies Ltd -
http://www.seamarshall.com/pdfs/media/Sea%20Marshall%20BASE%20UNITS%20rev%20014%20MK3%20SARfinder%20HIGH-RES.pdf
6 Reproduced with permission from Marine Rescue Technologies Ltd - http://www.seamarshall.com/pdfs/media/Sea%20Marshall%20BASE%20UNITS%20rev%20014%20MK3%20SARfinder%20HIGH-RES.pdf
8
2.2 Localization
Because the rescue vehicle needed to navigate the open ocean, certain environmental aspects
needed to be taken into account. For example, while a land-based robot can use encoders to track its
location while it travels over the earth, water-based vehicles have the disadvantage of traveling through
a surface that may very well be travelling in a separate direction on its own. Waves can also create
barriers that block out most signals. Keeping the restrictions in mind, various localization techniques
were researched.
2.2.1 Global Positioning System
Using the Global Positioning System (GPS) as a means of navigation was our original solution for
navigation. GPS communicates with satellites in space to triangulate its position using a time-of-flight
model. The minimum required number of satellites to get a two-dimensional fix is 3, but more satellites
in view gives a more accurate result; in the real world, it is very common to have more than six satellites
in view at once. The location is given in the global coordinate system: latitude and longitude. GPS
provides more reliable results when there is a direct line of site to the satellite, as well as when there are
no tall buildings, trees, or other GPS-reflective surfaces nearby. Due to the nature of the open ocean,
there is very rarely any obstruction between the GPS units and the sky.
If a GPS unit is attached to both the victim and the rescue vehicle, the respective GPS
coordinates can be used to determine the location of both the victim and the vehicle at any given time,
and to calculate a path from the rescue vehicle to the victim. GPS receivers also receive information
about the fix it has, such as the number of satellites used to get a location, the quality of the fix,
elevation of the unit, and satellite time. Most of the information provided is extraneous, but latitude
and longitude coordinates and satellite time can be used to navigate the vehicle. Additionally, the GPS
units provide current bearing information relative to true North, which is used in lieu of a compass.
Additionally, a compass would only be capable of providing a bearing relative to magnetic North, which
would require correction in software.
The GPS system has many advantages in terms of implementation. The number of parts
required is minimal. GPS units are required to provide coordinates of both the victim and the rescue
vehicle, and some sort of wireless radio would be needed to transmit the respective coordinates back to
the mothership for navigation. Another advantage is that, with the assumption that the victim and
rescue vehicle are on a relatively flat plane, the computation required to navigate the rescue vehicle is
9
straightforward. Finally, while a GPS receiver is moving, multipath signals reflected off of the
surrounding environment cannot converge on the receiver. This allows for only the direct signal from
the satellite to be accepted, giving the GPS unit very accurate coordinates.
2.2.1.1 Differential GPS (DGPS)
Differential GPS is a system implemented to overcome the inaccuracies inherent in the satellite-
based GPS [10]. Using stations at known coordinates, the system compares the known coordinates to
the coordinates obtained from a GPS receiver. The difference between the known and reported
coordinates is then broadcast via radios for other GPS users to obtain a more accurate location. What
will be referred to as differential GPS for the remainder of this report is different than this definition.
The differential GPS in this report refers to using the difference between two GPS coordinates to
calculate a path between them.
2.2.2 VOR-Inspired Positioning System
In a case where more accuracy than using just GPS is required, various methods of close-
proximity positioning were researched. A VHF Omnidirectional Range (VOR) -inspired system [11] can be
used to find the angle between the rescue vehicle’s heading and the victim’s location. The system
consists of a rotating platform with an omnidirectional monopole antenna and a highly directional
antenna, such as a pillbox antenna. By emitting an omnidirectional pulse once per revolution, and a
continuous sweeping signal out of the directional antenna, we can calculate the angle of the receiving
antenna relative to the transmitters.
By comparing the known rate of rotation of the directional beam to the received time difference
in the two signals, the angle between the current heading of the transmitter and the current position of
the receiver can be calculated as the ratio of the time difference and the total rotation time multiplied
by 360 degrees. However, this system is relatively vulnerable to choppy seas; large waves would easily
induce unpredictable errors in the received signals, such as too large of a delay between reception or
completely blocked signals.
2.2.3 Ultrasonic Positioning System
Another option that was explored for higher-precision local positioning was a hydrophonic
positioning system, where an ultrasonic hydrophone speaker would be placed on the victim, and the
rescue vehicle would have an array of hydrophone microphones. Using a time-of-arrival system, the
10
resulting victim location could be triangulated using basic trigonometry. However, much like the VOR
system, this system is subject to distortion and multipath error induced by waves on the ocean.
2.2.4 Other Systems
A few other localization systems were considered. First, a magnetic system, working much like
the ultrasonic system, was explored. By affixing multiple off-axis electromagnets to the hull of the
rescue vehicle, a magnetic field sensor to the victim, pulsing the electromagnets one at a time, and
looking at the received field strength of the victim, a position could be derived. Appropriately-shaped
electromagnets would produce a field with high strength lobes in one plane, with very little strength in a
tangential plane. By placing two of these electromagnets perpendicular to each other and alternating
which one is powered, the magnetic field sensor could approximate its angle relative to the pair by
looking at the field strengths. This system was quickly dismissed after the approximate size of the
magnets involved was found to be substantially too large to be feasible.
Another option was a robotic flying vehicle with a thermal imaging system of some sort. By
flying high above the scene, such a vehicle could easily and rapidly pinpoint the location of both the
victim, and, given a thermal beacon, the rescue vehicle, allowing the system to easily be guided in on the
victim. This system was dismissed both for its complexity and cost.
2.2.5 Location and Tracking Summary
While many localization techniques were researched, many were thrown out for lack of
feasibility, complexity, or cost. GPS localization was used in the final project both because of its ease of
implementation and the fact that it won’t be negatively affected by the sea. The VOR-inspired system
was also investigated further as a means to increase the precision of close-proximity localization.
2.3 Background Conclusion
In this chapter we researched both existing systems for man overboard search and rescue, as
well as various methods for location and tracking. We discussed the pros and cons of each rescue
system, and discussed the feasibility of the various localization methods. In the next chapter, we discuss
the requirements established for designing our proposed search and rescue system.
11
3 Requirements
After researching existing options, a set of explicit and implicit requirements were developed for
our search and rescue system. Explicitly, the system must operate completely autonomously; it must use
differential GPS to navigate a rescue vehicle to a victim who has fallen overboard; and it must be
capable of performing a full man overboard rescue scenario. Several implicit requirements were
assumed during development: the entire system needed to be reasonably affordable; the vehicle control
circuitry needed to be compact enough to fit on a rescue vehicle; the victim circuitry should be compact;
the controls needed to be completely watertight; and the rescue vehicle needed to remain buoyant in
spite of being loaded by control hardware.
3.1 Explicit Requirements
There are three requirements that truly define the core of this project, and they are focused on
the three principle areas of interest: system autonomy, GPS-based localization, and a fully-implemented
rescue system.
3.1.1 Autonomous Operation
The entire system must operate autonomously. One of the primary objectives of the system was
to remove human interaction from the rescue scenario, because, while it is possible to establish a rescue
team in as little as five minutes, a person can completely disappear in that timeframe. In order to
accomplish this objective and remove the human element from the equation, the system must be able
to completely autonomously navigate the rescue vehicle from the mothership to the victim and back.
3.1.2 GPS Navigation
Another primary objective of the project was to explore and evaluate the feasibility of GPS and
differential GPS for localization. To that end, the system must implement a GPS-based navigation
system, in which GPS data must be provided by the victim, rescue vehicle, and mothership in real time.
3.1.3 Full Rescue Scenario
When the system is complete, it must be able to perform a full rescue scenario. That is, it must
be capable of bringing a rescue vehicle from the mothership to within 5 meters of the victim in the
water and then return to the mothership. Additionally, it must be able to perform this scenario as if the
victim and rescue vehicle are truly out at sea; that is, they cannot rely on land-based infrastructure for
communications.

12
3.2 Implicit Requirements
There are also several requirements that serve to further define or clarify the explicit
requirements and set the stage for a project. In some cases, they establish limits on the scope of the
project: the project must be reasonably affordable, because it is funded largely out-of-pocket. In other
cases, they serve to solidify seemingly-obvious points: the rescue vehicle must float and safely house
components.
3.2.1 Cost
The system must be reasonably affordable. The project’s budget is $250 from the department
plus however much the project members are willing to invest. Realistically, this puts an upper bound on
project cost at around $1000. This limit suggests that, for example, a full-size rescue vehicle is unlikely to
be a viable option at the prototype level.
3.2.2 Control Circuitry Size
Due to the limitations imposed on the system by cost, the resulting rescue vehicle was likely to
be a scaled-down model. Care had to be taken to ensure that the controls for the rescue vehicle were
compact enough to fit on the selected rescue vehicle chassis.
3.2.3 Victim Circuitry
The circuitry that provides for victim localization should be compact enough to reasonably fit on
a lifejacket. Likewise, the requisite power source should be compact enough to fit on a lifejacket and last
at least 48 hours.
3.2.4 Watertight
The system should be able to withstand the stresses of its environment. Due to the aquatic
nature of this environment, care had to be taken in housing all near-water components of the system to
prevent water damage, which would likely prove fatal for most components of the system.
3.2.5 Buoyancy
In order for the rescue vehicle to complete its objectives, it should maintain buoyancy when
fully loaded with control hardware and protection.
3.3 Conclusion
In this chapter, a list of specific requirements was established; explicit requirements were
defined that highlight expected project functionality, while implicit requirements outline the

13
assumptions involved in this project. In the following chapter, the solutions to these established
requirements are explored in detail, both in terms of hardware solutions and software solutions.
14
4 Design and Implementation
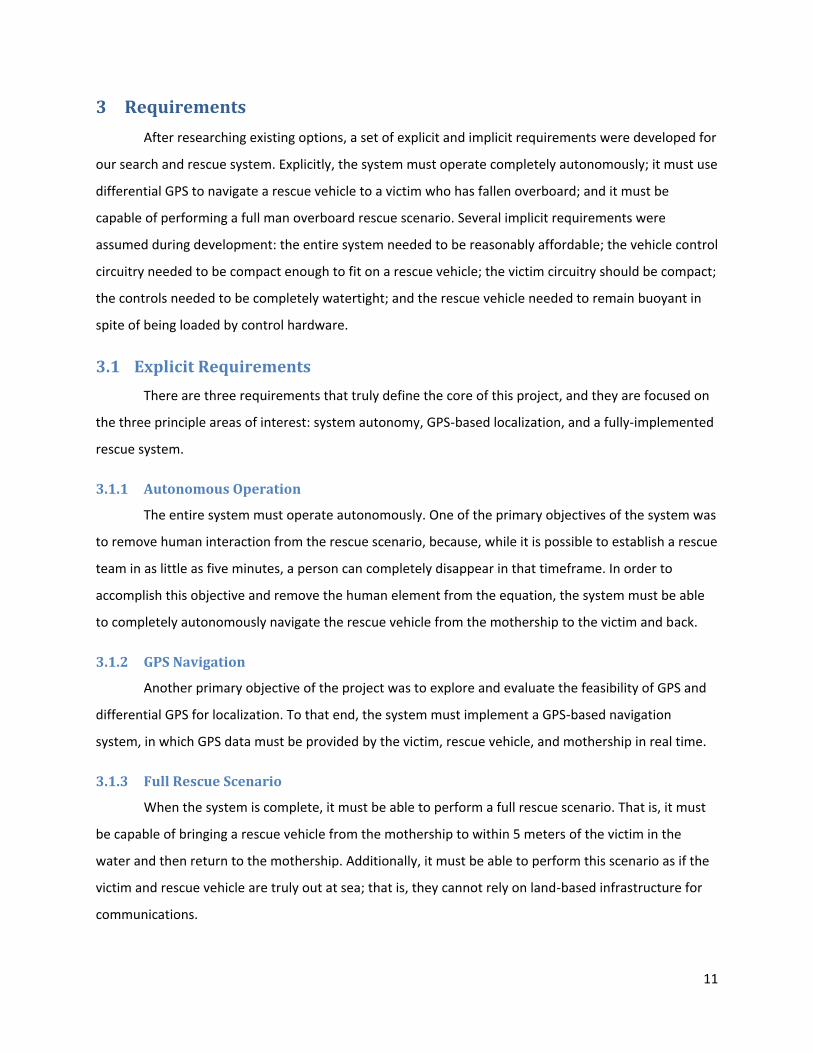
There were two design paths considered for this project. In one scenario (option A in figure 4-1),
the rescue vehicle is the master; it receives GPS data from the mothership and the victim, and then uses
this data to calculate its path and control its current state in realtime. In the other (option B in figure 4-
1), the mothership is a master; it receives GPS data from the rescue vehicle and the victim, then uses the
data to calculate a path for the rescue vehicle, and then finally broadcasts command and control data to
the rescue vehicle. Each option has its advantages and disadvantages. The primary advantage of the
first option is theoretically reduced latency; as soon as the rescue vehicle receives the victim’s
coordinates, it can calculate a new path and immediately start executing it. The downsides are that
targeting microcontrollers with the more advanced state machine code, as well as path calculations, is a
complex, time-consuming challenge; furthermore, microcontroller platforms, as well as the C language
itself, are generally not simple to debug. There is also the potential that the system would not be able to
keep up with new data; that is, the time to calculate controls off of old data could exceed the rate at
which data arrives, thereby reducing the speed at which new controls can be used. In the alternative
design that uses a mothership-based command system, many of these problems can be avoided. By
including a standard laptop computer on the mothership end, state logic and control can be handled by
a desktop application written in a high-level language, such as Java. The advantages then are extremely
rapid development, ease of debugging, and not having to worry about computational resources; the
primary disadvantage becomes network latency.
Figure 4-1: System Design Options
15
We chose to go with the latter solution. We hypothesized that the gain in latency from using a
laptop for calculations due to additional wireless network hops and transmissions would be insignificant
relative to the rate at which the GPS units update and at which the rescue vehicle responds to
commands. Furthermore, it could possibly be faster than doing calculations on the rescue vehicle’s
microcontroller simply because it takes less time to hop to, calculate on, and back from a laptop than it
would to do all the calculations in-place on the rescue vehicle’s microcontroller.
Using this approach, we came up with three principle actors in our system: the rescue vehicle
system, which would consist of a physical RC boat modified to be controlled by a microcontroller, with
an on-board GPS unit; a compact victim unit, designed to transmit the victim’s GPS data and operate
efficiently off of a single battery supply; and a mothership, consisting of a laptop connected to the
rescue system’s ad-hoc wireless network, which would run our Java control software. The rescue vehicle
system would be based around an existing development board to save time; the victim unit would
feature a custom, compact board that would share microcontroller architectures with the development
board to save firmware development time; and the mothership would simply be any laptop computer
with a USB port.
4.1 Ad-Hoc Wireless Network
Given that the expected deployment environment is in the middle of the ocean, the system
would need to be able to be completely self-sufficient in terms of communication; common land-based
approaches, such as existing Wi-Fi infrastructure or cellular M2M networks would not be an option at
sea. Instead, a ZigBee ad-hoc network would be used. ZigBee is a network standard based on the IEEE
802.15.4 standard, which is a low data rate personal area network protocol, much like Bluetooth. Unlike
Bluetooth, the network range can easily cover over a mile with cheap, off-the-shelf radios.
4.1.1 ZigBee Protocol and Radios
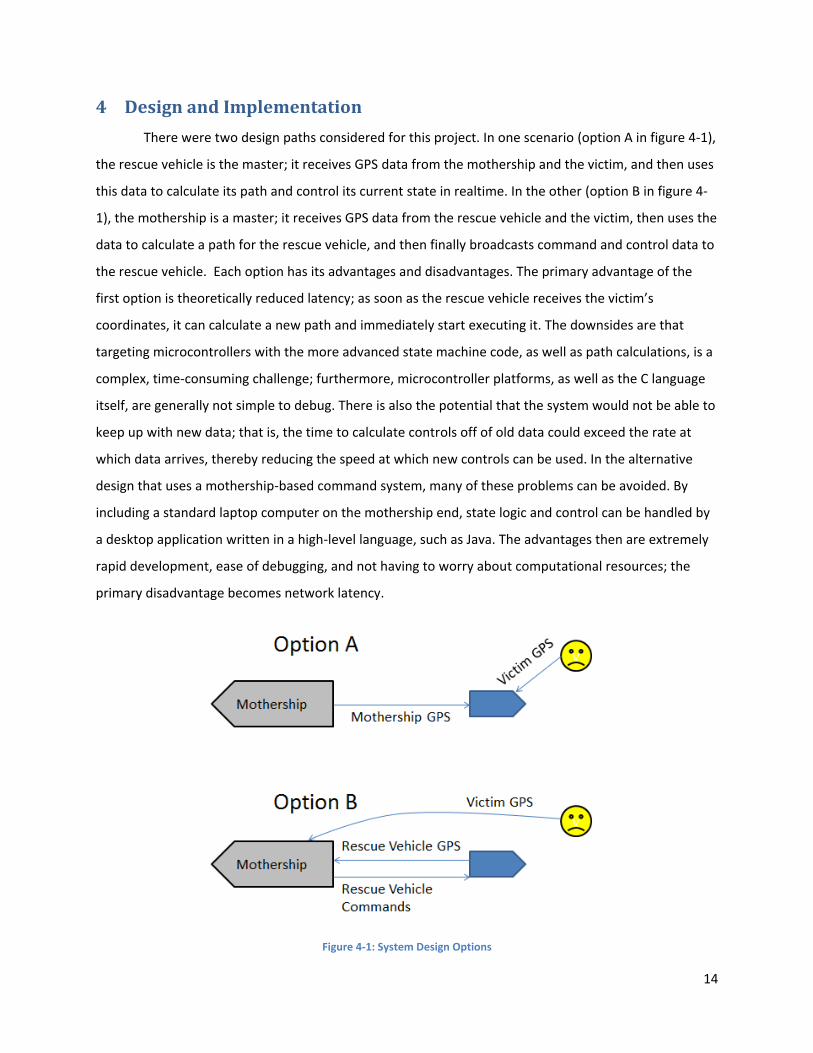
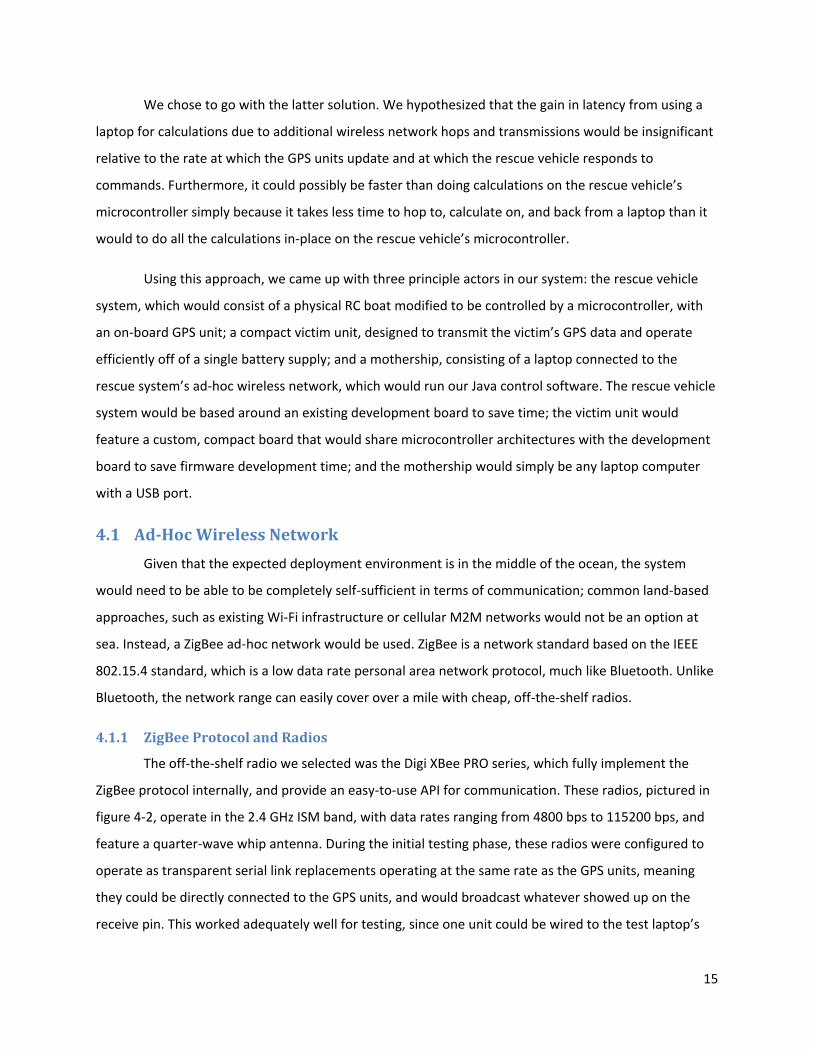
The off-the-shelf radio we selected was the Digi XBee PRO series, which fully implement the
ZigBee protocol internally, and provide an easy-to-use API for communication. These radios, pictured in
figure 4-2, operate in the 2.4 GHz ISM band, with data rates ranging from 4800 bps to 115200 bps, and
feature a quarter-wave whip antenna. During the initial testing phase, these radios were configured to
operate as transparent serial link replacements operating at the same rate as the GPS units, meaning
they could be directly connected to the GPS units, and would broadcast whatever showed up on the
receive pin. This worked adequately well for testing, since one unit could be wired to the test laptop’s
16
Figure 4-2: XBEE Pro Wireless Radio
serial port, but would not work in the final system for a variety of
reasons. First, the units would not transmit all of the data they
received; any bytes that came while the unit was transmitting a
packet of data were lost, though this was only an issue during
communication bursts, which the GPS units only produced during
strings that were not relevant to our testing. Secondly, however,
the data coming out of the receiving unit in transparent mode
looked exactly like the data going in; this meant that in a multi-
transmitter environment, it would be impossible to distinguish one
set of data from another.
Conveniently, API mode offers solutions to all of these problems. First, data loss can be
completely prevented by a combination of running the network at a higher bitrate and using a
microcontroller to buffer the data. Also, all data packets sent over the API network include their
sender’s MAC address, which can be easily used for packet source identification. The API mode also
offers a few other handy features, such as automatic rebroadcasting of failed packets; built-in error
checking; and multi-hop transmission, where a packet from node A, which is not in range of node C, will
be sent to node B to be retransmitted.
However, several issues arose during the implementation of the network. Getting the radios
into transparent mode was a fairly straightforward process, but getting them to actually work in API
mode at the desired baud rate was a nightmare for a variety of reasons. First, when reprogramming the
radios using the X-CTU tool, the program does not gracefully handle baud rate changes; after the
firmware is written, the baud rate the tool is using must be manually changed to the new baud rate
before the settings are written. This seems like a reasonably obvious solution, but it was completely
masked by the fact that one of the radios being used had begun to malfunction around this time; it
would allow itself to be programmed, and read back its settings correctly, but then would give the
appearance of going to sleep immediately thereafter. Before this was successfully diagnosed, it simply
gave the impression that the radios only successfully programmed and allowed their settings to be
written under seemingly random and unpredictable conditions. Once the malfunction was discovered
and a replacement ordered, a functional network was established at 38.4 kbps.
The original desired baud rate for the network was 115.2 kbps, because it would be virtually
impossible to saturate, nor would communication with it produce any substantial timing issues in either
17
of our microcontroller platforms. Unfortunately, due to the way the ATMega microcontrollers (both the
ATMega 164 on the victim unit and the ATMega 2560 on the rescue vehicle) select baud rates, an actual
baud rate of 115.2 kbps is not achievable, and the resulting approximation does not transmit into the
XBee radios in a workable fashion. The highest common bit rate that would be exactly clockable by both
the ATMega microcontroller and the unit in the XBee was 38.4 kbps, which was found to be adequately
fast for the purposes of system timing.
In order to ensure proper communication between the firmware and a radio, a strict packet
format is required for the API protocol. With a 72 byte packet size and 18 bytes of API packet frame
information, we are allowed 54 maximum bytes per packet. The packet is outlined in detail below.
API Packet Outline Byte 0: 0x7E Start Delimiter Byte 1: Length (MSB) Byte 2: Length (LSB) Byte 3: 0x10 Transmit Request Frame Type Byte 4: Non-zero number (frame ID) Byte 5-12: 64-bit Destination Address Byte 13-14: 16-bit Destination Address Byte 15: 0x00 Broadcast Radius Byte 16: 0x00 Options Byte 17-70: Data Payload Byte 71: Checksum
In the case of the GPS data packets, the maximum packet length was used to minimize network
overhead. Rescue vehicle control packets consist of two bytes of data – an unsigned byte for speed, and
a signed byte for angle, where zero corresponds to zero degrees, which is the “straight ahead” setting.
4.2 Victim Unit
The primary purpose of the victim unit is to continuously transmit the victim’s current GPS
location over an ad-hoc wireless network, such that the mothership may navigate the rescue vehicle to
the victim for rescue. Secondarily, the system should be compact as possible, so as to not encumber
individual sailors, and be energy-efficient, to minimize the size of the batteries required. Furthermore, it
needs to be capable of powering off of just one battery. Other design considerations include that it
should use the same programming interface as the development board of the rescue vehicle, and it
should have at least some extra IO available for prototyping and debugging purposes.
18
As will be discussed in section 4.3, the development board chosen for the rescue vehicle
features an ATMega2560 and a custom programming interface built around AVR’s in-system
programmer. To maintain continuity, and to encourage reusability of any firmware written, an
ATMega164 was chosen for the victim unit. This processor can be targeted by almost exactly the same C
as ATMega2560, but is substantially smaller and cheaper. It was selected because it is the cheapest
processor in the ATMega lineup that has two serial UARTs
built-in – a feature required for communicating with both
the GPS unit and the wireless unit. The remainder of the
board would then feature connections for both the GPS
module and the XBee PRO radio discussed in section 4.1. The
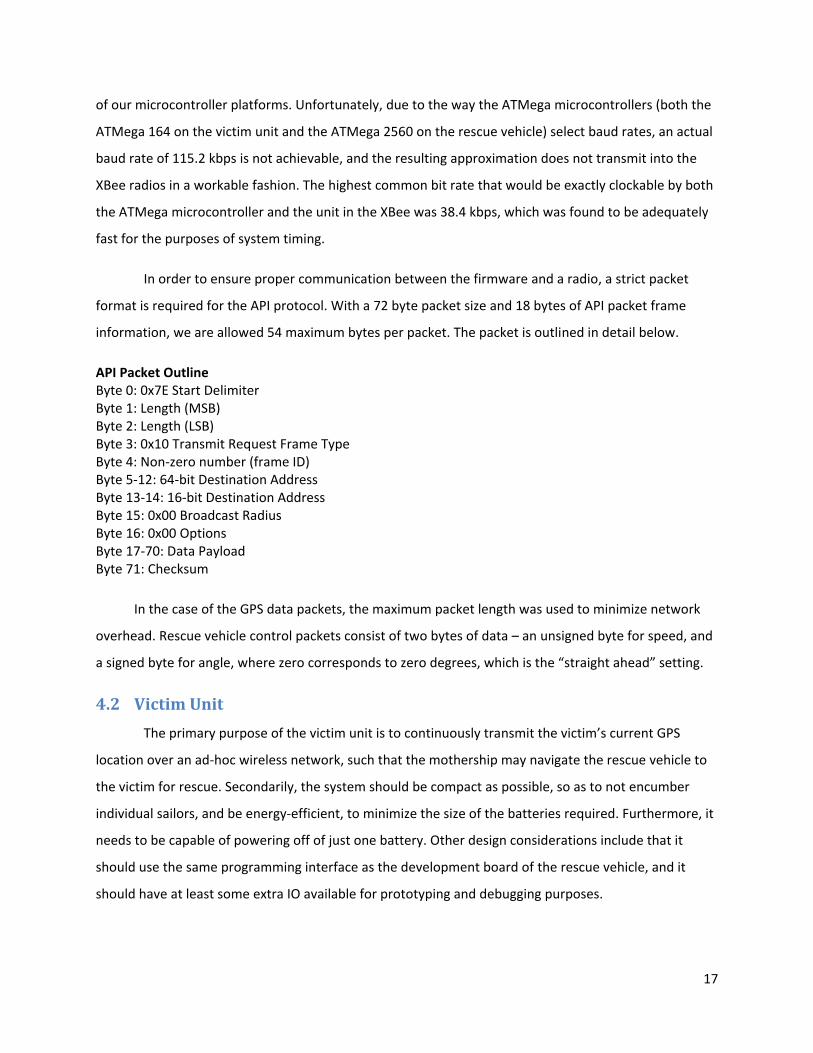
GPS module we selected was the EM406a receiver, pictured
in figure 4-3. The unit was selected because it represented a
good balance of low-cost at 60 dollars per unit, compact size
at just over one square inch, and the expected accuracy of
the unit’s SiRF StarIII chipset.
4.2.1 Hardware Design
As mentioned before, the victim unit features an ATMega164, EM406a GPS, and XBee PRO
radio. In addition, it is designed to be powered by a nominally 4.2 volt rechargeable battery, whose
actual output ranges from 4.2 to 3 volts. The GPS unit is designed for 5 volt power, with communication
signals at 3.3 volt logic levels. The ATMega164 can operate at voltages ranging from around 3 to 5 volts,
and the XBee PRO has a nominal rating of 3.3 volts for both supply voltage and I/O. It was decided that
the system would therefore be built with two voltage rails – a 3.3 volt rail for the ATMega164 and the
XBee PRO. The ATMega164 was run at 3.3 volts because the digital IO high voltage is the same as the
VCC; by making the ATMega164 run at 3.3 volts, its IO would be 3.3 volts, which could then directly be
used with the IO of the XBee PRO. Likewise, the GPS unit’s IO would be running at 3.3 volts; by running
the ATMega164 at 3.3 volts, there would be no need for level shifting any signals on the board. This
system can be seen in figure 4-4. The Battery feeds into a pair of voltage regulators, which then power
the 3.3 volt components and 5 volt components as appropriate. The GPS receiver and Xbee radio
communicate with the CPU over asynchronous serial connections.
Figure 4-3: EM406a GPS Receiver
19
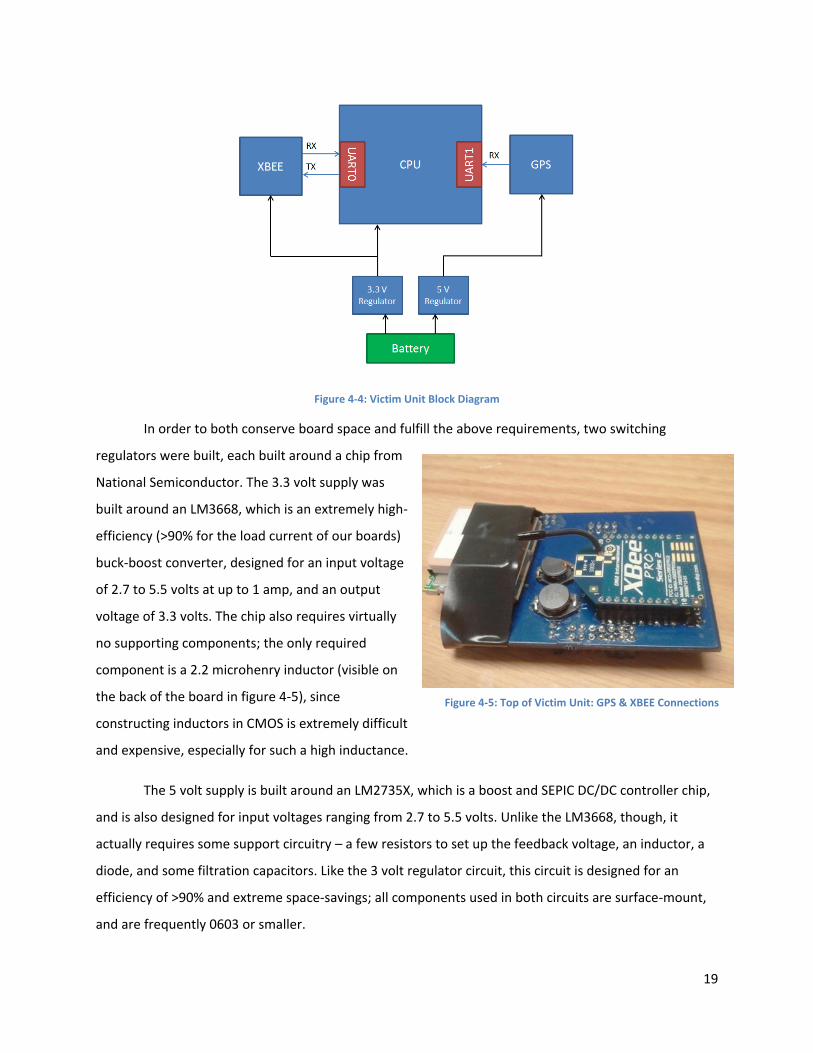
Figure 4-5: Top of Victim Unit: GPS & XBEE Connections
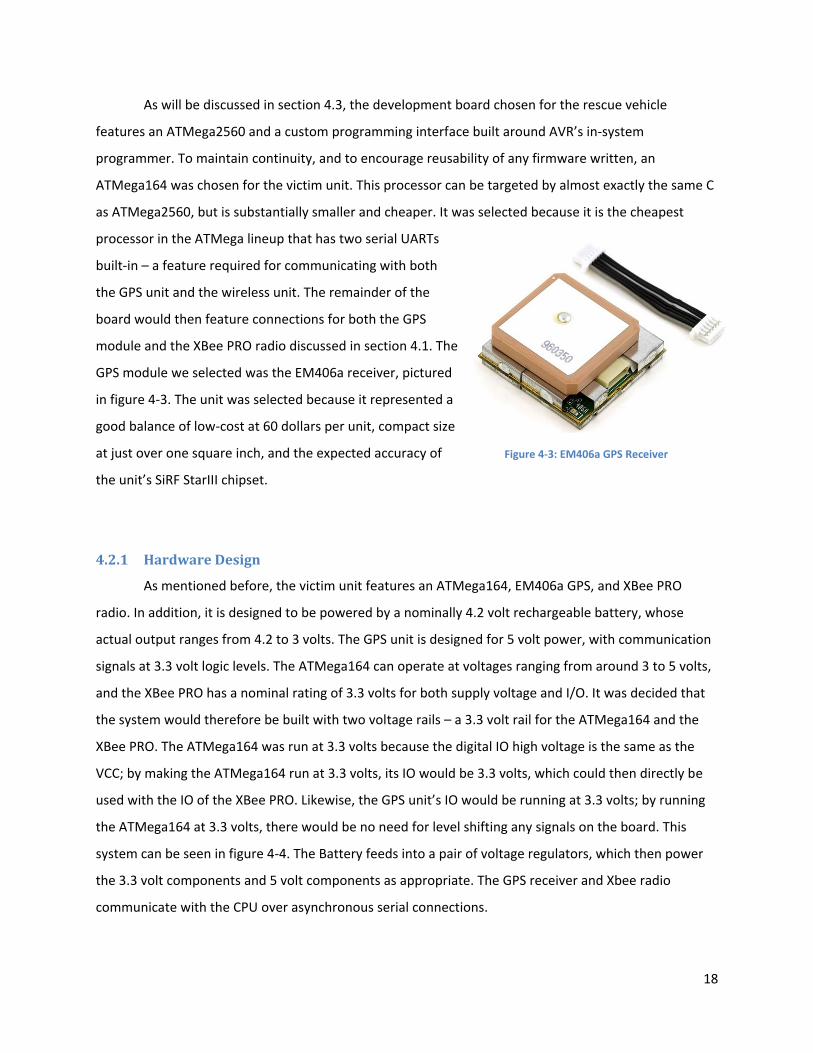
Figure 4-4: Victim Unit Block Diagram
In order to both conserve board space and fulfill the above requirements, two switching
regulators were built, each built around a chip from
National Semiconductor. The 3.3 volt supply was
built around an LM3668, which is an extremely high-
efficiency (>90% for the load current of our boards)
buck-boost converter, designed for an input voltage
of 2.7 to 5.5 volts at up to 1 amp, and an output
voltage of 3.3 volts. The chip also requires virtually
no supporting components; the only required
component is a 2.2 microhenry inductor (visible on
the back of the board in figure 4-5), since
constructing inductors in CMOS is extremely difficult
and expensive, especially for such a high inductance.
The 5 volt supply is built around an LM2735X, which is a boost and SEPIC DC/DC controller chip,
and is also designed for input voltages ranging from 2.7 to 5.5 volts. Unlike the LM3668, though, it
actually requires some support circuitry – a few resistors to set up the feedback voltage, an inductor, a
diode, and some filtration capacitors. Like the 3 volt regulator circuit, this circuit is designed for an
efficiency of >90% and extreme space-savings; all components used in both circuits are surface-mount,
and are frequently 0603 or smaller.
20
The GPS and XBee radio both exist on one side of the victim board merely as headers to plug in
the actual units, and can be seen connected in figure 4-5. In both cases, 10 microfarad filter capacitors
are placed as close to the voltage supply pins as possible.
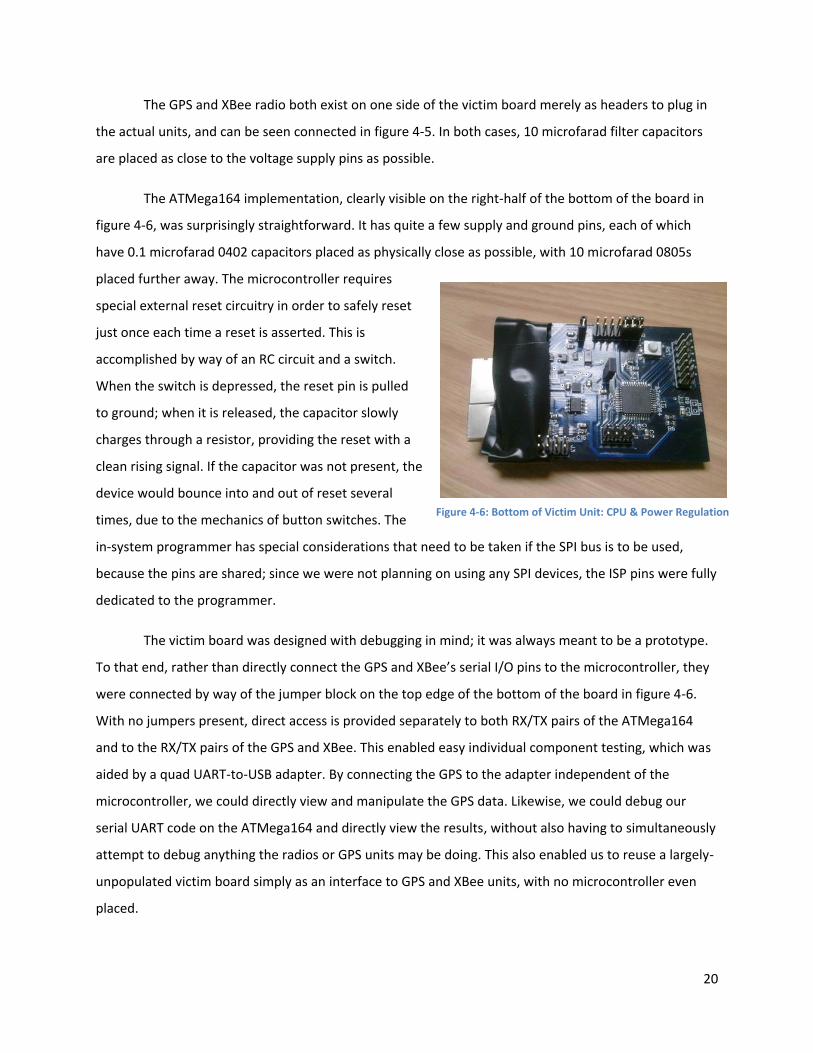
The ATMega164 implementation, clearly visible on the right-half of the bottom of the board in
figure 4-6, was surprisingly straightforward. It has quite a few supply and ground pins, each of which
have 0.1 microfarad 0402 capacitors placed as physically close as possible, with 10 microfarad 0805s
placed further away. The microcontroller requires
special external reset circuitry in order to safely reset
just once each time a reset is asserted. This is
accomplished by way of an RC circuit and a switch.
When the switch is depressed, the reset pin is pulled
to ground; when it is released, the capacitor slowly
charges through a resistor, providing the reset with a
clean rising signal. If the capacitor was not present, the
device would bounce into and out of reset several
times, due to the mechanics of button switches. The
in-system programmer has special considerations that need to be taken if the SPI bus is to be used,
because the pins are shared; since we were not planning on using any SPI devices, the ISP pins were fully
dedicated to the programmer.
The victim board was designed with debugging in mind; it was always meant to be a prototype.
To that end, rather than directly connect the GPS and XBee’s serial I/O pins to the microcontroller, they
were connected by way of the jumper block on the top edge of the bottom of the board in figure 4-6.
With no jumpers present, direct access is provided separately to both RX/TX pairs of the ATMega164
and to the RX/TX pairs of the GPS and XBee. This enabled easy individual component testing, which was
aided by a quad UART-to-USB adapter. By connecting the GPS to the adapter independent of the
microcontroller, we could directly view and manipulate the GPS data. Likewise, we could debug our
serial UART code on the ATMega164 and directly view the results, without also having to simultaneously
attempt to debug anything the radios or GPS units may be doing. This also enabled us to reuse a largely-
unpopulated victim board simply as an interface to GPS and XBee units, with no microcontroller even
placed.
Figure 4-6: Bottom of Victim Unit: CPU & Power Regulation
21
Similar prototype/debug considerations were taken for the power supply. Rather than directly
connect the outputs of the 3.3 volt regulator and 5 volt regulator to their respective voltage rails, they
were connected by way of jumper blocks. This allowed us to test individually the 3.3 volt regulator and 5
volt regulator circuits without potentially damaging the rest of the components on the board, which
proved extremely beneficial; the 3.3 volt regulator circuit on one of the boards we populated had two
pins accidentally bridged together, which resulted in dumping the test battery voltage directly into what
would have been the 3.3 volt rail. This would have likely damaged the XBee radio; since the jumpers
were not in place, the problem was caught and fixed with no damaged components. By also breaking
out the 5 and 3.3 volt rails downstream of the regulators, they could later be used to power any
peripherals that may be needed.
The victim boards were also designed to be able to charge any connected lithium-polymer
batteries, but due to an error in the layout of the charging circuit that was not noticed until assembly,
the charging circuit was unable to be used. It ultimately proved irrelevant, as we decided to use 3 AAA-
size batteries for power to reduce costs.
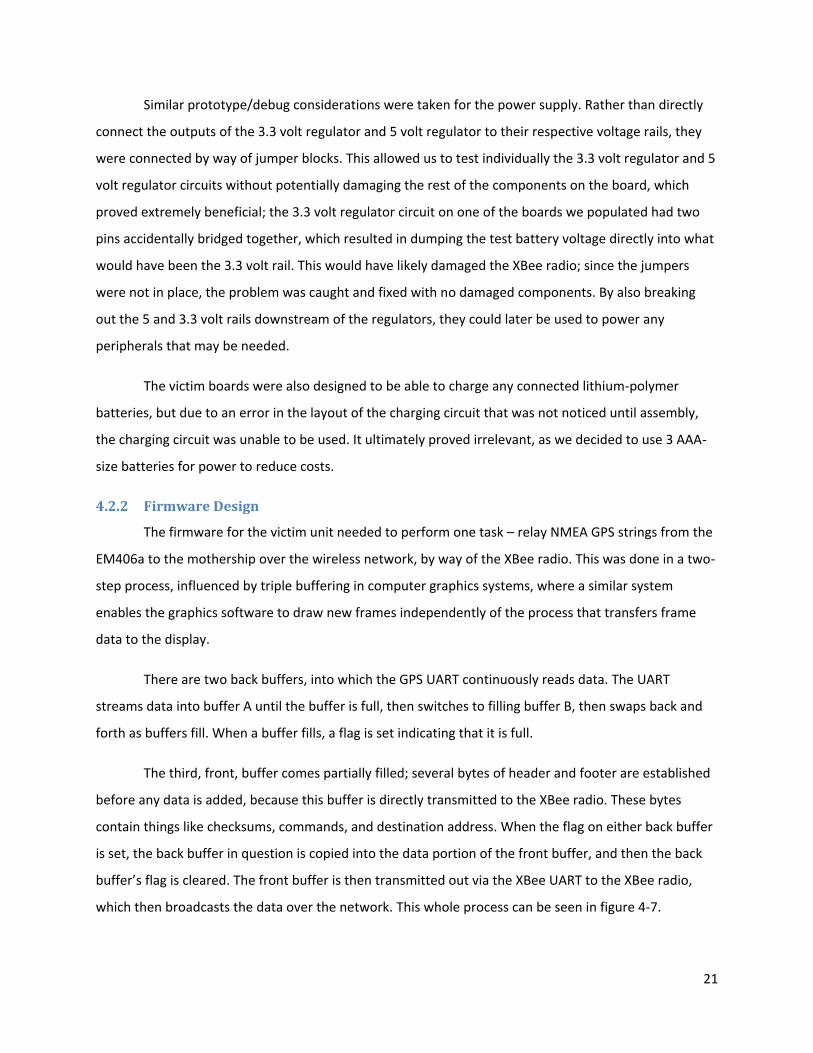
4.2.2 Firmware Design
The firmware for the victim unit needed to perform one task – relay NMEA GPS strings from the
EM406a to the mothership over the wireless network, by way of the XBee radio. This was done in a two-
step process, influenced by triple buffering in computer graphics systems, where a similar system
enables the graphics software to draw new frames independently of the process that transfers frame
data to the display.
There are two back buffers, into which the GPS UART continuously reads data. The UART
streams data into buffer A until the buffer is full, then switches to filling buffer B, then swaps back and
forth as buffers fill. When a buffer fills, a flag is set indicating that it is full.
The third, front, buffer comes partially filled; several bytes of header and footer are established
before any data is added, because this buffer is directly transmitted to the XBee radio. These bytes
contain things like checksums, commands, and destination address. When the flag on either back buffer
is set, the back buffer in question is copied into the data portion of the front buffer, and then the back
buffer’s flag is cleared. The front buffer is then transmitted out via the XBee UART to the XBee radio,
which then broadcasts the data over the network. This whole process can be seen in figure 4-7.
22
Figure 4-7: GPS Data Buffer Flowchart
The resulting code is an interrupt-driven architecture, where bytes received on the GPS UART
trigger the code that adds data to the appropriate buffer, sets the appropriate flag, and triggers the
function call that empties buffers when needed. The other interrupt allows for non-blocking data
transmission to the XBee radio. Normally, when data is being sent out over a UART, it is done so in a
blocking fashion; the first byte is sent, and while that byte is being transmitted, the microcontroller
waits for the event to finish. Once it finishes, the second byte is transmitted, and the process repeats
itself. This form of transmission blocks the execution of any other code, as the name suggests. The
ATMega164 provides support for interrupt-driven transmission, wherein an interrupt is fired every time
the data-to-be-transmitted buffer, which holds a single byte, is emptied. By using this interrupt and
careful pointer management, data transmission can occupy a substantially smaller percentage of the
processor’s running time, especially when the bit rate of the UART is significantly lower than the clock
rate of the processor. This strategy frees up on the order of a thousand clock cycles per byte
23
transmitted. These clock cycles can then be used receiving data from the GPS unit or calculating
checksums for new data.
4.3 Rescue Vehicle
The rescue boat is one of the main elements of the search and rescue system. It is the
autonomous vehicle in question, and features the most complex firmware in the system, and, along the
way, required considerations for everything ranging from motor speed to hull size to microprocessor
power.
The original plan was to buy a full-size rigid hull inflatable and turn it into a robot. This plan was
quickly deemed infeasible when we realized just how unnecessarily large and expensive such a vehicle
was. Instead, it was decided that a remote control boat would be converted into the robotic vehicle. It
would be significantly cheaper ($100 versus $1000+), smaller
(around 2 feet versus around 9 feet), and ultimately provide no
major system-level drawbacks in terms of prototyping. After
looking at nearly every modern RC boat on the market, several
trends were noticed: many boats have custom or proprietary
servo and motor interfaces; many boats do not have rudders,
but instead steer with unusual setups like dual props or mobile
propeller setups; and most boats have extremely poor part
documentation. Finally, a boat that avoided these problems
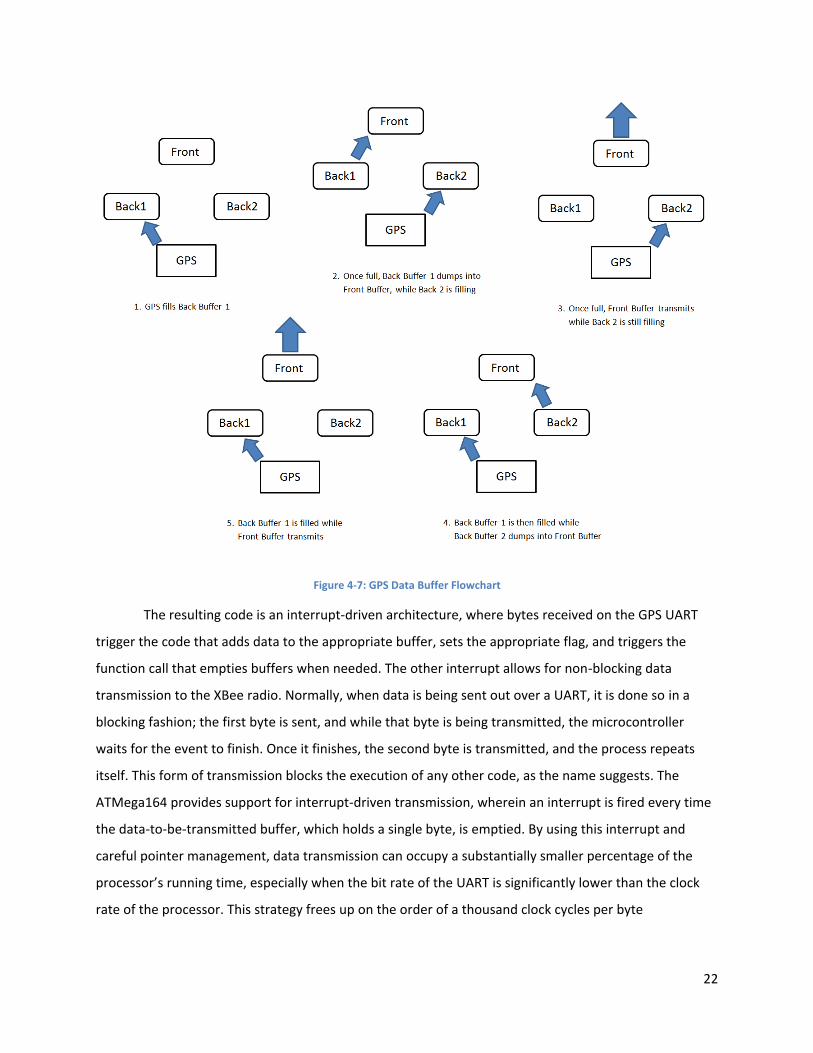
was found – the Mini Rio, pictured in figure 4-8. It features fully documented parts, a single-propeller
double-rudder design, and standard drive components, in the form of a two-wire DC motor and three-
wire servo.
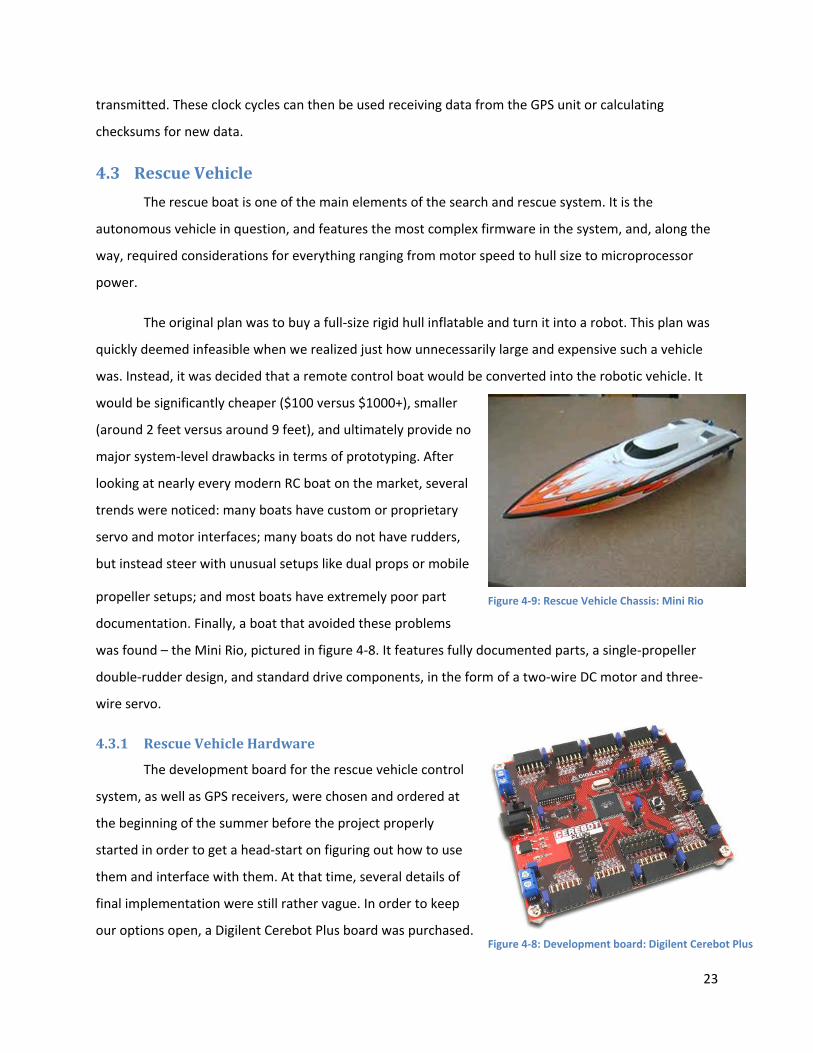
4.3.1 Rescue Vehicle Hardware
The development board for the rescue vehicle control
system, as well as GPS receivers, were chosen and ordered at
the beginning of the summer before the project properly
started in order to get a head-start on figuring out how to use
them and interface with them. At that time, several details of
final implementation were still rather vague. In order to keep
our options open, a Digilent Cerebot Plus board was purchased. Figure 4-8: Development board: Digilent Cerebot Plus
Figure 4-9: Rescue Vehicle Chassis: Mini Rio
24
Digilent is a company that specializes in education-targeted development boards for things like
microcontrollers and FPGAs. The board, pictured in figure 4-9, features an ATMega2560, which was
chosen largely based on our prior experience with the architecture. Ultimately, the board is definitely
more capable than needed, with large number of its GPIO options going unused, but it provides a
number of useful capabilities out-of-the-box, such as easy servo interfacing, onboard power regulation,
and easy support for motor control.
In order to actually control the motor, an H-bridge breakout board was purchased (pictured in
figure 4-10), featuring an MC33887, which is rated for 2.5 amps at up
to 30 volts. In the rescue vehicle, it would be running at battery
voltage. This board was chosen largely by price, as it is cheaper than
most of the other options, and H-bridges more or less all work the
same. The actual control signals involved govern the direction the
motor spins, and, through PWM, the rate at which it spins. In this
case, the rescue vehicle would only ever drive forward, so the
direction signals were tied high and low as needed. The remaining
signals would be driven by the ATMega2560, which has built-in timer functionality for PWM signal
generation.
The GPS and wireless units used are identical to those found on a victim unit, and wound up
being housed on one, as there were spare victim boards, and the parts more or less require a board with
the appropriate headers to connect with them.
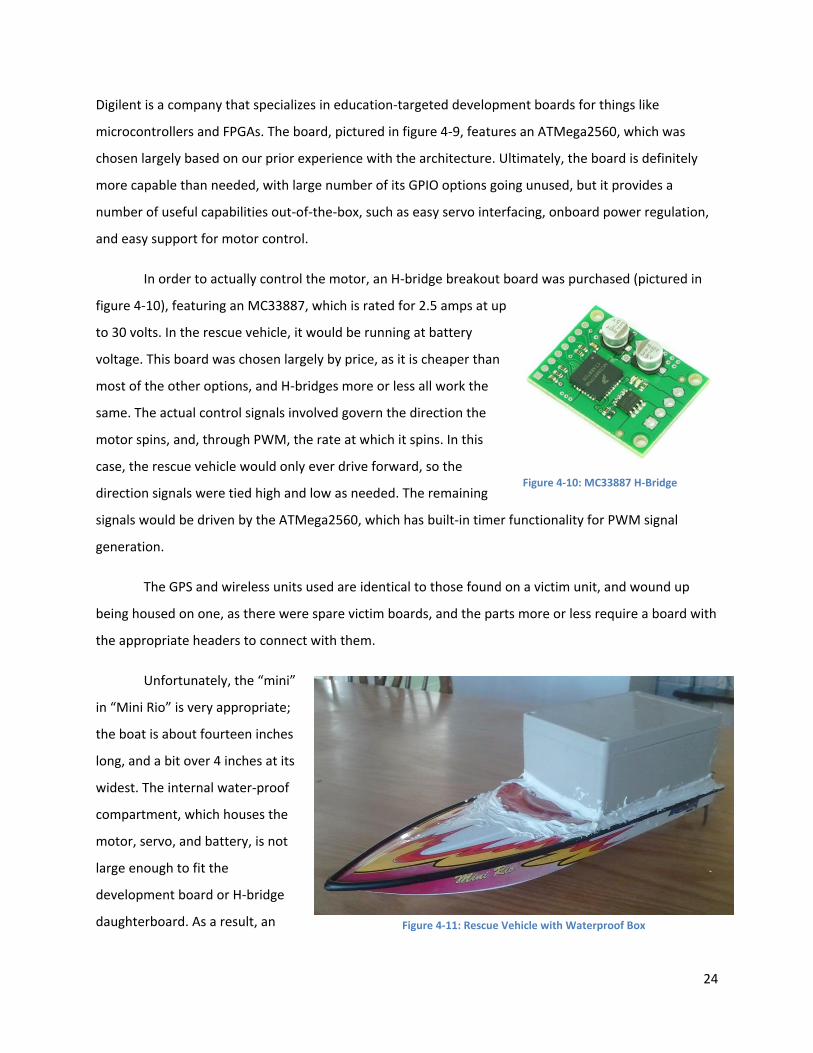
Unfortunately, the “mini”
in “Mini Rio” is very appropriate;
the boat is about fourteen inches
long, and a bit over 4 inches at its
widest. The internal water-proof
compartment, which houses the
motor, servo, and battery, is not
large enough to fit the
development board or H-bridge
daughterboard. As a result, an
Figure 4-10: MC33887 H-Bridge
Figure 4-11: Rescue Vehicle with Waterproof Box
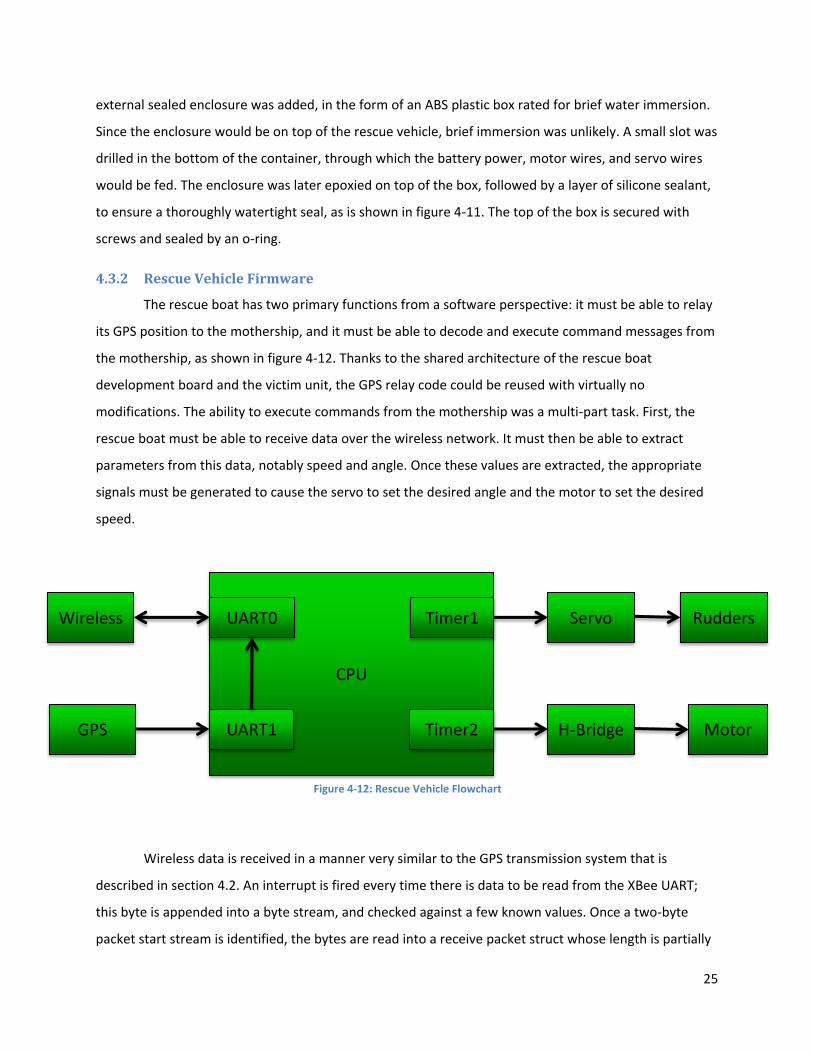
25
Wireless
GPS
Servo
H-Bridge
Rudders
Motor
CPU
UART0
UART1
Timer1
Timer2
external sealed enclosure was added, in the form of an ABS plastic box rated for brief water immersion.
Since the enclosure would be on top of the rescue vehicle, brief immersion was unlikely. A small slot was
drilled in the bottom of the container, through which the battery power, motor wires, and servo wires
would be fed. The enclosure was later epoxied on top of the box, followed by a layer of silicone sealant,
to ensure a thoroughly watertight seal, as is shown in figure 4-11. The top of the box is secured with
screws and sealed by an o-ring.
4.3.2 Rescue Vehicle Firmware
The rescue boat has two primary functions from a software perspective: it must be able to relay
its GPS position to the mothership, and it must be able to decode and execute command messages from
the mothership, as shown in figure 4-12. Thanks to the shared architecture of the rescue boat
development board and the victim unit, the GPS relay code could be reused with virtually no
modifications. The ability to execute commands from the mothership was a multi-part task. First, the
rescue boat must be able to receive data over the wireless network. It must then be able to extract
parameters from this data, notably speed and angle. Once these values are extracted, the appropriate
signals must be generated to cause the servo to set the desired angle and the motor to set the desired
speed.
Wireless data is received in a manner very similar to the GPS transmission system that is
described in section 4.2. An interrupt is fired every time there is data to be read from the XBee UART;
this byte is appended into a byte stream, and checked against a few known values. Once a two-byte
packet start stream is identified, the bytes are read into a receive packet struct whose length is partially
Figure 4-12: Rescue Vehicle Flowchart
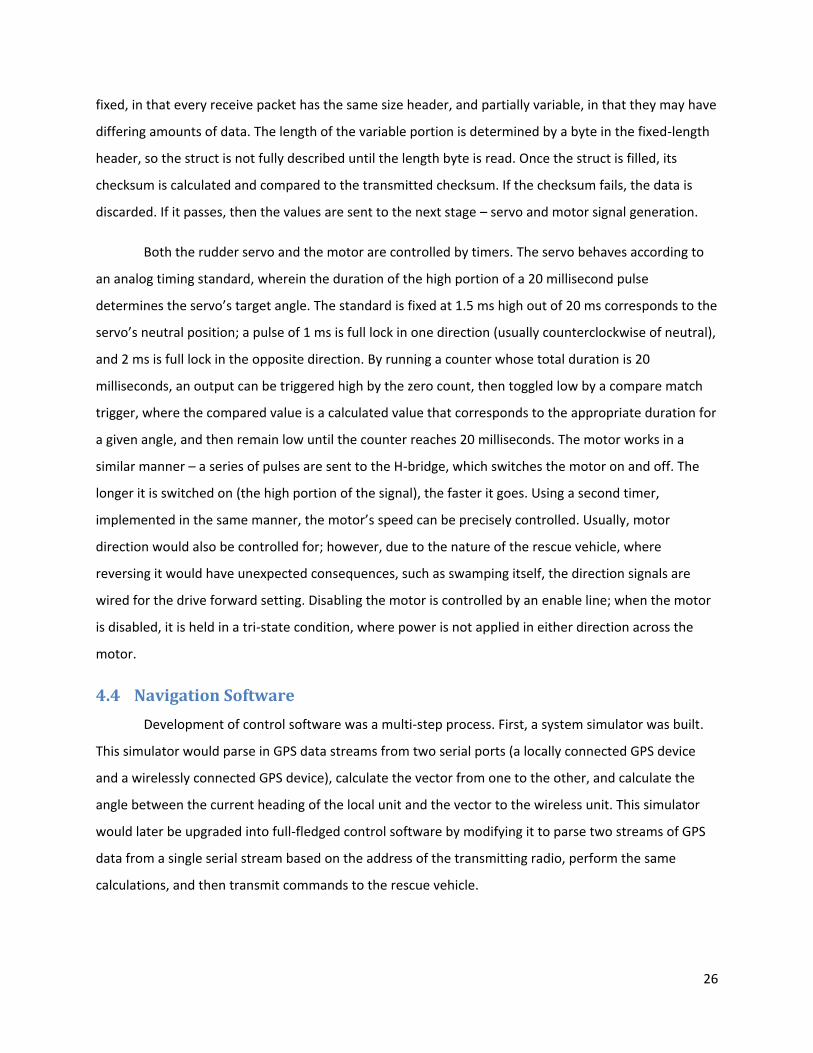
26
fixed, in that every receive packet has the same size header, and partially variable, in that they may have
differing amounts of data. The length of the variable portion is determined by a byte in the fixed-length
header, so the struct is not fully described until the length byte is read. Once the struct is filled, its
checksum is calculated and compared to the transmitted checksum. If the checksum fails, the data is
discarded. If it passes, then the values are sent to the next stage – servo and motor signal generation.
Both the rudder servo and the motor are controlled by timers. The servo behaves according to
an analog timing standard, wherein the duration of the high portion of a 20 millisecond pulse
determines the servo’s target angle. The standard is fixed at 1.5 ms high out of 20 ms corresponds to the
servo’s neutral position; a pulse of 1 ms is full lock in one direction (usually counterclockwise of neutral),
and 2 ms is full lock in the opposite direction. By running a counter whose total duration is 20
milliseconds, an output can be triggered high by the zero count, then toggled low by a compare match
trigger, where the compared value is a calculated value that corresponds to the appropriate duration for
a given angle, and then remain low until the counter reaches 20 milliseconds. The motor works in a
similar manner – a series of pulses are sent to the H-bridge, which switches the motor on and off. The
longer it is switched on (the high portion of the signal), the faster it goes. Using a second timer,
implemented in the same manner, the motor’s speed can be precisely controlled. Usually, motor
direction would also be controlled for; however, due to the nature of the rescue vehicle, where
reversing it would have unexpected consequences, such as swamping itself, the direction signals are
wired for the drive forward setting. Disabling the motor is controlled by an enable line; when the motor
is disabled, it is held in a tri-state condition, where power is not applied in either direction across the
motor.
4.4 Navigation Software
Development of control software was a multi-step process. First, a system simulator was built.
This simulator would parse in GPS data streams from two serial ports (a locally connected GPS device
and a wirelessly connected GPS device), calculate the vector from one to the other, and calculate the
angle between the current heading of the local unit and the vector to the wireless unit. This simulator
would later be upgraded into full-fledged control software by modifying it to parse two streams of GPS
data from a single serial stream based on the address of the transmitting radio, perform the same
calculations, and then transmit commands to the rescue vehicle.
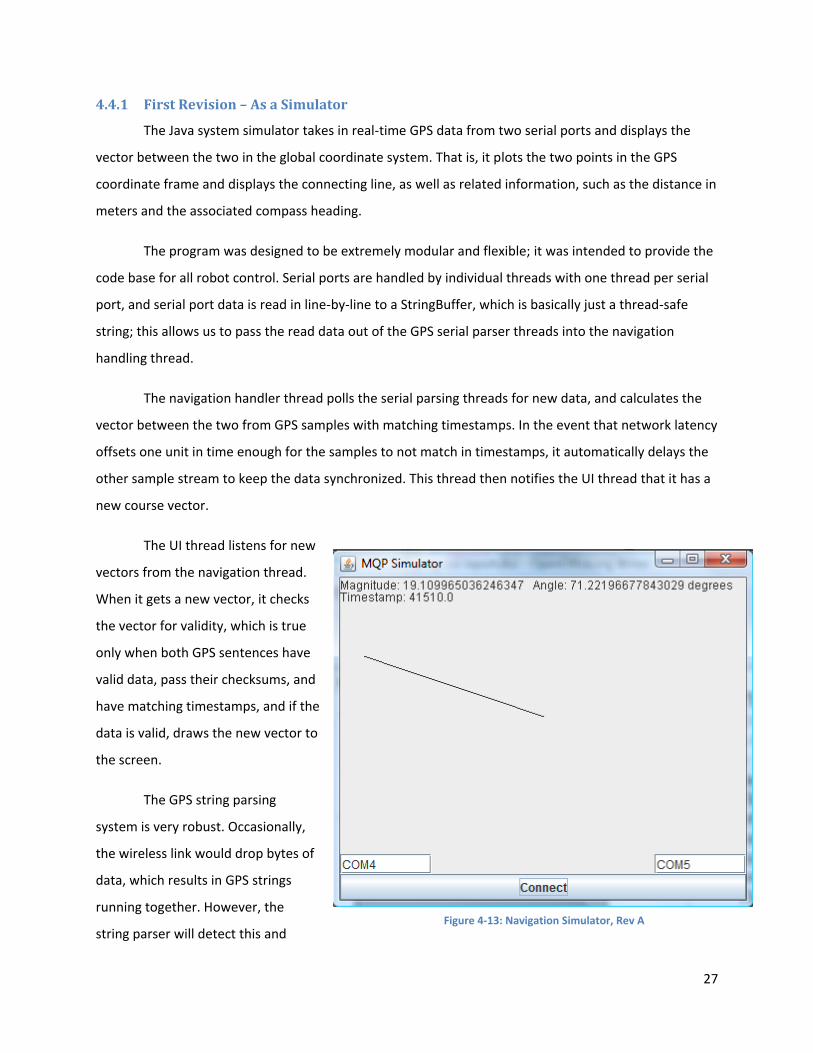
27
4.4.1 First Revision – As a Simulator
The Java system simulator takes in real-time GPS data from two serial ports and displays the
vector between the two in the global coordinate system. That is, it plots the two points in the GPS
coordinate frame and displays the connecting line, as well as related information, such as the distance in
meters and the associated compass heading.
The program was designed to be extremely modular and flexible; it was intended to provide the
code base for all robot control. Serial ports are handled by individual threads with one thread per serial
port, and serial port data is read in line-by-line to a StringBuffer, which is basically just a thread-safe
string; this allows us to pass the read data out of the GPS serial parser threads into the navigation
handling thread.
The navigation handler thread polls the serial parsing threads for new data, and calculates the
vector between the two from GPS samples with matching timestamps. In the event that network latency
offsets one unit in time enough for the samples to not match in timestamps, it automatically delays the
other sample stream to keep the data synchronized. This thread then notifies the UI thread that it has a
new course vector.
The UI thread listens for new
vectors from the navigation thread.
When it gets a new vector, it checks
the vector for validity, which is true
only when both GPS sentences have
valid data, pass their checksums, and
have matching timestamps, and if the
data is valid, draws the new vector to
the screen.
The GPS string parsing
system is very robust. Occasionally,
the wireless link would drop bytes of
data, which results in GPS strings
running together. However, the
string parser will detect this and Figure 4-13: Navigation Simulator, Rev A
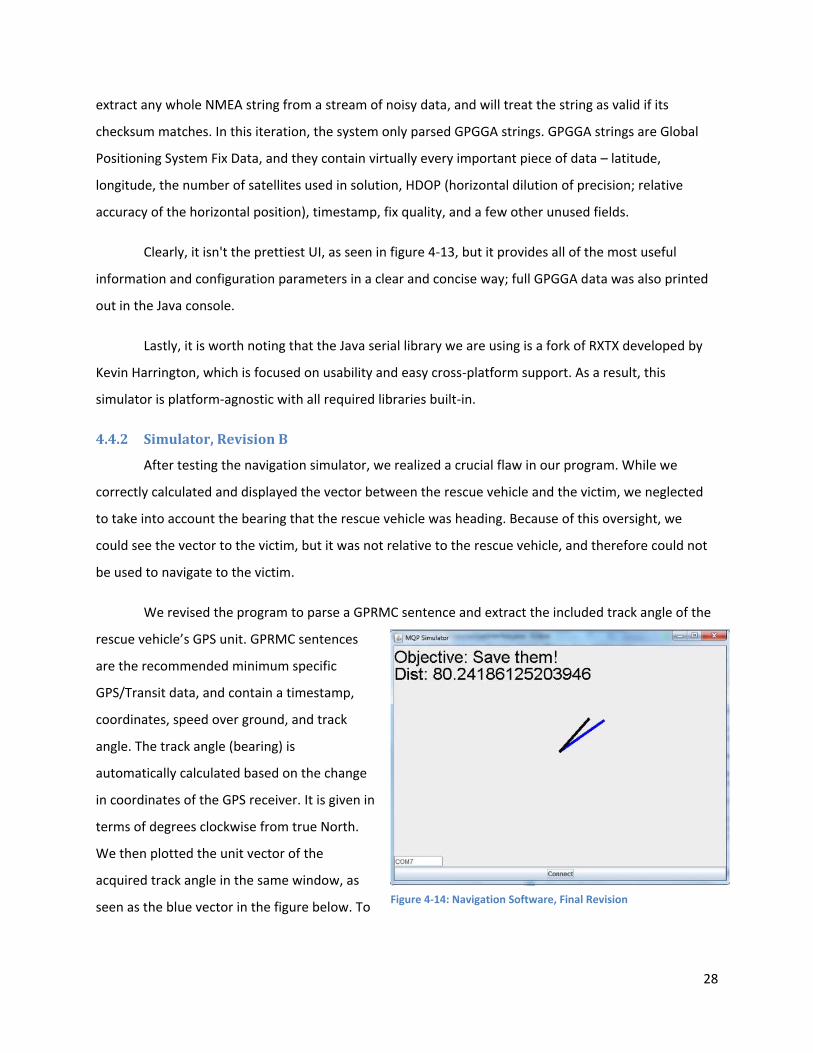
28
extract any whole NMEA string from a stream of noisy data, and will treat the string as valid if its
checksum matches. In this iteration, the system only parsed GPGGA strings. GPGGA strings are Global
Positioning System Fix Data, and they contain virtually every important piece of data – latitude,
longitude, the number of satellites used in solution, HDOP (horizontal dilution of precision; relative
accuracy of the horizontal position), timestamp, fix quality, and a few other unused fields.
Clearly, it isn't the prettiest UI, as seen in figure 4-13, but it provides all of the most useful
information and configuration parameters in a clear and concise way; full GPGGA data was also printed
out in the Java console.
Lastly, it is worth noting that the Java serial library we are using is a fork of RXTX developed by
Kevin Harrington, which is focused on usability and easy cross-platform support. As a result, this
simulator is platform-agnostic with all required libraries built-in.
4.4.2 Simulator, Revision B
After testing the navigation simulator, we realized a crucial flaw in our program. While we
correctly calculated and displayed the vector between the rescue vehicle and the victim, we neglected
to take into account the bearing that the rescue vehicle was heading. Because of this oversight, we
could see the vector to the victim, but it was not relative to the rescue vehicle, and therefore could not
be used to navigate to the victim.
We revised the program to parse a GPRMC sentence and extract the included track angle of the
rescue vehicle’s GPS unit. GPRMC sentences
are the recommended minimum specific
GPS/Transit data, and contain a timestamp,
coordinates, speed over ground, and track
angle. The track angle (bearing) is
automatically calculated based on the change
in coordinates of the GPS receiver. It is given in
terms of degrees clockwise from true North.
We then plotted the unit vector of the
acquired track angle in the same window, as
seen as the blue vector in the figure below. To Figure 4-14: Navigation Software, Final Revision
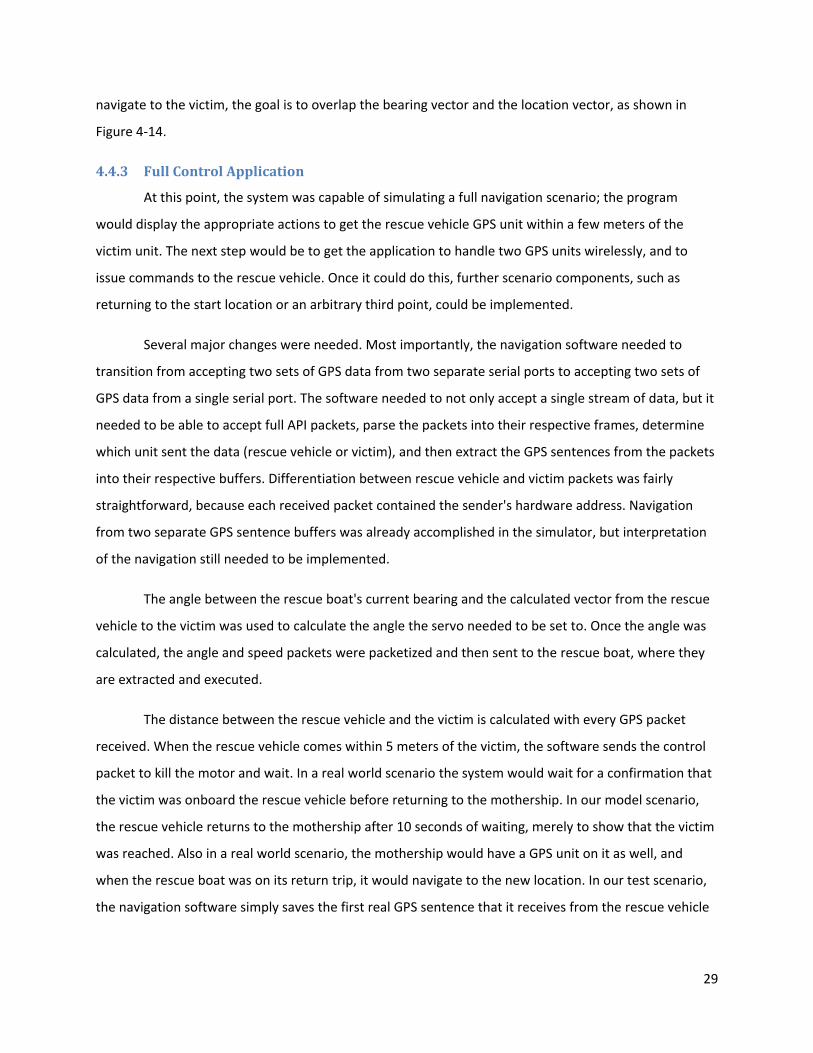
29
navigate to the victim, the goal is to overlap the bearing vector and the location vector, as shown in
Figure 4-14.
4.4.3 Full Control Application
At this point, the system was capable of simulating a full navigation scenario; the program
would display the appropriate actions to get the rescue vehicle GPS unit within a few meters of the
victim unit. The next step would be to get the application to handle two GPS units wirelessly, and to
issue commands to the rescue vehicle. Once it could do this, further scenario components, such as
returning to the start location or an arbitrary third point, could be implemented.
Several major changes were needed. Most importantly, the navigation software needed to
transition from accepting two sets of GPS data from two separate serial ports to accepting two sets of
GPS data from a single serial port. The software needed to not only accept a single stream of data, but it
needed to be able to accept full API packets, parse the packets into their respective frames, determine
which unit sent the data (rescue vehicle or victim), and then extract the GPS sentences from the packets
into their respective buffers. Differentiation between rescue vehicle and victim packets was fairly
straightforward, because each received packet contained the sender's hardware address. Navigation
from two separate GPS sentence buffers was already accomplished in the simulator, but interpretation
of the navigation still needed to be implemented.
The angle between the rescue boat's current bearing and the calculated vector from the rescue
vehicle to the victim was used to calculate the angle the servo needed to be set to. Once the angle was
calculated, the angle and speed packets were packetized and then sent to the rescue boat, where they
are extracted and executed.
The distance between the rescue vehicle and the victim is calculated with every GPS packet
received. When the rescue vehicle comes within 5 meters of the victim, the software sends the control
packet to kill the motor and wait. In a real world scenario the system would wait for a confirmation that
the victim was onboard the rescue vehicle before returning to the mothership. In our model scenario,
the rescue vehicle returns to the mothership after 10 seconds of waiting, merely to show that the victim
was reached. Also in a real world scenario, the mothership would have a GPS unit on it as well, and
when the rescue boat was on its return trip, it would navigate to the new location. In our test scenario,
the navigation software simply saves the first real GPS sentence that it receives from the rescue vehicle
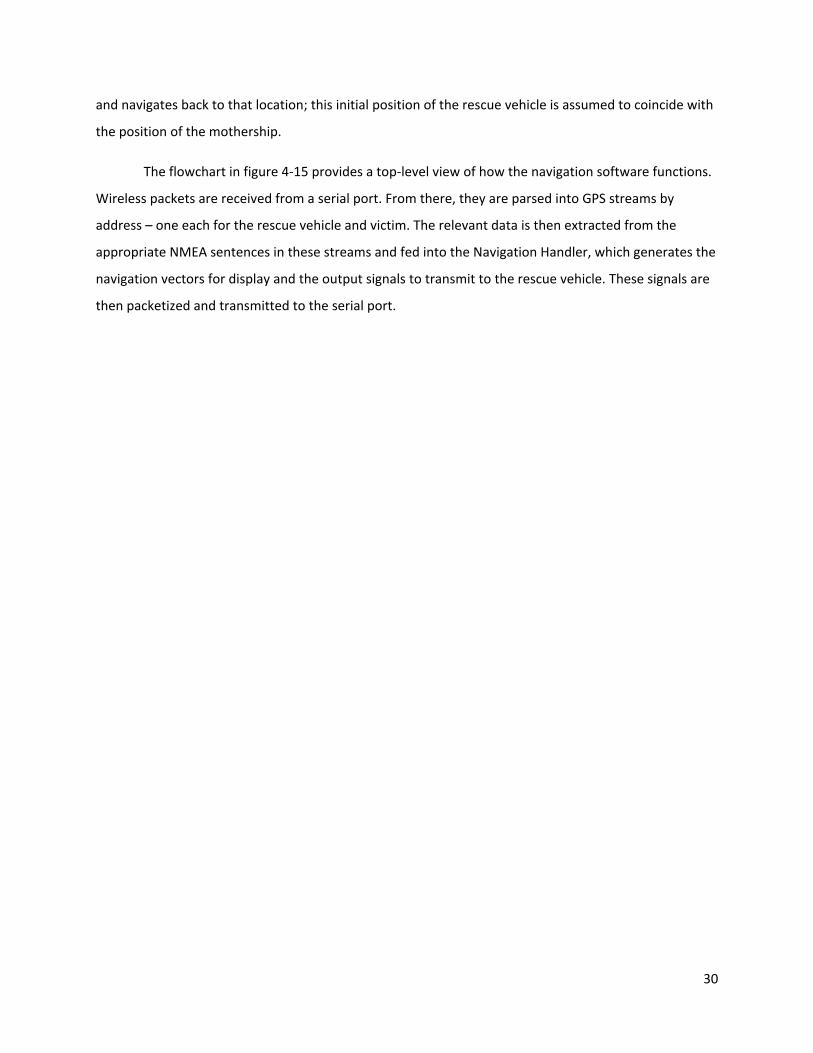
30
and navigates back to that location; this initial position of the rescue vehicle is assumed to coincide with
the position of the mothership.
The flowchart in figure 4-15 provides a top-level view of how the navigation software functions.
Wireless packets are received from a serial port. From there, they are parsed into GPS streams by
address – one each for the rescue vehicle and victim. The relevant data is then extracted from the
appropriate NMEA sentences in these streams and fed into the Navigation Handler, which generates the
navigation vectors for display and the output signals to transmit to the rescue vehicle. These signals are
then packetized and transmitted to the serial port.
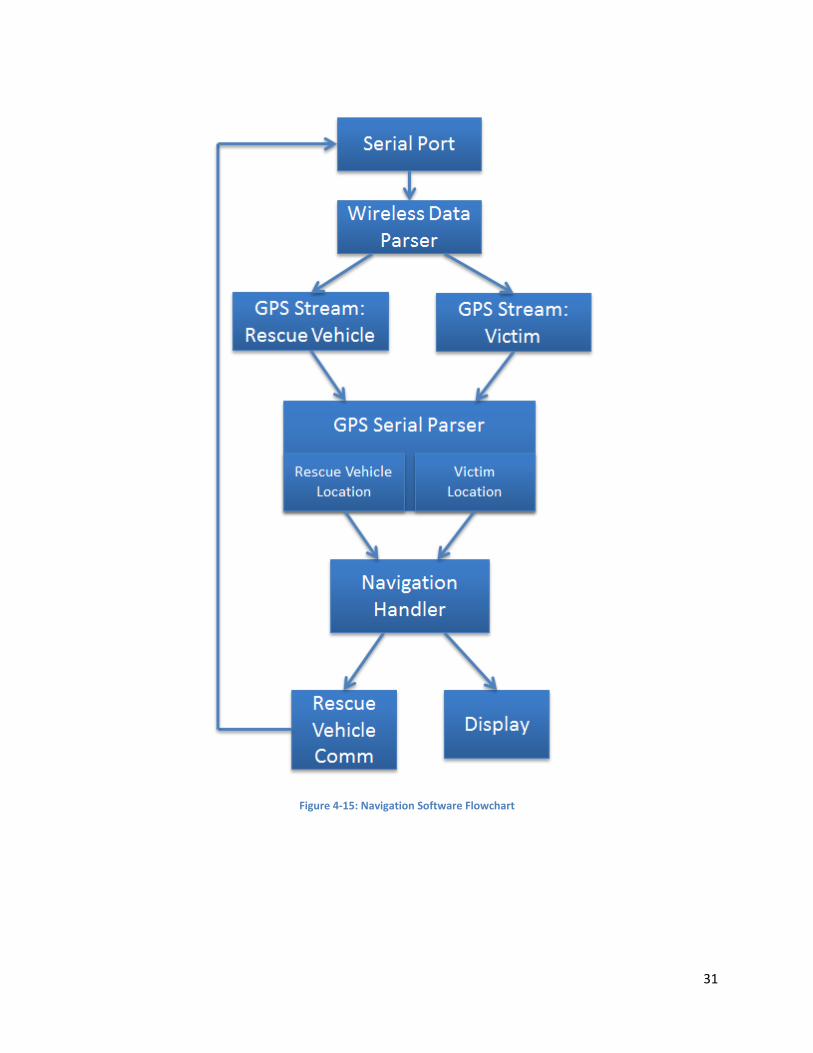
31
Figure 4-15: Navigation Software Flowchart
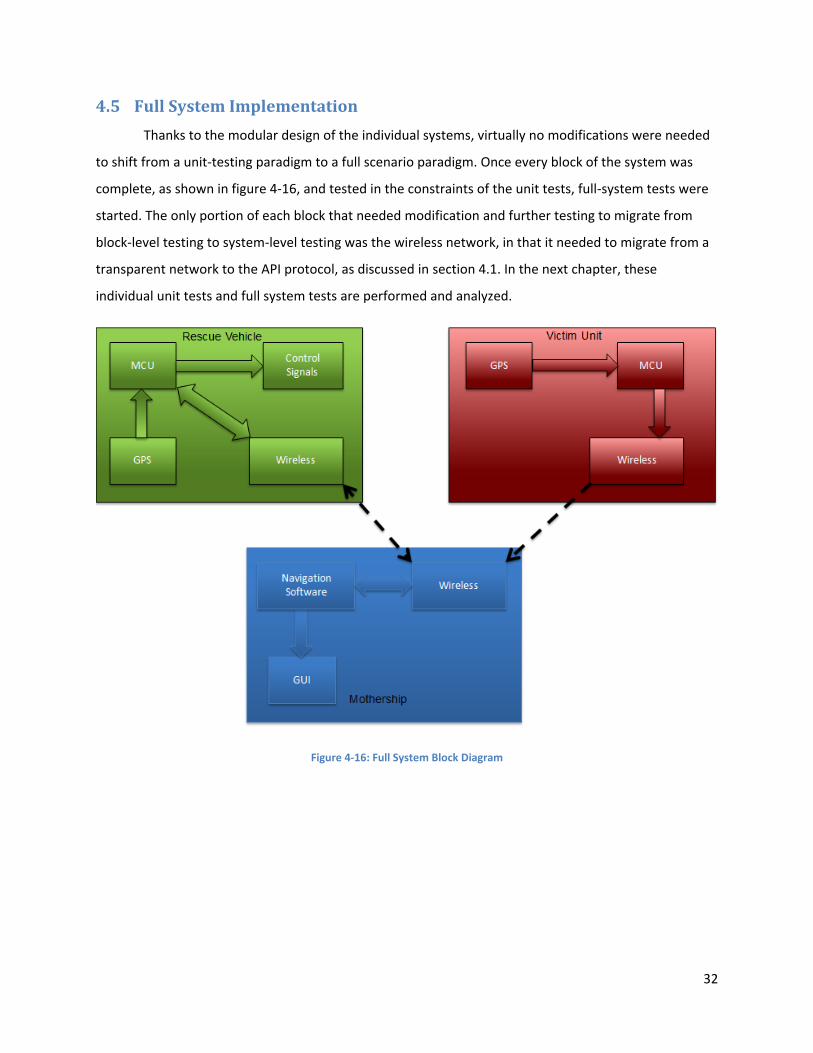
32
4.5 Full System Implementation
Thanks to the modular design of the individual systems, virtually no modifications were needed
to shift from a unit-testing paradigm to a full scenario paradigm. Once every block of the system was
complete, as shown in figure 4-16, and tested in the constraints of the unit tests, full-system tests were
started. The only portion of each block that needed modification and further testing to migrate from
block-level testing to system-level testing was the wireless network, in that it needed to migrate from a
transparent network to the API protocol, as discussed in section 4.1. In the next chapter, these
individual unit tests and full system tests are performed and analyzed.
Figure 4-16: Full System Block Diagram
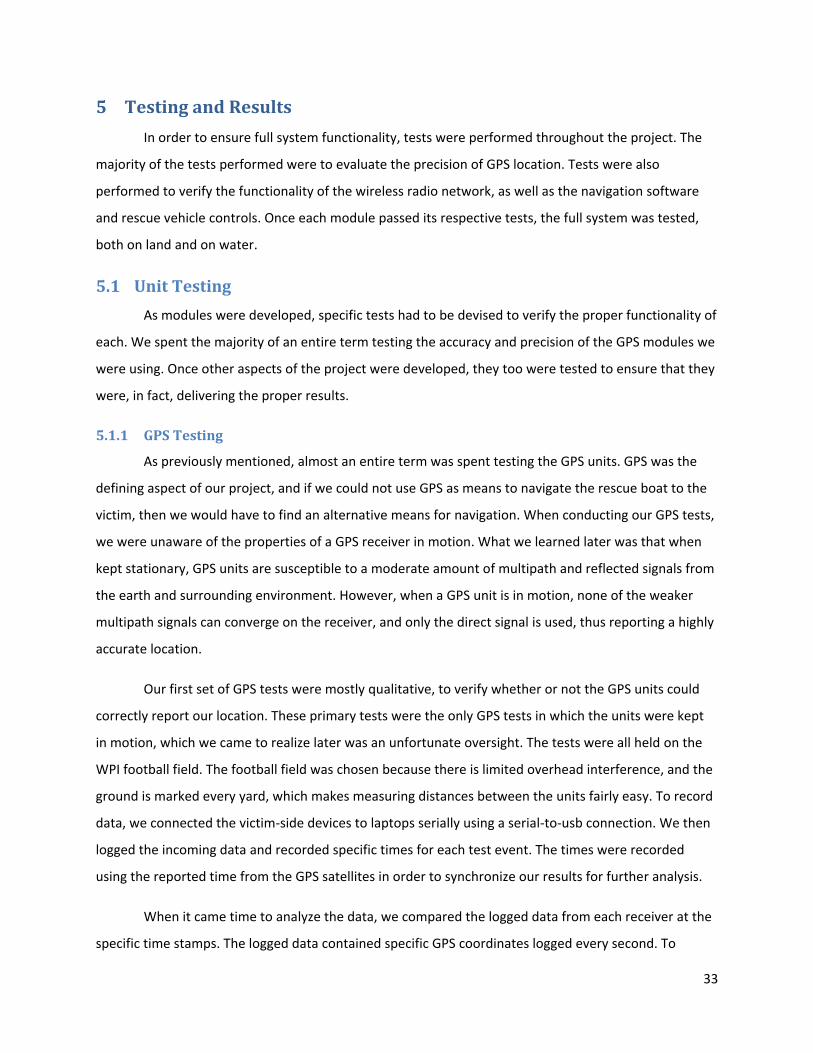
33
5 Testing and Results
In order to ensure full system functionality, tests were performed throughout the project. The
majority of the tests performed were to evaluate the precision of GPS location. Tests were also
performed to verify the functionality of the wireless radio network, as well as the navigation software
and rescue vehicle controls. Once each module passed its respective tests, the full system was tested,
both on land and on water.
5.1 Unit Testing
As modules were developed, specific tests had to be devised to verify the proper functionality of
each. We spent the majority of an entire term testing the accuracy and precision of the GPS modules we
were using. Once other aspects of the project were developed, they too were tested to ensure that they
were, in fact, delivering the proper results.
5.1.1 GPS Testing
As previously mentioned, almost an entire term was spent testing the GPS units. GPS was the
defining aspect of our project, and if we could not use GPS as means to navigate the rescue boat to the
victim, then we would have to find an alternative means for navigation. When conducting our GPS tests,
we were unaware of the properties of a GPS receiver in motion. What we learned later was that when
kept stationary, GPS units are susceptible to a moderate amount of multipath and reflected signals from
the earth and surrounding environment. However, when a GPS unit is in motion, none of the weaker
multipath signals can converge on the receiver, and only the direct signal is used, thus reporting a highly
accurate location.
Our first set of GPS tests were mostly qualitative, to verify whether or not the GPS units could
correctly report our location. These primary tests were the only GPS tests in which the units were kept
in motion, which we came to realize later was an unfortunate oversight. The tests were all held on the
WPI football field. The football field was chosen because there is limited overhead interference, and the
ground is marked every yard, which makes measuring distances between the units fairly easy. To record
data, we connected the victim-side devices to laptops serially using a serial-to-usb connection. We then
logged the incoming data and recorded specific times for each test event. The times were recorded
using the reported time from the GPS satellites in order to synchronize our results for further analysis.
When it came time to analyze the data, we compared the logged data from each receiver at the
specific time stamps. The logged data contained specific GPS coordinates logged every second. To
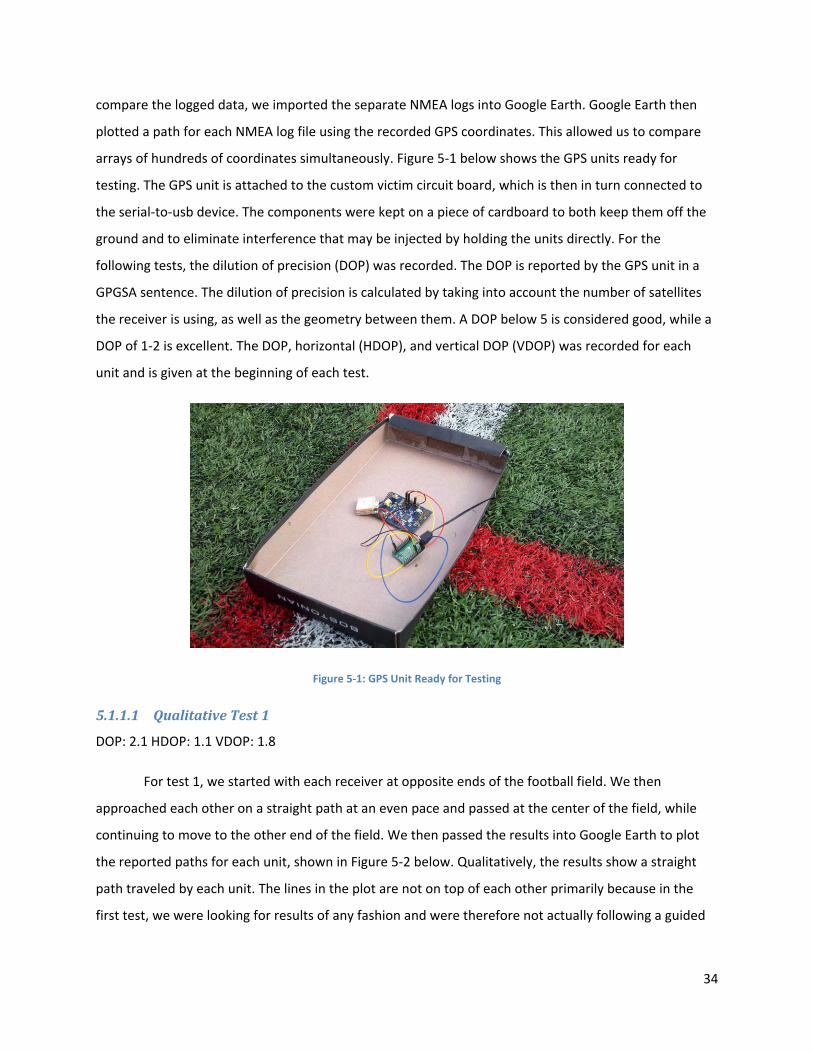
34
compare the logged data, we imported the separate NMEA logs into Google Earth. Google Earth then
plotted a path for each NMEA log file using the recorded GPS coordinates. This allowed us to compare
arrays of hundreds of coordinates simultaneously. Figure 5-1 below shows the GPS units ready for
testing. The GPS unit is attached to the custom victim circuit board, which is then in turn connected to
the serial-to-usb device. The components were kept on a piece of cardboard to both keep them off the
ground and to eliminate interference that may be injected by holding the units directly. For the
following tests, the dilution of precision (DOP) was recorded. The DOP is reported by the GPS unit in a
GPGSA sentence. The dilution of precision is calculated by taking into account the number of satellites
the receiver is using, as well as the geometry between them. A DOP below 5 is considered good, while a
DOP of 1-2 is excellent. The DOP, horizontal (HDOP), and vertical DOP (VDOP) was recorded for each
unit and is given at the beginning of each test.
Figure 5-1: GPS Unit Ready for Testing
5.1.1.1 Qualitative Test 1
DOP: 2.1 HDOP: 1.1 VDOP: 1.8
For test 1, we started with each receiver at opposite ends of the football field. We then
approached each other on a straight path at an even pace and passed at the center of the field, while
continuing to move to the other end of the field. We then passed the results into Google Earth to plot
the reported paths for each unit, shown in Figure 5-2 below. Qualitatively, the results show a straight
path traveled by each unit. The lines in the plot are not on top of each other primarily because in the
first test, we were looking for results of any fashion and were therefore not actually following a guided
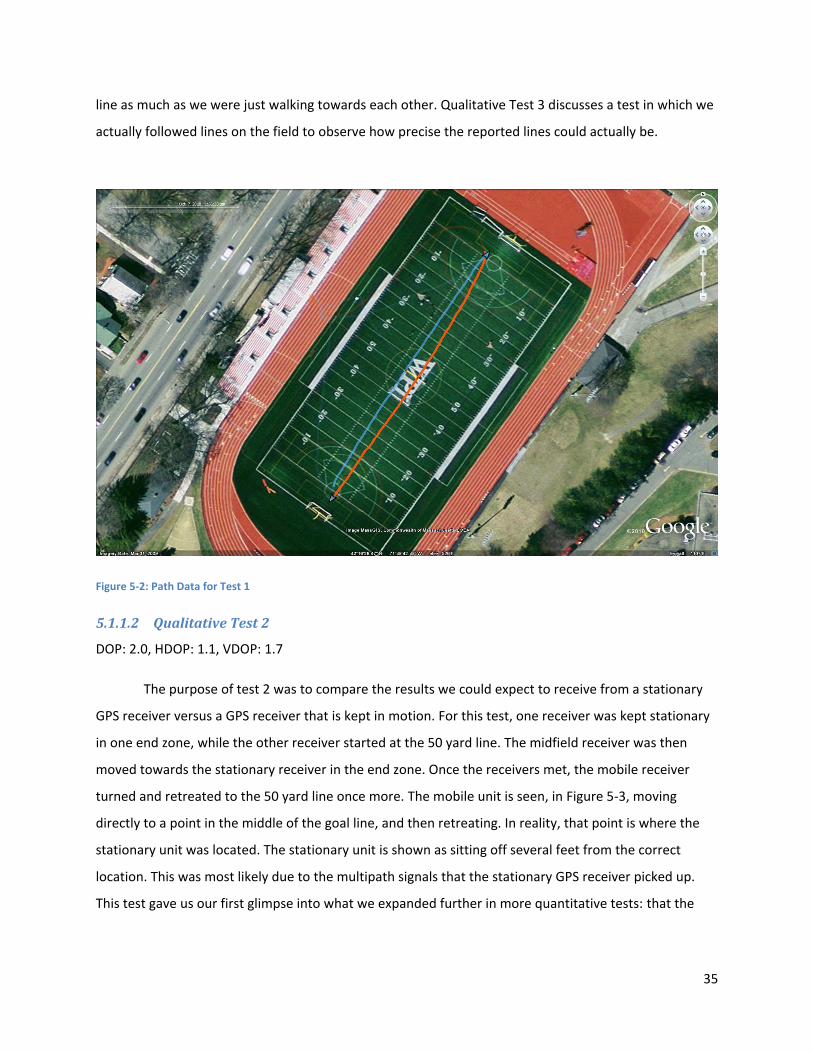
35
line as much as we were just walking towards each other. Qualitative Test 3 discusses a test in which we
actually followed lines on the field to observe how precise the reported lines could actually be.
Figure 5-2: Path Data for Test 1
5.1.1.2 Qualitative Test 2
DOP: 2.0, HDOP: 1.1, VDOP: 1.7
The purpose of test 2 was to compare the results we could expect to receive from a stationary
GPS receiver versus a GPS receiver that is kept in motion. For this test, one receiver was kept stationary
in one end zone, while the other receiver started at the 50 yard line. The midfield receiver was then
moved towards the stationary receiver in the end zone. Once the receivers met, the mobile receiver
turned and retreated to the 50 yard line once more. The mobile unit is seen, in Figure 5-3, moving
directly to a point in the middle of the goal line, and then retreating. In reality, that point is where the
stationary unit was located. The stationary unit is shown as sitting off several feet from the correct
location. This was most likely due to the multipath signals that the stationary GPS receiver picked up.
This test gave us our first glimpse into what we expanded further in more quantitative tests: that the
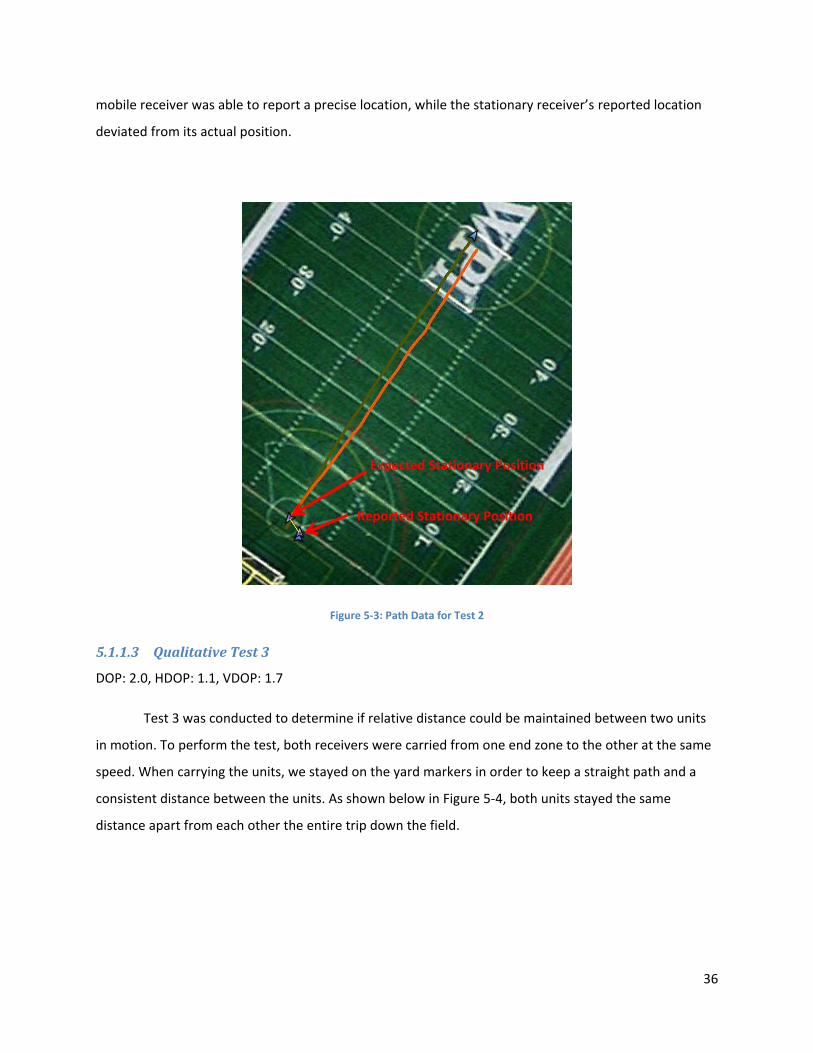
36
mobile receiver was able to report a precise location, while the stationary receiver’s reported location
deviated from its actual position.
Figure 5-3: Path Data for Test 2
5.1.1.3 Qualitative Test 3
DOP: 2.0, HDOP: 1.1, VDOP: 1.7
Test 3 was conducted to determine if relative distance could be maintained between two units
in motion. To perform the test, both receivers were carried from one end zone to the other at the same
speed. When carrying the units, we stayed on the yard markers in order to keep a straight path and a
consistent distance between the units. As shown below in Figure 5-4, both units stayed the same
distance apart from each other the entire trip down the field.
Reported Stationary Position
Expected Stationary Position
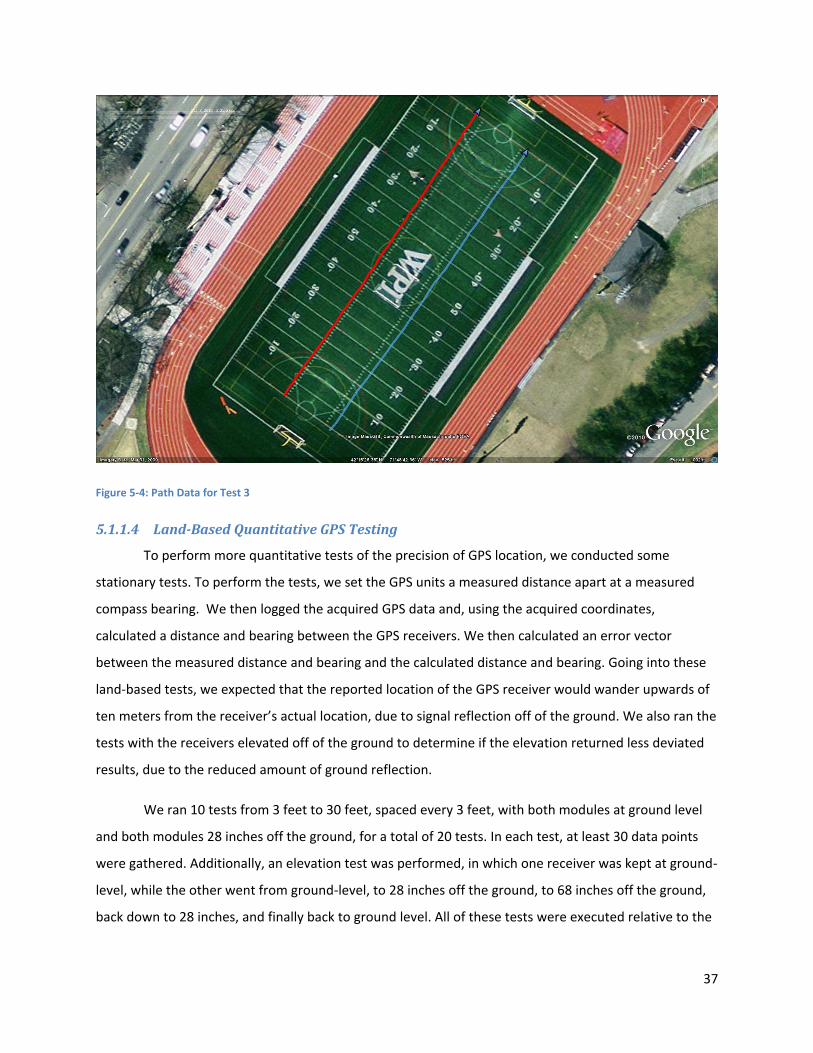
37
Figure 5-4: Path Data for Test 3
5.1.1.4 Land-Based Quantitative GPS Testing
To perform more quantitative tests of the precision of GPS location, we conducted some
stationary tests. To perform the tests, we set the GPS units a measured distance apart at a measured
compass bearing. We then logged the acquired GPS data and, using the acquired coordinates,
calculated a distance and bearing between the GPS receivers. We then calculated an error vector
between the measured distance and bearing and the calculated distance and bearing. Going into these
land-based tests, we expected that the reported location of the GPS receiver would wander upwards of
ten meters from the receiver’s actual location, due to signal reflection off of the ground. We also ran the
tests with the receivers elevated off of the ground to determine if the elevation returned less deviated
results, due to the reduced amount of ground reflection.
We ran 10 tests from 3 feet to 30 feet, spaced every 3 feet, with both modules at ground level
and both modules 28 inches off the ground, for a total of 20 tests. In each test, at least 30 data points
were gathered. Additionally, an elevation test was performed, in which one receiver was kept at ground-
level, while the other went from ground-level, to 28 inches off the ground, to 68 inches off the ground,
back down to 28 inches, and finally back to ground level. All of these tests were executed relative to the
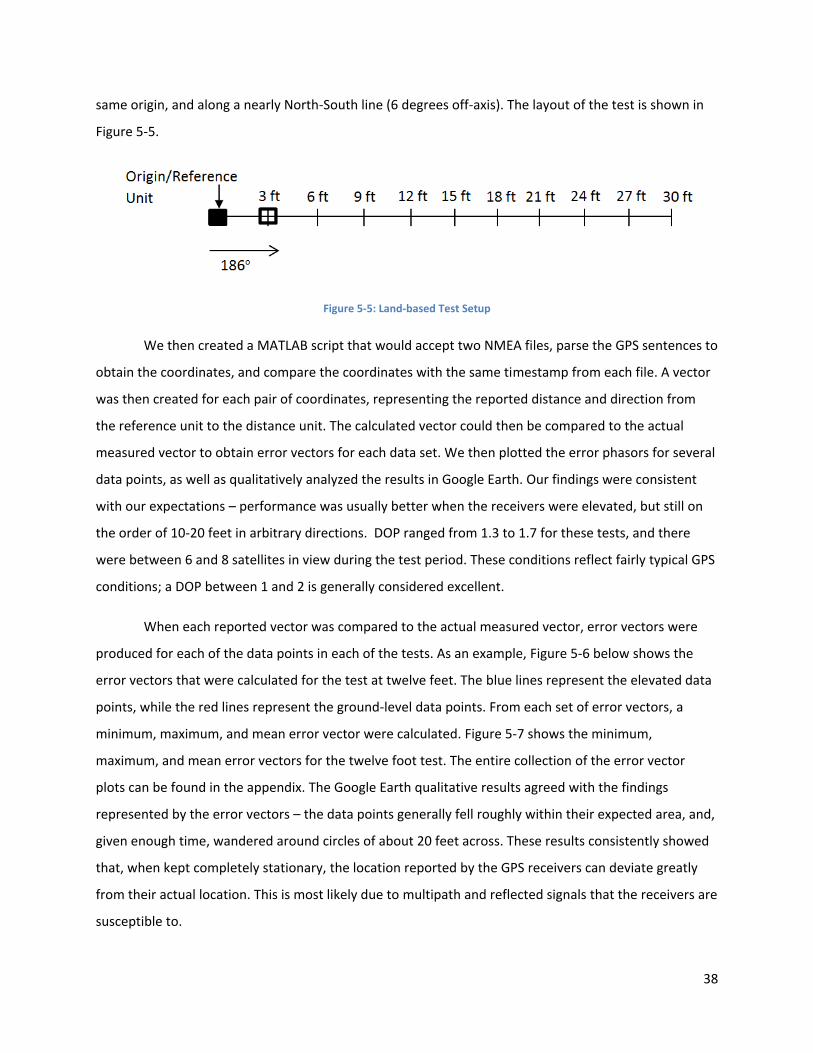
38
same origin, and along a nearly North-South line (6 degrees off-axis). The layout of the test is shown in
Figure 5-5.
Figure 5-5: Land-based Test Setup
We then created a MATLAB script that would accept two NMEA files, parse the GPS sentences to
obtain the coordinates, and compare the coordinates with the same timestamp from each file. A vector
was then created for each pair of coordinates, representing the reported distance and direction from
the reference unit to the distance unit. The calculated vector could then be compared to the actual
measured vector to obtain error vectors for each data set. We then plotted the error phasors for several
data points, as well as qualitatively analyzed the results in Google Earth. Our findings were consistent
with our expectations – performance was usually better when the receivers were elevated, but still on
the order of 10-20 feet in arbitrary directions. DOP ranged from 1.3 to 1.7 for these tests, and there
were between 6 and 8 satellites in view during the test period. These conditions reflect fairly typical GPS
conditions; a DOP between 1 and 2 is generally considered excellent.
When each reported vector was compared to the actual measured vector, error vectors were
produced for each of the data points in each of the tests. As an example, Figure 5-6 below shows the
error vectors that were calculated for the test at twelve feet. The blue lines represent the elevated data
points, while the red lines represent the ground-level data points. From each set of error vectors, a
minimum, maximum, and mean error vector were calculated. Figure 5-7 shows the minimum,
maximum, and mean error vectors for the twelve foot test. The entire collection of the error vector
plots can be found in the appendix. The Google Earth qualitative results agreed with the findings
represented by the error vectors – the data points generally fell roughly within their expected area, and,
given enough time, wandered around circles of about 20 feet across. These results consistently showed
that, when kept completely stationary, the location reported by the GPS receivers can deviate greatly
from their actual location. This is most likely due to multipath and reflected signals that the receivers are
susceptible to.
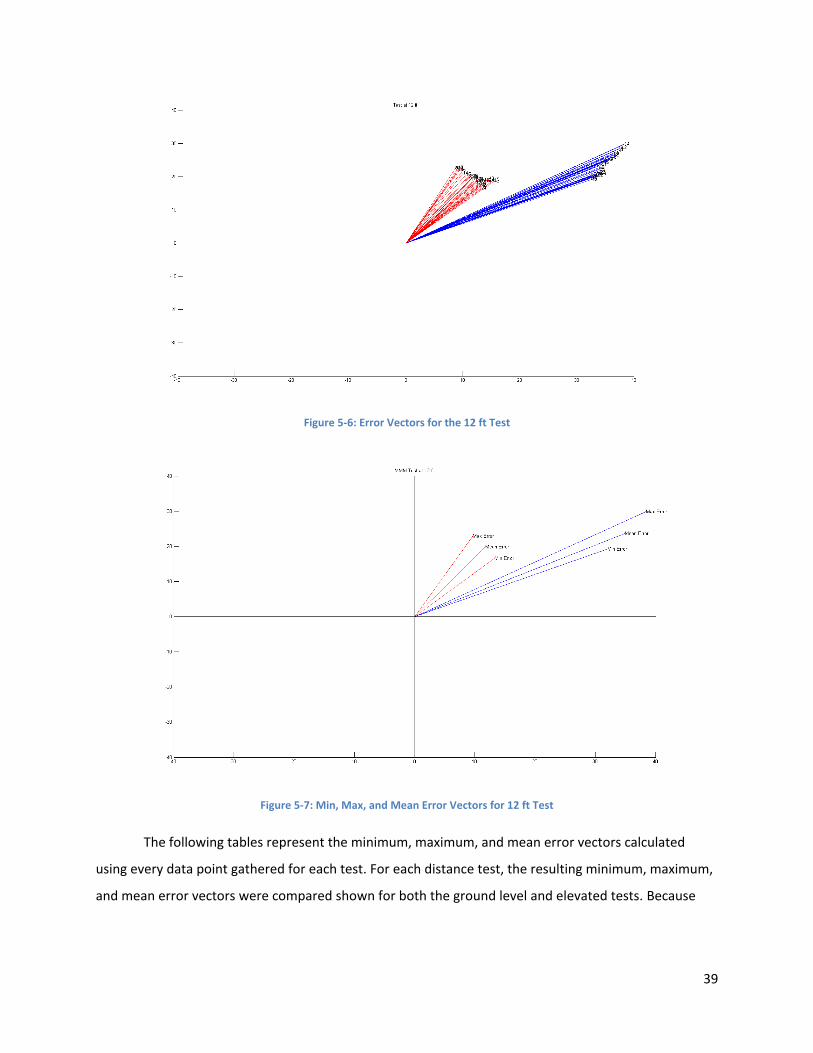
39
Figure 5-6: Error Vectors for the 12 ft Test
Figure 5-7: Min, Max, and Mean Error Vectors for 12 ft Test
The following tables represent the minimum, maximum, and mean error vectors calculated
using every data point gathered for each test. For each distance test, the resulting minimum, maximum,
and mean error vectors were compared shown for both the ground level and elevated tests. Because
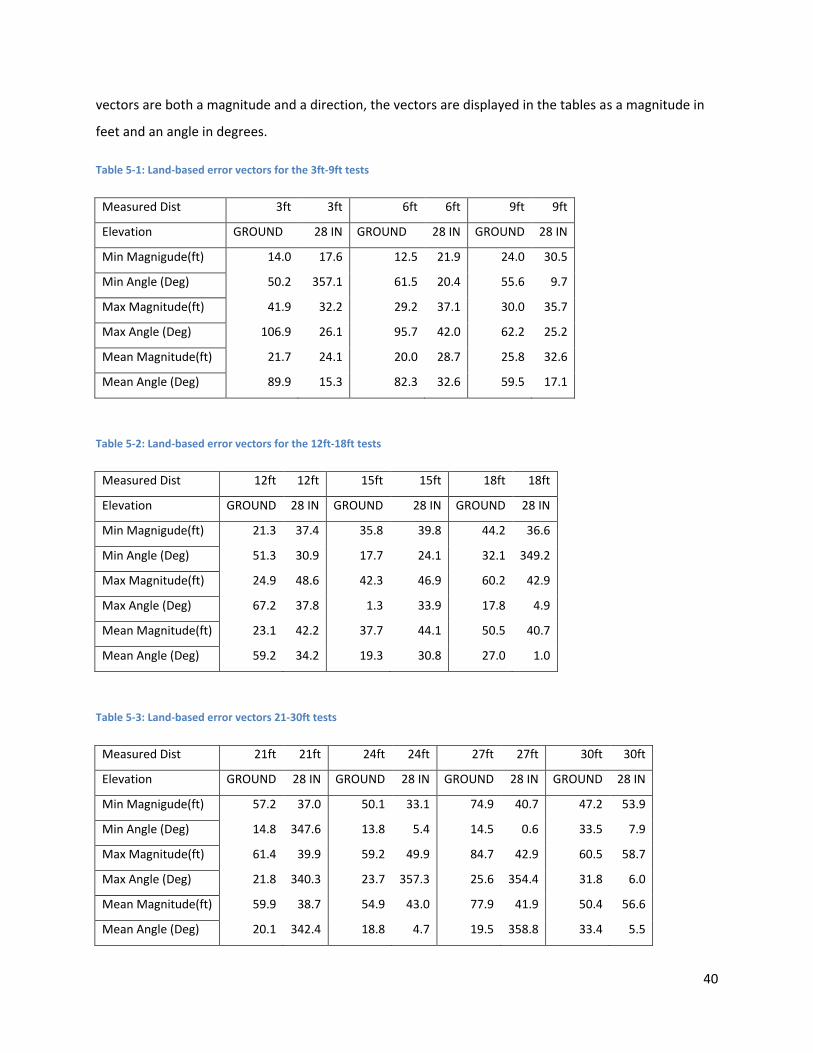
40
vectors are both a magnitude and a direction, the vectors are displayed in the tables as a magnitude in
feet and an angle in degrees.
Table 5-1: Land-based error vectors for the 3ft-9ft tests
Measured Dist 3ft 3ft 6ft 6ft 9ft 9ft
Elevation GROUND 28 IN GROUND 28 IN GROUND 28 IN
Min Magnigude(ft) 14.0 17.6 12.5 21.9 24.0 30.5
Min Angle (Deg) 50.2 357.1 61.5 20.4 55.6 9.7
Max Magnitude(ft) 41.9 32.2 29.2 37.1 30.0 35.7
Max Angle (Deg) 106.9 26.1 95.7 42.0 62.2 25.2
Mean Magnitude(ft) 21.7 24.1 20.0 28.7 25.8 32.6
Mean Angle (Deg) 89.9 15.3 82.3 32.6 59.5 17.1
Table 5-2: Land-based error vectors for the 12ft-18ft tests
Measured Dist 12ft 12ft 15ft 15ft 18ft 18ft
Elevation GROUND 28 IN GROUND 28 IN GROUND 28 IN
Min Magnigude(ft) 21.3 37.4 35.8 39.8 44.2 36.6
Min Angle (Deg) 51.3 30.9 17.7 24.1 32.1 349.2
Max Magnitude(ft) 24.9 48.6 42.3 46.9 60.2 42.9
Max Angle (Deg) 67.2 37.8 1.3 33.9 17.8 4.9
Mean Magnitude(ft) 23.1 42.2 37.7 44.1 50.5 40.7
Mean Angle (Deg) 59.2 34.2 19.3 30.8 27.0 1.0
Table 5-3: Land-based error vectors 21-30ft tests
Measured Dist 21ft 21ft 24ft 24ft 27ft 27ft 30ft 30ft
Elevation GROUND 28 IN GROUND 28 IN GROUND 28 IN GROUND 28 IN
Min Magnigude(ft) 57.2 37.0 50.1 33.1 74.9 40.7 47.2 53.9
Min Angle (Deg) 14.8 347.6 13.8 5.4 14.5 0.6 33.5 7.9
Max Magnitude(ft) 61.4 39.9 59.2 49.9 84.7 42.9 60.5 58.7
Max Angle (Deg) 21.8 340.3 23.7 357.3 25.6 354.4 31.8 6.0
Mean Magnitude(ft) 59.9 38.7 54.9 43.0 77.9 41.9 50.4 56.6
Mean Angle (Deg) 20.1 342.4 18.8 4.7 19.5 358.8 33.4 5.5
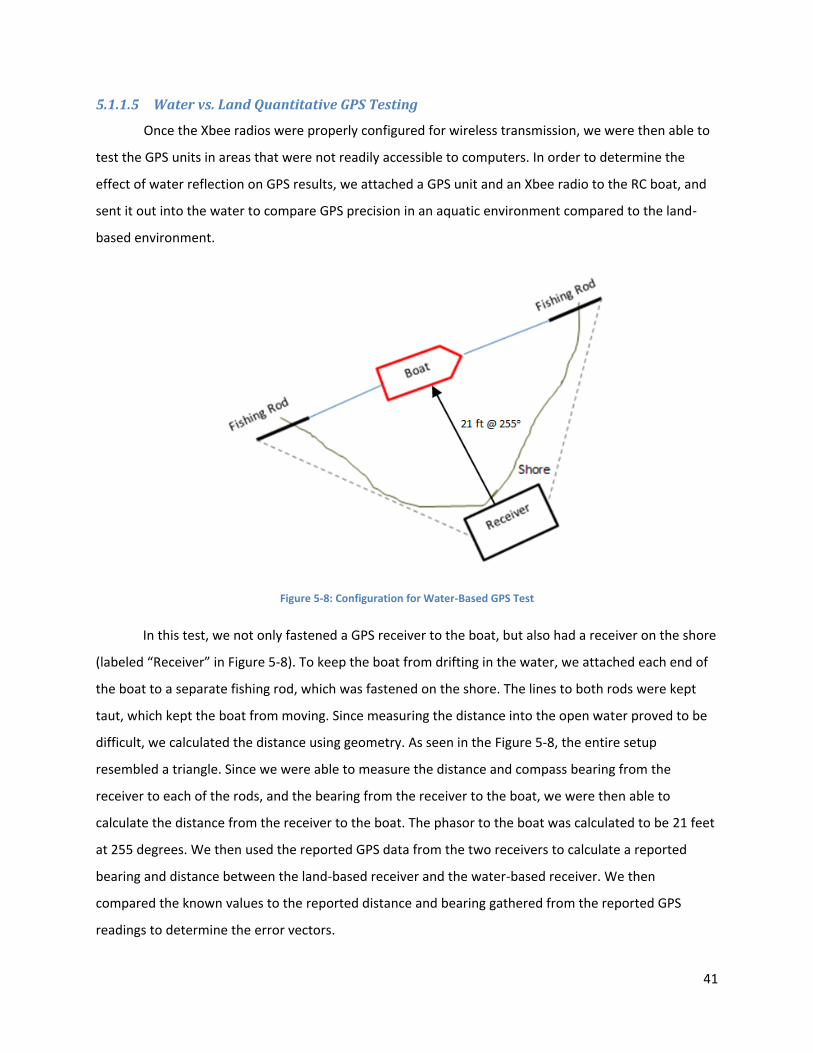
41
5.1.1.5 Water vs. Land Quantitative GPS Testing
Once the Xbee radios were properly configured for wireless transmission, we were then able to
test the GPS units in areas that were not readily accessible to computers. In order to determine the
effect of water reflection on GPS results, we attached a GPS unit and an Xbee radio to the RC boat, and
sent it out into the water to compare GPS precision in an aquatic environment compared to the land-
based environment.
Figure 5-8: Configuration for Water-Based GPS Test
In this test, we not only fastened a GPS receiver to the boat, but also had a receiver on the shore
(labeled “Receiver” in Figure 5-8). To keep the boat from drifting in the water, we attached each end of
the boat to a separate fishing rod, which was fastened on the shore. The lines to both rods were kept
taut, which kept the boat from moving. Since measuring the distance into the open water proved to be
difficult, we calculated the distance using geometry. As seen in the Figure 5-8, the entire setup
resembled a triangle. Since we were able to measure the distance and compass bearing from the
receiver to each of the rods, and the bearing from the receiver to the boat, we were then able to
calculate the distance from the receiver to the boat. The phasor to the boat was calculated to be 21 feet
at 255 degrees. We then used the reported GPS data from the two receivers to calculate a reported
bearing and distance between the land-based receiver and the water-based receiver. We then
compared the known values to the reported distance and bearing gathered from the reported GPS
readings to determine the error vectors.
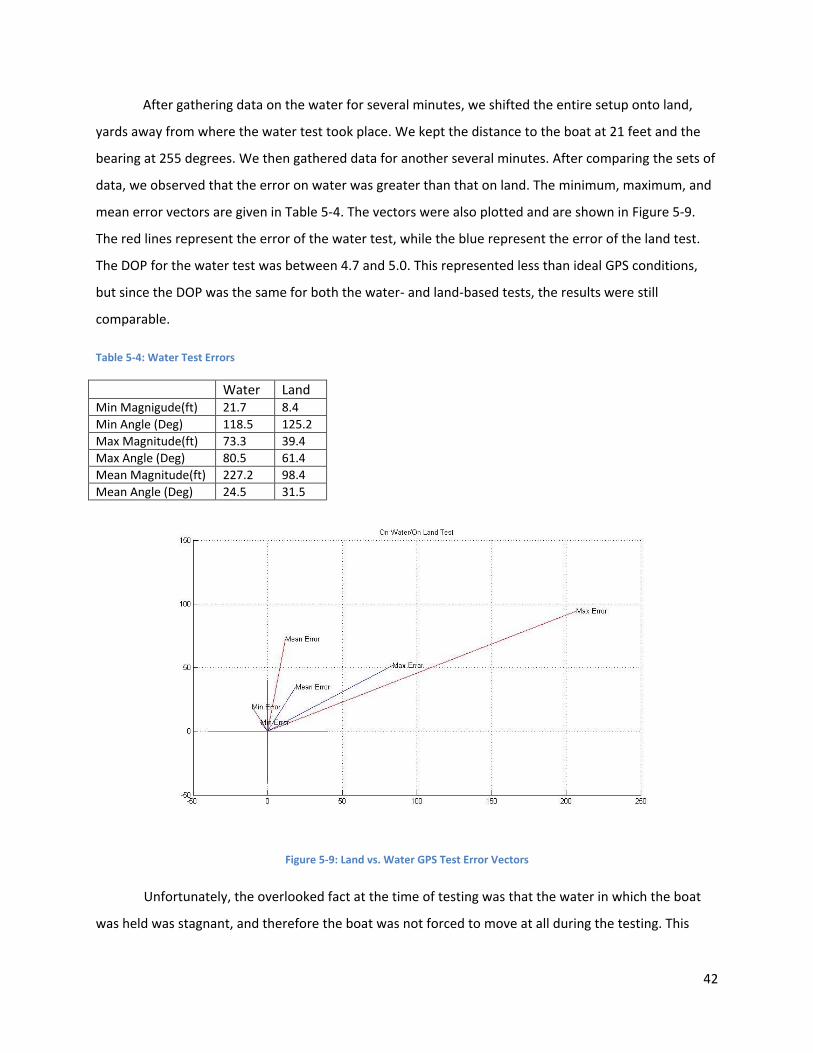
42
After gathering data on the water for several minutes, we shifted the entire setup onto land,
yards away from where the water test took place. We kept the distance to the boat at 21 feet and the
bearing at 255 degrees. We then gathered data for another several minutes. After comparing the sets of
data, we observed that the error on water was greater than that on land. The minimum, maximum, and
mean error vectors are given in Table 5-4. The vectors were also plotted and are shown in Figure 5-9.
The red lines represent the error of the water test, while the blue represent the error of the land test.
The DOP for the water test was between 4.7 and 5.0. This represented less than ideal GPS conditions,
but since the DOP was the same for both the water- and land-based tests, the results were still
comparable.
Table 5-4: Water Test Errors
Water Land Min Magnigude(ft) 21.7 8.4 Min Angle (Deg) 118.5 125.2 Max Magnitude(ft) 73.3 39.4 Max Angle (Deg) 80.5 61.4 Mean Magnitude(ft) 227.2 98.4 Mean Angle (Deg) 24.5 31.5
Figure 5-9: Land vs. Water GPS Test Error Vectors
Unfortunately, the overlooked fact at the time of testing was that the water in which the boat
was held was stagnant, and therefore the boat was not forced to move at all during the testing. This
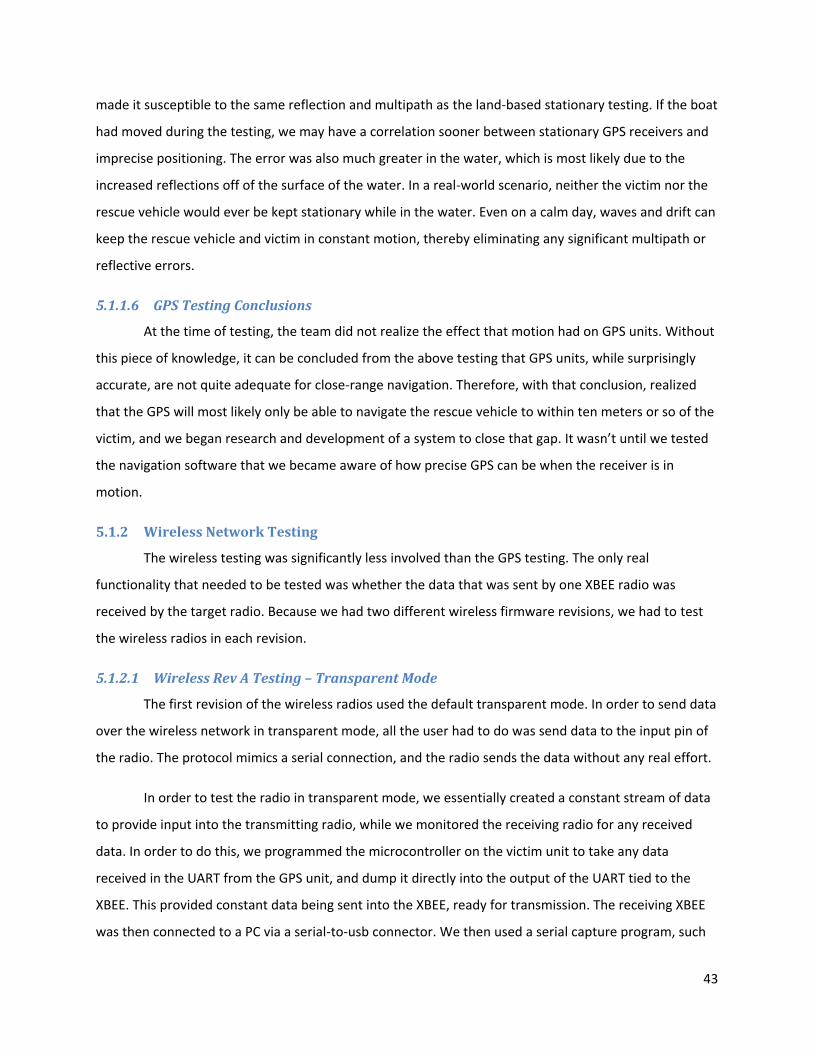
43
made it susceptible to the same reflection and multipath as the land-based stationary testing. If the boat
had moved during the testing, we may have a correlation sooner between stationary GPS receivers and
imprecise positioning. The error was also much greater in the water, which is most likely due to the
increased reflections off of the surface of the water. In a real-world scenario, neither the victim nor the
rescue vehicle would ever be kept stationary while in the water. Even on a calm day, waves and drift can
keep the rescue vehicle and victim in constant motion, thereby eliminating any significant multipath or
reflective errors.
5.1.1.6 GPS Testing Conclusions
At the time of testing, the team did not realize the effect that motion had on GPS units. Without
this piece of knowledge, it can be concluded from the above testing that GPS units, while surprisingly
accurate, are not quite adequate for close-range navigation. Therefore, with that conclusion, realized
that the GPS will most likely only be able to navigate the rescue vehicle to within ten meters or so of the
victim, and we began research and development of a system to close that gap. It wasn’t until we tested
the navigation software that we became aware of how precise GPS can be when the receiver is in
motion.
5.1.2 Wireless Network Testing
The wireless testing was significantly less involved than the GPS testing. The only real
functionality that needed to be tested was whether the data that was sent by one XBEE radio was
received by the target radio. Because we had two different wireless firmware revisions, we had to test
the wireless radios in each revision.
5.1.2.1 Wireless Rev A Testing – Transparent Mode
The first revision of the wireless radios used the default transparent mode. In order to send data
over the wireless network in transparent mode, all the user had to do was send data to the input pin of
the radio. The protocol mimics a serial connection, and the radio sends the data without any real effort.
In order to test the radio in transparent mode, we essentially created a constant stream of data
to provide input into the transmitting radio, while we monitored the receiving radio for any received
data. In order to do this, we programmed the microcontroller on the victim unit to take any data
received in the UART from the GPS unit, and dump it directly into the output of the UART tied to the
XBEE. This provided constant data being sent into the XBEE, ready for transmission. The receiving XBEE
was then connected to a PC via a serial-to-usb connector. We then used a serial capture program, such
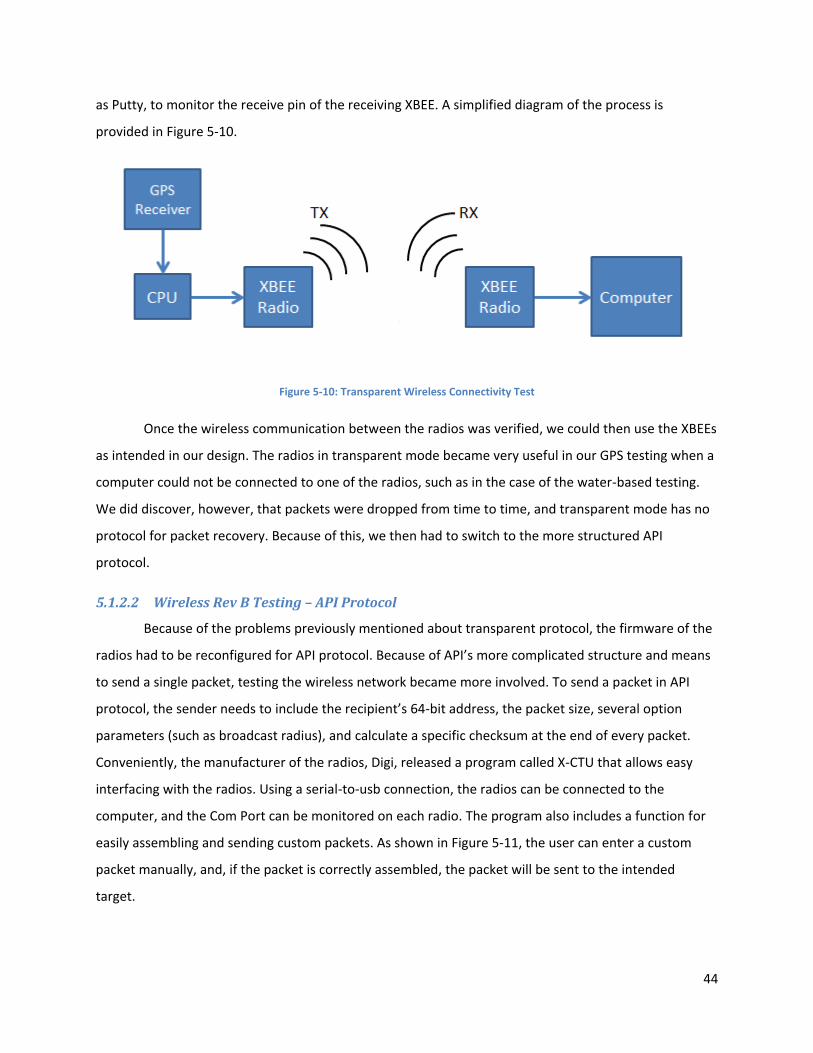
44
as Putty, to monitor the receive pin of the receiving XBEE. A simplified diagram of the process is
provided in Figure 5-10.
Figure 5-10: Transparent Wireless Connectivity Test
Once the wireless communication between the radios was verified, we could then use the XBEEs
as intended in our design. The radios in transparent mode became very useful in our GPS testing when a
computer could not be connected to one of the radios, such as in the case of the water-based testing.
We did discover, however, that packets were dropped from time to time, and transparent mode has no
protocol for packet recovery. Because of this, we then had to switch to the more structured API
protocol.
5.1.2.2 Wireless Rev B Testing – API Protocol
Because of the problems previously mentioned about transparent protocol, the firmware of the
radios had to be reconfigured for API protocol. Because of API’s more complicated structure and means
to send a single packet, testing the wireless network became more involved. To send a packet in API
protocol, the sender needs to include the recipient’s 64-bit address, the packet size, several option
parameters (such as broadcast radius), and calculate a specific checksum at the end of every packet.
Conveniently, the manufacturer of the radios, Digi, released a program called X-CTU that allows easy
interfacing with the radios. Using a serial-to-usb connection, the radios can be connected to the
computer, and the Com Port can be monitored on each radio. The program also includes a function for
easily assembling and sending custom packets. As shown in Figure 5-11, the user can enter a custom
packet manually, and, if the packet is correctly assembled, the packet will be sent to the intended
target.
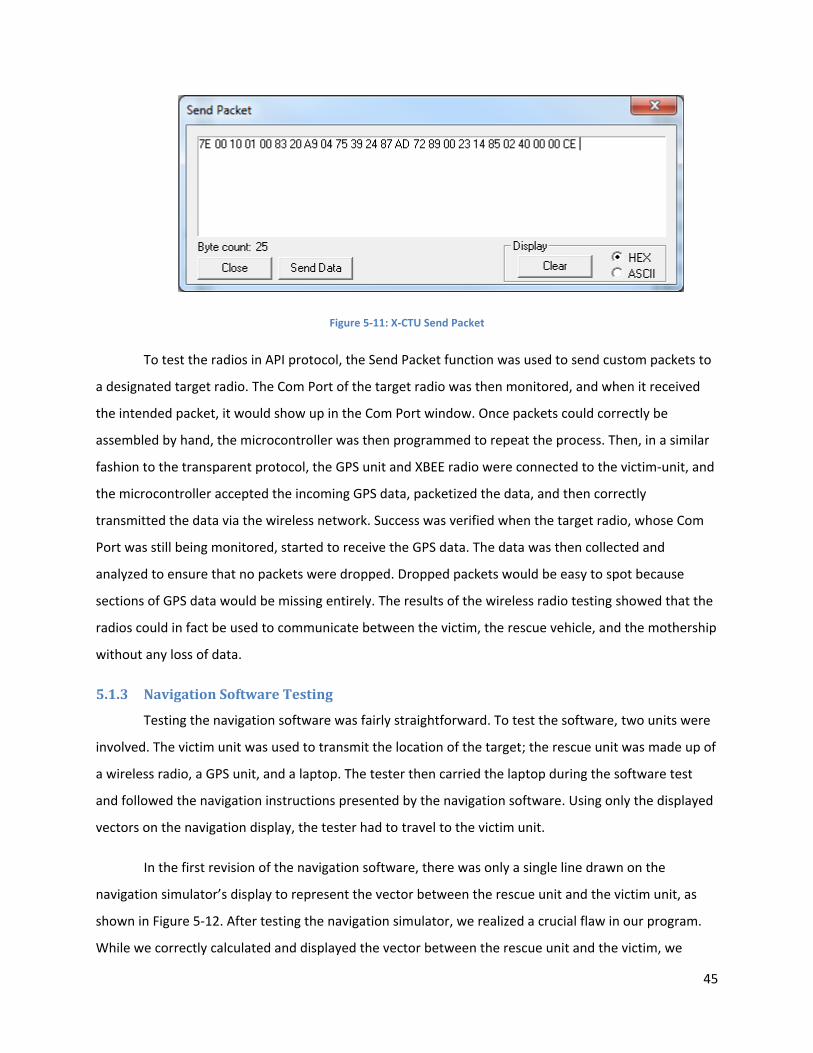
45
Figure 5-11: X-CTU Send Packet
To test the radios in API protocol, the Send Packet function was used to send custom packets to
a designated target radio. The Com Port of the target radio was then monitored, and when it received
the intended packet, it would show up in the Com Port window. Once packets could correctly be
assembled by hand, the microcontroller was then programmed to repeat the process. Then, in a similar
fashion to the transparent protocol, the GPS unit and XBEE radio were connected to the victim-unit, and
the microcontroller accepted the incoming GPS data, packetized the data, and then correctly
transmitted the data via the wireless network. Success was verified when the target radio, whose Com
Port was still being monitored, started to receive the GPS data. The data was then collected and
analyzed to ensure that no packets were dropped. Dropped packets would be easy to spot because
sections of GPS data would be missing entirely. The results of the wireless radio testing showed that the
radios could in fact be used to communicate between the victim, the rescue vehicle, and the mothership
without any loss of data.
5.1.3 Navigation Software Testing
Testing the navigation software was fairly straightforward. To test the software, two units were
involved. The victim unit was used to transmit the location of the target; the rescue unit was made up of
a wireless radio, a GPS unit, and a laptop. The tester then carried the laptop during the software test
and followed the navigation instructions presented by the navigation software. Using only the displayed
vectors on the navigation display, the tester had to travel to the victim unit.
In the first revision of the navigation software, there was only a single line drawn on the
navigation simulator’s display to represent the vector between the rescue unit and the victim unit, as
shown in Figure 5-12. After testing the navigation simulator, we realized a crucial flaw in our program.
While we correctly calculated and displayed the vector between the rescue unit and the victim, we
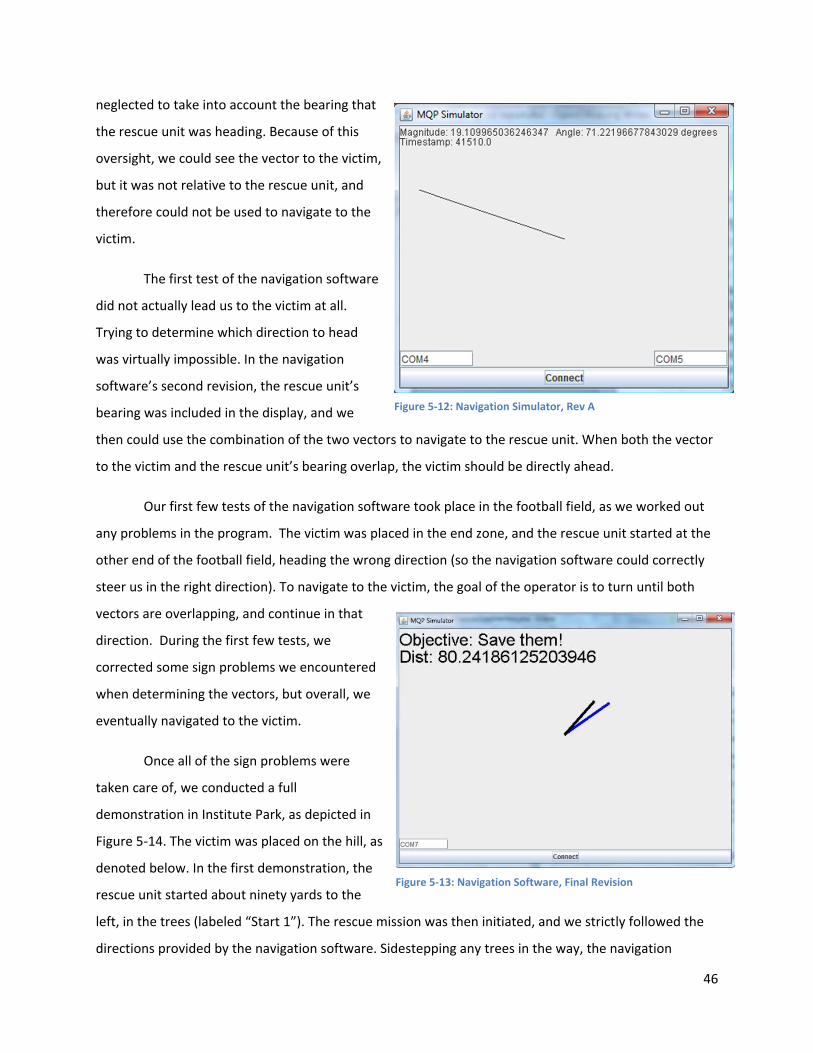
46
neglected to take into account the bearing that
the rescue unit was heading. Because of this
oversight, we could see the vector to the victim,
but it was not relative to the rescue unit, and
therefore could not be used to navigate to the
victim.
The first test of the navigation software
did not actually lead us to the victim at all.
Trying to determine which direction to head
was virtually impossible. In the navigation
software’s second revision, the rescue unit’s
bearing was included in the display, and we
then could use the combination of the two vectors to navigate to the rescue unit. When both the vector
to the victim and the rescue unit’s bearing overlap, the victim should be directly ahead.
Our first few tests of the navigation software took place in the football field, as we worked out
any problems in the program. The victim was placed in the end zone, and the rescue unit started at the
other end of the football field, heading the wrong direction (so the navigation software could correctly
steer us in the right direction). To navigate to the victim, the goal of the operator is to turn until both
vectors are overlapping, and continue in that
direction. During the first few tests, we
corrected some sign problems we encountered
when determining the vectors, but overall, we
eventually navigated to the victim.
Once all of the sign problems were
taken care of, we conducted a full
demonstration in Institute Park, as depicted in
Figure 5-14. The victim was placed on the hill, as
denoted below. In the first demonstration, the
rescue unit started about ninety yards to the
left, in the trees (labeled “Start 1”). The rescue mission was then initiated, and we strictly followed the
directions provided by the navigation software. Sidestepping any trees in the way, the navigation
Figure 5-13: Navigation Software, Final Revision
Figure 5-12: Navigation Simulator, Rev A
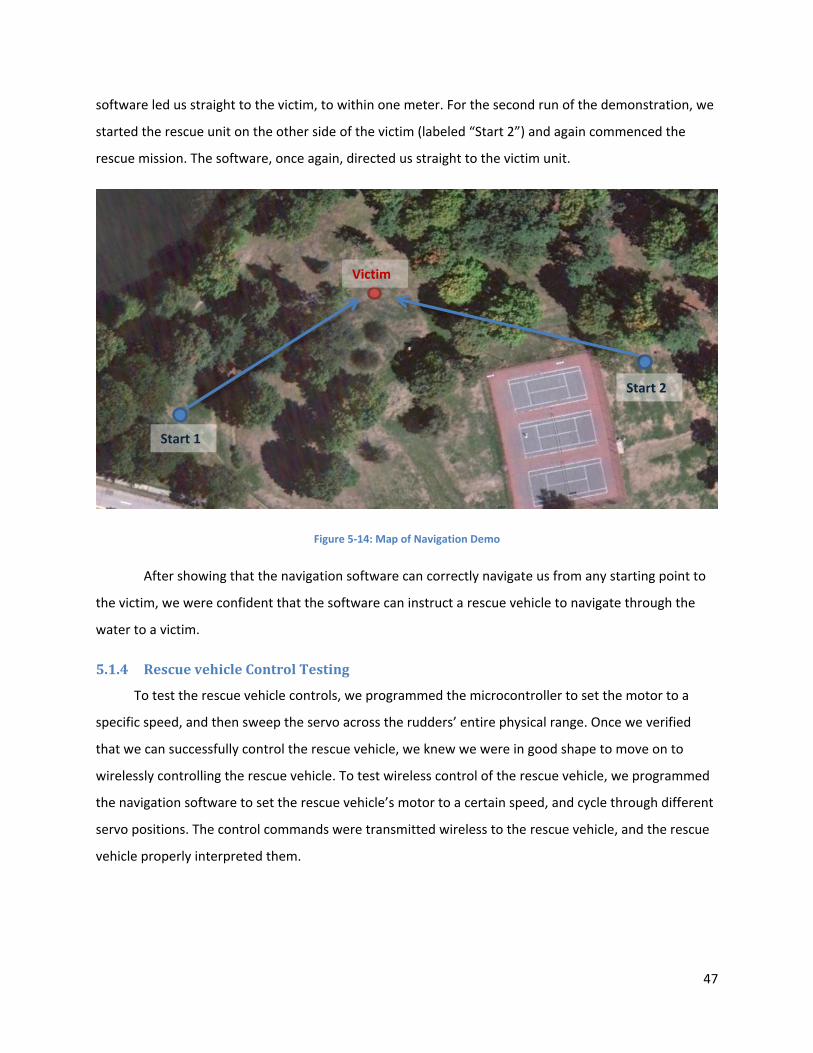
47
software led us straight to the victim, to within one meter. For the second run of the demonstration, we
started the rescue unit on the other side of the victim (labeled “Start 2”) and again commenced the
rescue mission. The software, once again, directed us straight to the victim unit.
Figure 5-14: Map of Navigation Demo
After showing that the navigation software can correctly navigate us from any starting point to
the victim, we were confident that the software can instruct a rescue vehicle to navigate through the
water to a victim.
5.1.4 Rescue vehicle Control Testing
To test the rescue vehicle controls, we programmed the microcontroller to set the motor to a
specific speed, and then sweep the servo across the rudders’ entire physical range. Once we verified
that we can successfully control the rescue vehicle, we knew we were in good shape to move on to
wirelessly controlling the rescue vehicle. To test wireless control of the rescue vehicle, we programmed
the navigation software to set the rescue vehicle’s motor to a certain speed, and cycle through different
servo positions. The control commands were transmitted wireless to the rescue vehicle, and the rescue
vehicle properly interpreted them.
Victim
Start 1
Start 2
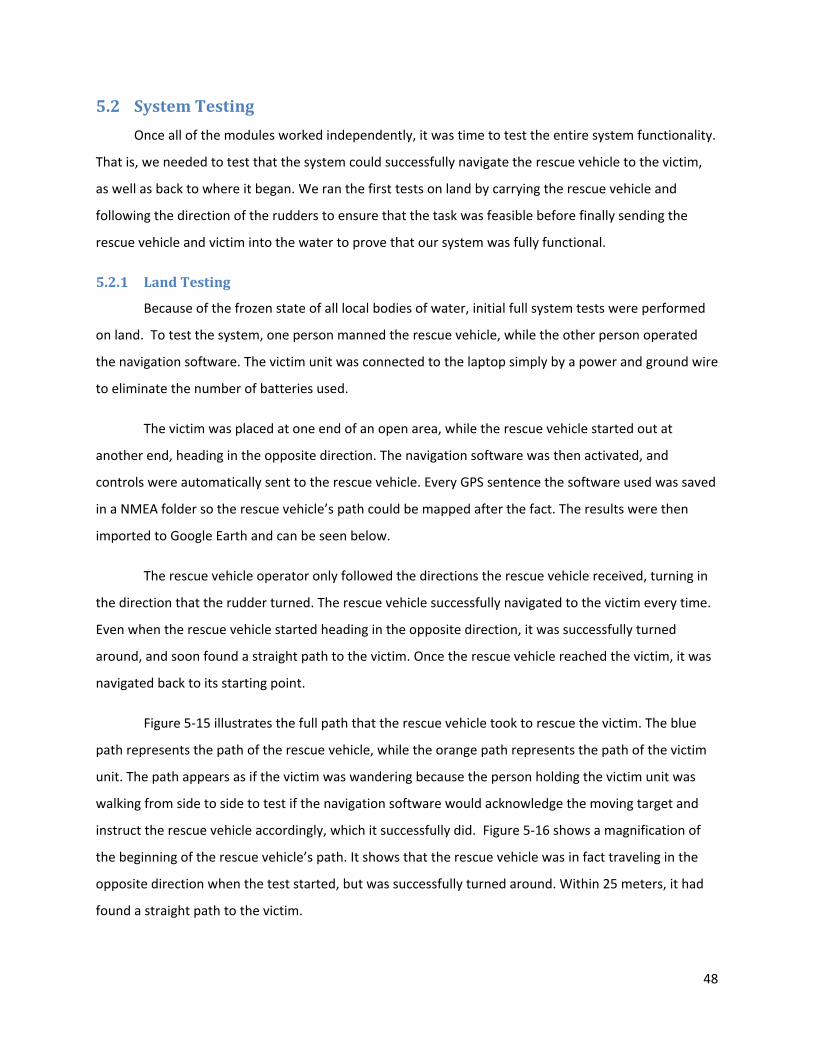
48
5.2 System Testing
Once all of the modules worked independently, it was time to test the entire system functionality.
That is, we needed to test that the system could successfully navigate the rescue vehicle to the victim,
as well as back to where it began. We ran the first tests on land by carrying the rescue vehicle and
following the direction of the rudders to ensure that the task was feasible before finally sending the
rescue vehicle and victim into the water to prove that our system was fully functional.
5.2.1 Land Testing
Because of the frozen state of all local bodies of water, initial full system tests were performed
on land. To test the system, one person manned the rescue vehicle, while the other person operated
the navigation software. The victim unit was connected to the laptop simply by a power and ground wire
to eliminate the number of batteries used.
The victim was placed at one end of an open area, while the rescue vehicle started out at
another end, heading in the opposite direction. The navigation software was then activated, and
controls were automatically sent to the rescue vehicle. Every GPS sentence the software used was saved
in a NMEA folder so the rescue vehicle’s path could be mapped after the fact. The results were then
imported to Google Earth and can be seen below.
The rescue vehicle operator only followed the directions the rescue vehicle received, turning in
the direction that the rudder turned. The rescue vehicle successfully navigated to the victim every time.
Even when the rescue vehicle started heading in the opposite direction, it was successfully turned
around, and soon found a straight path to the victim. Once the rescue vehicle reached the victim, it was
navigated back to its starting point.
Figure 5-15 illustrates the full path that the rescue vehicle took to rescue the victim. The blue
path represents the path of the rescue vehicle, while the orange path represents the path of the victim
unit. The path appears as if the victim was wandering because the person holding the victim unit was
walking from side to side to test if the navigation software would acknowledge the moving target and
instruct the rescue vehicle accordingly, which it successfully did. Figure 5-16 shows a magnification of
the beginning of the rescue vehicle’s path. It shows that the rescue vehicle was in fact traveling in the
opposite direction when the test started, but was successfully turned around. Within 25 meters, it had
found a straight path to the victim.
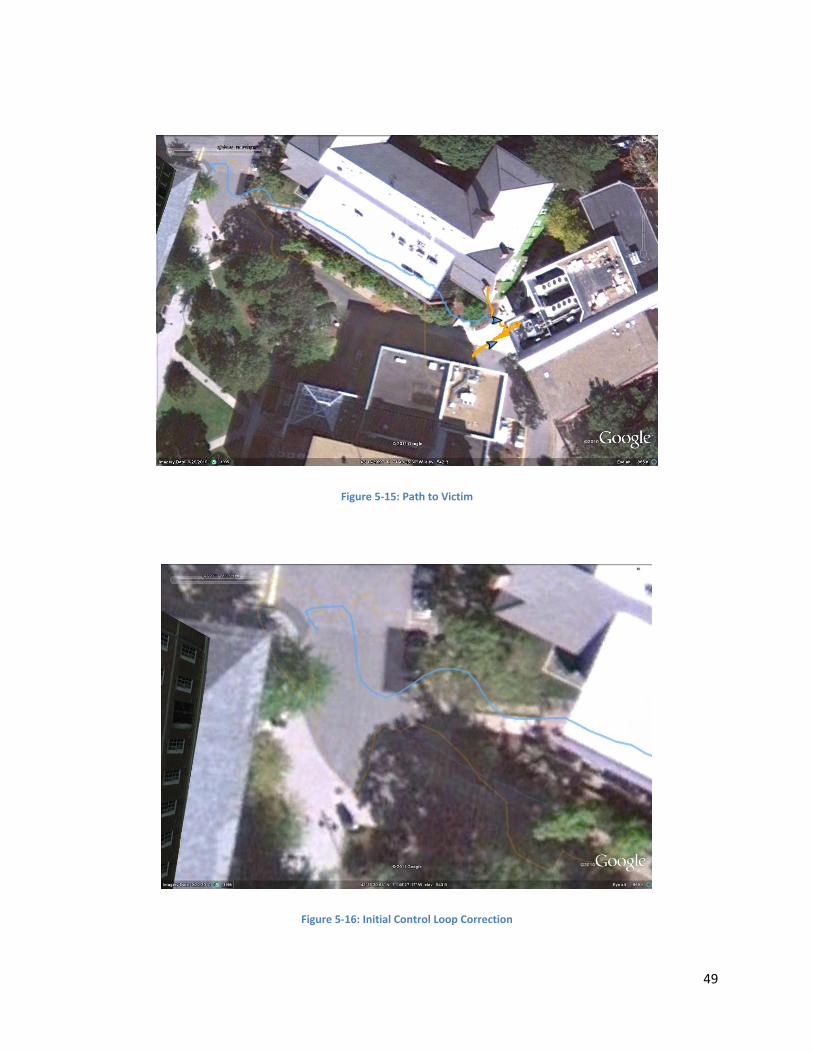
49
Figure 5-15: Path to Victim
Figure 5-16: Initial Control Loop Correction
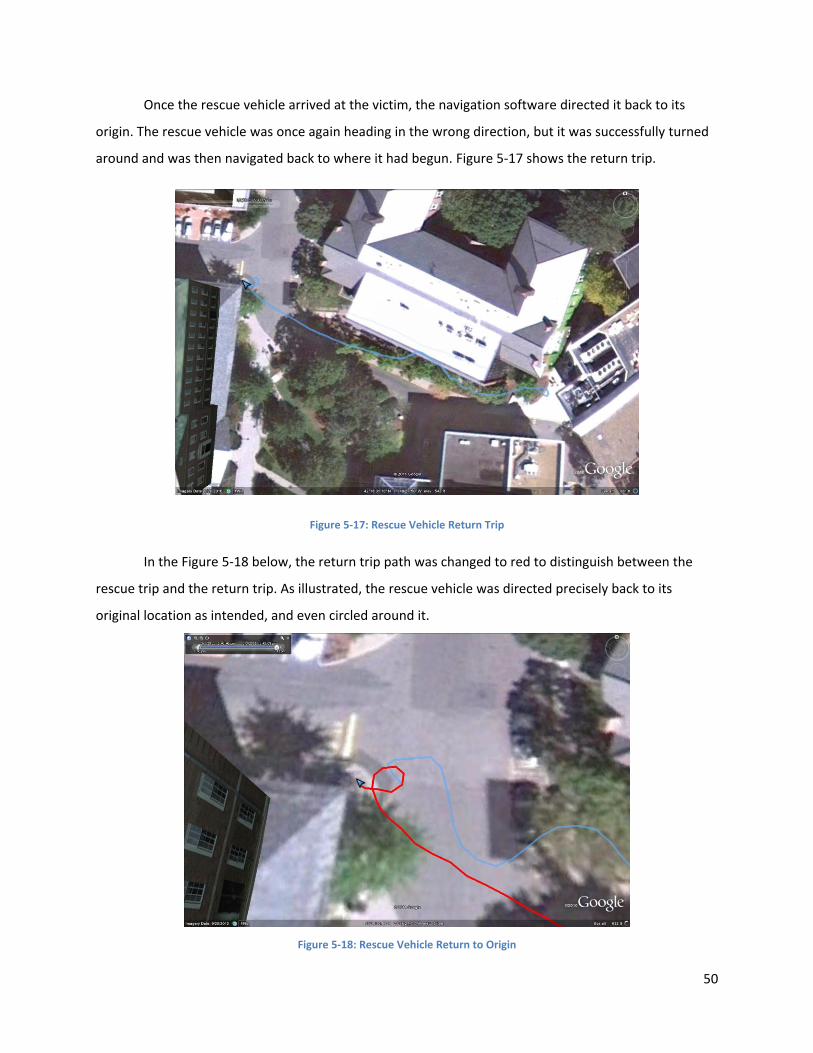
50
Once the rescue vehicle arrived at the victim, the navigation software directed it back to its
origin. The rescue vehicle was once again heading in the wrong direction, but it was successfully turned
around and was then navigated back to where it had begun. Figure 5-17 shows the return trip.
Figure 5-17: Rescue Vehicle Return Trip
In the Figure 5-18 below, the return trip path was changed to red to distinguish between the
rescue trip and the return trip. As illustrated, the rescue vehicle was directed precisely back to its
original location as intended, and even circled around it.
Figure 5-18: Rescue Vehicle Return to Origin
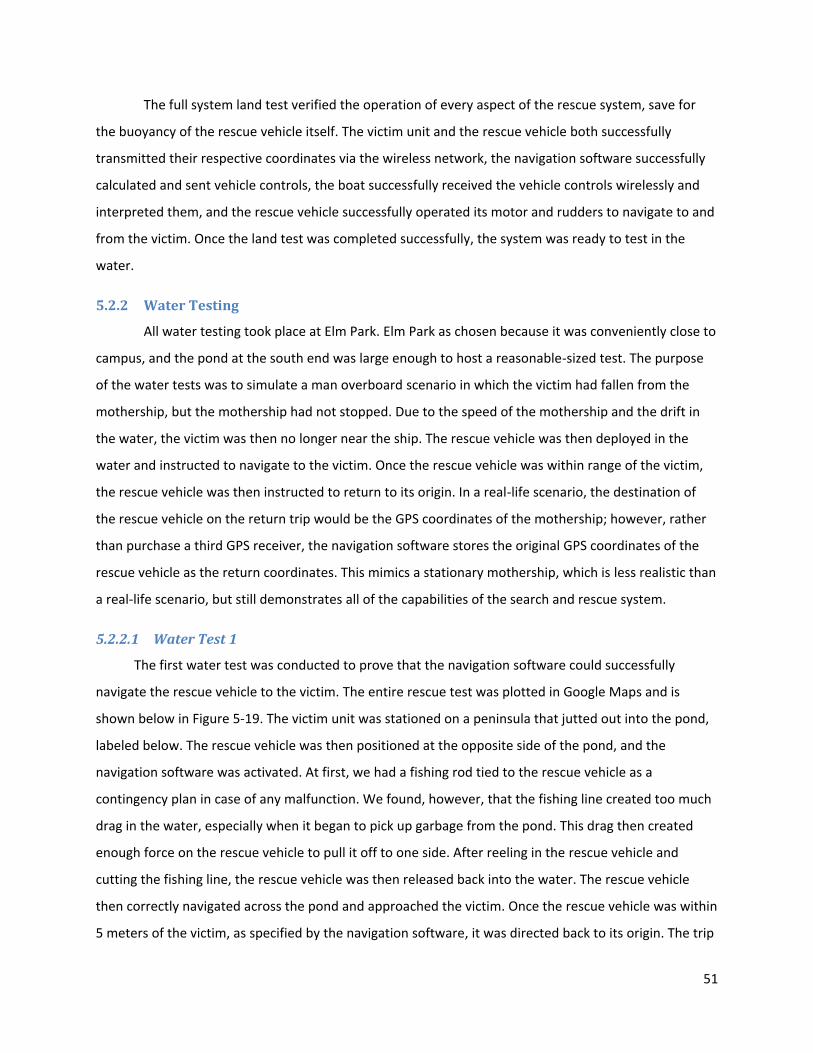
51
The full system land test verified the operation of every aspect of the rescue system, save for
the buoyancy of the rescue vehicle itself. The victim unit and the rescue vehicle both successfully
transmitted their respective coordinates via the wireless network, the navigation software successfully
calculated and sent vehicle controls, the boat successfully received the vehicle controls wirelessly and
interpreted them, and the rescue vehicle successfully operated its motor and rudders to navigate to and
from the victim. Once the land test was completed successfully, the system was ready to test in the
water.
5.2.2 Water Testing
All water testing took place at Elm Park. Elm Park as chosen because it was conveniently close to
campus, and the pond at the south end was large enough to host a reasonable-sized test. The purpose
of the water tests was to simulate a man overboard scenario in which the victim had fallen from the
mothership, but the mothership had not stopped. Due to the speed of the mothership and the drift in
the water, the victim was then no longer near the ship. The rescue vehicle was then deployed in the
water and instructed to navigate to the victim. Once the rescue vehicle was within range of the victim,
the rescue vehicle was then instructed to return to its origin. In a real-life scenario, the destination of
the rescue vehicle on the return trip would be the GPS coordinates of the mothership; however, rather
than purchase a third GPS receiver, the navigation software stores the original GPS coordinates of the
rescue vehicle as the return coordinates. This mimics a stationary mothership, which is less realistic than
a real-life scenario, but still demonstrates all of the capabilities of the search and rescue system.
5.2.2.1 Water Test 1
The first water test was conducted to prove that the navigation software could successfully
navigate the rescue vehicle to the victim. The entire rescue test was plotted in Google Maps and is
shown below in Figure 5-19. The victim unit was stationed on a peninsula that jutted out into the pond,
labeled below. The rescue vehicle was then positioned at the opposite side of the pond, and the
navigation software was activated. At first, we had a fishing rod tied to the rescue vehicle as a
contingency plan in case of any malfunction. We found, however, that the fishing line created too much
drag in the water, especially when it began to pick up garbage from the pond. This drag then created
enough force on the rescue vehicle to pull it off to one side. After reeling in the rescue vehicle and
cutting the fishing line, the rescue vehicle was then released back into the water. The rescue vehicle
then correctly navigated across the pond and approached the victim. Once the rescue vehicle was within
5 meters of the victim, as specified by the navigation software, it was directed back to its origin. The trip
52
back to the origin was hindered by a side wind and current, but the navigation software was able to
continue correcting the drift, and the rescue vehicle overcame the drift and still arrived at its
destination.
Figure 5-19: Full System Test, Water 1
5.2.2.2 Water Test 2
Knowing that the rescue vehicle will successfully navigate to and from the victim in the water, we
then decided to conduct another test in Elm Park, this time without the fishing line at all. Also, knowing
we can accurately get within five meters of the victim, we decided to reduce the range in which to
approach the victim to four meters. We changed the location of the victim unit from the previous test
to in the water near the bridge. The victim unit was fastened to a Styrofoam raft and held in place by a
pair of fishing poles on the shore, as shown in Figure 5-20. The rescue vehicle was released from a
peninsula and aimed away from the victim. The rescue was then initialized, and the rescue vehicle
navigated to the victim (red path in Figure 5-21). The rescue vehicle encountered the obstacle of wind
and waves about 2/3 of the way to the victim, and again corrected its path. Upon reaching four meters
from the victim, the rescue vehicle turned around and returned to its origin (green path).
Victim
Start/End Point
Cut the Line
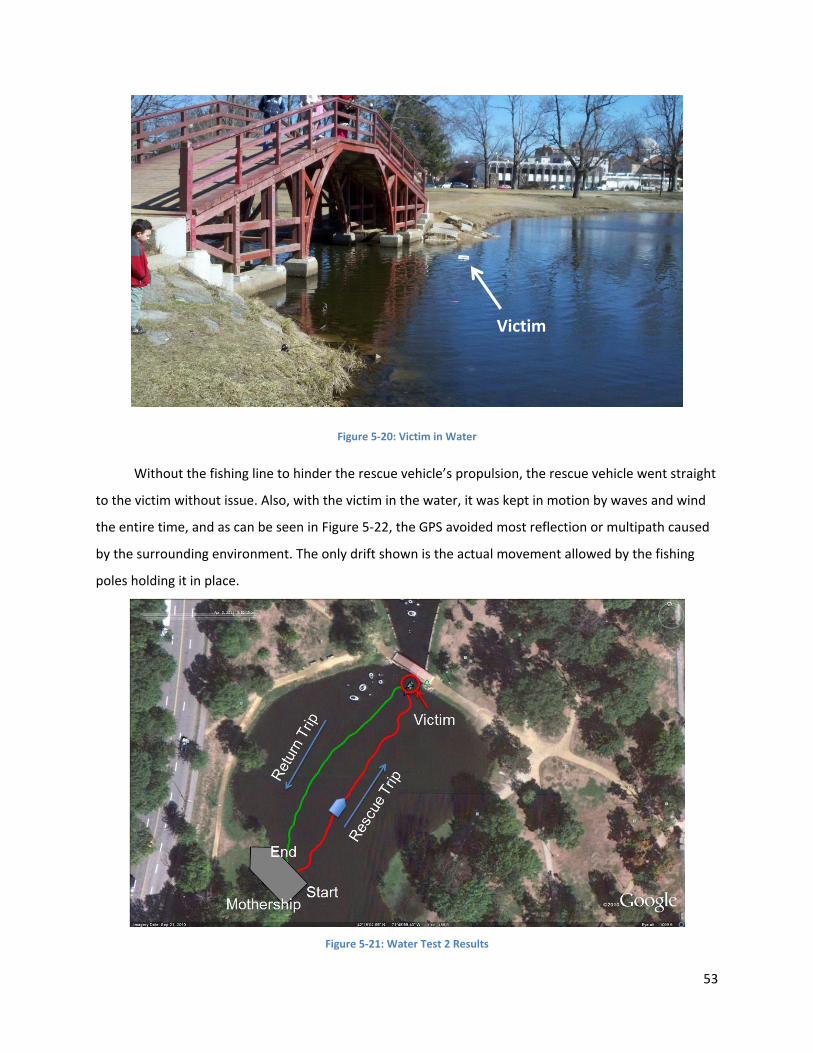
53
Figure 5-20: Victim in Water
Without the fishing line to hinder the rescue vehicle’s propulsion, the rescue vehicle went straight
to the victim without issue. Also, with the victim in the water, it was kept in motion by waves and wind
the entire time, and as can be seen in Figure 5-22, the GPS avoided most reflection or multipath caused
by the surrounding environment. The only drift shown is the actual movement allowed by the fishing
poles holding it in place.
Figure 5-21: Water Test 2 Results
Victim
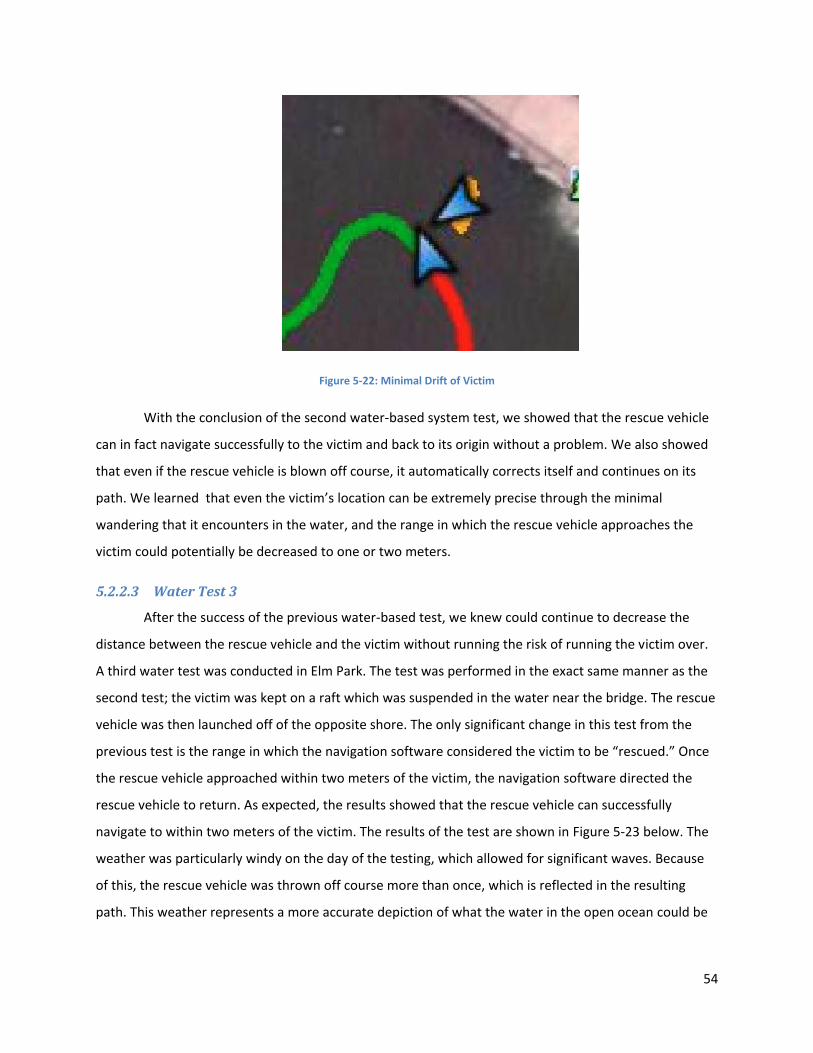
54
Figure 5-22: Minimal Drift of Victim
With the conclusion of the second water-based system test, we showed that the rescue vehicle
can in fact navigate successfully to the victim and back to its origin without a problem. We also showed
that even if the rescue vehicle is blown off course, it automatically corrects itself and continues on its
path. We learned that even the victim’s location can be extremely precise through the minimal
wandering that it encounters in the water, and the range in which the rescue vehicle approaches the
victim could potentially be decreased to one or two meters.
5.2.2.3 Water Test 3
After the success of the previous water-based test, we knew could continue to decrease the
distance between the rescue vehicle and the victim without running the risk of running the victim over.
A third water test was conducted in Elm Park. The test was performed in the exact same manner as the
second test; the victim was kept on a raft which was suspended in the water near the bridge. The rescue
vehicle was then launched off of the opposite shore. The only significant change in this test from the
previous test is the range in which the navigation software considered the victim to be “rescued.” Once
the rescue vehicle approached within two meters of the victim, the navigation software directed the
rescue vehicle to return. As expected, the results showed that the rescue vehicle can successfully
navigate to within two meters of the victim. The results of the test are shown in Figure 5-23 below. The
weather was particularly windy on the day of the testing, which allowed for significant waves. Because
of this, the rescue vehicle was thrown off course more than once, which is reflected in the resulting
path. This weather represents a more accurate depiction of what the water in the open ocean could be
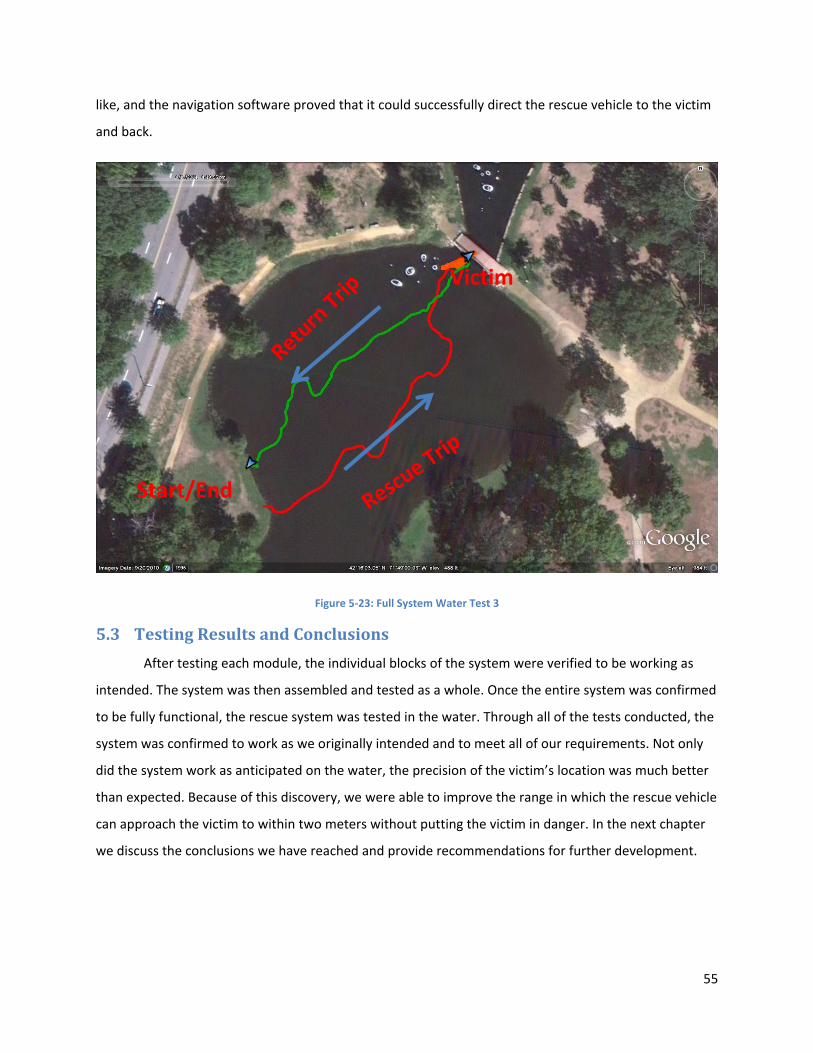
55
like, and the navigation software proved that it could successfully direct the rescue vehicle to the victim
and back.
Figure 5-23: Full System Water Test 3
5.3 Testing Results and Conclusions
After testing each module, the individual blocks of the system were verified to be working as
intended. The system was then assembled and tested as a whole. Once the entire system was confirmed
to be fully functional, the rescue system was tested in the water. Through all of the tests conducted, the
system was confirmed to work as we originally intended and to meet all of our requirements. Not only
did the system work as anticipated on the water, the precision of the victim’s location was much better
than expected. Because of this discovery, we were able to improve the range in which the rescue vehicle
can approach the victim to within two meters without putting the victim in danger. In the next chapter
we discuss the conclusions we have reached and provide recommendations for further development.
Start/End
Victim
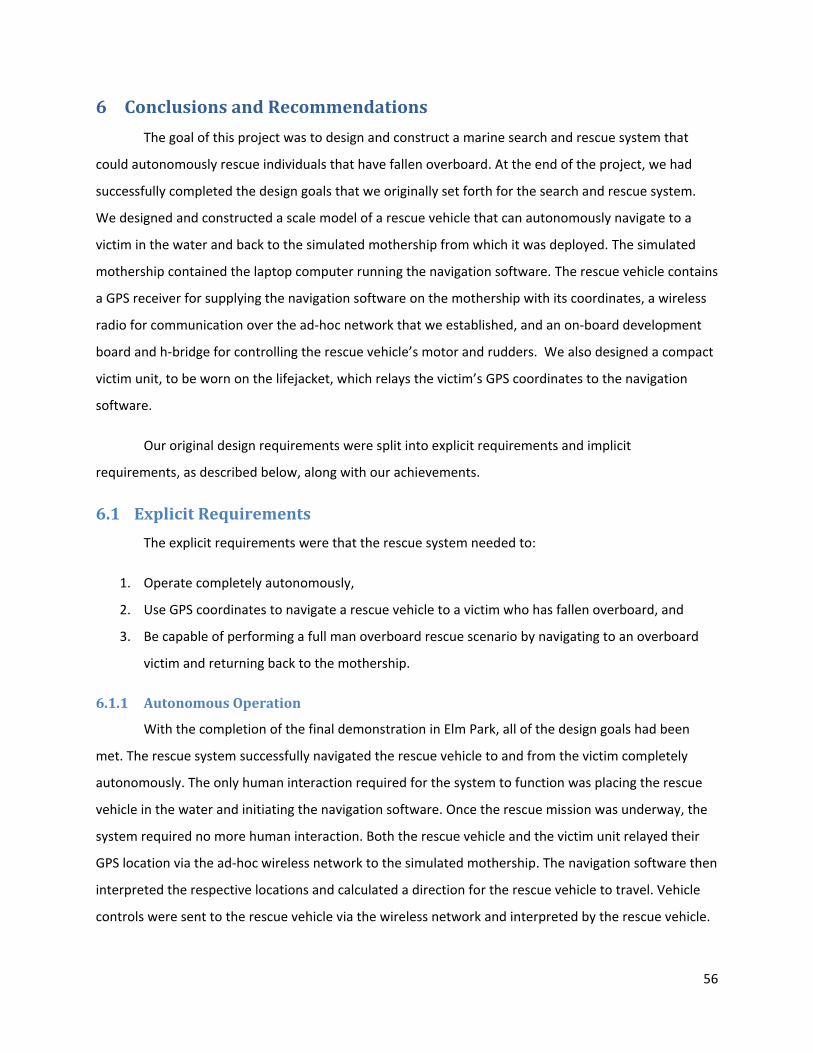
56
6 Conclusions and Recommendations
The goal of this project was to design and construct a marine search and rescue system that
could autonomously rescue individuals that have fallen overboard. At the end of the project, we had
successfully completed the design goals that we originally set forth for the search and rescue system.
We designed and constructed a scale model of a rescue vehicle that can autonomously navigate to a
victim in the water and back to the simulated mothership from which it was deployed. The simulated
mothership contained the laptop computer running the navigation software. The rescue vehicle contains
a GPS receiver for supplying the navigation software on the mothership with its coordinates, a wireless
radio for communication over the ad-hoc network that we established, and an on-board development
board and h-bridge for controlling the rescue vehicle’s motor and rudders. We also designed a compact
victim unit, to be worn on the lifejacket, which relays the victim’s GPS coordinates to the navigation
software.
Our original design requirements were split into explicit requirements and implicit
requirements, as described below, along with our achievements.
6.1 Explicit Requirements
The explicit requirements were that the rescue system needed to:
1. Operate completely autonomously,
2. Use GPS coordinates to navigate a rescue vehicle to a victim who has fallen overboard, and
3. Be capable of performing a full man overboard rescue scenario by navigating to an overboard
victim and returning back to the mothership.
6.1.1 Autonomous Operation
With the completion of the final demonstration in Elm Park, all of the design goals had been
met. The rescue system successfully navigated the rescue vehicle to and from the victim completely
autonomously. The only human interaction required for the system to function was placing the rescue
vehicle in the water and initiating the navigation software. Once the rescue mission was underway, the
system required no more human interaction. Both the rescue vehicle and the victim unit relayed their
GPS location via the ad-hoc wireless network to the simulated mothership. The navigation software then
interpreted the respective locations and calculated a direction for the rescue vehicle to travel. Vehicle
controls were sent to the rescue vehicle via the wireless network and interpreted by the rescue vehicle.
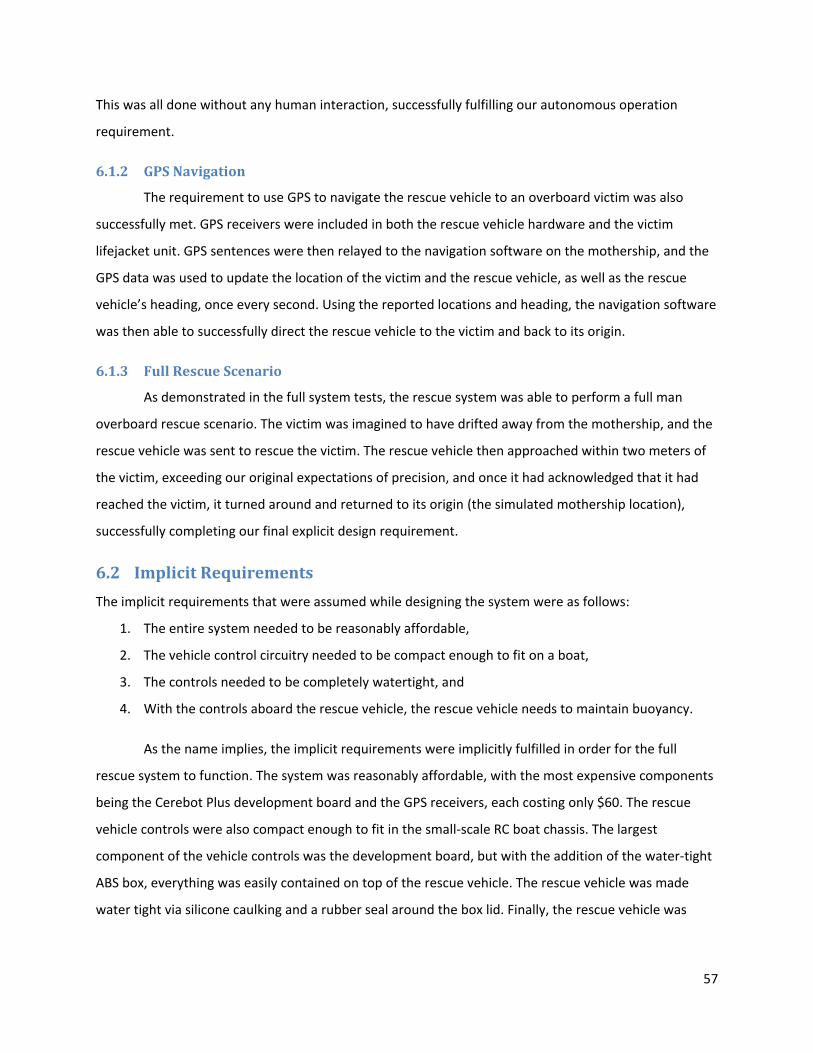
57
This was all done without any human interaction, successfully fulfilling our autonomous operation
requirement.
6.1.2 GPS Navigation
The requirement to use GPS to navigate the rescue vehicle to an overboard victim was also
successfully met. GPS receivers were included in both the rescue vehicle hardware and the victim
lifejacket unit. GPS sentences were then relayed to the navigation software on the mothership, and the
GPS data was used to update the location of the victim and the rescue vehicle, as well as the rescue
vehicle’s heading, once every second. Using the reported locations and heading, the navigation software
was then able to successfully direct the rescue vehicle to the victim and back to its origin.
6.1.3 Full Rescue Scenario
As demonstrated in the full system tests, the rescue system was able to perform a full man
overboard rescue scenario. The victim was imagined to have drifted away from the mothership, and the
rescue vehicle was sent to rescue the victim. The rescue vehicle then approached within two meters of
the victim, exceeding our original expectations of precision, and once it had acknowledged that it had
reached the victim, it turned around and returned to its origin (the simulated mothership location),
successfully completing our final explicit design requirement.
6.2 Implicit Requirements
The implicit requirements that were assumed while designing the system were as follows:
1. The entire system needed to be reasonably affordable,
2. The vehicle control circuitry needed to be compact enough to fit on a boat,
3. The controls needed to be completely watertight, and
4. With the controls aboard the rescue vehicle, the rescue vehicle needs to maintain buoyancy.
As the name implies, the implicit requirements were implicitly fulfilled in order for the full
rescue system to function. The system was reasonably affordable, with the most expensive components
being the Cerebot Plus development board and the GPS receivers, each costing only $60. The rescue
vehicle controls were also compact enough to fit in the small-scale RC boat chassis. The largest
component of the vehicle controls was the development board, but with the addition of the water-tight
ABS box, everything was easily contained on top of the rescue vehicle. The rescue vehicle was made
water tight via silicone caulking and a rubber seal around the box lid. Finally, the rescue vehicle was
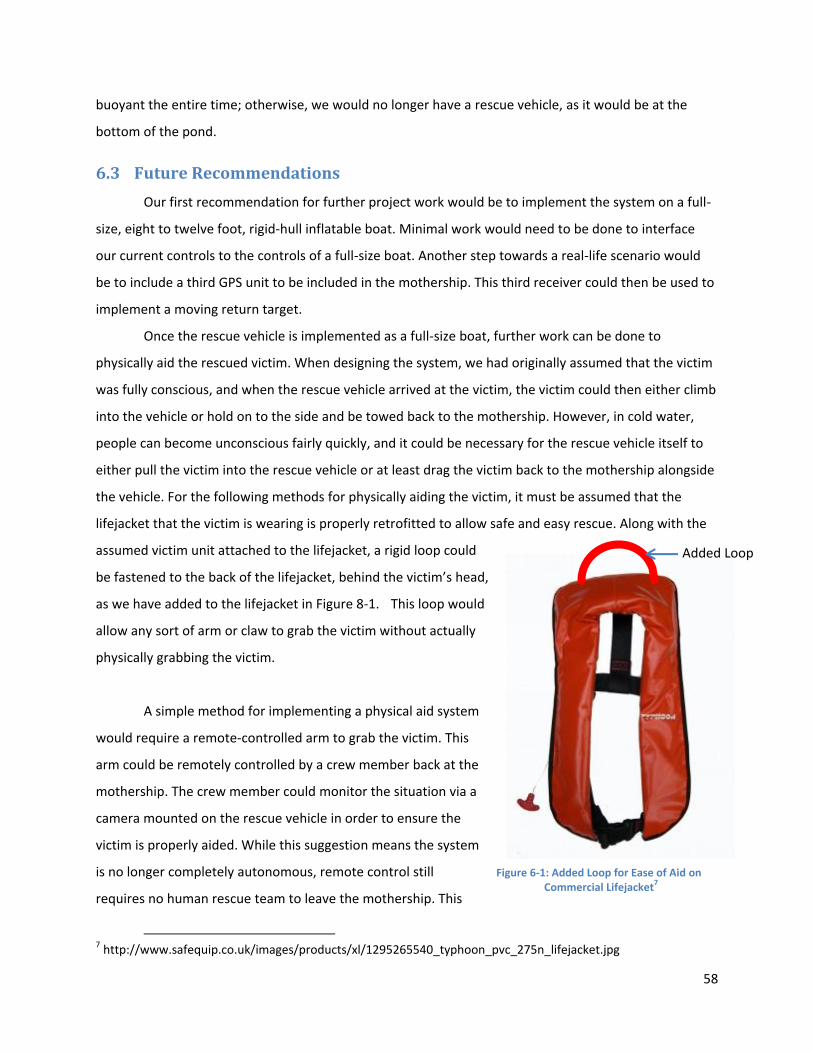
58
buoyant the entire time; otherwise, we would no longer have a rescue vehicle, as it would be at the
bottom of the pond.
6.3 Future Recommendations
Our first recommendation for further project work would be to implement the system on a full-
size, eight to twelve foot, rigid-hull inflatable boat. Minimal work would need to be done to interface
our current controls to the controls of a full-size boat. Another step towards a real-life scenario would
be to include a third GPS unit to be included in the mothership. This third receiver could then be used to
implement a moving return target.
Once the rescue vehicle is implemented as a full-size boat, further work can be done to
physically aid the rescued victim. When designing the system, we had originally assumed that the victim
was fully conscious, and when the rescue vehicle arrived at the victim, the victim could then either climb
into the vehicle or hold on to the side and be towed back to the mothership. However, in cold water,
people can become unconscious fairly quickly, and it could be necessary for the rescue vehicle itself to
either pull the victim into the rescue vehicle or at least drag the victim back to the mothership alongside
the vehicle. For the following methods for physically aiding the victim, it must be assumed that the
lifejacket that the victim is wearing is properly retrofitted to allow safe and easy rescue. Along with the
assumed victim unit attached to the lifejacket, a rigid loop could
be fastened to the back of the lifejacket, behind the victim’s head,
as we have added to the lifejacket in Figure 8-1. 7 This loop would
allow any sort of arm or claw to grab the victim without actually
physically grabbing the victim.
A simple method for implementing a physical aid system
would require a remote-controlled arm to grab the victim. This
arm could be remotely controlled by a crew member back at the
mothership. The crew member could monitor the situation via a
camera mounted on the rescue vehicle in order to ensure the
victim is properly aided. While this suggestion means the system
is no longer completely autonomous, remote control still
requires no human rescue team to leave the mothership. This
7 http://www.safequip.co.uk/images/products/xl/1295265540_typhoon_pvc_275n_lifejacket.jpg
Figure 6-1: Added Loop for Ease of Aid on Commercial Lifejacket7
Added Loop
59
can also limit the amount of liability involved, compared to if the vehicle was autonomously controlling
the hook or arm.
Another method for implementing a physical aid system would be to have the rescue vehicle
locate and autonomously grab the victim in the water. In order to locate the victim in such close
proximity, methods other than GPS would have to be used. Once the rescue vehicle is within a few
meters, the rescue vehicle can use a thermal camera to locate the victim. The water tends to be much
colder than a human body, so the victim’s head, which is being held above water by the lifejacket,
provides significant contrast for thermal cameras.
Another option for close-proximity localization is the VOR-inspired system that was researched
throughout the project. The system included a rotating platform on the rescue vehicle with an
omnidirectional antenna and a rotating directional antenna, both emitting signals of different
frequencies. Two receiving antennae could then be implemented on the victim unit. Using received
signal strength and the time difference between receiving the two signals, the system could then
calculate the direction to the victim. This system was designed but not fully constructed. Any method for
close-proximity localization can be used to allow for the rescue vehicle to have enough precision to
control a hook or arm to grab the victim.
Once the rescue vehicle is scaled to a larger boat, and a method is implemented to physically aid
the victim, the rescue system will be a complete system that can navigate to a victim and bring them
back to the mothership, regardless of whether or not they are conscious. This system can then be
implemented on any kind of large ship, such as an aircraft carrier or oil tanker. In closing, our system
fulfills all of the design requirements we had created, and even exceeds our expectations in regards to
the degree of precision in which the rescue vehicle can locate and approach the victim.

60
7 Works Cited
[1] (2011, February) US Search and Rescue Task Force. [Online].
http://www.ussartf.org/cold_water_survival.htm
[2] Sharon Foster. (2002, April) Entrepreneur. [Online].
http://www.entrepreneur.com/tradejournals/article/84368639.html
[3] Jennifer Lincoln and Devin Lucas. (2010, November) Center for Disease Control and Prevention.
[Online]. http://www.cdc.gov/niosh/docs/2011-106/pdfs/GC_CFID_Summary_EV.pdf
[4] (2007, March) NAVY.mil. [Online]. http://www.navy.mil/search/display.asp?story_id=28209
[5] (2011) BriarTek Incorporated. [Online]. http://www.briartek.com/products-services
[6] (2010, October) BriarTek Incorporated. [Online]. http://www.briartek.com/news/press-releases/63-
500th-mobi-installation-for-us-navy
[7] (2011) BriarTek Incorporated. [Online]. http://www.briartek.com/products-services/orca-direction-
finders
[8] (2008, October) European Space Agency. [Online].
http://www.esa.int/esaCP/SEMYPERTKMF_FeatureWeek_0.html
[9] (2011) Sea Marshall Alerting Units. [Online]. http://www.seamarshall.com/mobs_commercial.php
[10] Alan Gale. (2011, January) The NDB List. [Online].
http://www.ndblist.info/datamodes/dgpsguide.pdf
[11] Civil Aviation Authority. Civial Aviation Safety Authority. [Online].
http://www.casa.gov.au/pilots/download/VOR.pdf
[12] David Nagle. (2003, March) NAVY.mil. [Online].
http://www.navy.mil/search/display.asp?story_id=6076
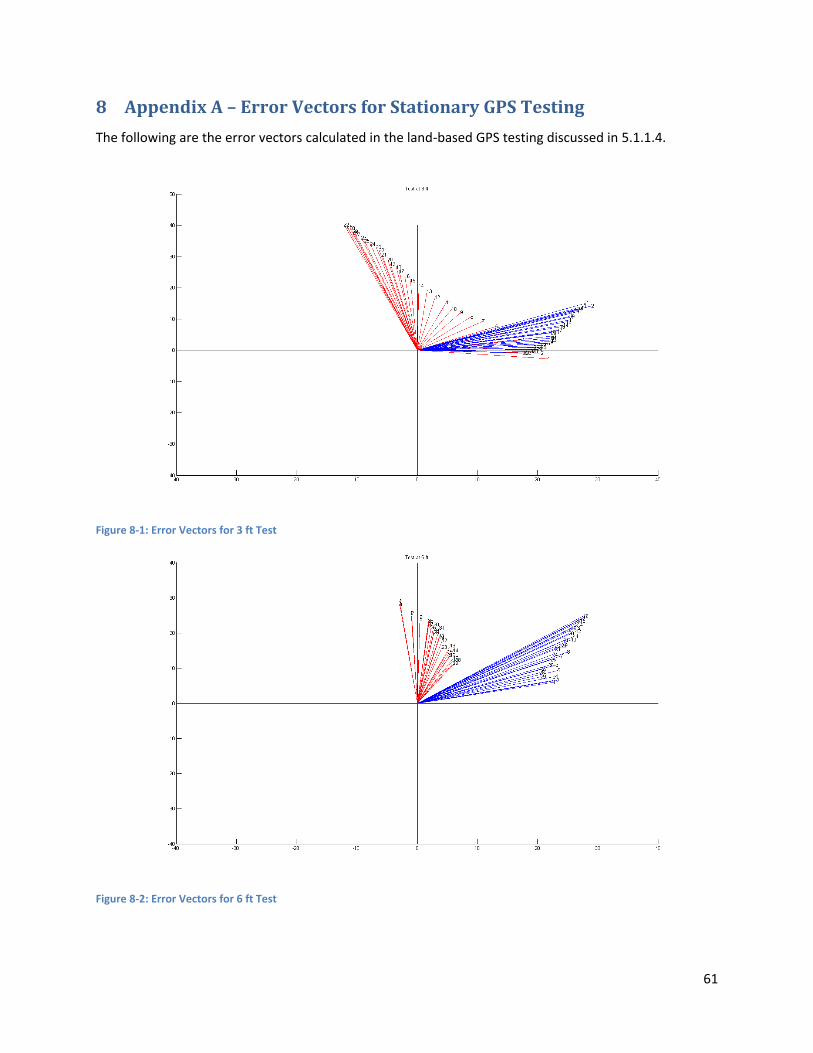
61
8 Appendix A – Error Vectors for Stationary GPS Testing
The following are the error vectors calculated in the land-based GPS testing discussed in 5.1.1.4.
Figure 8-1: Error Vectors for 3 ft Test
Figure 8-2: Error Vectors for 6 ft Test
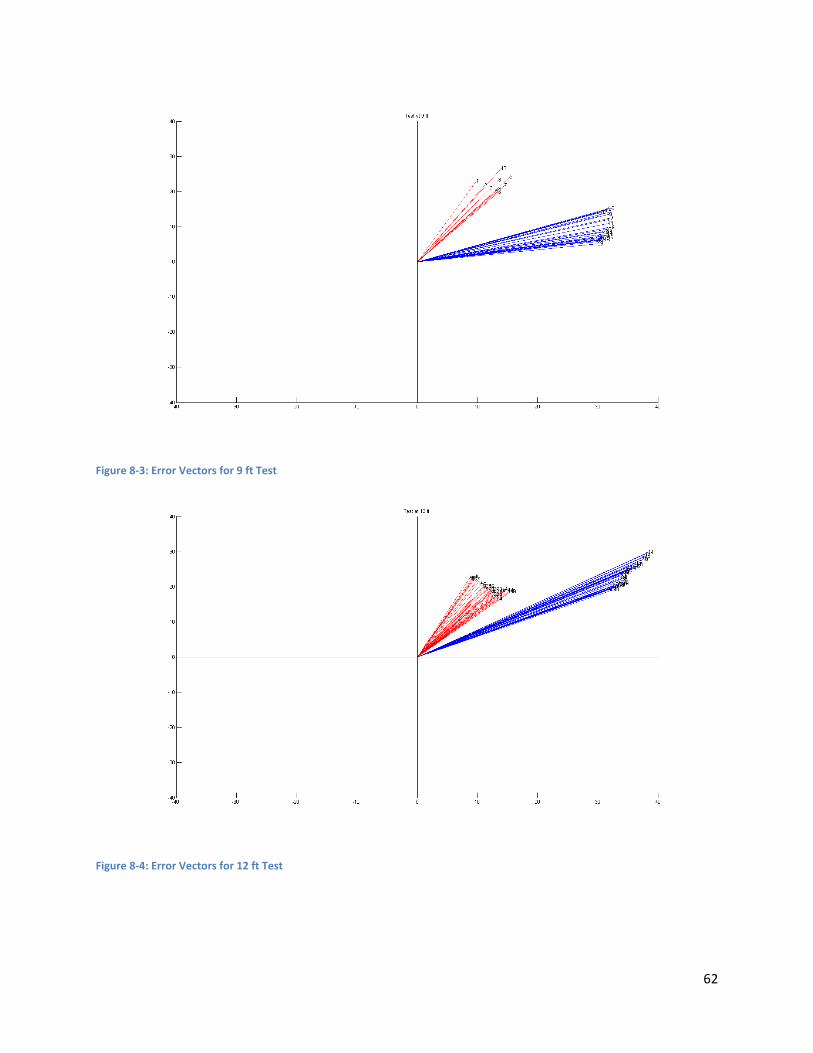
62
Figure 8-3: Error Vectors for 9 ft Test
Figure 8-4: Error Vectors for 12 ft Test
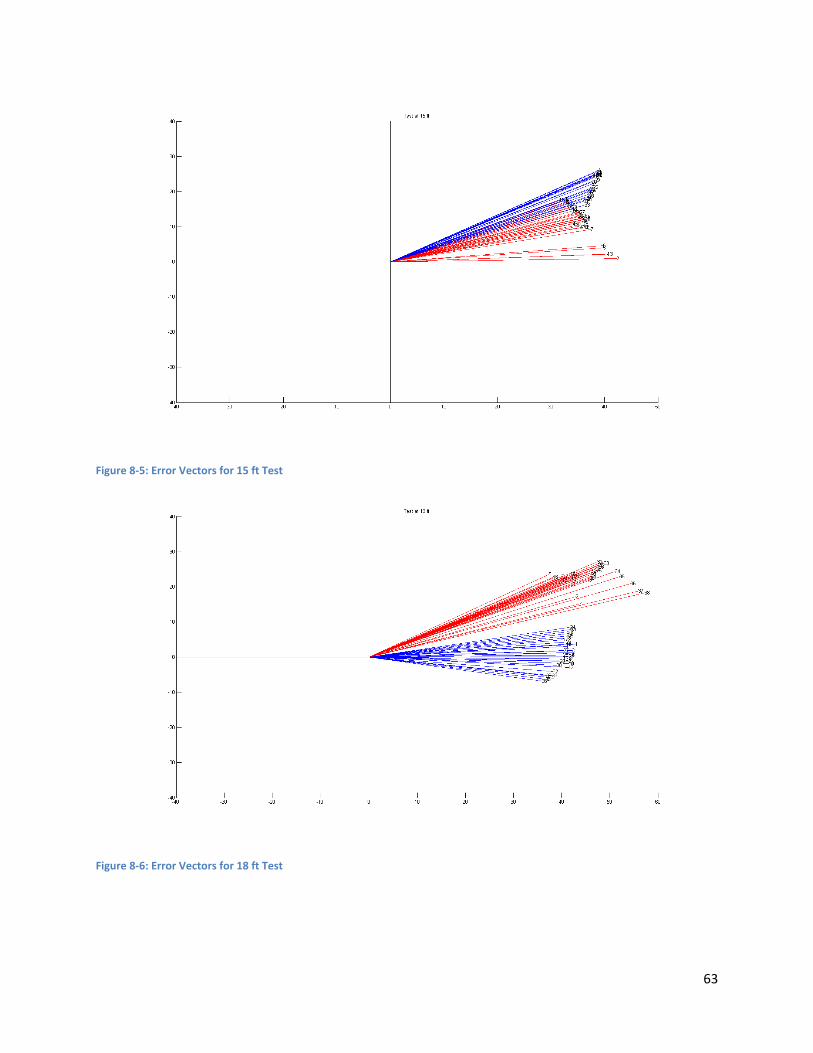
63
Figure 8-5: Error Vectors for 15 ft Test
Figure 8-6: Error Vectors for 18 ft Test
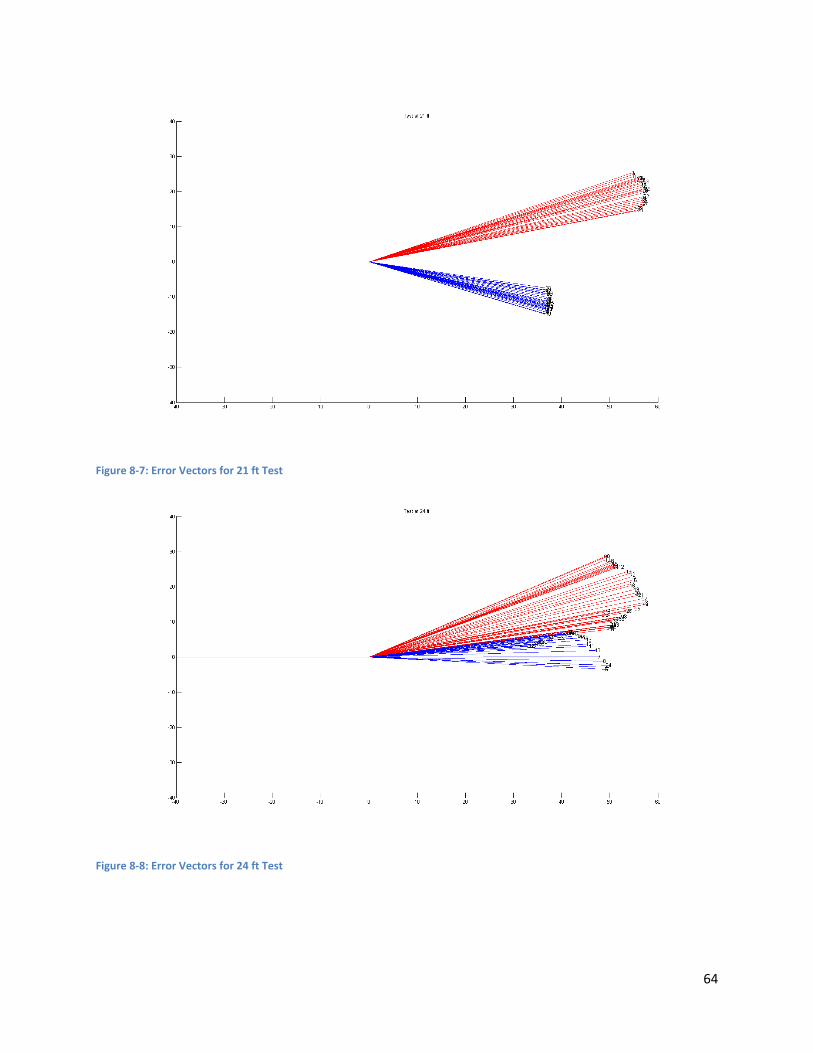
64
Figure 8-7: Error Vectors for 21 ft Test
Figure 8-8: Error Vectors for 24 ft Test
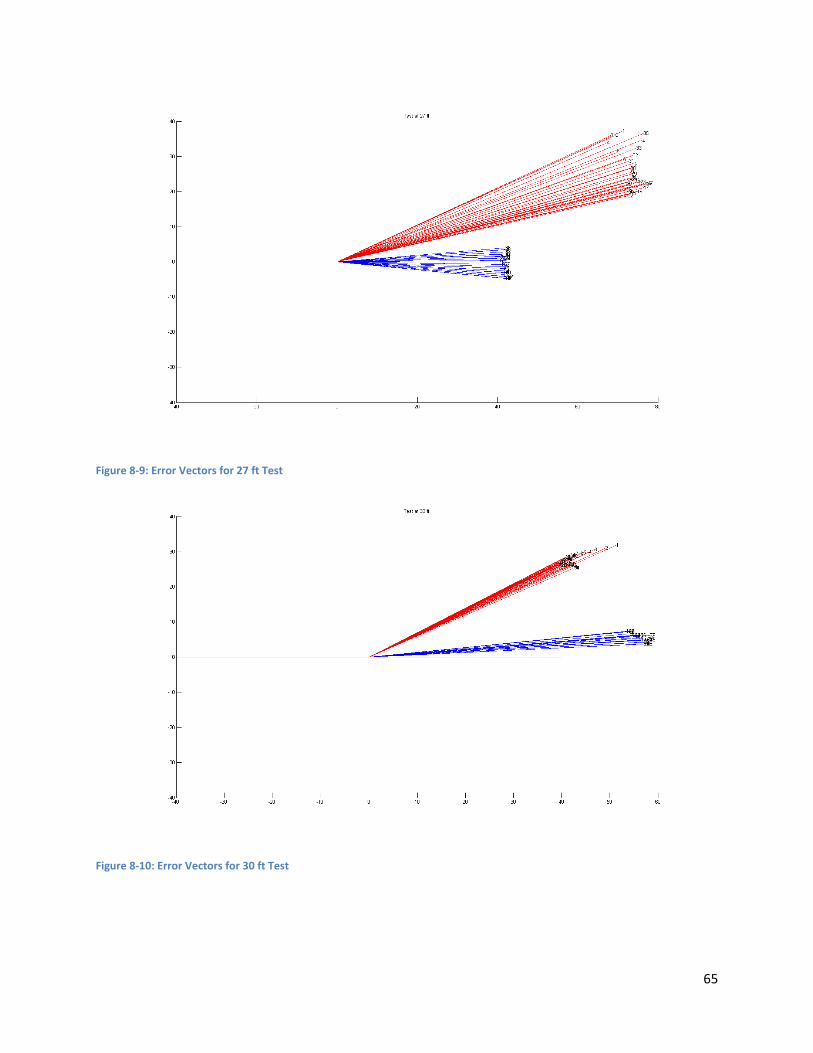
65
Figure 8-9: Error Vectors for 27 ft Test
Figure 8-10: Error Vectors for 30 ft Test
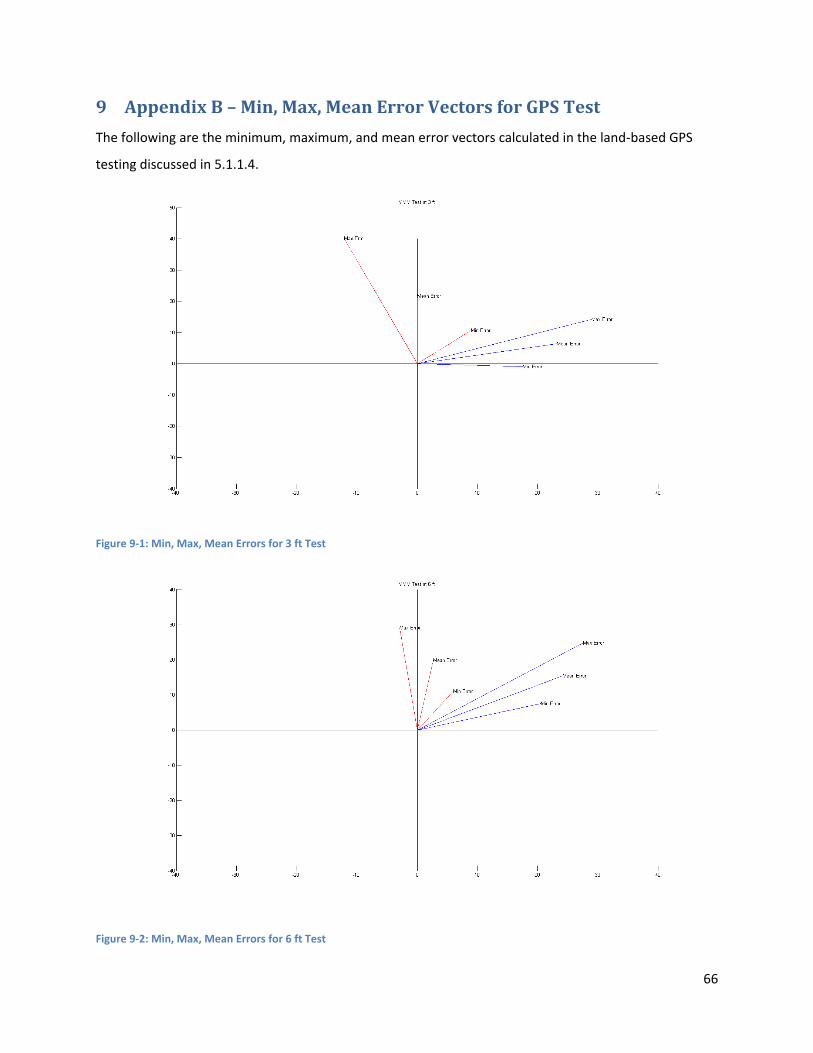
66
9 Appendix B – Min, Max, Mean Error Vectors for GPS Test
The following are the minimum, maximum, and mean error vectors calculated in the land-based GPS
testing discussed in 5.1.1.4.
Figure 9-1: Min, Max, Mean Errors for 3 ft Test
Figure 9-2: Min, Max, Mean Errors for 6 ft Test
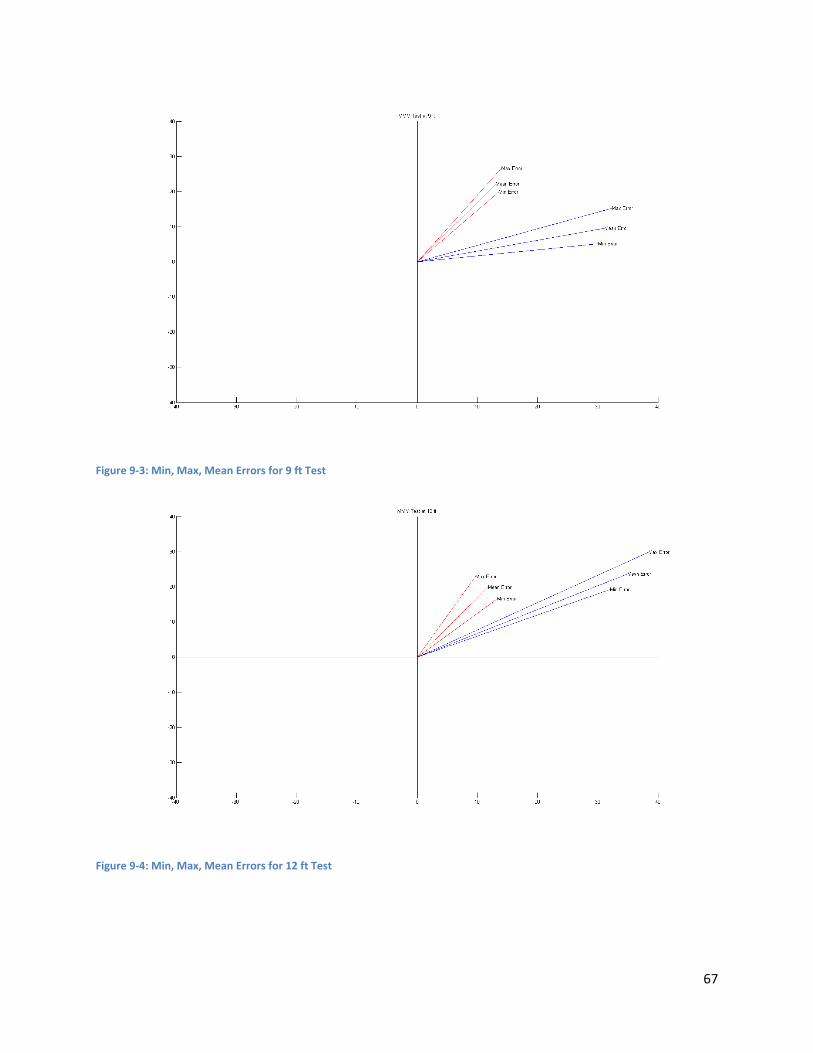
67
Figure 9-3: Min, Max, Mean Errors for 9 ft Test
Figure 9-4: Min, Max, Mean Errors for 12 ft Test
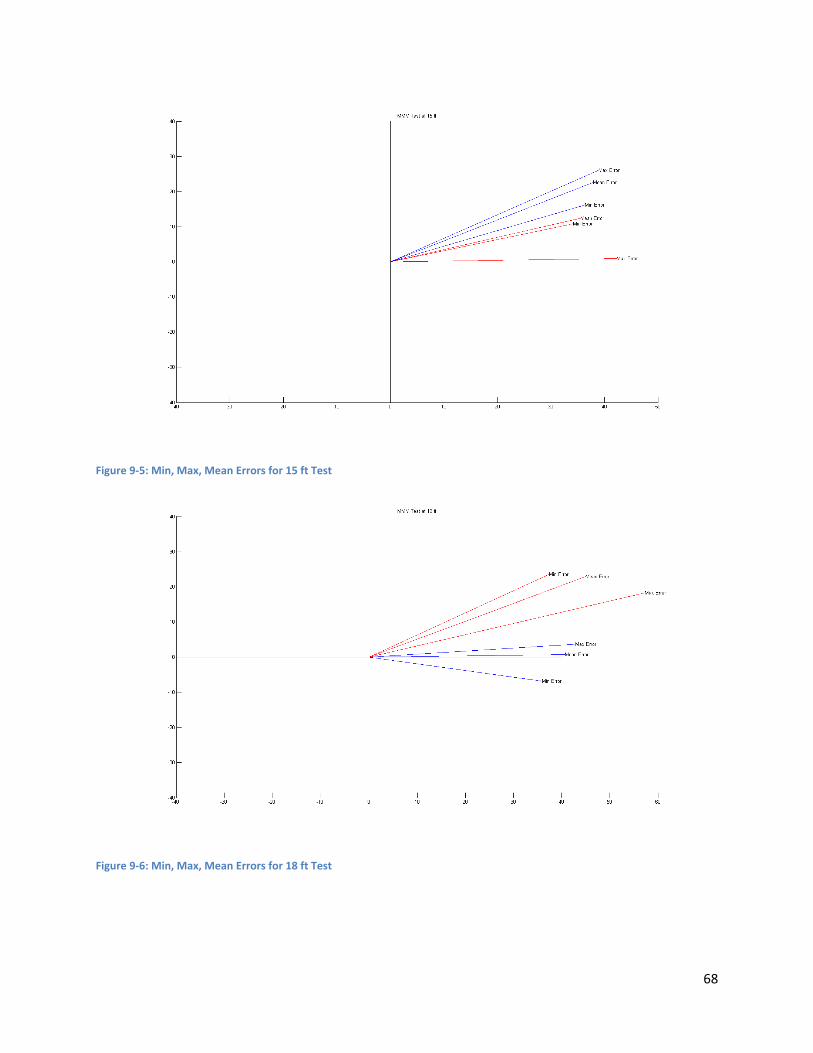
68
Figure 9-5: Min, Max, Mean Errors for 15 ft Test
Figure 9-6: Min, Max, Mean Errors for 18 ft Test
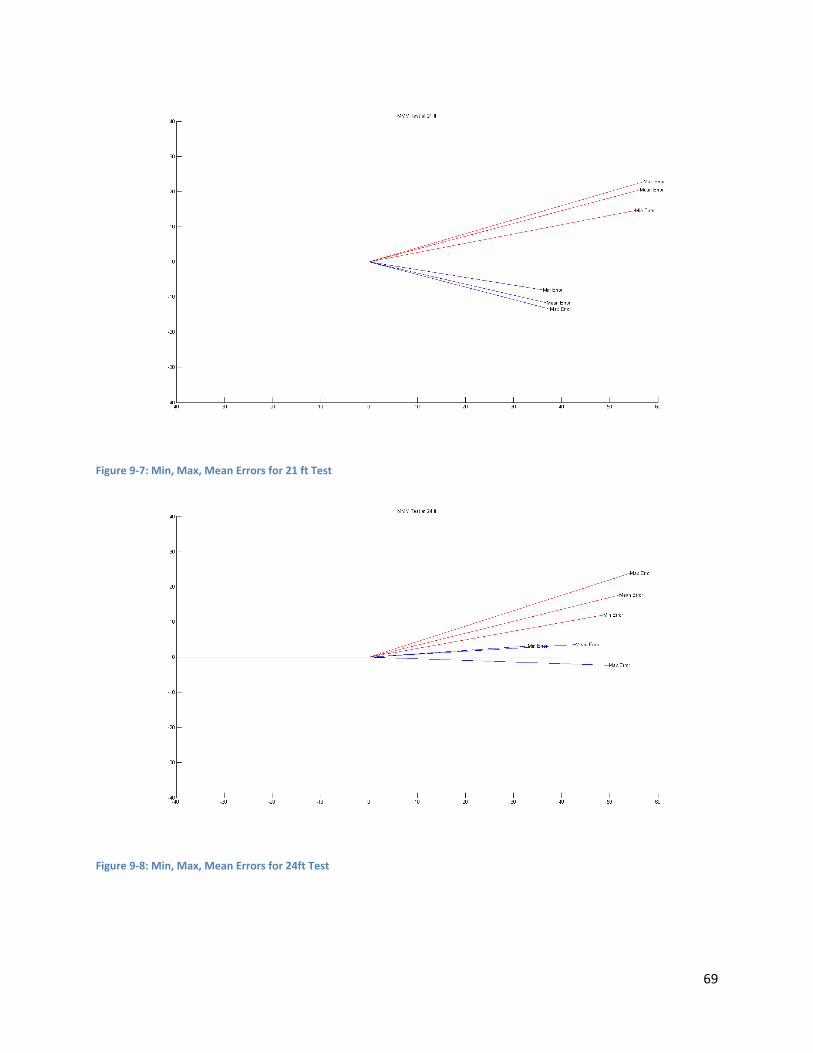
69
Figure 9-7: Min, Max, Mean Errors for 21 ft Test
Figure 9-8: Min, Max, Mean Errors for 24ft Test
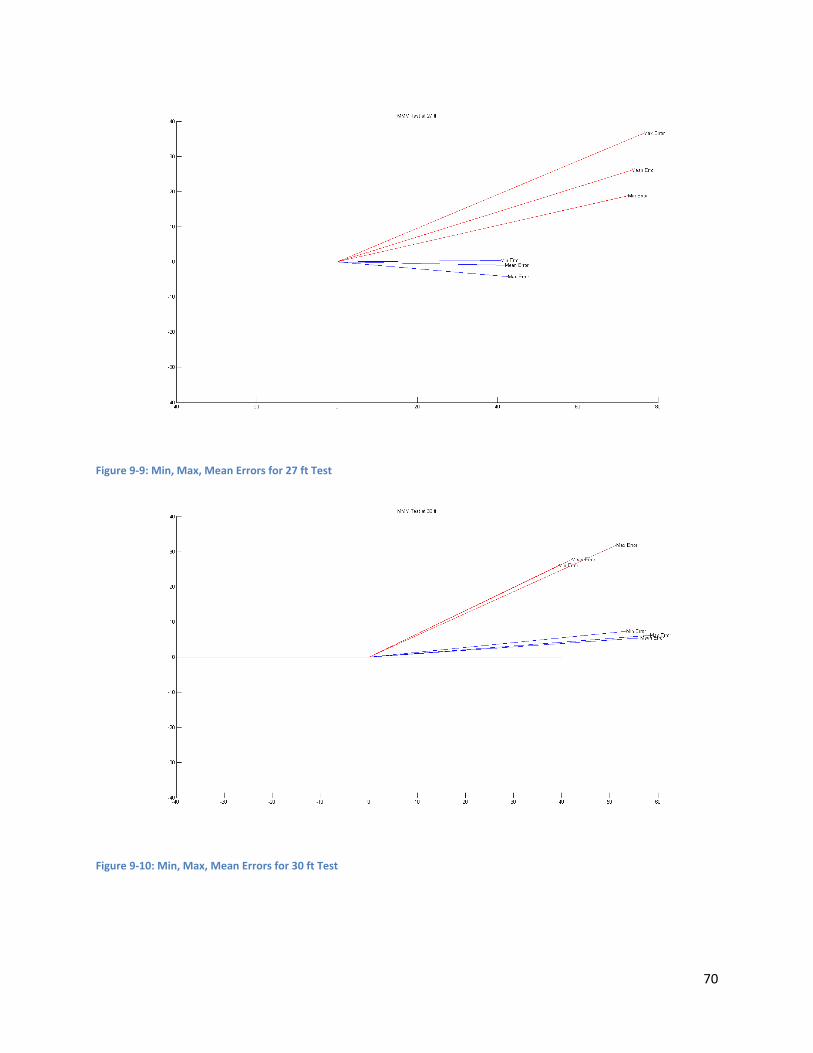
70
Figure 9-9: Min, Max, Mean Errors for 27 ft Test
Figure 9-10: Min, Max, Mean Errors for 30 ft Test
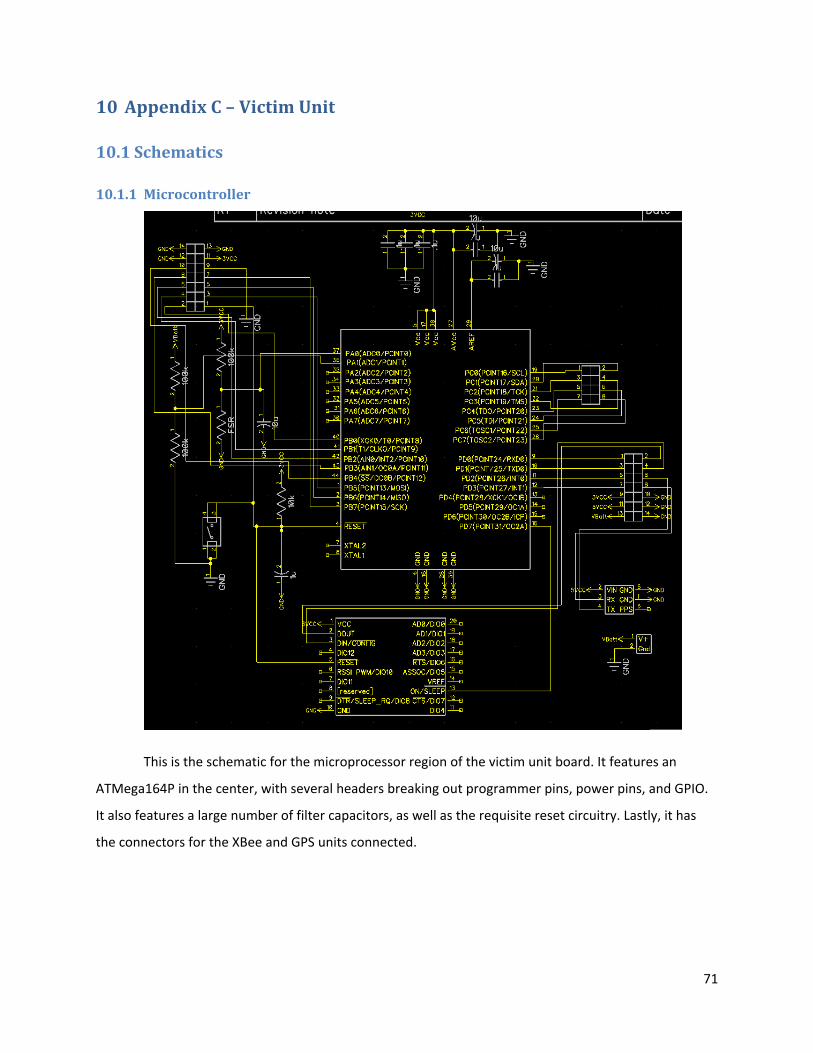
71
10 Appendix C – Victim Unit
10.1 Schematics
10.1.1 Microcontroller
This is the schematic for the microprocessor region of the victim unit board. It features an
ATMega164P in the center, with several headers breaking out programmer pins, power pins, and GPIO.
It also features a large number of filter capacitors, as well as the requisite reset circuitry. Lastly, it has
the connectors for the XBee and GPS units connected.
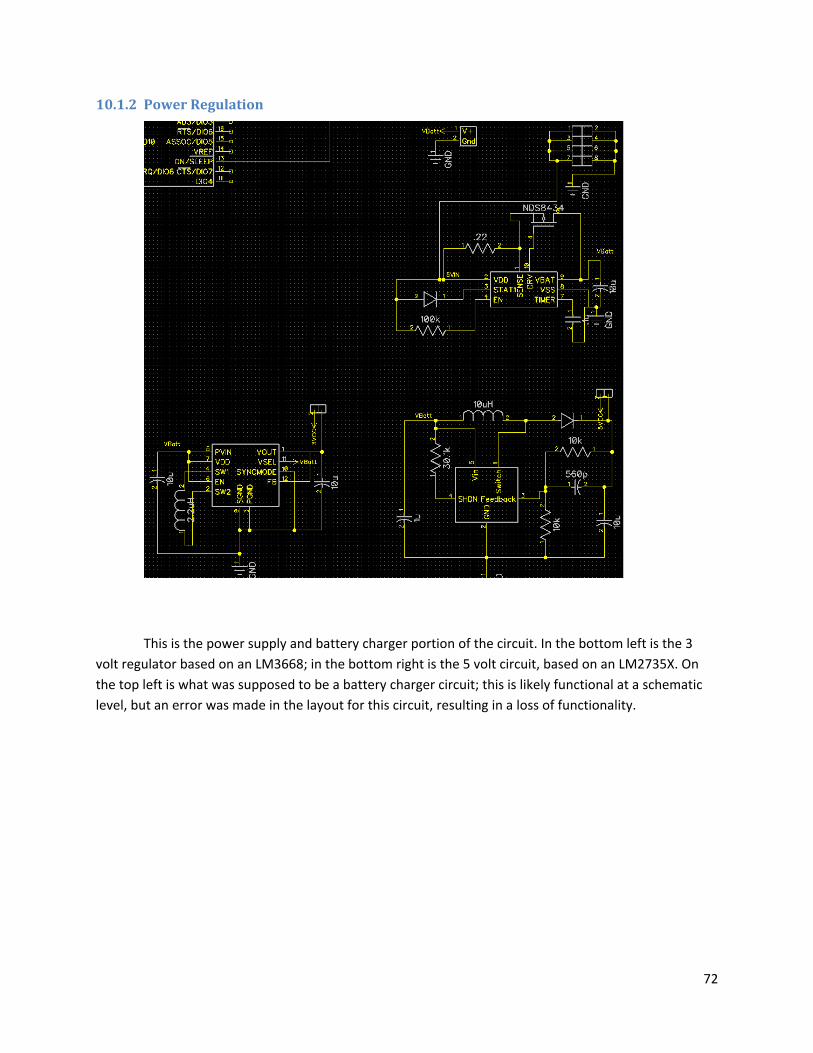
72
10.1.2 Power Regulation
This is the power supply and battery charger portion of the circuit. In the bottom left is the 3
volt regulator based on an LM3668; in the bottom right is the 5 volt circuit, based on an LM2735X. On
the top left is what was supposed to be a battery charger circuit; this is likely functional at a schematic
level, but an error was made in the layout for this circuit, resulting in a loss of functionality.
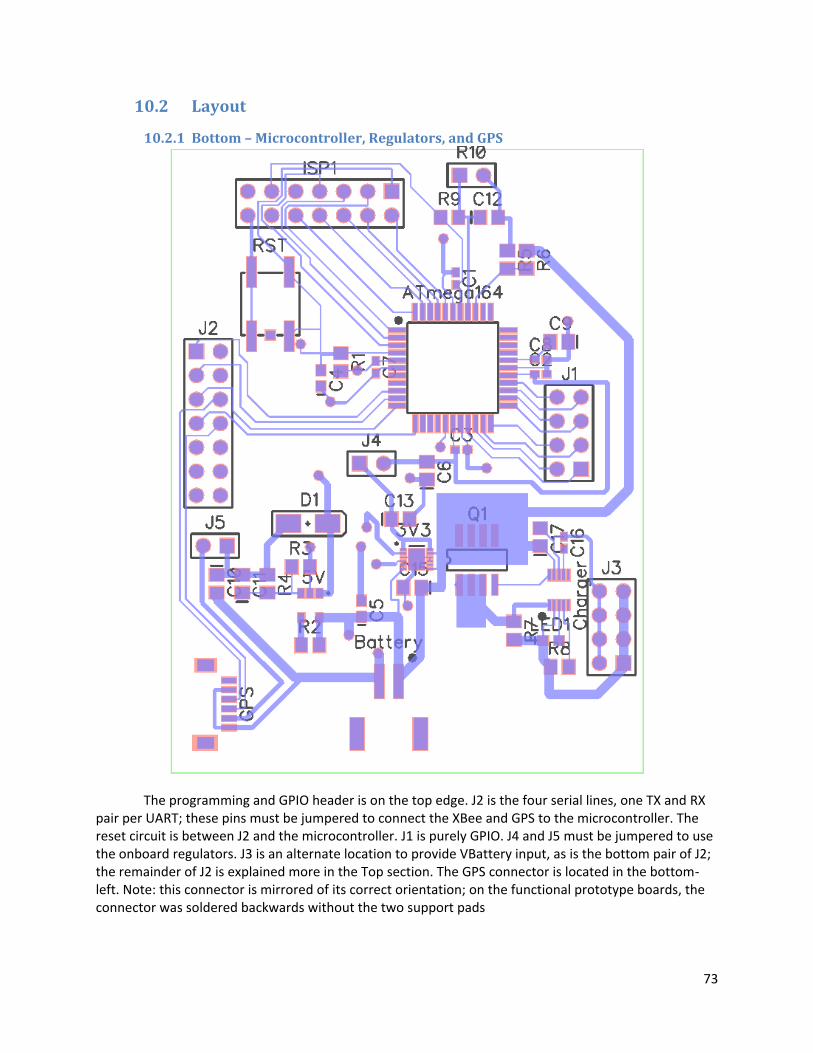
73
10.2 Layout
10.2.1 Bottom – Microcontroller, Regulators, and GPS
The programming and GPIO header is on the top edge. J2 is the four serial lines, one TX and RX pair per UART; these pins must be jumpered to connect the XBee and GPS to the microcontroller. The reset circuit is between J2 and the microcontroller. J1 is purely GPIO. J4 and J5 must be jumpered to use the onboard regulators. J3 is an alternate location to provide VBattery input, as is the bottom pair of J2; the remainder of J2 is explained more in the Top section. The GPS connector is located in the bottom-left. Note: this connector is mirrored of its correct orientation; on the functional prototype boards, the connector was soldered backwards without the two support pads
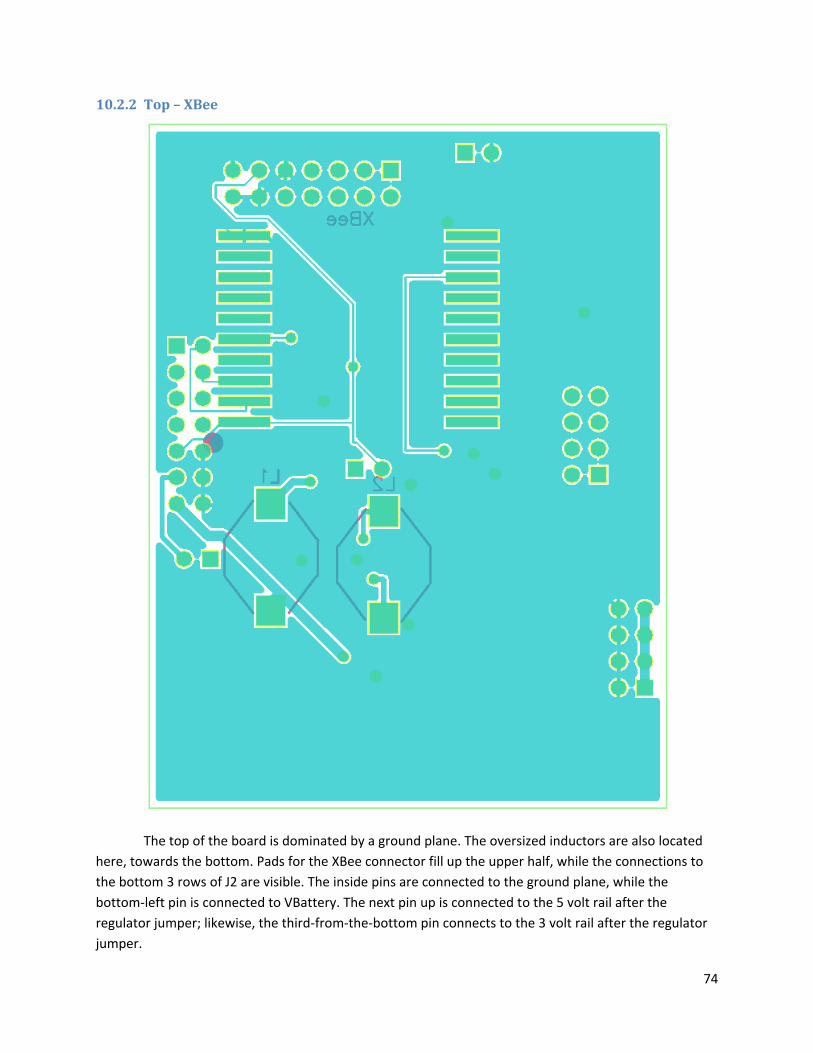
74
10.2.2 Top – XBee
The top of the board is dominated by a ground plane. The oversized inductors are also located
here, towards the bottom. Pads for the XBee connector fill up the upper half, while the connections to
the bottom 3 rows of J2 are visible. The inside pins are connected to the ground plane, while the
bottom-left pin is connected to VBattery. The next pin up is connected to the 5 volt rail after the
regulator jumper; likewise, the third-from-the-bottom pin connects to the 3 volt rail after the regulator
jumper.
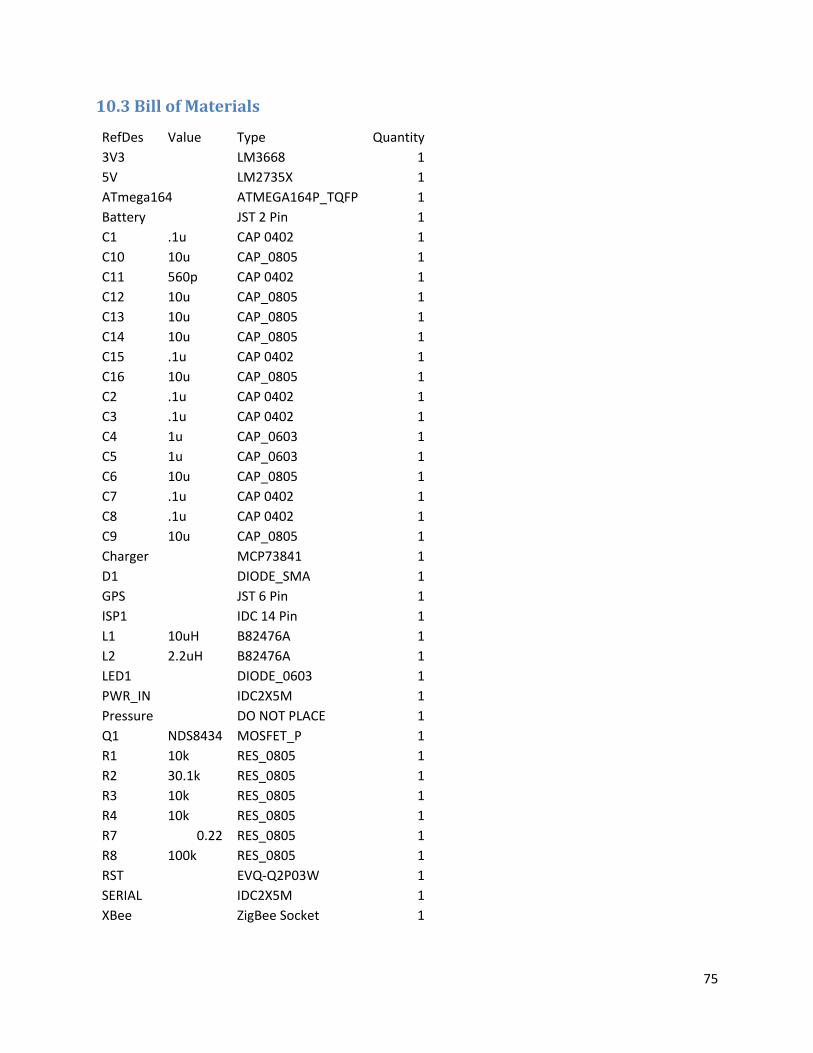
75
10.3 Bill of Materials
RefDes Value Type Quantity
3V3
LM3668 1
5V
LM2735X 1
ATmega164 ATMEGA164P_TQFP 1
Battery
JST 2 Pin 1
C1 .1u CAP 0402 1
C10 10u CAP_0805 1
C11 560p CAP 0402 1
C12 10u CAP_0805 1
C13 10u CAP_0805 1
C14 10u CAP_0805 1
C15 .1u CAP 0402 1
C16 10u CAP_0805 1
C2 .1u CAP 0402 1
C3 .1u CAP 0402 1
C4 1u CAP_0603 1
C5 1u CAP_0603 1
C6 10u CAP_0805 1
C7 .1u CAP 0402 1
C8 .1u CAP 0402 1
C9 10u CAP_0805 1
Charger
MCP73841 1
D1
DIODE_SMA 1
GPS
JST 6 Pin 1
ISP1
IDC 14 Pin 1
L1 10uH B82476A 1
L2 2.2uH B82476A 1
LED1
DIODE_0603 1
PWR_IN
IDC2X5M 1
Pressure
DO NOT PLACE 1
Q1 NDS8434 MOSFET_P 1
R1 10k RES_0805 1
R2 30.1k RES_0805 1
R3 10k RES_0805 1
R4 10k RES_0805 1
R7 0.22 RES_0805 1
R8 100k RES_0805 1
RST
EVQ-Q2P03W 1
SERIAL
IDC2X5M 1
XBee
ZigBee Socket 1
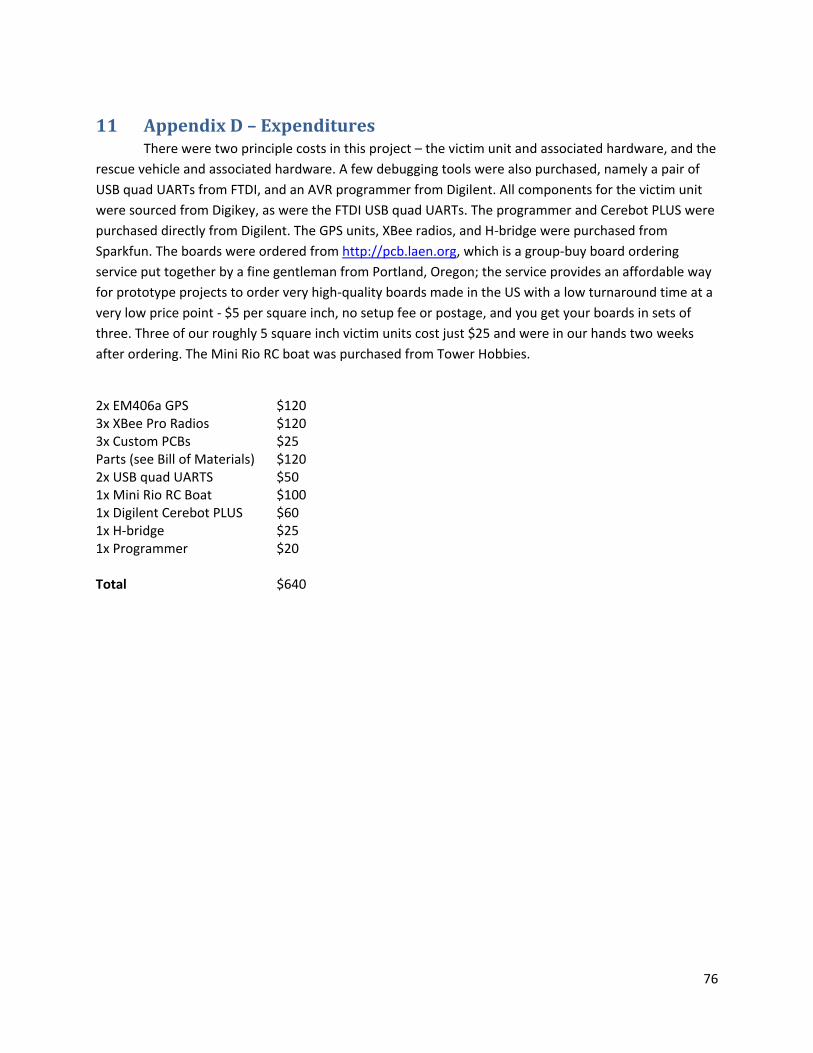
76
11 Appendix D – Expenditures There were two principle costs in this project – the victim unit and associated hardware, and the
rescue vehicle and associated hardware. A few debugging tools were also purchased, namely a pair of
USB quad UARTs from FTDI, and an AVR programmer from Digilent. All components for the victim unit
were sourced from Digikey, as were the FTDI USB quad UARTs. The programmer and Cerebot PLUS were
purchased directly from Digilent. The GPS units, XBee radios, and H-bridge were purchased from
Sparkfun. The boards were ordered from http://pcb.laen.org, which is a group-buy board ordering
service put together by a fine gentleman from Portland, Oregon; the service provides an affordable way
for prototype projects to order very high-quality boards made in the US with a low turnaround time at a
very low price point - $5 per square inch, no setup fee or postage, and you get your boards in sets of
three. Three of our roughly 5 square inch victim units cost just $25 and were in our hands two weeks
after ordering. The Mini Rio RC boat was purchased from Tower Hobbies.
2x EM406a GPS $120 3x XBee Pro Radios $120 3x Custom PCBs $25 Parts (see Bill of Materials) $120 2x USB quad UARTS $50 1x Mini Rio RC Boat $100 1x Digilent Cerebot PLUS $60 1x H-bridge $25 1x Programmer $20 Total $640