marine p&i - · pdf filep&i insurance providers. we believe that information is king,...
TRANSCRIPT

MARINE P&I AJGINTERNATIONAL.COM ARTHUR J. GALLAGHER 1
MARINE P&ICOMMERCIAL MARKET REVIEW OCTOBER 2014

MARINE P&I AJGINTERNATIONAL.COM ARTHUR J. GALLAGHER 2 MARINE P&I AJGINTERNATIONAL.COM ARTHUR J. GALLAGHER 3
CONTENTS
Commercial P&I Market Review 2014 4
Welcome From the Executive Director 7The World of P&I According to AJG 8Executive Summary 10P&I Fixed Premium Market Explained 16Review of the last 12 Months 19Non-IG P&I Market Overview 20Introduction to Market Facts & Figures 22
Market Facts and Figures 23
British Marine 24Carina 26Eagle Ocean Agencies Inc 28Hanseatic Underwriters 30Hydor AS 32Ingosstrakh Insurance Co 34Lodestar Marine Limited 36Navigators Insurance Company 38Osprey Underwriting Agency Limited 40RaetsMarine BV 42Rosgosstrakh Ltd 44
Non IG Mutual Market Facts & Figures 46China Shipowners Mutual Assurance Association 46Korea Shipowners Mutual P&I Association 48
Non-IG Charterers Facts & Figures 50Charterama BV 50Charterers P&I Club 52 Norwegian Hull Club 54
Industry Statistics 56
P&I Premium Income Development 58P&I Owned GT Development 60Average P&I Rate per GT Development 62P&I Charterers & Traders Premium Income Development 64Number of Vessels Insured Development 66Average Premium per Vessel Development (Charterers) 68Non-IG Mutual Owned GT Development 70Average Non-IG P&I Mutual Rate per GT Development 71 Rating Agency Analysis 72
Major Limiting Conventions & Statutes Affecting P&I Risks 74
Developments in the last 12 months 76
Marine Division Contacts 87
Marine One Stop Solution 88
FOUNDED BY ARTHUR J. GALLAGHER IN CHICAGO IN 1927, ARTHUR J. GALLAGHER & CO HAS GROWN TO BE ONE OF THE LARGEST, MOST SUCCESSFUL INSURANCE BROKERAGE AND RISK MANAGEMENT COMPANIES IN THE WORLD. WITH EXTRAORDINARY REACH AND DEPTH ACROSS INTERNATIONAL BORDERS, OUR PARENT GROUP EMPLOYS OVER 17,000 PEOPLE AND ITS GLOBAL NETWORK PROVIDES SERVICE IN MORE THAN 140 COUNTRIES.Outside the US, we use the brand name Arthur J. Gallagher.
Wherever and whenever there is an issue of risk we’re there for our clients - from individuals to small businesses to international conglomerates. Our people, our depth of technical expertise and our global reach is critical in delivering unrivalled coverage, risk management and placement expertise.
We work seamlessly across countries and international territories. Where we do encounter difficulties and complexities we meet them head on. We dismantle barriers never letting them get in the way.
We work tirelessly to provide solutions that drive value and competitive advantage for the benefit of all our clients and we liberate our people to do what they do best: promoting and protecting our clients’ interests. We just do not give up; whether it’s sourcing cover for the thatched cottage in England; cyber risks across European borders; complex coverage for the international supermarket chain; marine cargo in Australia; political risk coverage in developing economies; energy cover in extreme environments; or helping our banking partners with their comprehensive homeowner offer.
Family values have been core to our culture since our company was founded and this drives the way in which we, Arthur J. Gallagher, look after our clients. Since 1927 we have built our business for today. For tomorrow, we continue to invest in our business.
A BUSINESS WITHOUT BARRIERS
1
2
3
5
4

MARINE P&I AJGINTERNATIONAL.COM ARTHUR J. GALLAGHER 4 MARINE P&I AJGINTERNATIONAL.COM ARTHUR J. GALLAGHER 5
COMMERCIAL P&I MARKET REVIEW 2014
1

MARINE P&I AJGINTERNATIONAL.COM ARTHUR J. GALLAGHER 6 MARINE P&I AJGINTERNATIONAL.COM ARTHUR J. GALLAGHER 7
Arthur J. Gallagher is one of the leading global marine insurance brokers in the P&I industry sector. One of our core principles is transferring all pertinent market information, statistics as well as our independent reviews on the various P&I insurance providers. We believe that information is king, whereby we aim to enhance information streams to our clients and business partners, which is essential to remain successful this competitive market environment.
The Arthur J. Gallagher “Commercial P&I Market Review” was the first comprehensive review of its kind and compliments our mutual IG Club “Annual Pre-Renewal P&I Review” offering, which will be published later this autumn.
We closely monitor and analyse the P&I market, as it continues to evolve with its ever changing products, service, security, strength and flexibility. Our view at Arthur J. Gallagher is that the Non-IG market continues to play an important role the maritime insurance industry, offering alternative products and services to the small ship sector, where in previous years IG-P&I Clubs have lacked enthusiasm to participate in this risk profile.
As part of the P&I market evolution, we note however that some of the IG-Club managers have developed new fixed P&I facilities and have moved into the commercial market sector to diversify their product ranges, in order to increase revenue streams to enhance free-reserves further.
With the challenging shipping market still trading through this prolonged depressed freight market environment, the commercial P&I market may offer an opportunity for a segment of the world’s small ship operators to reduce their operational expenditure, which this review will offer more detail on.
The “AJG Commercial P&I Market Review” will focus on the leading fixed premium, non-IG mutual and charterers liability facilities, which are generally accessed via London brokers.
Arthur J. Gallagher P&I remains at the forefront as industry leaders, this is something we are extremely proud of and demonstrates our unrivalled value added service and commitment to our clients and partners alike.
Yours sincerely,
Malcolm Godfrey
Executive Director Marine Division | Specialty Risks
WELCOME TO OUR THIRD ANNUAL COMMERCIAL P&I MARKET REVIEW
WELCOME FROM THE EXECUTIVE DIRECTOR
MALCOM GODFREY EXECUTIVE DIRECTOR | MARINE DIVISION | SPECIALTY RISKS

MARINE P&I AJGINTERNATIONAL.COM ARTHUR J. GALLAGHER 8 MARINE P&I AJGINTERNATIONAL.COM ARTHUR J. GALLAGHER 9
THE WORLD OF P&I ACCORDING TO AJG
COMMERCIAL P&I MARKET REVIEW 2014 THE WORLD OF P&I ACCORDING TO AJG
USA, NEW YORK
• Eagle Ocean Marine
INTERNATIONAL GROUP P&I CLUB
COMMERCIAL P&I MARKET
NON-IG MUTUAL P&I CLUB
UK, LONDON
• Britannia P&I Club
• London P&I Club
• Shipowners P&I Club
• Standard Club
• Steamship Mutual P&I
• The UK Club
• West of England
UK, LONDON
• British Marine (QBE Group)
• Carina
• Lodestar Ltd
• Navigators P&I
• Osprey Underwriting Agency
• Charterers P&I Club
USA, NEW YORK
• American Club
UK, NEWCASTLE
• North of England
CHINA, BEIJING
• China P&I Club
KOREA, SEOUL
• Korea P&I Club
JAPAN, TOKYO
• Japan P&I Club
GREECE, ATHENS
• Aigaion Insurance Co. SA
NORWAY, BERGEN
• Norwegian Hull Club
NORWAY, OSLO
• Hydor AS
RUSSIA, MOSCOW
• Ingosstrakh
• Rosgosstrakh Ltd
GERMANY, HAMBURG
• Hanseatic Underwriters
NETHERLANDS, ROTTERDAM
• RaetsMarine BV
• Charterama BV
NORWAY, OSLO
• Skuld P&I
SWEDEN, GOTHENBURG
• Swedish Club
NORWAY, ARENDAL
• Gard AS

MARINE P&I AJGINTERNATIONAL.COM ARTHUR J. GALLAGHER 10 MARINE P&I AJGINTERNATIONAL.COM ARTHUR J. GALLAGHER 11
2013 HIGHLIGHTS The allure of fixed premium P&I has intensified in the last five years, which can be discerned by the abundance of capacity and more competition than ever before. With over twenty- five fixed premium insurers and agency facilities operating within the P&I commercial market sector, when will this expansion period end?! The fixed P&I market is viewed as a dynamic marketplace, with aggressive competition, without IGA (International Group Agreement) constraints slowing down business transferring for a better deal. With the expansion and oversupply diluting fixed market premiums annually, could the fixed market move into a loss making business like their hull & machinery and IG-P&I Club counterparts, if rates continue to diminish?
FIXED P&I RATES CONTINUE TO FALL2013 saw the market average rate per GT reduce by another -5.48%, which is a significant difference from the -2.07% average reduction in 2012. In the last five years owned fixed P&I rates have fallen by an average of -9.84%, which suggests that the new entrant expansion cycle, combined with oversupply continued to prolong the commercial soft market
environment. The average P&I owned fixed rate per GT is approximately US$ 6.55 PGT, which is the lowest average in the last five years. The owned P&I market premium decreased from US$ 291.6 million from US$ 289.3 million (-0.79%) in 2012 and the GT development also grew by 2.085 million GT since 2012 (+4.9%).
BUSINESS ENVIRONMENT
2014 has revealed more challenges for some of the new fixed premium market facilities, in particular those new entrants competing for market share. All fixed premium facilities are backed by insurance organisations providing capacity (reinsurance support). One of the major challenges amongst the new entrants is to balance growth expectations to avoid backers losing interest and forcing a potential market exit, by withdrawing reinsurance support. With the average owned P&I rate at a five year low and with more facilities entering an already soft market, only time will tell as to how long some of these facilities will last. However, if a facility is forced out of the market, another new entrant will surely take its place as there may be need for some insurers to diversify their product ranges to meet various solvency and capital adequacy requirements. Therefore in short we do not see the market consolidating in the short to medium term; however we see the market continuing to expand with average rates continuing to decrease.
NEW ENTRANT DEVELOPMENT2013 was an admirable year for some of the commercial markets newest agency facilities, with Hydor A/S making premium gains of +80% (US$ 4 million), GT gains of 8.6%, reporting an average rate per GT US$ 6.92 (a 65.9% increase on the 2012 rate per GT). Lodestar Ltd has also quickly become a top five facility (by premium income) with a twelve month premium gain of +51.5% (US$ 8.5 million), average rate per GT development of (-2.2%) suggests that the facility has managed to somewhat balance competition and underwriting discipline during the 2013 policy year. Lodestar have written US$ 25 million of premium income in the last two years proving that market relationships and broker support is paramount for success in the marine insurance industry.
THE OLD(ISH) GUARDThe established and intermediate fixed P&I providers continue to grapple for market share during this new entrant expansion phase. In 2013 many of the established providers saw premium income decline in the region of (-2.5%) to (-21.8%) on a twelve month basis, and up to (-20%) on a five year basis. RaetsMarine was one of the only established fixed premium providers to see growth in 2013, with an owned premium increase of +4% (US$ 2 million). The established and intermediate fixed markets currently command a total owned P&I premium income of US$ 243.5 million or 84.17%
of the fixed premium owned market, therefore in actual premium terms the new entrant expansion period has seen approximately US$ 45.8 million (15.83%) transfer to new entrant fixed facilities in the last four years (this figure is likely to be more if you consider what IG facilities have taken from the market also). We must not ignore the fact that part of every renewal will include clients leaving the marine industry, selling their assets or laying up vessels (however the owned GT grew by 4.96% in 2013), therefore the reported market development fluctuations are not a result of competition or business transferring alone. We have generally observed that once a facility enters into the “established” category, as a mature business, growing income and market share becomes more of a challenge. Instead the battle of maintaining market share ultimately becomes the test itself. These established markets may need to find a way to diversify and evolve in order to persevere and develop their facilities further.
IG CLUB DIVERSIFICATION Eleven of the thirteen IG P&I Clubs (or Club Managers) offer a fixed premium alternative, with four new facilities being launched only within the last two years. 20th February 2014 saw the soft launch of the new Standard Club fixed premium P&I facility, which was set up to back the newly formed Turkish P&I Agency. The Standard Club fixed facility, is backed by 100% by Lloyds of London and can offer limits up to USD 500 million, targeting vessels up to 5,000 GT. In early March, the completion of the Sunderland Marine and the North of England P&I Association merger was announced, to create the North Group, which adds another re-branded player to fixed premium market. Looking back to autumn 2013, Japanese insurance company Mitsui Sumitomo and Skuld P&I joined forces to facilitate Mitsui offering a blue-water fixed-premium P&I product to the Japanese ship-owning community. This diversification strategy will no doubt put pressure on the existing Japan P&I Club Naiko (Coastal) Class to maintain a local market majority share. If fixed market trends follow the same trajectory then the Japanese small ship operators will be pleased to see fixed P&I rates fall in the region. With the London and UK Club being the only two IG Clubs without a fixed premium P&I facility (excluding charterer’s liability insurance), will we soon see all thirteen IG Clubs compete in this sector within the current IGA framework?
TWELVE MONTH P&I OWNED MARKET DEVELOPMENT PERFORMANCE INDICATOR
PREMIUM INCOME USD
-0.07%
GROSS TONNAGE
+4.9%
AVERAGE RATE PER GT (PGT)
-5.48%2012 PY 2013 PY 2012 PY 2013 PY 2012 PY 2013 PY
USD 291,631,000 USD 289,330,000 42,052,000 44,137,000 USD 6.935 USD 6.555
COMMERCIAL P&I MARKET REVIEW 2014 EXECUTIVE SUMMARY
“SURVIVAL OF THE FITTEST”THE FIXED P&I MARKET MUST EVOLVE TO STAY AHEAD OF THE GAME
ALEX VULLO ASSOCIATE DIRECTOR | MARINE DIVISION | SPECIALTY RISKS
$7.800
$7.600
$7.400
$7.200
$7.000
$6.800
$6.600
$6.400
$6.200
$6.000
AVERAGE RATE PER GROSS TON DEVELOPMENT (US$)
2008 2009 2010 2011 2012 2013 2008 2009 2010 2011 2012 2013
AVERAGE RATE PER GT DEVELOPMENT (US$ PGT)
$7.700
$7.500
$7.300
$7.100
$6.900
$6.700
$6.500
2009 2010 2011 2012 2013
AVERAGE PREMIUM PER VESSEL DEVELOPMENT (US$)
$6,550
$6,450
$6,350
$6,250
$6,150
$6,050
$5,950
$5,850
$5,750
$5,6502008 2009 2010 2011 2012 2013
OWNED P&I PREMIUM DEVELOPMENT (US$’000)
$310,000
$290,000
$280,000
$270,000
$260,000
$250,000
$240,000
$230,000
$220,000
$210,000
AVERAGE RATE PER GT DEVELOPMENT (USD PGT) OWNED P&I PREMIUM DEVELOPMENT (USD'000)
OWNED P&I (5 YEAR DEVELOPMENT)
Policy Year Premium Income (USD ‘000)
Market GT (‘000) Av. Rate Per GT Change %
2009 USD 261,893 36,019 USD 7.271 -
2010 USD 275,886 36,022 USD 7.659 +5.33%
2011 USD 286,213 40,417 USD 7.082 -7.54%
2012 USD 291,631 42,052 USD 6.935 -2.07%
2013 USD 289,330 44,137 USD 6.555 -5.48%

MARINE P&I AJGINTERNATIONAL.COM ARTHUR J. GALLAGHER 12 MARINE P&I AJGINTERNATIONAL.COM ARTHUR J. GALLAGHER 13
FIVE YEAR HIGHS & LOWSThe overall fixed owned market premium reduced by -0.79% ($2.3 million) in 2013, where the total premium reported stood at US$ 289.3 million. However, the overall GT development increased by 4.96% (2.085 million GT), suggesting that a fraction of business transferred to IG fixed facilities in 2013. The average owned fixed rate per GT reduce by 5.48% to US$ 6.55 per GT, compared to the 2012 average
rate of US$ 6.93 per GT, representing a new five year low, suggesting that premiums are continuing to dilute. New entrant Eagle Ocean Marine currently has the highest rate per GT at US$ 11.864, with a small GT level of 0.59 million GT, whereas established RaetsMarine has the second lowest rate of US$ 3.38 per GT but has the highest level of GT reported at 15.3 million.
COMMERCIAL P&I MARKET REVIEW 2014 EXECUTIVE SUMMARY
TWELVE MONTHS AVERAGE RATE PER GT DEVELOPMENT (MARKET OVERVIEW)
NON-IG CHARTERERS & TRADERS MARKET Since the start of the financial and shipping downturn in 2008/09 the charterers liability market volume has slowly increased by 39.51% in the last five years, albeit reported as a deficit of -0.31% in 2013 (-1,437 vessels). Premiums on the other hand have also increased slightly by +1.61% at US$ 75.9 million reported for 2013, compared to US$ 74.7 million in 2012 (+1.2 million). The average premium per vessel has
also slightly decreased by 1.33%. The charterer’s liability market development figures are based on premium vs. volume averages to demonstrate how the market premium rating for this risk profile has developed in the past five years. It is important to note that a charterer may be on risk from anywhere between 1 day and 365 days within the policy period, which is not taken into account on the average premium vessel per figure.
CHARTERERS & TRADERS
Policy Year Premium
Income (USD’000)
No. Vessels Insured Av. Premium Per vessel
Change %
2009 USD 65,050 32,901 USD 6,493 -
2010 USD 68,400 39,501 USD 5,828 -10.23%
2011 USD 69,150 42,463 USD 5,851 +0.39%
2012 USD 74,700 46,043 USD 5,867 +0.28%
2013 USD 75,900 45,900 USD 5,789 -1.33%
NON-IG MARKET DEVELOPMENTWe have looked back to the policy years ranging from 2008 to 2012 in view of the China P&I Club not yet releasing their 2013 report on accounts. The five year development statistics reveal that the average rate per ton has moved back to the 2008 policy level, albeit the overall GT has increased by more
than doubled during this time. The Korean P&I Club however reportedly grew their 2013 P&I income by 3% (2013 income at US$ 31.1 million) and their GT grew by 53.74% to 18.1 million GT.
$7.800
$7.600
$7.400
$7.200
$7.000
$6.800
$6.600
$6.400
$6.200
$6.000
AVERAGE RATE PER GROSS TON DEVELOPMENT (US$)
2008 2009 2010 2011 2012 2013 2008 2009 2010 2011 2012 2013
AVERAGE RATE PER GT DEVELOPMENT (US$ PGT)
$7.700
$7.500
$7.300
$7.100
$6.900
$6.700
$6.500
2009 2010 2011 2012 2013
AVERAGE PREMIUM PER VESSEL DEVELOPMENT (US$)
$6,550
$6,450
$6,350
$6,250
$6,150
$6,050
$5,950
$5,850
$5,750
$5,6502008 2009 2010 2011 2012 2013
OWNED P&I PREMIUM DEVELOPMENT (US$’000)
$310,000
$290,000
$280,000
$270,000
$260,000
$250,000
$240,000
$230,000
$220,000
$210,0002009 2010 2011 2012 2013
$80,000
$75,000
$70,000
$65,000
$60,000
$55,000
PREMIUM INCOME DEVELOPMENT (US$)
2012 2013
$0.000 $2.000 $4.000 $6.000 $8.000 $10.000 $12.000
Average$6.555
British Marine
Carina
Eagle Ocean Marine
Hanseatic
Hydor AS
Ingosstrakh
Lodestar
Navigators
Osprey
Raetsmarine
Rosgosstrakh Ltd
NON-IG MUTUAL
Policy Year Premium
Income (USD’000)
No. Vessels Insured Av. Premium Per vessel
Change %
2008 USD 46,749 21,506 USD 4.480 -
2009 USD 63,868 25,218 USD 5.104 +13.93%
2010 USD 76,203 30,860 USD 5.788 +13.4%
2011 USD 90,196 37,807 USD 5.175 -10.59%
2012 USD 97,311 43,173 USD 4.695 -9.28%
TWELVE MONTH MARKET DEVELOPMENT BY OWNED P&I PREMIUM INCOME (USD ‘000)
# 2012 P&I Market
P&I owned income USD ‘000
Change # 2013 P&I Market
P&I owned income USD ‘000
Result
1 British Marine USD106,000 1 British Marine USD 100,000
-USD 6,000
2 Raetsmarine USD50,000 2 Raetsmarine USD 52,000 +USD 2,000
3 Osprey USD 38,400 3 Osprey USD 30,000 -USD 8,400
4 Ingosstrakh USD 23,523 4 Lodestar USD 25,000 +USD 8,500
5 Navigators USD 22,000 5 Ingosstrakh USD 21,800 -USD 1,723
6 Hanseatic USD 19,700 6 Navigators USD 21,430 -USD 570
7 Lodestar USD 16,500 7 Hanseatic USD 18,300 -USD 1,400
8 Eagle Ocean USD 6,500 8 Hydor AS USD 9,000 +USD 4,000
9 Hydor AS USD 5,000 9 Eagle Ocean USD 7,000 +USD 500
10 Rosgosstrakh USD 4,008 10 Rosgosstrakh USD 4,800 +USD 792
AVERAGE PREMIUM PER VESSEL DEVELOPMENT (USD) PREMIUM DEVELOPMENT (USD'000)

MARINE P&I AJGINTERNATIONAL.COM ARTHUR J. GALLAGHER 14 MARINE P&I AJGINTERNATIONAL.COM ARTHUR J. GALLAGHER 15
COMMERCIAL P&I MARKET OUTLOOK 2014/2015
CHALLENGES AHEAD“Survival of the fittest” may be an apt term to generalise the fixed premium market during this rapid expansion phase. Challenging times are certainly ahead for all market participants fighting for market share and new opportunities, particularly in a market where the “buyer” has control to pressure existing carriers to reduce premiums or move elsewhere for a better deal. How markets ultimately manage these factors, combined with claims control, loss prevention and reinsurance costs will continue to put pressure on carriers to survive for the future. Whilst painting a bleak picture of what challenges are indeed ahead, over capacity will mean rates will continue to fall in 2014/15.
We anticipate that average market rate per GT will continue to fall in 2014/15 as the effect of increased competition continues to re-shape the market. Each facility will no doubt need to increase their individual market share, to meet growth expectations and budgets, whereas others will need to simply defend their existing portfolio in this buyer’s market. If current trends continue, we expect to see another 5% to 10% reduction in the average rate per ton in 2014/15, bringing the average rate per ton down to between US$ 6.22 and US$ 5.89 per GT.
THE ESTABLISHED MARKETS• Maintaining market share will be the challenge for all
established markets in 2014/15, which is no change from the previous two years, as competition intensifies. We anticipate that the established markets will continue to maintain their existing strategies, whilst developing business in more focused geographical areas, as opposed to general expansion. On the whole we expect to see a further downward trend in premium, GT and rate per GT development whilst the market continues to develop during this expansion cycle.
• Balanced growth will be the challenge for the “intermediate” market facilities in 2014/15, in 2013 we saw most facilities “buy in” tonnage whereby their average rates per GT reduced by up to 17% in one year, resulting in further premium dilution.
• The new entrant and IG Club new fixed facilities will continue to apply pressure on the market; therefore we expect to see this sector drive down premiums further in 2014/15.
CONCLUSIONWe believe that the fixed premium market must look to evolve to stay ahead of market competition for the long term, this is more important for the established markets that are seeing significant downward trends in premiums, tonnage and average rate deterioration. The established and intermediate markets may need to consider offering new marine related products to complement their existing product ranges, as simply reducing rates at renewal and competing more aggressively for growth will only dilute premiums further and will ultimately add to fixed P&I becoming a loss making business in the future.
The three tiers of market facility will continue to battle in 2014/15, where established and intermediate markets will need to react to premium losses sustained in 2013/14. The new entrants will continue to grow at a measured pace whilst enhancing their reputation and developing their market presence.
The fixed premium market continues to play an important role in the marine insurance industry and as this market expands, so does market awareness, credibility and its desirability. All fixed facilities ultimately offer the same product and compete for the same business; however clients will need to be carefully guided on suitable market candidates in the selection process, as there are many factors and disparities offered by each carrier, such as service, reputation, flexibility at renewal, ability to put up security and most importantly pay claims. With rate reductions and even more capacity on the horizon clients will need to choose wisely to take advantage of this prevailing soft market, we at Arthur J. Gallagher are here to help!
COMMERCIAL P&I MARKET REVIEW 2014
BritishMarine
Carina Eagle Ocean Marine
2012 2013
Hanseatic Hydor AS Ingosstrakh Lodestar Navigators Osprey Raetsmarine RosgosstrakhLtd
$12.000
$10.000
$8.000
$6.000
$4.000
$2.000
$0.000
$6.555
2008 2009 2010 2011 2012
$6.000$5.800$5.600$5.400$5.200$5.000$4.800$4.600$4.400$4.200$4.000
AVERAGE PREMIUM PER VESSEL DEVELOPMENT (US$)
Average
$120,000
$100,000
$80,000
$60,000
$40,000
$20,000
$0
PREMIUM INCOME DEVELOPMENT (US$)
2008 2009 2010 2011 2012 2013
Non-IG Mutual Premium Income Development 2008-2012Korean P&I Club Development
AVERAGE PREMIUM PER VESSEL DEVELOPMENT (USD) PREMIUM DEVELOPMENT (USD'000)
EXECUTIVE SUMMARY

MARINE P&I AJGINTERNATIONAL.COM ARTHUR J. GALLAGHER 16 MARINE P&I AJGINTERNATIONAL.COM ARTHUR J. GALLAGHER 17
COMMERCIAL P&I MARKET REVIEW 2014
FIXED PREMIUM P&I INSURANCE EXPLAINED
WHAT IS FIXED PREMIUM INSURANCE?Fixed premium P&I insurance indemnifies ship owners, operators and charterers for third party liabilities arising from a fortuitous event or a marine peril. Third party risks include a carrier’s liability to a cargo owner for damage to cargo, a ship’s liability after a collision, environmental pollution, the ship’s liability to its crew, fines and war risks etc. The term “fixed premium” means exactly that, as the terms and conditions offered by a commercial insurance company, do not expose clients to potential excess supplementary calls, unlike IG Group Clubs.
The premiums involved in this market sector are often more competitive, compared to an IG Group Club option, as insurance packages are specifically tailored to meet the demands of the risk entailed, on a reduced limit of liability basis.
DO IG P&I CLUBS PROVIDE FIXED PREMIUM INSURANCE?Fixed premium insurance contracts are typically provided by insurance companies or underwriting agents outside of the International Group of P&I Clubs, however some of the IG P&I Clubs do provide “Owners P&I” fixed premium terms for some longstanding fleets, US flagged fleets and Government fleets, which have been approved by the International Group.
A number of P&I Clubs, such as American, Gard, Skuld, SOP and Steamship Mutual also have fixed P&I premium facilities in place for smaller inland craft and U.S. yachts. AJG will focus on these facilities in our “AJG International Group Club P&I Review 2013” which will be published towards the end of this year. All of the IG Clubs provide alternative fixed insurance products, such as Charterers’ Liability Insurance and other marine related products, which do not fall under the conventional IG Group P&I product or IG group reinsurance programme.
DIFFERENCES BETWEEN COMMERCIAL P&I MARKETS AND IG GROUP CLUB P&I INSURANCE
GENERAL INCREASES The fixed premium market does not adopt the annual general increase philosophy, which is a tradition practiced amongst most of the IG P&I Clubs. Renewals are instead underwritten on the assureds’ individual merits and loss record, although there may be increases sought on the basis of exposure, operating costs or the overall performance of the insurers portfolio.
ANNUAL MANDATORY REQUIREMENTS Over the last few years we have seen many P&I Clubs’ insert annual mandatory uplifts/ requirements, which are often non-negotiable, such as deductible increases etc. This is a practice which the commercial market does not follow.
PROSPECTS FOR SUPPLENTARY OR EXCESS CALLS IG Group Clubs have the power to make excess supplementary calls if there is a need to raise funds, which are non-negotiable. The non-mutual commercial insurance companies do not have this capability.
RELEASE CALLS The Commercial Market gives clients freedom to change insurer without having to release themselves from future liabilities to supplementary calls or excess supplementary calls, which is inherent within the IG Club rules.
COMPETITION The commercial insurance companies are able to offer independent terms as well as competing with each other to win business. All of the non-IG facilities are free from the constraints of the International Group Agreement, something which the IG Clubs voluntarily abide by.
SECURITY GUARANTEES IG P&I Clubs have an integral advantage over the commercial insurance market, with the ability to put up an immediate letter of guarantee to secure the release of an arrested vessel, without additional cost. However, fixed premium insurers typically need to contact their reinsurers to obtain security guarantees, which can take time and may come with additional costs, which would ordinarily be passed onto the assured. It is important to note that the ability of each individual insurance company differs, when it comes to issuing letters of security.
THE “OMNIBUS RULE” The fixed premium market does not benefit from the IG Club
“Omnibus Rule”, which allows the individual IG Club board’s to decide whether they can indemnify a Member in difficulty.
UNDERWRITING FOR PROFIT IG Group Clubs are focused on “not for profit service”, whereas a commercial insurance company can be more profit focused, which is an important factor to consider, when handling claims to ensure that the claimant is indemnified at an appropriate level. This is where a strong broker like AJG will add value!
SERVICE PHILOSOPHY In an IG Group Club, the managers are the “servants” of the Club, the overall control of the Clubs are in the hands of its Members and its ship owner boards, who decide on policy changes, scope of cover, claims payments and premiums calls.
LIMITS OF LIABILITY Without access to the International Group Pool, fixed premium coverage will be limited to a specific limit of liability, however clients may still be exposed to catastrophes, which could potentially exceed smaller limits. Choosing the appropriate level of cover is something that AJG can help you with.
BLUE CARDS Some fixed premium insurance companies issue blue cards which are not approved by a number of flag states or port authorities. It is vital to ensure that Bunker Blue Cards and/or CLC Blue Cards are accepted by the shipping authorities prior to trading.
CERTIFICATES OF FINANCIAL RESPONSIBILITY (COFR) A requirement under the US OPA 90 Act (United States Oil Pollution Act), where any vessel over 300 GT requires a valid COFR and COFR guarantee cover in place. Guarantee coverage is provided by several COFR guarantee companies, which require letters of undertaking by an International Group P&I Club, most of the fixed premium facilities are not approved by these guarantee companies. Therefore it is important to check this prior to trading to U.S. waters.
DIVIDENDS Some of the P&I Clubs pass back “dividends”, in the form of premium returns or not calling budgeted supplementary calls in full to the Membership if the Club has experienced a good underwriting year.
P&I FIXED PREMIUM MARKET EXPLAINED
P&I MARKET FACILTY VARIATIONS
FIXED PREMIUM P&I PROVIDERS There are three “facility types” that offer fixed premium P&I insurance, as follows:
THE INTERNATIONAL GROUP OF P&I CLUBSAll of the International Group of P&I Clubs offer alternative fixed premium solutions for their clients. These may include non-pooled insurance products such as charterer’s liabilities, offshore P&I, contractual liabilities, specialist operations etc., however, some of the IG P&I Club managers can provide fixed premium P&I covers aimed at smaller tonnages on a limited liability basis.
INSURANCE COMPANIESInsurance companies are business entities that generally look at multiple lines of insurance, be it marine or non-marine related risks. Insurance companies that provide marine
insurances typically can provide hull and machinery, cargo, ports and terminals, kidnap and ransom covers etc. some of these companies also provide fixed cost P&I insurance. In the past some of the demutualised P&I facilities and managing general agents have been purchased by independent insurance companies.
MANAGING GENERAL AGENTS (MGA)An MGA is an individual or business entity appointed by an insurance company to conduct and arrange insurance contracts on their behalf. An MGA generally acts as a fronting company for the insurer, as well as providing the insured with evidence of cover within the defined underwriting authority. MGA’s also service policies and most importantly handle claims. Traditionally MGA’s were formed where insurance companies wanted to expand their markets, but did not have their own resources or technical knowledge to open and staff offices, therefore utilising the services of an MGA.
The following table identifies the current “facilities” that are able to provide fixed premium P&I insurance:
International Group P&I Club Insurance Company Managing General Agent
Gard OffshoreBritish Marine (a brand of QBE Europe)
Carina (Lloyd's of London)
Japan Club Naiko (Coastal) Class Navigators P&I (Navigators)Charterama BV (Royal Sun Alliance)
North Group Ingosstrakh Insurance Co.Charterers P&I Club (Munich Re)
Shipowners P&I ClubRaetsmarine BV (Amlin Europe)
Eagle Ocean Marine (American Club)
Skuld P&I Club Rosgosstrakh LtdHanseatic P&I (Lloyd's of London)
Standard P&I Club Hydor AS (Brit Syndicate)
Steamship Yacht FacilityLodestar Marine Ltd (Royal Sun Alliance)
Swedish Club OffshoreNorwegian Hull Club (Lloyd's of London)
West of England P&I ClubOsprey Underwriting Agency (Lloyd's of London)

MARINE P&I AJGINTERNATIONAL.COM ARTHUR J. GALLAGHER 18 MARINE P&I AJGINTERNATIONAL.COM ARTHUR J. GALLAGHER 19
COMMERCIAL P&I MARKET REVIEW 2014
COMMERICIAL P&I MARKET TODAY MORE CAPACITY AND MORE COMPETITION THAN EVER BEFORE
The commercial P&I market has more than doubled in size since 2009, with seventeen non-IG P&I fixed premium and charterer’s liability specialist markets competing for business. With the over-supply of choice, we at AJG have observed P&I fixed rates reducing year on year, providing owners, operators and traders with an opportunity to reduce operating expenditure annually. In the last two years the market has seen more of the IG-P&I Clubs “awaken” in their attempts to diversify into this market sector, to increase revenues and free-reserves. In response to this change in appetite, the well-established commercial market facilities claim not to be intimidated by this change in stance, however they generally see it as an opportunity for the shipping community to become more aware of alternative P&I products and markets available.
The commercial market is still aimed at the smaller vessel operators, short-trade vessels, principally operating in coastal or inland waters typically within a tonnage range below 10,000 GT. Market facilities are available for vessels up to 40,000 gross tons (higher GT caps and limits are also available depending on the facility). For charterer’s liabilities, there are no vessel type or size restrictions among the specialist charterer’s liability facilities.
Limits up to USD 1 Billion are available, however typically the larger limit of choice is USD 500 million, where the majority of assureds are usually insured below USD 50 Million. All fixed premium facilities target ship owners, operators, charterers and traders emanating from all geographical areas (subject to EU/US Sanctions), however certain facilities tend to shy away from passenger, cruise and U.S. flagged, trans-Atlantic and trans-Pacific business. Coverage for over-age and non-IACS classed tonnage is also available from the majority of fixed premium facilities.
WHY CHOOSE FIXED PREMIUM?We at Gallagher London believe that some of the key advantages of insuring with a fixed premium insurer are that they can offer certainty of cost and lower, more accessible limits of liability, with no liabilities for unbudgeted supplementary calls or annual general increases. Not all of the alternative non-IG facilities offer fixed premium covers, some are mutual. In addition to this there are also exclusive charterer’s liability specialist insurers, which cater for charterers and traders. The fixed premium P&I market has continued to evolve considerably over the last five years, with more new entrants than exits from this industry sector. This is perhaps to be expected given the IG Group system’s workings and the competitive nature of the commercial market.
The following table provides a snapshot for the last five years' market development:
NON-IG MARKET DEVELOPMENT (YEARS 2009 – 2014)
ESTABLISHED MARKET (10yrs +)
INTERMEDIATE (5-10yrs) NEW ENTRANT (<5yrs) SPECULATIVE MARKET EXIT
British Marine (QBE) (Est. 1876)
Hanseatic P&I (Est. 2005)
Eagle Ocean Marine
(Est. 2010)
New Russian P&I Facility? Terra Nova Insurance Co. (2006)
Ingosstrakh (Est. 1974) Norwegian Hull Club (Est. 2008)
Rosgosstrakh P&I
(Est. 2010)
Axa Corporate Solutions (2008)
China P&I Club (Est. 1984)
Charterama BV (RSA) (Est. 2009)
Lodestar Marine Ltd (RSA) (Est. 2012)
InterCoastal Shipowners BV (2011)
Charterers P&I Club (Munich Re) (Est. 1986)
Hydor(Brit Syndicate) (Est. 2009)
India Ocean P&I Club (Est. 2013)
South of England Mutual (2011)
Osprey Underwriting Agency (Est. 1991)
Carina – Tindal Riley (Est. 2013)
Ceylon P&I Club (2012)
Raetsmarine BV (Amlin) (Est. 1993)
Skuld P&I Club (Fixed) (Est. 2013)
HEMPIRA (2014, due to consolidation with Aigaion)
Korea P&I Club (Est. 2000)
North Group (Sunderland Marine Merger) (Est. 2014)
Navigators P&I (Est. 2004)
Standard Club Fixed Facility (Est. 2014)
Aigaion Ins. Co. (Est. 2004)
P&I FIXED PREMIUM MARKET EXPLAINED
COMMERCIAL P&I MARKET NEWS REVIEW OF THE LAST 12 MONTHS
OCTOBER Mitsui Sumitomo and Skuld P&I Club join forces for Mitsui to offer a blue-water fixed-premium P&I product to the Japanese ship-owning community.
Navigators P&I announce the recruitment of Richard Lovett as underwriter (previously with Osprey Underwriting Agency).
NOVEMBER British Marine announces the recruitment of Julia Maly from competitor RaetsMarine and
Harriet Stillwell from the marine insurance broking community.
DECEMBER Hydor AS announces the recruitment of Andrey Mochalin as underwriter
Royal Sun Alliance downgraded by Standard & Poor’s from A to A- (Charterama BV & Lodestar).
JANUARY Lodestar’s David Mahoney departs to join marine insurance broking community.
Ingosstrakh Ins. Co. announces that the maximum limit of cover available has been increased to USD 1 billion from USD 500 million.
FEBRUARY RaetsMarine Insurance BV is approved as a designated insurer in Japan.
Michael Else & Co Ltd announces opening of Dubai based office Sextant Marine as a strategic hub.
Standard P&I Club soft launch their “Standard Fixed P&I” facility. The Standard Fixed facility is also one of the key backers to the Turkish P&I Club.
MARCH Lodestar Ltd announces an 88% business retention rate, as well as welcoming 82 new assureds, covering 335 vessels globally.
North of England P&I Association and Sunderland Marine Insurance Company Ltd complete all requirements to formally merge to form the “North Group”. The two companies will focus on “integration strategy” to deliver diversification to benefit the Club’s business profile and mutual membership.
Royal Sun Alliance upgraded by Standard & Poor’s from A- back to A (Charterama BV & Lodestar).
APRIL Eagle Ocean Marine announces that the maximum limit of cover available has been increased to from USD 50 million to USD 100 million. Furthermore EOM can also write vessels up to 25,000 GT (previous limit was 12,500 GT).
Hanseatic P&I accounted changes to their P&I and FD&D insurance consortium.
Michael Else & Co announces the opening of Sextant Marine Dubai, as a strategic hub to more efficiently handle overseas clients and provide further claims handling support.
MAY Charterama BV opens Hong Kong office, to be headed by ex-Norwegian Hull Club underwriter Powan Li.
Osprey Underwriting Agency announces that the maximum limit of cover available has been increased to USD 100 million to USD 500 million.
JUNE Hanseatic P&I announce relocation of London Office to 1 Royal Exchange Avenue.
Navigators P&I announce limit of liability increase by a factor 1.51 as of (8th June 2015) to comply with local Japanese law amendments to limits of liability.
OCTOBER Navigators P&I announce the recruitment of Jason Riley from the UK P&I Club
20
14
2013

MARINE P&I AJGINTERNATIONAL.COM ARTHUR J. GALLAGHER 20 MARINE P&I AJGINTERNATIONAL.COM ARTHUR J. GALLAGHER 21
COMMERCIAL P&I MARKET OVERVIEW
FACILITY CARRIER ANNUAL PREMIUM INCOME 2013 (USD)
TOTAL TONNAGE/ VESSELS INSURED
LOCATION MAXIMUM LIMIT MAX SIZE VESSEL EXCLUSIONS ETC
BRITISH MARINE QBE Insurance (Europe) Ltd S&P: A+
USD 100,000,000 11,000,000 GT LONDON, UNITED KINGDOM
USD 1 Billion No Cap. However focus on small & medium GT
Avoids passenger risks, dirty tankers, Tran-Pacific/ Atlantic.
CARINA Lloyd's of London
S&P: A+
UNDISCLOSED 2,000,000 GT LONDON, UNITED KINGDOM
USD 500 Million > 5,000 GT No U.S. flagged or managed business
CHARTERAMA BV Royal Sun Alliance
S&P: A
USD 10,000,000 10,500 Vessels ROTTERDAM, NETHERLANDS
USD 150 Million No limit No exclusions
CHARTERERS P&I Great Lakes/ Munich Re
S&P: AA-
USD 28,200,000 12,500 Vessels LONDON, UNITED KINGDOM
USD 500 Million No limit -
CHINA P&I CLUB Mutual Insurance Company
S&P: Unrated
US$ 69,900,000 31,700,000 GT BEIJING, CHINA No Limit -
EAGLE OCEAN MARINE American Club
S&P: BBB-
USD 7,000,000 590,000 GT NEW YORK, USA USD 100 Million >25,000 GT No U.S. flagged or yachts
HANSEATIC P&I Insurance Consortium – See Page
S&P: Various A Rated
USD 19,500,000 2,700,000 GT HAMBURG, GERMANY USD 500 Million >30,000 GT Bulkers
>20,000 GT Tankers
No U.S. flagged or managed business
HYDOR A/S Lloyd's of London
(Brit Syndicate 2987) S&P: A+
USD 9,000,000 1,300,000 GT BERGEN, NORWAY US$ 500 Million <10,000 GT No U.S. flagged or managed business
INGOSSTRAKH Ingosstrakh
S&P: BBB-
USD 21,800,000 5,001,155 MOSCOW, RUSSIA US$ 1 Billion <10,000 GT -
KOREAN P&I CLUB Mutual Insurance Company
AMB: A-
USD 31,127,000 18,192,000 GT SEOUL, KOREA USD 1 Billion No limit No coastal fishing vessels or dirty tankers over 10,000 GT
LODESTAR LTD Royal Sun Alliance
S&P: A
USD 25,000,000 2,756,154 GT LONDON, UNITED KINGDOM
USD 500 Million >20,000 GT Non-Tanker
>10,000 GT Tanker
No tankers trading to USA, US flagged, large cruise vessels
NAVIGATORS P&I Navigators Insurance Co.
S&P: A
USD 21,430,000 2,000,000 GT LONDON, UNITED KINGDOM
USD 500 Million >10,000 GT Dislike trans-Atlantic/ Pacific trade. No U.S. flagged business
NORWEGIAN HULL CLUB Norwegian Hull Club
S&P: A-
USD 11,000,000 UNDISCLOSED OSLO, NORWAY USD 200 Million No Limit Does not write tanker (persistent) cargoes.
OSPREY Lloyd's of London
S&P: A+
USD 30,000,000 1,800 Vessels LONDON, UNITED KINGDOM
USD 500,000 Million <10,000 GT No U.S. flagged or yachts
RAETSMARINE BV Amlin Europe N.V.
S&P: A-
USD 52,000,000 15,366,000 GT ROTTERDAM, NETHERLANDS
USD 500 Million >40,000 GT U.S. flagged business above USD 50 Million
ROSGOSSTRAKH LTD Rosgosstrakh Ltd
Local Rating: BB-/RU AA
USD 4,800,000 1,424,486 GT MOSCOW, RUSSIA USD 500 Million Tankers <8,500 GT
All others <25,000 GT -
COMMERCIAL P&I MARKET REVIEW 2014 NON-IG P&I MARKET OVERVIEW

MARINE P&I AJGINTERNATIONAL.COM ARTHUR J. GALLAGHER 22 MARINE P&I AJGINTERNATIONAL.COM ARTHUR J. GALLAGHER 23
INTRODUCTION TO FIXED P&I MARKET FACTS & FIGURESThe information contained in the Arthur J. Gallagher P&I facts and figures pages has been compiled by the various insurance providers contained in this report. As part of our assessment in choosing an appropriate fixed premium insurer(s) for our clients, amongst other key factors such as claims service, pricing, flexibility etc. AJG also considers the following parameters as essential indicators in the selection process.
REINSURANCE CARRIER:
The underlying security or insurance company providing the market capacity.
STANDARD AND POOR’S (S&P) RATING:
Arthur J. Gallagher operates a market security policy which sets a minimum standard for insurance markets which can be included on its acceptable market security list. A number of criteria are utilised to evaluate the financial condition of these markets and one of the criteria used is the ratings allocated by either Standard & Poor’s (S&P) or A M Best. The AJG (UK) security policy sets a minimum rating level of A- from these agencies as an indicator of acceptable security. See Page *** for more information on this policy. The specified rating attached to each facility is a credit rating based on S&P’s independent opinion regarding the ability of an issuer, corporation or association to meet its financial obligations. Such ratings are provided by organisations such as S&P and AM Best, also known as credit rating agencies. Each organisation applies its own merits in measuring credit and use a rating scale to publish their individual findings. Ratings are expressed as a letter grade for example AAA being the highest level.
MAXIMUM LIMIT OF LIABILITY AVAILABLE:
It is very common to see a limit of liability in insurance contracts, which stipulate limitations on the maximum amount payable under the contract. Further, the cost of defence, supplementary payments, and punitive damages may or may not be paid in addition to the limits. Separate limits often apply to claims for pollution and/or passenger or seamen claims. An annual aggregate limit may also be offered, which puts a maximum on the amount an insurer must pay in any one policy period.
VESSEL TYPE/ SIZE (GT) CAP:
This is the maximum size (gross ton) of vessel that can be insured by the facility.
FACILITY LOCATION(S):
The primary business location of the facility and various support and claims offices available. Local claims liaison offices are important to ensure that clients in different time zones can access claims or loss prevention assistance in a timely manner.
GEOGRAPHICAL SPREAD OF BUSINESS:
This is an indicator to show where business revenues derive from a geographical overview.
TYPE OF ENTERED VESSEL:
This indicator demonstrates what type of vessel a facility tends to write.
ANNUAL PREMIUM INCOME, GROSS TONNAGE AND PREMIUM PER GT DEVELOPMENT:
AJG analyses premium development to see how a particular facility is performing.
COMMERCIAL P&I MARKET REVIEW 2014
MARKET FACTS & FIGURES
2
MARINE P&I AJGINTERNATIONAL.COM ARTHUR J. GALLAGHER 24 MARINE P&I AJGINTERNATIONAL.COM ARTHUR J. GALLAGHER 25
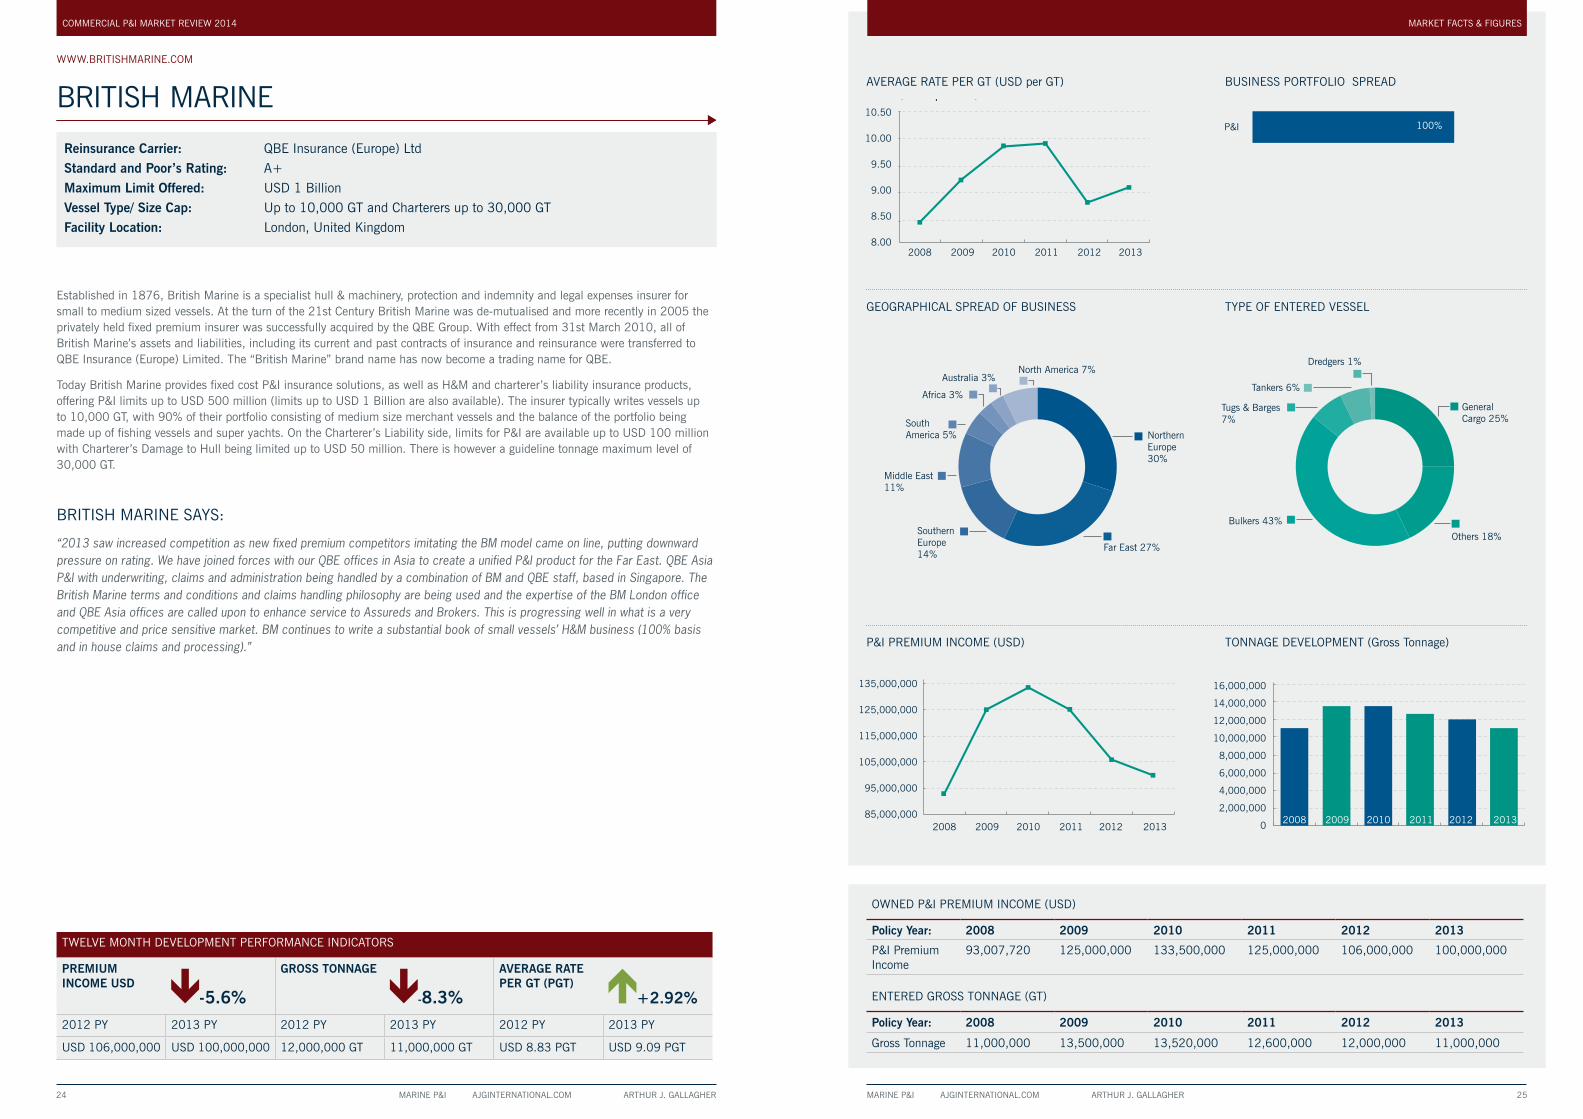
WWW.BRITISHMARINE.COM
BRITISH MARINE
Reinsurance Carrier: QBE Insurance (Europe) LtdStandard and Poor’s Rating: A+Maximum Limit Offered: USD 1 BillionVessel Type/ Size Cap: Up to 10,000 GT and Charterers up to 30,000 GTFacility Location: London, United Kingdom
Established in 1876, British Marine is a specialist hull & machinery, protection and indemnity and legal expenses insurer for small to medium sized vessels. At the turn of the 21st Century British Marine was de-mutualised and more recently in 2005 the privately held fixed premium insurer was successfully acquired by the QBE Group. With effect from 31st March 2010, all of British Marine’s assets and liabilities, including its current and past contracts of insurance and reinsurance were transferred to QBE Insurance (Europe) Limited. The “British Marine” brand name has now become a trading name for QBE.
Today British Marine provides fixed cost P&I insurance solutions, as well as H&M and charterer’s liability insurance products, offering P&I limits up to USD 500 million (limits up to USD 1 Billion are also available). The insurer typically writes vessels up to 10,000 GT, with 90% of their portfolio consisting of medium size merchant vessels and the balance of the portfolio being made up of fishing vessels and super yachts. On the Charterer’s Liability side, limits for P&I are available up to USD 100 million with Charterer’s Damage to Hull being limited up to USD 50 million. There is however a guideline tonnage maximum level of 30,000 GT.
BRITISH MARINE SAYS:
“2013 saw increased competition as new fixed premium competitors imitating the BM model came on line, putting downward pressure on rating. We have joined forces with our QBE offices in Asia to create a unified P&I product for the Far East. QBE Asia P&I with underwriting, claims and administration being handled by a combination of BM and QBE staff, based in Singapore. The British Marine terms and conditions and claims handling philosophy are being used and the expertise of the BM London office and QBE Asia offices are called upon to enhance service to Assureds and Brokers. This is progressing well in what is a very competitive and price sensitive market. BM continues to write a substantial book of small vessels’ H&M business (100% basis and in house claims and processing).”
TWELVE MONTH DEVELOPMENT PERFORMANCE INDICATORS
PREMIUM INCOME USD
-5.6%
GROSS TONNAGE
-8.3%
AVERAGE RATE PER GT (PGT)
+2.92%
2012 PY 2013 PY 2012 PY 2013 PY 2012 PY 2013 PY
USD 106,000,000 USD 100,000,000 12,000,000 GT 11,000,000 GT USD 8.83 PGT USD 9.09 PGT
COMMERCIAL P&I MARKET REVIEW 2014
Middle East11%
SouthernEurope14%
Far East 27%
NorthernEurope30%
SouthAmerica 5%
North America 7%Australia 3%
Africa 3%
P&I
BUSINESS PORTFOLIO SPREAD
100%
Bulkers 43%
Others 18%
GeneralCargo 25%
Tugs & Barges 7%
Dredgers 1%
Tankers 6%
2008 2009 2010 2011 2012 2013
2008 2009 2010 2011 2012 2013
135,000,000
125,000,000
115,000,000
105,000,000
95,000,000
85,000,000
10.50
10.00
9.50
9.00
8.50
8.00
16,000,000
14,000,000
12,000,000
10,000,000
8,000,000
6,000,000
4,000,000
2,000,000
0
P&I PREMIUM INCOME (USD)
TONNAGE DEVELOPMENT(Gross Tonnage)
AVERAGE RATE PER GT(USD per GT)
2008 2009 2010 2011 2012 2013
OWNED P&I PREMIUM INCOME (USD)
Policy Year: 2008 2009 2010 2011 2012 2013
P&I Premium Income
93,007,720 125,000,000 133,500,000 125,000,000 106,000,000 100,000,000
ENTERED GROSS TONNAGE (GT)
Policy Year: 2008 2009 2010 2011 2012 2013
Gross Tonnage 11,000,000 13,500,000 13,520,000 12,600,000 12,000,000 11,000,000
AVERAGE RATE PER GT (USD per GT) BUSINESS PORTFOLIO SPREAD
GEOGRAPHICAL SPREAD OF BUSINESS TYPE OF ENTERED VESSEL
P&I PREMIUM INCOME (USD) TONNAGE DEVELOPMENT (Gross Tonnage)
MARKET FACTS & FIGURES

MARINE P&I AJGINTERNATIONAL.COM ARTHUR J. GALLAGHER 26 MARINE P&I AJGINTERNATIONAL.COM ARTHUR J. GALLAGHER 27
WWW.CARINAPANDI.COM
CARINA
Reinsurance Carrier: Lloyd's of LondonStandard and Poor’s Rating: A+Maximum Limit Offered: Up to USD 500 MillionVessel Type/ Size Cap: Up to 5,000 GTFacility Location: London, United Kingdom
Carina is one of the most recent fixed premium new entrants starting in the early part of 2013. The facility is managed by Tindall Riley Marine (UK) Limited (who are the managers of the Britannia P&I Club), trading as Carina Managers. This facility offers fixed premium P&I coverage for Owners and Charterers of smaller vessels ranging up to 5,000 gross tons, operating in domestic or inland waters, worldwide. Policy limits of up to USD 500 million are available for Owners, whereas Charterers and Traders will be able to purchase limits up to USD 50 million.
The focus of the facility targets small ship sector operators only. Legal Defence Cover is also available together with additional ancillary covers that may be required. Carina will benefit from Tindall Riley Marine Limited vast experience in underwriting, claims and support services. Carina’s reinsurance programme is backed by Lloyd's of London syndicates, which hold an S&P A+ rating.
CARINA SAYS:
“Carina launched its business on 1 March 2013, so there are no figures relating to 2012. Carina does not have a ‘policy year,’ as such. In 2013, our Binder ran until 31 December, so the premium figures for 2013 would not be representative, covering just over 9 months of the year. Carina is now insuring over 4,200 ships, only 18 months after entering the market and that, we believe, is the most accurate indication of how well the facility has been supported. The combined net loss ratio for the year to 31 December 2013 is currently 72%. Carina believes that competition is a good thing and we always try to be as competitive as possible. Providing quotations by return and giving a first class service to the broker have helped us to build our reputation in a short period. Most of the new entrants are targeting ships of over 10,000 GT. Carina has focussed exclusively on ships with a maximum GT of 5,000. The new entrants have had little effect on the sector in which we specialise. To date, we have been very successful in retaining business, notwithstanding the competition. From Carina’s perspective, the last 12 months have been very successful. We have produced solid results and built a firm base in the small ships market. We intend to grow the business over the coming years and are very encouraged by the continuing interest in the facility.”
COMMERCIAL P&I MARKET REVIEW 2014
TWELVE MONTH DEVELOPMENT PERFORMANCE INDICATORS
PREMIUM INCOME USD
GROSS TONNAGE AVERAGE RATE PER GT (PGT)
2012 PY 2013 PY 2012 PY 2013 PY 2012 PY 2013 PY
No data provided
AVERAGE RATE PER GT (USD per GT) BUSINESS PORTFOLIO SPREAD
GEOGRAPHICAL SPREAD OF BUSINESS TYPE OF ENTERED VESSEL
P&I PREMIUM INCOME (USD) TONNAGE DEVELOPMENT (Gross Tonnage)
GEOGRAPHICAL SPREAD OF BUSINESS TYPE OF ENTERED VESSEL
Far East30%
Europe42%
Russia 21%
South America 7%
Passenger 14%
GeneralCargo 24%
Tankers 8% Tugs & Barges 37%
Others 12%
Fishing 5%
2,500,000
2,000,000
1,500,000
1,000,000
500,000
0
TONNAGE DEVELOPMENT(Gross Tonnage)
2008 2009 2010 2011 2012 2013
OWNED P&I PREMIUM INCOME (USD)
Policy Year: 2008 2009 2010 2011 2012 2013
P&I Premium Income
GROSS TONNAGE DEVELOPMENT (GT)
Policy Year: 2008 2009 2010 2011 2012 2013
Gross Tonnage - - - - - 2,000,000
No data providedNo data provided
No data provided
No data provided
MARKET FACTS & FIGURESGEOGRAPHICAL SPREAD OF BUSINESS TYPE OF ENTERED VESSEL
Far East30%
Europe42%
Russia 21%
South America 7%
Passenger 14%
GeneralCargo 24%
Tankers 8% Tugs & Barges 37%
Others 12%
Fishing 5%
2,500,000
2,000,000
1,500,000
1,000,000
500,000
0
TONNAGE DEVELOPMENT(Gross Tonnage)
2008 2009 2010 2011 2012 2013

MARINE P&I AJGINTERNATIONAL.COM ARTHUR J. GALLAGHER 28 MARINE P&I AJGINTERNATIONAL.COM ARTHUR J. GALLAGHER 29
WWW.EAGLEOCEANMARINE.COM
EAGLE OCEAN MARINE
Reinsurance Carrier: American P&I ClubStandard and Poor’s Rating: BBB-Maximum Limit Offered: Up to USD 100 MillionVessel Type/ Size Cap: Up to 25,000 GTFacility Location: New York, United States of America
Eagle Ocean Agencies, Inc. is an affiliated company of The Shipowners Claims Bureau, Inc., who are the managers of the American P&I Club, and Atlantic Marine Associates, Inc., which is a general marine adjusting and claims handling company. In 2010, the Directors of the American P&I Club formed a separate fixed premium facility, namely Eagle Ocean Marine, offering Protection and Indemnity and Freight, Demurrage and Defence insurance solutions. The facility is primarily focused on operators of smaller ships, below 25,000 gross tons, operating in regional waters, with policy limits being available up to $50 million for P&I and $2 million for FD&D. P&I coverage is available to operators on a worldwide basis; however coverage is not available to operators based in the U.S.A. or trading exclusively in U.S. waters. At present the facility is more Far East focused, with 60% of their portfolio emanating from this region.
The agency has recently re-structured its insurance and reinsurance arrangements, with American Steamship Owners Mutual Protection and Indemnity Association, Inc. providing the primary security. This in turn will allow Eagle Ocean to put up American Club security guarantees up to its primary limits, as well as providing American Club blue cards.
EAGLE OCEAN MARINE SAYS:
“With a softening ratings environment, EOM has focussed on maintaining a conservative approach to risk and therefore not allowing themselves to “follow the market down”. New entrants with high cost base are rating at prices which are unsustainable in the long term. EOM have confident that they will maintain its market share. The challenge is to grow the facility without compromising on rating. The fixed P&I market has continued to grow considerably over the past few years, doubling since 2008. The initial driver for this growth was smaller owners recognising the need to de-risk their operations, by moving capacity into the fixed P&I market, which gives them more transparency over what they will be paying for cover at a fixed annual cost. While rates may not continue to drop from current levels, EOM do not see any significant upwards movement in rates over the next 6 to 12 months. This in-balance will, ultimately, be reconciled. It will be interesting to see which players will remain.”
TWELVE MONTH DEVELOPMENT PERFORMANCE INDICATORS
PREMIUM INCOME USD
+7.6%
GROSS TONNAGE
-9.2%
AVERAGE RATE PER GT (PGT)
+18.6%2012 PY 2013 PY 2012 PY 2013 PY 2012 PY 2013 PY
USD 6,500,000 USD 7,000,000 650,000 GT 590,000 GT USD 10.00 PGT USD 11.86 PGT
COMMERCIAL P&I MARKET REVIEW 2014
AVERAGE RATE PER GT (USD per GT) BUSINESS PORTFOLIO SPREAD
GEOGRAPHICAL SPREAD OF BUSINESS TYPE OF ENTERED VESSEL
P&I PREMIUM INCOME (USD) TONNAGE DEVELOPMENT (Gross Tonnage)
OWNED P&I PREMIUM INCOME (USD)
Policy Year: 2008 2009 2010 2011 2012 2013
P&I Premium Income
- - 500,000 5,000,000 6,500,000 7,000,000
P&I Claims Incurred
50,000 3,000,000 5,000,000 1,200,000
ENTERED GROSS TONNAGE (GT)
Policy Year: 2008 2009 2010 2011 2012 2013
Gross Tonnage - - 50,000 470,000 650,000 590,000
2010 2011 2012 2013
GEOGRAPHICAL SPREAD OF BUSINESS
P&I
BUSINESS PORTFOLIO SPREAD
98%
FD&D 2%
TYPE OF ENTERED VESSEL
8,000,000
7,000,000
6,000,000
5,000,000
4,000,000
3,000,000
2,000,000
1,000,000
0
700,000
600,000
500,000
400,000
300,000
200,000
100,000
0
P&I PREMIUM INCOME (USD)
TONNAGE DEVELOPMENT(Gross Tonnage)
General Cargo 14%
Tugs & Barges 42%
Containers 3%
Tankers 22%
Bulkers 3%Fishing 1%
Others 15%
Africa 27%
Far East 59%
North America 1%
Fishing 1%
Middle East 6%
Southern Europe 3%
South America 1%
2010 2011 2012 2013
2010 2011 2012 2013
10.50
10.00
9.50
9.00
8.50
8.00
AVERAGE RATE PER GT(USD per GT)
2010 2011 2012 2013
GEOGRAPHICAL SPREAD OF BUSINESS
P&I
BUSINESS PORTFOLIO SPREAD
98%
FD&D 2%
TYPE OF ENTERED VESSEL
8,000,000
7,000,000
6,000,000
5,000,000
4,000,000
3,000,000
2,000,000
1,000,000
0
700,000
600,000
500,000
400,000
300,000
200,000
100,000
0
P&I PREMIUM INCOME (USD)
TONNAGE DEVELOPMENT(Gross Tonnage)
General Cargo 14%
Tugs & Barges 42%
Containers 3%
Tankers 22%
Bulkers 3%Fishing 1%
Others 15%
Africa 27%
Far East 59%
North America 1%
Fishing 1%
Middle East 6%
Southern Europe 3%
South America 1%
2010 2011 2012 2013
2010 2011 2012 2013
10.50
10.00
9.50
9.00
8.50
8.00
AVERAGE RATE PER GT(USD per GT)
MARKET FACTS & FIGURES

MARINE P&I AJGINTERNATIONAL.COM ARTHUR J. GALLAGHER 30 MARINE P&I AJGINTERNATIONAL.COM ARTHUR J. GALLAGHER 31
WWW.HANSEATIC_PANDI.COM
HANSEATIC UNDERWRITERS
Reinsurance Carrier: Allianz Global Corporate & Speciality AG – Swiss Re – Lloyd's of LondonStandard and Poor’s Rating: AA or AMaximum Limit Offered: Up to USD 500 MillionVessel Type/ Size Cap: 30,000 GT for Bulk Carriers and 20,000 GT for TankersFacility Location: Hamburg, Germany
Hanseatic P&I is an insurance consortium, which was founded in 2005, by five German Insurance Companies. All of the market participants in the consortium have an A or AA ratings. The consortium is managed by Zeller Associates Management Services GmbH, Hamburg. Hanseatic P&I provide ship owner’s liability, charterer’s liability and inland craft P&I cover. In addition FD&D is provided as either an additional or separate legal expenses cover under the brand name “Hanseatic Defence”, based on the same consortium of insurance companies as its P&I product. The facility offers P&I cover for all types of vessels with a limit up to USD 500 Million.
The core risk appetite of Hanseatic P&I is small and medium size general cargo and container vessels, as well as liquid cargo and dry bulk. Additionally Hanseatic has expertise in traditional, offshore and specialist vessels of any type. The underwriting philosophy at Hanseatic was originally focused on German and Northern European interests and later diversified its underwriting criteria to include other geographical areas. At present, Hanseatic P&I core business emanates from all parts of Europe, Russia and Turkey and it is presently looking to expand to select Middle East/North Africa and Asian regions.
HANSEATIC SAYS:
“Growth in both traditional and new markets has been our stand-out feature this year but to have managed that on the back of sustained and sensible pricing is very pleasing. The underwriting result is developing exceptionally well and is a reward for the faith shown in our team by the Hanseatic consortium which underwent a second renewal recently. The overall future for the sector should be seen as very good – at least there need be no stumbling blocks for those organisations with disciplined rating, experienced servicing capabilities and good relations with its security providers. We have managed a growth in written business of over 10% in the first 6 months of 2014 and anticipate a year-end increase approaching 20% overall on the previous year whilst sticking to our underwriting disciplines throughout. The modest reduction in premium and rate per GT in the reported figures represent, respectively, a re-writing of the book’s less profitable element during 2012/13 and an increase in ship size, with the facility being able to write up to 30,000GT dry and 20,000GT tanker tonnage.”
TWELVE MONTH DEVELOPMENT PERFORMANCE INDICATORS
PREMIUM INCOME USD
-7.1%
GROSS TONNAGE
+12.5%
AVERAGE RATE PER GT (PGT)
-12%2012 PY 2013 PY 2012 PY 2013 PY 2012 PY 2013 PY
USD 19,700,00 USD 18,300,000 2,400,000 GT 2,700,000 GT USD 8.21 PGT USD 7.22 PGT
COMMERCIAL P&I MARKET REVIEW 2014
AVERAGE RATE PER GT (USD per GT) BUSINESS PORTFOLIO SPREAD
GEOGRAPHICAL SPREAD OF BUSINESS TYPE OF ENTERED VESSEL
P&I PREMIUM INCOME (USD) TONNAGE DEVELOPMENT (Gross Tonnage)
OWNED P&I PREMIUM INCOME (USD)
Policy Year: 2008 2009 2010 2011 2012 2013
P&I Premium Income 7,700,000 11,200,000 14,700,000 15,800,000 19,700,000 18,300,000
P&I Claims Incurred 7,900,000 7,200,000 12,900,000 14,700,000 13,700,000 8,700,000
Surplus/ Deficit -200,000 4,000,000 1,800,000 1,100,000 6,000,000 9,600,000
CHARTERERS LIABILTIY INCOME
Policy Year: 2008 2009 2010 2011 2012 2013
Charterers Premium Income
1,200,000 850,000 900,000 950,000 1,000,000 1,200,000
Charterers Claims Incurred
1,800,000 700,000 200,000 150,000 170,000 154,000
Surplus/ Deficit -600,000 150,000 700,000 800,000 830,000 1,046,000
ENTERED GROSS TONNAGE (GT)
Policy Year: 2008 2009 2010 2011 2012 2013
Gross Tonnage 1,400,000 1,600,000 1,900,000 2,100,000 2,400,000 2,700,000
P&I
BUSINESS PORTFOLIO SPREAD
84%
Charterers/DTH 8%
5%
2%
1%
FD&D
War
Sol to Cargo
2008 2009 2010 2011 2012 2013
2008 2009 2010 2011 2012 2013
8.50
8.00
7.50
7.00
6.50
6.00
5.50
5.00
3,000,000
2,500,000
2,000,000
1,500,000
1,000,000
500,000
0
P&I PREMIUM INCOME (USD)
TONNAGE DEVELOPMENT(Gross Tonnage)
AVERAGE RATE PER GT(USD per GT)
2008 2009 2010 2011 2012 2013
21,000,000
19,000,000
17,000,000
15,000,000
13,000,000
11,000,000
9,000,000
7,000,000
0
Middle East9%
SouthernEurope23%
NorthernEurope49%
Africa 4%South America 4%
Far East 11%
Containers 18%
Bulkers 26%
GeneralCargo 37%
Tugs & Barges 8%
Fishing 3%
Tankers 2%
Dredgers 1%Offshore 3%
Others 2%
MARKET FACTS & FIGURES

MARINE P&I AJGINTERNATIONAL.COM ARTHUR J. GALLAGHER 32 MARINE P&I AJGINTERNATIONAL.COM ARTHUR J. GALLAGHER 33
WWW.HYDOR.NO
HYDOR AS
Reinsurance Carrier: Brit Syndicate 2987 – Lloyd's of LondonStandard and Poor’s Rating: A+Maximum Limit Offered: USD 500 MillionVessel Type/ Size Cap: Up to 10,000 GT, Unlimited for Charterers LiabilityFacility Location: Oslo, Norway
Established in 2010, Hydor is an underwriting agent on behalf of the Brit Syndicate 2987 (Lloyd’s of London) offering fixed premium Owner’s Protection & Indemnity, Charterer’s P&I, FD&D and other marine related insurance products. Hydor is licensed and regulated by the Financial Supervisory Authority (FSA) of Norway.
Through Lloyd’s of London the Brit Syndicate 2987 holds security ratings from Standard & Poor’s A+ (Strong). The fixed premium facility looks at vessels up to 10,000 GT, providing limits up to USD 500 million for P&I and Charterer’s Liabilities. Whilst Hydor is an underwriting agent for the Brit Syndicate, the claims service is provided by C Solutions Limited, which is a legal and claims consultancy staffed by lawyers from the major UK shipping law firms, former P&I Club Senior Managers, Master Mariners and Engineers. C Solutions have been authorised by Hydor to handle all claims exclusively.
HYDOR SAYS:
“Hydor AS has the past year further positioned themselves as a professional fixed priced Owners’ and Charterers’ P&I facility, providing customized solutions for clients both in their Norwegian home market as well as internationally. Hydor AS continues to shape their competitive edge, thus working with the client, rather than for the client. To sustain in a highly competitive market, each supplier needs to shape their competitive edge and strive to become better. Competition drives Hydor to work even more dedicated towards our clients. Consequently becoming the preferred supplier of fixed P&I. We believe that the IG Club entrance into the fixed priced premium marked has contributed to an increased academic acknowledgment and consequently their entrance result in strengthening fixed &I commercially.”
TWELVE MONTH DEVELOPMENT PERFORMANCE INDICATORS
PREMIUM INCOME USD
+80%
GROSS TONNAGE
+8.3%
AVERAGE RATE PER GT (PGT)
+65.9%2012 PY 2013 PY 2012 PY 2013 PY 2012 PY 2013 PY
USD 5,000,000 USD 9,000,000 1,200,000 GT 1,300,000 GT USD 4.17 PGT USD 6.92 PGT
COMMERCIAL P&I MARKET REVIEW 2014
AVERAGE RATE PER GT (USD per GT) BUSINESS PORTFOLIO SPREAD
GEOGRAPHICAL SPREAD OF BUSINESS TYPE OF ENTERED VESSEL
P&I PREMIUM INCOME (USD) TONNAGE DEVELOPMENT (Gross Tonnage)
1,400,000
1,200,000
1,000,000
800,000
600,000
400,000
200,000
0
South America10%
NorthernEurope73%
North America 9%
Bulkers 71%
Fishing 15%Tugs & Barges 1%
Dredgers 3%Others 7%
Tankers 3%Far East8%
2008 2009 2010 2011 2012 2013
P&I PREMIUM INCOME (USD)
TONNAGE DEVELOPMENT(Gross Tonnage)
AVERAGE RATE PER GT(USD per GT)
2008 2009 2010 2011 2012 2013
10,000,0009,000,0008,000,0007,000,0006,000,0005,000,0004,000,0003,000,0002,000,0001,000,000
0
2008 2009 2010 2011 2012 2013
8
7
6
5
4
3
2
1
0
OWNED P&I PREMIUM INCOME (USD)
Policy Year: 2008 2009 2010 2011 2012 2013
P&I Premium Income - - - 2,000,000 5,000,000 9,000,000
P&I Claims Incurred - - - 250,000 750,000 6,000,000
Surplus/ Deficit - - - 1,750,000 4,250,000 3,000,000
ENTERED GROSS TONNAGE (GT)
Policy Year: 2008 2009 2010 2011 2012 2013
Gross Tonnage - - - 1,000,000 1,200,000 1,300,000
No data provided
MARKET FACTS & FIGURES

MARINE P&I AJGINTERNATIONAL.COM ARTHUR J. GALLAGHER 34 MARINE P&I AJGINTERNATIONAL.COM ARTHUR J. GALLAGHER 35
WWW.INGOS.RU
INGOSSTRAKH INSURANCE CO.
Reinsurance Carrier: Lloyd's of LondonStandard and Poor’s Rating: BBB-Maximum Limit Offered: Up to USD 500 MillionVessel Type/ Size Cap: No Limit, but 97% of vessels covered are below 10,001 GTFacility Location: Moscow, Russia
Ingosstrakh Insurance Co. is a private federal level Insurance Company, which was founded in 1947, based in Moscow, Russia. The facility offers P&I, FD&D, H&M, Cargo and other marine related insurance solutions. The insurer has an international portfolio, however it holds a leading share of the Russian P&I Market giving particular preference to ship owners from Russia, CIS and East European Countries. The facility offers limits up to USD 500 million for P&I and USD 1 million for FD&D. Ingosstrakh covers in excess of 1,000 units, handling a large range of vessels from smaller inland and costal craft, to larger ocean going vessels in excess of 20,000 GT. The company is rated BBB- by Standard & Poor’s and a National Scale rating of ruAA++.
INGOSSTRAKH SAYS:
“One of the most important challenge we see in the gap between the real damage caused and the amount of claims which can be lodged. For example – unlimited liability before the third persons. Most probable it is IG Clubs’ creation thus putting aside commercial competitors. For commercial market it is difficult to comply. Surely competition grows and causes further reduction of rates. Smaller owners pay less attention to the security issues. Practically every new entrant declares something – a new approach (as though the present participants are overly conservative or demonstrate the lack of understanding for the demands). Here I would point out that new entrants are founded by the practitioners emanating from the old players and often by those who failed to demonstrate proper results. There is no much fear. This needs thinking it over – whether the same reinsurance scheme will be used by clubs for fixed covers. If not – we need reports on the results. If yes – then it will be a demonstration that the mutuality is no longer the best invention for the profession and starts to give way to commerciality. Aggressiveness is mostly expressed in underpricing. I would pay more attention to the fact that clubs start to form their H+M divisions which shortens the distance between them and fixed facilities. As for the last 12 months – we really noticed a lot of new entrants. However this did not added much innovation, neither better service in P&I.”
TWELVE MONTH DEVELOPMENT PERFORMANCE INDICATORS
PREMIUM INCOME USD
-7.32%
GROSS TONNAGE
NO CHANGE
AVERAGE RATE PER GT (PGT)
-7.23%2012 PY 2013 PY 2012 PY 2013 PY 2012 PY 2013 PY
USD 23,523,685 USD 21,800,000 5,001,155 5,001,155 USD 4.70 USD 4.36
COMMERCIAL P&I MARKET REVIEW 2014
AVERAGE RATE PER GT (USD per GT) BUSINESS PORTFOLIO SPREAD
GEOGRAPHICAL SPREAD OF BUSINESS TYPE OF ENTERED VESSEL
P&I PREMIUM INCOME (USD) TONNAGE DEVELOPMENT (Gross Tonnage)
OWNED P&I PREMIUM INCOME (USD)
Policy Year: 2008 2009 2010 2011 2012 2013
P&I Premium Income 25,400,000 27,250,000 23,000,000 19,228,453 23,523,685 21,800,000
P&I Claims Incurred 19,500,000 25,000,000 16,200,000 16,075,518 17,326,411 14,000,000
ENTERED GROSS TONNAGE (GT)
Policy Year: 2008 2009 2010 2011 2012 2013
Gross Tonnage 7,895,016 5,879,400 6,024,524 4,730,800 5,001,155 5,001,155
P&I
BUSINESS PORTFOLIO SPREAD
96%
FD&D 1%
Charterers/DTH 3%
Southern Europe 8%
Middle East 12%
South America 5%
NorthernEurope35%
Far East 35%
Africa 5%
Fishing 20% Tugs & Barges 19%
GeneralCargo 31%
Others 11%
Containers 2%
Tankers 11%
Yachts 1%
Bulkers 5%
2008 2009 2010 2011 2012 2013
4.804.604.404.204.003.803.603.403.203.00
9,000,0008,000,0007,000,0006,000,0007,000,0006,000,0005,000,0004,000,0003,000,0002,000,0001,000,000
0
TONNAGE DEVELOPMENT(Gross Tonnage)
AVERAGE RATE PER GT(USD per GT)
2008 2009 2010 2011 2012 2013
29,000,000
27,000,000
25,000,000
23,000,000
21,000,000
19,000,000
17,000,000
15,000,000
P&I PREMIUM INCOME (USD)
2008 2009 2010 2011 2012 2013
MARKET FACTS & FIGURES

MARINE P&I AJGINTERNATIONAL.COM ARTHUR J. GALLAGHER 36 MARINE P&I AJGINTERNATIONAL.COM ARTHUR J. GALLAGHER 37
WWW.LODESTAR-MARINE.COM
LODESTAR LTD
Reinsurance Carrier: Royal Sun Alliance GroupStandard and Poor’s Rating: AMaximum Limit Offered: USD 500 MillionVessel Type/ Size Cap: Up to 20,000 for non-tanker vessels and up to 10,000 GT for tankersFacility Location: London, United Kingdom
Lodestar Marine Limited (Lodestar) was established in 2012, providing fixed premium P&I insurance solutions. Lodestar is a partnership, backed by Tawa Plc, part of Groupe Artémis, a family owned investment company with consolidated assets in excess of Euro 27 billion. Lodestar comprises of a team of experienced underwriters and claims executives plus in-house surveyors, supported by further administration staff based in Gloucester, under contract with Pro Insurance Solutions Limited. The facility will write Fixed Premium P&I risks, with limits up to USD 500 million in co-operation with RSA and other “A” rated insurers who will provide security. Typical vessels insured by Lodestar will not exceed 10,000 gross tons.
A global network of over 250 correspondents has been established. In the event of a claim, security can be provided by either a letter of undertaking or bank guarantee. Furthermore, Lodestar is in the process of finalising Flag State approval for the issuance of Blue Cards with acceptance already received from a number of Authorities including United Kingdom, Netherlands, Hong Kong and Australia. Lodestar is authorised and regulated by the FCA as an appointed representative of Pro Insurance Solutions Limited.
LODESTAR SAYS:
“The biggest challenge within the Fixed Premium P&I sector from our perspective relates to over-capacity and the quality of market knowledge. The Fixed market has pretty much doubled in size over the last two or three years and with the emergence of “Mutual” Fixed Premium offerings the trend seems set to continue. We see competition as healthy. Lodestar was initially established to provide a quality alternative to the established Fixed Premium market. The Fixed market has since expanded, the result being that everybody involved in managing Fixed Premium business has had to up their game. Price is one area we refuse to compromise and our rate per ton is “broadly” consistent with this time last year notwithstanding extra capacity. Two years in to our journey we feel that we have already gained a market reputation for providing a good service, backed by strong product and “A” rated security. Our experience suggests that price, whilst important, isn’t always the deciding factor when it comes to choosing where to insure. New entrants in to the fixed market are actually giving it a great deal of credibility. Of late the newcomers comprise of “Mutual Club” related offerings and if members of the IG are investing in the fixed market, they must think it has a solid future.”
TWELVE MONTH DEVELOPMENT PERFORMANCE INDICATORS
PREMIUM INCOME USD
+51.5%
GROSS TONNAGE
+55%
AVERAGE RATE PER GT (PGT)
-2.2%2012 PY 2013 PY 2012 PY 2013 PY 2012 PY 2013 PY
USD 16,500,000 USD 25,000,000 1,777,512 GT 2,756,154 GT USD 9.28 PGT USD 9.07 PGT
COMMERCIAL P&I MARKET REVIEW 2014
AVERAGE RATE PER GT (USD per GT) BUSINESS PORTFOLIO SPREAD
GEOGRAPHICAL SPREAD OF BUSINESS TYPE OF ENTERED VESSEL
P&I PREMIUM INCOME (USD) TONNAGE DEVELOPMENT (Gross Tonnage)
OWNED P&I PREMIUM INCOME (USD)
Policy Year: 2008 2009 2010 2011 2012 2013
P&I Premium Income - - - - 16,500,000 25,000,000
ENTERED GROSS TONNAGE (GT)
Policy Year: 2008 2009 2010 2011 2012 2013
Gross Tonnage - - - - 1,777,512 2,756,154
P&I
BUSINESS PORTFOLIO SPREAD
96%
FD&D 2%
1%
1%
Other Risks
Charterers/DTH
12
10
8
6
4
2
0
AVERAGE RATE PER GT(USD per GT)
South America10%
Middle East9%
Far East 26%
Southern Europe39%
Northern Europe 11%
Australia 1%North America 1%
Africa 3%
Tankers 9%
Dry Cargo 65%
Offshore 7%
Tugs & Barges 11%
Others 3%
Dredgers 2%Yachts 1%
Fishing 2%
2011 2012 2013
2011 2012 2013
35,000,000
30,000,000
25,000,000
20,000,000
15,000,000
10,000,000
5,000,000
0
P&I PREMIUM INCOME (USD)
3,000,000
2,500,000
2,000,000
1,500,000
1,000,000
500,000
0
TONNAGE DEVELOPMENT(Gross Tonnage)
2011 2012 2013
MARKET FACTS & FIGURES

MARINE P&I AJGINTERNATIONAL.COM ARTHUR J. GALLAGHER 38 MARINE P&I AJGINTERNATIONAL.COM ARTHUR J. GALLAGHER 39
WWW.NAVPANDI.COM
NAVIGATORS P&I
Reinsurance Carrier: Navigators Insurance CompanyStandard and Poor’s Rating: AMaximum Limit Offered: Up to USD 500 MillionVessel Type/ Size Cap: Up to 10,000 GTFacility Location: London, United Kingdom
Established in 2004, the Navigators Insurance Group set up a fixed premium P&I facility protecting ship owners, managers and charterers against liabilities arising out of operating their vessels. Today Navigators P&I, based in London, offers fixed-cost Protection & Indemnity cover to vessels in coastal, short-sea and limited Ocean trades. The facility offers limits up to USD 500 million and looks to insure vessels up to 10,000 gross tons. Navigators underwriting profile looks at all types of vessels, excluding passenger vessels and those with U.S. Flag, cover is also available on a worldwide trading basis, excluding U.S. waters. In addition to Owner’s P&I, Navigators can also offer contractual liabilities as an extension of the main P&I coverage. Charterer’s Liability is also available to vessels below 10,000 GT. Furthermore, in addition also offers coverage for bunker convention and MLC 2006 risks.
Navigators have office locations in US, London, Antwerp, Stockholm, Copenhagen and Lloyd's representative offices in Shanghai and Rio. More recently Navigators have opened office locations in Rotterdam and Milan and also looking to shortly expand in Paris and Dubai. Furthermore, as part of the company’s expansion strategy Navigators is in the process of establishing a separate European Insurance Company in London enabling the acceptance of business from any EU country.
NAVIGATORS SAYS:
Declined to provide a comment
TWELVE MONTH DEVELOPMENT PERFORMANCE INDICATORS
PREMIUM INCOME USD
-2.5%
GROSS TONNAGE
-5%
AVERAGE RATE PER GT (PGT)
+2.2%2012 PY 2013 PY 2012 PY 2013 PY 2012 PY 2013 PY
USD 22,000,000 USD 21,430,000 2,100,000 GT 2,000,000 GT USD 10.48 PGT USD 10.72 PGT
COMMERCIAL P&I MARKET REVIEW 2014
AVERAGE RATE PER GT (USD per GT) BUSINESS PORTFOLIO SPREAD
GEOGRAPHICAL SPREAD OF BUSINESS TYPE OF ENTERED VESSEL
P&I PREMIUM INCOME (USD) TONNAGE DEVELOPMENT (Gross Tonnage)
OWNED P&I PREMIUM INCOME (USD)
Policy Year: 2008 2009 2010 2011 2012 2013
P&I Premium Income 28,200,000 25,000,000 24,000,000 22,500,000 22,000,000 21,430,000
ENTERED GROSS TONNAGE (GT)
Policy Year: 2008 2009 2010 2011 2012 2013
Gross Tonnage 2,450,000 2,300,000 2,100,000 2,200,000 2,100,000 2,000,000
2008 2009 2010 2011 2012 2013
12.00
11.50
11.00
10.50
10.00
9.50
P&I PREMIUM INCOME (USD)
AVERAGE RATE PER GT(USD per GT)
3,000,000
2,500,000
2,000,000
1,500,000
1,000,000
500,000
0
TONNAGE DEVELOPMENT(Gross Tonnage)
2008 2009 2010 2011 2012 2013
North America 15%
Far East 33%
Europe32%South
America 7%
Australia 1%
Africa 5%
Middle East 7%
Tugs & Barges 12%
GeneralCargo 56%
Bulker 10%
Offshore 3%
Tankers 10%
Fishing 5%
Others 4%
2008 2009 2010 2011 2012 2013
29,000,00028,000,00027,000,00026,000,00025,000,00024,000,00023,000,00022,000,00021,000,00020,000,000
2008 2009 2010 2011 2012 2013
12.00
11.50
11.00
10.50
10.00
9.50
P&I PREMIUM INCOME (USD)
AVERAGE RATE PER GT(USD per GT)
3,000,000
2,500,000
2,000,000
1,500,000
1,000,000
500,000
0
TONNAGE DEVELOPMENT(Gross Tonnage)
2008 2009 2010 2011 2012 2013
North America 15%
Far East 33%
Europe32%South
America 7%
Australia 1%
Africa 5%
Middle East 7%
Tugs & Barges 12%
GeneralCargo 56%
Bulker 10%
Offshore 3%
Tankers 10%
Fishing 5%
Others 4%
2008 2009 2010 2011 2012 2013
29,000,00028,000,00027,000,00026,000,00025,000,00024,000,00023,000,00022,000,00021,000,00020,000,000
No data provided
MARKET FACTS & FIGURES

MARINE P&I AJGINTERNATIONAL.COM ARTHUR J. GALLAGHER 40 MARINE P&I AJGINTERNATIONAL.COM ARTHUR J. GALLAGHER 41
WWW.SPECIAL-RISKS.CO.UK
OSPREY UNDERWRITING AGENCY LIMITED
Reinsurance Carrier: Lloyd's of London (various syndicates)Standard and Poor’s Rating: A+Maximum Limit Offered: Up to USD 100 MillionVessel Type/ Size Cap: Up to 25,000 GT (dry bulk) and 10,000 GT all other vessel typesFacility Location: London, United Kingdom
Established in 1991, Osprey Underwriting Agency is a specialist P&I fixed premium insurance provider and is the oldest P&I fixed premium insurer in London. The Agency provides insurance services to ship owners on a variety of vessel types and operations, with a focused portfolio of tugs, barges and fishing vessels. The facility caters for vessels of up to 25,000 GT, engaged in the carriage of dry cargoes and up to 10,000 GT for all other vessel types. Osprey avoids writing tankers carrying persistent cargoes and passenger vessels. For business emanating from the USA the policy limit is USD 1 Million.
Coverage can be provided on a worldwide basis, which is backed up by an extensive global network of correspondents and Lloyd’s agents. Osprey is actively looking to expand its non-US book of business with a focus on Asia, whilst maintaining its leading position as providers of U.S. Primary P&I Insurance.
OSPREY SAYS:
"The last 12 months have been positive for the Agency. The composition of our account has changed in that the proportion of Non US business has increased as we have developed this part of our account. For international business the Agency now offers a USD 500m limit, Lloyds a+ rated paper. In addition to P&I, the Agency continues to offer P&I war risks, H&M to USD 5m value, Marine General Liability and Maritime Employers liability coverage. New this year we can also offer an MLC compliant financial guarantee product for shipowners and crewing agencies. All of our products are 100% Lloyd’s A+ rated paper. In the US we have reduced our market share in the fishboat account although it remains a significant proportion of our US business. We have no plans to rationalise it further. The US account remains the most significant part of our overall account and it remains unique in comparison to our fixed premium peers. To demonstrate our commitment to our US clients we opened a claims office in Louisiana in August 2014, headed up by our claims Director Christian Kelly. This is Osprey’s first overseas marine office and an exciting development for us. We hope it will be the start of a global network of offices as our international P&I book grows but have no immediate plans to open offices in other time zones. Market conditions are soft across all classes and we are seeing in certain areas, unsustainable rating .In the medium term, we expect P&I capacity to reduce as the cost of reinsurance increases and the availability reduces. The economic changes necessary for this change to manifest itself are complex and still in our view years away. We expect the market to remain soft over the next 12-18 months. As a company we have been focusing on enhancing service both underwriting and claims and focus on working with our long term clients and supporters to provide excellent products on a sustainable basis."
TWELVE MONTH DEVELOPMENT PERFORMANCE INDICATORS
PREMIUM INCOME USD
-21.8%
GROSS TONNAGE
-26.5%
AVERAGE RATE PER GT (PGT)
+6.3%2012 PY 2013 PY 2012 PY 2013 PY 2012 PY 2013 PY
USD 38,400,000 USD 30,000,000 2,450 1,800 USD 15,673 USD 16,667
COMMERCIAL P&I MARKET REVIEW 2014
AVERAGE PREMIUM PER VESSEL (USD) BUSINESS PORTFOLIO SPREAD
GEOGRAPHICAL SPREAD OF BUSINESS TYPE OF ENTERED VESSEL
P&I PREMIUM INCOME (USD) TONNAGE DEVELOPMENT (Gross Tonnage)
OWNED P&I PREMIUM INCOME (USD)
Policy Year: 2008 2009 2010 2011 2012 2013
P&I Premium Income 31,000,000 36,000,000 40,500,000 41,100,000 38,400,000 30,000,000
NUMBER OF VESSELS ON RISK
Policy Year: 2008 2009 2010 2011 2012 2013
Number of Vessels On-Risk
2,350 2,660 2,849 3,095 2,450 1800
P&I
BUSINESS PORTFOLIO SPREAD
90%
Other Risks 8%
H&M 3%
2008 2009 2010 2011 2012 2013
18,000
17,000
16,000
15,000
14,000
13,000
12,000
3,500
3,000
2,500
2,000
1,500
1,000
500
0
P&I PREMIUM INCOME (USD)
TONNAGE DEVELOPMENT(Gross Tonnage)
AVERAGE RATE PER GT(USD per GT)
2008 2009 2010 2011 2012 2013
South America 13%
Europe 2%
North America 61%
Asia/Middle East 22%
Other 2%
Fishing 22%
Tugs & Barges 41%
Offshore 15%
General Cargo 2%
Others 20%
2008 2009 2010 2011 2012 2013
45,000,000
43,000,000
41,000,000
39,000,000
37,000,000
35,000,000
33,000,000
31,000,000
29,000,000
MARKET FACTS & FIGURES

MARINE P&I AJGINTERNATIONAL.COM ARTHUR J. GALLAGHER 42 MARINE P&I AJGINTERNATIONAL.COM ARTHUR J. GALLAGHER 43
WWW.RAETSMARINE.COM
RAETSMARINE BV
Reinsurance Carrier: Amlin Europe N.V.Standard and Poor’s Rating: A-Maximum Limit Offered: Up to USD 500 MillionVessel Type/ Size Cap: Up to 40,000 GT. Unlimited for Charterers Liability.Facility Location: Rotterdam, Netherlands
RaetsMarine BV was founded in 1993, initially writing charterers liability insurance only. RaetsMarine BV were independent underwriting agents of Amlin Corporate Insurance BV before they were absorbed by Amlin Europe N.V. in 2013, RaetsMarine continues to be responsible for P&I, FD&D, Charterers Liability insurances. The “Owners P&I” facility targets small to medium sized vessels, up to 40,000 GT, as well as supply vessels, fishing boats, tugs and barges and other specialist units.
For Charterers Liability, RaetsMarine has no restrictions on vessel type, size, age or territory. The facility currently serves over 1,000 charterers, including traders, operators, NVOCC’s and others chartering vessels, offering limits up to USD 500 million (for both owned and chartered business). RaetsMarine BV owned and controlled by Amlin Europe N.V. which is A- rated by Standard and Poor’s.
RAETSMARINE SAYS:
“A major challenge for our industry is the increasing complexity of marine risks in combination with a decreasing level of knowledge and experience in the market. Another major challenge is the increasing limits on conventions and the high cost of casualties. It is inevitable that due to the increasing number of competitors the premiums are under pressure as clients tend to go for the lowest premium. With clients facing difficult times we understand this and there have to continue innovating our products and services. At present around 40% of the medium size (500-25,000GT) vessels are insured with fixed premium and 60% with IG Clubs. Over the past 5 years the biggest growth (in number and tonnage) can be observed with large (25,000-60,000GT) and very large (>60,000GT) vessels. Due to this trend small and medium size Shipowners’ insured with IG Clubs are likely to face increasing cost for huge claims caused by ‘giant’ vessels. This trend will make that small to medium size tonnage will move to fixed premium providers whereas large and very large vessels will remain with IG Clubs. We do not fear our market share will be reduced by IG Clubs diversifying into fixed premium. At present there is still no level playing field as IG Clubs still rely on release calls hindering shipowners to leave an IG Club for fixed premium. Once an improving market will make funds available more, smaller vessels are expected to leave mutuality. Our clients still face difficult market circumstances. Hence the expected increase in trading volume and investment in new tonnage did not take place to the extend we expected. Nevertheless we expect to benefit from future expansion in the number of vessels when the market starts to improve. For us the current market does not form a threat but rather an opportunity to further develop our skills and offer an unrivalled service to our clients.”
TWELVE MONTH DEVELOPMENT PERFORMANCE INDICATORS
PREMIUM INCOME USD
+4%
GROSS TONNAGE
-2.8%
AVERAGE RATE PER GT (PGT)
+6.9%2012 PY 2013 PY 2012 PY 2013 PY 2012 PY 2013 PY
USD 50,000,000 USD 52,000,000 15,806,600 15,366,000 USD 3.16 USD 3.38
OWNED P&I PREMIUM INCOME (USD)
Policy Year: 2008 2009 2010 2011 2012 2013
P&I Premium Income 28,600,000 35,500,000 36,400,000 51,700,000 50,000,000 52,000,000
CHARTERERS PREMIUM INCOME (USD)
Policy Year: 2008 2009 2010 2011 2012 2013
P&I Premium Income 24,500,000 24,500,000 26,000,000 25,700,000 27,000,000 25,500,000
COMMERCIAL P&I MARKET REVIEW 2014
AVERAGE RATE PER GT (USD per GT) BUSINESS PORTFOLIO SPREAD
GEOGRAPHICAL SPREAD OF BUSINESS TYPE OF ENTERED VESSEL
P&I PREMIUM INCOME (SO Only) (USD) TONNAGE DEVELOPMENT (SO Only) (Gross Tonnage)
ENTERED GROSS TONNAGE (SO only)
Policy Year: 2008 2009 2010 2011 2012 2013
Gross Tonnage 5,298,502 12,178,942 11,390,104 16,262,048 15,806,600 15,366,000
NO. CHARTERER VESSELS INSURED
Policy Year: 2008 2009 2010 2011 2012 2013
# Vessels - 18,061 22,371 23,783 23,000 21,000
BUSINESS PORTFOLIO SPREAD
65%
23%
8%
0.5%
0.5%
3%
Far East34%
Europe45%
Middle East12%
Russia & CIS 2%
South America5%
Bulkers 17% General Cargo20%
Others 30%Tankers 3%
Containers 2%
Fishing 4%
Dredgers 1%Yachts 2%
Offshore 4%
Tugs & Barges 18%
North America 1%
Africa 1%
P&I
Charterers/DTH
FD&D
Ports and Terminals
SOL to Cargo
War
16,000,000
14,000,000
12,000,000
10,000,000
8,000,000
6,000,000
4,000,000
2,000,000
0
P&I PREMIUM INCOME (SO Only) (USD)
TONNAGE DEVELOPMENT (SO Only)(Gross Tonnage)
AVERAGE RATE PER GT(USD per GT)
2008 2009 2010 2011 2012 2013
2008 2009 2010 2011 2012 2013
60,000,000
55,000,000
50,000,000
45,000,000
40,000,000
35,000,000
30,000,000
25,000,000
2008 2009 2010 2011 2012 2013
6.00
5.50
5.00
4.50
4.00
3.50
3.00
2.50
2.00
25,000
20,000
15,000
10,000
5,000
0
VESSELS ON RISK (CL only)(No. Vsls)
2009 2010 2011 2012 2013
2009 2010 2011 2012 2013
27,500,000
27,000,000
26,500,000
26,000,000
25,500,000
25,000,000
24,500,000
24,000,000
CL PREMIUM INCOME (USD)
2009 2010 2011 2012 2013
1,400.00
1,350.00
1,300.00
1,250.00
1,200.00
1,150.00
1,100.00
1,050.00
1,000.00
AVERAGE PREMIUM PER VSL (USD)
VESSELS ON RISK (CL only) (No. Vsls)
CL PREMIUM INCOME (USD) AVERAGE PREMIUM PER VSL (USD)
MARKET FACTS & FIGURES

MARINE P&I AJGINTERNATIONAL.COM ARTHUR J. GALLAGHER 44 MARINE P&I AJGINTERNATIONAL.COM ARTHUR J. GALLAGHER 45
WWW.RGS. RU
ROSGOSSTRAKH LTD
Reinsurance Carrier: Reinsurance TreatyStandard and Poor’s Rating: BB-/RuAA (P&I Reinsurance Treaty A+)Maximum Limit Offered: Up to USD 500 MillionVessel Type/ Size Cap: Tankers up to 8,500 GT and All other vessels up to 25,000 GTFacility Location: Moscow, Russia
Established in 1921, Rosgosstrakh Ltd is one of the leading Insurance companies in Russia. In 2010 the insurance company was privatized and today it employs over 100,000 professionals in 83 regional branches comprising of 3,500 offices. On the P&I side the insurer currently handles in excess of 1,400 vessels, with a combined gross tonnage of 1,424,486. Rosgosstrakh offers P&I limits up to US$ 500 ml, FD&D of US$ 1 ml and Charterer’s Liability up to US$ 100 ml. Last year the facility substantially expanded its book with over 900 inland Russian trading vessels and strives to grow this segment further. Rosgosstrakh also provides cover for hull and machinery, cargo and other marine related insurance solutions.
ROSGOSSTRAKH LTD SAYS:
"A challenge for fixed premium underwriters in general is pool purchase of excess limits to keep reinsurance costs at a more appropriate level, for example pool reinsurance of US$ 500 ml excess of US$ 500 ml. While this is a dubious testing issue and far more difficult to implement than for members of the International Group of P&I Clubs (IG), it is possible to resolve. With strict requirements to meet solvency criteria etc. the IG fixed premium facilities may potentially be launched to serve this and other needs. The current portfolio structure of Rosgosstrakh has almost 90% Russian clients, with the vast portion involved in inland waters trading. Thus we don’t see much competition from the new fixed-premium facilities for this segment. As always, anything new and fresh attracts the attention. Such entrants normally start with aggressive marketing and no less aggressive underwriting and sometimes brokerage offered. This is not a new strategy, and is likely to make sense only for the short term on a rapidly growing portfolio. An interesting statistics will be to see the performance of the new players on a 3-5 years time frame, including those which decided to leave the market or close P&I operations - or went bust within same period. We don’t have much fear on that score. However it is true indeed that fixed premium facilities launched by the clubs are focused on smaller tonnage so far, which is the focus for fixed premium players, thus increasing the competition in the sector. Our concern would rather be the allocation of reinsurance costs by the IG clubs` fixed premium facilities. They lack transparency and seem to be more competitive."
TWELVE MONTH DEVELOPMENT PERFORMANCE INDICATORS
PREMIUM INCOME USD
+19.7%
GROSS TONNAGE
+42.1%
AVERAGE RATE PER GT (PGT)
-15.7%2012 PY 2013 PY 2012 PY 2013 PY 2012 PY 2013 PY
USD 4,008,499 USD 4,800,000 1,002,000 1,424,486 USD 4.00 USD 3.37
COMMERCIAL P&I MARKET REVIEW 2014
AVERAGE RATE PER GT (USD per GT) BUSINESS PORTFOLIO SPREAD
GEOGRAPHICAL SPREAD OF BUSINESS TYPE OF ENTERED VESSEL
P&I PREMIUM INCOME (USD) TONNAGE DEVELOPMENT (Gross Tonnage)
OWNED P&I PREMIUM INCOME (USD)
Policy Year: 2008 2009 2010 2011 2012 2013
P&I Premium Income 744,480 1,943,532 3,286,643 3,885,055 4,008,499 4,800,000
P&I Claims Incurred 101,532 274,745 195,519 2,090,796 975,731 -
Surplus/ Deficit 642,948 1,668,787 3,091,124 1,794,259 3,032,768 -
ENTERED GROSS TONNAGE (GT)
Policy Year: 2008 2009 2010 2011 2012 2013
Gross Tonnage 235,258 562,170 1,038,500 1,055,019 1,002,000 1,424,486
P&I
BUSINESS PORTFOLIO SPREAD
100%
1,600,000
1,400,000
1,200,000
1,000,000
800,000
600,000
400,000
200,000
0
P&I PREMIUM INCOME (USD)
TONNAGE DEVELOPMENT(Gross Tonnage)
2008 2009 2010 2011 2012 2013
Southern Europe 5%
Russia 84%
N. & S. America 11%
General Cargo 21%
Tankers 32%
Others 30%
Bulkers 2%
Tugs & Barges 13%
Fishing 2%
2008 2009 2010 2011 2012 2013
6,000,000
5,000,000
4,000,000
3,000,000
2,000,000
1,000,000
0
2008 2009 2010 2011 2012 2013
4,400
4,200
4,000
3,800
3,600
3,400
3,200
3,000
AVERAGE RATE PER GT(USD per GT)
MARKET FACTS & FIGURES

MARINE P&I AJGINTERNATIONAL.COM ARTHUR J. GALLAGHER 46 MARINE P&I AJGINTERNATIONAL.COM ARTHUR J. GALLAGHER 47
WWW.CPIWEB.ORG
CHINA P&I CLUB
Reinsurance Carrier: Co-Insured with International Group P&I Clubs (Skuld, SSM, UK and WofE) Standard and Poor’s Rating: UnratedMaximum Limit Offered: International Group Club LimitVessel Type/ Size Cap: No restrictionsFacility Location: Beijing, China
The China Shipowners Mutual Assurance Association was established in 1984, based in Beijing, China, offering mutual P&I, Legal Defence, Charterers Liability and Hull insurance solutions to its Members. In 1994, the CPI set up a service office in Hong Kong, with additional representative offices in the major ports of China’s mainland, such as Shanghai and Dalian.
The CPI is not a member of the International Group of P&I Club’s, however the Club does rely on reinsurance arrangements to offer its Members IG-Club limits, through a co-insurance arrangement with the Skuld, Steamship Mutual, UK Club and the West of England (excess of USD 400,000).
The Club has a growing portfolio of predominately Chinese Members and has more recently attracted new Members from Hong Kong, Singapore and other parts of Asia. The Club has an exceptionally strong free reserve amounting to USD 686 million, which would put CPI second to Gard in terms of free reserve strength (compared to IG-Group Club free reserves).
AJG OVERVIEW OF THE 2012 POLICY YEAR (AS 2013 REPORT NOT YET PUBLISHED AT OCT 2014)
At the end of the 2012 policy year, the Association’s entered tonnage amounted to 31.73 million GT with 1,124 ships. The net increase of total entered tonnage is 0.39 million GT, representing a net increase of 1.24% in comparison with the previous policy year. Premium income, including additional calls, increased from USD67.1m in the 2011/12 policy year to USD69.1m for the 2012/13 year. The Club achieved and outsized investment gain of 15.8% or USD184.6m, which owing to the underwriting surpluses in the open years, flowed directly to free reserves. This substantial return is predominantly down to unrealised gains on its holding of equities in local banks free reserves now stand at USD1.09b according to their annual report, an increase of 24.2% from the previous year. The influx of new buildings and the departure of older vessels have helped to improve the age profile of the Association’s entered vessels. The average age of the fleet is approximately 12 years, quite young indeed. Claims appear to be well managed. The Club’s annual report notes, “There were 1,786 reported claims in the 2012 policy year with an aggregate claim amount of USD56.73 million. This represents a decrease of 1.22% in the number of claims and an increase of 13.41% in the aggregate claim amount, compared to the previous policy year’s 1,808 claims with USD50.02 million in claim amount. In the 2012 policy year, the Club’s direction, cargo liability, and crew claims ranked the top three of the most frequent claim types. The sequence remained the same with that of the 2011 policy year. Cargo liability, unrecoverable GA contribution and pollution risks became the top three of risk types in terms of claim amount.” Notwithstanding the volume of claims, only 25 have exceeded their “major claims” category for claims in excess of USD400,000. All told the reported claim amount for these high value incidents is USD39.6m, including a GA claim for USD15.4 million. It is also noteworthy that the Club’s annual report spends a good deal of space detailing and analysing many claims with a view to providing immediate feedback and lessons learned for members, issuing guidance notes within the annual report itself. Additionally the Club seems be able to settle and close a good portion of open claims each policy year thereby limiting back year deterioration, and makes this a part of their report to members.
COMMERCIAL P&I MARKET REVIEW 2014
AVERAGE RATE PER GT (USD per GT) BUSINESS PORTFOLIO SPREAD
GEOGRAPHICAL SPREAD OF BUSINESS TYPE OF ENTERED VESSEL
P&I PREMIUM INCOME (USD) TONNAGE DEVELOPMENT (Gross Tonnage)
MARKET FACTS & FIGURES
OWNED P&I PREMIUM INCOME (USD)
Policy Year: 2008 2009 2010 2011 2012 2013
P&I Premium Income 34,941,000 44,802,000 51,148,000 60,012,000 67,090,000 -
P&I Claims Incurred 1,790,000 15,149,000 11,225,000 20,140,000 29,536,000 -
Surplus/ Deficit 33,151,000 29,653,000 39,923,000 39,872,000 37,554,000 -
ENTERED GROSS TONNAGE (GT)
Policy Year: 2008 2009 2010 2011 2012 2013
Gross Tonnage 16,510,000 17,880,000 24,010,000 27,800,000 31,340,000 -
35,000,000
30,000,000
25,000,000
20,000,000
15,000,000
10,000,000
5,000,000
0
P&I PREMIUM INCOME (USD)
TONNAGE DEVELOPMENT(Gross Tonnage)
Far East 100% Not disclosed
2008 2009 2010 2011 2012
80,000,000
70,000,000
60,000,000
50,000,000
40,000,000
30,000,000
20,000,000
10,000,000
0
2.6
2.5
2.4
2.3
2.2
2.1
2
1.9
AVERAGE RATE PER GT(USD per GT)
2008 2009 2010 2011 2012
2008 2009 2010 2011 2012
No data provided

MARINE P&I AJGINTERNATIONAL.COM ARTHUR J. GALLAGHER 48 MARINE P&I AJGINTERNATIONAL.COM ARTHUR J. GALLAGHER 49
WWW.KPICLUB.OR.KR
KOREAN SHIPOWNERS MUTUAL P&I
Reinsurance Carrier: Lloyds of London, Kuwait Re. and Korean Re.Standard and Poor’s Rating: A- (excellent)Maximum Limit Offered: USD 1 BillionVessel Type/ Size Cap: No LimitFacility Location: Seoul, Korea
The Korea Shipowners Mutual P&I Association was established in 2000, offering fixed premium P&I solutions, as well as other marine related insurances. KPI operates as a mutual organization (not for profit), covering in excess of 900 vessels, commanding a collective market share of 18 Million GT, with a premium income of approximately US$ 31million (based on 2013). The facility offers P&I limits of liability up to US$300 Million (US$ 1 Billion is also available in some cases), backed by reinsurers from Lloyd’s of London, Korean Re, and Kuwait Re.
KPI targets a large tonnage range of merchant vessels ranging up to 100,000GT for dry cargo vessels and up to 10,000 GT for tanker tonnages. The majority of their portfolio consists of Korean member, which makes up 97% of the Club.
KOREAN P&I CLUB SAYS:
"In our view, the biggest challenge in the P&I market sector is increasing size of the marine accident, in particular wreck removal or oil pollution clean-up costs to which limit of shipowners' liability regime is not applied. Currently, P&I market in Korea is shared by IG Clubs and KP&I and new entrants have an ounce of portion in the market. New entrants is not so successful to compete in the market based on price competitiveness because shipowners do not have confidence in their claim handling ability and some countries do not designate them as approved insurer for certificates such as Bunker/CLC Certificates. IG Clubs' fixed premium facilities is not attractive to Korean shipowners because P&I market in Korea is shared by IG Clubs and KP&I. It seems that IG Clubs' fixed premium facilities cannot encroach on Korean market. In Korean market, Korean shipowners sold many aged small and middle sized vessels of which P&I premium are high and limitedly purchased newly built large sized vessels. There have been fierce price competitions for newly purchased vessels."
TWELVE MONTH DEVELOPMENT PERFORMANCE INDICATORS
PREMIUM INCOME USD
+8.3%
GROSS TONNAGE
+53.7%
AVERAGE RATE PER GT (PGT)
-31.7%2012 PY 2013 PY 2012 PY 2013 PY 2012 PY 2013 PY
USD 29,653,000 USD 32,119,000 11,833,000 18,192,000 USD 2.506 USD 1.711
COMMERCIAL P&I MARKET REVIEW 2014
AVERAGE RATE PER GT (USD per GT) BUSINESS PORTFOLIO SPREAD
GEOGRAPHICAL SPREAD OF BUSINESS TYPE OF ENTERED VESSEL
P&I PREMIUM INCOME (USD) TONNAGE DEVELOPMENT (Gross Tonnage)
OWNED P&I PREMIUM INCOME (USD)
Policy Year: 2008 2009 2010 2011 2012 2013
P&I Premium Income 13,248,000 19,509,000 26,002,000 28,894,000 29,653,000 32,119,000
P&I Claims Incurred 7,829,000 10,404,000 10,265,000 21,170,000 16,985,000 22,624,000
Surplus/ Deficit 5,419,000 9,105,000 15,737,000 7,724,000 12,668,000 9,495,000
ENTERED GROSS TONNAGE (GT)
Policy Year: 2008 2009 2010 2011 2012 2013
Gross Tonnage 4,996,000 7,338,000 8,685,000 10,007,000 11,833,000 18,192,000
P&I
BUSINESS PORTFOLIO SPREAD
98%
Charterers/DTH 1%
FD&D 1%
25,000,000
20,000,000
15,000,000
10,000,000
5,000,000
0
P&I PREMIUM INCOME (USD)
TONNAGE DEVELOPMENT(Gross Tonnage)
Far East 99.8%
Bulkers 22%
Others 21%
Fishing 16% GeneralCargo 13%
Tugs & Barges 9%
Containers 11%
Tankers 8%
Middle East 0.2%
2008 2009 2010 2011 2012 2013 2014
35,000,000
30,000,000
25,000,000
20,000,000
15,000,000
10,000,000
5,000,000
8.50
8.00
7.50
7.00
6.50
6.00
5.50
5.00
AVERAGE RATE PER GT(USD per GT)
2008 2009 2010 2011 2012 2013 2014
2008 2009 2010 2011 2012 2013 2014
MARKET FACTS & FIGURES

MARINE P&I AJGINTERNATIONAL.COM ARTHUR J. GALLAGHER 50 MARINE P&I AJGINTERNATIONAL.COM ARTHUR J. GALLAGHER 51
WWW.CHARTERAMA.COM
CHARTERAMA BV
Reinsurance Carrier: Royal Sun Alliance Standard and Poor’s Rating: AMaximum Limit Offered: Up to USD 100 MillionVessel Type/ Size Cap: No restrictionsFacility Location: Rotterdam, Netherlands
Charterama BV was established in March 2009, based in Rotterdam, Netherlands, as an underwriting agency offering a full range of Charterers’ P&I coverage. The facility is able to respond worldwide, with their extensive global network of correspondents. Charterama BV is backed by its primary carrier Royal Sun Alliance, who holds an A Standard and Poor’s rating. The facility specialises in Charterers’ Liability, Damage to Hull and FD&D coverage, offering limits up to USD 100 million and USD 2 million for FD&D, additional covers, such as War and Bunkers insurance are also available. The facility has grown tremendously from a premium income of USD 3 million in 2009, to USD 10 million in 2013. More recently in April 2014, Charterama BV opened a new office in Hong Kong, to expand their network and support services in Asia where 25% of the agencies portfolio current emanates from.
CHARTERAMA SAYS:
“Charterama is unique as a facility offering charterers liability on an exclusive basis. Other fixed providers offer charterers liability as a side product to their core business. This obviously has consequences for their service level and their management will strongly monitor technical results. The IG Clubs, set up, managed and owned by shipowners have become more active in offering standalone charterers liability insurance. Some more active and aggressive than others. The unfortunate result is that premiums are still very competitive with little sign of improvement. This may look interesting for charterers buying the insurance but in the long run it will be disadvantageous for charterers. Records will turn bad much sooner as there are hardly any margins with the risk that a charterer’s liability insurer doesn’t wish to continue the cover. Finding a new home will become more difficult. It may also have an effect on the longevity of providers offering charterers liability as a side product and decide to return to their core business, leaving the charterer with a claim in a run-off situation. Our market share is increasing as many of our clients recognise our specialism, dedication and commitment to the charterer’s interest”
TWELVE MONTH DEVELOPMENT PERFORMANCE INDICATORS
PREMIUM INCOME USD
+25%
NUMBER OF VESSELS ON RISK +26.5%
AVERAGE PREMIUM PER VESSEL -1.2%
2012 PY 2013 PY 2012 PY 2013 PY 2012 PY 2013 PY
USD 8,000,000 USD 10,000,000 8,300 10,500 USD 963.85 USD 952.38
COMMERCIAL P&I MARKET REVIEW 2014
AVERAGE PREMIUM PER VESSEL BUSINESS PORTFOLIO SPREAD
GEOGRAPHICAL SPREAD OF BUSINESS TYPE OF ENTERED VESSEL
P&I PREMIUM INCOME (USD) NUMBER OF VESSELS ON RISK
CHARTERERS LIABILTIY INCOME (USD)
Policy Year: 2008 2009 2010 2011 2012 2013
Charterers Premium Income
- 3,000,000 5,000,000 6,000,000 8,000,000 10,000,000
NO. VESSELS INSURED
Policy Year: 2008 2009 2010 2011 2012 2013
No. Vessels - 2,500 4,000 5,800 8,300 10,500
Charterers/DTH
FD&D
War
Other Risks
BUSINESS PORTFOLIO SPREAD
70%
25%
4%
1%
North America 13%
Far East25%
Europe50%
Middle East 4%
Africa 1%
Australia 5%
General Cargo 30%
Others 3%
Bulkers 45%
Tankers 15%
South America 2%
Tugs & Barges 2%
Containers 5%
12,000,000
10,000,000
8,000,000
6,000,000
4,000,000
2,000,000
0
P&I PREMIUM INCOME (USD)
12,000
10,000
8,000
6,000
4,000
2,000
0
VESSELS ON RISK
2008 2009 2010 2011 2012 2013
2009 2010 2011 2012 2013
2009 2010 2011 2012 2013
1,400
1,200
1,000
800
600
400
200
0
MARKET FACTS & FIGURES
Charterers/DTH
FD&D
War
Other Risks
BUSINESS PORTFOLIO SPREAD
70%
25%
4%
1%
North America 13%
Far East25%
Europe50%
Middle East 4%
Africa 1%
Australia 5%
General Cargo 30%
Others 3%
Bulkers 45%
Tankers 15%
South America 2%
Tugs & Barges 2%
Containers 5%
12,000,000
10,000,000
8,000,000
6,000,000
4,000,000
2,000,000
0
P&I PREMIUM INCOME (USD)
12,000
10,000
8,000
6,000
4,000
2,000
0
VESSELS ON RISK
2008 2009 2010 2011 2012 2013
2009 2010 2011 2012 2013
2009 2010 2011 2012 2013
1,400
1,200
1,000
800
600
400
200
0

MARINE P&I AJGINTERNATIONAL.COM ARTHUR J. GALLAGHER 52 MARINE P&I AJGINTERNATIONAL.COM ARTHUR J. GALLAGHER 53
WWW.EXCLUSIVELYFORCHARTERERS.COM
CHARTERERS P&I CLUB
Reinsurance Carrier: Munich ReStandard and Poor’s Rating: AA-Maximum Limit Offered: Up to USD 500 MillionVessel Type/ Size Cap: No restrictionsFacility Location: London, United Kingdom
The Charterers P&I club was founded in 1986, as a mutual insurance company, specialising in charterers liability insurance and defence coverage. In 1999 the Club was demutualised and an underwriting agency was formed, backed by Lloyd's of London security, offering fixed premium charterers liability and other marine related products. In 2009 the agency switched its security to Great Lakes Munich Re Group, which holds an S&P AA- rating. Michael Else & Co. are the managers of the Club and provide all underwriting and claims support though its global correspondent network. The facility provides limits of liability up to USD 500 million for charterer’s liability and up to USD 2 million for FD&D.
The agency employs experienced maritime lawyers and commercial claims handlers, with offices in London, Shanghai and a claims handling office in Dubai. In the latter part of 2013, the managers of the Charterers P&I Club set up a strategic hub in Dubai as Sextant Marine to service the overseas markets more efficiently.
CHARTERERS P&I SAYS:
“The fixed market has developed significantly over the last two decades and currently has a very diverse list of participants offering various security and service levels competing against the traditional Mutual P&I markets. If imitation is the greatest form of flattery then the fact that so many of the mutuals are starting fixed facilities or entering the Lloyd's market demonstrates that there are significant changes afoot in the P&I market in the years to come. The changing P&I market is coming at a turbulent time for the more traditional participants. The depressed shipping market has led to challenges in many classes of business from the FD&D claims cycle to the churn effect impacting prices, premium volume and which has forced many of the traditional owners clubs to seek new markets with many of them deciding that they are now a home for charterers, hull insurance, energy insurance and other risks having avoided these markets entirely in the past. There has been a significant upsurge in competition over the last three years which has intensified over the last twenty four months. We have had to take a defensive approach to renewals and we have had to revise our growth levels to take into account that many of our competitors are willing to write business at levels that does not appear to be sustainable long term. Diversification from some of the IG Clubs is unwelcome but not a concern long term. Diversification is more likely to be a problem for Mutual Clubs in the longer term as they dilute the service levels that their members, i.e. shipowners, have become accustomed to receiving and they inevitably dilute the strength of the brand they have taken decades to establish.”
TWELVE MONTH DEVELOPMENT PERFORMANCE INDICATORS
PREMIUM INCOME USD
+3.6%
NUMBER OF VESSELS ON RISK +4.1%
AVERAGE PREMIUM PER VESSEL -0.5%
2012 PY 2013 PY 2012 PY 2013 PY 2012 PY 2013 PY
USD 27,200,000 USD 28,200,000 12,000 12,500 USD 2,333.33 USD 2,256.00
COMMERCIAL P&I MARKET REVIEW 2014
AVERAGE PREMIUM PER VESSEL BUSINESS PORTFOLIO SPREAD
GEOGRAPHICAL SPREAD OF BUSINESS TYPE OF ENTERED VESSEL
P&I PREMIUM INCOME (USD) NUMBER OF VESSELS ON RISK
CHARTERERS LIABILTIY INCOME (USD)
Policy Year: 2008 2009 2010 2011 2012 2013
Charterers Premium Income
25,500,000 28,000,000 27,000,000 25,500,000 27,200,000 28,200,000
NO. VESSELS INSURED
Policy Year: 2008 2009 2010 2011 2012 2013
Gross Tonnage - 11,000 11,500 11,000 12,000 12,500
Middle East11%
Northern Europe14%
Far East 53%
Southern Europe 14%
North America 5%
Africa 3%
Bulkers 76% Liner 18%
Others 3%
Tankers 3%
2009 2010 2011 2012 2013
2,6002,5502,5002,4502,4002,3502,3002,2502,2002,1502,100
TONNAGE DEVELOPMENT(Gross Tonnage)
13,000
12,500
12,000
11,500
11,000
10,500
10,000 2009 2010 2011 2012 2013
27,000,000
27,500,000
27,000,000
26,500,000
26,000,000
25,500,000
25,000,000
P&I PREMIUM INCOME (USD)
2008 2009 2010 2011 2012 2013
AVERAGE RATE PER GT(USD per GT)
No data provided
MARKET FACTS & FIGURES

MARINE P&I AJGINTERNATIONAL.COM ARTHUR J. GALLAGHER 54 MARINE P&I AJGINTERNATIONAL.COM ARTHUR J. GALLAGHER 55
WWW.NORCLUB-NO
NORWEGIAN HULL CLUB
Reinsurance Carrier: Lloyd's of LondonStandard and Poor’s Rating: A-Maximum Limit Offered: USD 200 MillionVessel Type/ Size Cap: No restrictionsFacility Location: Oslo, Norway
In 2008 the Club commenced underwriting Charterer’s Liability risks, today their portfolio commands a premium income of around USD 11 Million, with approximately 150 charterers & traders clients. The Clubs’ charterer’s facility offers limits up to USD 500 Million for traditional Charterer’s P&I and Damage to Hull. FD&D for charterers is also available in addition to the Clubs extensive marine insurance product range. The Norwegian Hull Club has a large share of the Norwegian ocean hull market and ranks amongst the largest pure marine underwriters in the world.
NORWEGIAN HULL CLUB SAYS:
“There is too much capacity in the market providing inconsistent pricing among providers.
NHC has scaled back its portfolio due to strong competition in certain markets, offering unsustainable pricing.
NHC is always aiming to become long-term strategic partner, and not a pure capacity provider, hence we are selective in a soft market in order to manage the cycle and be there for the long run. Some of the P&I clubs have been in the charterer’s liability market for a long time, in general all new capacity in a market will threaten the established market's shares. As expected, P&I Clubs are looking to grow their books, and are undercutting an already soft market.”
TWELVE MONTH DEVELOPMENT PERFORMANCE INDICATORS
PREMIUM INCOME USD
-4.3%
NUMBER OF VESSELS ON RISK -3.1%
AVERAGE PREMIUM PER VESSEL -1.3%
2012 PY 2013 PY 2012 PY 2013 PY 2012 PY 2013 PY
USD 11,500,000 USD 11,000,000 1,960 1,900 USD 5,867 USD 5,789
COMMERCIAL P&I MARKET REVIEW 2014
AVERAGE PREMIUM PER VESSEL BUSINESS PORTFOLIO SPREAD
GEOGRAPHICAL SPREAD OF BUSINESS TYPE OF ENTERED VESSEL
P&I PREMIUM INCOME (USD) NUMBER OF VESSELS ON RISK
CHARTERERS LIABILTIY INCOME (USD)
Policy Year: 2008 2009 2010 2011 2012 2013
Charterers Premium Income
4,800,000 8,700,000 9,500,000 11,000,000 11,500,000 11,000,000
NO. VESSELS INSURED
Policy Year: 2008 2009 2010 2011 2012 2013
Gross Tonnage 890 1,340 1,630 1,880 1,960 1,900
H&M
BUSINESS PORTFOLIO SPREAD
64%
Other Risks 27%
4%
5%
War
Charterers/DTH
Middle East1%
Asia Pacific40%
Europe55%
North America 4%
Bulkers 15%GeneralCargo 75%
Other 10%
2,500
2,000
1,500
1,000
500
0
P&I PREMIUM INCOME (USD)
VESSELS ON RISK
AVERAGE PREMIUM PER VESSEL
2008 2009 2010 2011 2012 2013
2008 2009 2010 2011 2012 2013
11,500,000
10,500,000
9,500,000
8,500,000
7,500,000
6,500,000
5,500,000
4,500,000
2008 2009 2010 2011 2012 2013
6,600
6,400
6,200
6,000
5,800
5,600
5,400
5,200
5,000
MARKET FACTS & FIGURES

MARINE P&I AJGINTERNATIONAL.COM ARTHUR J. GALLAGHER 56 MARINE P&I AJGINTERNATIONAL.COM ARTHUR J. GALLAGHER 57
INDUSTRY STATISTICS
3
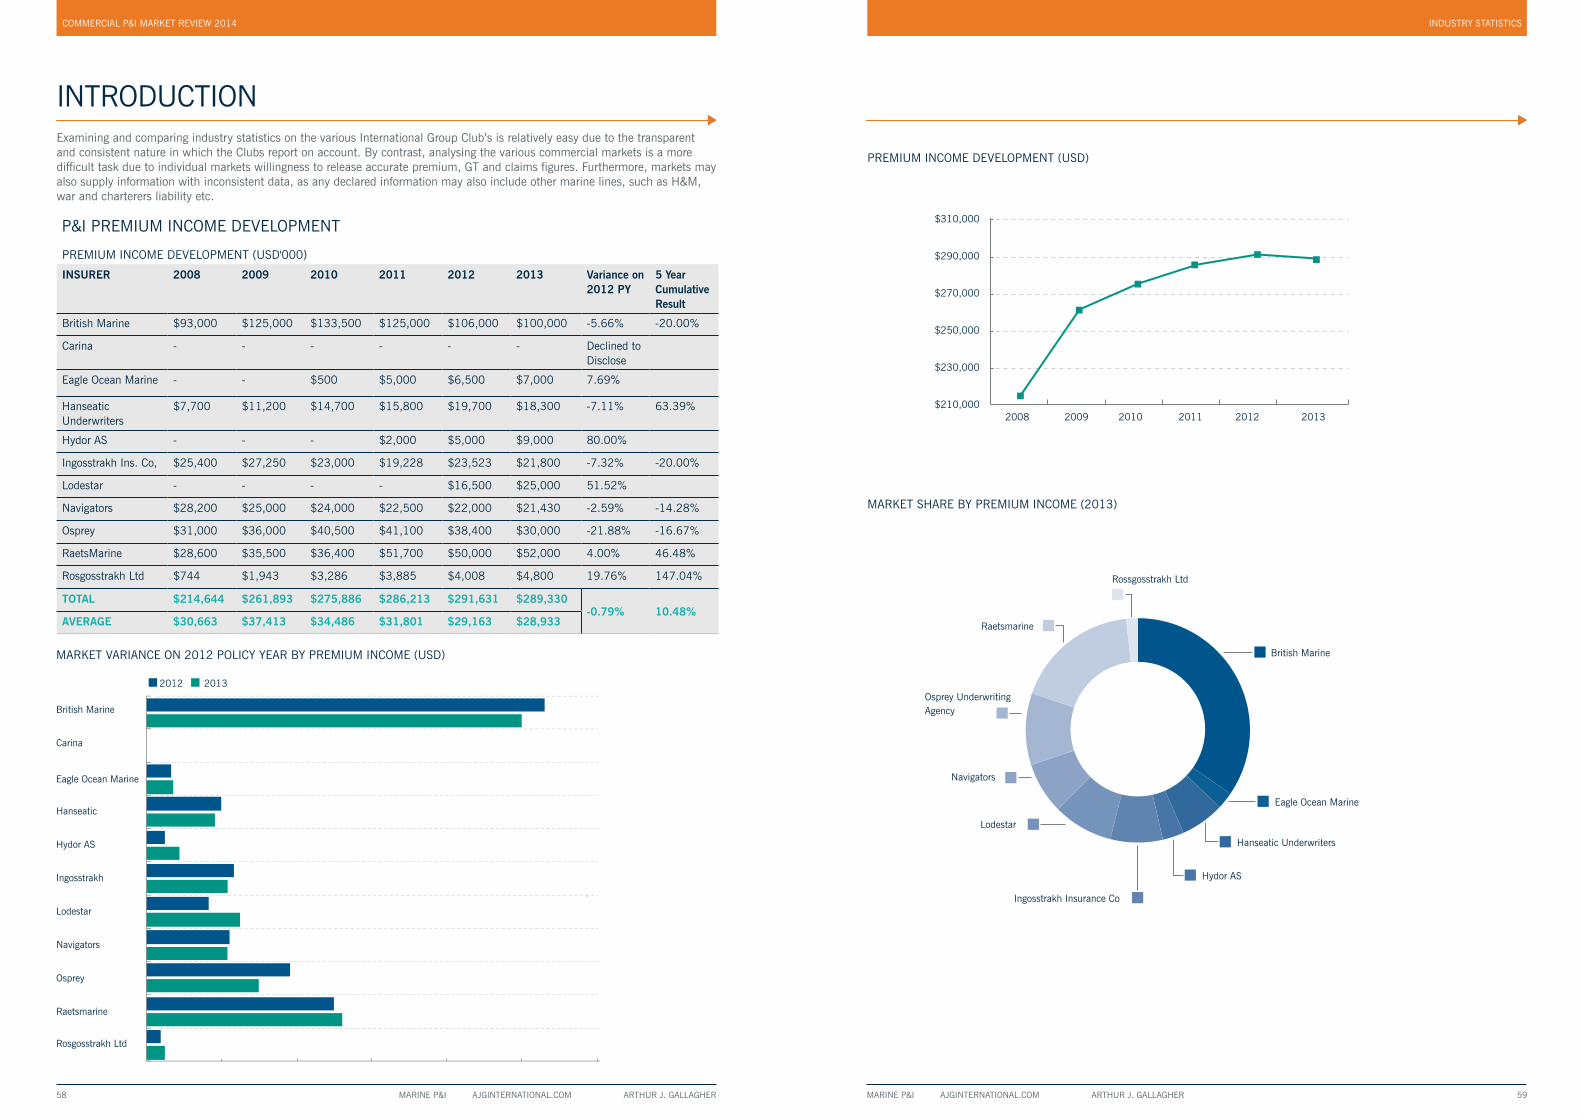
INTRODUCTION
Examining and comparing industry statistics on the various International Group Club’s is relatively easy due to the transparent and consistent nature in which the Clubs report on account. By contrast, analysing the various commercial markets is a more difficult task due to individual markets willingness to release accurate premium, GT and claims figures. Furthermore, markets may also supply information with inconsistent data, as any declared information may also include other marine lines, such as H&M, war and charterers liability etc.
P&I PREMIUM INCOME DEVELOPMENT
PREMIUM INCOME DEVELOPMENT (USD'000)
INSURER
2008 2009 2010 2011 2012 2013 Variance on 2012 PY
5 Year Cumulative Result
British Marine $93,000 $125,000 $133,500 $125,000 $106,000 $100,000 -5.66% -20.00%
Carina - - - - - - Declined to Disclose
Eagle Ocean Marine - - $500 $5,000 $6,500 $7,000 7.69%
Hanseatic Underwriters
$7,700 $11,200 $14,700 $15,800 $19,700 $18,300 -7.11% 63.39%
Hydor AS - - - $2,000 $5,000 $9,000 80.00%
Ingosstrakh Ins. Co, $25,400 $27,250 $23,000 $19,228 $23,523 $21,800 -7.32% -20.00%
Lodestar - - - - $16,500 $25,000 51.52%
Navigators $28,200 $25,000 $24,000 $22,500 $22,000 $21,430 -2.59% -14.28%
Osprey $31,000 $36,000 $40,500 $41,100 $38,400 $30,000 -21.88% -16.67%
RaetsMarine $28,600 $35,500 $36,400 $51,700 $50,000 $52,000 4.00% 46.48%
Rosgosstrakh Ltd $744 $1,943 $3,286 $3,885 $4,008 $4,800 19.76% 147.04%
TOTAL $214,644 $261,893 $275,886 $286,213 $291,631 $289,330-0.79% 10.48%
AVERAGE $30,663 $37,413 $34,486 $31,801 $29,163 $28,933
MARINE P&I AJGINTERNATIONAL.COM ARTHUR J. GALLAGHER 58
COMMERCIAL P&I MARKET REVIEW 2014
MARKET VARIANCE ON 2012 POLICY YEAR BY PREMIUM INCOME (USD)
$0 $20,000 $40,000 $60,000 $80,000 $100,000 $120,000
2012 2013
British Marine
Carina
Eagle Ocean Marine
Hanseatic
Hydor AS
Ingosstrakh
Lodestar
Navigators
Osprey
Raetsmarine
Rosgosstrakh Ltd
$310,000
$290,000
$270,000
$250,000
$230,000
$210,000
PREMIUM INCOME DEVELOPMENT (US$)
2008 2009 2010 2011 2012 2013
59MARINE P&I AJGINTERNATIONAL.COM ARTHUR J. GALLAGHER
Navigators
Lodestar
Eagle Ocean Marine
British Marine
Osprey Underwriting Agency
Rossgosstrakh Ltd
Raetsmarine
Hanseatic Underwriters
Hydor AS
Ingosstrakh Insurance Co
INDUSTRY STATISTICS
PREMIUM INCOME DEVELOPMENT (USD)
MARKET SHARE BY PREMIUM INCOME (2013)

P&I OWNED GT DEVELOPMENT
P&I OWNED GT DEVELOPMENT (USD'000)
INSURER
2008 2009 2010 2011 2012 2013 Variance on 2012 PY
5 Year Cumulative Result
British Marine 11,000 13,500 13,520 12,600 12,000 11,000 -8.33% -18.52%
Carina - - - - - 2,000 - -
Eagle Ocean - - 50 470 650 590 -9.23% -
Hanseatic 1,400 1,600 1,900 2,100 2,400 2,700 12.50% 68.75%
Hydor AS - - - 1,000 1,200 1,300 8.33% -
Ingosstrakh Ins. Co 7,895 5,879 6,024 4,730 5,001 5,001 0.00% -14.93%
Lodestar - - - - 1,777 2,756 55.09% -
Navigators 2,450 2,300 2,100 2,200 2,100 2,000 -4.76% -13.04%
Osprey - - - - - - - -
RaetsMarine 5,298 12,178 11,390 16,262 15,806 15,366 -2.78% 26.18%
Rosgosstrakh Ltd 235 562 1,038 1,055 1,118 1,424 27.37% 153.38%
TOTAL 28,278 36,019 36,022 40,417 42,052 44,137
4.96% 22.54%AVERAGE 2,571 3,274 3,275 3,674 3,823 4,012
MARINE P&I AJGINTERNATIONAL.COM ARTHUR J. GALLAGHER 60
COMMERCIAL P&I MARKET REVIEW 2014
MARKET VARIANCE ON 2012 POLICY YEAR BY GROSS TONNAGE
$0 $2,000 $4,000 $6,000 $8,000 $10,000 $12,000 $14,000 $16,000 $18,000
2012 2013
British Marine
Carina
Eagle Ocean Marine
Hanseatic
Hydor AS
Ingosstrakh
Lodestar
Navigators
Osprey
Raetsmarine
Rosgosstrakh Ltd
2008 2009 2010 2011 2012 2013
45,000
43,000
41,000
39,000
37,000
35,000
33,000
31,000
29,000
27,000
25,000
GROSS TONNAGE DEVELOPMENT
MARKET SHARE BY GROSS TONNAGE (2013)
Navigators
Lodestar
Ingosstrakh Insurance Co
Carina
British Marine
Rossgosstrakh Ltd
Raetsmarine
Eagle Ocean Marine
Hanseatic Underwriters
Hydor AS
GROSS TONNAGE DEVELOPMENT
MARINE P&I AJGINTERNATIONAL.COM ARTHUR J. GALLAGHER 61
INDUSTRY STATISTICS
MARKET SHARE BY GROSS TONNAGE (2013)

MARINE P&I AJGINTERNATIONAL.COM ARTHUR J. GALLAGHER 62 MARINE P&I AJGINTERNATIONAL.COM ARTHUR J. GALLAGHER 63
COMMERCIAL P&I MARKET REVIEW 2014
AVERAGE P&I RATE PER GT DEVELOPMENT
P&I OWNED AVERAGE P&I RATE PER GT DEVELOPMENT (USD'000)
INSURER
2008 2009 2010 2011 2012 2013 Variance on 2012 PY
5 Year Cumulative Result
British Marine $8.455 $9.259 $9.874 $9.921 $8.833 $9.091 2.92% -1.82%
Carina - - - - - - - -
Eagle Ocean Marine - - $10.000 $10.638 $10.000 $11.864 18.64% -
Hanseatic Underwriters
$5.500 $7.000 $7.737 $7.524 $8.208 $6.778 -17.43% -3.17%
Hydor AS - - - $2.000 $4.167 $6.923 66.15% -
Ingosstrakh Ins. Co, $3.217 $4.635 $3.818 $4.065 $4.704 $4.359 -7.32% -5.95%
Lodestar - - - - $9.285 $9.071 -2.31% -
Navigators $11.510 $10.870 $11.429 $10.227 $10.476 $10.715 2.28% -1.42%
Osprey - - - - - - - -
RaetsMarine $5.398 $2.915 $3.196 $3.179 $3.163 $3.380 6.85% 15.95%
Rosgosstrakh Ltd $3.166 $3.457 $3.166 $3.682 $3.585 $3.370 -6.00% -2.52%
TOTAL $7.590 $7.271 $7.659 $7.082 $6.935 $6.555-5.48% -9.84%
VARIANCE -4.21% 5.33% -7.54% -2.07% -5.48%
AVERAGE RATE PER GT DEVELOPMENT (LAST 12 MONTHS)
Average$6.555
2012 2013
$0 $2,000 $4,000 $6,000 $8,000 $10,000 $12,000 $14,000
British Marine
Carina
Eagle Ocean Marine
Hanseatic
Hydor AS
Ingosstrakh
Lodestar
Navigators
Osprey
Raetsmarine
Rosgosstrakh Ltd
INDUSTRY STATISTICS
2008 2009 2010 2011 2012 2013
AVERAGE RATE PER GT DEVELOPMENT (US$)
$8.100
$7.900
$7.700
$7.500
$7.300
$7.100
$6.900
$6.700
$6.500
AVERAGE RATE PER GT DEVELOPMENT (USD)

P&I CHARTERERS & TRADERS PREMIUM INCOME DEVELOPMENT
P&I CHARTERERS & TRADERS PREMIUM INCOME DEVELOPMENT (USD'000)
INSURER
2008 2009 2010 2011 2012 2013 Variance on 2012 PY
5 Year Cumulative Result
Charterama BV - $3,000 $5,000 $6,000 $8,000 $10,000 25.00% 233.33%
Charterers P&I Club $25,000 $28,000 $27,000 $25,500 $27,200 $28,200 3.68% 0.71%
RaetsMarine BV $0 $24,500 $26,000 $25,700 $27,000 $25,500 -5.56% 4.08%
Norwegian Hull Club
$4,800 $8,700 $9,500 $11,000 $11,500 $11,000 -4.35% 26.44%
Hanseatic Underwriters
$1,200 $850 $900 $950 $1,000 $1,200 20.00% 41.18%
TOTAL $31,000 $65,050 $68,400 $69,150 $74,700 $75,900
1.61% 16.68%
VARIANCE 109.84% 5.15% 1.10% 8.03% 1.61%
MARINE P&I AJGINTERNATIONAL.COM ARTHUR J. GALLAGHER 64
COMMERCIAL P&I MARKET REVIEW 2014
MARKET VARIANCE ON 2012 POLICY YEAR BY PREMIUM INCOME (USD)
$0 $5,000 $10,000 $15,000 $20,000 $25,000 $30,000
2012 2013
Charterama BV
Charterers P&I Club
Raetsmarine BV
Norwegian Hull Club
Hanseatic Underwriters
2008 2009 2010 2011 2012
$78,000
$76,000
$74,000
$72,000
$70,000
$68,000
$66,000
$64,000
PREMIUM INCOME DEVELOPMENT (US$)
MARKET SHARE BY PREMIUM INCOME (US$)
Raetsmarine BV
Charterama
Norwegian Hull Club
Hanseatic Underwriters
Charterers P&I Club
MARINE P&I AJGINTERNATIONAL.COM ARTHUR J. GALLAGHER 65
INDUSTRY STATISTICS
PREMIUM INCOME DEVELOPMENT (USD)
MARKET SHARE BY PREMIUM INCOME (USD)

MARINE P&I AJGINTERNATIONAL.COM ARTHUR J. GALLAGHER 66 MARINE P&I AJGINTERNATIONAL.COM ARTHUR J. GALLAGHER 67
NUMBER OF VESSELS INSURED DEVELOPMENT
P&I CHARTERERS & TRADERS NUMBER OF VESSELS INSURED DEVELOPMENT (USD'000)
INSURER
2008 2009 2010 2011 2012 2013 Variance on 2012 PY
5 Year Cumulative Result
Charterama BV 2,500 4,000 5,800 8,300 10,500 26.51% 320.00%
Charterers P&I Club 11,000 11,500 11,000 12,000 12,500 4.17% 13.64%
RaetsMarine BV 18,061 22,371 23,783 23,783 21,000 -11.70% 16.27%
Norwegian Hull Club
890 1,340 1,630 1,880 1,960 1,900 -3.06% 41.79%
Hanseatic Underwriters
- - - - - - - -
TOTAL 890 32,901 39,501 42,463 46,043 45,900
-0.31% 39.51%
VARIANCE 3596.74% 20.06% 7.50% 8.43% -0.31%
COMMERCIAL P&I MARKET REVIEW 2014
MARKET VARIANCE ON 2012 POLICY YEAR BY NUMBER OF VESSELS INSURED
$0 $5,000 $10,000 $15,000 $20,000 $25,000
2012 2013
Charterama BV
Charterers P&I Club
Raetsmarine BV
Norwegian Hull Club
Hanseatic Underwriters
MARKET SHARE BY NUMBER OF VESSELS INSURED
Raetsmarine BV
Charterama
Norwegian Hull Club
Charterers P&I Club
2009 2010 2011 2012 2013
50,000
48,000
46,000
44,000
42,000
40,000
38,000
36,000
34,000
32,000
30,000
NUMBER OF VESSELS INSURED DEVELOPMENT
INDUSTRY STATISTICS
NUMBER OF VESSELS INSURED DEVELOPMENT
MARKET SHARE BY NUMBER OF VESSELS INSURED
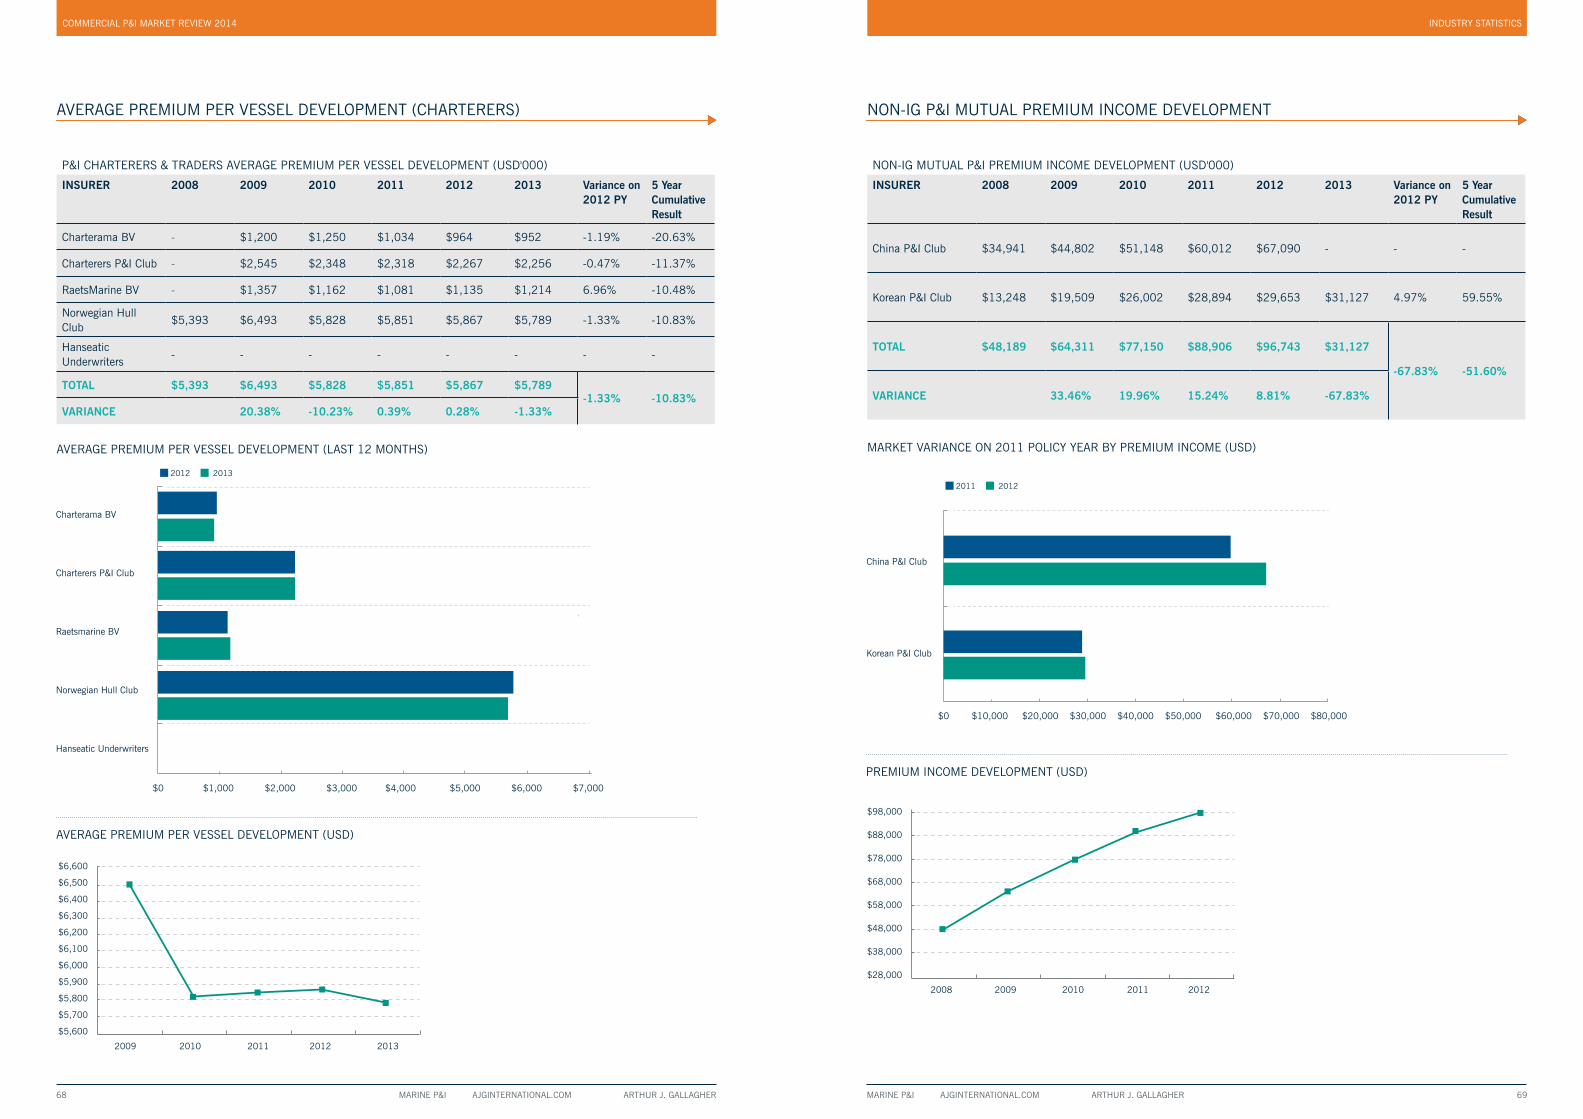
MARINE P&I AJGINTERNATIONAL.COM ARTHUR J. GALLAGHER 68
AVERAGE PREMIUM PER VESSEL DEVELOPMENT (CHARTERERS)
P&I CHARTERERS & TRADERS AVERAGE PREMIUM PER VESSEL DEVELOPMENT (USD'000)
INSURER
2008 2009 2010 2011 2012 2013 Variance on 2012 PY
5 Year Cumulative Result
Charterama BV - $1,200 $1,250 $1,034 $964 $952 -1.19% -20.63%
Charterers P&I Club - $2,545 $2,348 $2,318 $2,267 $2,256 -0.47% -11.37%
RaetsMarine BV - $1,357 $1,162 $1,081 $1,135 $1,214 6.96% -10.48%
Norwegian Hull Club
$5,393 $6,493 $5,828 $5,851 $5,867 $5,789 -1.33% -10.83%
Hanseatic Underwriters
- - - - - - - -
TOTAL $5,393 $6,493 $5,828 $5,851 $5,867 $5,789-1.33% -10.83%
VARIANCE 20.38% -10.23% 0.39% 0.28% -1.33%
2009 2010 2011 2012 2013
$6,600
$6,500
$6,400
$6,300
$6,200
$6,100
$6,000
$5,900
$5,800
$5,700
$5,600
AVERAGE PREMIUM PER VESSEL DEVELOPMENT (US$)
AVERAGE PREMIUM PER VESSEL DEVELOPMENT (LAST 12 MONTHS)
COMMERCIAL P&I MARKET REVIEW 2014
$0 $1,000 $2,000 $3,000 $4,000 $5,000 $6,000 $7,000
2012 2013
Charterama BV
Charterers P&I Club
Raetsmarine BV
Norwegian Hull Club
Hanseatic Underwriters
AVERAGE PREMIUM PER VESSEL DEVELOPMENT (USD)
MARINE P&I AJGINTERNATIONAL.COM ARTHUR J. GALLAGHER 69
2008 2009 2010 2011 2012
$98,000
$88,000
$78,000
$68,000
$58,000
$48,000
$38,000
$28,000
PREMIUM INCOME DEVELOPMENT (US$)
NON-IG P&I MUTUAL PREMIUM INCOME DEVELOPMENT
NON-IG MUTUAL P&I PREMIUM INCOME DEVELOPMENT (USD'000)
INSURER
2008 2009 2010 2011 2012 2013 Variance on 2012 PY
5 Year Cumulative Result
China P&I Club $34,941 $44,802 $51,148 $60,012 $67,090 - - -
Korean P&I Club $13,248 $19,509 $26,002 $28,894 $29,653 $31,127 4.97% 59.55%
TOTAL $48,189 $64,311 $77,150 $88,906 $96,743 $31,127
-67.83% -51.60%
VARIANCE 33.46% 19.96% 15.24% 8.81% -67.83%
MARKET VARIANCE ON 2011 POLICY YEAR BY PREMIUM INCOME (USD)
PREMIUM INCOME DEVELOPMENT (USD)
INDUSTRY STATISTICS
$0 $10,000 $20,000 $30,000 $40,000 $50,000 $60,000 $70,000 $80,000
2011 2012
China P&I Club
Korean P&I Club

MARINE P&I AJGINTERNATIONAL.COM ARTHUR J. GALLAGHER 70 MARINE P&I AJGINTERNATIONAL.COM ARTHUR J. GALLAGHER 71
NON-IG P&I MUTUAL OWNED GT DEVELOPMENT
NON-IG MUTUAL P&I GT DEVELOPMENT (USD'000)
INSURER
2008 2009 2010 2011 2012 2013 Variance on 2012 PY
5 Year Cumulative Result
China P&I Club 16,510 17,880 24,010 27,800 31,340 - - -
Korean P&I Club 4,996 7,338 8,685 10,007 11,833 18,192 53.74% 147.91%
TOTAL 21,506 25,218 32,695 37,807 43,173 18,192
-57.86% -27.86%
VARIANCE 17% 30% 16% 14% -58%
50,000
45,000
40,000
35,000
30,000
25,000
20,000
15,000
10,000
5,000
0
GROSS TONNAGE DEVELOPMENT
2008 2009 2010 2011 2012 2013
Korean P&I Club Development
Non-IG Mutual GT Development 2008-2012
MARKET VARIANCE ON 2011 POLICY YEAR BY GROSS TONNAGE
GROSS TONNAGE DEVELOPMENT
$0 $5,000 $10,000 $15,000 $20,000 $25,000 $30,000 $35,000
2011 2012
China P&I Club
Korean P&I Club
COMMERCIAL P&I MARKET REVIEW 2014
2008 2009 2010 2011 2012
$7.000
$6.000
$5.000
$4.000
$3.000
$2.000
$1.000
$0
AVERAGE RATE PER GT DEVELOPMENT (US$)
AVERAGE NON-IG P&I MUTUAL RATE PER GT DEVELOPMENT
NON-IG MUTUAL P&I AVERAGE P&I RATE PER GT DEVELOPMENT (USD'000)
INSURER
2008 2009 2010 2011 2012 2013 Variance on 2012 PY
5 Year Cumulative Result
China P&I Club $2.116 $2.506 $2.130 $2.159 $2.141 - - -
Korean P&I Club $2.652 $2.659 $2.994 $2.887 $2.506 $1.711 -31.72% -35.64%
TOTAL $4.768 $5.164 $5.124 $5.046 $4.647 $1.711
-63.18% -66.87%
VARIANCE 8.31% -0.78% -1.52% -7.92% -63.18%
AVERAGE RATE PER GT DEVELOPMENT (LAST 12 MONTHS)
AVERAGE RATE PER GT DEVELOPMENT (USD)
$0.000 $1.000 $2.000 $3.000 $4.000
2011 2012
China P&I Club
Korean P&I Club
INDUSTRY STATISTICS

MARINE P&I AJGINTERNATIONAL.COM ARTHUR J. GALLAGHER 72 MARINE P&I AJGINTERNATIONAL.COM ARTHUR J. GALLAGHER 73
KEYAA: “Very Strong” financial security characteristics.
A: “Strong” financial security characteristics, but is somewhat more likely to be affected by adverse business conditions than are insurers with higher ratings.
BBB: “Good” financial security characteristics, but is more likely to be affected by adverse business conditions than are higher rated insurers.
BB: “Marginal” financial security characteristics. Positive attributes exist, but adverse business conditions lead to insufficient ability to meet financial requirements.
B: “Weak” financial security characteristics. Adverse business conditions will likely impart the ability to meet financial commitments.
Ratings BBB or higher are regarded as having financial security characteristics that outweigh any vulnerabilities, and are likely to have the ability to meet financial commitments.
Ratings BB or lower are regarded as having vulnerable characteristics that may outweigh the strengths.
‘Pi’ ratings are based on public data only; others are based on a periodic review by S&P analysts.
+ or - Signs show relative standing within the major rating category
RATING AGENCY ANALISYSArthur J. Gallagher (UK) Ltd (“AJG (UK)”) operates a market security policy which sets a minimum standard for insurance markets which can be included on its acceptable market security list. A number of criteria are utilised to evaluate the financial condition of these markets and one of the criteria used is the ratings allocated by either Standard & Poor’s (S&P) or A M Best. The AJG (UK) security policy sets a minimum rating level of A- from these agencies as an indicator of acceptable security.
Accordingly where a security fails to meet the minimum criteria, we would direct your attention to your P&I Insurers financial strength rating, where and when it falls below an S&P or AM Best A- rating and where this security no longer qualifies for inclusion on the AJG (UK) market security list; requesting that you advise us if you wish us to attempt to source an alternative market. In some cases it may be possible to arrange P&I cover with an S&P or AM Best ‘A’ rated carrier on similar terms.
This is something that we can discuss with you on an individual case by case basis. It is important that you carefully consider maintaining your insurance with your current P&I insurer where the rating is below the AJG(UK) minimum of A- and that should you decide to do so that you also understand that AJG (UK) are not responsible for the continuing performance of any security and that any future credit risk associated with renewing the policy with your current insurer will be borne by the assured. We would, therefore, draw your attention to the following ratings and respectfully request that, if you require us to look at other options in respect of your risk here, you advise us accordingly as soon as possible.
STANDARD AND POOR’S RATINGS
P&I FACILITY CURRENT RATING P&I FACILITY CURRENT RATING
BRITISH MARINE A+ INGOSSTRAKH BBB-
CARINA A+ KOREAN P&I CLUB UNRATED BY S&P
CHARTERAMA BV A LODESTAR LTD A
CHARTERERS P&I CLUB AA- NAVIGATORS P&I A
CHINA P&I CLUB UNRATED BY S&P NORWEGIAN HULL CLUB A-
EAGLE OCEAN MARINE BBB- OSPREY A+
HANSEATIC P&I A RAETSMARINE BV A-
HYDOR AS A+
COMMERCIAL P&I MARKET REVIEW 2014

MARINE P&I AJGINTERNATIONAL.COM ARTHUR J. GALLAGHER 74 MARINE P&I AJGINTERNATIONAL.COM ARTHUR J. GALLAGHER 75
MAJOR LIMITING CONVENTIONS & STATUTES AFFECTING P&I RISKS
4

MARINE P&I AJGINTERNATIONAL.COM ARTHUR J. GALLAGHER 76 MARINE P&I AJGINTERNATIONAL.COM ARTHUR J. GALLAGHER 77
DEVELOPMENTS IN THE PAST 12 MONTHS
ATHENS CONVENTION / EU PASSENGER LIABILITY REGULATION The Passenger Liability Regulation (“PLR”), which is the part of the 3rd Maritime Safety Package that deals with passenger liabilities, came into force on 31 December 2012 without the need for national implementation.
The provisions of PLR mirror those of the 2002 Protocol to the Athens Convention (“PAL”) with only minor differences. These came into force on 23 April 2014.
Both the PLR and PAL requires that ships which carry 12 or more passengers, must carry a certificate of insurance / financial security.
At present there is some debate going on about whether the certificates issued under one regulation are acceptable under the other – eg would a non EU PAL ratifying state accept a PLR certificate? This would avoid the need for duplicate certificates under each piece of regulation.
Currently EU states will accept certificates issued under PLR or PAL but this attitude has yet to have universal approval as additional states accede to PAL.
NAIROBI WRECK REMOVAL CONVENTION
This has achieved a sufficiency of ratifications by early 2014 and is now due to enter into force in April 2015.
The Convention establishes strict liability upon the shipowner to locate, mark and remove a wreck where it is a hazard to navigation or the environment. The convention sets out 15 criteria to be taken into account when assessing the risk and the measures required. The convention automatically applies to a signatory state’s EEZ, but not necessarily (unless extended) to the signatory’s territorial waters.
As has become a trend with recent Conventions, the Nairobi Convention allows direct action against the owner and insurer, and also requires financial certification via a Blue Card.
MARITIME LABOUR CONVENTION (“MLC”)The MLC came into force on 20 August 2013 having presented the Clubs with a couple of coverage dilemmas. Most liabilities under the MLC fell under normal Club cover, but there are a number of areas which were considered likely to cause problems.
The MLC requires financial security to be in place to cover abandonment and repatriation of crew where the shipowner becomes insolvent. This issue was addressed by extending Club cover to insure this aspect of “credit risk”, on a non-pooled basisThis time last year, the MLC did not, extend the
financial security requirements to encompass unpaid wages in the event of shipowner insolvency. However in June 2014 the Special Tripartite Committee of the ILO approved a number of amendments to the MLC which will effectively extend liability under the MLC to encompass loss of up to 4 months wages in the event of shipowner insolvency, and to require certification thereof.
This obligation is not part of current P&I cover – unlike most of the original elements of the MLC which are presently covered. Indeed, it is also inconsistent with current rating methodologies as it is a financial risk cover based on the shipowners perceived solvency levels. Whilst, for certification purposes, it may be desirable for the Clubs to offer this cover, it may not be something that they feel able to incorporate in P&I cover as a retained risk.
Ultimately we could see a “reverse COFR” style of solution, with the Clubs certifying cover in place but not actually providing the cover, but any solution is unlikely to have effect before late 2016 or 2017.
COMMERCIAL P&I MARKET REVIEW 2014
1. CONVENTION ON LIMITATION OF LIABILITY FOR MARITIME CLAIMS (LLMC), 1976 (IN FORCE 1 DEC 1986)This convention applies to all vessels involved in incidents in signatory states, except such incidents to which the Civil Liability Convention (See Section 3) applies. At 28 July 2014, it has been ratified by 54 states, covering 54.55% of world tonnage.
The right to limit losses under this convention is lost if the incident involves a personal act or omission carried out intentionally or recklessly and with the knowledge that loss would result.
Liability under the convention is calculated in accordance with the following formulae (note that, at 28 August 2014, SDR 1 = approximately US$ 1.522):
1.1. PERSONAL INJURY / LOSS OF LIFE
Vessel Size Formula
500 GT or less Minimum SDR 333,000
501-3,000 GT Add SDR 500 per GT to the above sum
3,001-30,000 GT Add SDR 333 per GT to the above aggregate
30,001-70,000 GT Add SDR 250 per GT to the above aggregate
70,001 GT or more Add SDR 167 per GT to the above aggregate
Example
25,000 GT SDR 8,909,000
75,000 GT SDR 21,409,000
1.2. PROPERTY
Vessel Size Formula
500 GT or less Minimum SDR 167,000
501-30,000 GT Add SDR 167 per GT to the above sum
30,001-70,000 GT Add SDR 125 per GT to the above aggregate
70,001 GT or more Add SDR 83 per GT to the above aggregate
Example
25,000 GT SDR 4,258,500
75,000 GT SDR 10,508,500
INDUSTRY STATISTICS

MARINE P&I AJGINTERNATIONAL.COM ARTHUR J. GALLAGHER 78 MARINE P&I AJGINTERNATIONAL.COM ARTHUR J. GALLAGHER 79
1A. 1996 PROTOCOL TO THE 1976 LLMC (IN FORCE 13 MAY 2004)
This amends the limits of compensation payable and has been adopted by 49 states encompassing 45.30% of world tonnage at 28 July 2014. These limits are now as follows:
1A.1. PERSONAL INJURY / LOSS OF LIFE
Vessel Size Formula
2,000 GT or less Minimum SDR 2,000,000
2,001-30,000 GT Add SDR 800 per GT to the above sum
30,001-70,000 GT Add SDR 600 per GT to the above aggregate
70,001 GT or more Add SDR 400 per GT to the above aggregate
Example
25,000 GT SDR 20,400,000
75,000 GT SDR 50,400,000
1A.2. PROPERTY
Vessel Size Formula
2,000 GT or less Minimum SDR 1,000,000
2,001-30,000 GT Add SDR 400 per GT to the above sum
30,001-70,000 GT Add SDR 300 per GT to the above aggregate
70,001 GT or more Add SDR 200 per GT to the above aggregate
Example
25,000 GT SDR 10,200,000
75,000 GT SDR 25,200,000
COMMERCIAL P&I MARKET REVIEW 2014
1B. 2012 AMENDMENTS TO THE 1996 PROTOCOL (ADOPTED APRIL 2012, EXPECTED IN FORCE 8 JUNE 2015)
This further amends the limits of compensation payable. It is being dealt with via the tacit acceptance system whereby it is deemed acceptable to all contracting states after 18 months following notification and enters into force after a further 18 months. It is thus expected to come into force within another 9 months. These limits will then be as follows:
1B.1. PERSONAL INJURY / LOSS OF LIFE
Vessel Size Formula
2,000 GT or less Minimum SDR 3,020,000
2,001-30,000 GT Add SDR 1,208 per GT to the above sum
30,001-70,000 GT Add SDR 906 per GT to the above aggregate
70,001 GT or more Add SDR 604 per GT to the above aggregate
Example
25,000 GT SDR 30,804,000
75,000 GT SDR 76,104,000
1B.2. PROPERTY
Vessel Size Formula
2,000 GT or less Minimum SDR 1,510,000
2,001-30,000 GT Add SDR 604 per GT to the above sum
30,001-70,000 GT Add SDR 453 per GT to the above aggregate
70,001 GT or more Add SDR 302 per GT to the above aggregate
Example
25,000 GT SDR 15,402,000
75,000 GT SDR 38,052,000
INDUSTRY STATISTICS

MARINE P&I AJGINTERNATIONAL.COM ARTHUR J. GALLAGHER 80 MARINE P&I AJGINTERNATIONAL.COM ARTHUR J. GALLAGHER 81
2. INTERNATIONAL CONVENTION ON CIVIL LIABILITY FOR OIL POLLUTION DAMAGE (CLC), 1969 (IN FORCE 19 JUN 1975); PROTOCOL TO CLC, 1992 (IN FORCE 30 MAY 1996)
The Civil Liability Convention covers those who suffer oil pollution damage resulting from maritime casualties involving oil-carrying ships. The Convention places the liability for such damage on the owner of the ship from which the polluting oil escaped or was discharged. The original Convention has been largely replaced by the 1992 Protocol, which has been adopted by 133 states, encompassing 96.70% of world shipping as at 28 July 2014. 35 states encompassing 2.70% of world shipping remain under the original 1969 regime.
Liability is strict, and insurance is compulsory. Liability under the convention is calculated in accordance with the following formulae:
2.1. LIABILITY UNDER CLC (1992 PROTOCOL)
Vessel Size Formula
5,000 GT or less Minimum SDR 3,000,000
5,001 GT or more Add SDR 420 per GT to the above sum
Maximum SDR 59,700,000 (equivalent to 140,000 GT)
70,001 GT or more Add SDR 83 per GT to the above aggregate
Example
25,000 GT SDR 11,400,000 See earlier comment regarding the mechanics of the calculation.…
75,000 GT SDR 32,400,000
Following the spill resulting from the loss of the “Erika”, the limits were increased under an amendment, without objection, in 2000 as follows:
2.2. LIABILITY UNDER CLC AS AMENDED IN 2000 (IN FORCE 1 NOVEMBER 2003)
Vessel Size Formula
5,000 GT or less Minimum SDR 4,510,000
5,001 GT or more Add SDR 631 per GT to the above sum
Maximum SDR 89,770,000 (equivalent to 140,000 GT)
70,001 GT or more Add SDR 83 per GT to the above aggregate
Example
25,000 GT SDR 17,130,000
75,000 GT SDR 48,680,000
COMMERCIAL P&I MARKET REVIEW 2014
3. INTERNATIONAL CONVENTION ON THE ESTABLISHMENT OF AN INTERNATIONAL FUND FOR COMPENSATION FOR OIL POLLUTION DAMAGE (FUND), 1992 PROTOCOL (IN FORCE 30 MAY 1996)
The purpose of this Fund is to provide compensation for pollution damage to the extent that the protection afforded by the 1969 Civil Liability Convention is inadequate. It is also intended to give relief to shipowners in respect of the additional financial burden imposed on them by the 1969 Civil Liability Convention, with such relief being subject to conditions designed to ensure compliance with safety at sea and other conventions.
The Fund is financed by receivers of persistent oil cargoes in signatory states, via a governmental levy. It is managed by an inter-governmental organisation, the IOPC Funds.
The original 1971 Fund was denunciated in 2002 when the number of contracting states fell below 25, being effectively replaced by the 1992 Fund which entered into force in 1996. Subsequently the limits in the 1992 Fund were increased by amendment in 2000, effective November 2003.
114 states have adopted the 1992 Protocol at 28 July 2014, covering 94.16% of the world fleet.
The 2000 protocol increased this maximum sum to SDR 203 million, inclusive of the primary contribution under the 1992 CLC Protocol.
4. SUPPLEMENTARY FUND, 2003 (IN FORCE 3 MAR 2005)
The aim of this Fund is to supplement the compensation available under the 1992 Civil Liability and Fund Conventions with an additional, third tier of compensation. The Protocol is optional and participation is open to all States which are party to the 1992 Fund Convention. 31 states have adopted the 2000 protocol at 28 July 2014, covering 18.26% of the world fleet.
As with the 1992 Fund, the Supplementary Fund is financed by levies on receivers of persistent oil cargoes.
The total amount of compensation payable for any one incident will be limited to a combined total of SDR 750 million inclusive of the amount of compensation paid under the existing CLC/Fund Convention system.
5. TANKER OIL POLLUTION INDEMNIFICATION AGREEMENTS
In recognition of the potential disparities between contributions by shipowners and receivers of cargo towards the cost of pollution incidents, two agreements came into force in 2006 which sought to remedy the situation.
Under STOPIA, owners of small tankers of 29,548 GT or less indemnify the 1992 Fund for the difference between their 1992 CLC liability and SDR 20 million.
Under TOPIA, all tanker owners indemnify the 2003 Supplementary Fund in respect of 50% of any claim falling on that fund.
INDUSTRY STATISTICS

MARINE P&I AJGINTERNATIONAL.COM ARTHUR J. GALLAGHER 82 MARINE P&I AJGINTERNATIONAL.COM ARTHUR J. GALLAGHER 83
6. US OIL POLLUTION ACT (OPA), 1990
The USA is not party to any of the above pollution related conventions, instead there are specific statutes which affect any vessels discharging oil, oil products or oil by-products in US waters.
The main one of these is OPA 1990, which imposes strict liability – the only defence being acts of war, acts of God or that the loss was caused solely by the actions of a third party.
In July 2006, the US Coast Guard & Maritime Transportation Act 2006 amended limits under OPA 1990 as set out in the table below. For non tank vessels the above increases were immediate, and for tank vessels they came into force in October 2006.
6.1. LIMITS OF LIABILITY UNDER OPA 1990 AS AMENDED IN 2006
Vessel Size Formula
Single Hull Tanker: 3,000 GT or less USD 3,000 per GT with minimum USD 6,000,000
Single Hull Tanker: 3,000 GT or more USD 3,000 per GT with minimum USD 22,000,000
Double Hull Tanker: 3,000 GT or less USD 1,900 per GT with minimum USD 4,000,000
Double Hull Tanker: 3,000 GT or more USD 1,900 per GT with minimum USD 16,000,000
Other Vessels USD 950 per GT with minimum USD 800,000
Example
25,000 GT Single: USD 75,000,000 Double: USD 47,500,000
75,000 GT Single: USD 225,000,000 Double: USD 142,500,000
The US Coast Guard has subsequently announced increases in liability limits to reflect inflationary erosions since the 2006 change. These came into effect on a provisional basis on 1 July 2009, and were formally adopted with effect from 5 February 2010. Further increases are likely every three years.
6.2. AMENDED LIMITS OF LIABILITY UNDER OPA 1990 WITH EFFECT FROM 5 FEBRUARY 2010
Vessel Size Formula
Single Hull Tanker: 3,000 GT or less USD 3,200 per GT with minimum USD 6,408,000
Single Hull Tanker: 3,000 GT or more USD 3,200 per GT with minimum USD 23,496,000
Double Hull Tanker: 3,000 GT or less USD 2,000 per GT with minimum USD 4,272,000
Double Hull Tanker: 3,000 GT or more USD 2,000 per GT with minimum USD 17,088,000
Other Vessels USD 1,000 per GT with minimum USD 854,400
Example
25,000 GT Single: USD 80,000,000 Double: USD 50,000,000
75,000 GT Single: USD 240,000,000 Double: USD 150,000,000
The US has also established an Oil Spill Liability Trust Fund (“OSLTF”) administered by the National Pollution Funds Center which supports OPA 90 and is funded by a tax on oil produced and imported into the USA. The OSLTF responds where a responsible party denies liability or fails to meet that liability or where the first level of liability is insufficient to fund all claims. It can provide up to $ 1 billion any one oil pollution incident.
COMMERCIAL P&I MARKET REVIEW 2014
7. US COMPREHENSIVE ENVIRONMENTAL RESPONSE,COMPENSATION AND LIABILITY ACT (CERCLA), 1980
This legislation is focussed on “hazardous substances”, however there are circumstances where both CERCLA and OPA could apply to an incident involving a shipowner, operator, bareboat charterer etc. Club cover is discretionary as regards CERCLA related claims.
Limits of liability are as follows:
a) for vessels over 300 GT carrying a hazardous substance as cargo – the greater of US$ 5 million or US$ 300 per GT;
b) for any other vessel over 300 GT – the greater of US$ 500,000 or US$ 300 per GT.
These limits did not change when the OPA 90 limits were raised in July 2009.
In respect of obligations under both OPA and CERCLA, Certificates of Financial responsibility (COFRs) are required.
As Clubs are unwilling to certify financial responsibility as required by the US regulators, the COFR is generally provided by an independent issuing company, and covers the aggregate of the CERCLA and OPA limits of liability. Example A double hull tanker of 25,000 GT will need a COFR of US$ 55 million, comprising US$ 47,500,000 under OPA 1990 as amended plus US$ 7,500,000 under CERCLA.
8. ATHENS CONVENTION RELATING TO THE CARRIAGE OF PASSENGERS AND THEIR LUGGAGE BY SEA (PAL), 1974 (IN FORCE 30 APR 1989) & 2002 PROTOCOL THERETO (IN FORCE 23 APRIL 2014)
The Convention consolidated and harmonised two earlier Brussels conventions dealing with passengers and luggage, which were adopted in 1961 and 1967 respectively. It establishes a regime of liability for damage suffered by passengers carried on a seagoing vessel. It declares a carrier liable for damage or loss suffered by a passenger if the incident causing the damage occurred in the course of the carriage and was due to the fault or neglect of the carrier.
However, unless the carrier acted with intent to cause such damage, or recklessly and with knowledge that such damage would probably result, it can limit its liability. For the death of, or personal injury to, a passenger, this limit of liability is set at SDR 46,666 per passenger.
Liability is however further limited for losses arising from acts of terrorism to the practically insurable amount. As of 2006, this amount is SDR 250,000 per passenger with an aggregate limit of SDR 340 million.
Subsequent to the ratification of this convention (by 35 states to date, covering 45.88% of the world’s fleet) the limitation amount has become more and more inadequate. A 1990 protocol increasing the limit to SDR 175,000 was not adopted (being ratified by only 6 minor states) and has been superseded by the 2002 protocol.
Through 28 July 2014 17 contracting states, including the European Union, representing 33.23% of world tonnage have acceded to the protocol.
Notwithstanding the above, the principle provisions of this protocol came into effect within the European Union and the European Economic Area via the EU Passenger Liability Regulation # 329/2009 on 31 December 2012.
INDUSTRY STATISTICS

MARINE P&I AJGINTERNATIONAL.COM ARTHUR J. GALLAGHER 84 MARINE P&I AJGINTERNATIONAL.COM ARTHUR J. GALLAGHER 85
8.1. LIMITS UNDER 2002 PROTOCOL TO PAL
Type of Loss Limit
Strict Liability Passenger Personal Injury / Death SDR 250,000 per passenger
Operator Negligence Passenger Personal Injury / Death SDR 400,000 per passenger
Loss or Damage to Cabin Luggage SDR 2,250 per passenger
Loss or Damage to Vehicle and Luggage therein SDR 12,700 per vehicle
Loss or damage to Other Luggage SDR 3,375 per passenger
9. INTERNATIONAL CONVENTION ON CIVIL LIABILITY FOR BUNKER OIL POLLUTION DAMAGE, (BUNKERS) 2001 (IN FORCE 21 NOV 2008)
The Bunker Convention reached its required criteria of 18 states’ ratification in November 2007, and by 28 July 2014 had 77 acceptances covering 90.52% of the world fleet.
The Convention covers pollution caused by spills of oil carried as fuel on board the vessel. The limits are the same as those imposed under LLMC 1976 as amended by the 1996 Protocol.
10. ILO MARITIME LABOUR CONVENTION (MLC) 2006 (IN FORCE 20 AUGUST 2013)
30 countries were required to ratify the Maritime Labour Convention for it to start the 12 month countdown to coming into force. On 20th August 2012 the 30th country signed up, being the Russian Federation. At 28 July 2014 there were 64 ratifications, although in some 16 of these jurisdictions the convention is not yet in force. In the majority of these 16 cases, “in force status” is expected within the next 12 months. In 2007 the European Union authorized its member states to ratify the Convention by the end of 2010, but in a number of EU states this process is still incomplete. Accordingly the MLC came into force in August 2013.
Most liabilities under the MLC fall under normal Club cover, but individual Clubs agreed to extend cover for crew repatriation costs in situations that had previously fallen outside Club cover – eg in the event of shipowner insolvency. This new risk is not currently poolable.
COMMERCIAL P&I MARKET REVIEW 2014
11. INTERNATIONAL CONVENTION ON LIABILITY AND COMPENSATION FOR DAMAGE IN CONNECTION WITH THE CARRIAGE OF HAZARDOUS AND NOXIOUS SUBSTANCES BY SEA (HNS), 1996 AND PROTOCOL, 2010 (NOT YET IN FORCE)
The original 1996 HNS Protocol established a two tier compensation regime for amounts up to SDR 250 million and has been ratified by 14 states or 13.61% of world fleet by 28 July 2014.
A Focus Group was established in 2007 in order to address administrative concerns of the ratifying states – particularly in respect of the operations of the 2nd tier of compensation, and the difficulty in establishing how much HNS was received in any country.
A revised 2010 protocol, based on the findings of the above focus group, was adopted in April 2010, but has not yet been ratified by any states, with 8 states signing the protocol “subject to ratification”.
Under this protocol the total compensation remains the same, but the shipowner’s maximum liability for an incident involving packaged HNS is increased from SDR 100 million to SDR 115 million. Thereafter compensation would be paid by a second tier HNS Fund, financed by cargo receivers. The shipowners liability for bulk HNS remains unchanged at SDR 100 million.
The revised protocol will enter force eighteen months after at least 12 States (including at least 4 with over 2 million GT) express their consent to be bound by it. Additional conditions relate to cargo receiving country contributions.
11.1. LIMITS OF LIABILITY UNDER HNS 1996
Vessel Size Formula – bulk HNS Formula – packaged HNS
2,000 GT or less Minimum SDR 10,000,000 Minimum SDR 11,500,000
2,001-50,000 GT Add SDR 1,500 per GT to the above Add SDR 1,725 per GT to the above
50,001 GT or more Add SDR 360 per GT to the above aggregate
Add SDR 414 per GT to the above aggregate
Maximum SDR 100 million SDR 115 million
Example
25,000 GT SDR 44,500,000 SDR 51,175,000
75,000 GT SDR 91,000,000 SDR 104,650,000
12. NAIROBI INTERNATIONAL CONVENTION ON THE REMOVAL OF WRECKS (NAIROBI WRC) 2007 (EXPECTED IN FORCE 14 APRIL 2015)
The Convention provides a sound legal basis for coastal states to remove, or have removed, from their coastlines, wrecks which pose a hazard to the safety of navigation or to the marine and coastal environments, or both. It will make shipowners financially liable and require them to take out insurance or provide other financial security to cover the costs of wreck removal. It will also provide states with a right of direct action against insurers.
The Convention has been adopted by 11 states representing 5.38% of the world fleet at 28 July 2014 and is expected to come into force in April 2015.
INDUSTRY STATISTICS

MARINE P&I AJGINTERNATIONAL.COM ARTHUR J. GALLAGHER 86 MARINE P&I AJGINTERNATIONAL.COM ARTHUR J. GALLAGHER 87
13. UN CONVENTION FOR THE INTERNATIONAL CARRIAGE OF GOODS WHOLLY OR PARTLY BY SEA (ROTTERDAM RULES) 2009 (NOT YET IN FORCE)
In 1996, in order to harmonise liability regimes, the United Nations Commission on International Trade Law (UNCITRAL) began a review of laws in the area of the international carriage of goods by sea. An additional aim was to update the regimes to reflect more modern transportation systems. This resulted in the “Rotterdam Rules” which became open for signature in September 2009 and will enter into force 12 months after 20 states have ratified it.
By 30 November 2012, 24 nations have signed the Rules, including major shipping nations such as Greece, Norway and the United States: collectively these signatories account for 25% of world trade. Noticeably none of the major Asian trading nations have signed the Rules.
The Convention will come into force one year after ratification by the 20th UN Member state. Whilst 25 have signed the Convention, only 3 states (Congo joining Spain and Togo this year) have yet ratified it at 28 July 2014. Although there remains widespread support for the Convention, the expectation remains that it may be some time before the Rules enter into force.
The Rotterdam Rules have eroded some of the traditional defences available to sea carriers, for example the elimination of the nautical fault defence. The obligation of due diligence has been extended to apply throughout the duration of the voyage, and limits of liability per package, or unit of weight, have been significantly increased, beyond Hague-Visby and Hamburg Rules limits.
The table below contrasts the liability under the various regimes:
13.1. CONTRASTING LIABILITY UNDER “RULES”
“Rule” Limitation of Liability Liability for Delay
Hague (1934) £ 100 per package/unit N/A
Hague Visby (1968) Higher of SDR 2 per kg or SDR 667 per package
N/A
Hamburg (1978) Higher of SDR 2.50 per kg or SDR 835 per package/ shipping unit
2.5 times freight on goods delayed subject to an upper limit if lost
Rotterdam (2009) Higher of SDR 3 per kg or SDR 875 per package/shipping unit
2.5 times freight on goods delayed not to exceed limit under rules
US COGSA (1936) USD 500 per package/unit N/A
COMMERCIAL P&I MARKET REVIEW 2014
MARINE DIVISION CONTACTS
5

MARINE P&I AJGINTERNATIONAL.COM ARTHUR J. GALLAGHER 88 MARINE P&I AJGINTERNATIONAL.COM ARTHUR J. GALLAGHER 89
COMMERCIAL P&I MARKET REVIEW 2014 MARINE DIVISION CONTACTS

MARINE P&I AJGINTERNATIONAL.COM ARTHUR J. GALLAGHER 90 MARINE P&I AJGINTERNATIONAL.COM ARTHUR J. GALLAGHER 91
Malcolm Godfrey Executive Director+44 (0)20 7204 [email protected]
Nicola Burnell Divisional Director+44 (0)20 7204 [email protected]
Nicola Ellis Divisional Director+44 (0)20 7204 [email protected]
Richard Sturgeon Divisional Director+44 (0)20 7204 [email protected]
Alex Vullo Associate Director+44 (0)20 7204 [email protected]
Matthew Cramp Account Executive+44 (0)20 7204 [email protected]
Wayne Godfrey Account Executive+44 (0)20 7204 [email protected]
Wendy Needham Account Executive+44 (0)20 7204 [email protected]
Lauren Osman Account Executive+44 (0)20 7204 [email protected]
Brian Webster Account Executive+44 (0)20 7560 [email protected]
Jonathan Suckling Managing Director+44 (0)20 7204 [email protected]
Malcolm Godfrey Executive Director+44 (0)20 7204 [email protected]
Andrew James Executive Director+44 (0)20 7204 [email protected]
Peter Wilmot Executive Director+44 (0)20 7204 [email protected]
Matthew Maccabe Executive Director+44 (0)20 7204 [email protected]
LONDON MARINE P&I
LONDON MARINE DIVISION Senior Management
COMMERCIAL P&I MARKET REVIEW 2014
Nicola Burnell Divisional Director+44 (0)20 7204 [email protected]
Nicola Ellis Divisional Director+44 (0)20 7204 [email protected]
John GloverDivisional Director+44 20 7204 [email protected]
Gemma Greenwood Divisional Director+44 (0)20 7234 [email protected]
Simon Mauduit Divisional Director+44 (0)20 7204 [email protected]
Mike Mctomney Divisional Director+44 (0)20 7560 [email protected]
Nick Paice Divisional Director+44 (0)20 7204 [email protected]
Malcolm Peckett Divisional Director+44 (0)20 7204 [email protected]
Richard Sturgeon Divisional Director+44 (0)20 7204 [email protected]
Tim Sullivan Divisional Director+44 (0)20 7204 [email protected]
Patrick Wilmot Divisional Director+44 (0)20 7560 [email protected]
Christopher KearnsExecutive Director+44 (0)20 7560 [email protected]
Gary Brand Associate Director+44 (0)20 7204 [email protected]
Mike Ingham Associate Director+44 (0)20 7204 [email protected]
Richard LockwoodAssociate Director+44 (0)20 7204 [email protected]
Jenny Mankelow Associate Director+44 (0)20 7204 [email protected]
David Meadway Associate Director+44 (0)20 7560 [email protected]
Anne Paige Associate Director+44 (0)20 7560 [email protected]
Richard PinkertonAssociate Director+44 (0)20 7560 [email protected]
Sophia Quentin Associate Director+44 (0)20 7560 [email protected]
Edward Remnant Associate Director+44 (0)20 7204 [email protected]
Alex Vullo Associate Director+44 (0)20 7204 [email protected]
David WallerAssociate Director+44 (0)20 7560 [email protected]
David Wescomb Associate Director+44 (0)20 7204 [email protected]
LONDON MARINE DIVISION Directors
LONDON MARINE DIVISION Broker / Account Executive / Technician
Angus BlayneyAccount Executive+44 (0)20 7204 [email protected]
Melanie BuitendagAccount Executive+44 (0)20 3425 [email protected]
Matthew CrampAccount Executive+44 (0)20 7204 [email protected]
Liera DoyleAccount Executive+44 (0)20 7204 [email protected]
Wayne GodfreyAccount Executive+44 (0)20 7204 [email protected]
Amanda GrayAccount Executive+44 (0)20 3425 [email protected]
Michael HutchinsAccount Executive+44 (0)20 3425 [email protected]
Richard LandersAccount Executive+44 (0)20 7204 [email protected]
Wendy NeedhamAccount Executive+44 (0)20 7204 [email protected]
Lauren Osman Account Executive+44 (0)20 7204 [email protected]
Isabel JamesAccount Executive+44 (0)20 7204 [email protected]
Clare StewartAccount Executive+44 (0)20 7560 [email protected]
Brian Webster Account Executive+44 (0)20 7560 [email protected]
Anneliese CampbellAccount Handler+44 (0)20 7560 [email protected]
Julie SmallpeiceTechnician+44 (0)20 7204 [email protected]
Haris LagiosGraduate+44 (0)20 7204 [email protected]
Michelle FieldPA to Jonathan Suckling+44 (0)20 7560 [email protected]
MARINE DIVISION CONTACTS

MARINE P&I AJGINTERNATIONAL.COM ARTHUR J. GALLAGHER 92
Arthur J. Gallagher
Walbrook OfficeThe Walbrook Building25 WalbrookLondonEC4N 8AW
Tel: +44 (0) 20 7204 6000Fax: +44 (0) 20 7204 6001
www.ajginternational.com
Arthur J. Gallagher (Specialty) is a trading name of Arthur J. Gallagher (UK) Limited which is authorised and regulated by the Financial Conduct Authority. Registered Office: The Walbrook Building, 25 Walbrook, London EC4N 8AW. Registered in England and Wales. Company Number: 1193013. www.ajginternational.com
The information contained in this market review has been compiled by Arthur J. Gallagher from information provided by each insurer. This review does not purport to be comprehensive or to give legal advice. While every effort has been made to ensure accuracy, Arthur J. Gallagher cannot be held liable for any errors, omissions or inaccuracies contained within the document. Readers should not act upon (or refrain from acting upon) information in this document without first taking further specialist or professional advice.