marine sector analysis report: non-tribal fishing
TRANSCRIPT

i
Marine Sector Analysis Report:
Non-Tribal Fishing
Revised Final Report | October 31, 2014
prepared for:
Washington Coastal Marine Advisory Council
prepared by:
Industrial Economics, Incorporated
2067 Massachusetts Avenue
Cambridge, MA 02140
617-354-0074
Sector Analysis Report – Fishing Prepared under Contract No. SC 14-327
NOTICE
The information presented in this report reflects data collected from readily
available sources and the opinions of a limited number of individuals
knowledgeable about this sector, including representatives of private business
interests. The views and opinions expressed herein are those of the individuals
consulted and are not necessarily representative of the views of any state agency
or of the perspectives of other experts or participants in the marine spatial
planning process, either within or outside the sector. Industrial Economics, Inc. is
solely responsible for the content of this report.
Sector Analysis Report – Fishing Prepared under Contract No. SC 14-327
TABLE OF CONTENTS
LIST OF ACRONYMS AND ABBREVIATIONS
PREFACE
Washington Marine Spatial Planning Overview 1
Sector Analysis Study Area 2
Scope of Economic Information Considered 5
Organization of the Report 5
INTRODUCTION TO THE NON-TRIBAL FISHING SECTOR
Sector Definition 6
History, Trends, and Opportunities 7
Summary of Key Issues 9
SECTOR STATUS
Commercial Fishing Sector 10
General Overview 10
Fishery Specific Information 16
Recreational Fishing Sector 33
General Overview 33
Fishery Specific Information 42
Existing Policies and Laws 49
Federal 50
State 50
Tribal 51
ISSUES FACING THE SECTOR
Barriers to Entry and Success 52
Limitations in Use of Space 52
Ocean Acidification 53
Oil Industry 54
Overfished Species 54
Potential for Concentration of Ownership 54
Regulatory Uncertainty 54
SECTION 1
SECTION 2
SECTION 3
Sector Analysis Report – Fishing Prepared under Contract No. SC 14-327
i
Salmon Production and Survivability 55
Laws and Regulations Limiting Catch 56
INVENTORY OF AVAILABLE DATA
Summary and Review of Existing Data Sources 57
Data Gaps and Key Economic Questions 68
Data Gaps 68
Key Economic Questions 68
REFERENCES
APPENDIX A: SUMMARY OF EXPERTS INTERVIEWED
APPENDIX B: COMMERCIAL FISHERIES – LANDINGS AND EX-VESSEL
VALUE DATA
APPENDIX C: RECREATIONAL FISHING SUB-SECTOR DATA TABLES
SECTION 4

Sector Analysis Report – Fishing Prepared under Contract No. SC 14-327
ii
LIST OF ACRONYMS AND ABBREVIATIONS
DFW Washington Department of Fish and Wildlife
DNR Washington Department of Natural Resources
EEZ Exclusive Economic Zone
EIS Environmental Impact Statement
ESA Endangered Species Act
FMP Fishery Management Plan
FWS US Fish and Wildlife Service
IFQ Individual Fishing Quota
IPHC International Pacific Halibut Commission
MSA Magnuson-Stevens Fishery Conservation and Management Act
MSP Marine Spatial Plan
NEPA National Environmental Policy Act
NMFS National Marine Fisheries Service
NOAA National Oceanic and Atmospheric Administration
PDO Pacific Decadal Oscillation
PFMC Pacific Fishery Management Council
PSMFC Pacific States Marine Fisheries Commission
RCW Revised Code of Washington
SAFE Stock Assessment and Fishery Evaluation Report
U&A Usual and Accustomed
WAC Washington Administrative Code
WCMAC Washington Coastal Marine Advisory Council
Sector Analysis Report – Fishing Prepared under Contract No. SC 14-327
1
PREFACE
The Washington Department of Ecology is leading an effort to develop a marine spatial
plan (MSP) for Washington’s Pacific coast. The plan is being developed in coordination
with an interagency team that includes the Office of the Governor, the Washington
Department of Natural Resources (DNR), the Washington Department of Fish and
Wildlife (DFW), Washington Sea Grant, and the Washington State Parks and Recreation
Commission.1
The planning process also involves and engages coastal stakeholders, the
public and local, tribal and federal governments. In particular, the Washington Coastal
Marine Advisory Council (WCMAC) is advising on the development of the plan. The
WCMAC is a 26-member advisory group established in the Governor’s office and
comprised of a diverse range of stakeholder interests. In support of this effort, DNR has
engaged Industrial Economics, Incorporated and BST Associates to develop reports on
five major sectors of the state’s marine economy: aquaculture; non-tribal fishing; marine
renewable energy; recreation and tourism; and shipping. These reports are intended to
help state agencies, the WCMAC, and other stakeholders understand the trends and
potential issues associated with economically important activity in the marine
environment.
This report focuses on the non-tribal fishing sector. It synthesizes information from
publicly available sources to provide an overview of current economic activity, major
trends in activity, and potential future resource uses and needs. In addition, the report
draws on perspectives and insights from industry experts and relevant government
agencies to highlight critical issues affecting the sector – including any current or
potential future conflicts within the sector or with other sectors – and the role of marine
spatial planning in addressing these issues (see Appendix A for a complete list of
individuals interviewed). It also identifies key remaining questions, data quality issues,
and data gaps.
WASHINGTON MARINE SPATIAL PLANNING OVERVIEW
Marine spatial planning is a public process of analyzing and allocating the spatial and
temporal distribution of human activities in marine environments to achieve ecological,
economic, and social objectives. The MSP will address issues resulting from increasing
pressures on the resources in the area, as well as conflicts between and among existing
1 For additional information on Washington’s marine spatial planning efforts, see RCW 43.372 and http://www.msp.wa.gov.
An interactive mapping tool is available at: www.msp.wa.gov/explore/mapping-application.
Sector Analysis Report – Fishing Prepared under Contract No. SC 14-327
2
and proposed new uses of these resources. The planning process will also involve and
engage coastal stakeholders, the general public, and local, tribal, and federal
governments. The MSP will develop a comprehensive plan for addressing these types of
potential activities to avoid and minimize impacts, reduce potential conflicts, and foster a
healthy ecosystem. In addition, the MSP provides a basis for improving coordination and
implementation of existing state and local laws, regulations and policies. It also provides
an opportunity to coordinate with federal agencies and tribes related to their authorities.
The law does not create any new authority under the MSP, nor does the MSP have
authority to affect any existing or proposed project, use, or activity during the
development of the plan (RCW 43.372.060). Instead, the MSP provides a consistent
information framework for agencies to use when applying their existing authorities in
response to particular project proposals and permit processes.
As part of the MSP planning process, the State Environmental Policy Act (SEPA)
requires the state to develop an Environmental Impact Statement (EIS); the SEPA
scoping summary was recently released (Ecology 2014). The EIS should be finalized
within the next year; the MSP is expected to be finalized by December 2016 (Ecology
2013).
SECTOR ANALYSIS STUDY AREA
The activities considered in this sector profile are those which occur or may in occur in
the future in marine or estuarine waters off the Washington Pacific coast. The area of
interest includes state and federal waters from Cape Disappointment north to Cape
Flattery and seaward to a depth of 700 fathoms, including Willapa Bay and Grays Harbor.
The marine shoreline bordering this area includes roughly 157 miles of Pacific coastline,
89 miles in Grays Harbor, and 129 miles in Willapa Bay (Ecology 2001). The study area
does not include the Strait of Juan de Fuca, the Lower Columbia River Estuary, or Puget
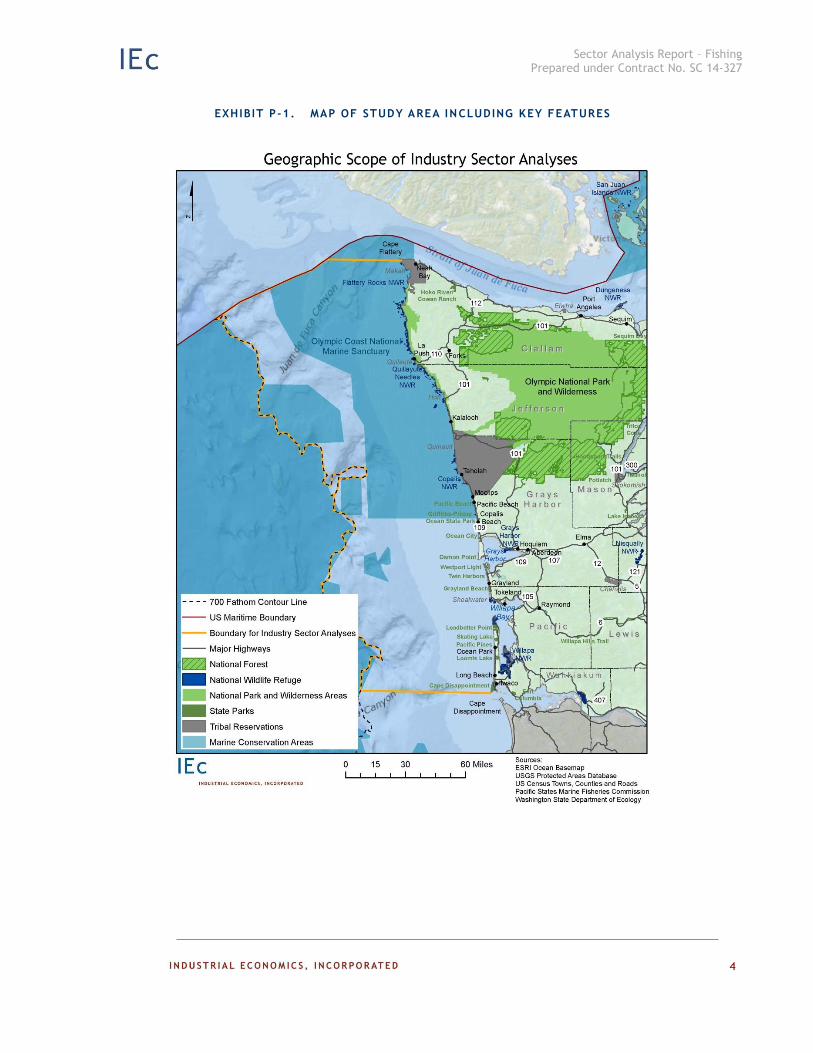
Sound. The study area is illustrated in Exhibit P-1.
The Washington Pacific coast is mostly rural, and is supported by an economy based on
tourism, recreation, and natural resources (e.g., commercial fisheries and timber). The
region includes four counties: Jefferson, Clallam, Grays Harbor, and Pacific. In 2013,
the total population of these counties was roughly 194,000, or three percent of the state
population (Census Quickfacts 2014). In recent years, population growth and economic
growth in these counties has been below the state average.
The Olympic Coast National Marine Sanctuary makes up most of the northern half of the
study area, running north from the mouth of the Copalis River along the coast and
extending seaward between 25 to 40 miles, including 2,408 square nautical miles of
marine waters (Olympia Coast National Marine Sanctuary 2014). Olympic National Park
occupies significant portions of the Clallam and Jefferson County coastlines. Other
marine conservation areas in the study area include various federally-designated Essential
Sector Analysis Report – Fishing Prepared under Contract No. SC 14-327
3
Fish Habitat areas. In addition, areas off the Washington coast are designated training
and testing areas for the U.S. Navy.2
The Makah, Quileute, Hoh, Quinault, and Shoalwater Bay Indian tribes have reservation
lands along the coast. Ocean resources are both economically and culturally important to
these tribes, as are the tourism and recreation benefits offered by their coastal locations.
2 The Naval Undersea Warfare Center Keyport Range Complex is located within the study area. For more information see
U.S. Navy 2014, www.nwtteis.com.
Sector Analysis Report – Fishing Prepared under Contract No. SC 14-327
4
EXHIBIT P-1. MAP OF STUDY AREA INCLUDING KEY FEATURES
Sector Analysis Report – Fishing Prepared under Contract No. SC 14-327
5
The southern portion of the coast is more heavily developed than the northern coast, with
a greater number of urbanized areas and a greater concentration of marine industry and
infrastructure. Developed areas in the southern half of the coast include the cities of
Hoquiam and Aberdeen and the Port of Grays Harbor, as well as the coastal towns of
Pacific Beach, Ocean Shores, Westport, Ocean Park, Seaview, Long Beach, and Ilwaco.
Numerous state park facilities are located along the southern half of the Washington
coast. In addition, Willapa Bay, located in the southern portion of the study area,
contains the Willapa Bay National Wildlife Refuge, and an economically important
oyster industry.
SCOPE OF ECONOMIC INFORMATION CONSIDERED
This report focuses on the ocean economy, considering economic activity within the state
that derives all or part of its inputs from the ocean (Colgan 2007). The report further
focuses on current activities or activities that may occur in the reasonably foreseeable
future. As a general guide we consider activities that are expected to occur within a
planning horizon of 20 years. This timeframe should be sufficient to guide long-term
planning, provided the MSP is periodically updated to take new information into account.
ORGANIZATION OF THE REPORT
The remainder of the report is organized as follows:
Section 1 provides an introduction to the sector.
Section 2 summarizes the current status of the sector.
Section 3 describes the key issues facing the sector.
Section 4 provides an inventory of the available economic data for the sector, and
highlights limitations of the existing data and data gaps.

Sector Analysis Report – Fishing Prepared under Contract No. SC 14-327
6
SECTION 1 | INTRODUCTION TO THE NON-TRIBAL FISHING
SECTOR
SECTOR DEFINITION
For the purposes of this report, we define the fishing sector to be the non-tribal
commercial and recreational fishing activity that is executed in Washington’s outer
coastal waters between Cape Flattery and Cape Disappointment, as well the distribution
and processing activities that support it. The scope of the analysis specifically excludes
the following significant components of Washington’s overall fishing industry:
Tribal fisheries;
Commercial and recreational fisheries occurring in the Columbia River estuary,
Strait of Juan de Fuca, Puget Sound, and all freshwater rivers, lakes and streams;
Fisheries outside the study area in which Washington-based vessels participate,
such as those in Alaska; and
Aquaculture.
Describing the diverse ranges of activities taking place under the umbrella description of
“Washington’s non-tribal fishing industry” and providing descriptive statistics at that
level presents a major challenge. While all fishing activity in the state exhibits certain
commonalities, there are many aspects of each segment of “the non-tribal fishing
industry” that make that segment unique and worthy of individual attention. At minimum,
it is necessary to differentiate between the commercial and recreational subsectors.
Within these sub-sectors, individual fisheries have their own unique history and face their
own unique challenges. While each of these fisheries could themselves be the subject of
a sector analysis, the scope of this report does not allow such an in-depth discussion.
Our profile of the non-tribal fishing sector on Washington’s outer coast begins with a
broad overview of the area’s commercial and recreational fisheries. We then provide
brief descriptions of individual fisheries within each sub-sector, including data on
participation, annual harvests, and other indicators of economic value. The specific
fisheries discussed in this report are listed in Exhibit 1-1.

Sector Analysis Report – Fishing Prepared under Contract No. SC 14-327
7
HISTORY, TRENDS AND OPPORTUNITIES
The state of Washington has long been home to a vibrant and diverse fishing industry.
The Native American tribes in the region have been fishing for salmon, groundfish and
shellfish for thousands of years, and European settlers have been fishing commercially in
the region since they arrived in the mid-1800s (Community Attributes, Inc. 2013).3
EXHIBIT 1-1. LIST OF NON-TRIBAL FISHERIES DESCRIBED IN THIS REPORT
COMMERCIAL RECREATIONAL
Salmon
Dungeness crab
Groundfish
Pink shrimp
Albacore tuna
Spot shrimp
Sardine
Anchovy
Hagfish
Razor clam
Razor clam
Dungeness crab
Albacore tuna
Bottomfish
Halibut
Salmon
A number of events have substantially influenced the trajectories of the commercial and
recreational fisheries in Washington, including federal court decisions associated with
tribal treaty fishing rights. In United States vs. Washington (1974), Judge George Hugo
Boldt held that Washington’s native American treaty tribes reserved the right to take up
to 50 percent of the harvestable salmon in their respective usual and accustomed (U&A)
fishing grounds (384 F. Supp. 312 (W.D. Wash. 1974)). This ruling was also the basis
for their co-management of the fishery with the state. Twenty years later, in subsequent
cases under United States vs. Washington (1994), Judge Edward Rafeedie held that the
treaty right extended to finfish other than salmon, and to shellfish, including oysters,
clams, and Dungeness crab (OCNMS IPC 2008). These rulings, by providing for treaty
fishing in a number of commercial fisheries, accordingly reduced the harvest share for
non-treaty fishery participants. The state/tribal management plans to implement these
decisions also include “special management areas,” which are closed to non-treaty
Dungeness crab fishing at the start of the season in order to allow treaty tribes’ fleets a
window to attempt harvest of 50 percent of the resource, for that interval concentrating
the non-treaty commercial fishing activity into the southern portion of the coast (Personal
comm. D. Beasley 2014, Personal comm. L. Thevik 2014, Personal comm. K. Krueger
2014, Personal comm. M. Culver 2014).
3 Other important species harvested by tribes include black cod, rockfish, and other groundfish (Personal comm. K. Krueger
2014).
Sector Analysis Report – Fishing Prepared under Contract No. SC 14-327
8
Another significantly influential event has been the decline in the salmon resource itself
due to many factors including, but not limited to, loss of in-river habitat. Restoration
projects are working to reverse that situation, nevertheless, over the past decades, there
has been a significant reduction in the number of salmon available for harvest by the
tribal and non-tribal commercial and recreational fisheries alike (Personal comm. M.
Cedergreen 2014, Personal comm. L. Thevik 2014, Personal comm. D. Beasley 2014,
Personal comm. K. Krueger 2014).
These factors and others have substantially changed the characteristics of Washington’s
commercial and recreational fisheries. The sizable fleet that developed to target salmon
up until the 1970s now operates at a fraction of its former capacity (Personal comm. L.
Thevik 2014). Where non-tribal Dungeness crab commercial fishermen had historically
been able to rely upon participation in one fishery to sustain them financially, fishermen
today must participate in three to four fisheries in order to survive, which is more typical
of participants in fisheries that depend upon resource availability (e.g., salmon, albacore
tuna, sardines) (Personal comm. M. Culver 2014, Personal comm. D. Beasley 2014). The
lucrative Dungeness crab fishery that historically was dominated by coastal residents has
seen an influx of vessels from Oregon, Alaska, and Seattle (Personal comm. L. Thevik
2014). On the recreational front, Washington’s charter fleet, which was developed
around the salmon resource, has contracted significantly, and by necessity targets a much
more diverse array of species (Personal comm. M. Cedergreen 2014). The tribal and non-
tribal fishery participants alike are affected by competition from out-of-state, and other
factors influencing wild fish populations, such as impacts on fish habitat (Personal comm.
K. Krueger 2014).
Another major change has been the near complete loss of Washington’s trawling fleet.
This loss was primarily due to the federal trawl buyback program, which bought out 92
permits along the West Coast, including five of Washington’s seven major trawlers
operating out of Bellingham, in 2005. This buyback was implemented through a loan
from the federal government, which the remaining trawlers are paying back through a
dedicated landing tax. This buyback was fully supported by the trawl industry via
referendum in recognition of the overcapacity of the fleet. The Pacific Fishery
Management Council (PFMC) worked with the trawl industry to develop a Strategic Plan
in 2000, which called for a fleet reduction of 50 percent; the buyback program was one of
the key steps to accomplishing this goal. While the full 50 percent target reduction was
not achieved, the buyback program reduced the total number permits to the current level
of 167.
Washington’s non-tribal fishing industry has proven itself to be highly adaptable to the
challenges it has faced in the last few decades. It continues to thrive as one of the most
productive and valuable fishing industries in the country. However, one industry expert
interviewed expressed concern that the industry has been pushed to its limits, and may
not be able to sustain additional restrictions, particularly those that would further limit the
geographic space in which they can operate (Personal comm. D. Beasley 2014).
Sector Analysis Report – Fishing Prepared under Contract No. SC 14-327
9
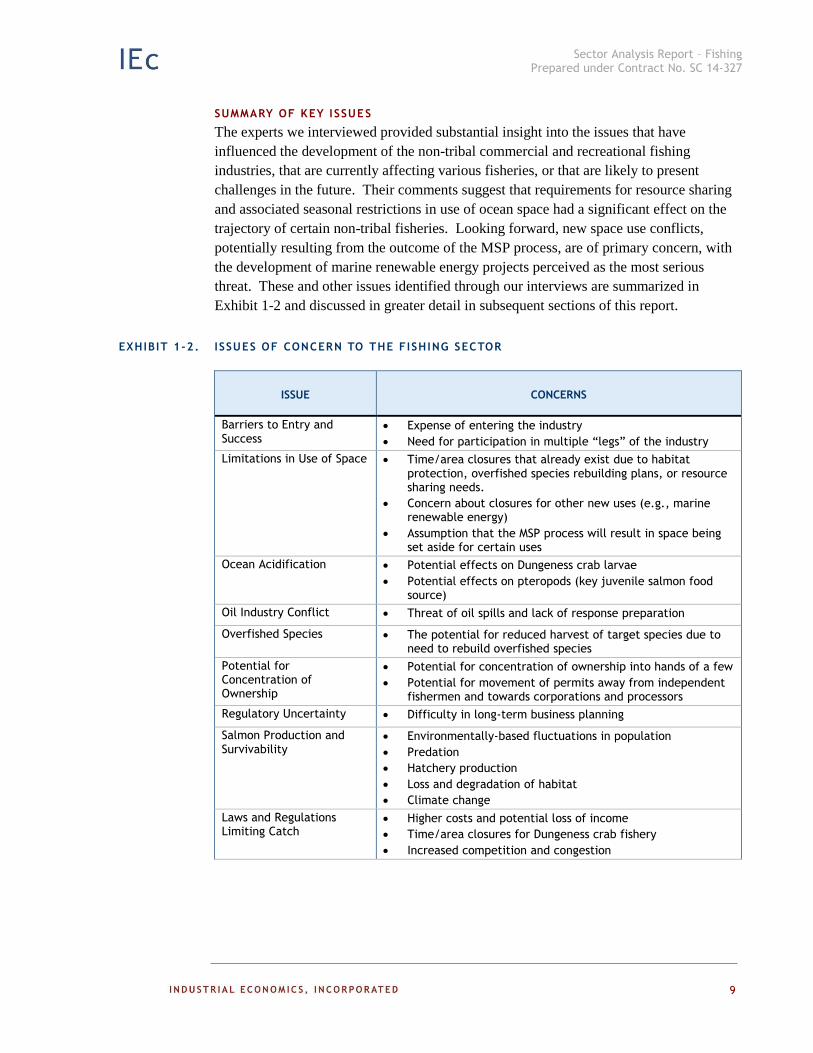
SUMMARY OF KEY ISSUES
The experts we interviewed provided substantial insight into the issues that have
influenced the development of the non-tribal commercial and recreational fishing
industries, that are currently affecting various fisheries, or that are likely to present
challenges in the future. Their comments suggest that requirements for resource sharing
and associated seasonal restrictions in use of ocean space had a significant effect on the
trajectory of certain non-tribal fisheries. Looking forward, new space use conflicts,
potentially resulting from the outcome of the MSP process, are of primary concern, with
the development of marine renewable energy projects perceived as the most serious
threat. These and other issues identified through our interviews are summarized in
Exhibit 1-2 and discussed in greater detail in subsequent sections of this report.
EXHIBIT 1-2. ISSUES OF CONCERN TO THE FISHING SECTOR
ISSUE CONCERNS
Barriers to Entry and Success
Expense of entering the industry
Need for participation in multiple “legs” of the industry
Limitations in Use of Space Time/area closures that already exist due to habitat protection, overfished species rebuilding plans, or resource sharing needs.
Concern about closures for other new uses (e.g., marine renewable energy)
Assumption that the MSP process will result in space being set aside for certain uses
Ocean Acidification Potential effects on Dungeness crab larvae
Potential effects on pteropods (key juvenile salmon food source)
Oil Industry Conflict Threat of oil spills and lack of response preparation
Overfished Species The potential for reduced harvest of target species due to need to rebuild overfished species
Potential for Concentration of Ownership
Potential for concentration of ownership into hands of a few
Potential for movement of permits away from independent fishermen and towards corporations and processors
Regulatory Uncertainty Difficulty in long-term business planning
Salmon Production and Survivability
Environmentally-based fluctuations in population
Predation
Hatchery production
Loss and degradation of habitat
Climate change
Laws and Regulations Limiting Catch
Higher costs and potential loss of income
Time/area closures for Dungeness crab fishery
Increased competition and congestion
Sector Analysis Report – Fishing Prepared under Contract No. SC 14-327
10
SECTION 2 | SECTOR STATUS
Describing the diverse range of activities taking place under the umbrella description of
“Washington’s non-tribal fishing industry” and providing descriptive statistics at that
level presents a unique challenge. While all fishing activity in the state exhibits certain
commonalities, there are many aspects of each segment of “the non-tribal fishing
industry” that makes it unique and worthy of individual attention. At minimum, it is
necessary to differentiate between the commercial and recreational sub-sectors. Beyond
that, individual segments of these industries that target different species are in themselves
subject to their own unique history, trends, economic characteristics, and challenges.
While each of these sub-sectors and fisheries could themselves be the subject of a sector
analysis, the scope of this report does not allow for an extensive discussion of each
component.
The following discussion addresses commercial and recreational fishing in turn. In each
case, we begin with a general overview that provides a sense of the scope and scale of the
sub-sector, presenting available information on participation and overall economic
impacts.4 This discussion is followed by brief descriptions of individual fisheries within
each sub-sector, including data on participation, annual harvests, and other indicators of
economic value.
COMMERCIAL FISHING SECTOR
GENERAL OVERVIEW
The Washington commercial fishing industry, inclusive of aquaculture production and
tribal fisheries, is one of the most productive and valuable in the U.S. According to the
annual NOAA Report, “Fisheries of the United States, 2012,” Washington ranked fourth
in landed pounds (420.1 million) in 2012, and fifth in value of landings ($302.0 million)
(NMFS 2013a). These figures represent four percent of the total landings and six percent
of the total value of all U.S. commercial fisheries.
The ports of Westport and Ilwaco/Chinook, both located within our study area, rank
among the most important commercial fishing ports in the country. Westport was ranked
13th by landed weight in 2012 (133 million pounds) and 16
th by landed value ($59
4 Note that this summary focuses on the most recently-available relevant data. Other potential data sources not described in
detail in this section are listed in Exhibit 4-1.

Sector Analysis Report – Fishing Prepared under Contract No. SC 14-327
11
million). Ilwaco/Chinook was ranked 30th by landed weight (29 million pounds) and 50
th
by landed value ($22 million) (NMFS 2013a).5
Washington ranked below California and Oregon in 2012 in commercial fishing landings
by weight, but above these states in landings by value (NMFS 2013a). Its most valuable
harvested species included Dungeness crab ($59,485,000), albacore tuna ($28,440,000),
and salmon (multiple species) ($28,398,000) (NMFS 2013b).
Commercial landings at ports within our study area (i.e., from Neah Bay to the mouth of
the Columbia River) account for a substantial share of landings statewide: 83 percent of
landings by weight and 63 percent of landings by value (DFW 2008). The value of
landings at ports in Grays Harbor County (including Aberdeen, Bay City, and Westport)
is the highest in the state ($19,262,100 in 2006), accounting for approximately 30 percent
of ex-vessel revenues statewide (DFW 2008).
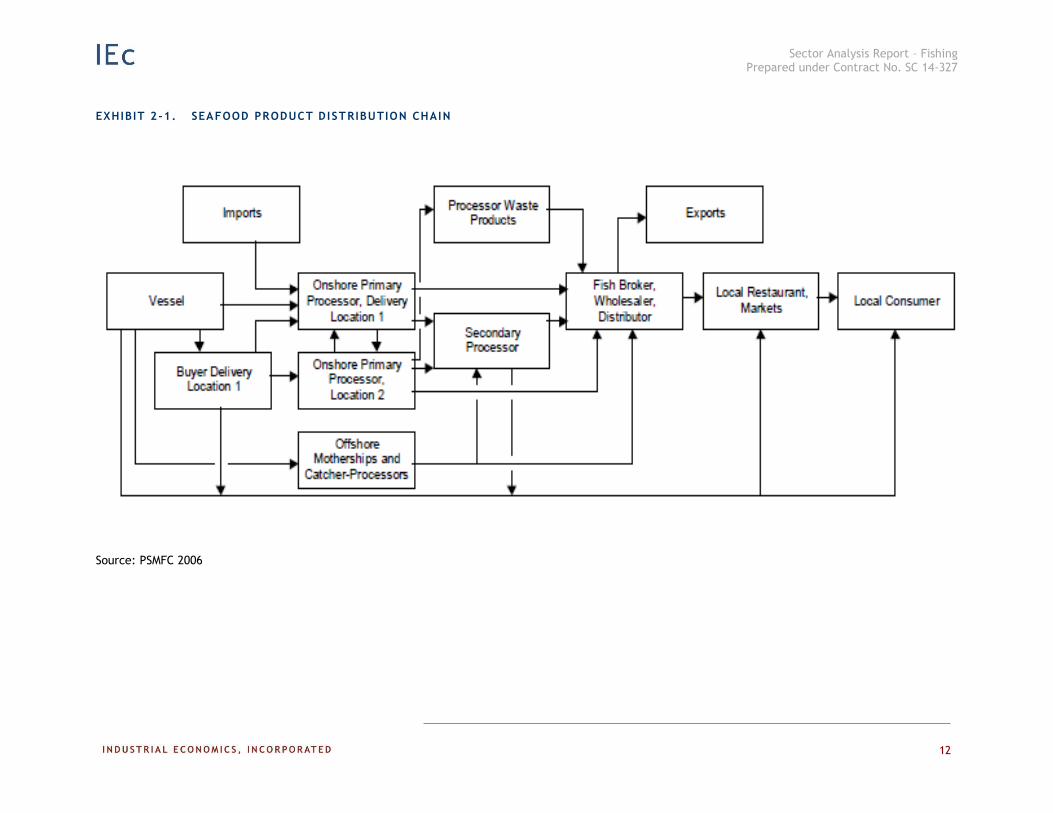
Exhibit 2-1 shows the general flow of seafood from harvest to consumer. The majority of
the harvest landed in Washington is delivered to one of the many onshore processors
located within the state; in 2006, there were 104 seafood processing facilities based on
the Washington coast (TRG 2008). A share of the commercial Pacific whiting (aka
Pacific hake) catch, however, is processed at sea. In addition, onshore processing
capacity has seen some consolidation in recent years. As a result, the port at which the
harvest is landed does not necessarily realize the economic benefits of related processing
activity (DFW 2008). At the same time, some crab landed in California and Oregon is
transferred to Washington processing facilities, helping to maintain Washington shoreside
processing infrastructure (Personal comm. D. Beasley 2014).
According to a 2006 report published by the Pacific States Marine Fisheries Commission
(PSMFC), the majority of processing companies on the U.S. west coast depend upon
multiple species and markets. In addition, there has been a trend towards multi-species
dependency for high volume processors (PSMFC 2006). Factors that have affected the
fish processing industry since the early 1990s include:
Infrastructure issues related to whether water or byproduct use in the processing
process will overwhelm existing infrastructure;
A decline in wholesale prices for seafood;
Major expansion of the onshore Pacific whiting fishery;
Horizontal integration of processors and consolidation of processing plants in
fewer locations;
Vertical integration into distribution and harvesting operations; and
Return of small processors to offering specialty products in niche markets.
5 The port of Shelton, WA is also included within the top 50 ports by landed value; however, this is due to the harvest of
aquaculture products. Information on the aquaculture sector is presented in a separate report, and thus is not included in
this discussion.
Sector Analysis Report – Fishing Prepared under Contract No. SC 14-327
12
EXHIBIT 2 -1. SEAFOOD PRODUCT DISTRIBUTION CHAIN
Source: PSMFC 2006
Sector Analysis Report – Fishing Prepared under Contract No. SC 14-327
13
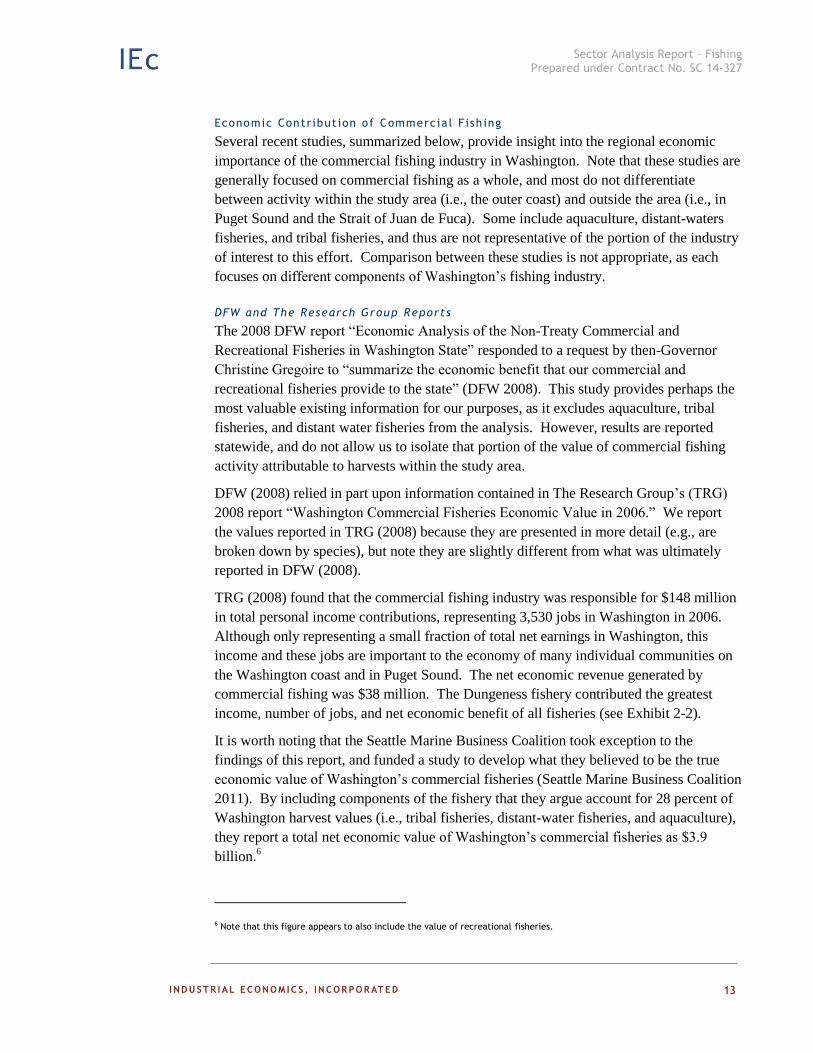
Economic Contr ibut ion of Commerc ia l F ish ing
Several recent studies, summarized below, provide insight into the regional economic
importance of the commercial fishing industry in Washington. Note that these studies are
generally focused on commercial fishing as a whole, and most do not differentiate
between activity within the study area (i.e., the outer coast) and outside the area (i.e., in
Puget Sound and the Strait of Juan de Fuca). Some include aquaculture, distant-waters
fisheries, and tribal fisheries, and thus are not representative of the portion of the industry
of interest to this effort. Comparison between these studies is not appropriate, as each
focuses on different components of Washington’s fishing industry.
DFW and The Research Group Reports
The 2008 DFW report “Economic Analysis of the Non-Treaty Commercial and
Recreational Fisheries in Washington State” responded to a request by then-Governor
Christine Gregoire to “summarize the economic benefit that our commercial and
recreational fisheries provide to the state” (DFW 2008). This study provides perhaps the
most valuable existing information for our purposes, as it excludes aquaculture, tribal
fisheries, and distant water fisheries from the analysis. However, results are reported
statewide, and do not allow us to isolate that portion of the value of commercial fishing
activity attributable to harvests within the study area.
DFW (2008) relied in part upon information contained in The Research Group’s (TRG)
2008 report “Washington Commercial Fisheries Economic Value in 2006.” We report
the values reported in TRG (2008) because they are presented in more detail (e.g., are
broken down by species), but note they are slightly different from what was ultimately
reported in DFW (2008).
TRG (2008) found that the commercial fishing industry was responsible for $148 million
in total personal income contributions, representing 3,530 jobs in Washington in 2006.
Although only representing a small fraction of total net earnings in Washington, this
income and these jobs are important to the economy of many individual communities on
the Washington coast and in Puget Sound. The net economic revenue generated by
commercial fishing was $38 million. The Dungeness fishery contributed the greatest
income, number of jobs, and net economic benefit of all fisheries (see Exhibit 2-2).
It is worth noting that the Seattle Marine Business Coalition took exception to the
findings of this report, and funded a study to develop what they believed to be the true
economic value of Washington’s commercial fisheries (Seattle Marine Business Coalition
2011). By including components of the fishery that they argue account for 28 percent of
Washington harvest values (i.e., tribal fisheries, distant-water fisheries, and aquaculture),
they report a total net economic value of Washington’s commercial fisheries as $3.9
billion.6
6 Note that this figure appears to also include the value of recreational fisheries.

Sector Analysis Report – Fishing Prepared under Contract No. SC 14-327
14
EXHIBIT 2 -2. NET ECONOMIC VALUES AND ECONOMIC EFFECTS GENERATED BY WASHINGTON’S COMMERCIAL FISHERIES IN 2006
FISHERY
REVENUE
(THOUSANDS OF $2006)
REGIONAL ECONOMIC IMPACT (PERSONAL INCOME)
NET
ECONOMIC
VALUE
(THOUSANDS
OF $2006)
(THOUSANDS OF $2006)
SHARE
(THOUSANDS)
EX-VESSEL EX-PROCESSOR HARVESTER PROCESSOR TOTAL JOBS
Groundfish $6,425 $8,858 $8,874 $3,029 $11,903 8% 0.283 $3,103
P. Whiting $3,274 $12,296 $4,857 $12,271 $17,128 12% 0.408 $4,978
Salmon $9,554 $16,624 $12,370 $8,935 $21,305 14% 0.507 $7,091
Crab $29,607 $41,612 $41,721 $15,377 $57,098 39% 1.359 $11,596
Shrimp $1,592 $2,953 $2,252 $1,509 $3,761 3% 0.090 $881
Pelagic $509 $3,577 $735 $3,946 $4,681 3% 0.111 $1,914
Migratory $3,792 $6,772 $4,351 $3,762 $8,112 5% 0.193 $2,142
Halibut $422 $497 $587 $89 $676 0.5% 0.016 $201
Shellfish $8,209 $5,183 $10,082 $9,132 $19,214 13% 0.457 $5,038
Other $2,134 $2,838 $2,901 $1,492 $4,393 3% 0.105 $1,138
Total $65,517 $101,210 $88,729 $59,543 $148,272 100% 3.530 $38,082
Source: Recreated from TRG (2008), Table 4 Notes:
1. Based on commercial landings at Washington ports except for those in the following fisheries: tribal commercial and C&S fisheries, aquaculture, West Coast offshore fisheries, fishing grounds southerly of an extension of the Washington-Oregon land border, harvests returned from Alaska, and other distant water fisheries.
2. Ex-vessel revenues are what harvesters receive when selling their retained catch. Ex-processor revenue is the wholesale value of seafood products.
3. Regional economic impact (REI) is measured as total personal income. It includes the "multiplier" effects. It is a measurement for the state level economy.
4. Jobs are full-time and part-time employment using BEA estimates for wage and salary, and proprietorship earnings in 2006 for the State.
5. Net economic value (NEV) is the prorated profitability of vessels and processors active in the included fisheries. It does not include an accounting of social costs to sustain the fisheries. It is a measurement at the fishing industry level.

Sector Analysis Report – Fishing Prepared under Contract No. SC 14-327
15
Community Attr ibutes , Inc. Report
In 2013, Community Attributes, Inc. published a study for the Economic Development
Council of Seattle and King County and the Workforce Development Council of Seattle-
King County investigating the economic impacts of the sectors that comprise
Washington’s maritime industry cluster, including Fishing and Seafood Processing
(Community Attributes, Inc. 2013). Measures provided include direct impacts (gross
business income and employment), indirect/induced impacts (employment and
induced/indirect revenues/output), and wages. The results of the analysis are not directly
applicable to the present analysis, as it includes tribal fishing, recreational fishing,
aquaculture/fish farming, and distant-waters fisheries. However, it could provide useful
context for ultimately understanding the overall contribution of coastal non-tribal
fisheries to the state’s commercial fishing industry as a whole.
The analysis identified 720 establishments providing covered employment in the fishing
and seafood processing sector, and found a trend toward consolidation of businesses.
However, it also identified steady and even growing employment in the sector, with
approximately 11,000 jobs provided in 2011 (not including self-employed individuals
such as many fishermen (4,541 jobs)). Exhibit 2-3 describes the number of jobs that are
supported by various sub-sectors of the Fishing and Seafood Processing sector. The
study calculated a total jobs multiplier for this sector as 3.0, meaning that for every job in
the sector, an additional two jobs are supported by fish and seafood processing activities.
Total wages generated by this sector were $1.1 billion. Gross business revenues were
estimated as $8.6 billion, and the sector contributed an estimated $135.7 million in tax
revenues to the state.
EXHIBIT 2-3. FISHING AND SEAFOOD PROCESSING JOBS, 2011
Source: Community Attributes, Inc. (2013)

Sector Analysis Report – Fishing Prepared under Contract No. SC 14-327
16
Fisher ies of the United States , 2012
The 2013 NOAA report “Fisheries of the United States, 2012” reports that Washington’s
seafood industry was responsible for 60,955 jobs, $7.5 billion in sales impacts, and $2.0
billion in personal income, and contributed $3.0 billion in value added to the economy
(NMFS 2013a) (see Exhibit 2-4). These figures are not, however, strictly representative
of the segment of the fishing industry of interest to this report, as they include tribal
fisheries, aquaculture, and distant waters fisheries, and are inclusive of all state waters.
EXHIBIT 2-4. ECONOMIC IMPACTS OF THE PACIFIC REGION SEAFOOD INDUSTRY (THOUSANDS OF
DOLLARS)
STATE
LANDINGS
REVENUE JOBS SALES INCOME VALUE ADDED
California $231,683 145,433 $24,043,813 $5,172,755 $8,582,461
Oregon $128,030 16,051 $1,174,111 $385,350 $550,045
Washington $275,585 60,955 $7,533,447 $2,002,804 $3,055,370
Source: Recreated from NMFS (2013a).
FISHERY SPECIF IC INFORMATION
The marine waters off the Pacific coast of Washington support at least ten important
commercial fisheries. For each fishery, we briefly describe the range of activities
occurring in that fishery, and provide descriptive statistics to characterize the fishery,
including landings and ex-vessel revenues over the last ten years. The landings and ex-
vessel values provided in the exhibits reflect harvest from Pacific Ocean waters, Grays
Harbor, and Willapa Bay. All ex-vessel values presented in the exhibits have been
converted to 2014 dollars using the GDP implicit price deflator. Appendix B includes the
raw data tables that serve as the basis for these exhibits. All data were provided by DFW
in June and August, 2014.
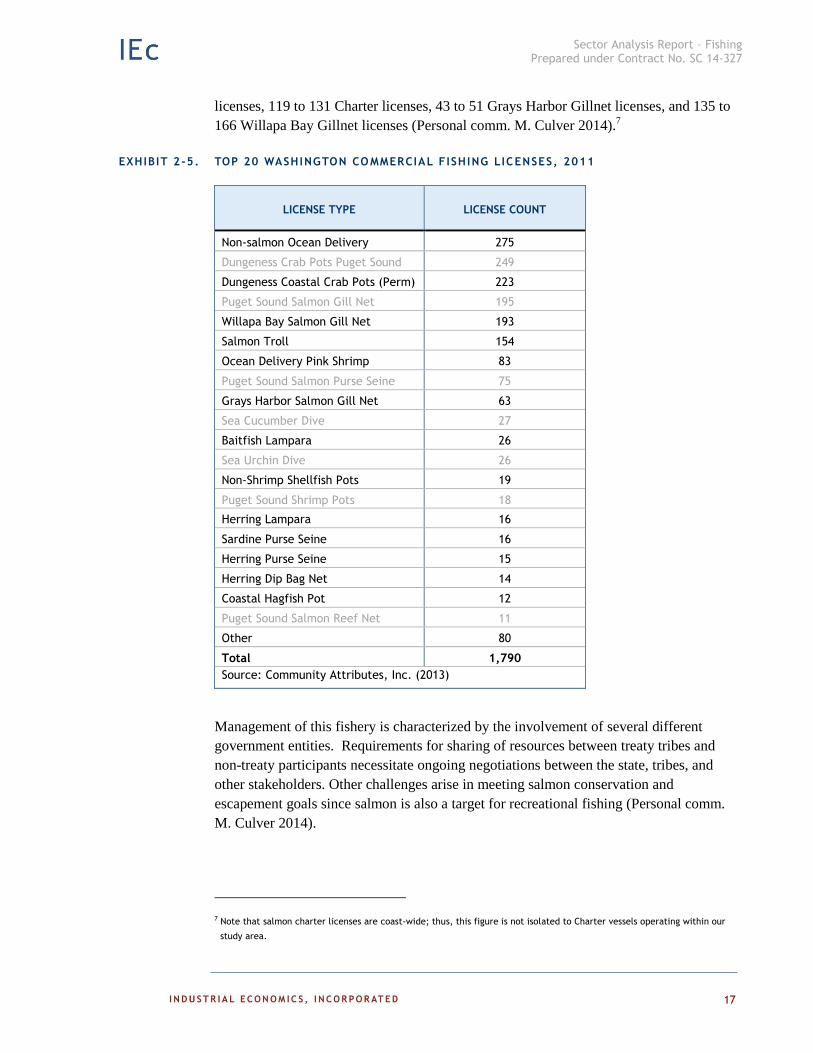
Exhibit 2-5 lists the commercial fisheries with the highest participation, by licenses
issued in 2011, providing a sense of overall activity in each fishery. Note that the data
reported for these license categories are state-wide and that the categories are not limited
to fisheries operating in our study area. We have denoted in grey license categories for
fisheries that operate entirely outside the study area.
Salmon
The commercial salmon fishery within our study area operates in both the ocean and
coastal estuaries (i.e., Willapa Bay and Grays Harbor). There are three methods used for
the commercial harvest of salmon, each with its own license category: ocean trolling,
charter, and gillnet licenses. Although none of the commercial salmon fisheries are
technically limited entry, there is a moratorium on new licenses, and the total licenses
available each year is capped at the number of licenses issued the previous year. An
individual needs an estuary-specific permit to gillnet for salmon in Grays Harbor and/or
Willapa Bay. Ownership of either permit allows one to gillnet for salmon in the
Columbia River. The number issued each year ranges from 120 to 131 Ocean trolling
Sector Analysis Report – Fishing Prepared under Contract No. SC 14-327
17
licenses, 119 to 131 Charter licenses, 43 to 51 Grays Harbor Gillnet licenses, and 135 to
166 Willapa Bay Gillnet licenses (Personal comm. M. Culver 2014).7
EXHIBIT 2-5. TOP 20 WASHINGTON CO MMERCIAL FISHING LICENSES, 2011
LICENSE TYPE LICENSE COUNT
Non-salmon Ocean Delivery 275
Dungeness Crab Pots Puget Sound 249
Dungeness Coastal Crab Pots (Perm) 223
Puget Sound Salmon Gill Net 195
Willapa Bay Salmon Gill Net 193
Salmon Troll 154
Ocean Delivery Pink Shrimp 83
Puget Sound Salmon Purse Seine 75
Grays Harbor Salmon Gill Net 63
Sea Cucumber Dive 27
Baitfish Lampara 26
Sea Urchin Dive 26
Non-Shrimp Shellfish Pots 19
Puget Sound Shrimp Pots 18
Herring Lampara 16
Sardine Purse Seine 16
Herring Purse Seine 15
Herring Dip Bag Net 14
Coastal Hagfish Pot 12
Puget Sound Salmon Reef Net 11
Other 80
Total 1,790
Source: Community Attributes, Inc. (2013)
Management of this fishery is characterized by the involvement of several different
government entities. Requirements for sharing of resources between treaty tribes and
non-treaty participants necessitate ongoing negotiations between the state, tribes, and
other stakeholders. Other challenges arise in meeting salmon conservation and
escapement goals since salmon is also a target for recreational fishing (Personal comm.
M. Culver 2014).
7 Note that salmon charter licenses are coast-wide; thus, this figure is not isolated to Charter vessels operating within our
study area.
Sector Analysis Report – Fishing Prepared under Contract No. SC 14-327
18
The non-tribal commercial salmon fleet was historically quite large, but retracted
substantially for several reasons. First, following the Boldt decision, non-treaty fishers’
allocation of the resource was limited to 50 percent of the harvestable resource. Second,
there was a decline in the salmon resource itself as a result of numerous factors including
a loss and deterioration of habitat and access to ocean fisheries by other nations. The
non-tribal commercial fishery today is comprised of trolling vessels, primarily targeting
Chinook and coho salmon. Primary landing ports for this fishery are Westport and
Ilwaco. Fish harvested in this fishery are typically sold fresh or frozen, rather than being
processed and canned (Personal comm. L. Thevik 2014, Personal comm. K. Krueger
2014).
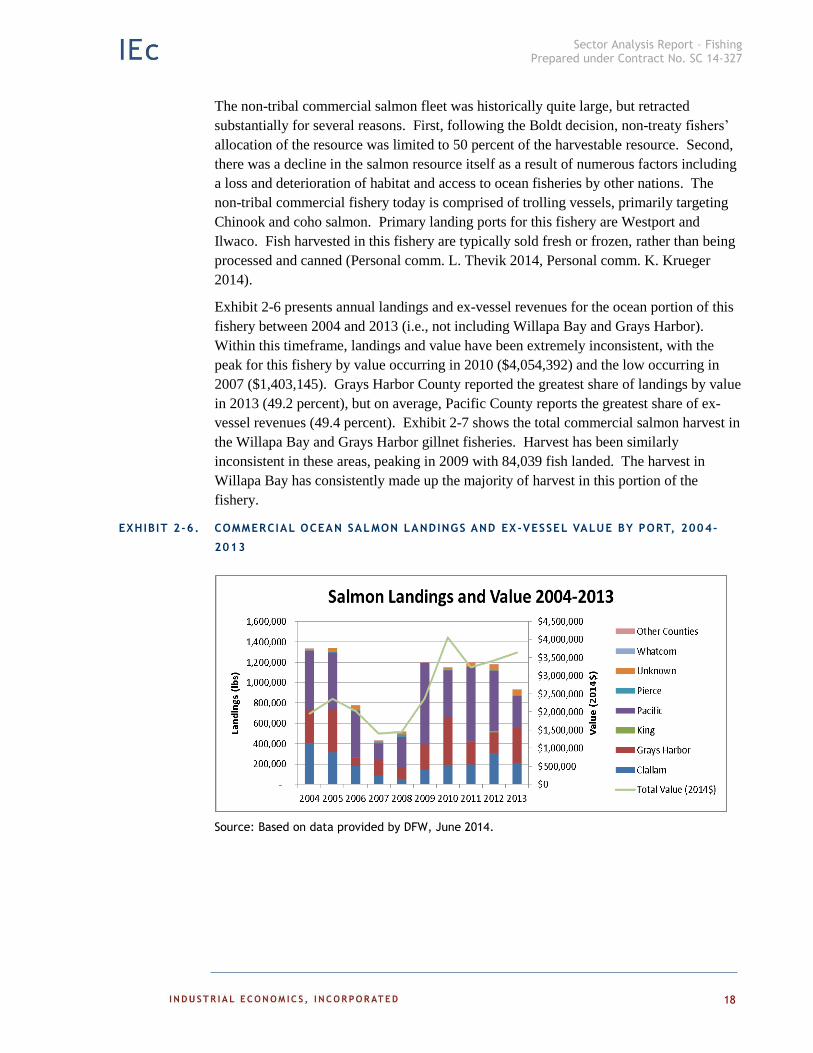
Exhibit 2-6 presents annual landings and ex-vessel revenues for the ocean portion of this
fishery between 2004 and 2013 (i.e., not including Willapa Bay and Grays Harbor).
Within this timeframe, landings and value have been extremely inconsistent, with the
peak for this fishery by value occurring in 2010 ($4,054,392) and the low occurring in
2007 ($1,403,145). Grays Harbor County reported the greatest share of landings by value
in 2013 (49.2 percent), but on average, Pacific County reports the greatest share of ex-
vessel revenues (49.4 percent). Exhibit 2-7 shows the total commercial salmon harvest in
the Willapa Bay and Grays Harbor gillnet fisheries. Harvest has been similarly
inconsistent in these areas, peaking in 2009 with 84,039 fish landed. The harvest in
Willapa Bay has consistently made up the majority of harvest in this portion of the
fishery.
EXHIBIT 2-6. COMMERCIAL OCEAN SALMON LANDINGS AND EX-VESSEL VALUE BY PORT, 2004-
2013
Source: Based on data provided by DFW, June 2014.

Sector Analysis Report – Fishing Prepared under Contract No. SC 14-327
19
EXHIBIT 2-7. COMMERCIAL COASTAL ESTUARY GILLNET SALMON LANDINGS BY HARVEST AREA,
2003-2013
Source: Based on data contained within PFMC 2014
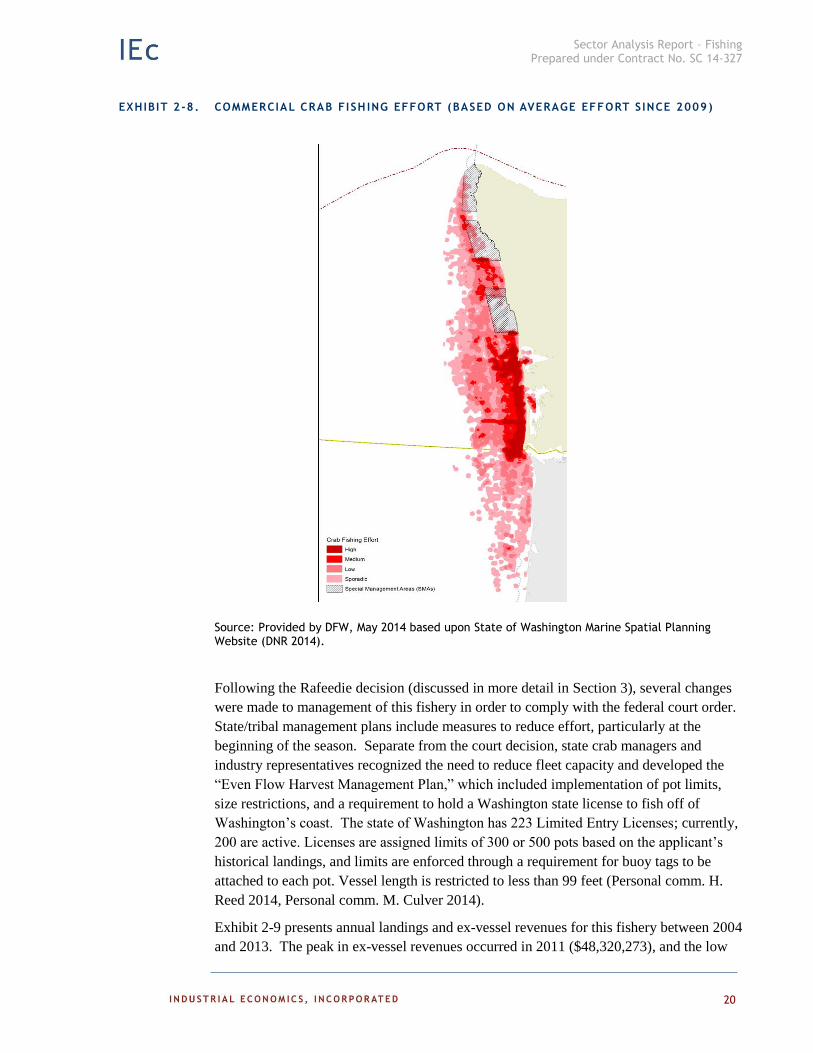
Dungeness Crab
The commercial Dungeness crab fishery is a pot and buoy fishery that operates from 5 to
60 fathoms along the Washington coast. Exhibit 2-8 identifies the relative level of effort
for specific locations along the coast. The nine-month season runs from December
through September 15 annually. Typically a majority of the catch is taken within the first
two months of the season. The key ports for this fishery are Westport in Grays Harbor
and Ilwaco/Chinook on the Columbia River. Minor ports to the north include Neah Bay
and La Push (Personal comm. H. Reed 2014). A small number of vessels (between 20
and 30) also operate within Willapa Bay. Primary processing facilities for this fishery are
located in Westport and Ilwaco Chinook. Catch landed in Neah Bay and La Push are
bought by buyers who typically bring the product to other locations (e.g., Port Angeles)
for processing (Personal comm. L. Thevik 2014).
-
10,000
20,000
30,000
40,000
50,000
60,000
70,000
80,000
90,000
2003 2004 2005 2006 2007 2008 2009 2010 2011 2012 2013
Har
vest
(N
um
be
r o
f Fi
sh)
Commercial Gillnet Salmon Harvest 2003-2013
Grays Harbor Willapa Bay
Sector Analysis Report – Fishing Prepared under Contract No. SC 14-327
20
EXHIBIT 2-8. COMMERCIAL CRAB FISH ING EFFORT (BASED ON AVERAGE EFFORT S INCE 2009)
Source: Provided by DFW, May 2014 based upon State of Washington Marine Spatial Planning Website (DNR 2014).
Following the Rafeedie decision (discussed in more detail in Section 3), several changes
were made to management of this fishery in order to comply with the federal court order.
State/tribal management plans include measures to reduce effort, particularly at the
beginning of the season. Separate from the court decision, state crab managers and
industry representatives recognized the need to reduce fleet capacity and developed the
“Even Flow Harvest Management Plan,” which included implementation of pot limits,
size restrictions, and a requirement to hold a Washington state license to fish off of
Washington’s coast. The state of Washington has 223 Limited Entry Licenses; currently,
200 are active. Licenses are assigned limits of 300 or 500 pots based on the applicant’s
historical landings, and limits are enforced through a requirement for buoy tags to be
attached to each pot. Vessel length is restricted to less than 99 feet (Personal comm. H.
Reed 2014, Personal comm. M. Culver 2014).
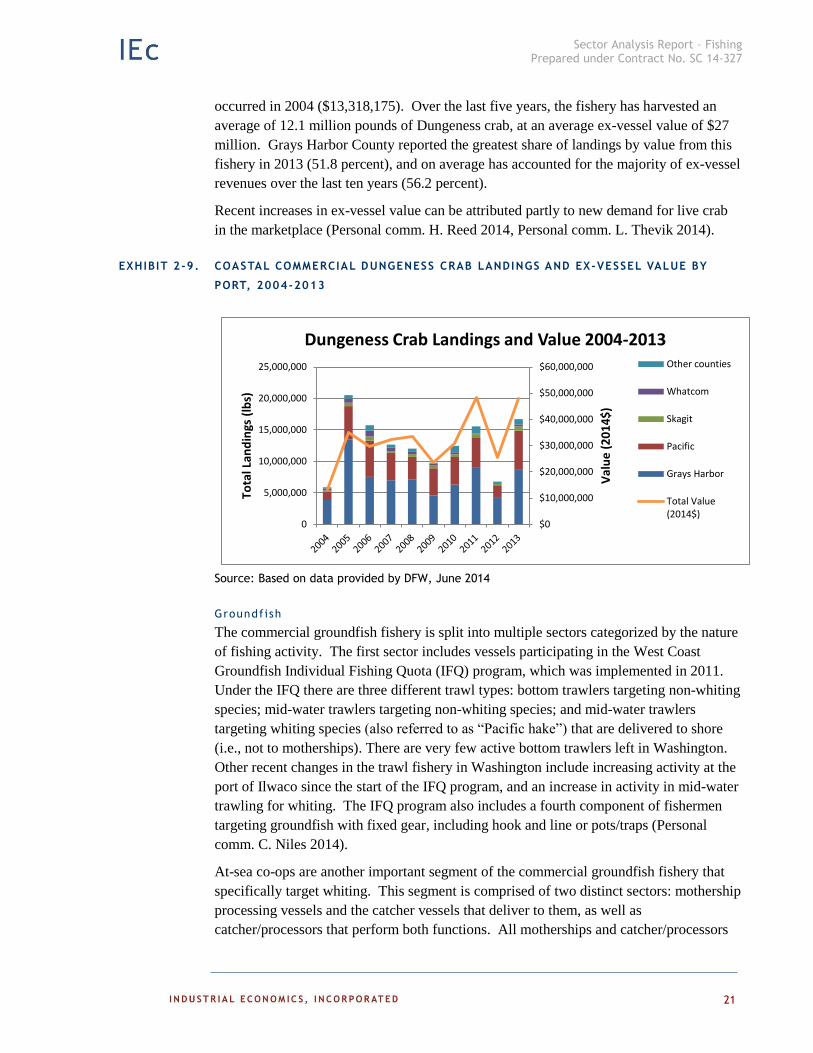
Exhibit 2-9 presents annual landings and ex-vessel revenues for this fishery between 2004
and 2013. The peak in ex-vessel revenues occurred in 2011 ($48,320,273), and the low
Sector Analysis Report – Fishing Prepared under Contract No. SC 14-327
21
occurred in 2004 ($13,318,175). Over the last five years, the fishery has harvested an
average of 12.1 million pounds of Dungeness crab, at an average ex-vessel value of $27
million. Grays Harbor County reported the greatest share of landings by value from this
fishery in 2013 (51.8 percent), and on average has accounted for the majority of ex-vessel
revenues over the last ten years (56.2 percent).
Recent increases in ex-vessel value can be attributed partly to new demand for live crab
in the marketplace (Personal comm. H. Reed 2014, Personal comm. L. Thevik 2014).
EXHIBIT 2-9. COASTAL COMMERCIAL DUNGENESS CRAB LANDINGS AND EX-VESSEL VALUE BY
PORT, 2004-2013
Source: Based on data provided by DFW, June 2014
Groundfish
The commercial groundfish fishery is split into multiple sectors categorized by the nature
of fishing activity. The first sector includes vessels participating in the West Coast
Groundfish Individual Fishing Quota (IFQ) program, which was implemented in 2011.
Under the IFQ there are three different trawl types: bottom trawlers targeting non-whiting
species; mid-water trawlers targeting non-whiting species; and mid-water trawlers
targeting whiting species (also referred to as “Pacific hake”) that are delivered to shore
(i.e., not to motherships). There are very few active bottom trawlers left in Washington.
Other recent changes in the trawl fishery in Washington include increasing activity at the
port of Ilwaco since the start of the IFQ program, and an increase in activity in mid-water
trawling for whiting. The IFQ program also includes a fourth component of fishermen
targeting groundfish with fixed gear, including hook and line or pots/traps (Personal
comm. C. Niles 2014).
At-sea co-ops are another important segment of the commercial groundfish fishery that
specifically target whiting. This segment is comprised of two distinct sectors: mothership
processing vessels and the catcher vessels that deliver to them, as well as
catcher/processors that perform both functions. All motherships and catcher/processors
$0
$10,000,000
$20,000,000
$30,000,000
$40,000,000
$50,000,000
$60,000,000
0
5,000,000
10,000,000
15,000,000
20,000,000
25,000,000
Val
ue
(2
01
4$
)
Tota
l Lan
din
gs (
lbs)
Dungeness Crab Landings and Value 2004-2013 Other counties
Whatcom
Skagit
Pacific
Grays Harbor
Total Value(2014$)
Sector Analysis Report – Fishing Prepared under Contract No. SC 14-327
22
operating in this fishery are based in Washington, and the catchers that deliver to them
are based in both Washington and Oregon (Personal comm. C. Niles 2014).
The last sector of this fishery is the fixed gear (i.e., bottom longline and pot gear) sector,
which includes a limited entry fishery, managed through a primary annual season and
restrictions on the amount of fish harvested on a given trip or set period of time (i.e.,
daily, weekly, monthly, bimonthly), and an open access fishery . This fishery primarily
targets sablefish (also known as “black cod”) (Personal comm. C. Niles 2014).
Separate from the groundfish fishery managed by PFMC, there is an open access directed
commercial fishery for Pacific halibut and an incidental retention allowance of halibut for
the fixed gear sablefish fishery occurring north of Point Chehalis and an incidental
allowance for the salmon troll fishery West Coast-wide. There are annual surveys, stock
assessments, and quotas set by the International Pacific Halibut Commission (IPHC).
The allocation of halibut is managed by PFMC through its Catch Sharing Plan, which
was developed in 1988. Due to the derby nature of the fishery and recent increases in
effort generally, the directed commercial fishery only lasts a few days. Participation
varies depending on the timing of the fishery openers and the availability of other fishing
opportunities (Personal comm. M. Culver 2014).
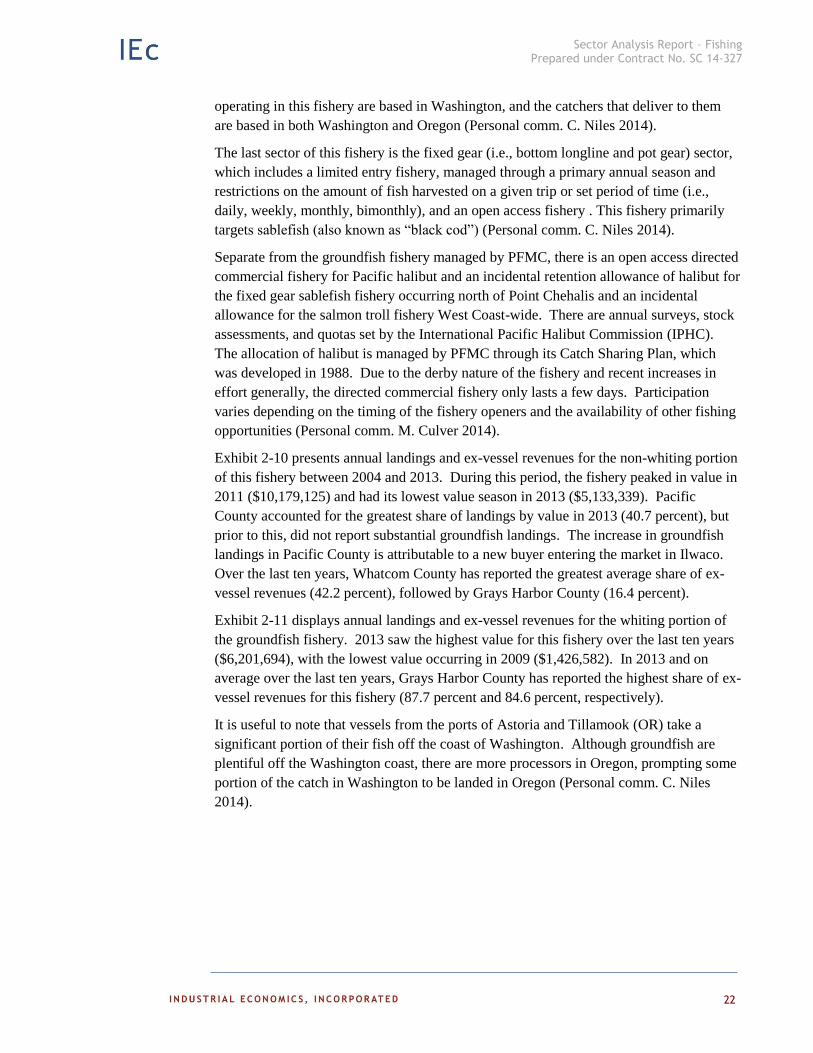
Exhibit 2-10 presents annual landings and ex-vessel revenues for the non-whiting portion
of this fishery between 2004 and 2013. During this period, the fishery peaked in value in
2011 ($10,179,125) and had its lowest value season in 2013 ($5,133,339). Pacific
County accounted for the greatest share of landings by value in 2013 (40.7 percent), but
prior to this, did not report substantial groundfish landings. The increase in groundfish
landings in Pacific County is attributable to a new buyer entering the market in Ilwaco.
Over the last ten years, Whatcom County has reported the greatest average share of ex-
vessel revenues (42.2 percent), followed by Grays Harbor County (16.4 percent).
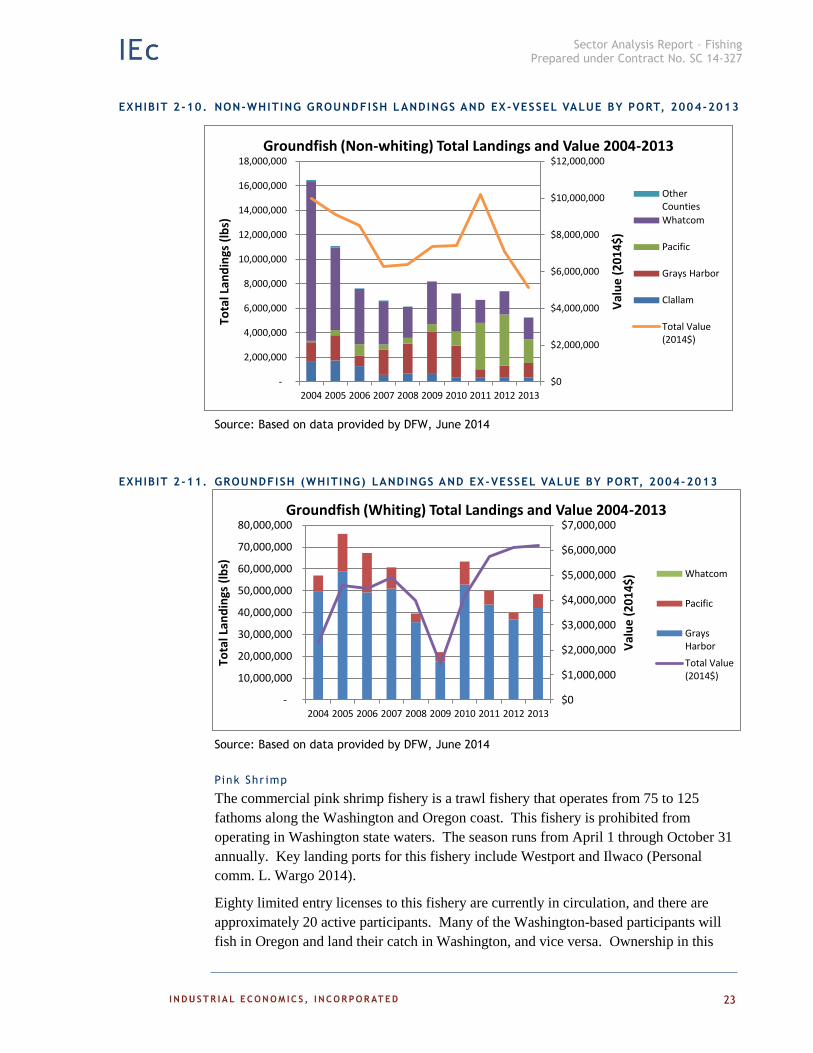
Exhibit 2-11 displays annual landings and ex-vessel revenues for the whiting portion of
the groundfish fishery. 2013 saw the highest value for this fishery over the last ten years
($6,201,694), with the lowest value occurring in 2009 ($1,426,582). In 2013 and on
average over the last ten years, Grays Harbor County has reported the highest share of ex-
vessel revenues for this fishery (87.7 percent and 84.6 percent, respectively).
It is useful to note that vessels from the ports of Astoria and Tillamook (OR) take a
significant portion of their fish off the coast of Washington. Although groundfish are
plentiful off the Washington coast, there are more processors in Oregon, prompting some
portion of the catch in Washington to be landed in Oregon (Personal comm. C. Niles
2014).
Sector Analysis Report – Fishing Prepared under Contract No. SC 14-327
23
EXHIBIT 2-10. NON-WHITING GROUNDFISH LANDINGS AND EX-VESSEL VALUE BY PORT, 2004-2013
Source: Based on data provided by DFW, June 2014
EXHIBIT 2-11. GROUNDFISH (WHITING) LANDINGS AND EX-VESSEL VALUE BY PORT, 2004-2013
Source: Based on data provided by DFW, June 2014
Pink Shr imp
The commercial pink shrimp fishery is a trawl fishery that operates from 75 to 125
fathoms along the Washington and Oregon coast. This fishery is prohibited from
operating in Washington state waters. The season runs from April 1 through October 31
annually. Key landing ports for this fishery include Westport and Ilwaco (Personal
comm. L. Wargo 2014).
Eighty limited entry licenses to this fishery are currently in circulation, and there are
approximately 20 active participants. Many of the Washington-based participants will
fish in Oregon and land their catch in Washington, and vice versa. Ownership in this
$0
$2,000,000
$4,000,000
$6,000,000
$8,000,000
$10,000,000
$12,000,000
-
2,000,000
4,000,000
6,000,000
8,000,000
10,000,000
12,000,000
14,000,000
16,000,000
18,000,000
2004 2005 2006 2007 2008 2009 2010 2011 2012 2013
Val
ue
(2
01
4$
)
Tota
l Lan
din
gs (
lbs)
Groundfish (Non-whiting) Total Landings and Value 2004-2013
OtherCounties
Whatcom
Pacific
Grays Harbor
Clallam
Total Value(2014$)
$0
$1,000,000
$2,000,000
$3,000,000
$4,000,000
$5,000,000
$6,000,000
$7,000,000
-
10,000,000
20,000,000
30,000,000
40,000,000
50,000,000
60,000,000
70,000,000
80,000,000
2004 2005 2006 2007 2008 2009 2010 2011 2012 2013
Val
ue
(2
01
4$
)
Tota
l Lan
din
gs (
lbs)
Groundfish (Whiting) Total Landings and Value 2004-2013
Whatcom
Pacific
GraysHarbor
Total Value(2014$)
Sector Analysis Report – Fishing Prepared under Contract No. SC 14-327
24
fishery is a mix of sole proprietors and corporate owners (Personal comm. L. Wargo
2014).
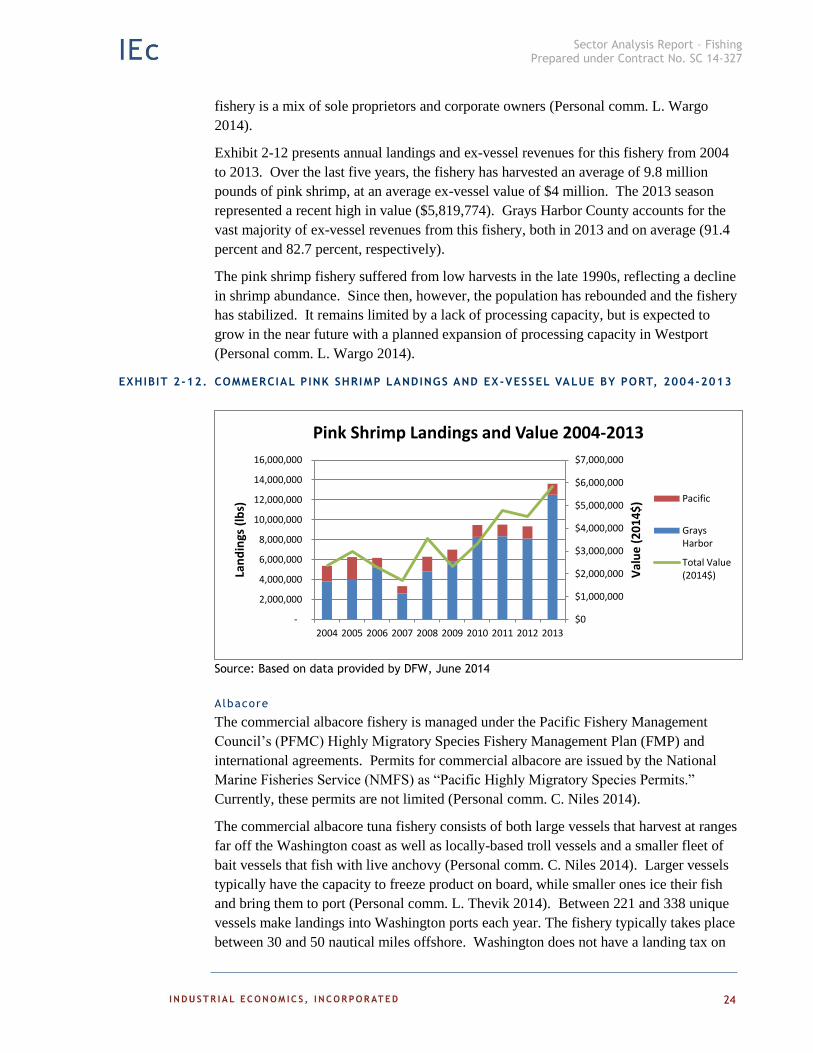
Exhibit 2-12 presents annual landings and ex-vessel revenues for this fishery from 2004
to 2013. Over the last five years, the fishery has harvested an average of 9.8 million
pounds of pink shrimp, at an average ex-vessel value of $4 million. The 2013 season
represented a recent high in value ($5,819,774). Grays Harbor County accounts for the
vast majority of ex-vessel revenues from this fishery, both in 2013 and on average (91.4
percent and 82.7 percent, respectively).
The pink shrimp fishery suffered from low harvests in the late 1990s, reflecting a decline
in shrimp abundance. Since then, however, the population has rebounded and the fishery
has stabilized. It remains limited by a lack of processing capacity, but is expected to
grow in the near future with a planned expansion of processing capacity in Westport
(Personal comm. L. Wargo 2014).
EXHIBIT 2-12. COMMERCIAL PINK SHRIMP LANDINGS AND EX-VESSEL VALUE BY PORT, 2004-2013
Source: Based on data provided by DFW, June 2014
Albacore
The commercial albacore fishery is managed under the Pacific Fishery Management
Council’s (PFMC) Highly Migratory Species Fishery Management Plan (FMP) and
international agreements. Permits for commercial albacore are issued by the National
Marine Fisheries Service (NMFS) as “Pacific Highly Migratory Species Permits.”
Currently, these permits are not limited (Personal comm. C. Niles 2014).
The commercial albacore tuna fishery consists of both large vessels that harvest at ranges
far off the Washington coast as well as locally-based troll vessels and a smaller fleet of
bait vessels that fish with live anchovy (Personal comm. C. Niles 2014). Larger vessels
typically have the capacity to freeze product on board, while smaller ones ice their fish
and bring them to port (Personal comm. L. Thevik 2014). Between 221 and 338 unique
vessels make landings into Washington ports each year. The fishery typically takes place
between 30 and 50 nautical miles offshore. Washington does not have a landing tax on
$0
$1,000,000
$2,000,000
$3,000,000
$4,000,000
$5,000,000
$6,000,000
$7,000,000
-
2,000,000
4,000,000
6,000,000
8,000,000
10,000,000
12,000,000
14,000,000
16,000,000
2004 2005 2006 2007 2008 2009 2010 2011 2012 2013V
alu
e (
20
14
$)
Lan
din
gs (
lbs)
Pink Shrimp Landings and Value 2004-2013
Pacific
GraysHarbor
Total Value(2014$)
Sector Analysis Report – Fishing Prepared under Contract No. SC 14-327
25
albacore fisheries, making its ports desirable landing sites (Personal comm. C. Niles
2014).
Due to the highly migratory nature of albacore, an international treaty was instated that
allows vessels from participating nations to fish albacore across borders. Over the five-
year period between 2009 and 2013, an average of 13 Canadian vessels made landings
under this treaty in Washington each year (Personal comm. C. Niles 2014).
Historically, much of the harvest from this fishery was canned. Although a substantial
portion continues to be canned, new domestic markets have developed for fresh albacore,
as well as for custom-canned albacore. These trends have resulted in an increased price
for these fish (Personal comm. L. Thevik 2014).
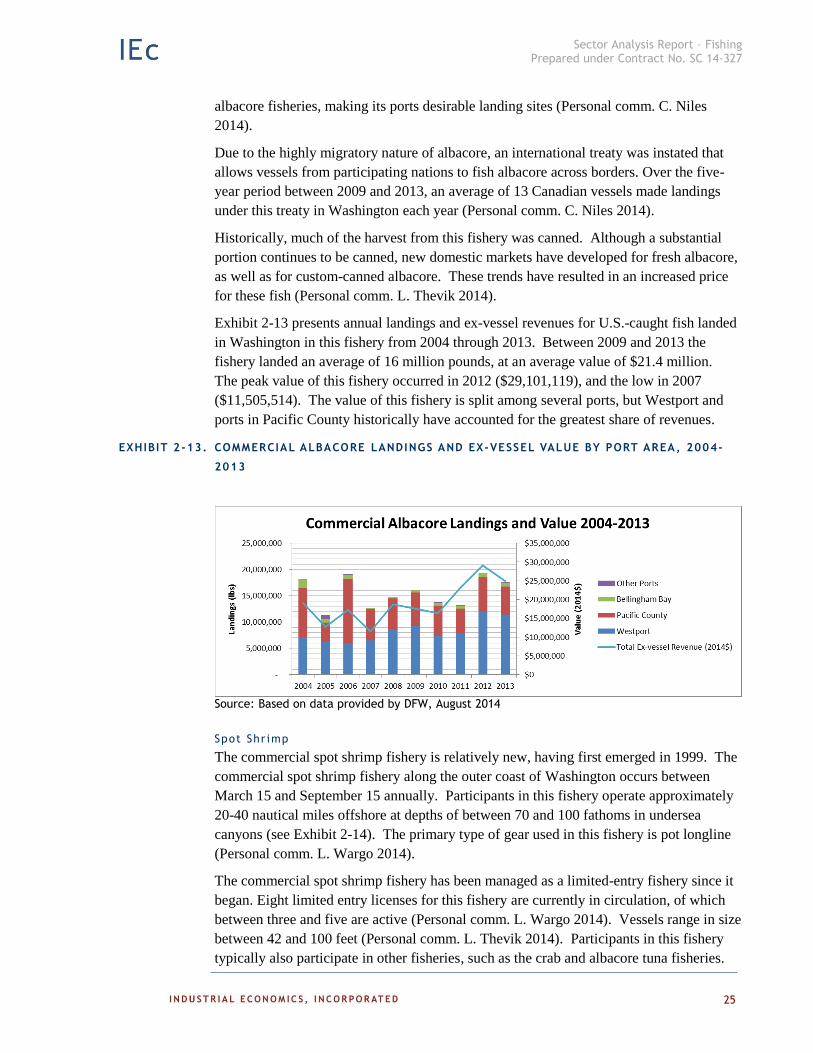
Exhibit 2-13 presents annual landings and ex-vessel revenues for U.S.-caught fish landed
in Washington in this fishery from 2004 through 2013. Between 2009 and 2013 the
fishery landed an average of 16 million pounds, at an average value of $21.4 million.
The peak value of this fishery occurred in 2012 ($29,101,119), and the low in 2007
($11,505,514). The value of this fishery is split among several ports, but Westport and
ports in Pacific County historically have accounted for the greatest share of revenues.
EXHIBIT 2-13. COMMERCIAL ALBACORE LANDINGS AND EX-VESSEL VALUE BY PORT AREA, 2004-
2013
Source: Based on data provided by DFW, August 2014
Spot Shr imp
The commercial spot shrimp fishery is relatively new, having first emerged in 1999. The
commercial spot shrimp fishery along the outer coast of Washington occurs between
March 15 and September 15 annually. Participants in this fishery operate approximately
20-40 nautical miles offshore at depths of between 70 and 100 fathoms in undersea
canyons (see Exhibit 2-14). The primary type of gear used in this fishery is pot longline
(Personal comm. L. Wargo 2014).
The commercial spot shrimp fishery has been managed as a limited-entry fishery since it
began. Eight limited entry licenses for this fishery are currently in circulation, of which
between three and five are active (Personal comm. L. Wargo 2014). Vessels range in size
between 42 and 100 feet (Personal comm. L. Thevik 2014). Participants in this fishery
typically also participate in other fisheries, such as the crab and albacore tuna fisheries.

Sector Analysis Report – Fishing Prepared under Contract No. SC 14-327
26
The fishery is managed under a quota, but has never actually reached that quota (Personal
comm. L. Wargo 2014).
Exhibit 2-15 presents annual landings and ex-vessel revenues for the commercial spot
shrimp fishery from 2004 through 2013. The highest value year came in 2010
($754,585), and the lowest in 2013 ($102,257).
Primary landing ports for this fishery include Port Angeles, Seattle, Neah Bay, and
Westport (Personal comm. L. Thevik 2014). Landings in Grays Harbor County account
for the vast majority of ex-vessel revenues in this fishery (100 percent in 2013, 87.1
percent on average over the last ten years).
EXHIBIT 2-14. COMMERCIAL SPOT SHRIMP GENERAL FISHING GROUNDS
Source: Provided by DFW, May 2014

Sector Analysis Report – Fishing Prepared under Contract No. SC 14-327
27
EXHIBIT 2-15. COMMERICAL SPOT SHRIMP LANDINGS AND EX-VESSEL VALUE BY PORT, 2004-2013
Source: Based on data provided by DFW, June 2014
Sard ine
The commercial sardine fishery is a purse seine fishery open between April 1 and
December 31. The opening of this season is timed to protect salmon. It is prohibited in
state waters (within 3 nautical miles of shore). Exhibit 2-16 identifies the location of
fishing activity in this fishery for 2013. There are presently 16 limited entry permanent
license holders, of which approximately 8 are active (Personal comm. L. Wargo 2014).
The sardine fishery is managed by the Federal Annual Harvest Guideline for the US West
Coast, as well as by State commercial fishery regulations. Exhibit 2-17 presents annual
harvest and revenue data for Washington landings between 2004 and 2013. Over this
time period, the fishery peaked in value in 2012 ($7,973,928), and had its low in 2006
($498,377). In 2013 Grays Harbor County accounted for nearly 70 percent of ex-vessel
revenues, down slightly from its historical average of 75 percent.
Washington’s share of the coast-wide sardine harvest has increased recently due to the
changing focus in California to more lucrative squid, and the proximity of the fish
themselves to Westport, allowing fishermen to take multiple trips in one day. The fishery
is managed under a reduction restriction, meaning that no more than 15 percent of the
harvest can be used for purposes other than human consumption or bait (Personal comm.
L. Wargo 2014).
Methods used for the sardine harvest can result in bycatch of non-target species,
including anchovy, mackerel, and squid. Some incidental harvest allowance is granted to
baitfish fisheries, but salmon is a prohibited bycatch species (Personal comm. L. Wargo
2014).
$0
$100,000
$200,000
$300,000
$400,000
$500,000
$600,000
$700,000
$800,000
-
20,000
40,000
60,000
80,000
100,000
120,000
140,000
160,000
2004200520062007200820092010201120122013
Val
ue
(2
01
4$
)
Lan
din
gs (
lbs)
Spot Shrimp Landings and Value 2004-2013
Whatcom
Skagit
Pacific
King
Jefferson
Grays Harbor
Total Value (2014$)

Sector Analysis Report – Fishing Prepared under Contract No. SC 14-327
28
EXHIBIT 2-16. SARDINE FISHERY CATCH LOCATIONS (2013)
Source: Provided by DFW, May 2014
EXHIBIT 2-17. COMMERICAL SARDINE LANDINGS AND EX -VESSEL VALUE BY PORT, 2004-2013
Source: Based on data provided by DFW, June 2014
$0
$1,000,000
$2,000,000
$3,000,000
$4,000,000
$5,000,000
$6,000,000
$7,000,000
$8,000,000
$9,000,000
-
10,000,000
20,000,000
30,000,000
40,000,000
50,000,000
60,000,000
70,000,000
80,000,000
90,000,000
Val
ue
(2
01
4$
)
Lan
din
gs (
lbs)
Sardines Landings and Value 2004-2013
Whatcom
Skagit
Pacific
Grays Harbor

Sector Analysis Report – Fishing Prepared under Contract No. SC 14-327
29
Anchovy
The commercial anchovy fishery is comprised of two distinct fisheries managed under the
Annual Catch Limit for the West Coast and through state commercial fishery regulations.
Licenses in this fishery are linked to the gear employed, and the fishery is open-access.
Activity in this fishery tends to be near shore, and is allowed in state waters, including in
Willapa Bay and Grays Harbor. Anchovy landings are limited to 11,000 pounds per day
and 22,000 pounds per week. The state enforces some incidental catch limits for other
non-target forage fish. The commercial anchovy season closes for a portion of the spring
in order to protect out-migrating salmon (Personal comm. L. Wargo 2014).
The first segment of this fishery is comprised of commercial albacore tuna fishermen who
use lampara gear to harvest anchovies for personal use. Westport is the key landing port
for this fishery and supports between five and ten vessels annually. The other segment of
this fishery uses purse seine gear to catch live and tray bait for recreational fisheries.
Westport and Ilwaco are the key landing ports for between one and three vessels annually
(Personal comm. L. Wargo 2014).
Exhibit 2-18 presents data on annual landings and ex-vessel revenues for this fishery
between 2004 and 2013. There was a tremendous peak in value in 2009, when ex-vessel
revenues reached $146,154. Although nearly all of the landings have occurred in Grays
Harbor County, both in 2013 and historically on average, the value in Pacific County (not
displayed here) was much greater in 2013 (65 percent) and has been disproportionately
high (41 percent) on average over the last ten years). Over the last five years, the
combined fisheries have harvested an average of 650,000 pounds annually at an average
ex-vessel value of $80,000 (Personal comm. L. Wargo 2014).
EXHIBIT 2-18. COMMERICAL ANCHOVY LANDINGS AND EX-VESSEL VALUE BY PORT, 2004-2013
Source: Based on data provided by DFW, June 2014
$0
$20,000
$40,000
$60,000
$80,000
$100,000
$120,000
$140,000
$160,000
0
200,000
400,000
600,000
800,000
1,000,000
1,200,000
1,400,000
1,600,000
1,800,000
2,000,000
2004 2005 2006 2007 2008 2009 2010 2011 2012 2013
Tota
l Val
ue
(2
01
4$
)
Tota
l Lan
din
gs (
lbs)
Anchovy Landings and Value 2004-2013
Pacific
GraysHarbor
Sector Analysis Report – Fishing Prepared under Contract No. SC 14-327
30
Hagfish (“Sl ime Eels”)
The hagfish fishery is an emerging commercial fishery that began operating as an open
access fishery in 2005. Since 2005, there have been between 15 and 20 licenses in
circulation annually, of which anywhere between two and 15 have been active in any
given year. Each license holder may fish 100 pots. The fishery is open year-round, and
operates on muddy or sandy bottom between depths of 50 and 80 fathoms (see Exhibit 2-
19). The fishery is closed in waters shallower than 50 fathoms (Personal comm. L.
Wargo 2014).
Only two individuals primarily target hagfish, while others are likely participating to
supplement earnings in other fisheries. The market for this fishery consists of both fresh
and frozen product that is almost exclusively exported to Korea. The market is extremely
volatile, and there is a high demand for this product (Personal comm. L. Wargo 2014).
Success in this fishery requires some specialization, as the species is difficult to handle
and sale of the product requires relationships with Korean buyers. This fishery is to some
extent limited by the difficulty in establishing these relationships (Personal comm. L.
Wargo 2014).
Exhibit 2-19 provides a graphical representation of the location of fishing effort between
2005 and 2012, as well as the total landings for each of these years by reporting area.
Landings of this fish are fairly widely distributed, and Westport is a key landing port at
this time. The ports of Ilwaco, Port Angeles, Port Townsend, and Blaine also receive
notable landings (Personal comm. L. Wargo 2014). Neah Bay and La Push currently do
not allow landings of this species (Personal comm. K. Krueger 2014).
Exhibit 2-20 presents data on annual landings and ex-vessel revenues for this fishery
between 2004 and 2013. Landings and revenues have climbed steadily since the fishery’s
inception in 2005. Ex-vessel revenues reached an historical high in 2012 ($2,326,260).
Grays Harbor has been the primary port for landings of hagfish since the fishery began,
accounting for 61 percent of ex-vessel revenues in 2013 and 79 percent of revenues on
average since 2004.

Sector Analysis Report – Fishing Prepared under Contract No. SC 14-327
31
EXHIBIT 2-19. HAGFISH LANDINGS AND LOCATION OF EFFORT BY REPORTING AREA (2005-2012)
Source: Provided by DFW, May 2014
EXHIBIT 2-20. HAGFISH LANDINGS AND EX-VESSEL VALUE BY PORT AREA, 2004 -2013
Source: Based on data provided by DFW, June 2014
$0
$500,000
$1,000,000
$1,500,000
$2,000,000
$2,500,000
-
500,000
1,000,000
1,500,000
2,000,000
2,500,000
Val
ue
(2
01
4$
)
Lan
din
gs (
lbs)
Hagfish Landings and Value 2004-2013
Whatcom
Skagit
Pacific
King
Jefferson
Grays Harbor
Clallam
Total Value (2014$)
Sector Analysis Report – Fishing Prepared under Contract No. SC 14-327
32
Razor Clam
The commercial razor clam fishery occurs from May through June each year. The
majority of catch in this fishery is sold as bait for the Dungeness crab fishery (Personal
comm. D. Ayres 2014).
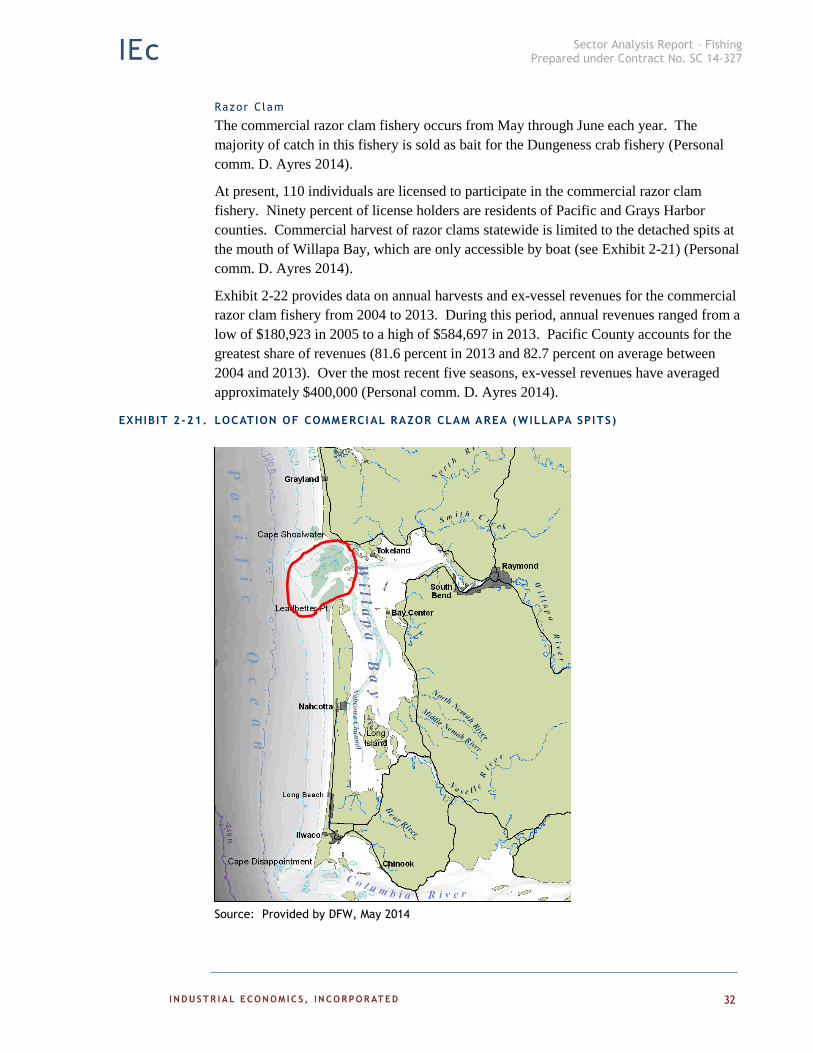
At present, 110 individuals are licensed to participate in the commercial razor clam
fishery. Ninety percent of license holders are residents of Pacific and Grays Harbor
counties. Commercial harvest of razor clams statewide is limited to the detached spits at
the mouth of Willapa Bay, which are only accessible by boat (see Exhibit 2-21) (Personal
comm. D. Ayres 2014).
Exhibit 2-22 provides data on annual harvests and ex-vessel revenues for the commercial
razor clam fishery from 2004 to 2013. During this period, annual revenues ranged from a
low of $180,923 in 2005 to a high of $584,697 in 2013. Pacific County accounts for the
greatest share of revenues (81.6 percent in 2013 and 82.7 percent on average between
2004 and 2013). Over the most recent five seasons, ex-vessel revenues have averaged
approximately $400,000 (Personal comm. D. Ayres 2014).
EXHIBIT 2-21. LOCATION OF COMMERCI AL RAZOR CLAM AREA (WILLAPA SPITS)
Source: Provided by DFW, May 2014

Sector Analysis Report – Fishing Prepared under Contract No. SC 14-327
33
EXHIBIT 2-22. COMMERCIAL RAZOR CLAM LANDINGS AND EX-VESSEL VALUE BY PORT, 2004-2013
Source: Based on data provided by DFW, June 2014
RECREATIONAL FISHING SECTOR
GENERAL OVERVIEW
Recreational fishing on the Washington coast is primarily a boat-based activity that
occurs offshore. There is little activity in coastal bays or estuaries, or from the shore,
except for the recreational harvest of razor clams from Kalaloch Beach and south of the
Quinault Indian Reservation. Approximately 60 percent of the coastal recreational
fishing activity occurs along the southernmost part of the coast, from Point Grenville to
the Columbia River, largely due to there being more ports and thus greater accessibility
(Personal comm. M. Cedergreen 2014).
The recreational fishing sector supports two distinct components – a for-hire (i.e., charter
boat) fleet, and a private vessel fleet. The for-hire fleet ranges from 26 to 65 feet in
length and carries between four and thirty anglers, while private vessels generally range
from 16 to 50 feet and carry between two and ten anglers. There has been a recent trend
towards larger, more powerful private vessels that are capable of going further offshore.
Coastwide, approximately 40 percent of recreational fishing trips are taken on charter
vessels, and 60 percent are taken on private vessels (Personal comm. M. Cedergreen
2014).
Salmon and groundfish are the most important target species for the recreational non-
tribal fishing industry. Other important species include albacore tuna and halibut, with
Dungeness crab ranking a very distant fifth (Personal comm. M. Cedergreen 2014).
The Washington coast supports several major port areas. The Columbia River is home to
two major ports, Ilwaco and Chinook, which focus primarily on salmon and Columbia
River sturgeon. Approximately 25 percent of trips from these ports are on charter
vessels, with 75 percent on private vessels. Westport is another major port, and a hub of
recreational fishing activity. The Westport fleet focuses on salmon and groundfish, as
well as halibut and albacore. Nearly 75 percent of trips out of Westport are taken on
$0
$100,000
$200,000
$300,000
$400,000
$500,000
$600,000
$700,000
-
50,000
100,000
150,000
200,000
250,000
300,000
Val
ue
(2
01
4$
)
Lan
din
gs (
lbs)
Razor Clam Landings and Value 2004-2013
Unknown
Pacific
Grays Harbor
Total Value (2014$)
Sector Analysis Report – Fishing Prepared under Contract No. SC 14-327
34
charter vessels. Together, Ilwaco/Chinook and Westport are responsible for
approximately 75 percent of coastal angler trips (both private and for-hire). To the north,
the ports of La Push and Neah Bay, which are located on tribal lands, are also important.
Charter trips are much more limited in these ports, with approximately 10 percent and 20
percent of trips occurring on charter vessels, respectively (Personal comm. M.
Cedergreen 2014).
The vast majority (perhaps 85 to 90 percent) of participants in Washington’s coastal
recreational fisheries are state residents, with most coming from along the Interstate 5
corridor. This is largely due to the fact that the Washington coast is relatively
inaccessible, and lacks the substantial tourism infrastructure that characterizes other
fishing destinations, such as those in Oregon (Personal comm. M. Cedergreen 2014).
During the 2012-2013 fishing season, DFW reports that a total of 720,000 anglers
purchased recreational fishing licenses to participate in the State’s fresh and marine water
fisheries (Personal comm. M. Culver 2014). DFW issues a variety of licenses that permit
different types of fishing activity in the state’s waters. Licenses relevant to recreational
activity within our study area include Saltwater, Combination
(Saltwater/Freshwater/Shellfish), Shellfish/Seaweed, and Razor Clam licenses. Licenses
may be issued on an annual or temporary basis. Temporary licenses allowing harvest in
coastal areas include a 1-, 2-, or 3-day combination license, and a 3-day razor clam
license. As licenses are not fishery or location-specific, it is not possible to isolate the
total number of licenses sold with the intent of participation in any of the fisheries or
locations of specific interest to this report.
Part ic ipat ion and Economic Contr ibution of Mar ine Recreational F ish ing
Participation and spending on recreational fishing in Washington is part of a billion dollar
industry (DFW 2008). Several recent sources discuss the economic importance of marine
recreational fishing, either to the U.S. as a whole or to Washington specifically. These
studies, which are summarized below, provide some insight into the economic
importance of recreational fishing and shellfishing in coastal Washington. However,
these studies are generally focused on marine recreational fishing as a whole, and
generally do not differentiate between activity within our study area (i.e., the outer coast)
and activity elsewhere (i.e., in Puget Sound and the Strait of Juan de Fuca).
National Survey of Fish ing, Hunting and Wildl i fe -Associated Recreation
The U.S. Fish and Wildlife Service conducts its National Survey of Fishing, Hunting and
Wildlife-Associated Recreation every five years (FWS 2011).8 The survey provides
statewide figures on participation in outdoor recreational activities and expenditures
associated with those activities, including saltwater fishing. Exhibit 2-23 presents the
saltwater fishing data for Washington for the last four surveys. In 2011, 401,000
participants fished for a total of 2.7 million fishing days. Total expenditures on saltwater
8 Note that this report is cited extensively, and provides the basis for numerous other reports on the economic importance of
recreational fishing.

Sector Analysis Report – Fishing Prepared under Contract No. SC 14-327
35
fishing in Washington were $2.7 million. Exhibit 2-24 presents the data for fishing days
and total expenditures graphically, and shows that total fishing effort has not followed a
particular trend, ranging from 1.6 million in 2006 to 2.9 million in 2001. Further, as the
exhibit indicates, expenditures have not necessarily followed the same pattern as
participation. Note that these statewide results may not be representative of our study
area, since they are based in part on activity in other locations (e.g., Puget Sound).
EXHIBIT 2-23. NATIONAL SURVEY OF F ISHING, HUNTING, AND WILDLIFE-ASSOCIATED RECREATION
- WASHINGTON STATE (20 14$) - SALTWATER FISHING
STATISTICS 1996 2001 2006 2011
Participants 378,000 386,000 286,000 401,000
Participant days 2,135,000 2,941,000 1,550,000 2,700,000
Avg. days per participant 6 8 5 7
Number of trips 1,796,000 2,244,000 1,235,000 2,063,000
Total expenditures $266,135,612 $225,042,455 $271,015,054 $271,874,675
Trip-related $100,001,156 $163,108,758 $136,232,306 $196,979,627
Equipment and other $262,362,437 $66,683,779 $61,934,981 $134,781,614
Average annual expenditures per angler
$573 $569 $878 $289
Average trip-related expenditure per day
$47 $55 $88 $73
Sources: FWS 2012, FWS 2008, FWS 2003, FWS 1998.
Note: All dollar estimates have been converted to 2014$ using the GDP Implicit Price Deflator.
DFW Analys is of Non-Treaty Commercial and Recreational Fisher ies
In 2008, DFW published an economic analysis of the non-treaty commercial and
recreational fisheries in Washington State. The report sought to estimate the economic
benefits generated by commercial and recreational fishing in 2006, and provides a variety
of data on recreational harvest, participation, and economic impacts.
Exhibit 2-25 presents the total recreational catch of finfish by species originating from
each of the study regions. Of the total recreational finfish catch of 843,636 fish, 46
percent was caught within the waters of our coastal study area. Catches of several marine
species were heavily weighted toward the coast, including bottomfish (72 percent),
Pacific halibut (67 percent), and albacore tuna (100 percent). In contrast, recreational
harvest of shellfish predominantly occurs outside of the study area, with the exception of
razor clams. 100 percent of the total recreational razor clam harvest in 2006 came from
the coast (see Exhibit 2-26).
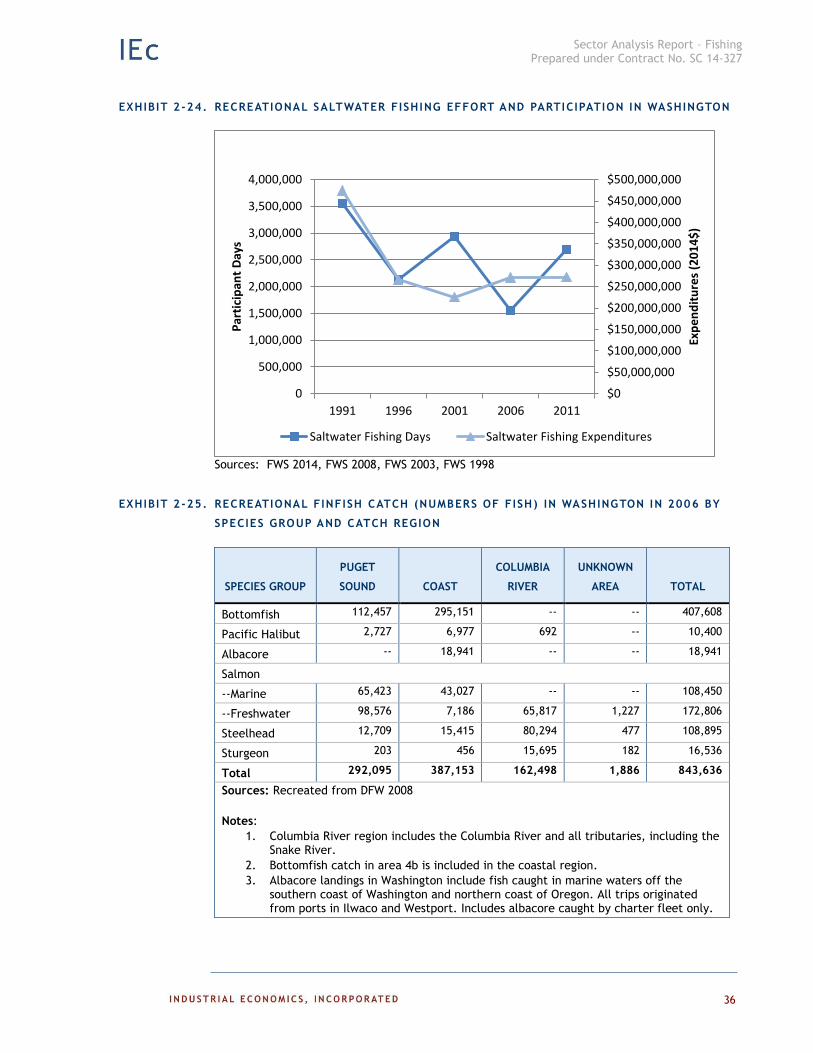
Sector Analysis Report – Fishing Prepared under Contract No. SC 14-327
36
EXHIBIT 2-24. RECREATIONAL SALTWATER FISHING EFFORT AND PARTICIPATION IN WASHINGTON
Sources: FWS 2014, FWS 2008, FWS 2003, FWS 1998
EXHIBIT 2-25. RECREATIONAL FINFISH CATCH (NUMBERS OF FISH) IN WASHINGTON IN 2006 BY
SPECIES GROUP AND CATCH REGION
SPECIES GROUP
PUGET
SOUND COAST
COLUMBIA
RIVER
UNKNOWN
AREA TOTAL
Bottomfish 112,457 295,151 -- -- 407,608
Pacific Halibut 2,727 6,977 692 -- 10,400
Albacore -- 18,941 -- -- 18,941
Salmon
--Marine 65,423 43,027 -- -- 108,450
--Freshwater 98,576 7,186 65,817 1,227 172,806
Steelhead 12,709 15,415 80,294 477 108,895
Sturgeon 203 456 15,695 182 16,536
Total 292,095 387,153 162,498 1,886 843,636
Sources: Recreated from DFW 2008
Notes:
1. Columbia River region includes the Columbia River and all tributaries, including the Snake River.
2. Bottomfish catch in area 4b is included in the coastal region.
3. Albacore landings in Washington include fish caught in marine waters off the southern coast of Washington and northern coast of Oregon. All trips originated from ports in Ilwaco and Westport. Includes albacore caught by charter fleet only.
$0
$50,000,000
$100,000,000
$150,000,000
$200,000,000
$250,000,000
$300,000,000
$350,000,000
$400,000,000
$450,000,000
$500,000,000
0
500,000
1,000,000
1,500,000
2,000,000
2,500,000
3,000,000
3,500,000
4,000,000
1991 1996 2001 2006 2011
Exp
en
dit
ure
s (2
01
4$
)
Par
tici
pan
t D
ays
Saltwater Fishing Days Saltwater Fishing Expenditures

Sector Analysis Report – Fishing Prepared under Contract No. SC 14-327
37
EXHIBIT 2-26. RECREATIONAL SHELLFI SH CATCH (POUNDS) IN WASHINGTON IN 2006, BY SPECIES
GROUP AND CATCH REGION
SPECIES GROUP
NORTH
PUGET
SOUND
SOUTH
PUGET
SOUND STRAIT COAST
COLUMBIA
RIVER TOTAL
Dungeness crab 798,2014 381,692 39,755 -- -- 1,219,551
Shrimp 21,388 82,683 1,850 -- -- 105,921
Razor clams -- -- -- 3,601,000 -- 3,601,000
Other clams 92,704 252,964 -- -- -- 345,668
Oysters 19,106 632,988 -- -- -- 652,094
Sources: Recreated from DFW 2008
Notes:
1. All values in pounds except for oysters, which are in number of oysters
2. Columbia River region includes the Columbia River and all tributaries, including the Snake River.
3. Recreational Dungeness crab harvest is not tracked on the coast.
DFW’s economic analysis reported data on angler expenditures, the net economic value
of recreational fishing, and the economic impacts of this activity. The angler
expenditures employed in this analysis came from the 2008 FWS National Survey of
Fishing, Hunting, and Wildlife-Associated Recreation and are not reported here, since
more recent data are available (see above). Relative to net economic value, the study
reviewed previous studies on angler willingness to pay for fishing opportunities, and
found those values to be $58/day for marine salmon fishing and $60/day for other marine
fishing. These values resulted in a net economic value of marine recreational fishing of
$81.8 million. Although the report identifies the direct, indirect and induced impacts of
recreational fishing in some detail, they are reported for saltwater and freshwater
recreational fishing collectively, and thus are of limited utility in describing the economic
impacts of recreational fishing in our study area.
NOAA Analys is of Marine Angler Expenditures in the United States, 2011
A 2013 report by Lovell et al. for NOAA reports that anglers spent a total of $460 million
on marine recreational fishing in Washington in 2011. It further reports that marine
recreational fishing in Washington contributed 5,100 jobs to the economy, generated
$654 million in sales, contributed $390 million to the state’s Gross Domestic Product,
and generated $247 million in income (see Exhibit 2-27). Marine recreational fishing in
Washington also generated $102,633,000 in federal and state taxes in 2011 (Lovell et al.
2013). Again, these results represent statewide marine fishing activity and are not limited
to our study area.
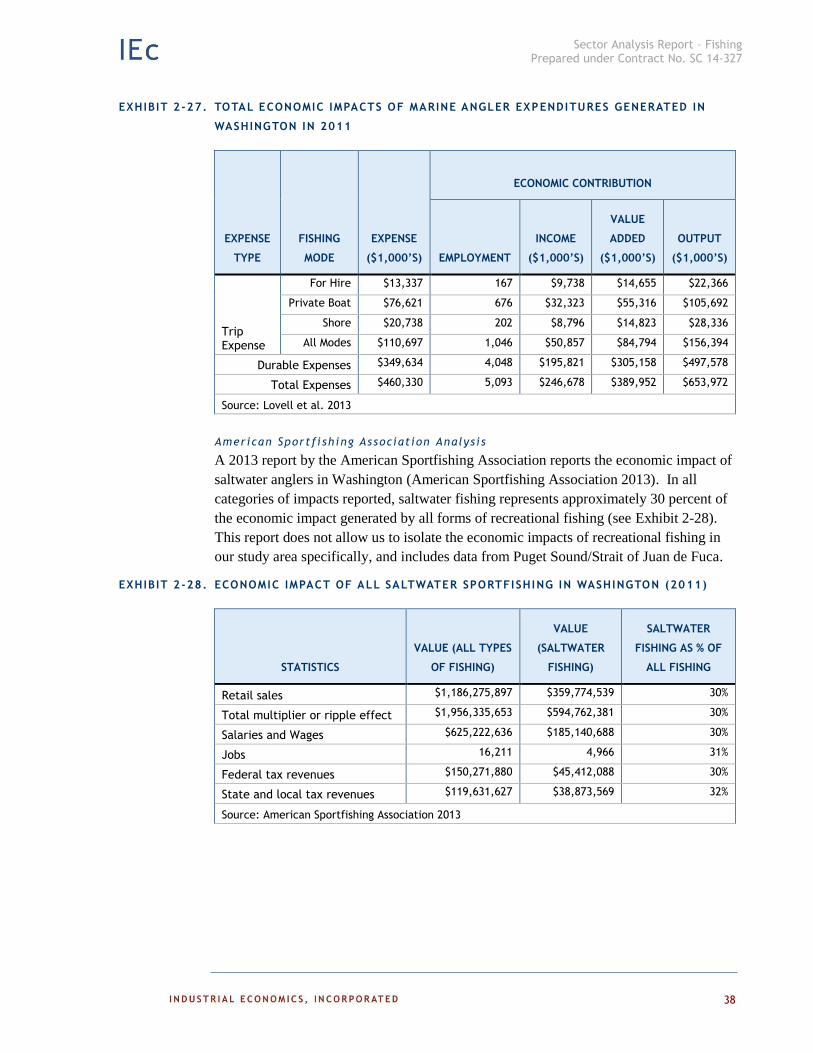
Sector Analysis Report – Fishing Prepared under Contract No. SC 14-327
38
EXHIBIT 2-27. TOTAL ECONOMIC IMPACTS OF MARINE ANGLER EXPENDITURES GENERATED IN
WASHINGTON IN 2011
EXPENSE
TYPE
FISHING
MODE
EXPENSE
($1,000’S)
ECONOMIC CONTRIBUTION
EMPLOYMENT
INCOME
($1,000’S)
VALUE
ADDED
($1,000’S)
OUTPUT
($1,000’S)
Trip Expense
For Hire $13,337 167 $9,738 $14,655 $22,366
Private Boat $76,621 676 $32,323 $55,316 $105,692
Shore $20,738 202 $8,796 $14,823 $28,336
All Modes $110,697 1,046 $50,857 $84,794 $156,394
Durable Expenses $349,634 4,048 $195,821 $305,158 $497,578
Total Expenses $460,330 5,093 $246,678 $389,952 $653,972
Source: Lovell et al. 2013
American Sportfi sh ing As sociat ion Analys is
A 2013 report by the American Sportfishing Association reports the economic impact of
saltwater anglers in Washington (American Sportfishing Association 2013). In all
categories of impacts reported, saltwater fishing represents approximately 30 percent of
the economic impact generated by all forms of recreational fishing (see Exhibit 2-28).
This report does not allow us to isolate the economic impacts of recreational fishing in
our study area specifically, and includes data from Puget Sound/Strait of Juan de Fuca.
EXHIBIT 2-28. ECONOMIC IMPACT OF ALL SALTWATER SPORTFISHING IN WASHINGTON (2011)
STATISTICS
VALUE (ALL TYPES
OF FISHING)
VALUE
(SALTWATER
FISHING)
SALTWATER
FISHING AS % OF
ALL FISHING
Retail sales $1,186,275,897 $359,774,539 30%
Total multiplier or ripple effect $1,956,335,653 $594,762,381 30%
Salaries and Wages $625,222,636 $185,140,688 30%
Jobs 16,211 4,966 31%
Federal tax revenues $150,271,880 $45,412,088 30%
State and local tax revenues $119,631,627 $38,873,569 32%
Source: American Sportfishing Association 2013
Sector Analysis Report – Fishing Prepared under Contract No. SC 14-327
39
Char ter Boat Industry
As noted above, the charter boat industry is an important component of Washington’s
marine recreational fishing sector. The industry developed rapidly following World War
II, focusing almost exclusively on salmon through the 1960s. Between 1960 and 1977
there was tremendous growth in the industry, with approximately 500,000 people fishing
annually coastwide. Between 1977 and 1984, however, the charter boat industry
contracted significantly due to a decline in the salmon resource, new requirements to
share salmon resources with the treaty tribes, and overcapitalization of the fleet. At this
point fisherman began targeting new species such as groundfish and albacore, and
eventually halibut. Beginning in the mid-1980s charter boat activity began to stabilize,
and has been fairly stable since the 1990s. The decline from the historical peak, however,
is evident in communities like Westport, which supported approximately 230 charter
vessels in 1977 but today is home to only 30 such vessels (Personal comm. M.
Cedergreen 2014).
Although much of the information presented in the previous section includes the charter
boat component of recreational fishing, there are a number of sources that have
specifically analyzed the economics this sub-sector specifically. For example, a 2006
survey by Leonard and Watson (2013) provides the most recent, comprehensive data on
revenue sources for the charter boat industry in Washington and Oregon, as well as
estimates of the industry’s direct, indirect, and induced economic effects. Exhibits 2-29
and 2-30 present this information. Exhibit 2-29 focuses on the categories of revenue
generated by charter vessels, allowing us to see the relative contribution of each to total
revenue. These data indicate that salmon fishing provided the greatest contribution to the
revenues of charter vessels in the Northwest, followed by groundfish. Exhibit 2-30
outlines expenses incurred by charter vessels. The greatest expenditures made by these
businesses are for fuel, captain’s fees, and government taxes and fees. Finally, Exhibit 2-
31 describes the economic contributions of the charter industry in Washington. The
analysis found that the charter boat industry contributed $13,333,376 in industry output,
$6,094,780 in income, and $799,139 in taxes to the Washington economy. It also
accounted for a total of 208 jobs statewide.
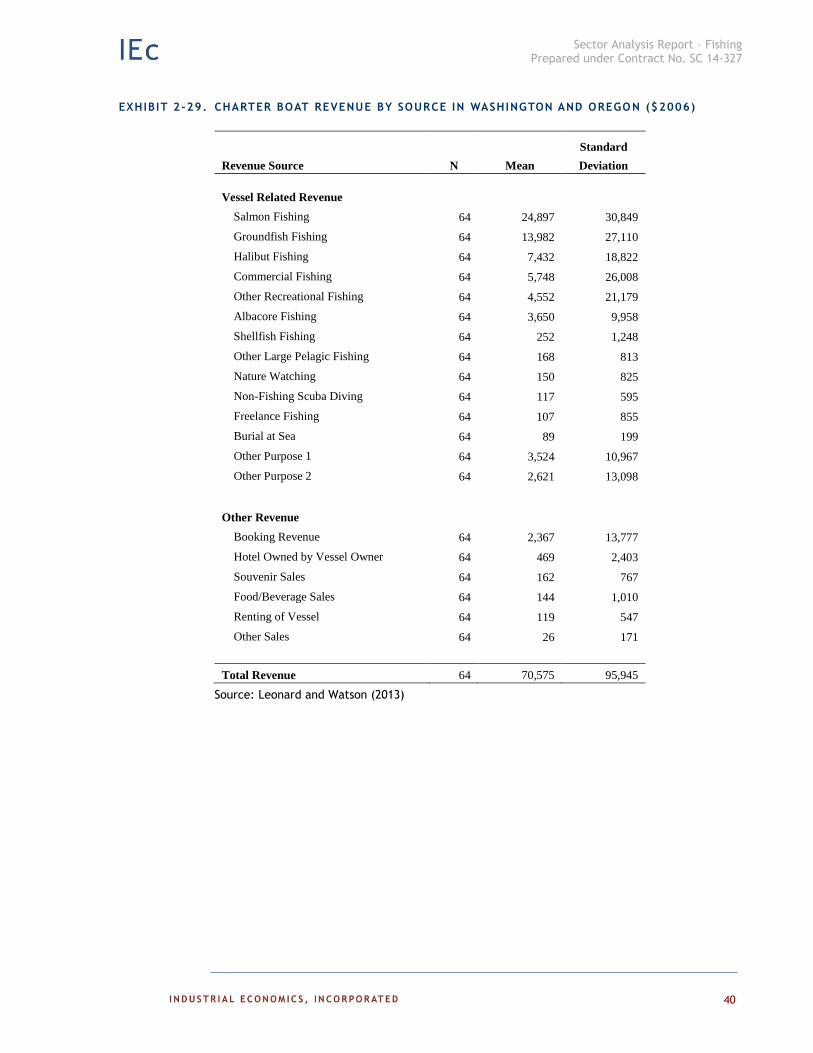
Sector Analysis Report – Fishing Prepared under Contract No. SC 14-327
40
EXHIBIT 2-29. CHARTER BOAT REVENUE BY SOURCE IN WASHINGTON AND OREGON ($2006)
Revenue Source N Mean
Standard
Deviation
Vessel Related Revenue
Salmon Fishing 64 24,897 30,849
Groundfish Fishing 64 13,982 27,110
Halibut Fishing 64 7,432 18,822
Commercial Fishing 64 5,748 26,008
Other Recreational Fishing 64 4,552 21,179
Albacore Fishing 64 3,650 9,958
Shellfish Fishing 64 252 1,248
Other Large Pelagic Fishing 64 168 813
Nature Watching 64 150 825
Non-Fishing Scuba Diving 64 117 595
Freelance Fishing 64 107 855
Burial at Sea 64 89 199
Other Purpose 1 64 3,524 10,967
Other Purpose 2 64 2,621 13,098
Other Revenue
Booking Revenue 64 2,367 13,777
Hotel Owned by Vessel Owner 64 469 2,403
Souvenir Sales 64 162 767
Food/Beverage Sales 64 144 1,010
Renting of Vessel 64 119 547
Other Sales 64 26 171
Total Revenue 64 70,575 95,945
Source: Leonard and Watson (2013)
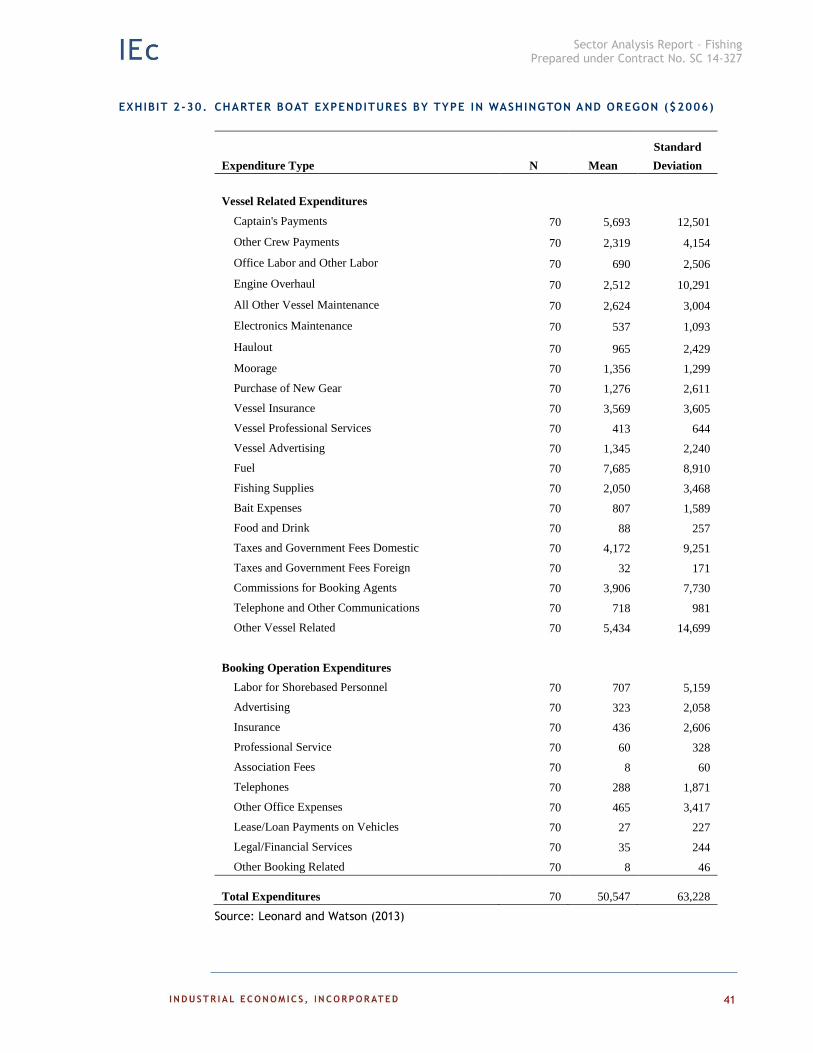
Sector Analysis Report – Fishing Prepared under Contract No. SC 14-327
41
EXHIBIT 2-30. CHARTER BOAT EXPENDITURES BY TYPE IN WASHINGTON AND OREGON ($2006)
Expenditure Type N Mean
Standard
Deviation
Vessel Related Expenditures
Captain's Payments 70 5,693 12,501
Other Crew Payments 70 2,319 4,154
Office Labor and Other Labor 70 690 2,506
Engine Overhaul 70 2,512 10,291
All Other Vessel Maintenance 70 2,624 3,004
Electronics Maintenance 70 537 1,093
Haulout 70 965 2,429
Moorage 70 1,356 1,299
Purchase of New Gear 70 1,276 2,611
Vessel Insurance 70 3,569 3,605
Vessel Professional Services 70 413 644
Vessel Advertising 70 1,345 2,240
Fuel 70 7,685 8,910
Fishing Supplies 70 2,050 3,468
Bait Expenses 70 807 1,589
Food and Drink 70 88 257
Taxes and Government Fees Domestic 70 4,172 9,251
Taxes and Government Fees Foreign 70 32 171
Commissions for Booking Agents 70 3,906 7,730
Telephone and Other Communications 70 718 981
Other Vessel Related 70 5,434 14,699
Booking Operation Expenditures
Labor for Shorebased Personnel 70 707 5,159
Advertising 70 323 2,058
Insurance 70 436 2,606
Professional Service 70 60 328
Association Fees 70 8 60
Telephones 70 288 1,871
Other Office Expenses 70 465 3,417
Lease/Loan Payments on Vehicles 70 27 227
Legal/Financial Services 70 35 244
Other Booking Related 70 8 46
Total Expenditures 70 50,547 63,228
Source: Leonard and Watson (2013)
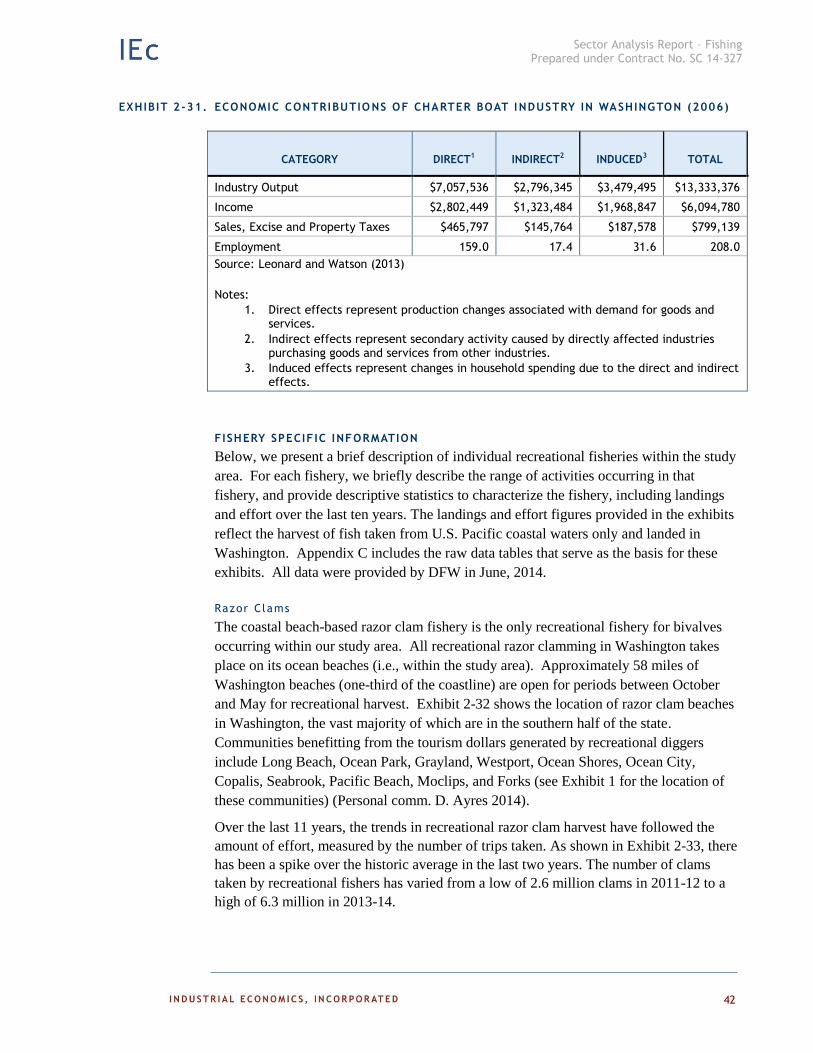
Sector Analysis Report – Fishing Prepared under Contract No. SC 14-327
42
EXHIBIT 2-31. ECONOMIC CONTRIBUTIO NS OF CHARTER BOAT INDUSTRY IN WASHINGTON (2006)
CATEGORY DIRECT1 INDIRECT2 INDUCED3 TOTAL
Industry Output $7,057,536 $2,796,345 $3,479,495 $13,333,376
Income $2,802,449 $1,323,484 $1,968,847 $6,094,780
Sales, Excise and Property Taxes $465,797 $145,764 $187,578 $799,139
Employment 159.0 17.4 31.6 208.0
Source: Leonard and Watson (2013)
Notes:
1. Direct effects represent production changes associated with demand for goods and services.
2. Indirect effects represent secondary activity caused by directly affected industries purchasing goods and services from other industries.
3. Induced effects represent changes in household spending due to the direct and indirect effects.
FISHERY SPECIF IC INFORMATION
Below, we present a brief description of individual recreational fisheries within the study
area. For each fishery, we briefly describe the range of activities occurring in that
fishery, and provide descriptive statistics to characterize the fishery, including landings
and effort over the last ten years. The landings and effort figures provided in the exhibits
reflect the harvest of fish taken from U.S. Pacific coastal waters only and landed in
Washington. Appendix C includes the raw data tables that serve as the basis for these
exhibits. All data were provided by DFW in June, 2014.
Razor Clams
The coastal beach-based razor clam fishery is the only recreational fishery for bivalves
occurring within our study area. All recreational razor clamming in Washington takes
place on its ocean beaches (i.e., within the study area). Approximately 58 miles of
Washington beaches (one-third of the coastline) are open for periods between October
and May for recreational harvest. Exhibit 2-32 shows the location of razor clam beaches
in Washington, the vast majority of which are in the southern half of the state.
Communities benefitting from the tourism dollars generated by recreational diggers
include Long Beach, Ocean Park, Grayland, Westport, Ocean Shores, Ocean City,
Copalis, Seabrook, Pacific Beach, Moclips, and Forks (see Exhibit 1 for the location of
these communities) (Personal comm. D. Ayres 2014).
Over the last 11 years, the trends in recreational razor clam harvest have followed the
amount of effort, measured by the number of trips taken. As shown in Exhibit 2-33, there
has been a spike over the historic average in the last two years. The number of clams
taken by recreational fishers has varied from a low of 2.6 million clams in 2011-12 to a
high of 6.3 million in 2013-14.

Sector Analysis Report – Fishing Prepared under Contract No. SC 14-327
43
As show in Exhibit 2-32, the fishery is concentrated in five areas: Long Beach, Twin
Harbors, Copalis, Mocrocks, and Kalaloch. During the 2013-14 fishing season, nearly 40
percent of the harvest came from Long Beach, and approximately 30 percent came from
Twin Harbors. The level of effort is similarly distributed. Data for the last 11 years
indicate that the two southernmost beaches, Long Beach and Twin Harbors, consistently
account for the majority of the recreational clamming harvest and a similar share of
recreational clamming effort.
EXHIBIT 2-32. LOCATION OF RECREATIONAL RAZOR CLAM BEACHES
Source: DFW 2014d

Sector Analysis Report – Fishing Prepared under Contract No. SC 14-327
44
EXHIBIT 2-33. TOTAL RECREATIONAL RAZOR CLAM HARVEST AND LEVEL OF EFFORT, 2003-2014
Source: Based on data provided by DFW, June 2014
A 2010 report by Dyson and Huppert examined the local economic effects of razor clam
fisheries on the coastal communities of Grays Harbor and Pacific Counties. Exhibit 2-34
identifies total expenditures on razor clamming at four beaches, based on a survey of 240
parties. Total expenditures for the 2007-2008 season were estimated at $24.4 million,
contributing an estimated 404 full-time equivalent jobs and $12.6 million in labor income
to the economy. The authors used these data to estimate that a full-year closure due to a
harmful algal bloom would result in a loss of 339 full-time equivalent jobs and $10.6
million of labor income.
Dungeness Crab
Although Dungeness crab is one of the most popular recreational fisheries in the state,
very little of this activity occurs within our study area (Personal comm. H. Reed 2014).
Because recreational activity offshore is constrained by weather (the primary season
occurring in the dead of winter), most coastal activity is limited to Willapa Bay, Grays
Harbor, and the Columbia River. Although activity is limited, there has been an increase
recently in the number of recreational crabbers who hire charter boats so they can
participate in the fishery prior to the opening of the commercial season (Personal comm.
H. Reed 2014).
Although DFW maintains a rigorous reporting system for the recreational crab harvest in
Puget Sound and along the Strait of Juan de Fuca, reporting of recreational harvests along
the coast is not required. Thus, data on total landings or harvest trips for Dungeness crab
within the study area are not available (Personal comm. H. Reed 2014). The only
available data are for the Puget Sound/Strait of Juan de Fuca area, where recreational
crabbers caught an average of 1.4 million pounds of Dungeness crab between 2006-2011
(DFW 2014a).
050,000100,000150,000200,000250,000300,000350,000400,000450,000500,000
0
1,000,000
2,000,000
3,000,000
4,000,000
5,000,000
6,000,000
7,000,000
Digger trips Clams
Harvest (clams) Effort (digger trips)

Sector Analysis Report – Fishing Prepared under Contract No. SC 14-327
45
EXHIBIT 2-34. PARTICIPATION AND EXPENDITURE DATA FOR FOUR RAZOR CLAMMING BEACHES ON
WASHINGTON’S OUTER COAST (2008$)
CATEGORY MOCROCKS COPALIS
TWIN
HARBORS LONG BEACH
Annual participants 22,247 42,376 65,253 112,442
Days Open 11 13 39 22
Avg. participants per day 2,022 3,260 1,673 5,111
Average $ spent per participant per day
Hotel $21.22 $29.82 $16.34 $20.57
Camping $2.68 $1.31 $3.89 $3.14
Restaurant $15.26 $21.27 $17.42 $28.09
Groceries $8.58 $8.65 $15.96 $15/08
Gas and oil $20.04 $25.81 $26.82 $33.28
Ferry tolls $0.42 $0.09 $0.11 $0.00
Other transport $0.25 $0.19 $0.14 $3.53
All other $3.97 $11.74 $7.07 $10.42
Total expenditures $72.43 $98.89 $87.76 $114.01
Source: Dyson and Huppert 2010.
Albacore Tuna
Albacore are a popular recreational target along the Washington coast during the summer
and early fall. The geographic range of this fishery moves with the highly migratory fish,
but tends to occur between 50 and 100 nautical miles offshore (DFW 2014b). Albacore
are caught using jigs, which are trolled behind the vessel, as well as with live bait while
drifting.
Albacore are targeted by both charter boats and private vessels. Managers note an
increasing trend in the use of private vessels in this fishery. Private fishermen are
required to carry a state saltwater or combination license. Charter boat operators must
carry a salmon charter license, which are limited by the state.9 There are presently no bag
limits on albacore tuna, but increasing pressure at the international level to cap U.S.
fishing effort on albacore may eventually lead to state implementation of a bag limit
(Personal comm. C. Niles 2014).
Exhibit 2-35 presents the total angler trips for albacore between 2009 and 2011. In 2011,
anglers made 3,744 trips targeting albacore tuna. The ports of Westport and Ilwaco saw
nearly equal levels of effort (1,783 and 1,834 trips, respectively). Slightly more trips (57
percent) were made by private vessel than by charter vessels.
9 A Salmon Charter license is required for anyone accepting a fee to take a person fishing for salmon, food fish (including
albacore tuna), or shellfish in Marine Areas 1-13 (DFW 2014e).
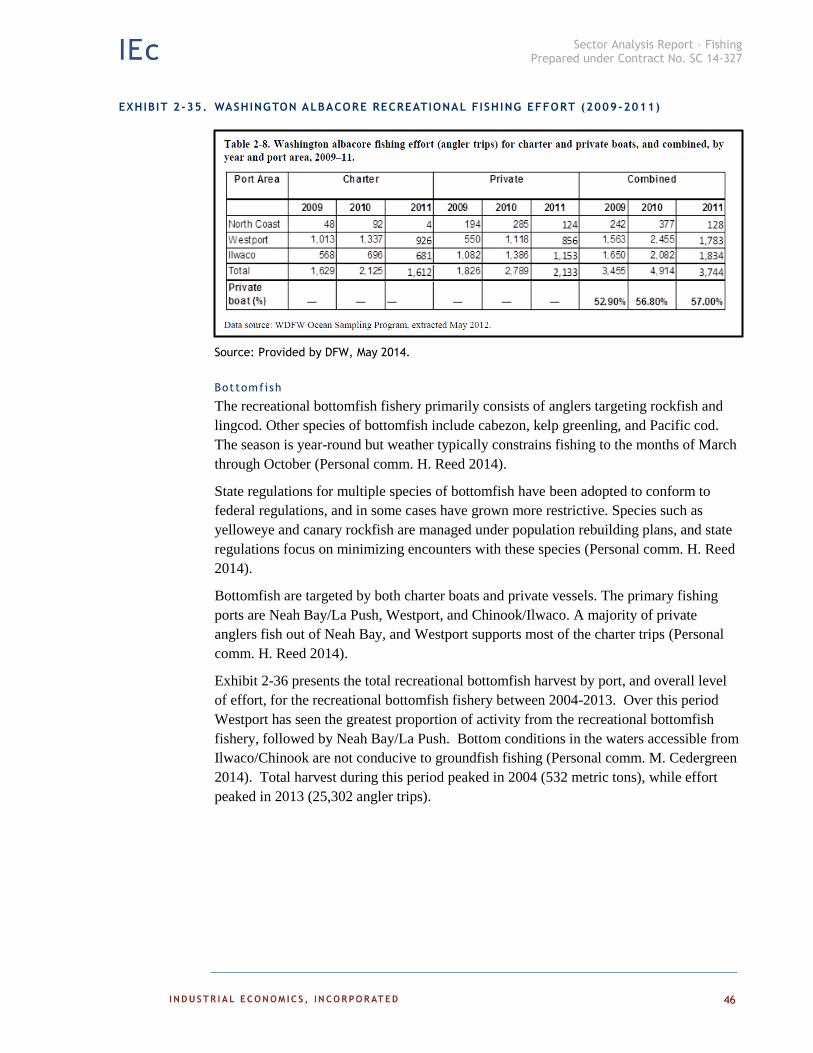
Sector Analysis Report – Fishing Prepared under Contract No. SC 14-327
46
EXHIBIT 2-35. WASHINGTON ALBACORE RECREATIONAL FISHING EFFORT (2009-2011)
Source: Provided by DFW, May 2014.
Bottomfish
The recreational bottomfish fishery primarily consists of anglers targeting rockfish and
lingcod. Other species of bottomfish include cabezon, kelp greenling, and Pacific cod.
The season is year-round but weather typically constrains fishing to the months of March
through October (Personal comm. H. Reed 2014).
State regulations for multiple species of bottomfish have been adopted to conform to
federal regulations, and in some cases have grown more restrictive. Species such as
yelloweye and canary rockfish are managed under population rebuilding plans, and state
regulations focus on minimizing encounters with these species (Personal comm. H. Reed
2014).
Bottomfish are targeted by both charter boats and private vessels. The primary fishing
ports are Neah Bay/La Push, Westport, and Chinook/Ilwaco. A majority of private
anglers fish out of Neah Bay, and Westport supports most of the charter trips (Personal
comm. H. Reed 2014).
Exhibit 2-36 presents the total recreational bottomfish harvest by port, and overall level
of effort, for the recreational bottomfish fishery between 2004-2013. Over this period
Westport has seen the greatest proportion of activity from the recreational bottomfish
fishery, followed by Neah Bay/La Push. Bottom conditions in the waters accessible from
Ilwaco/Chinook are not conducive to groundfish fishing (Personal comm. M. Cedergreen
2014). Total harvest during this period peaked in 2004 (532 metric tons), while effort
peaked in 2013 (25,302 angler trips).
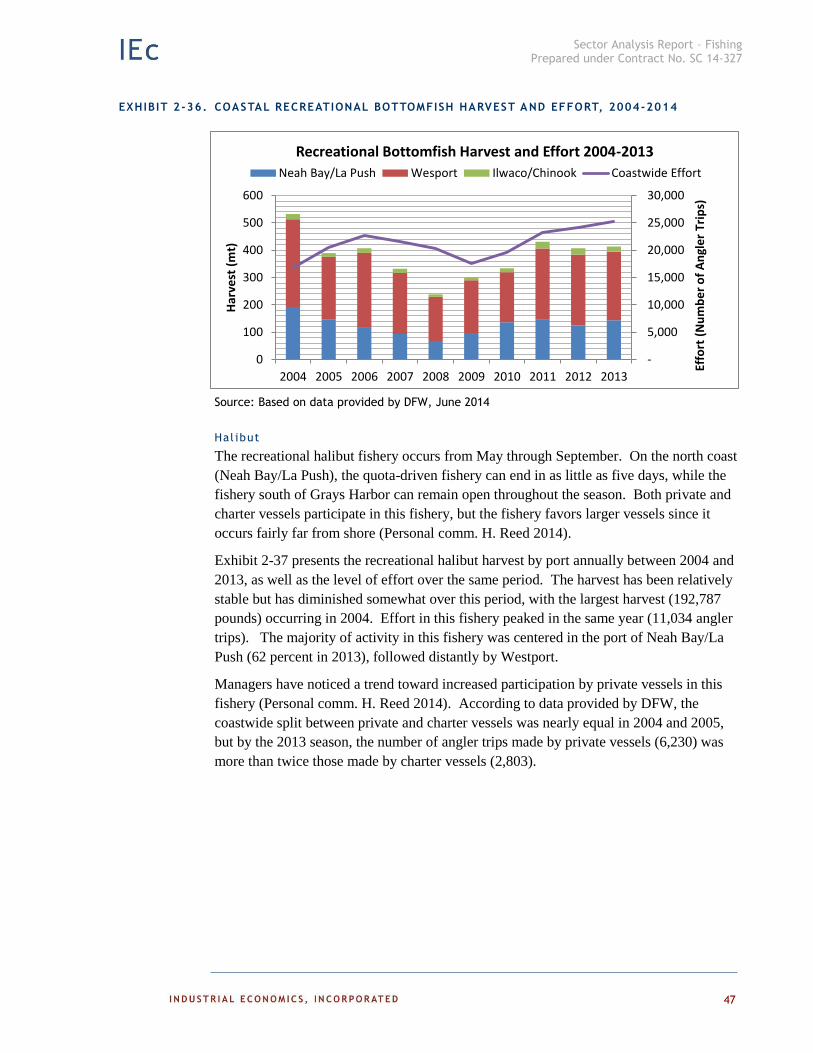
Sector Analysis Report – Fishing Prepared under Contract No. SC 14-327
47
EXHIBIT 2-36. COASTAL RECREATIONAL BOTTOMFISH HARVEST AND EFFORT, 2004-2014
Source: Based on data provided by DFW, June 2014
Hal ibut
The recreational halibut fishery occurs from May through September. On the north coast
(Neah Bay/La Push), the quota-driven fishery can end in as little as five days, while the
fishery south of Grays Harbor can remain open throughout the season. Both private and
charter vessels participate in this fishery, but the fishery favors larger vessels since it
occurs fairly far from shore (Personal comm. H. Reed 2014).
Exhibit 2-37 presents the recreational halibut harvest by port annually between 2004 and
2013, as well as the level of effort over the same period. The harvest has been relatively
stable but has diminished somewhat over this period, with the largest harvest (192,787
pounds) occurring in 2004. Effort in this fishery peaked in the same year (11,034 angler
trips). The majority of activity in this fishery was centered in the port of Neah Bay/La
Push (62 percent in 2013), followed distantly by Westport.
Managers have noticed a trend toward increased participation by private vessels in this
fishery (Personal comm. H. Reed 2014). According to data provided by DFW, the
coastwide split between private and charter vessels was nearly equal in 2004 and 2005,
but by the 2013 season, the number of angler trips made by private vessels (6,230) was
more than twice those made by charter vessels (2,803).
-
5,000
10,000
15,000
20,000
25,000
30,000
0
100
200
300
400
500
600
2004 2005 2006 2007 2008 2009 2010 2011 2012 2013
Effo
rt (
Nu
mb
er
of
An
gle
r Tr
ips)
Har
vest
(m
t)
Recreational Bottomfish Harvest and Effort 2004-2013
Neah Bay/La Push Wesport Ilwaco/Chinook Coastwide Effort
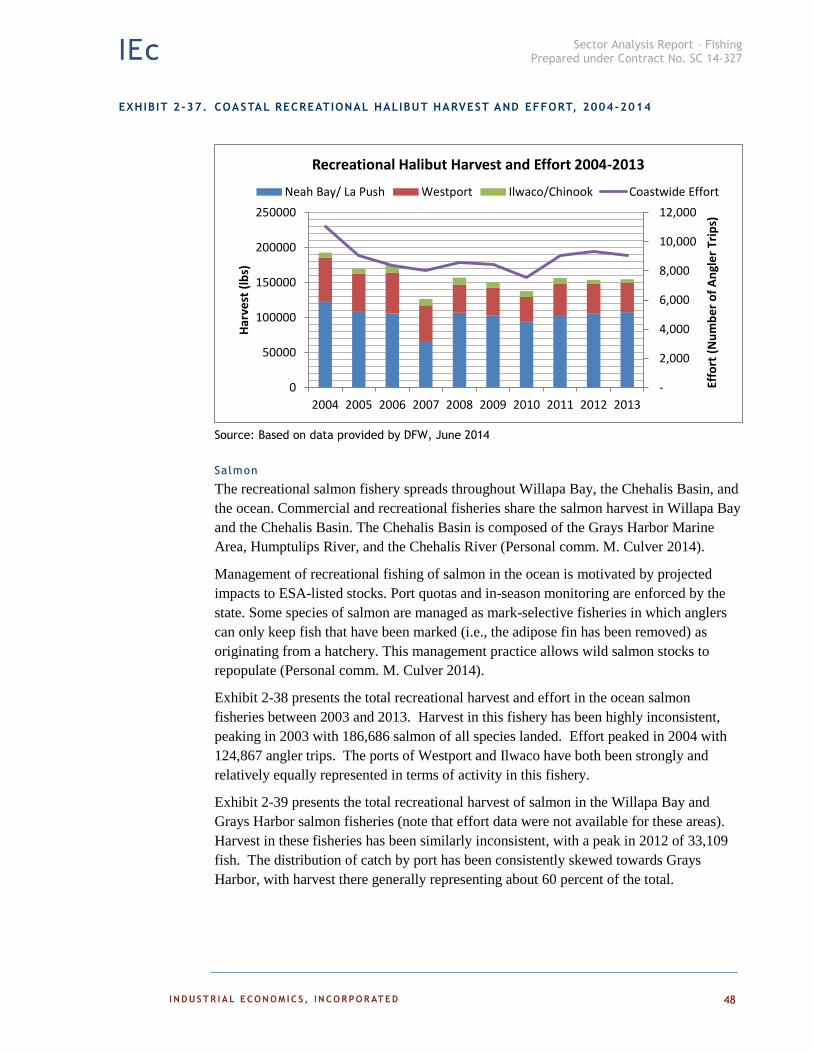
Sector Analysis Report – Fishing Prepared under Contract No. SC 14-327
48
EXHIBIT 2-37. COASTAL RECREATIONAL HALIBUT HARVEST AND EFFORT, 2004-2014
Source: Based on data provided by DFW, June 2014
Salmon
The recreational salmon fishery spreads throughout Willapa Bay, the Chehalis Basin, and
the ocean. Commercial and recreational fisheries share the salmon harvest in Willapa Bay
and the Chehalis Basin. The Chehalis Basin is composed of the Grays Harbor Marine
Area, Humptulips River, and the Chehalis River (Personal comm. M. Culver 2014).
Management of recreational fishing of salmon in the ocean is motivated by projected
impacts to ESA-listed stocks. Port quotas and in-season monitoring are enforced by the
state. Some species of salmon are managed as mark-selective fisheries in which anglers
can only keep fish that have been marked (i.e., the adipose fin has been removed) as
originating from a hatchery. This management practice allows wild salmon stocks to
repopulate (Personal comm. M. Culver 2014).
Exhibit 2-38 presents the total recreational harvest and effort in the ocean salmon
fisheries between 2003 and 2013. Harvest in this fishery has been highly inconsistent,
peaking in 2003 with 186,686 salmon of all species landed. Effort peaked in 2004 with
124,867 angler trips. The ports of Westport and Ilwaco have both been strongly and
relatively equally represented in terms of activity in this fishery.
Exhibit 2-39 presents the total recreational harvest of salmon in the Willapa Bay and
Grays Harbor salmon fisheries (note that effort data were not available for these areas).
Harvest in these fisheries has been similarly inconsistent, with a peak in 2012 of 33,109
fish. The distribution of catch by port has been consistently skewed towards Grays
Harbor, with harvest there generally representing about 60 percent of the total.
-
2,000
4,000
6,000
8,000
10,000
12,000
0
50000
100000
150000
200000
250000
2004 2005 2006 2007 2008 2009 2010 2011 2012 2013
Effo
rt (
Nu
mb
er
of
An
gle
r Tr
ips)
Har
vest
(lb
s)
Recreational Halibut Harvest and Effort 2004-2013
Neah Bay/ La Push Westport Ilwaco/Chinook Coastwide Effort
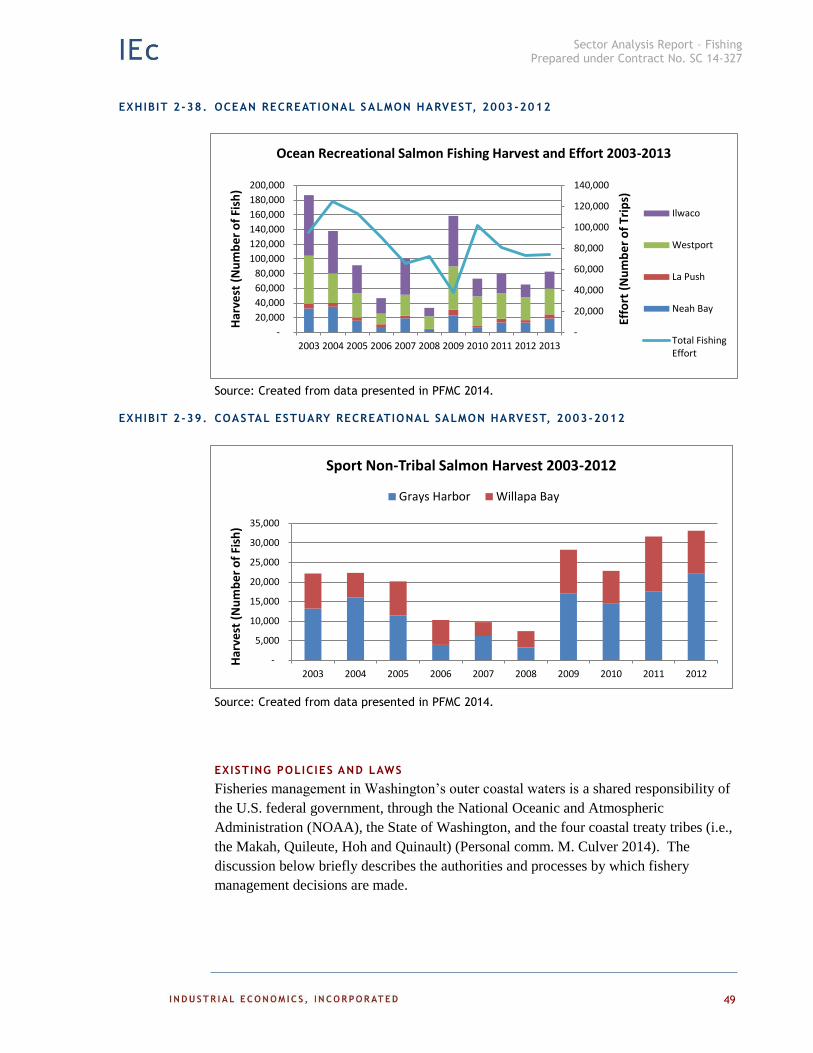
Sector Analysis Report – Fishing Prepared under Contract No. SC 14-327
49
EXHIBIT 2-38. OCEAN RECREATIONAL SALMON HARVEST, 2003-2012
Source: Created from data presented in PFMC 2014.
EXHIBIT 2-39. COASTAL ESTUARY RECREATIONAL SALMON HARVEST, 2003-2012
Source: Created from data presented in PFMC 2014.
EXISTING POLICIES AND LAWS
Fisheries management in Washington’s outer coastal waters is a shared responsibility of
the U.S. federal government, through the National Oceanic and Atmospheric
Administration (NOAA), the State of Washington, and the four coastal treaty tribes (i.e.,
the Makah, Quileute, Hoh and Quinault) (Personal comm. M. Culver 2014). The
discussion below briefly describes the authorities and processes by which fishery
management decisions are made.
-
5,000
10,000
15,000
20,000
25,000
30,000
35,000
2003 2004 2005 2006 2007 2008 2009 2010 2011 2012
Har
vest
(N
um
be
r o
f Fi
sh)
Sport Non-Tribal Salmon Harvest 2003-2012
Grays Harbor Willapa Bay
-
20,000
40,000
60,000
80,000
100,000
120,000
140,000
-
20,000
40,000
60,000
80,000
100,000
120,000
140,000
160,000
180,000
200,000
2003 2004 2005 2006 2007 2008 2009 2010 2011 2012 2013
Effo
rt (
Nu
mb
er
of
Trip
s)
Har
vest
(N
um
be
r o
f Fi
sh)
Ocean Recreational Salmon Fishing Harvest and Effort 2003-2013
Ilwaco
Westport
La Push
Neah Bay
Total FishingEffort

Sector Analysis Report – Fishing Prepared under Contract No. SC 14-327
50
FEDERAL
The Magnuson-Stevens Fishery Conservation and Management Act of 1976 (MSA)
guides the process by which U.S. fisheries are regulated in federal waters (from three
miles to the 200 nautical mile limit of the U.S. Exclusive Economic Zone (EEZ) offshore
of Washington’s coast) (16 U.S.C. §§ 1801-1891d). The MSA establishes eight regional
fishery management councils that are delegated the responsibility of developing strategies
and making decisions regarding the management and conservation of commercial and
recreational fisheries occurring in these waters. Management of the federal waters off
Washington’s coast is the responsibility of the PFMC. The PFMC executes this
responsibility through development and implementation of fishery management plans
(FMPs) that provide the framework under which the National Marine Fisheries Service
(NMFS) issues regulations governing specific fisheries. The PFMC currently oversees
implementation of four FMPs, including Salmon, Groundfish, Coastal Pelagic Species,
and Highly Migratory Species, and a Fishery Ecosystem Plan.
While the PFMC has autonomous authority to make decisions regarding the majority of
fisheries occurring in the U.S. EEZ, in some instances it must confer and negotiate with
several international bodies. Through the IPHC, the U.S. and Canada make joint
decisions on stockwide conservation measures and harvest allocations for Pacific halibut
(Personal comm. M. Culver 2014). In addition, the U.S. has treaties with Canada that
allow U.S. and Canadian vessels to target salmon and albacore tuna across the
international border (Personal comm. C. Niles 2014).
The National Oceanic and Atmospheric Administration (NOAA), through NMFS, has the
authority to promulgate regulations that implement the decisions made by the PFMC.
These regulations are implemented in Title 50 of the Code of Federal Regulations.
In addition to the requirements of the MSA, the Endangered Species Act (ESA) has a
significant effect on the management of U.S. fisheries. Requirements to protect and
restore populations of species listed under the ESA as threatened or endangered can result
in limitations to commercial and recreational fishing activities in the region.
STATE
Generally speaking, the State of Washington has the authority to regulate fisheries
occurring within its coastal waters (from shore to three nautical miles). However, the
MSA allows states to regulate its registered fishing vessels in federal waters for fisheries
that do not have federal FMPs (e.g., pink shrimp, spot shrimp and hagfish) or if the state’s
regulations are consistent with the FMP (e.g., sardines, anchovies and albacore tuna).
The MSA also specifically delegates to the State the authority to manage the Dungeness
crab fishery out to the limits of the EEZ (i.e., to 200 nautical miles). The state presently
manages nine commercial fisheries, including those for Dungeness crab, albacore tuna,
sardines, anchovies, salmon, pink shrimp, spot shrimp, hagfish, and razor clams, as well
as numerous recreational fisheries. The majority of state laws related to management of
fishery resources are contained within Title 77 of the Revised Code of Washington
(RCW). Implementing regulations are contained within Section 220 of the Washington
Administrative Code (WAC) (Personal comm. M. Culver 2014).

Sector Analysis Report – Fishing Prepared under Contract No. SC 14-327
51
TRIBAL
Although tribal fishing activities are expressly not within the scope of this report, it is not
possible to discuss management of Washington’s fisheries without noting the role that
Native American treaty tribes play as co-managers of these resources. Treaties signed
between Native American tribes and the U.S. government in the mid-1800s reserved the
right for these tribes to fish in their Usual and Accustomed (U&A) fishing areas. For four
tribes, the Makah, Quileute, Hoh and Quinault, these areas include portions of
Washington’s marine coastal waters. The bounding latitudes of each tribe’s U&A differ
and overlap with one another, but the seaward boundary of 125°44' W. longitude that was
adjudicated for the Makah has been used in federal fishing regulations for the other three
coastal treaty tribes (see Exhibit 2-40) (Personal comm. M. Culver 2014).
Federal court cases have affected the involvement of the four treaty tribes in
Washington’s ocean commercial fisheries. In United States vs. Washington, Judge
George Hugo Boldt held that Washington’s Native American treaty tribes reserved the
right to take up to 50 percent of the harvestable salmon in their respective U&As (384 F.
Supp. 312 (W.D. Wash. 1974)). This ruling also established the fisheries co-manager
relationship between the state and the treaty tribes. Twenty years later, in subsequent
cases under United States vs. Washington (1994), Judge Edward Rafeedie held that the
treaty right extended to finfish other than salmon, and to shellfish, including oysters,
clams, and Dungeness crab (OCNMS IPC 2008, Personal comm. K. Krueger 2014).
These rulings substantially revised involvement patterns in a number of commercial
fisheries. While tribes were finally provided the opportunity to exercise their treaty rights
in certain fisheries, in some cases non-treaty fishermen experienced significantly reduced
participation and revenues from those fisheries (Personal comm. D. Beasley 2014,
Personal comm. K. Krueger 2014, Personal comm. M. Culver 2014).
EXHIBIT 2-40. TREATY TRIBES’ USUAL AND ACCUSTOMED OFFSHORE FI SHING GROUNDS
Source: Provided by DFW, May 2014
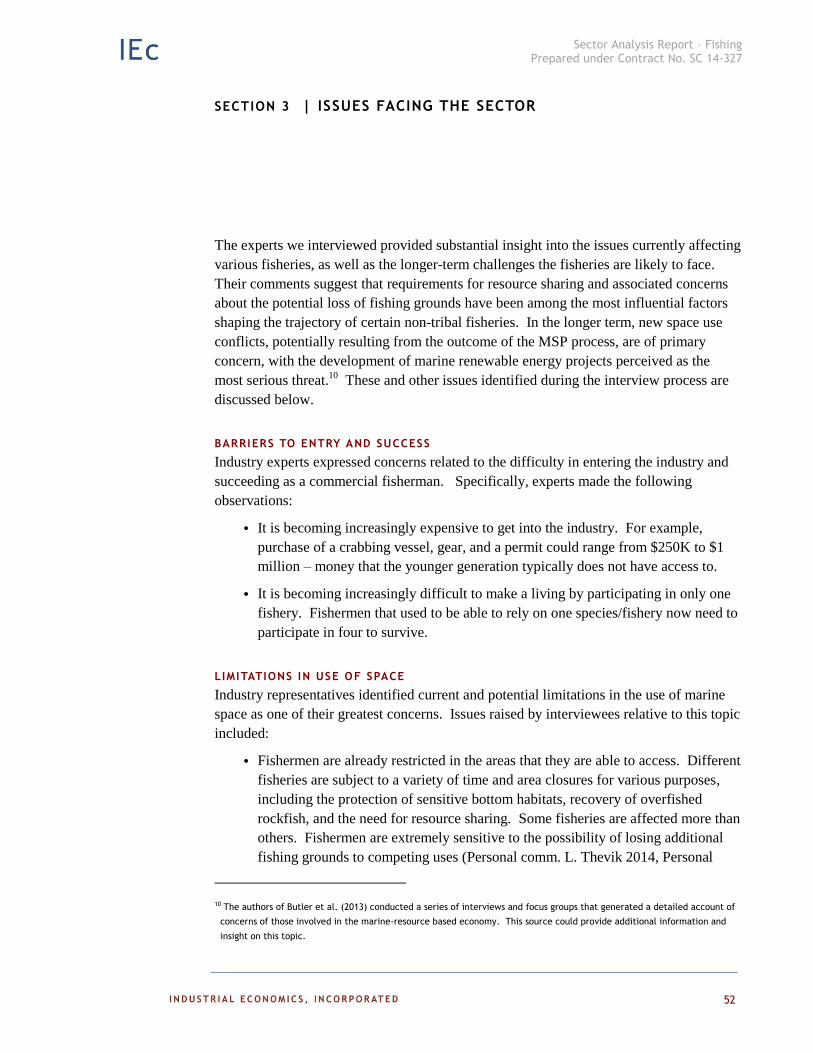
Sector Analysis Report – Fishing Prepared under Contract No. SC 14-327
52
SECTION 3 | ISSUES FACING THE SECTOR
The experts we interviewed provided substantial insight into the issues currently affecting
various fisheries, as well as the longer-term challenges the fisheries are likely to face.
Their comments suggest that requirements for resource sharing and associated concerns
about the potential loss of fishing grounds have been among the most influential factors
shaping the trajectory of certain non-tribal fisheries. In the longer term, new space use
conflicts, potentially resulting from the outcome of the MSP process, are of primary
concern, with the development of marine renewable energy projects perceived as the
most serious threat.10
These and other issues identified during the interview process are
discussed below.
BARRIERS TO ENTRY AND SUCCESS
Industry experts expressed concerns related to the difficulty in entering the industry and
succeeding as a commercial fisherman. Specifically, experts made the following
observations:
It is becoming increasingly expensive to get into the industry. For example,
purchase of a crabbing vessel, gear, and a permit could range from $250K to $1
million – money that the younger generation typically does not have access to.
It is becoming increasingly difficult to make a living by participating in only one
fishery. Fishermen that used to be able to rely on one species/fishery now need to
participate in four to survive.
LIMITATIONS IN USE OF SPACE
Industry representatives identified current and potential limitations in the use of marine
space as one of their greatest concerns. Issues raised by interviewees relative to this topic
included:
Fishermen are already restricted in the areas that they are able to access. Different
fisheries are subject to a variety of time and area closures for various purposes,
including the protection of sensitive bottom habitats, recovery of overfished
rockfish, and the need for resource sharing. Some fisheries are affected more than
others. Fishermen are extremely sensitive to the possibility of losing additional
fishing grounds to competing uses (Personal comm. L. Thevik 2014, Personal
10 The authors of Butler et al. (2013) conducted a series of interviews and focus groups that generated a detailed account of
concerns of those involved in the marine-resource based economy. This source could provide additional information and
insight on this topic.
Sector Analysis Report – Fishing Prepared under Contract No. SC 14-327
53
comm. D. Beasley 2014, Personal comm. M. Cedergreen 2014, Personal comm.
Michele Culver 2014).
The possibility of development of marine renewable energy projects off the
Washington coast seems to be the greatest concern relative to space use conflicts
with other industries. In theory, any new use of marine space in the region would
be seen as a threat, but other potential uses such as offshore aquaculture do not
appear to be on the horizon. One individual noted that conflicts with existing uses
(e.g., shipping) are not viewed as a threat because the uses have co-existed for
some time and participants have been able to work out arrangements to avoid
conflicts (Personal comm. L. Thevik 2014, Personal comm. D. Beasley 2014,
Personal comm. M. Cedergreen 2014).
Industry experts also identified concern about the MSP process itself, in
particular, about the apparent assumption in the process that space can and will be
set aside for certain uses without displacing others. This matter is of particular
concern when being discussed in the context of setting space aside for uses that do
not yet exist (Personal comm. L. Thevik 2014).
OCEAN ACIDIFICATION
Although the exact effects of ocean acidification on Dungeness crab larvae are
unknown, the industry is concerned about how rising acidity may ultimately affect
this resource (Personal comm. L Thevik 2014). Researchers have demonstrated
that ocean acidification leads to thinner shells, slower growth rates, and higher
mortality rates for oysters. Oysters and other shellfish are most vulnerable to the
effects of ocean acidification when they are young (NOAA PMEL 2014).
Additional research is being conducted to investigate the potential effects of ocean
acidity on various crab species (see, for example, NOAA OAP 2014) and some
studies have already found that a lower pH drastically increases juvenile crab
mortality (The Seattle Times 2014). Research has also found that acidification
reducing shell-building and growth rates in pteropods, a key food source for
juvenile salmon (Washington State Blue Ribbon Panel on Ocean Acidification
2012).
Recognizing the importance of this issue in a state whose economy and culture is
so connected to shellfish and the marine environment, the Governor’s office has
taken a number of steps to promote research and actions to address it. In 2012,
then-Governor Gregoire convened a Washington State Blue Ribbon Panel on
Ocean Acidification to develop actions to address the causes and consequences of
acidification. The recommendations of the Panel, documented in Washington
State Blue Ribbon Panel on Ocean Acidification (2012), resulted in Executive
Order 12-07, which directs the Washington State Department of Ecology and
other cabinet agencies to implement the Panel’s key early actions (State of
Washington Office of the Governor 2012).
Sector Analysis Report – Fishing Prepared under Contract No. SC 14-327
54
OIL INDUSTRY
One fishing industry representative identified the threat of an oil spill as a critical
potential issue facing many marine and coastal-based economic sectors. An oil spill
could result in the loss of entire fisheries for substantial periods of time. The anticipated
increase in oil tanker traffic from Vancouver, the danger in crossing the Columbia River,
and the perceived lack of preparation to respond quickly all contribute to the concern
about this threat (Personal comm. D. Beasley 2014).
OVERFISHED SPECIES
Certain fisheries, especially sectors of the groundfish fishery, have the potential to be
limited by requirements to protect overfished species such as canary rockfish and
yelloweye rockfish, which are managed under rebuilding plans. If the allowed bycatch
quota for these overfished species were filled, additional area restrictions may be
implemented or fishing seasons may close prematurely, which could result in leaving
some portion of the allowable catch of the target species not harvested (Personal comm.
D. Beasley 2014). Since the rebuilding plans were implemented in 2000, premature
closure of groundfish fisheries has occurred once in the recreational fishing sector, and
has not occurred in any of the commercial fishing sectors (Personal comm. M. Culver
2014).
POTENTIAL FOR CONCENTRATION OF OWNERSHIP
Industry experts noted concern for the future of the commercial fishing industry related to
the anticipated movement toward consolidation of ownership as a result of
implementation of the Trawl ITQ program. By design, this program will eventually
result in a contraction and consolidation of the fleet to address issues related to
overcapacity. Industry representatives noted concern about his movement concentrating
ownership in the hands of a few, potentially away from independent fishermen and
toward processors and corporations (Personal comm. D. Beasley 2014, Personal comm.
L. Thevik 2014).
REGULATORY UNCERTAINTY
Uncertainty related to future regulatory decisions makes it difficult for fishermen to make
long-term business decisions, such as decisions about capital investments. For example,
Dungeness crab fishermen have long been operating under a regime in which the state has
the authority to manage the fishery in federal waters. However, this authority will expire
in 2016, and it is unclear how the management regime may change after that point
(Personal comm. L. Thevik 2014).

Sector Analysis Report – Fishing Prepared under Contract No. SC 14-327
55
SALMON PRODUCTION AND SURVIVABILITY
The interview process identified a number of concerns related to salmon production and
survivability in the study area. These issues have the potential to affect or are already
affecting the commercial and recreational salmon fisheries. The factors of concern
include:
Oceanic conditions and climatic shifts such as the Pacific Decadal Oscillation, El
Niño and La Niña, and other weather conditions (e.g., droughts and floods) over
which there is no control;
Predation by protected California sea lions (primarily at the foot of dams) and
birds such as Caspian terns and cormorants (most notably at an artificial island
created by the Army Corps of Engineers on the lower Columbia River); and
A reduction in hatchery production due to a number of factors, including science
suggesting that hatchery production has a negative impact on wild salmon
populations, reductions in federal funding, and fulfillment of mitigation
requirements related to hydropower projects (Personal comm. M. Cedergreen
2014).
In addition to those factors identified by interviewed experts, the Governor’s Salmon
Recovery Board identifies the following additional causes of salmon declines:
Loss, fragmentation, and destruction of salmon habitat;
Land uses that pollute waterways and degrade habitat;
Dams;
Over-fishing;
Hatcheries that produce fish that compete with wild salmon for limited resources;
and
Climate change (WRCO 2014).

Sector Analysis Report – Fishing Prepared under Contract No. SC 14-327
56
LAWS AND REGULATIONS LIMITING CATCH
Industry experts pointed to issues related to resource sharing with treaty tribes as a key
factor that has shaped the trajectory of the non-tribal Dungeness crab fishing industry
(Personal comm. L. Thevik 2014, Personal comm. D. Beasley 2014, Personal comm. D.
Eager 2014). The 1994 ruling by Judge Edward Rafeedie (“the Rafeedie Decision”)
extended the tribal treaty rights to salmon confirmed in the 1974 Boldt Decision to other
finfish and shellfish (including Dungeness crab), effectively guaranteeing tribes the
reserved right to harvest up to 50 percent of the shellfish from their U&As, which
collectively extend along approximately 75 percent of the Washington coastline, although
not all four tribes participate in the Dungeness crab fishery to the same degree (see
Exhibit 2-40) (Northwest Indian Fisheries Commission 2014, DFW 2014c, Personal
comm. M. Culver 2014). As a result, numerous regulations were implemented in the
Dungeness crab fishery to ensure that tribes had the opportunity to access their share of
the harvestable resource, including implementation of pot limits, size restrictions, and a
requirement to hold a Washington state license to fish off of Washington’s coast
(Personal comm. H. Reed 2014).
The Rafeedie Decision likely affected the potential value of the fishery to non-treaty
tribal fishermen; however, subsequent to the court order, the non-tribal revenue in the
Dungeness crab fishery has increased substantially, attaining its highest levels in the most
recent years (2010-2014) (Personal comm. M. Culver 2014). As noted above, the
opening months of the crab season gives a window to treaty fishers to assure access to
their 50 percent share. As a result, non-tribal fishery participants now concentrate their
effort in the southern portion of the state, in waters outside of the treaty area, which can
lead to congestion and increased competition within the fishing grounds (Personal comm.
D. Beasley 2014, Personal comm. L. Thevik 2014, Personal comm. K. Krueger 2014).
Sector Analysis Report – Fishing Prepared under Contract No. SC 14-327
57
SECTION 4 | INVENTORY OF AVAILABLE DATA
SUMMARY AND REVIEW O F EXISTING DATA SOURCES
Exhibit 4-1 summarizes the key sources of information that are currently available to
support development of an economic analysis of the non-tribal fishing industry. We
include in this inventory the identity of the data source, a brief description of its contents,
any known caveats or limitations with respect to using the data, and a contact or website
from which the data are available.

Sector Analysis Report – Fishing Prepared under Contract No. SC 14-327
58
EXHIBIT 4-1. INVENTORY OF KEY DATA SOURCES ON THE NON-TRIBAL FISHING INDUSTRY
DATA SOURCE TITLE OR
CITATION DESCRIPTION CAVEATS AND LIMITATIONS AVAILABLE FROM
American Sportfishing Association. 2013. Sport Fishing in America.
The ASA report looks at the 2011 economic benefits of the sport fishing industry at the state and national level. The ASA collected detailed information on angler numbers, expenditures, and days fished for freshwater, saltwater, and the Great Lakes.
Data cannot be isolated to specific species or counties.
http://asafishing.org/uploads/2011_ASASportfishing_in_America_Report_January_2013.pdf
Bell, Kathleen P., Daniel Huppert, and Rebecca L. Johnson. 2003. Willingness to Pay for Local Coho Salmon Enhancement in Coastal Communities. Marine Resource Economics.
The authors conducted a contingent valuation study in five rural, coastal communities in Oregon and Washington to evaluate the extent to which coastal residents are willing to pay for local coho salmon enhancement.
Information is somewhat dated. http://www.researchgate.net/publication/23945211_WILLINGNESS_TO_PAY_FOR_LOCAL_COHO_SALMON_ENHANCEMENT_IN_COASTAL_COMMUNITIES
Bureau of Ocean Energy Management. 2012. Identification of Outer Continental Shelf Renewable Energy Space-Use Conflicts and Analysis of Potential Mitigation Measures. OCS Study BOEM 2012-083. Prepared by Industrial Economics, Inc. under BOEM contract M09PC00037.
Report commissioned by the Bureau of Ocean Energy Management examining ocean space-use conflicts and mitigation strategies for the outer continental shelf. BOEM collected data from NOAA, the U.S. Coast Guard, U.S. Army Corps of Engineers, and many state and regional offices. The study is divided into five regions: Northeast Atlantic, Mid-Atlantic, South Atlantic, Pacific Northwest, and Northern California. State-specific data are available for each region, but county-specific data are not. Some data are available by major sea port.
Data cannot be isolated to specific counties or marine areas, and species detail is limited.
http://ir.library.oregonstate.edu/xmlui/handle/1957/36453
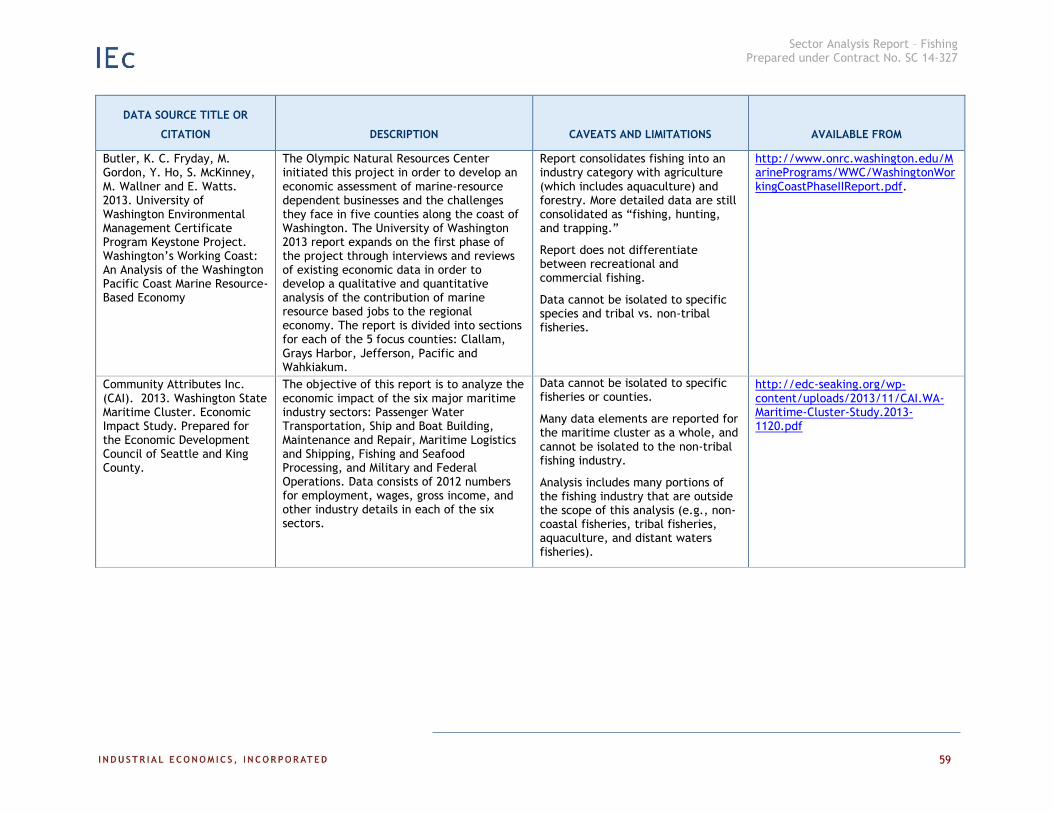
Sector Analysis Report – Fishing Prepared under Contract No. SC 14-327
59
DATA SOURCE TITLE OR
CITATION DESCRIPTION CAVEATS AND LIMITATIONS AVAILABLE FROM
Butler, K. C. Fryday, M. Gordon, Y. Ho, S. McKinney, M. Wallner and E. Watts. 2013. University of Washington Environmental Management Certificate Program Keystone Project. Washington’s Working Coast: An Analysis of the Washington Pacific Coast Marine Resource-Based Economy
The Olympic Natural Resources Center initiated this project in order to develop an economic assessment of marine-resource dependent businesses and the challenges they face in five counties along the coast of Washington. The University of Washington 2013 report expands on the first phase of the project through interviews and reviews of existing economic data in order to develop a qualitative and quantitative analysis of the contribution of marine resource based jobs to the regional economy. The report is divided into sections for each of the 5 focus counties: Clallam, Grays Harbor, Jefferson, Pacific and Wahkiakum.
Report consolidates fishing into an industry category with agriculture (which includes aquaculture) and forestry. More detailed data are still consolidated as “fishing, hunting, and trapping.”
Report does not differentiate between recreational and commercial fishing.
Data cannot be isolated to specific species and tribal vs. non-tribal fisheries.
http://www.onrc.washington.edu/MarinePrograms/WWC/WashingtonWorkingCoastPhaseIIReport.pdf.
Community Attributes Inc. (CAI). 2013. Washington State Maritime Cluster. Economic Impact Study. Prepared for the Economic Development Council of Seattle and King County.
The objective of this report is to analyze the economic impact of the six major maritime industry sectors: Passenger Water Transportation, Ship and Boat Building, Maintenance and Repair, Maritime Logistics and Shipping, Fishing and Seafood Processing, and Military and Federal Operations. Data consists of 2012 numbers for employment, wages, gross income, and other industry details in each of the six sectors.
Data cannot be isolated to specific fisheries or counties.
Many data elements are reported for the maritime cluster as a whole, and cannot be isolated to the non-tribal fishing industry.
Analysis includes many portions of the fishing industry that are outside the scope of this analysis (e.g., non-coastal fisheries, tribal fisheries, aquaculture, and distant waters fisheries).
http://edc-seaking.org/wp-content/uploads/2013/11/CAI.WA-Maritime-Cluster-Study.2013-1120.pdf
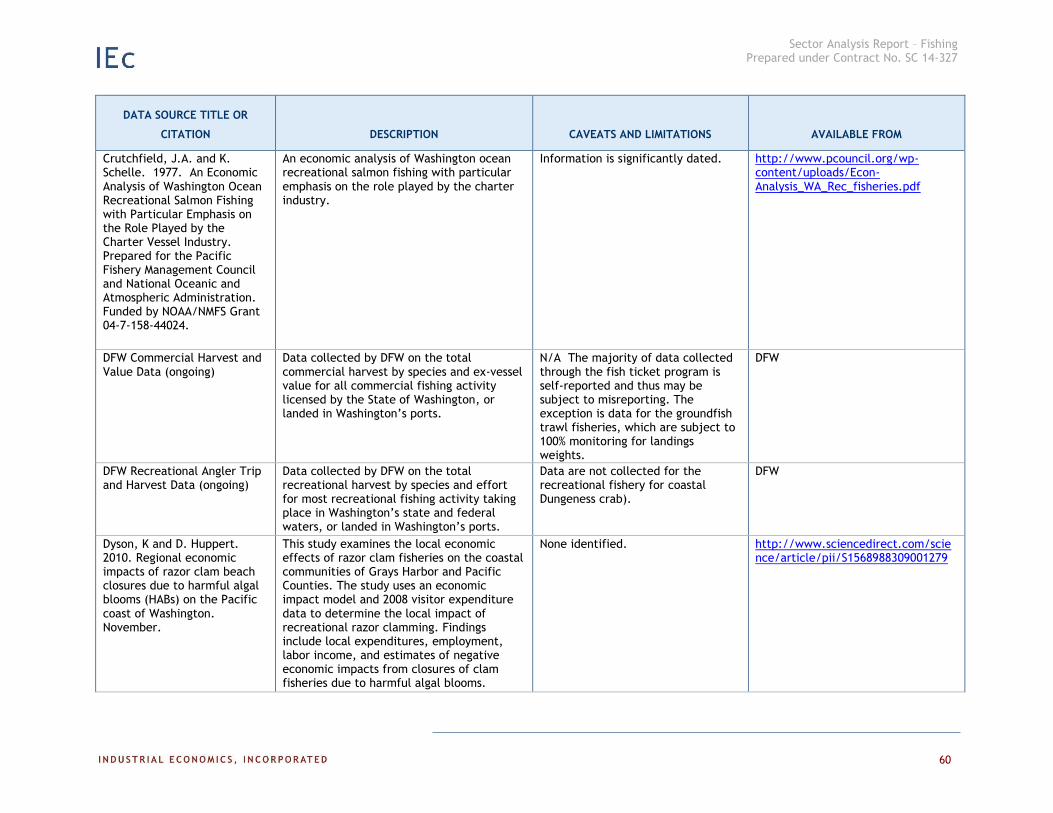
Sector Analysis Report – Fishing Prepared under Contract No. SC 14-327
60
DATA SOURCE TITLE OR
CITATION DESCRIPTION CAVEATS AND LIMITATIONS AVAILABLE FROM
Crutchfield, J.A. and K. Schelle. 1977. An Economic Analysis of Washington Ocean Recreational Salmon Fishing with Particular Emphasis on the Role Played by the Charter Vessel Industry. Prepared for the Pacific Fishery Management Council and National Oceanic and Atmospheric Administration. Funded by NOAA/NMFS Grant 04-7-158-44024.
An economic analysis of Washington ocean recreational salmon fishing with particular emphasis on the role played by the charter industry.
Information is significantly dated. http://www.pcouncil.org/wp-content/uploads/Econ-Analysis_WA_Rec_fisheries.pdf
DFW Commercial Harvest and Value Data (ongoing)
Data collected by DFW on the total commercial harvest by species and ex-vessel value for all commercial fishing activity licensed by the State of Washington, or landed in Washington’s ports.
N/A The majority of data collected through the fish ticket program is self-reported and thus may be subject to misreporting. The exception is data for the groundfish trawl fisheries, which are subject to 100% monitoring for landings weights.
DFW
DFW Recreational Angler Trip and Harvest Data (ongoing)
Data collected by DFW on the total recreational harvest by species and effort for most recreational fishing activity taking place in Washington’s state and federal waters, or landed in Washington’s ports.
Data are not collected for the recreational fishery for coastal Dungeness crab).
DFW
Dyson, K and D. Huppert. 2010. Regional economic impacts of razor clam beach closures due to harmful algal blooms (HABs) on the Pacific coast of Washington. November.
This study examines the local economic effects of razor clam fisheries on the coastal communities of Grays Harbor and Pacific Counties. The study uses an economic impact model and 2008 visitor expenditure data to determine the local impact of recreational razor clamming. Findings include local expenditures, employment, labor income, and estimates of negative economic impacts from closures of clam fisheries due to harmful algal blooms.
None identified. http://www.sciencedirect.com/science/article/pii/S1568988309001279
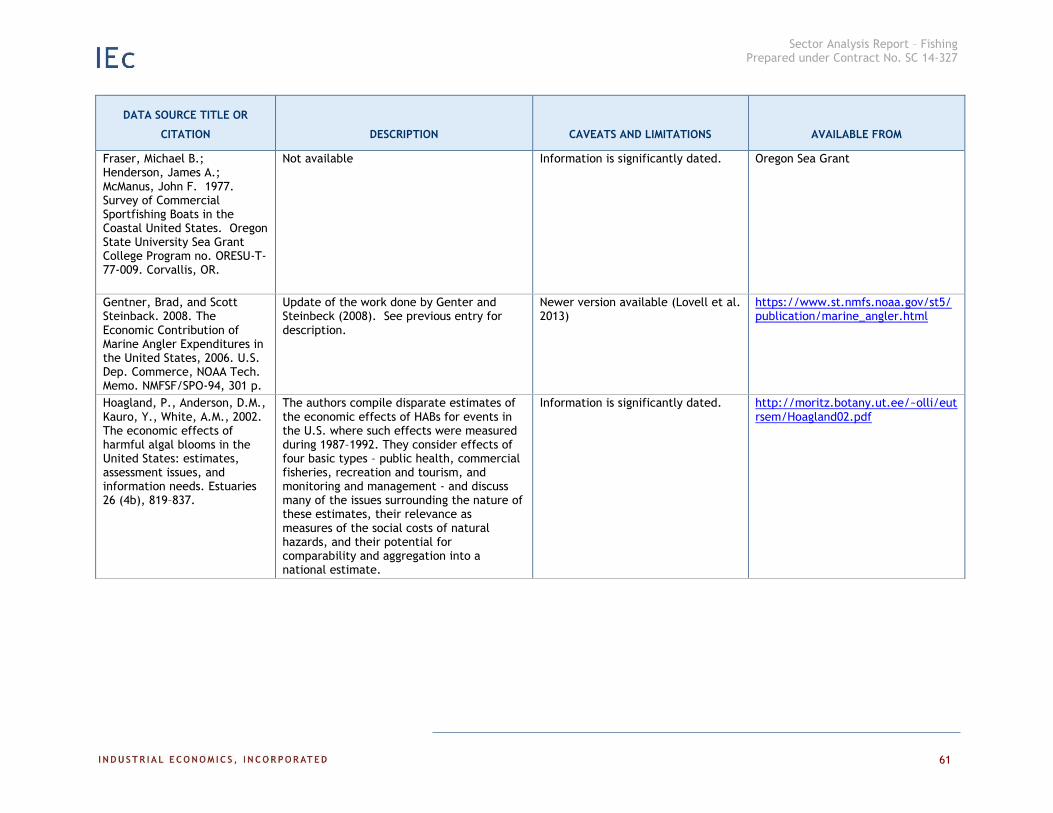
Sector Analysis Report – Fishing Prepared under Contract No. SC 14-327
61
DATA SOURCE TITLE OR
CITATION DESCRIPTION CAVEATS AND LIMITATIONS AVAILABLE FROM
Fraser, Michael B.; Henderson, James A.; McManus, John F. 1977. Survey of Commercial Sportfishing Boats in the Coastal United States. Oregon State University Sea Grant College Program no. ORESU-T-77-009. Corvallis, OR.
Not available Information is significantly dated. Oregon Sea Grant
Gentner, Brad, and Scott Steinback. 2008. The Economic Contribution of Marine Angler Expenditures in the United States, 2006. U.S. Dep. Commerce, NOAA Tech. Memo. NMFSF/SPO-94, 301 p.
Update of the work done by Genter and Steinbeck (2008). See previous entry for description.
Newer version available (Lovell et al. 2013)
https://www.st.nmfs.noaa.gov/st5/publication/marine_angler.html
Hoagland, P., Anderson, D.M., Kauro, Y., White, A.M., 2002. The economic effects of harmful algal blooms in the United States: estimates, assessment issues, and information needs. Estuaries 26 (4b), 819–837.
The authors compile disparate estimates of the economic effects of HABs for events in the U.S. where such effects were measured during 1987–1992. They consider effects of four basic types – public health, commercial fisheries, recreation and tourism, and monitoring and management - and discuss many of the issues surrounding the nature of these estimates, their relevance as measures of the social costs of natural hazards, and their potential for comparability and aggregation into a national estimate.
Information is significantly dated. http://moritz.botany.ut.ee/~olli/eutrsem/Hoagland02.pdf
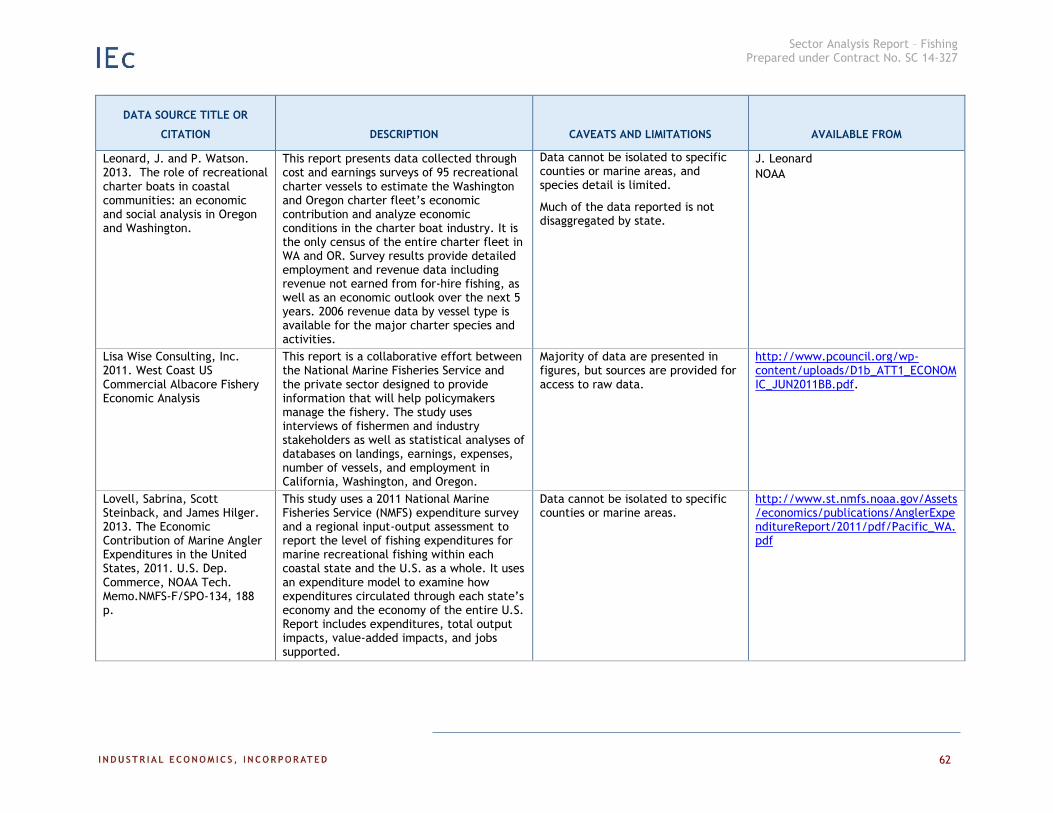
Sector Analysis Report – Fishing Prepared under Contract No. SC 14-327
62
DATA SOURCE TITLE OR
CITATION DESCRIPTION CAVEATS AND LIMITATIONS AVAILABLE FROM
Leonard, J. and P. Watson. 2013. The role of recreational charter boats in coastal communities: an economic and social analysis in Oregon and Washington.
This report presents data collected through cost and earnings surveys of 95 recreational charter vessels to estimate the Washington and Oregon charter fleet’s economic contribution and analyze economic conditions in the charter boat industry. It is the only census of the entire charter fleet in WA and OR. Survey results provide detailed employment and revenue data including revenue not earned from for-hire fishing, as well as an economic outlook over the next 5 years. 2006 revenue data by vessel type is available for the major charter species and activities.
Data cannot be isolated to specific counties or marine areas, and species detail is limited.
Much of the data reported is not disaggregated by state.
J. Leonard
NOAA
Lisa Wise Consulting, Inc. 2011. West Coast US Commercial Albacore Fishery Economic Analysis
This report is a collaborative effort between the National Marine Fisheries Service and the private sector designed to provide information that will help policymakers manage the fishery. The study uses interviews of fishermen and industry stakeholders as well as statistical analyses of databases on landings, earnings, expenses, number of vessels, and employment in California, Washington, and Oregon.
Majority of data are presented in figures, but sources are provided for access to raw data.
http://www.pcouncil.org/wp-content/uploads/D1b_ATT1_ECONOMIC_JUN2011BB.pdf.
Lovell, Sabrina, Scott Steinback, and James Hilger. 2013. The Economic Contribution of Marine Angler Expenditures in the United States, 2011. U.S. Dep. Commerce, NOAA Tech. Memo.NMFS-F/SPO-134, 188 p.
This study uses a 2011 National Marine Fisheries Service (NMFS) expenditure survey and a regional input-output assessment to report the level of fishing expenditures for marine recreational fishing within each coastal state and the U.S. as a whole. It uses an expenditure model to examine how expenditures circulated through each state’s economy and the economy of the entire U.S. Report includes expenditures, total output impacts, value-added impacts, and jobs supported.
Data cannot be isolated to specific counties or marine areas.
http://www.st.nmfs.noaa.gov/Assets/economics/publications/AnglerExpenditureReport/2011/pdf/Pacific_WA.pdf

Sector Analysis Report – Fishing Prepared under Contract No. SC 14-327
63
DATA SOURCE TITLE OR
CITATION DESCRIPTION CAVEATS AND LIMITATIONS AVAILABLE FROM
National Marine Fisheries Service. 2008. Inventory of For-Hire Data Collections in the United States and U.S. Territories.
This report develops an inventory of available information on fishing effort and catch by marine recreational anglers fishing on professionally licensed for-hire vessels (charter, guide, and large party boats). NOAA Fisheries’ objective was to provide a description of existing sources of data and data needs of for-hire fisheries in order to develop regional and national assessments of fish stocks and fisheries management. The report examines eight regions: Pacific Coast, Alaska, Pacific Islands, Caribbean, Gulf of Mexico and Florida Keys, South Atlantic, Mid-Atlantic, and North-Atlantic.
Data are not presented in the report, but it provides and discusses many resources.
http://www.countmyfish.noaa.gov/projects/downloads/Inventory_of%20For-Hire%20Methods.pdf
National Marine Fisheries Service. 2013. Fisheries of the United States 2012. Office of Science and Technology, Fisheries Statistics Division. Alan Lowther, editor. September.
This report presents 2012 data on U.S. commercial landings and processed fishery products. Report also includes some information on aquaculture production, as well as recreational fishing expenditures and their impact. Landings and production data are reported in detail by species and by state.
Data cannot be isolated to specific counties or marine areas, but some information is available by major sea port.
Reported commercial fishing data includes aquaculture products.
http://www.st.nmfs.noaa.gov/Assets/commercial/fus/fus12/FUS2012.pdf.
National Marine Fisheries Service. 2013. Fisheries of the United States 2012 – Regional Profile: Pacific. Office of Science and Technology, Fisheries Statistics Division. Alan Lowther, editor. September.
This section of the 2012 Fisheries of the United States report is focused on the Pacific Region, which is comprised of California, Oregon, and Washington. Landings and production data are reported in detail by species and by state.
Data cannot be isolated to specific counties or marine areas.
Reported commercial fishing data includes aquaculture products.
http://www.st.nmfs.noaa.gov/Assets/economics/documents/feus/2011/FEUS2011%20-%20Pacific.pdf
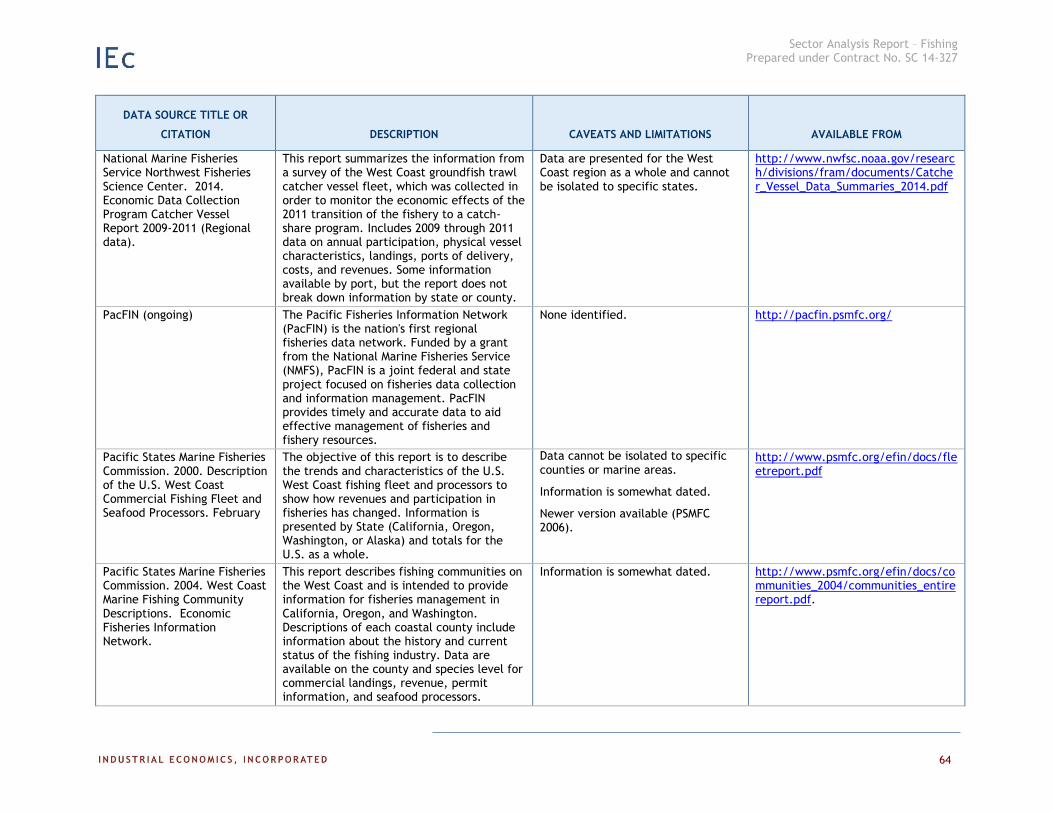
Sector Analysis Report – Fishing Prepared under Contract No. SC 14-327
64
DATA SOURCE TITLE OR
CITATION DESCRIPTION CAVEATS AND LIMITATIONS AVAILABLE FROM
National Marine Fisheries Service Northwest Fisheries Science Center. 2014. Economic Data Collection Program Catcher Vessel Report 2009-2011 (Regional data).
This report summarizes the information from a survey of the West Coast groundfish trawl catcher vessel fleet, which was collected in order to monitor the economic effects of the 2011 transition of the fishery to a catch-share program. Includes 2009 through 2011 data on annual participation, physical vessel characteristics, landings, ports of delivery, costs, and revenues. Some information available by port, but the report does not break down information by state or county.
Data are presented for the West Coast region as a whole and cannot be isolated to specific states.
http://www.nwfsc.noaa.gov/research/divisions/fram/documents/Catcher_Vessel_Data_Summaries_2014.pdf
PacFIN (ongoing) The Pacific Fisheries Information Network (PacFIN) is the nation's first regional fisheries data network. Funded by a grant from the National Marine Fisheries Service (NMFS), PacFIN is a joint federal and state project focused on fisheries data collection and information management. PacFIN provides timely and accurate data to aid effective management of fisheries and fishery resources.
None identified. http://pacfin.psmfc.org/
Pacific States Marine Fisheries Commission. 2000. Description of the U.S. West Coast Commercial Fishing Fleet and Seafood Processors. February
The objective of this report is to describe the trends and characteristics of the U.S. West Coast fishing fleet and processors to show how revenues and participation in fisheries has changed. Information is presented by State (California, Oregon, Washington, or Alaska) and totals for the U.S. as a whole.
Data cannot be isolated to specific counties or marine areas.
Information is somewhat dated.
Newer version available (PSMFC 2006).
http://www.psmfc.org/efin/docs/fleetreport.pdf
Pacific States Marine Fisheries Commission. 2004. West Coast Marine Fishing Community Descriptions. Economic Fisheries Information Network.
This report describes fishing communities on the West Coast and is intended to provide information for fisheries management in California, Oregon, and Washington. Descriptions of each coastal county include information about the history and current status of the fishing industry. Data are available on the county and species level for commercial landings, revenue, permit information, and seafood processors.
Information is somewhat dated. http://www.psmfc.org/efin/docs/communities_2004/communities_entirereport.pdf.
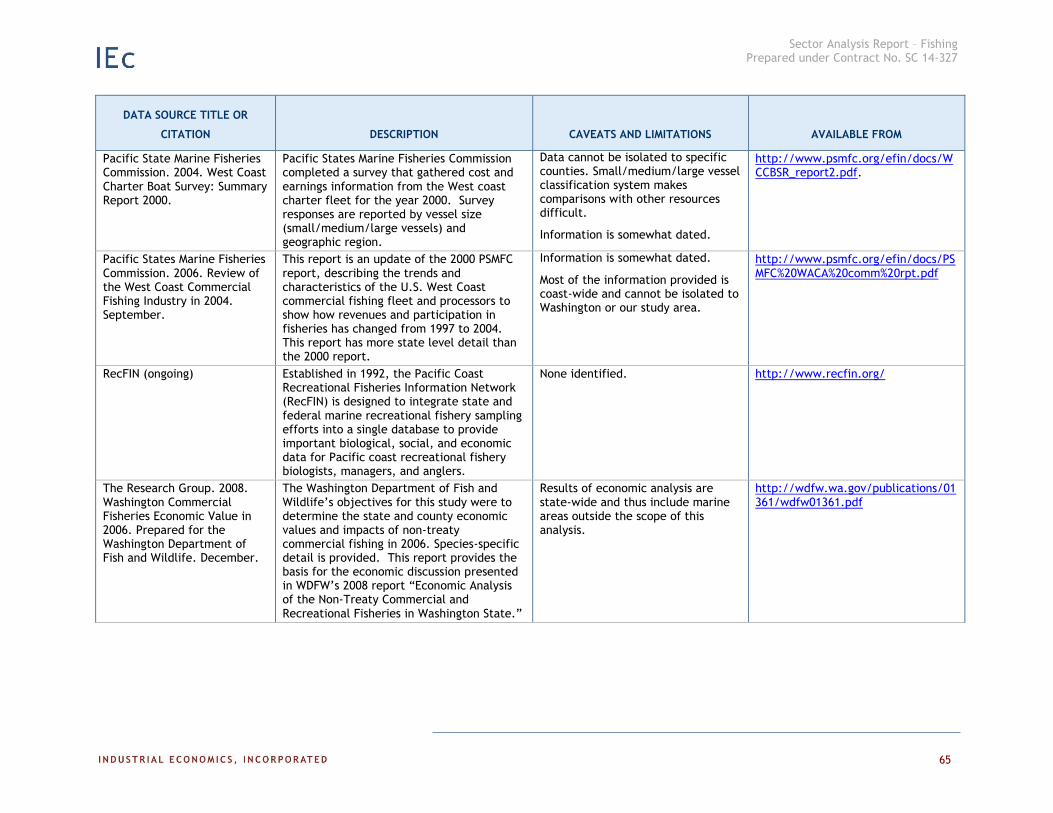
Sector Analysis Report – Fishing Prepared under Contract No. SC 14-327
65
DATA SOURCE TITLE OR
CITATION DESCRIPTION CAVEATS AND LIMITATIONS AVAILABLE FROM
Pacific State Marine Fisheries Commission. 2004. West Coast Charter Boat Survey: Summary Report 2000.
Pacific States Marine Fisheries Commission completed a survey that gathered cost and earnings information from the West coast charter fleet for the year 2000. Survey responses are reported by vessel size (small/medium/large vessels) and geographic region.
Data cannot be isolated to specific counties. Small/medium/large vessel classification system makes comparisons with other resources difficult.
Information is somewhat dated.
http://www.psmfc.org/efin/docs/WCCBSR_report2.pdf.
Pacific States Marine Fisheries Commission. 2006. Review of the West Coast Commercial Fishing Industry in 2004. September.
This report is an update of the 2000 PSMFC report, describing the trends and characteristics of the U.S. West Coast commercial fishing fleet and processors to show how revenues and participation in fisheries has changed from 1997 to 2004. This report has more state level detail than the 2000 report.
Information is somewhat dated.
Most of the information provided is coast-wide and cannot be isolated to Washington or our study area.
http://www.psmfc.org/efin/docs/PSMFC%20WACA%20comm%20rpt.pdf
RecFIN (ongoing) Established in 1992, the Pacific Coast Recreational Fisheries Information Network (RecFIN) is designed to integrate state and federal marine recreational fishery sampling efforts into a single database to provide important biological, social, and economic data for Pacific coast recreational fishery biologists, managers, and anglers.
None identified. http://www.recfin.org/
The Research Group. 2008. Washington Commercial Fisheries Economic Value in 2006. Prepared for the Washington Department of Fish and Wildlife. December.
The Washington Department of Fish and Wildlife’s objectives for this study were to determine the state and county economic values and impacts of non-treaty commercial fishing in 2006. Species-specific detail is provided. This report provides the basis for the economic discussion presented in WDFW’s 2008 report “Economic Analysis of the Non-Treaty Commercial and Recreational Fisheries in Washington State.”
Results of economic analysis are state-wide and thus include marine areas outside the scope of this analysis.
http://wdfw.wa.gov/publications/01361/wdfw01361.pdf

Sector Analysis Report – Fishing Prepared under Contract No. SC 14-327
66
DATA SOURCE TITLE OR
CITATION DESCRIPTION CAVEATS AND LIMITATIONS AVAILABLE FROM
Seattle Marine Business Coalition. 2011. Washington State Commercial Fishing Industry Total Economic Contribution. Prepared by Hans Radtke.
This report provides economic value estimates for fisheries omitted from the 2008 Washington Department of Fish and Wildlife Economic Analysis (WDFW 2008). Such omissions include tribal fisheries, distant water fisheries, and aquaculture. The Seattle Marine Business Coalition report collected species-specific information on harvest value and onshore landed value for these omitted fisheries as well as Washington’s other fisheries.
Data include elements of the industry that are outside the scope of this analysis (e.g., tribal fisheries, aquaculture, and distant water fisheries).
http://www.philipspublishing.com/smbc/attachments/SMBC%20Washington%20Total%20Commercial%20Fisheries%204.pdf.
Southwick Associates. 2006. The Relative Economic Contributions of U.S. Recreational and Commercial Fisheries
This report assesses the U.S. economic impacts of marine commercial and recreational fisheries. The data presented provides 2004 economic impacts including landings value, sales, income, jobs, and tax revenues by state. Some information on U.S. annual aquaculture production is provided as a comparison.
Economic impact data on recreational fishing taken directly from Steinback et al. 2004, which is now out of date (replaced by Lovell et al. 2013)
Data cannot be isolated to specific species, counties, or marine areas.
http://www.igfa.org/images/uploads/files/Economics_of_Fisheries_Harvests.pdf.
Steinback, Scott, Brad Gentner, and Jeremy Castle. 2004. The economic importance of marine angler expenditures in the United States. NOAA Prof. Paper NMFS 2, 169 p.
In 1998, the National Marine Fisheries Service (NMFS) began a series of marine angler expenditure surveys in the coastal regions of the U.S. to evaluate marine recreational fishing expenditures and the financial impacts of these expenditures in each region and the U.S. as a whole. In this report, the authors use the previously estimated expenditure estimates to assess the total financial impact of anglers’ saltwater expenditures. Estimates are provided for sales, income, employment, and tax impacts for each coastal state in the U.S.
Newer version available (Lovell et al. 2013)
http://permanent.access.gpo.gov/LPS108518/LPS108518/spo.nwr.noaa.gov/pp2.pdf
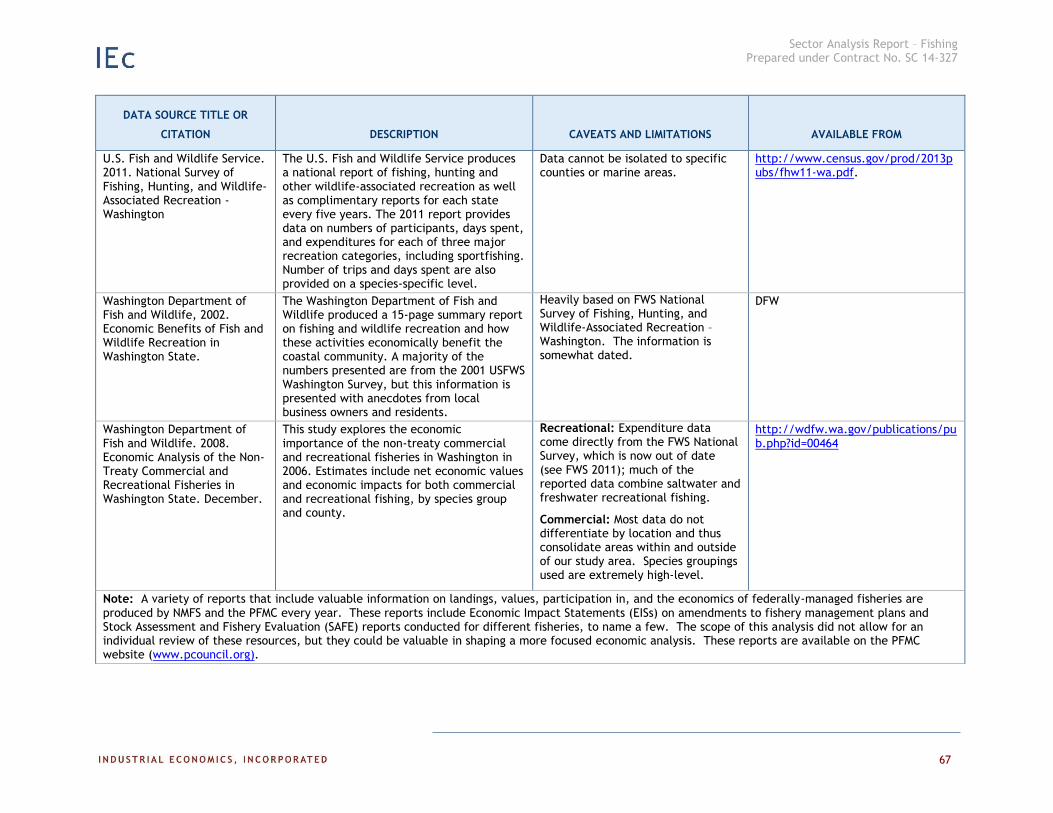
Sector Analysis Report – Fishing Prepared under Contract No. SC 14-327
67
DATA SOURCE TITLE OR
CITATION DESCRIPTION CAVEATS AND LIMITATIONS AVAILABLE FROM
U.S. Fish and Wildlife Service. 2011. National Survey of Fishing, Hunting, and Wildlife-Associated Recreation - Washington
The U.S. Fish and Wildlife Service produces a national report of fishing, hunting and other wildlife-associated recreation as well as complimentary reports for each state every five years. The 2011 report provides data on numbers of participants, days spent, and expenditures for each of three major recreation categories, including sportfishing. Number of trips and days spent are also provided on a species-specific level.
Data cannot be isolated to specific counties or marine areas.
http://www.census.gov/prod/2013pubs/fhw11-wa.pdf.
Washington Department of Fish and Wildlife, 2002. Economic Benefits of Fish and Wildlife Recreation in Washington State.
The Washington Department of Fish and Wildlife produced a 15-page summary report on fishing and wildlife recreation and how these activities economically benefit the coastal community. A majority of the numbers presented are from the 2001 USFWS Washington Survey, but this information is presented with anecdotes from local business owners and residents.
Heavily based on FWS National Survey of Fishing, Hunting, and Wildlife-Associated Recreation – Washington. The information is somewhat dated.
DFW
Washington Department of Fish and Wildlife. 2008. Economic Analysis of the Non-Treaty Commercial and Recreational Fisheries in Washington State. December.
This study explores the economic importance of the non-treaty commercial and recreational fisheries in Washington in 2006. Estimates include net economic values and economic impacts for both commercial and recreational fishing, by species group and county.
Recreational: Expenditure data come directly from the FWS National Survey, which is now out of date (see FWS 2011); much of the reported data combine saltwater and freshwater recreational fishing.
Commercial: Most data do not differentiate by location and thus consolidate areas within and outside of our study area. Species groupings used are extremely high-level.
http://wdfw.wa.gov/publications/pub.php?id=00464
Note: A variety of reports that include valuable information on landings, values, participation in, and the economics of federally-managed fisheries are produced by NMFS and the PFMC every year. These reports include Economic Impact Statements (EISs) on amendments to fishery management plans and Stock Assessment and Fishery Evaluation (SAFE) reports conducted for different fisheries, to name a few. The scope of this analysis did not allow for an individual review of these resources, but they could be valuable in shaping a more focused economic analysis. These reports are available on the PFMC website (www.pcouncil.org).
Sector Analysis Report – Fishing Prepared under Contract No. SC 14-327
68
DATA GAPS AND KEY ECONOMIC QUESTIONS
DATA GAPS
This report relies upon existing information to develop a characterization of the non-tribal
fishing industry in Washington’s Pacific coastal waters. Generally speaking, reliable data
quantifying harvest, effort, and value (in the case of commercial fishing) are readily
available. Through this process, however, we identified a number of gaps in the existing
information that limited our ability to develop a complete characterization of this sector.
These gaps may present a similar challenge for the state’s forthcoming economic
analysis. The most important data issues are described briefly below.
Employment data: Many fishermen are self-employed and thus are not captured
in traditional sources of employment statistics. This information is critical to
developing an accurate estimate of the economic impact of the industry.
Economic impacts of ocean-based commercial fishing: Previous studies have
provided information on the economic impact of commercial fishing in
Washington. However, most analyses have included components of the industry
outside the scope of interest (e.g., aquaculture, tribal fisheries and distant waters
fisheries). We found very little information that helps us understand the economic
impact of the specific segments of the commercial fishing industry that are of
interest in developing the MSP for Washington’s outer coast.
Economic impacts of ocean-based recreational fishing: Previous studies have
provided information on the economic impact of marine recreational fishing in
Washington. However, most analyses are conducted on a statewide basis, and
cannot be isolated to our study area/counties of interest. We found very little
information specifically focused on the economic impacts of recreational fishing
along Washington’s outer coast.
Processor data: Due to the expansive scope of the harvesting segment of the non-
tribal fishing industry, we were not able to develop a characterization of the
processing and distribution segment of the industry. Though we did identify some
data sources that provide information on this industry segment, further research is
needed to identify the extent to which detailed data are available to support the
economic analysis.
Recreational Dungeness crab fishery: DFW does not track effort or catch in the
outer coast’s recreational Dungeness crab fishery. Note, however, that this
segment is a very small contributor to the overall recreational Dungeness crab
fishery, and thus might not be critical to the economic analysis.
KEY ECONOMIC QUESTIO NS
A number of existing studies have examined the economic impacts of the commercial and
recreational fishing industry on the Washington economy. However, there are a number
of questions not thoroughly addressed by previous research that should be considered in
the design of the forthcoming economic analysis. These questions are described briefly
below.

Sector Analysis Report – Fishing Prepared under Contract No. SC 14-327
69
Definition of the potentially affected industry: What is the most appropriate way
to define and bound the fishing industry potentially affected by decisions made in
the marine spatial planning process? Should the focus remain on non-tribal
fisheries whose catch comes from Washington’s outer coast, or should the scope
of the analysis be expanded to provide a more complete understanding of the
potentially affected industry and its economic reach?
o Distant Waters Fisheries: To what extent do distant water fisheries (e.g.,
Washington-based vessels fishing in Alaska) generate revenues that are
brought into the Washington state economy? Should this activity be
included in the analysis?
o Tribal Fisheries: What value are tribal treaty fisheries bringing to the
Washington state economy? Should this activity be included in the
analysis?
Economic contribution of outer coastal fisheries: Nearly all available data on
economic impacts identified though the present process is reported at the state
level, and includes the aquaculture and/or tribal fishing industry. What economic
contributions are specifically made by the fisheries operating off Washington’s
outer coast?
Indirect services: How do/should we quantify services that are indirectly provided
by the fishing industry (e.g., the indirect benefits provided by a seafood
processing plant that purchases enough water from a public water supply system
to reduce the share of the system’s capital costs that must be borne by other
members of the community, or the indirect benefits to recreational boaters that
stem from dredging and other navigation improvement projects undertaken to
allow commercial fishing vessels to access fishing ports ).
Indirect recreational fishing value: Can/should we quantify the economic
contributions made to coastal communities when an individual’s planned fishing
trip results in the rest of his family visiting the coast, shopping, eating, and
contributing to the economy?
Community fabric/social value: How do/should we quantify or characterize the
non-monetary contributions made by members of the fishing industry to their
communities (e.g., through service on school boards, as volunteer firefighters,
etc.)?

Sector Analysis Report – Fishing Prepared under Contract No. SC 14-327
70
REFERENCES
American Sportfishing Association. 2013. Sport Fishing in America. January.
Bell, Kathleen P. Huppert, Daniel Johnson, Rebecca L. 2003. Willingness to Pay for
Local Coho Salmon Enhancement in Coastal Communities. Marine Resource
Economics.
Bureau of Ocean Energy Management. 2012. Identification of Outer Continental Shelf
Renewable Energy Space-Use Conflicts and Analysis of Potential Mitigation
Measures. OCS Study BOEM 2012-083. Prepared by Industrial Economics, Inc.
under BOEM contract M09PC00037.
Butler, K. C. Fryday, M. Gordon, Y. Ho, S. McKinney, M. Wallner and E. Watts. 2013.
University of Washington Environmental Management Certificate Program
Keystone Project. Washington’s Working Coast: An Analysis of the Washington
Pacific Coast Marine Resource-Based Economy
Census Quickfacts. 2014. Available at:
http://quickfacts.census.gov/qfd/states/53000.html, accessed on June 3, 2014.
Colgan, Charles S. 2007. A Guide to the Measurement of the Market Data for the Ocean
and Coastal Economy in the National Ocean Economics Program. Available at:
http://www.oceaneconomics.org/Market/, accessed on February 16, 2014.
Community Attributes Inc. 2013. Washington State Maritime Cluster. Economic Impact
Study. Prepared for the Economic Development Council of Seattle and King County.
Crutchfield, J.A. and K. Schelle. 1977. An Economic Analysis of Washington Ocean
Recreational Salmon Fishing with Particular Emphasis on the Role Played by the
Charter Vessel Industry. Prepared for the Pacific Fishery Management Council and
National Oceanic and Atmospheric Administration. Funded by NOAA/NMFS Grant
04-7-158-44024.
Dyson, Karen and Daniel Huppert. 2010. Regional economic impacts of razor clam beach
closures due to harmful algal blooms (HABs) on the Pacific coast of Washington.
Harmful Algae. Vol. 9(3): 264-271.
Fraser, Michael B.; Henderson, James A.; McManus, John F. 1977. Survey of
Commercial Sportfishing Boats in the coastal United States. Oregon State
University Sea Grant College Program no. ORESU-T-77-009. Corvallis, OR.
Gentner, Brad, and Scott Steinback. 2008. The Economic Contribution of Marine Angler
Expenditures in the United States, 2006. U.S. Dep. Commerce, NOAA Tech. Memo.
NMFSF/SPO-94, 301 p.
Hoagland, P., Anderson, D.M., Kauro, Y., White, A.M., 2002. The economic effects of
harmful algal blooms in the United States: estimates, assessment issues, and
information needs. Estuaries 26 (4b), 819–837.
Sector Analysis Report – Fishing Prepared under Contract No. SC 14-327
71
Leonard, J. and P. Watson. 2013. The role of recreational charter boats in coastal
communities: an economic and social analysis in Oregon and Washington.
Lisa Wise Consulting, Inc. 2011. West Coast US Commercial Albacore Fishery
Economic Analysis
Lovell, Sabrina, Scott Steinback, and James Hilger. 2013. The Economic Contribution of
Marine Angler Expenditures in the United States, 2011. U.S. Dep. Commerce,
NOAA Tech. Memo.NMFS-F/SPO-134, 188 p.
National Marine Fisheries Service (NMFS). 2008. Inventory of For-Hire Data
Collections in the United States and U.S. Territories.
National Marine Fisheries Service (NMFS). 2013a. Fisheries of the United States 2012.
Office of Science and Technology, Fisheries Statistics Division. Alan Lowther,
editor. September.
National Marine Fisheries Service (NMFS). 2013b. Fisheries of the United States 2012 –
Pacific Regional Profile. Office of Science and Technology, Fisheries Statistics
Division. Alan Lowther, editor. September.
National Marine Fisheries Service Northwest Fisheries Science Center. 2014. Economic
Data Collection Program Catcher Vessel Report 2009-2011 (Regional data).
National Oceanic and Atmospheric Administration Ocean Acidification Program (NOAA
OAP). 2014. Cancer Crabs. Available at
http://oceanacidification.noaa.gov/AreasofFocus/BiologicalResponse/CancerCrabs.a
spx, accessed on June 23, 2014.
National Oceanic and Atmospheric Administration Pacific Marine Environmental
Laboratory (NOAA PMEL). 2014. Ocean acidification’s impact on oysters and
other shellfish. Available at
http://www.pmel.noaa.gov/co2/story/Ocean+Acidification%27s+impact+on+oysters
+and+other+shellfish, accessed on June 23, 2014.
Northwest Indian Fisheries Commission. 2014. Rafeedie Decision. Available at
http://nwifc.org/about-us/shellfish/rafeedie-decision/, accessed on June 23, 2014.
Olympia Coast National Marine Sanctuary Intergovernmental Policy Council (OCNMS
IPC). 2008. IPC Condition Report Addendum: An overview of Tribal, state, and
federal co-management relationships in Washington.
Olympic Coast National Marine Sanctuary. 2014. Olympic Coast National Marine
Sanctuary website, available at: http://olympiccoast.noaa.gov/welcome.html,
accessed on August 12, 2014.
Pacific Fishery Management Council (PFMC). 2014. Review of 2013 Ocean Salmon
Fisheries: Stock assessment and fishery evaluation document for the Pacific coast
Salmon Fishery Management Plan. February.
Pacific States Marine Fisheries Commission (PSMFC). 2000. Description of the U.S.
West Coast Commercial Fishing Fleet and Seafood Processors. February
Sector Analysis Report – Fishing Prepared under Contract No. SC 14-327
72
Pacific States Marine Fisheries Commission (PSMFC). 2004. West Coast Marine Fishing
Community Descriptions
Pacific States Marine Fisheries Commission (PSMFC). 2006. Review of the West Coast
Commercial Fishing Industry in 2004. September.
Personal communication with Corey Niles, Washington Department of Fish and Wildlife,
May 1, 2014.
Personal communication with Dale Beasley, Columbia River Crab Fishermen’s
Association and Coalition of Coastal Fisheries, May 8, 2014 and July 11, 2014.
Personal communication with Dan Ayres, Washington Department of Fish and Wildlife,
May 1, 2014.
Personal communication with Dwight Eager, Bell Buoy Crab Company Incorporated,
May 8, 2014
Personal communication with Heather Reed, Washington Department of Fish and
Wildlife, May 1, 2014.
Personal communication with Katie Krueger, Staff Attorney, Quileute Tribe, July 12 and
October 28, 2014.
Personal communication with Larry Thevik, May 13, 2014 and July 15, 2014.
Personal communication with Lorna Wargo, Washington Department of Fish and
Wildlife, May 1, 2014.
Personal communication with Mark Cedergreen, Westport Charterboat Association, May
15, 2014.
Personal communication with Michele Culver, Washington Department of Fish and
Wildlife, May 1, 2014 and July 11, 2014.
The Research Group (TRG). 2008. Washington Commercial Fisheries Economic Value
in 2006. Prepared for the Washington Department of Fish and Wildlife. December.
Seattle Marine Business Coalition . 2011. Washington State Commercial Fishing Industry
Total Economic Contribution. Prepared by Hans Radtke.
Southwick Associates. 2006. The Relative Economic Contributions of U.S. Recreational
and Commercial Fisheries
State of Washington Office of the Governor. 2012. Executive Order 12-07:
Washington’s Response to Ocean Acidification. November 27.
Steinback, Scott, Brad Gentner, and Jeremy Castle. 2004. The economic importance of
marine angler expenditures in the United States. NOAA Prof. Paper NMFS 2, 169 p.
The Seattle Times. 2014. Sea Change: Lucrative Crab Industry in Danger. Available at
http://apps.seattletimes.com/reports/sea-change/2013/sep/11/alaska-crab-industry/,
accessed on June 23, 2014.
Sector Analysis Report – Fishing Prepared under Contract No. SC 14-327
73
United States Fish and Wildlife Service (FWS). 1998. National Survey of Fishing,
Hunting, and Wildlife-Associated Recreation - Washington.
United States Fish and Wildlife Service (FWS). 2003. National Survey of Fishing,
Hunting, and Wildlife-Associated Recreation - Washington.
United States Fish and Wildlife Service (FWS). 2008. National Survey of Fishing,
Hunting, and Wildlife-Associated Recreation - Washington.
United States Fish and Wildlife Service (FWS). 2011. National Survey of Fishing,
Hunting, and Wildlife-Associated Recreation - Washington.
United States Navy. Northwest Training and Testing EIS/OEIS Website. Available at:
www.nwtteis.com, accessed on June 4, 2014.
United States v. Washington, 384 F. Supp. 312 (W. D. Wash. at Tacoma, 1974); aff’d 573
F.2d 1123 (9th Cir. 1978) and aff’d sub nomen Washington State Commercial
Passenger Fishing Vessel Assn. et al. v..U.S. et al., 99 S.Ct. 3055 (1979).
United States v. Washington, 506 F. Supp 187, 208 (W.D. Wash. 1980); aff’d 694 F.2d
1374, 1381 (9th Cir. 1983)
United States v. Washington, 873 F. Supp. 1422 (W.D. Wash. 1994).
United States v. Washington, 135 F.3d 618 (9th Cir. 1998).
United States v. Washington, 898 F. Supp. 1453 (W.D. Wash. 1995).
United States v. Washington, 909 F. Supp. 787 (W. D. Wash. 1995).
United States v. Washington, 157 F.3d 630 (9th Cir. 1998).
Washington Department of Ecology (Ecology). 2001. Managing Washington’s Coast.
Washington State’s Coastal Zone Management Program. Publication 00-06-129.
February.
Washington Department of Ecology (Ecology). 2013. Marine Spatial Planning Website
News item. Public Comment Period Open for Pacific Coast Marine Spatial Plan.
July 16, 2013. Available at: http://www.msp.wa.gov/public-comment-period-open-
for-marine-spatial-plan/, accessed on June 4, 2014.
Washington Department of Ecology (Ecology). 2014. Marine Spatial Plan for
Washington’s Pacific Coast: Summary of SEPA Scoping and Response to
Comments. January 2014. Available at: http://www.msp.wa.gov/wp-
content/uploads/2014/01/MSP_scoping_summary_2014.pdf, accessed on June 4,
2014.
Washington Department of Fish and Wildlife (DFW), 2002. Economic Benefits of Fish
and Wildlife Recreation in Washington State.
Washington Department of Fish and Wildlife (DFW). 2008. Economic Analysis of the
Non-Treaty Commercial and Recreational Fisheries in Washington State. December.
Sector Analysis Report – Fishing Prepared under Contract No. SC 14-327
74
Washington Department of Fish and Wildlife (DFW). 2014a. Fishing and Shellfishing:
Recreational Crab Fishing. Available at
http://wdfw.wa.gov/fishing/shellfish/crab/estimates.html, accessed on June 23, 2014.
Washington Department of Fish and Wildlife (DFW). 2014b. Fishing and Shellfishing:
Albacore Tuna, Recreational Fishery. Available at
http://wdfw.wa.gov/fishing/tuna/recreational.html, accessed on June 23, 2014.
Washington Department of Fish and Wildlife (DFW). 2014c. Fishing and Shellfishing:
Commercial, Coastal Dungeness Crab Fishery. Available at
http://wdfw.wa.gov/fishing/commercial/crab/coastal/, accessed on June 23, 2014.
Washington Department of Fish and Wildlife (DFW). 2014d. Fishing and Shellfishing:
Razor Clams, Recreational Razor Clams. Available at
http://wdfw.wa.gov/fishing/shellfish/razorclams/, accessed on June 24, 2014.
Washington Department of Fish and Wildlife (DFW). 2014e. Licensing & Permits:
Commercial Licensing, Licensing Requirements for Charter Boats and Fishing
Guides. Available at http://wdfw.wa.gov/licensing/commercial/charter_guides.html,
accessed on June 24, 2014.
Washington Department of Natural Resource (DNR). 2014. Marine Spatial Planning
Mapping Application. Available at https://fortress.wa.gov/dnr/mspmaps/index.html,
accessed on June 23, 2014.
Washington State Recreation and Conservation Office (WRCO). 2014. Salmon
Recovery in Washington. Available at
http://www.rco.wa.gov/salmon_recovery/index.shtml, accessed on August 7, 2014.
Washington State Blue Ribbon Panel on Ocean Acidification. 2012. Ocean
Acidification: From Knowledge to Action, Washington State’s Strategic Response.
H. Adelsman and L. Whitely Binder (eds). Washington Department of Ecology,
Olympia, Washington. Publication no. 12-01-015.

Sector Analysis Report – Fishing Prepared under Contract No. SC 14-327
APPENDIX A
SUMMARY OF EXPERT INTERVIEWS

Sector Analysis Report – Fishing Prepared under Contract No. SC 14-327
A-1
CONTACT NAME (AFFILIATION) DATE OF INTERVIEW CONTACT INFORMATION MODE OF CONTACT
Michele Culver (WA Dept. of Fish and Wildlife, WCMAC)
May 1, 2014 Regional Director, South Sound and Olympic Peninsula Washington Department of Fish and Wildlife 48 Devonshire Road Montesano, WA 98563 Phone: 360-249-4628 ex 1211 E-mail: [email protected]
In person
Corey Niles (WA Dept. of Fish and Wildlife)
May 1, 2014 Coastal Marine Policy Lead Washington Department of Fish and Wildlife Montesano, WA 98563 Phone: 360-249-1223 E-mail: [email protected]
In person
Heather Reed (WA Dept. of Fish and Wildlife)
May 1, 2014 Coastal Marine Resources Policy Coordinator Washington Department of Fish and Wildlife Phone: 360-249-1202 E-mail: [email protected]
In person
Lorna Wargo (WA Dept. of Fish and Wildlife)
May 1, 2014 Washington Department of Fish and Wildlife 48 Devonshire Road Montesano, WA 98563 Phone: 360-249-1221 (office) Mobile (new): 360-591-5872 (new mobile number) 360-489-4679 (old mobile number) E-mail: [email protected]
In person
Daniel Ayres (WA Dept. of Fish and Wildlife)
May 1, 2014 Coastal Shellfish Manager Washington Department of Fish and Wildlife 48 Devonshire Road Montesano, WA 98563 360-249-4628 ext. 209 Mobile 360-470-3557 E-mail: [email protected]
In person
Dale Beasley (Columbia River Crab Fisherman’s Association and Coalition of Coastal Fisheries, WCMAC)
May 8, 2014 President Columbia River Crab Fishermen’s Association and Coalition of Coastal Fisheries P.O. Box 461 Ilwaco, WA 98624 Phone: 360-642-3942 (h) 360-360-0096 (c) E-mail: [email protected]
In person
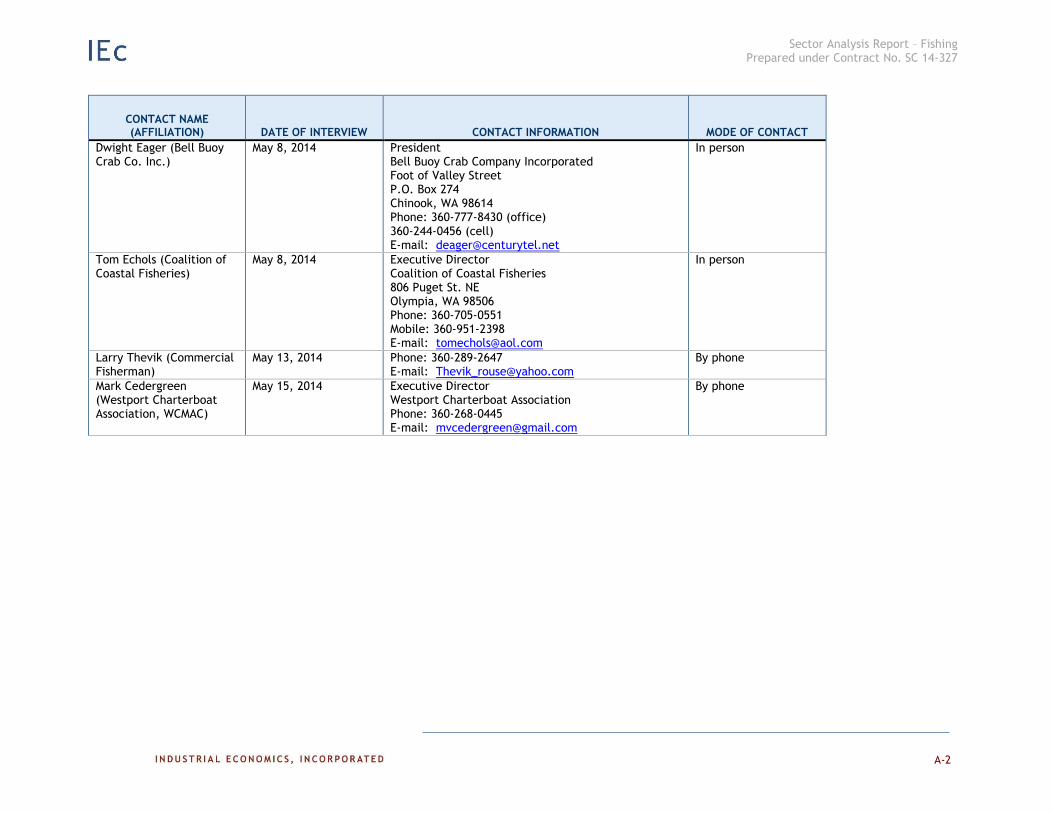
Sector Analysis Report – Fishing Prepared under Contract No. SC 14-327
A-2
CONTACT NAME (AFFILIATION) DATE OF INTERVIEW CONTACT INFORMATION MODE OF CONTACT
Dwight Eager (Bell Buoy Crab Co. Inc.)
May 8, 2014 President Bell Buoy Crab Company Incorporated Foot of Valley Street P.O. Box 274 Chinook, WA 98614 Phone: 360-777-8430 (office) 360-244-0456 (cell) E-mail: [email protected]
In person
Tom Echols (Coalition of Coastal Fisheries)
May 8, 2014 Executive Director Coalition of Coastal Fisheries 806 Puget St. NE Olympia, WA 98506 Phone: 360-705-0551 Mobile: 360-951-2398 E-mail: [email protected]
In person
Larry Thevik (Commercial Fisherman)
May 13, 2014 Phone: 360-289-2647 E-mail: [email protected]
By phone
Mark Cedergreen (Westport Charterboat Association, WCMAC)
May 15, 2014 Executive Director Westport Charterboat Association Phone: 360-268-0445 E-mail: [email protected]
By phone
Sector Analysis Report – Fishing Prepared under Contract No. SC 14-327
APPENDIX B
COMMERCIAL FISHERIES - LANDINGS AND EX-VESSEL VALUE DATA
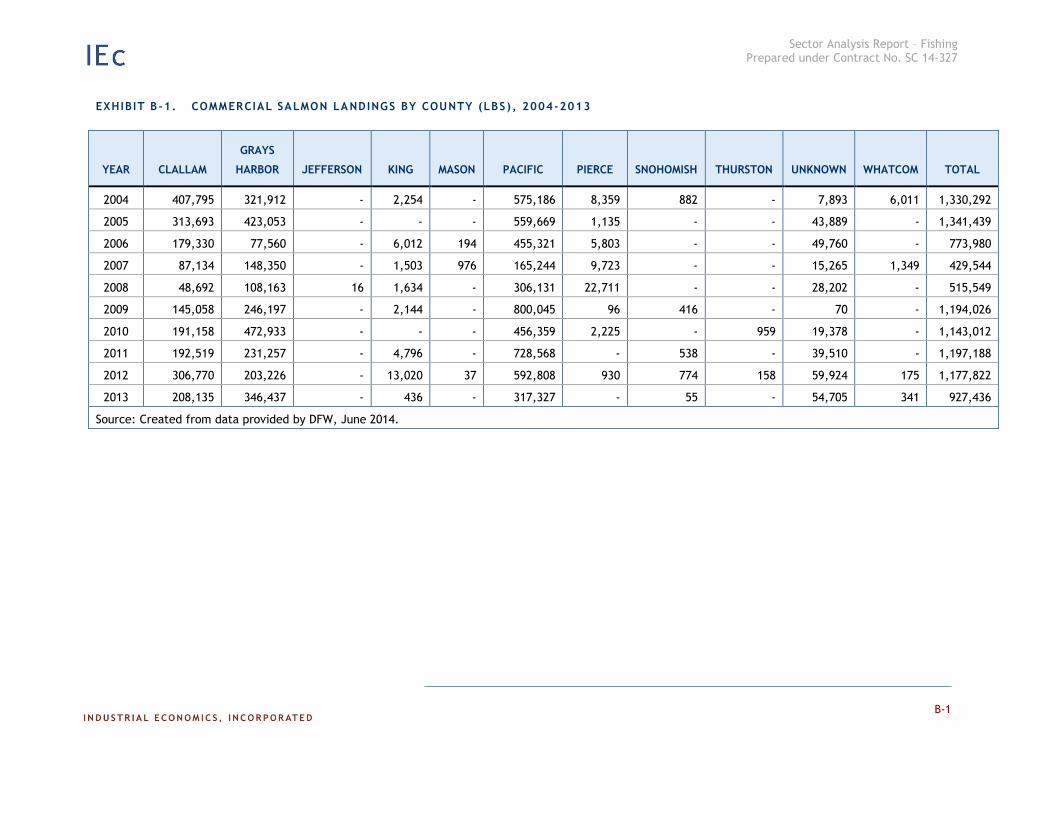
Sector Analysis Report – Fishing Prepared under Contract No. SC 14-327
ter Text].
B-1
EXHIBIT B -1. COMMERCIAL SALMON LA NDINGS BY COUNTY (LBS) , 2004-2013
YEAR CLALLAM
GRAYS
HARBOR JEFFERSON KING MASON PACIFIC PIERCE SNOHOMISH THURSTON UNKNOWN WHATCOM TOTAL
2004 407,795 321,912 - 2,254 - 575,186 8,359 882 - 7,893 6,011 1,330,292
2005 313,693 423,053 - - - 559,669 1,135 - - 43,889 - 1,341,439
2006 179,330 77,560 - 6,012 194 455,321 5,803 - - 49,760 - 773,980
2007 87,134 148,350 - 1,503 976 165,244 9,723 - - 15,265 1,349 429,544
2008 48,692 108,163 16 1,634 - 306,131 22,711 - - 28,202 - 515,549
2009 145,058 246,197 - 2,144 - 800,045 96 416 - 70 - 1,194,026
2010 191,158 472,933 - - - 456,359 2,225 - 959 19,378 - 1,143,012
2011 192,519 231,257 - 4,796 - 728,568 - 538 - 39,510 - 1,197,188
2012 306,770 203,226 - 13,020 37 592,808 930 774 158 59,924 175 1,177,822
2013 208,135 346,437 - 436 - 317,327 - 55 - 54,705 341 927,436
Source: Created from data provided by DFW, June 2014.
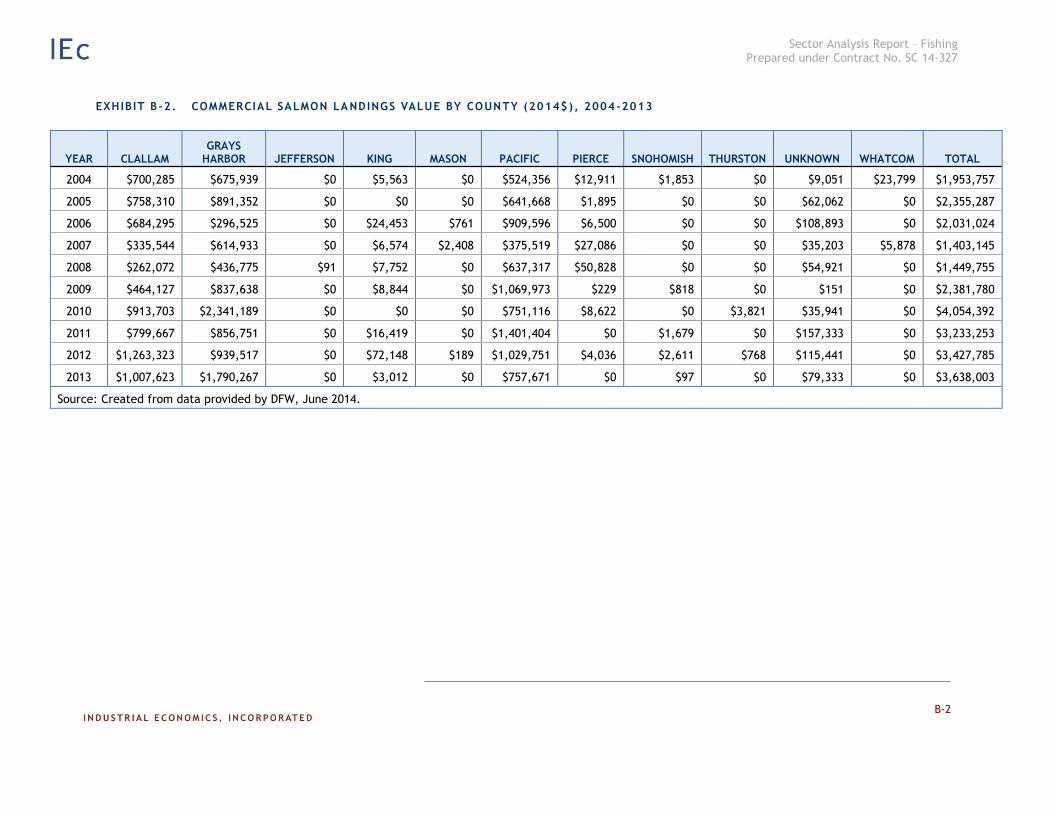
Sector Analysis Report – Fishing Prepared under Contract No. SC 14-327
oter Text]
B-2
EXHIBIT B -2. COMMERCIAL SALMON LA NDINGS VALUE BY COUNTY (2014$), 2004-2013
YEAR CLALLAM GRAYS
HARBOR JEFFERSON KING MASON PACIFIC PIERCE SNOHOMISH THURSTON UNKNOWN WHATCOM TOTAL
2004 $700,285 $675,939 $0 $5,563 $0 $524,356 $12,911 $1,853 $0 $9,051 $23,799 $1,953,757
2005 $758,310 $891,352 $0 $0 $0 $641,668 $1,895 $0 $0 $62,062 $0 $2,355,287
2006 $684,295 $296,525 $0 $24,453 $761 $909,596 $6,500 $0 $0 $108,893 $0 $2,031,024
2007 $335,544 $614,933 $0 $6,574 $2,408 $375,519 $27,086 $0 $0 $35,203 $5,878 $1,403,145
2008 $262,072 $436,775 $91 $7,752 $0 $637,317 $50,828 $0 $0 $54,921 $0 $1,449,755
2009 $464,127 $837,638 $0 $8,844 $0 $1,069,973 $229 $818 $0 $151 $0 $2,381,780
2010 $913,703 $2,341,189 $0 $0 $0 $751,116 $8,622 $0 $3,821 $35,941 $0 $4,054,392
2011 $799,667 $856,751 $0 $16,419 $0 $1,401,404 $0 $1,679 $0 $157,333 $0 $3,233,253
2012 $1,263,323 $939,517 $0 $72,148 $189 $1,029,751 $4,036 $2,611 $768 $115,441 $0 $3,427,785
2013 $1,007,623 $1,790,267 $0 $3,012 $0 $757,671 $0 $97 $0 $79,333 $0 $3,638,003
Source: Created from data provided by DFW, June 2014.

Sector Analysis Report – Fishing Prepared under Contract No. SC 14-327
ter Text].
B-3
EXHIBIT B -3. COMMERCIAL SALMON (CHINOOK AND COHO) NON-TRIBAL GILLNET HARVEST BY
COASTAL ESTUARY (NUMBER OF FISH), 2003-2013
YEAR
CHINOOK SALMON COHO SALMON
GRAYS HARBOR WILLAPA BAY GRAYS HARBOR WILLAPA BAY
2003 295 7,268 6,623 66,470
2004 183 4,349 5,231 16,533
2005 379 6,523 3,073 49,001
2006 195 12,334 649 19,948
2007 514 4,112 1,687 8,218
2008 717 3,595 7,783 16,699
2009
1,193 6,868 561 75,417
2010
1,495 6,903 3,990 28,568
2011
2,121 17,059 3,628 48,173
2012
1,579 7,510 10,350 25,891
2013 85 11,432 5,941 11,545
Source: Based on data provided in PFMC 2014.
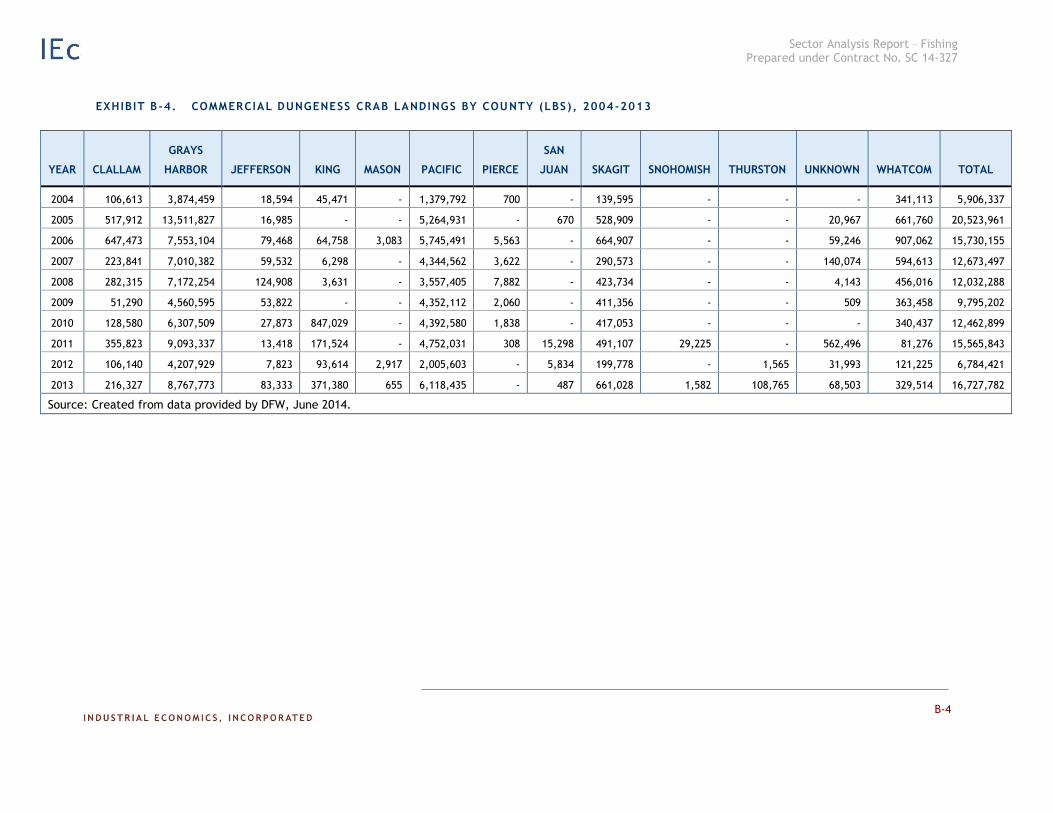
Sector Analysis Report – Fishing Prepared under Contract No. SC 14-327
ter Text].
B-4
EXHIBIT B -4. COMMERCIAL DUNGENESS CRAB LANDINGS BY COUNTY (LBS), 2004-2013
YEAR CLALLAM
GRAYS
HARBOR JEFFERSON KING MASON PACIFIC PIERCE
SAN
JUAN SKAGIT SNOHOMISH THURSTON UNKNOWN WHATCOM TOTAL
2004 106,613 3,874,459 18,594 45,471 - 1,379,792 700 - 139,595 - - - 341,113 5,906,337
2005 517,912 13,511,827 16,985 - - 5,264,931 - 670 528,909 - - 20,967 661,760 20,523,961
2006 647,473 7,553,104 79,468 64,758 3,083 5,745,491 5,563 - 664,907 - - 59,246 907,062 15,730,155
2007 223,841 7,010,382 59,532 6,298 - 4,344,562 3,622 - 290,573 - - 140,074 594,613 12,673,497
2008 282,315 7,172,254 124,908 3,631 - 3,557,405 7,882 - 423,734 - - 4,143 456,016 12,032,288
2009 51,290 4,560,595 53,822 - - 4,352,112 2,060 - 411,356 - - 509 363,458 9,795,202
2010 128,580 6,307,509 27,873 847,029 - 4,392,580 1,838 - 417,053 - - - 340,437 12,462,899
2011 355,823 9,093,337 13,418 171,524 - 4,752,031 308 15,298 491,107 29,225 - 562,496 81,276 15,565,843
2012 106,140 4,207,929 7,823 93,614 2,917 2,005,603 - 5,834 199,778 - 1,565 31,993 121,225 6,784,421
2013 216,327 8,767,773 83,333 371,380 655 6,118,435 - 487 661,028 1,582 108,765 68,503 329,514 16,727,782
Source: Created from data provided by DFW, June 2014.

Sector Analysis Report – Fishing Prepared under Contract No. SC 14-327
oter Text]
B-5
EXHIBIT B -5. COMMERCIAL DUNGENESS CRAB LANDINGS VALUE BY COUNTY (2014$), 2004-2013
YEAR CLALLAM
GRAYS
HARBOR JEFFERSON KING MASON PACIFIC PIERCE
SAN
JUAN SKAGIT SNOHOMISH THURSTON UNKNOWN WHATCOM TOTAL
2004 $219,546 $8,617,025 $55,608 $122,360 $0 $2,956,381 $1,689 $0 $375,199 $0 $0 $0 $970,367 $13,318,175
2005 $850,924 $22,629,161 $45,723 $0 $0 $8,751,571 $0 $1,958 $1,108,567 $0 $0 $40,090 $1,532,497 $34,960,491
2006 $1,245,383 $13,840,385 $214,998 $174,439 $6,948 $10,404,479 $11,895 $0 $1,512,886 $0 $0 $130,781 $2,210,321 $29,752,517
2007 $563,563 $17,497,017 $241,713 $23,824 $0 $10,629,596 $9,802 $0 $942,111 $0 $0 $313,453 $2,026,289 $32,247,368
2008 $804,520 $20,479,121 $518,500 $16,704 $0 $8,342,234 $39,244 $0 $1,456,284 $0 $0 $12,852 $1,678,434 $33,347,892
2009 $124,956 $11,754,163 $212,028 $0 $0 $9,019,789 $6,724 $0 $1,321,823 $0 $0 $885 $1,304,233 $23,744,601
2010 $261,453 $16,558,463 $105,399 $2,069,265 $0 $9,481,617 $5,784 $0 $1,357,743 $0 $0 $0 $1,136,892 $30,976,616
2011 $1,090,417 $28,928,782 $51,829 $652,429 $0 $12,967,165 $1,003 $69,994 $1,871,748 $143,387 $0 $2,178,470 $365,050 $48,320,273
2012 $397,974 $16,383,516 $41,532 $415,991 $11,162 $6,774,141 $0 $25,582 $867,825 $0 $7,148 $133,903 $537,498 $25,596,273
2013 $607,475 $24,947,003 $325,577 $1,346,720 $1,983 $16,658,048 $0 $2,703 $2,348,678 $4,517 $436,116 $230,800 $1,246,442 $48,156,063
Source: Created from data provided by DFW, June 2014.
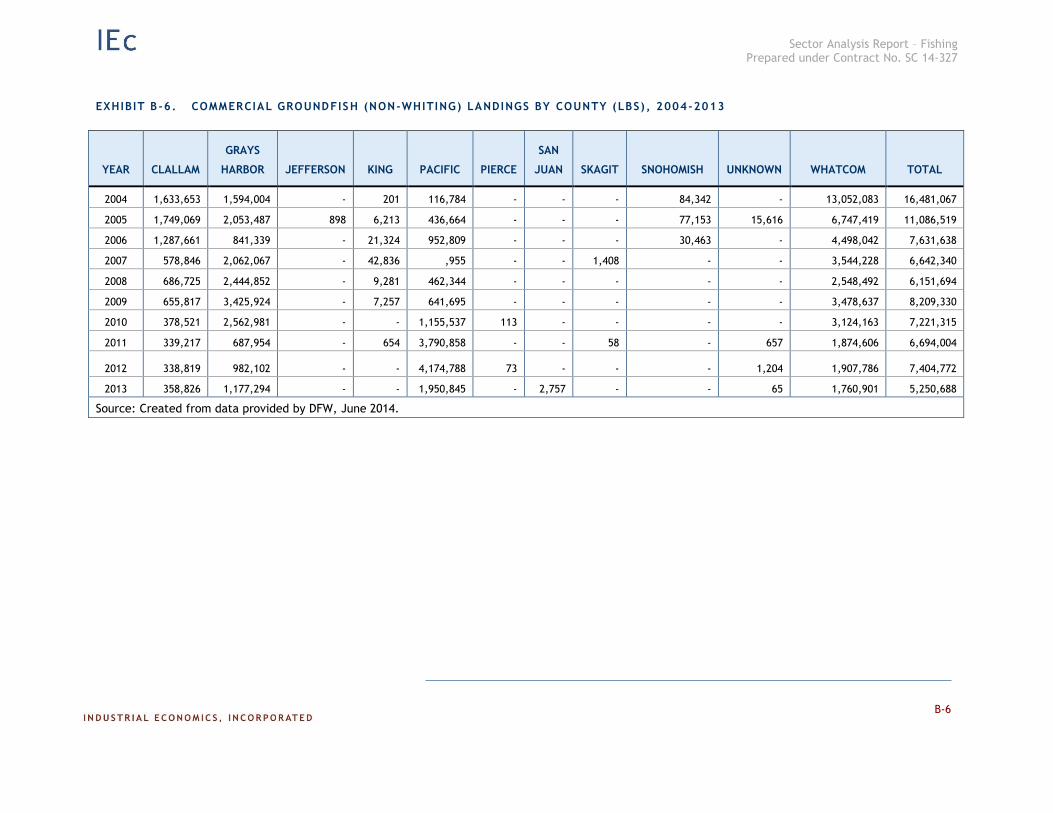
Sector Analysis Report – Fishing Prepared under Contract No. SC 14-327
oter Text]
B-6
EXHIBIT B -6. COMMERCIAL GROUNDFISH (NON-WHITING) LANDINGS BY COUNTY (LBS) , 2004-2013
YEAR CLALLAM
GRAYS
HARBOR JEFFERSON KING PACIFIC PIERCE
SAN
JUAN SKAGIT SNOHOMISH UNKNOWN WHATCOM TOTAL
2004 1,633,653 1,594,004 - 201 116,784 - - - 84,342 - 13,052,083 16,481,067
2005 1,749,069 2,053,487 898 6,213 436,664 - - - 77,153 15,616 6,747,419 11,086,519
2006 1,287,661 841,339 - 21,324 952,809 - - - 30,463 - 4,498,042 7,631,638
2007 578,846 2,062,067 - 42,836 ,955 - - 1,408 - - 3,544,228 6,642,340
2008 686,725 2,444,852 - 9,281 462,344 - - - - - 2,548,492 6,151,694
2009 655,817 3,425,924 - 7,257 641,695 - - - - - 3,478,637 8,209,330
2010 378,521 2,562,981 - - 1,155,537 113 - - - - 3,124,163 7,221,315
2011 339,217 687,954 - 654 3,790,858 - - 58 - 657 1,874,606 6,694,004
2012 338,819 982,102 - - 4,174,788 73 - - - 1,204 1,907,786 7,404,772
2013 358,826 1,177,294 - - 1,950,845 - 2,757 - - 65 1,760,901 5,250,688
Source: Created from data provided by DFW, June 2014.

Sector Analysis Report – Fishing Prepared under Contract No. SC 14-327
oter Text]
B-7
EXHIBIT B -7. COMMERCIAL GROUNDFISH (NON-WHITING) LANDINGS VALUE BY COUNTY (2014$), 2004-2013
YEAR CLALLAM
GRAYS
HARBOR JEFFERSON KING PACIFIC PIERCE
SAN
JUAN SKAGIT SNOHOMISH UNKNOWN WHATCOM TOTAL
2004 $1,651,578 $1,606,154 $0 $122 $162,615 $0 $0 $0 $172,455 $0 $6,405,125 $9,998,049
2005 $1,481,263 $1,772,262 $1,595 $12,204 $781,883 $0 $0 $0 $186,161 $25,724 $4,862,356 $9,123,448
2006 $1,370,312 $752,544 $0 $55,037 $1,598,450 $0 $0 $0 $82,154 $0 $4,664,528 $8,523,024
2007 $1,091,800 $1,124,566 $0 $114,237 $742,491 $0 $0 $2,639 $0 $0 $3,223,497 $6,299,230
2008 $969,205 $1,598,712 $0 $32,177 $1,055,372 $0 $0 $0 $0 $0 $2,738,279 $6,393,744
2009 $1,216,327 $1,804,649 $0 $26,566 $1,354,567 $0 $0 $0 $0 $0 $2,957,463 $7,359,572
2010 $968,466 $1,260,842 $0 $0 $3,085,550 $179 $0 $0 $0 $0 $2,107,668 $7,422,705
2011 $1,151,218 $956,372 $0 $1,543 $5,762,738 $0 $0 $60 $0 $1,464 $2,305,729 $10,179,125
2012 $866,851 $1,144,586 $0 $0 $3,335,887 $118 $0 $0 $0 $2,271 $1,755,574 $7,105,286
2013 $628,570 $691,358 $0 $0 $2,087,810 $0 $5,934 $0 $0 $99 $1,719,569 $5,133,339
Source: Created from data provided by DFW, June 2014.
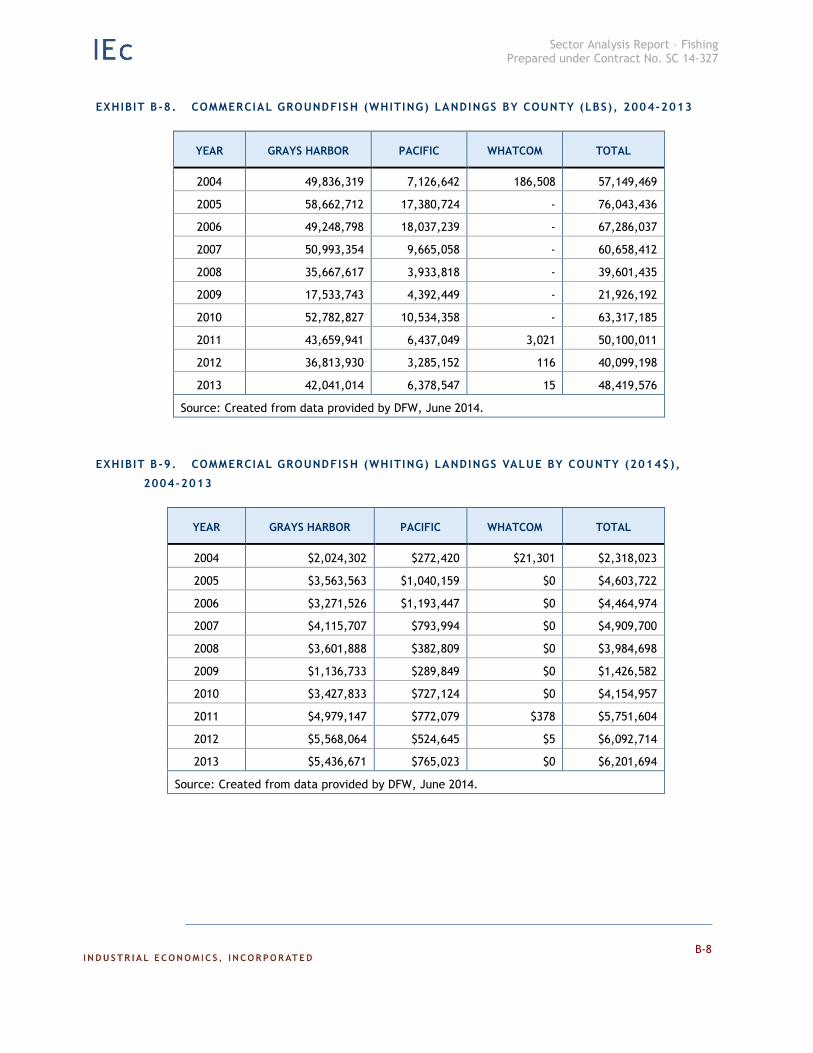
Sector Analysis Report – Fishing Prepared under Contract No. SC 14-327
ter Text].
B-8
EXHIBIT B -8. COMMERCIAL GROUNDFISH (WHITING) LANDINGS BY COUNTY (LBS), 2004-2013
YEAR GRAYS HARBOR PACIFIC WHATCOM TOTAL
2004 49,836,319 7,126,642 186,508 57,149,469
2005 58,662,712 17,380,724 - 76,043,436
2006 49,248,798 18,037,239 - 67,286,037
2007 50,993,354 9,665,058 - 60,658,412
2008 35,667,617 3,933,818 - 39,601,435
2009 17,533,743 4,392,449 - 21,926,192
2010 52,782,827 10,534,358 - 63,317,185
2011 43,659,941 6,437,049 3,021 50,100,011
2012 36,813,930 3,285,152 116 40,099,198
2013 42,041,014 6,378,547 15 48,419,576
Source: Created from data provided by DFW, June 2014.
EXHIBIT B -9. COMMERCIAL GROUNDFISH (WHITING) LANDINGS VALUE BY COUNTY (2014$),
2004-2013
YEAR GRAYS HARBOR PACIFIC WHATCOM TOTAL
2004 $2,024,302 $272,420 $21,301 $2,318,023
2005 $3,563,563 $1,040,159 $0 $4,603,722
2006 $3,271,526 $1,193,447 $0 $4,464,974
2007 $4,115,707 $793,994 $0 $4,909,700
2008 $3,601,888 $382,809 $0 $3,984,698
2009 $1,136,733 $289,849 $0 $1,426,582
2010 $3,427,833 $727,124 $0 $4,154,957
2011 $4,979,147 $772,079 $378 $5,751,604
2012 $5,568,064 $524,645 $5 $6,092,714
2013 $5,436,671 $765,023 $0 $6,201,694
Source: Created from data provided by DFW, June 2014.
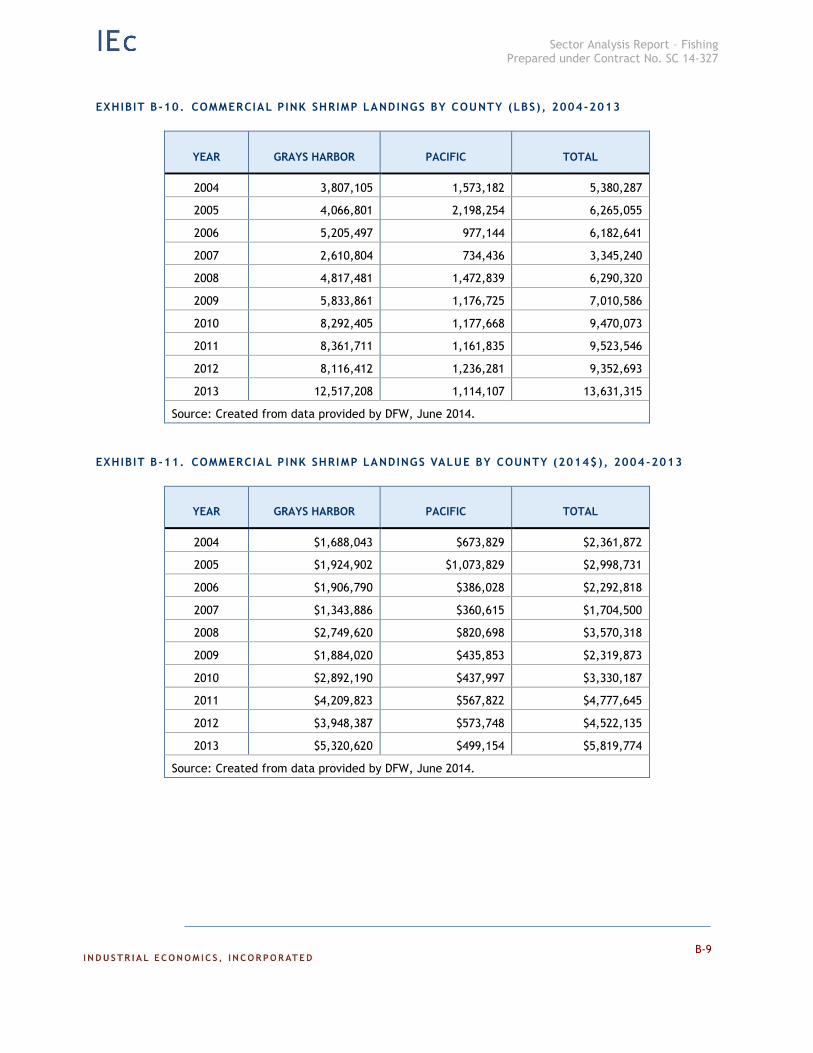
Sector Analysis Report – Fishing Prepared under Contract No. SC 14-327
oter Text]
B-9
EXHIBIT B -10. COMMERCIAL PINK SHRIMP LANDINGS BY COUNTY (LBS), 2004-2013
YEAR GRAYS HARBOR PACIFIC TOTAL
2004 3,807,105 1,573,182 5,380,287
2005 4,066,801 2,198,254 6,265,055
2006 5,205,497 977,144 6,182,641
2007 2,610,804 734,436 3,345,240
2008 4,817,481 1,472,839 6,290,320
2009 5,833,861 1,176,725 7,010,586
2010 8,292,405 1,177,668 9,470,073
2011 8,361,711 1,161,835 9,523,546
2012 8,116,412 1,236,281 9,352,693
2013 12,517,208 1,114,107 13,631,315
Source: Created from data provided by DFW, June 2014.
EXHIBIT B -11. COMMERCIAL PINK SHRIMP LANDINGS VALUE BY COUNTY (2014$), 2004 -2013
YEAR GRAYS HARBOR PACIFIC TOTAL
2004 $1,688,043 $673,829 $2,361,872
2005 $1,924,902 $1,073,829 $2,998,731
2006 $1,906,790 $386,028 $2,292,818
2007 $1,343,886 $360,615 $1,704,500
2008 $2,749,620 $820,698 $3,570,318
2009 $1,884,020 $435,853 $2,319,873
2010 $2,892,190 $437,997 $3,330,187
2011 $4,209,823 $567,822 $4,777,645
2012 $3,948,387 $573,748 $4,522,135
2013 $5,320,620 $499,154 $5,819,774
Source: Created from data provided by DFW, June 2014.
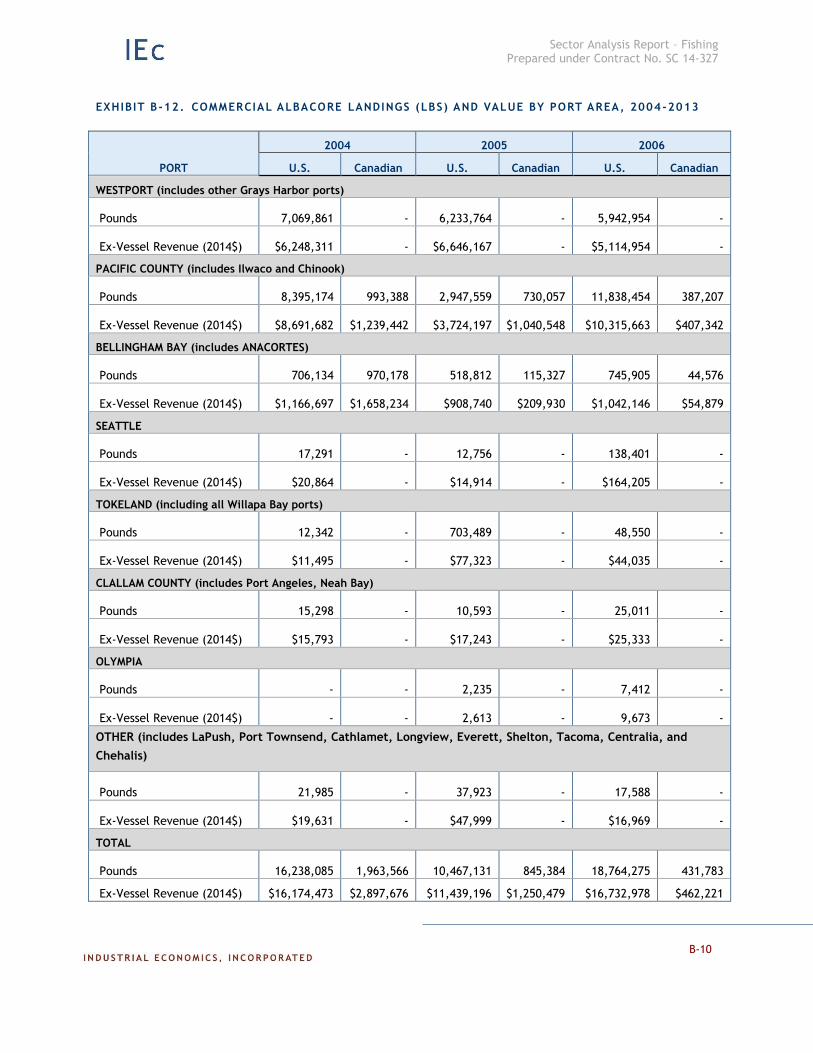
Sector Analysis Report – Fishing Prepared under Contract No. SC 14-327
ter Text].
B-10
EXHIBIT B -12. COMMERCIAL ALBACORE LANDINGS (LBS) AND VALUE BY PORT AREA, 2004-2013
PORT
2004 2005 2006
U.S. Canadian U.S. Canadian U.S. Canadian
WESTPORT (includes other Grays Harbor ports)
Pounds
7,069,861
-
6,233,764
-
5,942,954
-
Ex-Vessel Revenue (2014$)
$6,248,311
-
$6,646,167
-
$5,114,954 -
PACIFIC COUNTY (includes Ilwaco and Chinook)
Pounds
8,395,174
993,388
2,947,559
730,057
11,838,454
387,207
Ex-Vessel Revenue (2014$)
$8,691,682
$1,239,442
$3,724,197
$1,040,548
$10,315,663
$407,342
BELLINGHAM BAY (includes ANACORTES)
Pounds
706,134
970,178
518,812
115,327
745,905
44,576
Ex-Vessel Revenue (2014$)
$1,166,697
$1,658,234
$908,740
$209,930
$1,042,146
$54,879
SEATTLE
Pounds
17,291
-
12,756
-
138,401
-
Ex-Vessel Revenue (2014$)
$20,864
-
$14,914
-
$164,205 -
TOKELAND (including all Willapa Bay ports)
Pounds
12,342
-
703,489
-
48,550
-
Ex-Vessel Revenue (2014$)
$11,495
-
$77,323
-
$44,035 -
CLALLAM COUNTY (includes Port Angeles, Neah Bay)
Pounds
15,298
-
10,593
-
25,011
-
Ex-Vessel Revenue (2014$)
$15,793
-
$17,243
-
$25,333 -
OLYMPIA
Pounds
-
-
2,235
-
7,412
-
Ex-Vessel Revenue (2014$)
-
-
2,613
-
9,673
-
OTHER (includes LaPush, Port Townsend, Cathlamet, Longview, Everett, Shelton, Tacoma, Centralia, and
Chehalis)
Pounds
21,985
-
37,923
-
17,588
-
Ex-Vessel Revenue (2014$)
$19,631
-
$47,999
-
$16,969 -
TOTAL
Pounds
16,238,085
1,963,566
10,467,131
845,384
18,764,275
431,783
Ex-Vessel Revenue (2014$) $16,174,473 $2,897,676 $11,439,196 $1,250,479 $16,732,978 $462,221
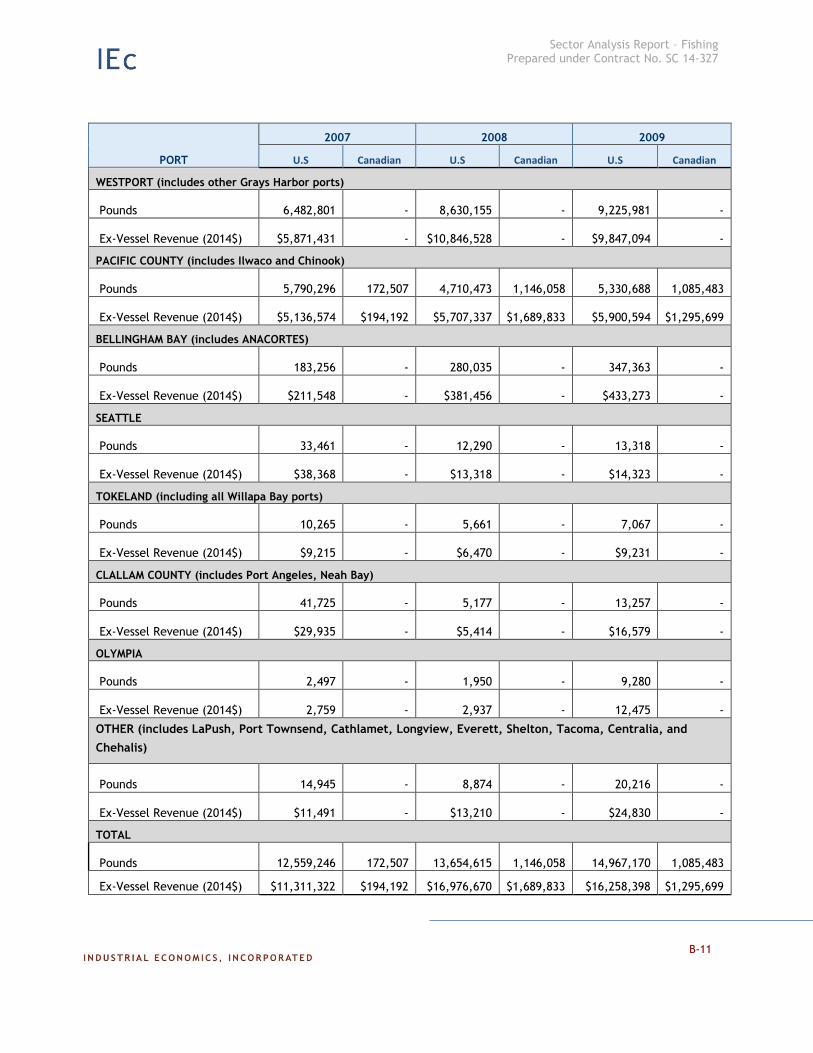
Sector Analysis Report – Fishing Prepared under Contract No. SC 14-327
oter Text]
B-11
PORT
2007 2008 2009
U.S Canadian U.S Canadian U.S Canadian
WESTPORT (includes other Grays Harbor ports)
Pounds
6,482,801
-
8,630,155
-
9,225,981
-
Ex-Vessel Revenue (2014$)
$5,871,431 -
$10,846,528
-
$9,847,094 -
PACIFIC COUNTY (includes Ilwaco and Chinook)
Pounds
5,790,296
172,507
4,710,473
1,146,058
5,330,688
1,085,483
Ex-Vessel Revenue (2014$)
$5,136,574
$194,192
$5,707,337
$1,689,833
$5,900,594
$1,295,699
BELLINGHAM BAY (includes ANACORTES)
Pounds
183,256
-
280,035
-
347,363
-
Ex-Vessel Revenue (2014$)
$211,548
-
$381,456
-
$433,273 -
SEATTLE
Pounds
33,461
-
12,290
-
13,318
-
Ex-Vessel Revenue (2014$)
$38,368
-
$13,318
-
$14,323 -
TOKELAND (including all Willapa Bay ports)
Pounds
10,265
-
5,661
-
7,067
-
Ex-Vessel Revenue (2014$)
$9,215
-
$6,470
-
$9,231 -
CLALLAM COUNTY (includes Port Angeles, Neah Bay)
Pounds
41,725
-
5,177
-
13,257
-
Ex-Vessel Revenue (2014$)
$29,935
-
$5,414
-
$16,579 -
OLYMPIA
Pounds
2,497
-
1,950
-
9,280
-
Ex-Vessel Revenue (2014$)
2,759
-
2,937
-
12,475
-
OTHER (includes LaPush, Port Townsend, Cathlamet, Longview, Everett, Shelton, Tacoma, Centralia, and
Chehalis)
Pounds
14,945
-
8,874
-
20,216
-
Ex-Vessel Revenue (2014$)
$11,491
-
$13,210
-
$24,830 -
TOTAL
Pounds
12,559,246
172,507
13,654,615
1,146,058
14,967,170
1,085,483
Ex-Vessel Revenue (2014$) $11,311,322 $194,192 $16,976,670 $1,689,833 $16,258,398 $1,295,699
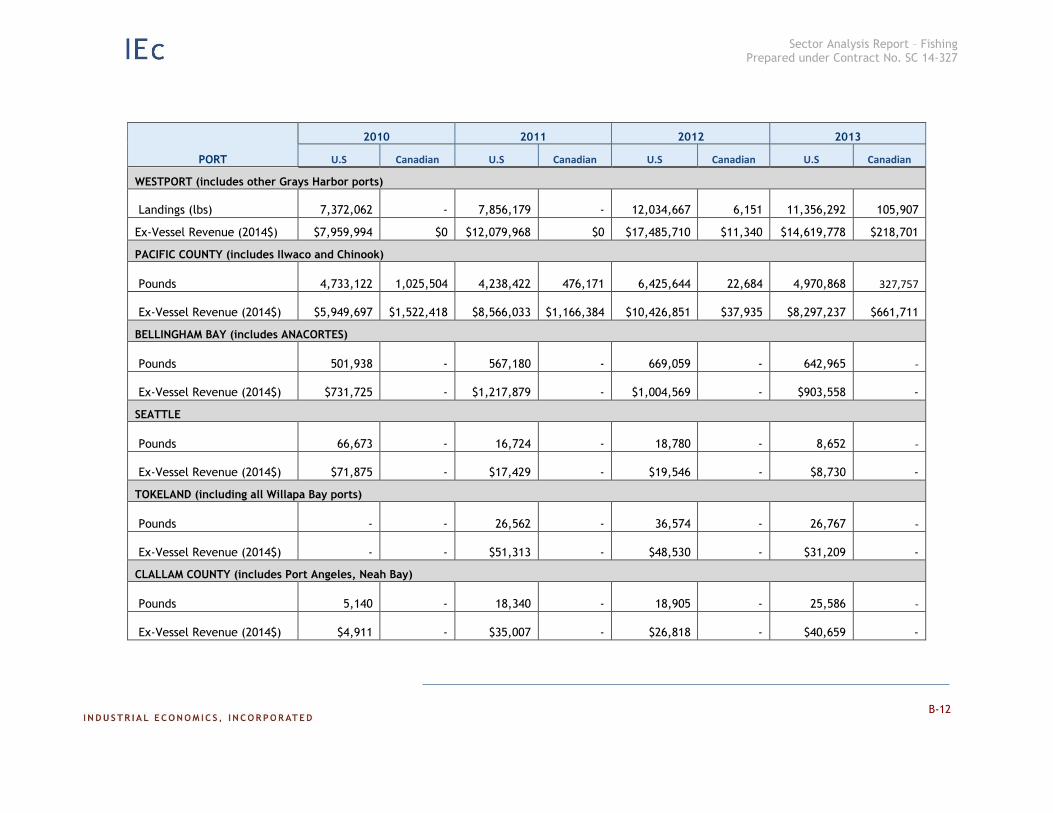
Sector Analysis Report – Fishing Prepared under Contract No. SC 14-327
ter Text].
B-12
PORT
2010 2011 2012 2013
U.S Canadian U.S Canadian U.S Canadian U.S Canadian
WESTPORT (includes other Grays Harbor ports)
Landings (lbs)
7,372,062 -
7,856,179 -
12,034,667
6,151
11,356,292
105,907
Ex-Vessel Revenue (2014$) $7,959,994 $0 $12,079,968 $0 $17,485,710 $11,340 $14,619,778 $218,701
PACIFIC COUNTY (includes Ilwaco and Chinook)
Pounds
4,733,122
1,025,504
4,238,422
476,171
6,425,644
22,684
4,970,868
327,757
Ex-Vessel Revenue (2014$)
$5,949,697
$1,522,418
$8,566,033
$1,166,384
$10,426,851
$37,935
$8,297,237
$661,711
BELLINGHAM BAY (includes ANACORTES)
Pounds
501,938
-
567,180
-
669,059
-
642,965
-
Ex-Vessel Revenue (2014$)
$731,725
-
$1,217,879
-
$1,004,569
-
$903,558
-
SEATTLE
Pounds
66,673
-
16,724
-
18,780
-
8,652
-
Ex-Vessel Revenue (2014$)
$71,875
-
$17,429
-
$19,546 -
$8,730
-
TOKELAND (including all Willapa Bay ports)
Pounds
-
-
26,562
-
36,574
-
26,767
-
Ex-Vessel Revenue (2014$)
-
-
$51,313
-
$48,530
-
$31,209 -
CLALLAM COUNTY (includes Port Angeles, Neah Bay)
Pounds
5,140
-
18,340
-
18,905
-
25,586
-
Ex-Vessel Revenue (2014$)
$4,911
-
$35,007
-
$26,818
-
$40,659
-
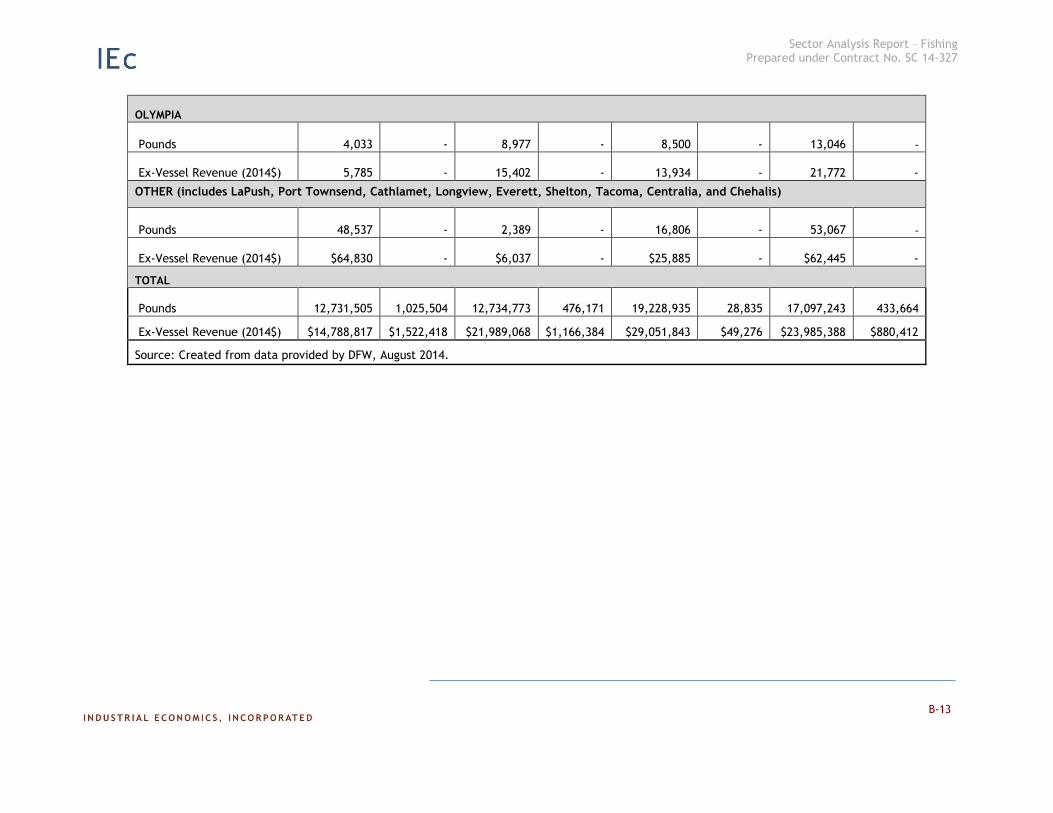
Sector Analysis Report – Fishing Prepared under Contract No. SC 14-327
oter Text]
B-13
OLYMPIA
Pounds
4,033
-
8,977
-
8,500
-
13,046
-
Ex-Vessel Revenue (2014$)
5,785
-
15,402
-
13,934
-
21,772
-
OTHER (includes LaPush, Port Townsend, Cathlamet, Longview, Everett, Shelton, Tacoma, Centralia, and Chehalis)
Pounds
48,537
-
2,389
-
16,806
-
53,067
-
Ex-Vessel Revenue (2014$)
$64,830
-
$6,037
-
$25,885
-
$62,445
-
TOTAL
Pounds
12,731,505
1,025,504
12,734,773
476,171
19,228,935
28,835
17,097,243
433,664
Ex-Vessel Revenue (2014$) $14,788,817 $1,522,418 $21,989,068 $1,166,384 $29,051,843 $49,276 $23,985,388 $880,412
Source: Created from data provided by DFW, August 2014.
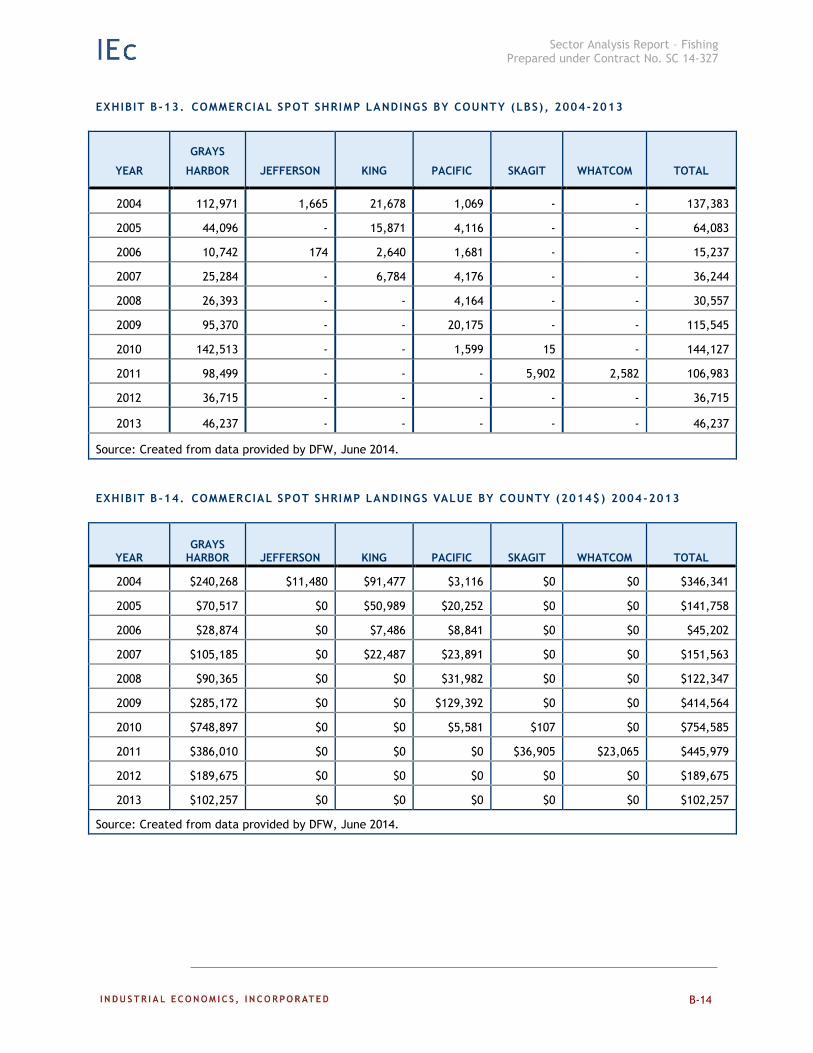
Sector Analysis Report – Fishing Prepared under Contract No. SC 14-327
B-14
EXHIBIT B -13. COMMERCIAL SPOT SHRIMP LANDINGS BY COUNTY (LBS), 2004-2013
YEAR
GRAYS
HARBOR JEFFERSON KING PACIFIC SKAGIT WHATCOM TOTAL
2004 112,971 1,665 21,678 1,069 - - 137,383
2005 44,096 - 15,871 4,116 - - 64,083
2006 10,742 174 2,640 1,681 - - 15,237
2007 25,284 - 6,784 4,176 - - 36,244
2008 26,393 - - 4,164 - - 30,557
2009 95,370 - - 20,175 - - 115,545
2010 142,513 - - 1,599 15 - 144,127
2011 98,499 - - - 5,902 2,582 106,983
2012 36,715 - - - - - 36,715
2013 46,237 - - - - - 46,237
Source: Created from data provided by DFW, June 2014.
EXHIBIT B -14. COMMERCIAL SPOT SHRIMP LANDINGS VALUE BY COUNTY (2014$) 2004 -2013
YEAR GRAYS
HARBOR JEFFERSON KING PACIFIC SKAGIT WHATCOM TOTAL
2004 $240,268 $11,480 $91,477 $3,116 $0 $0 $346,341
2005 $70,517 $0 $50,989 $20,252 $0 $0 $141,758
2006 $28,874 $0 $7,486 $8,841 $0 $0 $45,202
2007 $105,185 $0 $22,487 $23,891 $0 $0 $151,563
2008 $90,365 $0 $0 $31,982 $0 $0 $122,347
2009 $285,172 $0 $0 $129,392 $0 $0 $414,564
2010 $748,897 $0 $0 $5,581 $107 $0 $754,585
2011 $386,010 $0 $0 $0 $36,905 $23,065 $445,979
2012 $189,675 $0 $0 $0 $0 $0 $189,675
2013 $102,257 $0 $0 $0 $0 $0 $102,257
Source: Created from data provided by DFW, June 2014.
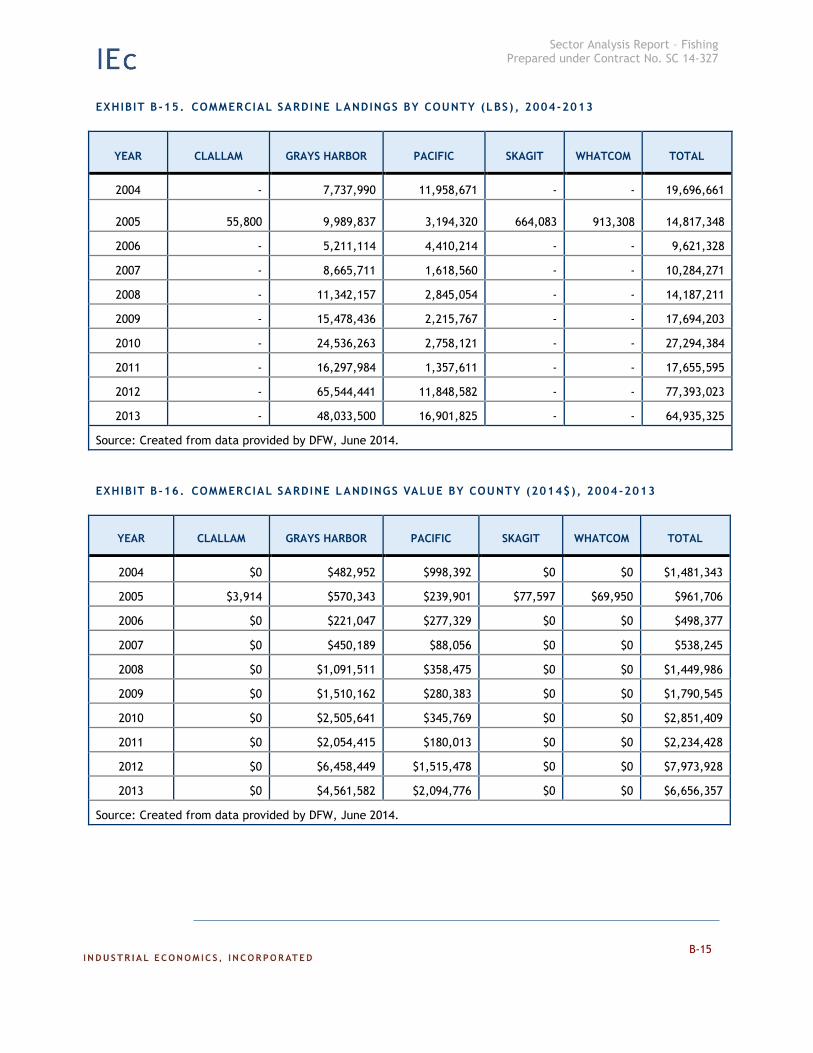
Sector Analysis Report – Fishing Prepared under Contract No. SC 14-327
oter Text]
B-15
EXHIBIT B -15. COMMERCIAL SARDINE LANDINGS BY COUNTY (LBS) , 2004-2013
YEAR CLALLAM GRAYS HARBOR PACIFIC SKAGIT WHATCOM TOTAL
2004 - 7,737,990 11,958,671 - - 19,696,661
2005 55,800 9,989,837 3,194,320 664,083
913,308 14,817,348
2006 - 5,211,114 4,410,214 - - 9,621,328
2007 - 8,665,711 1,618,560 - - 10,284,271
2008 - 11,342,157 2,845,054 - - 14,187,211
2009 - 15,478,436 2,215,767 - - 17,694,203
2010 - 24,536,263 2,758,121 - - 27,294,384
2011 - 16,297,984 1,357,611 - - 17,655,595
2012 - 65,544,441 11,848,582 - - 77,393,023
2013 - 48,033,500 16,901,825 - - 64,935,325
Source: Created from data provided by DFW, June 2014.
EXHIBIT B -16. COMMERCIAL SARDINE LANDINGS VALUE BY COUNTY (2014$), 2004-2013
YEAR CLALLAM GRAYS HARBOR PACIFIC SKAGIT WHATCOM TOTAL
2004 $0 $482,952 $998,392 $0 $0 $1,481,343
2005 $3,914 $570,343 $239,901 $77,597 $69,950 $961,706
2006 $0 $221,047 $277,329 $0 $0 $498,377
2007 $0 $450,189 $88,056 $0 $0 $538,245
2008 $0 $1,091,511 $358,475 $0 $0 $1,449,986
2009 $0 $1,510,162 $280,383 $0 $0 $1,790,545
2010 $0 $2,505,641 $345,769 $0 $0 $2,851,409
2011 $0 $2,054,415 $180,013 $0 $0 $2,234,428
2012 $0 $6,458,449 $1,515,478 $0 $0 $7,973,928
2013 $0 $4,561,582 $2,094,776 $0 $0 $6,656,357
Source: Created from data provided by DFW, June 2014.

Sector Analysis Report – Fishing Prepared under Contract No. SC 14-327
oter Text]
B-16
EXHIBIT B -17. COMMERCIAL ANCHOVY LANDINGS BY COUNTY (LBS), 2004-2013
YEAR GRAYS HARBOR PACIFIC TOTAL
2004 470,500 - 470,500
2005 361,000 - 361,000
2006 350,000 - 350,000
2007 327,260 - 327,260
2008 225,820 14,700 240,520
2009 1,680,927 108,950 1,789,877
2010 147,010 118,200 265,210
2011 334,891 86,200 421,091
2012 369,088 110,410 479,498
2013 193,190 61,960 255,150
Source: Created from data provided by DFW, June 2014.
EXHIBIT B -18. COMMERCIAL ANCHOVY LANDINGS VALUE BY COUNTY (2014$), 2004-2013
YEAR GRAYS HARBOR PACIFIC TOTAL
2004 $77,118 $0 $77,118
2005 $41,785 $0 $41,785
2006 $39,698 $0 $39,698
2007 $33,247 $0 $33,247
2008 $27,125 $11,108 $38,232
2009 $80,041 $66,113 $146,154
2010 $12,720 $62,801 $75,521
2011 $26,084 $44,917 $71,001
2012 $27,961 $56,543 $84,504
2013 $16,607 $31,259 $47,866
Source: Created from data provided by DFW, June 2014.
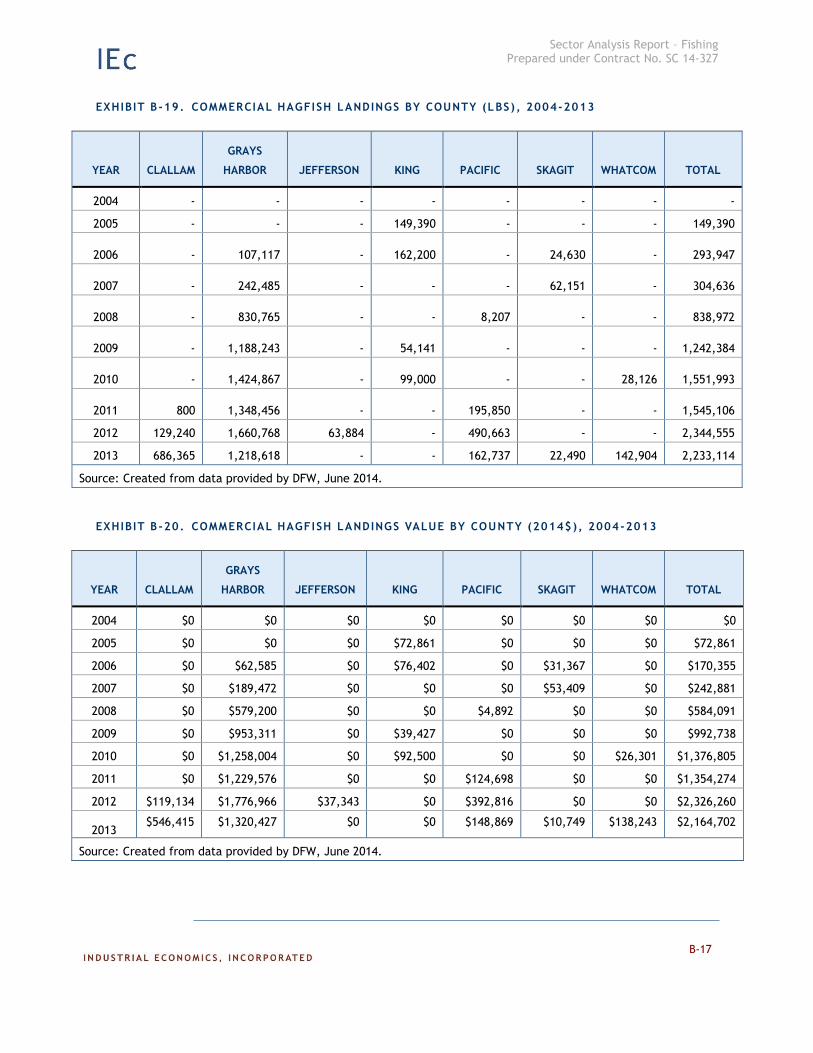
Sector Analysis Report – Fishing Prepared under Contract No. SC 14-327
oter Text]
B-17
EXHIBIT B -19. COMMERCIAL HAGFISH LANDINGS BY COUNTY (LBS) , 2004-2013
YEAR CLALLAM
GRAYS
HARBOR JEFFERSON KING PACIFIC SKAGIT WHATCOM TOTAL
2004 - - - - - - - -
2005 - - - 149,390 - - - 149,390
2006 -
107,117 - 162,200 - 24,630 - 293,947
2007 -
242,485 - - - 62,151 - 304,636
2008 -
830,765 - - 8,207 - - 838,972
2009 -
1,188,243 - 54,141 - - - 1,242,384
2010 -
1,424,867 - 99,000 - - 28,126 1,551,993
2011 800
1,348,456 - - 195,850 - - 1,545,106
2012 129,240 1,660,768 63,884 - 490,663 - - 2,344,555
2013 686,365 1,218,618 - - 162,737 22,490 142,904 2,233,114
Source: Created from data provided by DFW, June 2014.
EXHIBIT B -20. COMMERCIAL HAGFISH LANDINGS VALUE BY COUNTY (2014$), 2004-2013
YEAR CLALLAM
GRAYS
HARBOR JEFFERSON KING PACIFIC SKAGIT WHATCOM TOTAL
2004 $0 $0 $0 $0 $0 $0 $0 $0
2005 $0 $0 $0 $72,861 $0 $0 $0 $72,861
2006 $0 $62,585 $0 $76,402 $0 $31,367 $0 $170,355
2007 $0 $189,472 $0 $0 $0 $53,409 $0 $242,881
2008 $0 $579,200 $0 $0 $4,892 $0 $0 $584,091
2009 $0 $953,311 $0 $39,427 $0 $0 $0 $992,738
2010 $0 $1,258,004 $0 $92,500 $0 $0 $26,301 $1,376,805
2011 $0 $1,229,576 $0 $0 $124,698 $0 $0 $1,354,274
2012 $119,134 $1,776,966 $37,343 $0 $392,816 $0 $0 $2,326,260
2013 $546,415 $1,320,427 $0 $0 $148,869 $10,749 $138,243 $2,164,702
Source: Created from data provided by DFW, June 2014.
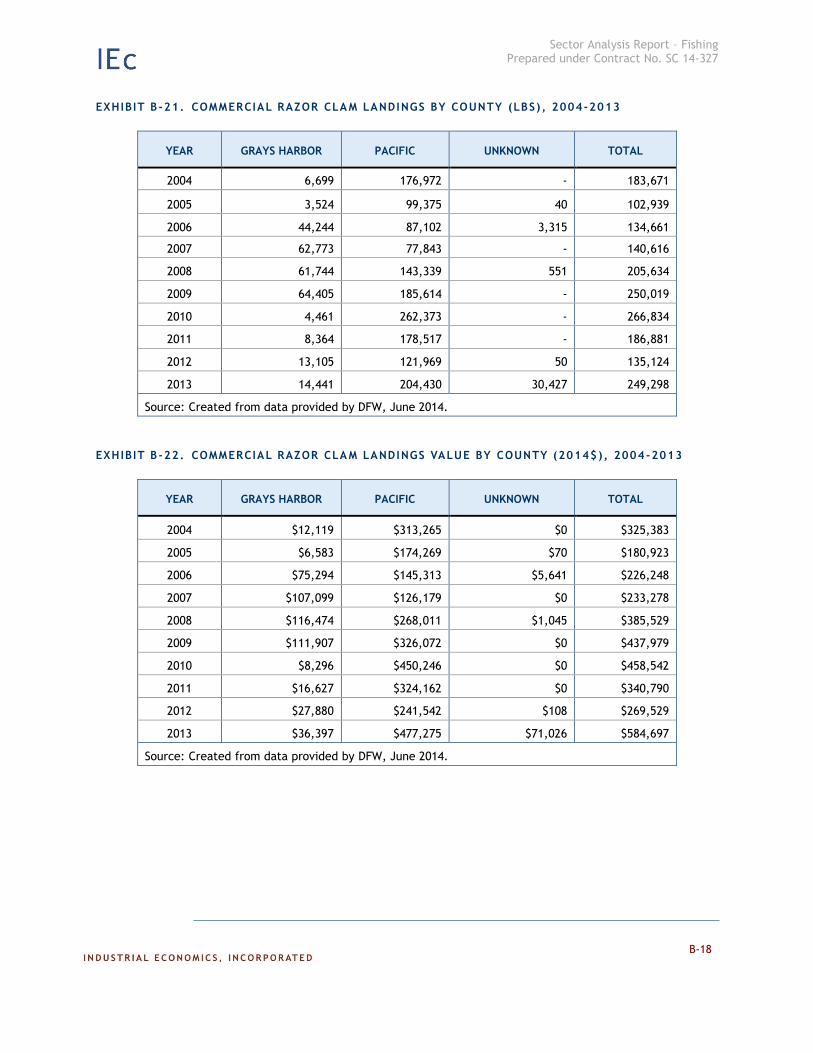
Sector Analysis Report – Fishing Prepared under Contract No. SC 14-327
oter Text]
B-18
EXHIBIT B -21. COMMERCIAL RAZOR CLA M LANDINGS BY COUNTY (LBS) , 2004-2013
YEAR GRAYS HARBOR PACIFIC UNKNOWN TOTAL
2004 6,699 176,972 - 183,671
2005 3,524 99,375 40 102,939
2006 44,244 87,102 3,315 134,661
2007 62,773 77,843 - 140,616
2008 61,744 143,339 551 205,634
2009 64,405 185,614 - 250,019
2010 4,461 262,373 - 266,834
2011 8,364 178,517 - 186,881
2012 13,105 121,969 50 135,124
2013 14,441 204,430 30,427 249,298
Source: Created from data provided by DFW, June 2014.
EXHIBIT B -22. COMMERCIAL RAZOR CLA M LANDINGS VALUE BY COUNTY (2014$), 2004 -2013
YEAR GRAYS HARBOR PACIFIC UNKNOWN TOTAL
2004 $12,119 $313,265 $0 $325,383
2005 $6,583 $174,269 $70 $180,923
2006 $75,294 $145,313 $5,641 $226,248
2007 $107,099 $126,179 $0 $233,278
2008 $116,474 $268,011 $1,045 $385,529
2009 $111,907 $326,072 $0 $437,979
2010 $8,296 $450,246 $0 $458,542
2011 $16,627 $324,162 $0 $340,790
2012 $27,880 $241,542 $108 $269,529
2013 $36,397 $477,275 $71,026 $584,697
Source: Created from data provided by DFW, June 2014.

Sector Analysis Report – Fishing Prepared under Contract No. SC 14-327
APPENDIX C
RECREATIONAL FISHING SUB-SECTOR DATA TABLES

Sector Analysis Report – Fishing Prepared under Contract No. SC 14-327
C-1
EXHIBIT C-1. RECREATIONAL RAZOR CLAM HARVEST AND EFFO RT BY BEACH, 2003-2013
YEAR
LONG BEACH TWIN HARBORS COPALIS MOCROCKS KALALOCH COAST-WIDE
HARVEST
(CLAMS)
EFFORT
(DIGGER
TRIPS)
HARVEST
(CLAMS)
EFFORT
(DIGGER
TRIPS)
HARVEST
(CLAMS)
EFFORT
(DIGGER
TRIPS)
HARVEST
(CLAMS)
EFFORT
(DIGGER
TRIPS)
HARVEST
(CLAMS)
EFFORT
(DIGGER
TRIPS)
HARVEST
(CLAMS)
EFFORT
(DIGGER
TRIPS)
2003-04 1,290,978 109,483 840,317 70,593 462,520 36,702 586,135 39,969 145,625 10,306 3,325,575 267,053
2004-05 1,696,283 118,491 525,984 40,110 1,239,173 84,121 591,167 40,426 74,263 5,368 4,126,870 288,516
2005-06 1,378,575 97,768 410,698 33,040 817,228 60,618 647,658 44,291 30,039 5,051 3,284,198 240,768
2006-07 1,751,151 126,812 773,572 55,630 466,620 31,847 595,492 42,967 14,404 2,591 3,601,239 259,847
2007-08 1,227,519 112,441 825,539 65,252 636,376 42,376 341,406 22,248 0 0 3,030,840 242,317
2008-09 1,031,223 94,845 565,138 41,288 963,497 68,384 656,309 44,211 0 0 3,216,167 248,728
2009-10 1,422,020 105,817 840,119 60,165 1,000,413 75,822 496,303 37,092 46,373 4,548 3,805,228 283,444
2010-11 1,170,069 87,417 813,417 66,566 674,714 50,533 531,766 37,749 14,345 2,163 3,204,311 244,428
2011-12 1,063,066 82,847 563,138 40,632 348,837 26,212 597,700 44,002 2,952 1,283 2,575,693 194,976
2012-13 2,382,398 165,238 1,537,299 106,278 1,393,686 95,700 764,726 51,783 0 0 6,078,109 418,999
2013-14 2,423,612 181,240 1,714,479 119,872 1,102,421 75,198 1,044,692 74,736 0 0 6,285,204 451,046
Average 1,441,328 110,116 769,522 57,955 800,306 57,232 580,866 40,474 29,818 2,846 3,624,823 268,908
Source: Created from data provided by DFW, June 2014
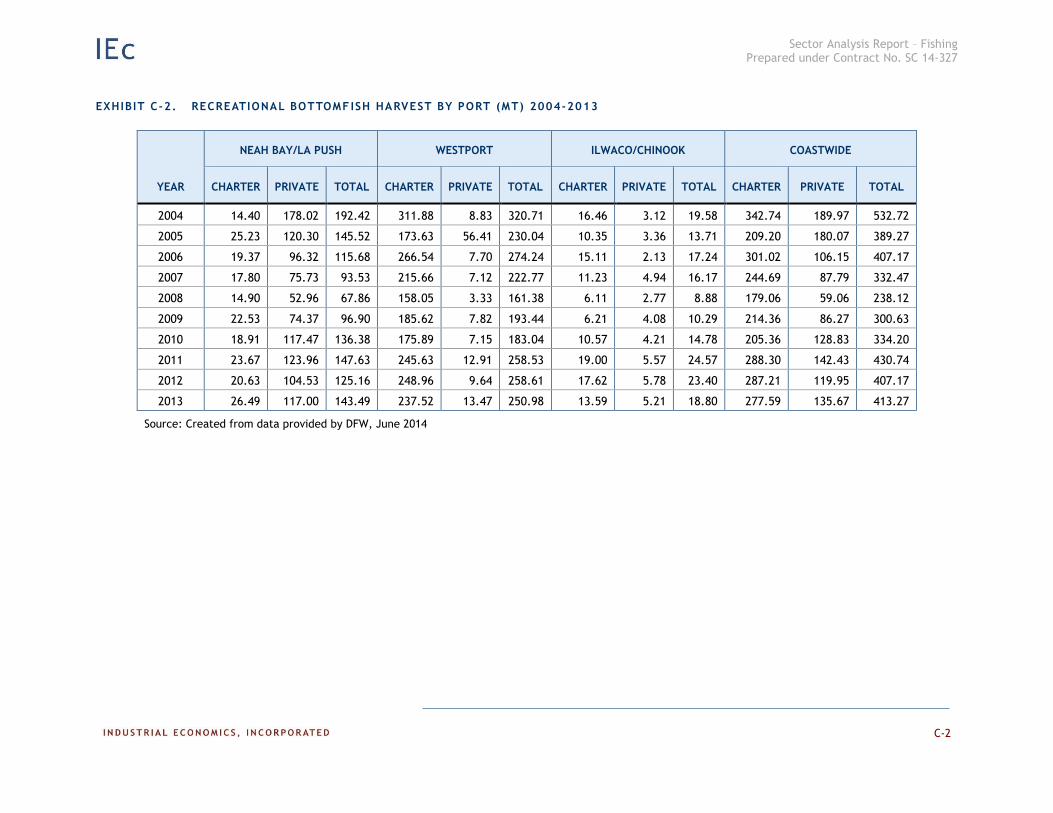
Sector Analysis Report – Fishing Prepared under Contract No. SC 14-327
C-2
EXHIBIT C-2. RECREATIONAL BOTTOMF ISH HARVEST BY PORT (MT) 2004-2013
YEAR
NEAH BAY/LA PUSH WESTPORT ILWACO/CHINOOK COASTWIDE
CHARTER PRIVATE TOTAL CHARTER PRIVATE TOTAL CHARTER PRIVATE TOTAL CHARTER PRIVATE TOTAL
2004 14.40 178.02 192.42 311.88 8.83 320.71 16.46 3.12 19.58 342.74 189.97 532.72
2005 25.23 120.30 145.52 173.63 56.41 230.04 10.35 3.36 13.71 209.20 180.07 389.27
2006 19.37 96.32 115.68 266.54 7.70 274.24 15.11 2.13 17.24 301.02 106.15 407.17
2007 17.80 75.73 93.53 215.66 7.12 222.77 11.23 4.94 16.17 244.69 87.79 332.47
2008 14.90 52.96 67.86 158.05 3.33 161.38 6.11 2.77 8.88 179.06 59.06 238.12
2009 22.53 74.37 96.90 185.62 7.82 193.44 6.21 4.08 10.29 214.36 86.27 300.63
2010 18.91 117.47 136.38 175.89 7.15 183.04 10.57 4.21 14.78 205.36 128.83 334.20
2011 23.67 123.96 147.63 245.63 12.91 258.53 19.00 5.57 24.57 288.30 142.43 430.74
2012 20.63 104.53 125.16 248.96 9.64 258.61 17.62 5.78 23.40 287.21 119.95 407.17
2013 26.49 117.00 143.49 237.52 13.47 250.98 13.59 5.21 18.80 277.59 135.67 413.27
Source: Created from data provided by DFW, June 2014
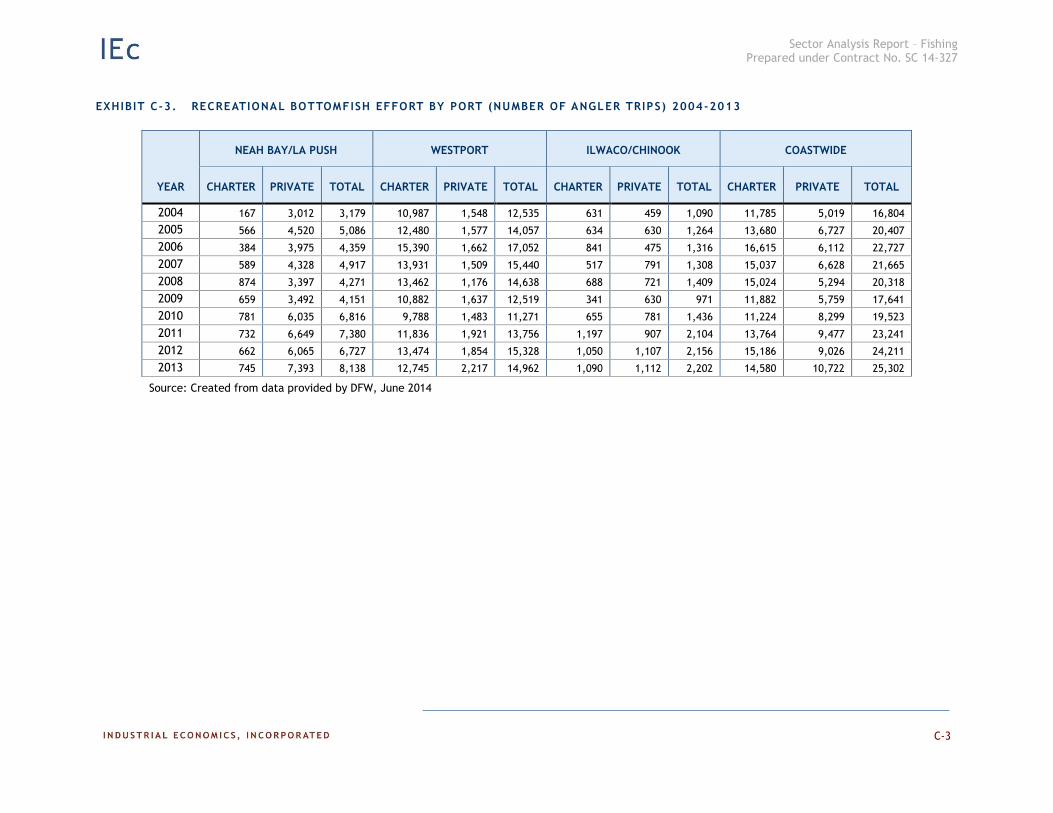
Sector Analysis Report – Fishing Prepared under Contract No. SC 14-327
C-3
EXHIBIT C-3. RECREATIONAL BOTTOMFISH EFFORT BY PORT (NUMBER OF ANGLER TRIPS) 2004-2013
YEAR
NEAH BAY/LA PUSH WESTPORT ILWACO/CHINOOK COASTWIDE
CHARTER PRIVATE TOTAL CHARTER PRIVATE TOTAL CHARTER PRIVATE TOTAL CHARTER PRIVATE TOTAL
2004 167 3,012 3,179 10,987 1,548 12,535 631 459 1,090 11,785 5,019 16,804
2005 566 4,520 5,086 12,480 1,577 14,057 634 630 1,264 13,680 6,727 20,407
2006 384 3,975 4,359 15,390 1,662 17,052 841 475 1,316 16,615 6,112 22,727
2007 589 4,328 4,917 13,931 1,509 15,440 517 791 1,308 15,037 6,628 21,665
2008 874 3,397 4,271 13,462 1,176 14,638 688 721 1,409 15,024 5,294 20,318
2009 659 3,492 4,151 10,882 1,637 12,519 341 630 971 11,882 5,759 17,641
2010 781 6,035 6,816 9,788 1,483 11,271 655 781 1,436 11,224 8,299 19,523
2011 732 6,649 7,380 11,836 1,921 13,756 1,197 907 2,104 13,764 9,477 23,241
2012 662 6,065 6,727 13,474 1,854 15,328 1,050 1,107 2,156 15,186 9,026 24,211
2013 745 7,393 8,138 12,745 2,217 14,962 1,090 1,112 2,202 14,580 10,722 25,302
Source: Created from data provided by DFW, June 2014

Sector Analysis Report – Fishing Prepared under Contract No. SC 14-327
C-4
EXHIBIT C-4. RECREATIONAL HALIBUT HARVEST (LBS) BY PORT 2004-2013
YEAR
NEAH BAY/LA PUSH WESTPORT ILWACO/CHINOOK COASTWIDE
CHARTER PRIVATE TOTAL CHARTER PRIVATE TOTAL CHARTER PRIVATE TOTAL CHARTER PRIVATE TOTAL
2004 49,836 72,597 122,433 61,615 1,208 62,823 7,022 509 7,531 118,474 74,313 192,787
2005 40,349 67,799 108,148 53,160 1,685 54,845 5,169 1,981 7,150 98,678 71,465 170,143
2006 27,665 78,140 105,805 57,051 1,433 58,484 7,805 3,200 11,005 92,522 82,772 175,294
2007 22,193 44,237 66,430 50,836 330 51,166 6,441 2,509 8,950 79,471 47,075 126,546
2008 42,734 64,118 106,852 32,569 7,828 40,397 6,182 3,511 9,693 81,484 75,458 156,942
2009 31,108 71,674 102,782 32,399 7,197 39,596 5,193 3,066 8,259 68,699 81,938 150,637
2010 28,143 66,871 95,014 30,198 4,354 34,552 5,097 3,145 8,242 63,439 74,369 137,808
2011 26,276 77,465 103,741 35,180 9,920 45,100 5,678 1,979 7,657 67,134 89,364 156,498
2012 18,220 87,259 105,479 34,305 8,162 42,467 3,714 2,191 5,905 56,240 97,611 153,851
2013 16,629 91,227 107,856 33,873 8,213 42,086 2,912 1,765 4,677 53,414 101,205 154,619
Source: Created from data provided by DFW, June 2014
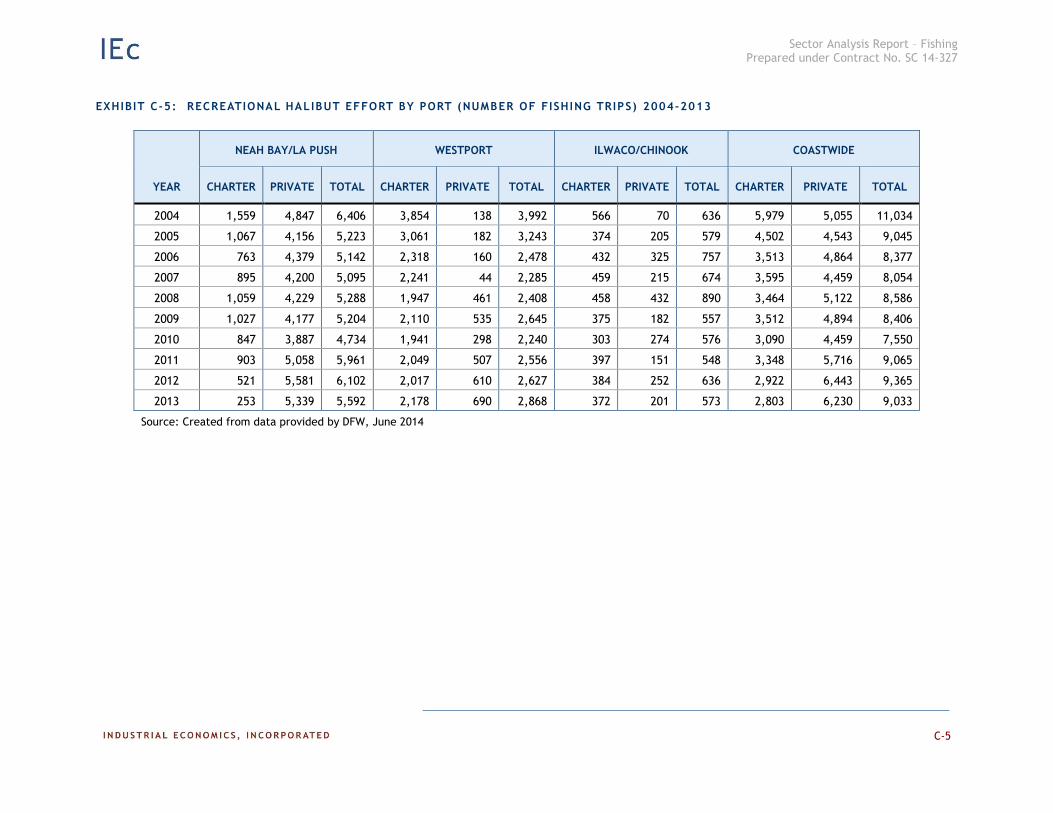
Sector Analysis Report – Fishing Prepared under Contract No. SC 14-327
C-5
EXHIBIT C-5: RECREATIONAL HAL IBUT EFFORT BY PORT (NUMBER OF FISHING TRIPS) 2004-2013
YEAR
NEAH BAY/LA PUSH WESTPORT ILWACO/CHINOOK COASTWIDE
CHARTER PRIVATE TOTAL CHARTER PRIVATE TOTAL CHARTER PRIVATE TOTAL CHARTER PRIVATE TOTAL
2004 1,559 4,847 6,406 3,854 138 3,992 566 70 636 5,979 5,055 11,034
2005 1,067 4,156 5,223 3,061 182 3,243 374 205 579 4,502 4,543 9,045
2006 763 4,379 5,142 2,318 160 2,478 432 325 757 3,513 4,864 8,377
2007 895 4,200 5,095 2,241 44 2,285 459 215 674 3,595 4,459 8,054
2008 1,059 4,229 5,288 1,947 461 2,408 458 432 890 3,464 5,122 8,586
2009 1,027 4,177 5,204 2,110 535 2,645 375 182 557 3,512 4,894 8,406
2010 847 3,887 4,734 1,941 298 2,240 303 274 576 3,090 4,459 7,550
2011 903 5,058 5,961 2,049 507 2,556 397 151 548 3,348 5,716 9,065
2012 521 5,581 6,102 2,017 610 2,627 384 252 636 2,922 6,443 9,365
2013 253 5,339 5,592 2,178 690 2,868 372 201 573 2,803 6,230 9,033
Source: Created from data provided by DFW, June 2014
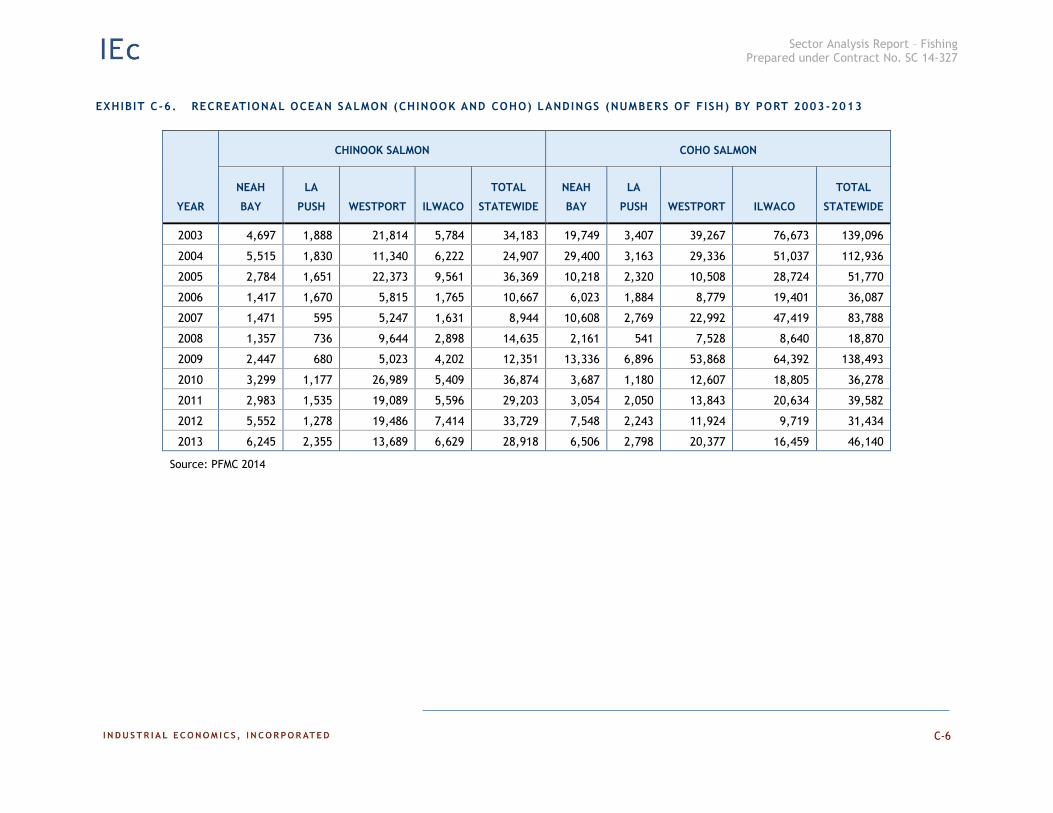
Sector Analysis Report – Fishing Prepared under Contract No. SC 14-327
C-6
EXHIBIT C-6. RECREATIONAL OCEAN SALMON (CHINOOK AND COHO) LANDINGS (NUMBERS OF FISH) BY PORT 2003-2013
YEAR
CHINOOK SALMON COHO SALMON
NEAH
BAY
LA
PUSH WESTPORT ILWACO
TOTAL
STATEWIDE
NEAH
BAY
LA
PUSH WESTPORT ILWACO
TOTAL
STATEWIDE
2003 4,697 1,888 21,814 5,784 34,183 19,749 3,407 39,267 76,673 139,096
2004 5,515 1,830 11,340 6,222 24,907 29,400 3,163 29,336 51,037 112,936
2005 2,784 1,651 22,373 9,561 36,369 10,218 2,320 10,508 28,724 51,770
2006 1,417 1,670 5,815 1,765 10,667 6,023 1,884 8,779 19,401 36,087
2007 1,471 595 5,247 1,631 8,944 10,608 2,769 22,992 47,419 83,788
2008 1,357 736 9,644 2,898 14,635 2,161 541 7,528 8,640 18,870
2009 2,447 680 5,023 4,202 12,351 13,336 6,896 53,868 64,392 138,493
2010 3,299 1,177 26,989 5,409 36,874 3,687 1,180 12,607 18,805 36,278
2011 2,983 1,535 19,089 5,596 29,203 3,054 2,050 13,843 20,634 39,582
2012 5,552 1,278 19,486 7,414 33,729 7,548 2,243 11,924 9,719 31,434
2013 6,245 2,355 13,689 6,629 28,918 6,506 2,798 20,377 16,459 46,140
Source: PFMC 2014
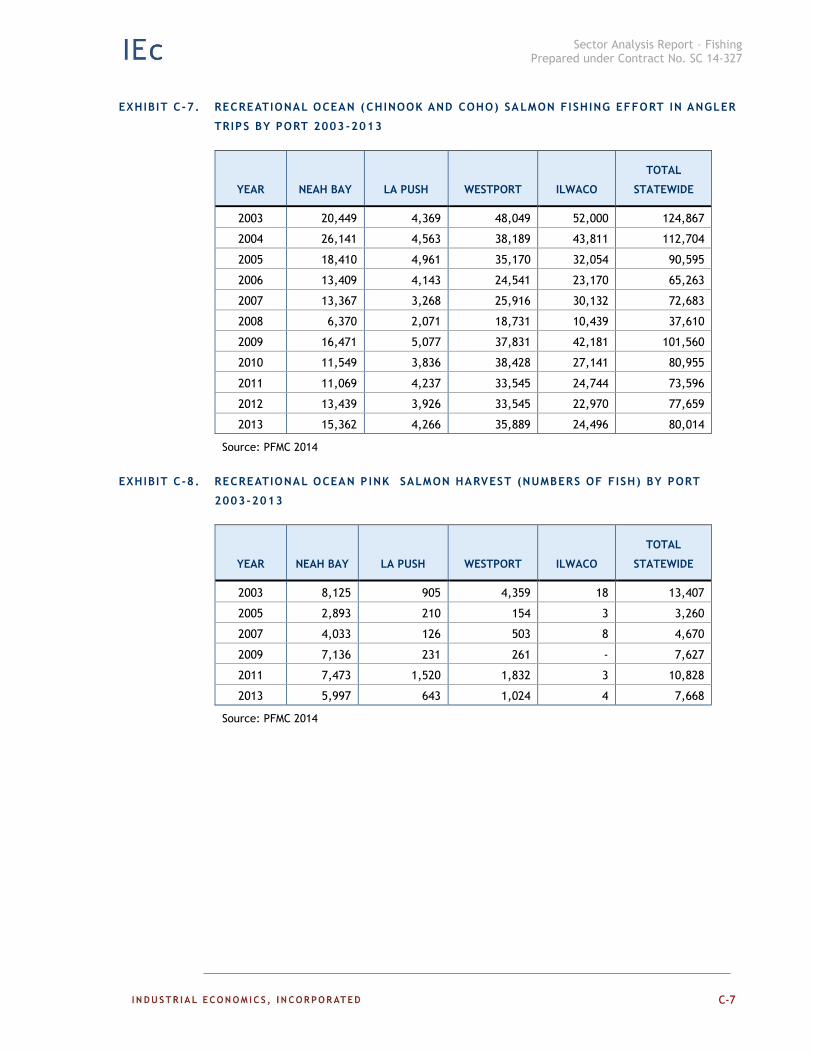
Sector Analysis Report – Fishing Prepared under Contract No. SC 14-327
C-7
EXHIBIT C-7. RECREATIONAL OCEAN (CHINOOK AND COHO) SALMON FISHING EFFORT IN ANGLER
TRIPS BY PORT 2003 -2013
YEAR NEAH BAY LA PUSH WESTPORT ILWACO
TOTAL
STATEWIDE
2003 20,449 4,369 48,049 52,000 124,867
2004 26,141 4,563 38,189 43,811 112,704
2005 18,410 4,961 35,170 32,054 90,595
2006 13,409 4,143 24,541 23,170 65,263
2007 13,367 3,268 25,916 30,132 72,683
2008 6,370 2,071 18,731 10,439 37,610
2009 16,471 5,077 37,831 42,181 101,560
2010 11,549 3,836 38,428 27,141 80,955
2011 11,069 4,237 33,545 24,744 73,596
2012 13,439 3,926 33,545 22,970 77,659
2013 15,362 4,266 35,889 24,496 80,014
Source: PFMC 2014
EXHIBIT C-8. RECREATIONAL OCEAN P INK SALMON HARVEST (NUMBERS OF FISH) BY PORT
2003-2013
YEAR NEAH BAY LA PUSH WESTPORT ILWACO
TOTAL
STATEWIDE
2003 8,125 905 4,359 18 13,407
2005 2,893 210 154 3 3,260
2007 4,033 126 503 8 4,670
2009 7,136 231 261 - 7,627
2011 7,473 1,520 1,832 3 10,828
2013 5,997 643 1,024 4 7,668
Source: PFMC 2014
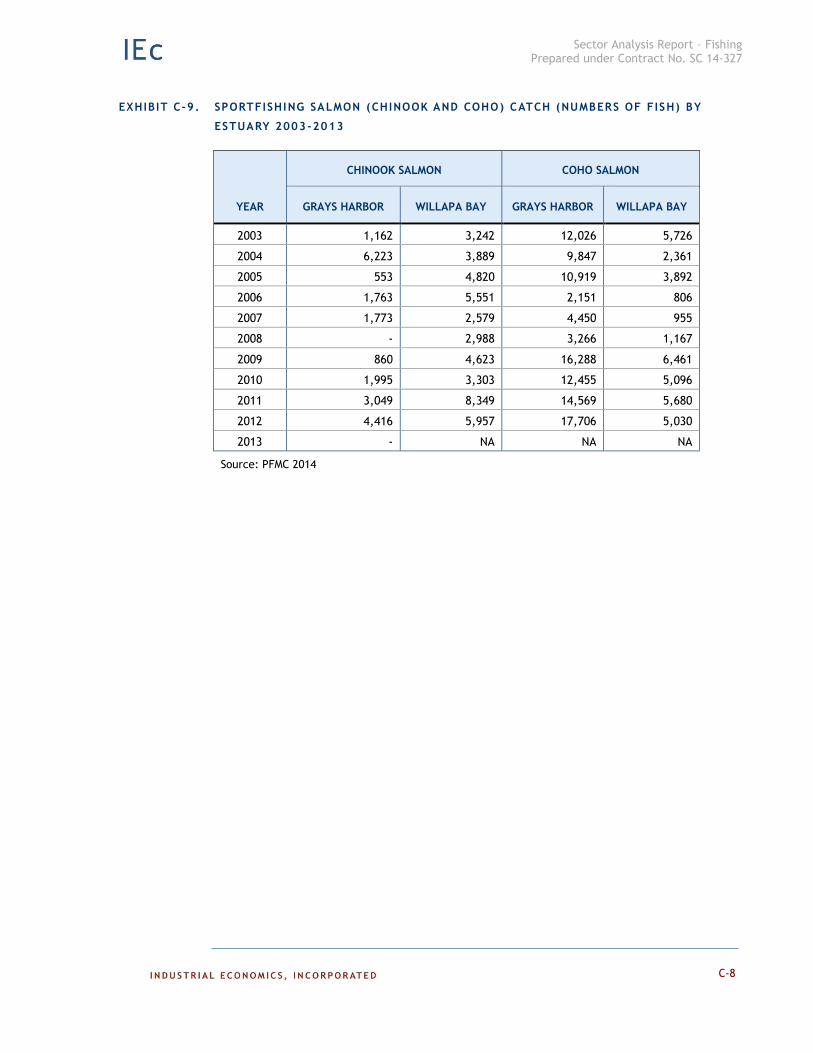
Sector Analysis Report – Fishing Prepared under Contract No. SC 14-327
C-8
EXHIBIT C-9. SPORTFISHING SALMON (CHINOOK AND COHO) CATCH (NUMBERS OF FISH) BY
ESTUARY 2003-2013
YEAR
CHINOOK SALMON COHO SALMON
GRAYS HARBOR WILLAPA BAY GRAYS HARBOR WILLAPA BAY
2003 1,162 3,242 12,026 5,726
2004 6,223 3,889 9,847 2,361
2005 553 4,820 10,919 3,892
2006 1,763 5,551 2,151 806
2007 1,773 2,579 4,450 955
2008 - 2,988 3,266 1,167
2009 860 4,623 16,288 6,461
2010 1,995 3,303 12,455 5,096
2011 3,049 8,349 14,569 5,680
2012 4,416 5,957 17,706 5,030
2013 - NA NA NA
Source: PFMC 2014