marine water quality in hong kong in 2011 water quality in hong kong in 2011 introduction the hong...
TRANSCRIPT

Environmental Protection Department The Government of the Hong Kong Special Administrative Region
MMMaaarrriiinnneee WWWaaattteeerrr QQQuuuaaallliiitttyyy iiinnn
HHHooonnnggg KKKooonnnggg iiinnn 222000111111
Marine Water Quality in Hong Kong in 2011
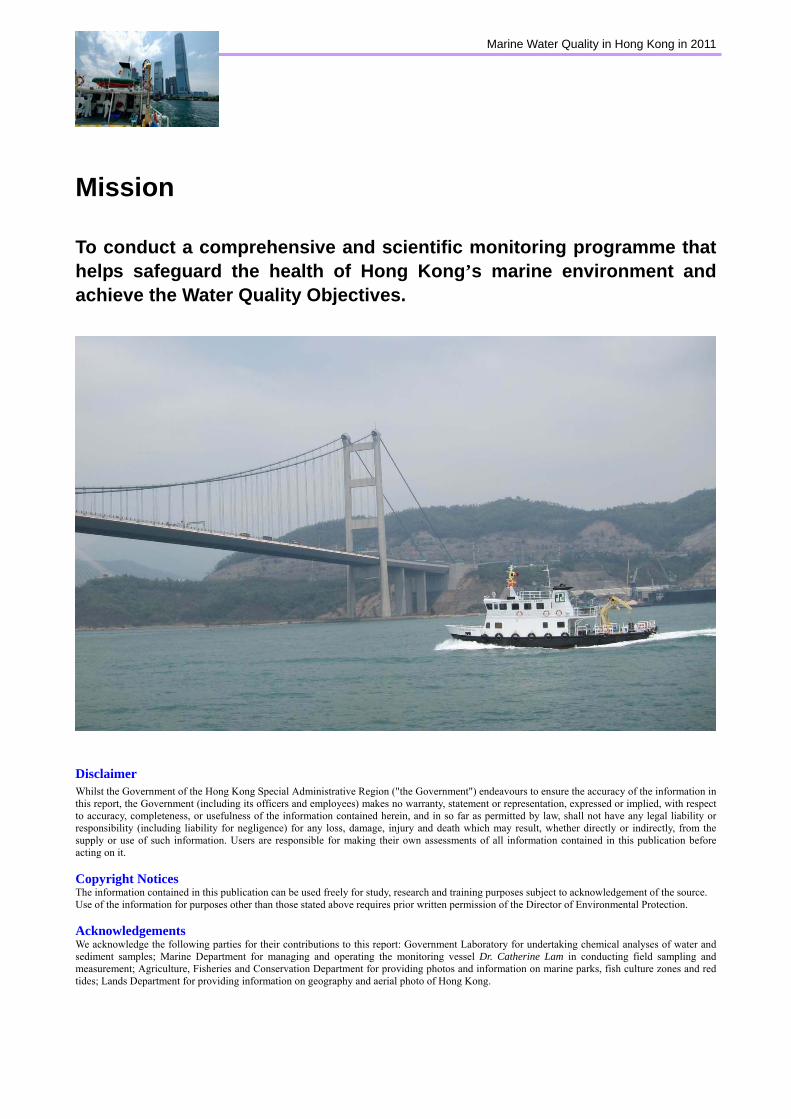
Mission To conduct a comprehensive and scientific monitoring programme that helps safeguard the health of Hong Kong’s marine environment and achieve the Water Quality Objectives.
Disclaimer Whilst the Government of the Hong Kong Special Administrative Region ("the Government") endeavours to ensure the accuracy of the information in this report, the Government (including its officers and employees) makes no warranty, statement or representation, expressed or implied, with respect to accuracy, completeness, or usefulness of the information contained herein, and in so far as permitted by law, shall not have any legal liability or responsibility (including liability for negligence) for any loss, damage, injury and death which may result, whether directly or indirectly, from the supply or use of such information. Users are responsible for making their own assessments of all information contained in this publication before acting on it. Copyright Notices The information contained in this publication can be used freely for study, research and training purposes subject to acknowledgement of the source. Use of the information for purposes other than those stated above requires prior written permission of the Director of Environmental Protection. Acknowledgements We acknowledge the following parties for their contributions to this report: Government Laboratory for undertaking chemical analyses of water and sediment samples; Marine Department for managing and operating the monitoring vessel Dr. Catherine Lam in conducting field sampling and measurement; Agriculture, Fisheries and Conservation Department for providing photos and information on marine parks, fish culture zones and red tides; Lands Department for providing information on geography and aerial photo of Hong Kong.

Marine Water Quality in Hong Kong in 2011
Introduction The Hong Kong Special Administrative Region (HKSAR) has a land area of 1,104km2 and 1,651km2 of marine waters. It has long coastlines, including 463km in Kowloon Peninsula and New Territories and 727km in Hong Kong Island, Lantau Island and other small islands. Excluding Hong Kong Island and Lantau Island, there are 261 islands in the territory, each with an area greater than 500m2. Its coastal waters support a variety of marine life.
1

Marine Water Quality in Hong Kong in 2011
To protect the marine environment of Hong Kong, the Environmental Protection Department (EPD) has initiated a comprehensive marine water quality monitoring programme since 1986. The aims and objectives of the programme are to:
o indicate the state of coastal waters; o reveal long-term changes in water quality; o provide a basis for planning water pollution control strategies; and o assess compliance with the statutory Water Quality Objectives (WQOs).
Every month, the EPD monitors the marine water quality at 76 monitoring stations and collects and examines phytoplankton samples from 25 of the stations. We also monitor the water quality of 17 typhoon shelters, marinas, and dockyard across Hong Kong bimonthly. In addition, sediment samples are collected and analyzed at 60 stations, covering the 17 typhoon shelters, marinas, and dockyard, twice a year.
EPD’s marine monitoring vessel
“Dr. Catherine Lam”
2

Marine Water Quality in Hong Kong in 2011
The EPD has a dedicated marine monitoring vessel “Dr. Catherine Lam”. It is equipped with an advanced conductivity-temperature-depth (CTD) profiler linked to a computer-controlled rosette water sampler which takes field measurements and collects water samples simultaneously. Marine sediments are collected using bottom sediment grabs. The water and sediment samples are analysed by the EPD’s laboratories and the Government Laboratory on over 80 physical, chemical and biological parameters.
EPD’s staff and the computer-controlled rosette water sampler
3
Marine Water Quality in Hong Kong in 2011
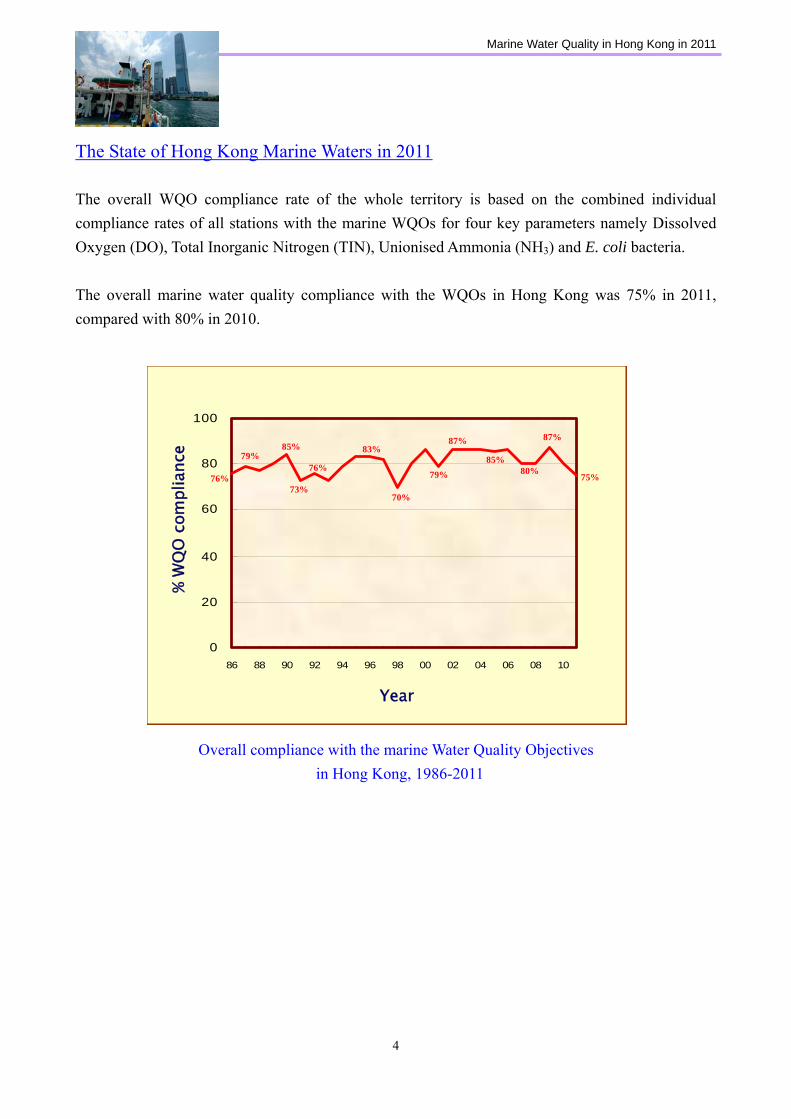
The State of Hong Kong Marine Waters in 2011 The overall WQO compliance rate of the whole territory is based on the combined individual compliance rates of all stations with the marine WQOs for four key parameters namely Dissolved Oxygen (DO), Total Inorganic Nitrogen (TIN), Unionised Ammonia (NH3) and E. coli bacteria. The overall marine water quality compliance with the WQOs in Hong Kong was 75% in 2011, compared with 80% in 2010.
0
20
40
60
80
100
86 88 90 92 94 96 98 00 02 04 06 08 10
Year
% W
QO
com
plia
nce
85%
87%
79%
70%
83%
76%
73%
85%79%
76%
87%
80%75%
Overall compliance with the marine Water Quality Objectives in Hong Kong, 1986-2011
4

Marine Water Quality in Hong Kong in 2011
30
40
50
60
70
80
90
100
110
86 88 90 92 94 96 98 00 02 04 06 08 10
% co
mpl
ianc
e
YearCompliance rate for DO objective
Overall compliance rate for WQOs
Compliance rate for NH3 objectiveCompliance rate for TIN objective
Compliance rate for E. coli objective for secondary contact recreation subzones
Overall compliance rate with the WQOs and the compliance rates for the four objectives in Hong Kong, 1986-2011
A lower overall WQO compliance rate in 2011 compared with 2010 was mainly due to a decline in the compliance rates with DO objective from 71.1% in 2010 to 69.7% in 2011 and the TIN objective from 65.2% in 2010 to 50.7% in 2011.
5

Marine Water Quality in Hong Kong in 2011
Dissolved Oxygen Non-compliance with the DO objective in 2011 was observed in the Tolo Harbour and Channel Water Control Zone (WCZ), Victoria Harbour WCZ and Western Buffer WCZ.
Dissolved oxygen (depth-average) levels in Hong Kong waters
in summer months (June-September) of 2011
Water Quality Parameter Water Quality Objective Water Control Zone (WCZ) to which the WQO applies
Dissolved Oxygen
(depth-average)
Not less than 4 mg/L for
90% of samples
Marine waters of all WCZs except Tolo Harbour &
Channel WCZ
Dissolved Oxygen
(bottom)
Not less than 2 mg/L for
90% of samples
Marine waters of all WCZs except Tolo Harbour &
Channel WCZ
Dissolved Oxygen
(all depths) Not less than 4mg/L Channel Subzone in Tolo Harbour & Channel WCZ
Dissolved Oxygen
(surface to 2m above bottom) Not less than 4mg/L
Buffer and Harbour Subzones in Tolo Harbour &
Channel WCZ
Not less than 3mg/L
Water Quality Objective for dissolved oxygen in the ten Water Control Zones
Buffer Subzone in Tolo Harbour & Channel WCZ Dissolved Oxygen
(bottom) Not less than 2mg/L Harbour Subzone in Tolo Harbour & Channel WCZ
6

Marine Water Quality in Hong Kong in 2011
Dissolved oxygen (bottom) levels in Hong Kong waters in summer months (June-September) of 2011
As pointed out in previous marine reports, the DO levels in a water body can be affected by organic pollution as well as natural factors such as temperature and stratification of the water column. High temperature can markedly reduce the solubility of oxygen in the water column, and hence reduce the DO level in hot weather. Since 2011’s monitoring data, on the basis of parameters such as organic nitrogen and 5-day Biochemical Oxygen Demand (BOD5), did not show any obvious sign of an increase in organic pollution in Hong Kong’s waters, the lower compliance rate with the DO objective in 2011 was likely related to the hot weather experienced during the summer months of that year. According to the Hong Kong Observatory’s weather report for 2011, there was an exceptionally strong anticyclone covering southern China during August making Hong Kong unusually hotter. That month’s mean temperature was one of the three hottest for August since 1884. During the summer months of 2011, low DO levels were observed in many parts of Hong Kong’s waters largely due to the unusually hot weather.
7
Marine Water Quality in Hong Kong in 2011
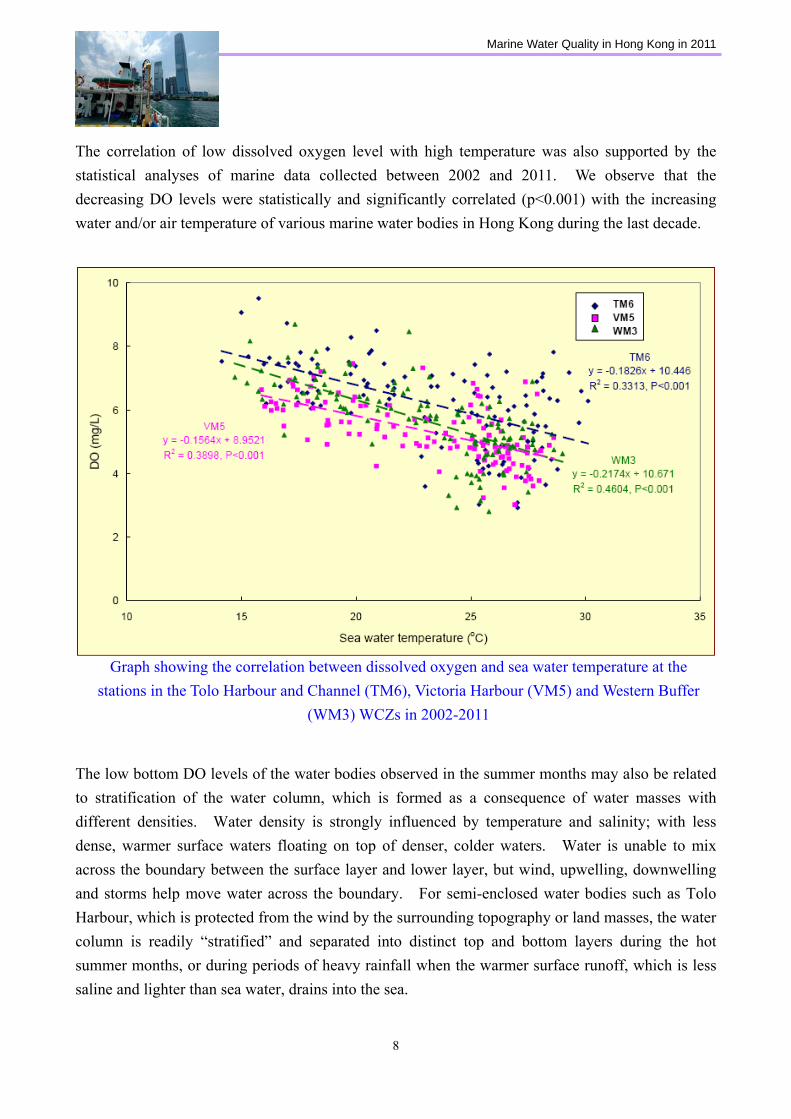
The correlation of low dissolved oxygen level with high temperature was also supported by the statistical analyses of marine data collected between 2002 and 2011. We observe that the decreasing DO levels were statistically and significantly correlated (p<0.001) with the increasing water and/or air temperature of various marine water bodies in Hong Kong during the last decade.
Graph showing the correlation between dissolved oxygen and sea water temperature at the stations in the Tolo Harbour and Channel (TM6), Victoria Harbour (VM5) and Western Buffer
(WM3) WCZs in 2002-2011
The low bottom DO levels of the water bodies observed in the summer months may also be related to stratification of the water column, which is formed as a consequence of water masses with different densities. Water density is strongly influenced by temperature and salinity; with less dense, warmer surface waters floating on top of denser, colder waters. Water is unable to mix across the boundary between the surface layer and lower layer, but wind, upwelling, downwelling and storms help move water across the boundary. For semi-enclosed water bodies such as Tolo Harbour, which is protected from the wind by the surrounding topography or land masses, the water column is readily “stratified” and separated into distinct top and bottom layers during the hot summer months, or during periods of heavy rainfall when the warmer surface runoff, which is less saline and lighter than sea water, drains into the sea.
8
Marine Water Quality in Hong Kong in 2011
Total Inorganic Nitrogen In terms of nutrients, although the overall annual average levels of TIN in the Victoria Harbour WCZ only increased from 0.34 mg/L in 2010 to 0.39 mg/L in 2011, the compliance rate with the TIN objective decreased markedly from 90% in 2010 to 30% in 2011. The higher non-compliance rate in 2011 was due to the fact that out of the 10 stations in the Victoria Harbour WCZ, 6 stations in the central and western parts of Victoria Harbour which marginally complied with the objective (TIN level below 0.4 mg/L) in 2010 could not comply with the WQO in 2011. The increase in TIN levels could be due to a higher background TIN level under the influence of Pearl River discharge, as reflected in the increase in TIN levels in many stations in the Northwestern and Southern WCZs, the year-to-year normal range of fluctuation of the discharge from the Tolo Harbour Effluent Export Scheme and surface run-off, as well as the gradual increase in the amount of effluent discharged from the four preliminary treatment plants located between North Point and Central during the period. After the commissioning of HATS Stage 2A in 2014, we anticipate that the pollution load into Victoria Harbour will be significantly reduced when the effluent from the four preliminary treatment plants are intercepted from direct discharge and collected for treatment at the Stonecutters Island Sewage Treatment Works.
9

Marine Water Quality in Hong Kong in 2011
The percentage compliance rates of three WCZs, i.e. Victoria Harbour, Western Buffer and North Western, are lower in 2011 as compared with those in 2010. For the Victoria Harbour WCZ, the lower compliance rate (50%) in 2011 was mainly due to the wide-spread low DO situation across the harbour particularly in the summer months as well as the increase in TIN levels which could be due to a higher background TIN level under the influence of Pearl River discharge, the year-to-year normal range of fluctuation of the discharge from the Tolo Harbour Effluent Export Scheme and surface run-off, as well as the gradual increase in the amount of effluent discharged from the four preliminary treatment plants located between North Point and Central during the period. For the Western Buffer WCZ, the lower compliance rate in 2011 was due to lower levels of DO recorded in the summer. The small drop in compliance rate in the Northwestern WCZ from 78% in 2010 to 72% in 2011 was mainly due to the higher levels of TIN recorded at the stations located at the western side of the WCZ, which could be attributed to the higher background TIN level under the influence of Pearl River discharge.
Level of compliance with the Water Quality Objectives in the ten Water Control Zones in 2010 and 2011
10
Marine Water Quality in Hong Kong in 2011
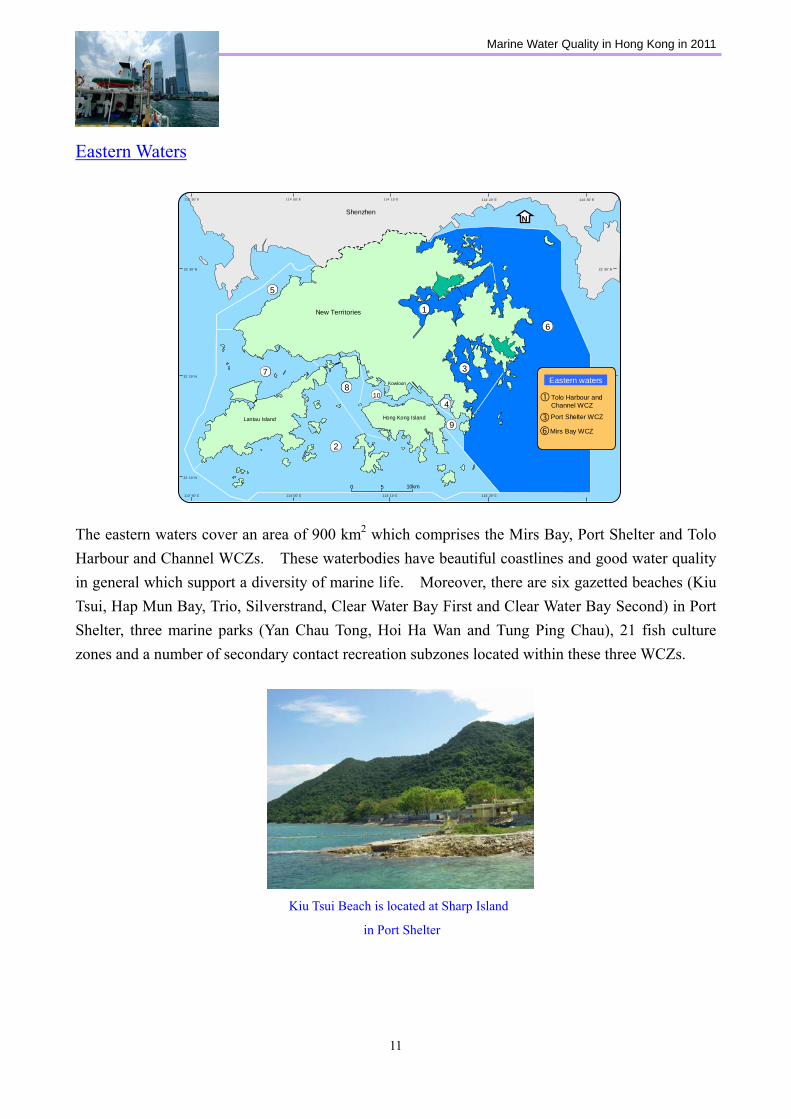
Eastern Waters
22° 20’ N
22° 10’ N
New Territories
Lantau Island
2
9
Hong Kong Island
Kowloon
3
1
5
7
2S
10.1
810.2
6
4
5
10
Shenzhen
Hong Kong Island
Kowloon
Lantau Island
N
New Territories
0 5 10km
114° 20’ E114° 10’ E114° 00’ E113° 50’ E
22° 30’ N
114° 30’ E
114° 00’ E 114° 10’ E 114° 20’ E
22° 30’ N
Eastern waters
Tolo Harbour and Channel WCZ
Port Shelter WCZ
Mirs Bay WCZ
113° 50’ E
The eastern waters cover an area of 900 km2 which comprises the Mirs Bay, Port Shelter and Tolo Harbour and Channel WCZs. These waterbodies have beautiful coastlines and good water quality in general which support a diversity of marine life. Moreover, there are six gazetted beaches (Kiu Tsui, Hap Mun Bay, Trio, Silverstrand, Clear Water Bay First and Clear Water Bay Second) in Port Shelter, three marine parks (Yan Chau Tong, Hoi Ha Wan and Tung Ping Chau), 21 fish culture zones and a number of secondary contact recreation subzones located within these three WCZs.
Kiu Tsui Beach is located at Sharp Island
in Port Shelter
11

Marine Water Quality in Hong Kong in 2011
Mirs Bay Water Control Zone
0
20
40
60
80
100
86 88 90 92 94 96 98 00 02 04 06 08 10
67%
98%100%
Year
% WQO com
plianc
e
In 2011, the overall WQO compliance rate of the Mirs Bay WCZ was 98%, same as in 2010 and 2009. The water quality of the Mirs Bay WCZ was generally good in 2011 with high DO as well as low nutrient levels which fully met their respective WQO. Moreover, Mirs Bay also complied with the bacteriological WQO of ≤ 610 E. coli cfu / 100 mL (annual geometric mean) for secondary contact recreation. The only recorded non-compliance with the WQOs was due to the low oxygen levels recorded at the sea bottom in August at station MM17 located in North Channel near Port Island, brought about by thermal stratification of the water column.
Year
Mirs Bay Water Control Zone
% W
QO
com
plia
nce
Tung Ping Chau is one of marine parks in Hong Kong and famous
for its sedimentary rock
12
Marine Water Quality in Hong Kong in 2011
13
Port Shelter Water Control Zone
0
20
40
60
80
100
86 88 90 92 94 96 98 00 02 04 06 08 10
82%
92%100%
Year
% WQO com
plianc
e
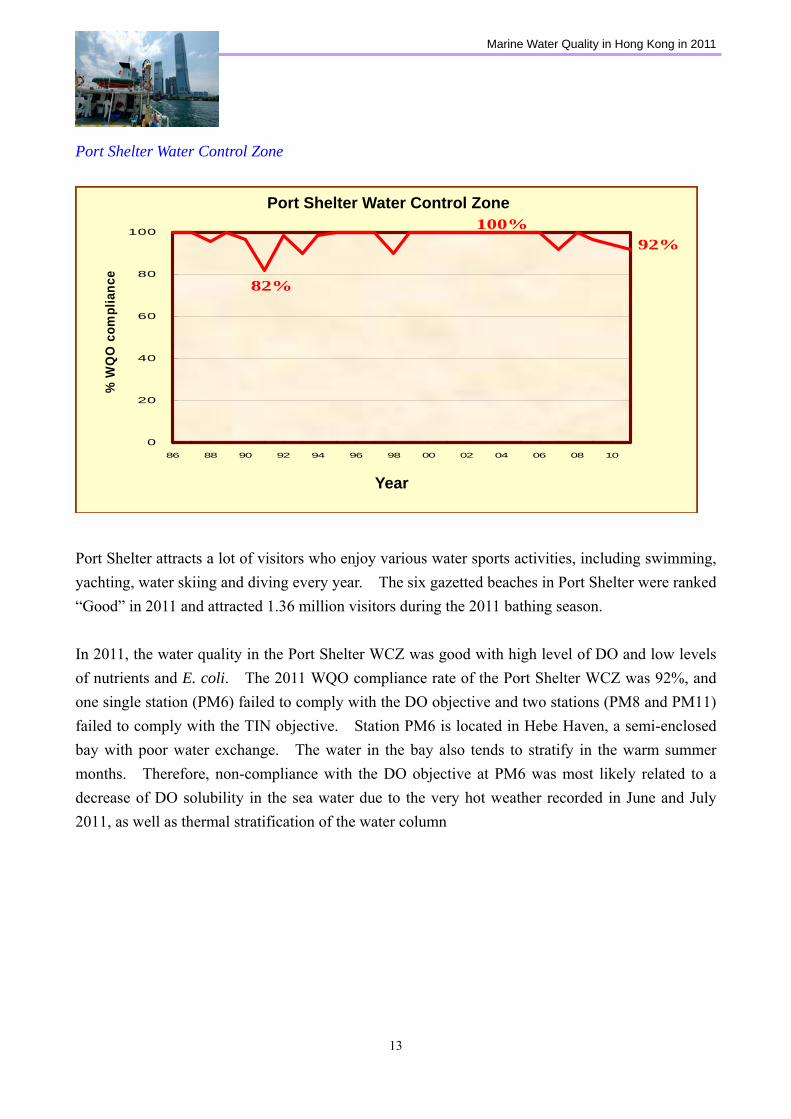
Port Shelter attracts a lot of visitors who enjoy various water sports activities, including swimming, yachting, water skiing and diving every year. The six gazetted beaches in Port Shelter were ranked “Good” in 2011 and attracted 1.36 million visitors during the 2011 bathing season. In 2011, the water quality in the Port Shelter WCZ was good with high level of DO and low levels of nutrients and E. coli. The 2011 WQO compliance rate of the Port Shelter WCZ was 92%, and one single station (PM6) failed to comply with the DO objective and two stations (PM8 and PM11) failed to comply with the TIN objective. Station PM6 is located in Hebe Haven, a semi-enclosed bay with poor water exchange. The water in the bay also tends to stratify in the warm summer months. Therefore, non-compliance with the DO objective at PM6 was most likely related to a decrease of DO solubility in the sea water due to the very hot weather recorded in June and July 2011, as well as thermal stratification of the water column
Year
Port Shelter Water Control Zone
% W
QO
com
plia
nce

Marine Water Quality in Hong Kong in 2011
On the other hand, the annual mean TIN levels at PM8 and PM11 in 2011 were 0.106 and 0.115 mg/L respectively and marginally exceeded the TIN objective (0.1 mg/L). Since both stations are located at outer Port Shelter and away from local pollution sources including surface runoffs and discharges from villages as well as fish culture zones in Sai Kung area, their non-compliance was largely due to the increasing levels of TIN levels in the eastern waters of Hong Kong in recent years, as illustrated in the trend line shown below.
Annual mean total inorganic nitrogen levels of all 23 stations located
in the eastern waters of Hong Kong in 2002-2011
14

Marine Water Quality in Hong Kong in 2011
Tolo Harbour and Channel Water Control Zone Since the implementation of the Tolo Harbour Action Plan (including control of livestock wastes, improvement of sewage treatment facilities, export of treated effluent outside Tolo Harbour and extension of village sewerage) in the mid-80s, there has been a steady improvement in water quality (e.g. a decrease in the levels of 5-day Biochemical Oxygen Demand (BOD5), E. coli, nitrogen and orthophosphate phosphorus measurements) in Tolo Harbour in the past decade. The long term data as shown in the figures below indicated the decreasing trends of organic and nutrient loading. Moreover, Tolo Harbour is also able to comply with the bacteriological WQO of ≤ 610 E. coli cfu / 100 mL (annual geometric mean) for secondary contact recreation.
15

Marine Water Quality in Hong Kong in 2011
0
20
40
60
80
100
86 88 90 92 94 96 98 00 02 04 06 08 10
40%
57%
86% The 2011 overall WQO compliance rate of the Tolo Harbour and Channel WCZ was 57% and was slightly higher than that in 2010 (50%). Same as before, the non-compliance was solely due to the low DO situation in the summer months. As already pointed out, the low DO level in sea water could be due to the decrease in oxygen solubility during the hot weather. In addition, Tolo Harbour is a shallow semi-enclosed water body with low water exchange rate with Mirs Bay. The harbour’s essentially landlocked situation often leads to stratification of the water column inside particularly during the hot summer months. As a result, the harbour water experienced a lower compliance rate (14.3%) with the DO objective in 2011, as observed in previous years.
Year
% W
QO
com
plia
nce
Tolo Harbour and Channel Water Control Zone
Tai Mei Tuk waterfront in Tolo Harbour is one of the
most popular locations for water sports
16
Marine Water Quality in Hong Kong in 2011
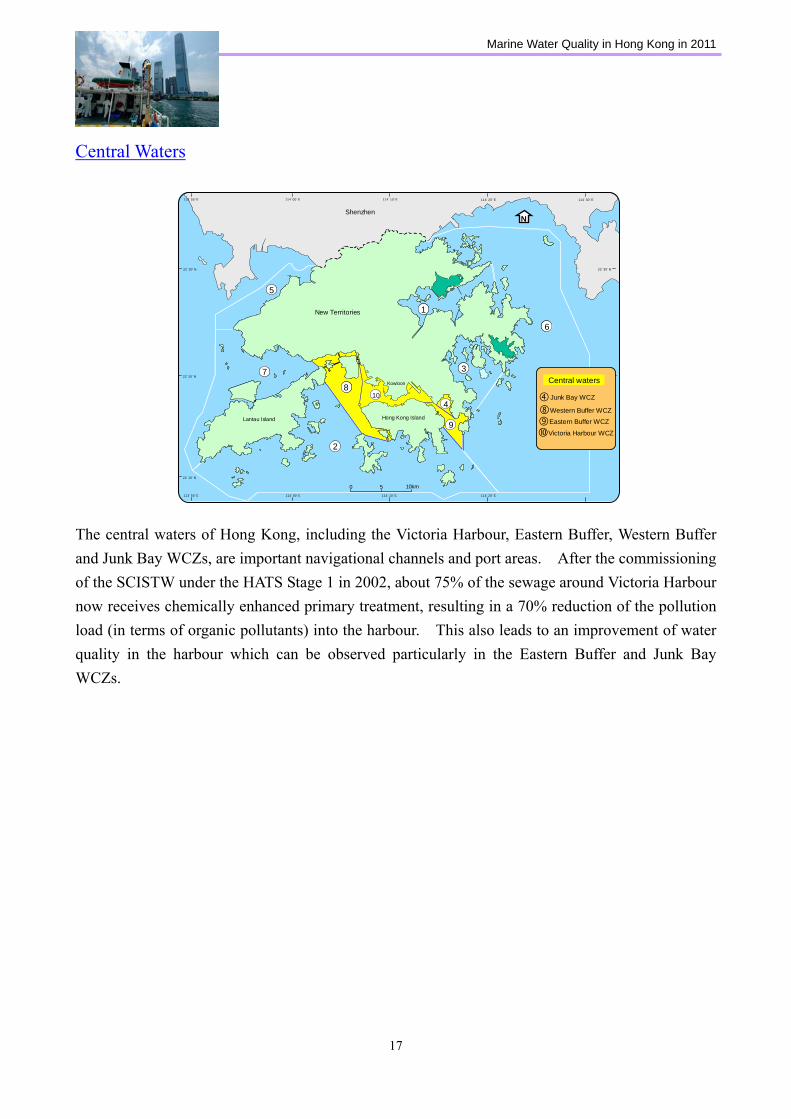
Central Waters
22° 20’ N
22° 10’ N
New Territories
Lantau Island
2
9
Hong Kong Island
Kowloon
3
1
5
7
2S
10.1
810.2
6
4
5
10
Shenzhen
Hong Kong Island
Kowloon
Lantau Island
N
New Territories
0 5 10km
114° 20’ E114° 10’ E114° 00’ E113° 50’ E
22° 30’ N
114° 30’ E
114° 00’ E 114° 10’ E 114° 20’ E
22° 30’ N
113° 50’ E
Central waters
Junk Bay WCZ
Western Buffer WCZ
Eastern Buffer WCZ
Victoria Harbour WCZ
The central waters of Hong Kong, including the Victoria Harbour, Eastern Buffer, Western Buffer and Junk Bay WCZs, are important navigational channels and port areas. After the commissioning of the SCISTW under the HATS Stage 1 in 2002, about 75% of the sewage around Victoria Harbour now receives chemically enhanced primary treatment, resulting in a 70% reduction of the pollution load (in terms of organic pollutants) into the harbour. This also leads to an improvement of water quality in the harbour which can be observed particularly in the Eastern Buffer and Junk Bay WCZs.
17

Marine Water Quality in Hong Kong in 2011
18
Victoria Harbour Water Control Zone The figure below illustrates that the water quality of Victoria Harbour has been on an improving trend during the last decade after implementation of the HATS Stage 1 in end 2001.
(mg/
L)
year
(cfu
/100
mL)
year
year
(mg/
L)
year
(mg/
L)
year
(mg/
L)
E. coli
Total Inorganic Nitrogen
Orthophosphate phosphorusWater quality in Victoria Harbour WCZ, 1986-2011
0
1000
5000
6000
86 88 90 92 94 96 98 00 02 04 06 08 10
2000
3000
4000
0
0.01
0.02
0.03
0.04
0.05
0.06
86 88 90 92 94 96 98 00 02 04 06 08 10
0
0.1
0.2
0.3
0.4
0.5
86 88 90 92 94 96 98 00 02 04 06 08 10
( HATS Stage 1 commissioned in end 2001)
0
0.5
1
1.5
2
86 88 90 92 94 96 9 00 02 04 06 08 10
BOD5
8
0
0.1
0.2
0.3
0.4
86 88 90 92 94 96 98 00 02 04 06 08 10
Ammonia Nitrogen
0.28
0.13
0.297
0.498
5300
0.054
0.029
1.4
0.94
0.72
0.17
920 610
0.393
0.019

Marine Water Quality in Hong Kong in 2011
0
20
40
60
80
100
86 88 90 92 94 96 98 00 02 04 06 08 10
45%
50%
97%
The overall WQO compliance rate of the WCZ was only 50%, as compared with 76.7% in 2010, and it was mainly due to the non-compliance with the DO objective at eight stations in the WCZ (VM1, 2, 4, 5, 6, 7, 8 and 12) and the non-compliance with the TIN objective at stations VM5, 6, 7, 8, 12, 14 and 15) in 2011.
Year
% W
QO
com
plia
nce
Victoria Harbour Water Control Zone
It should be noted that this low DO phenomenon in 2011 was also observed across the entire Victoria Harbour as well as other WCZs such as Western Buffer and North Western.
19
Marine Water Quality in Hong Kong in 2011
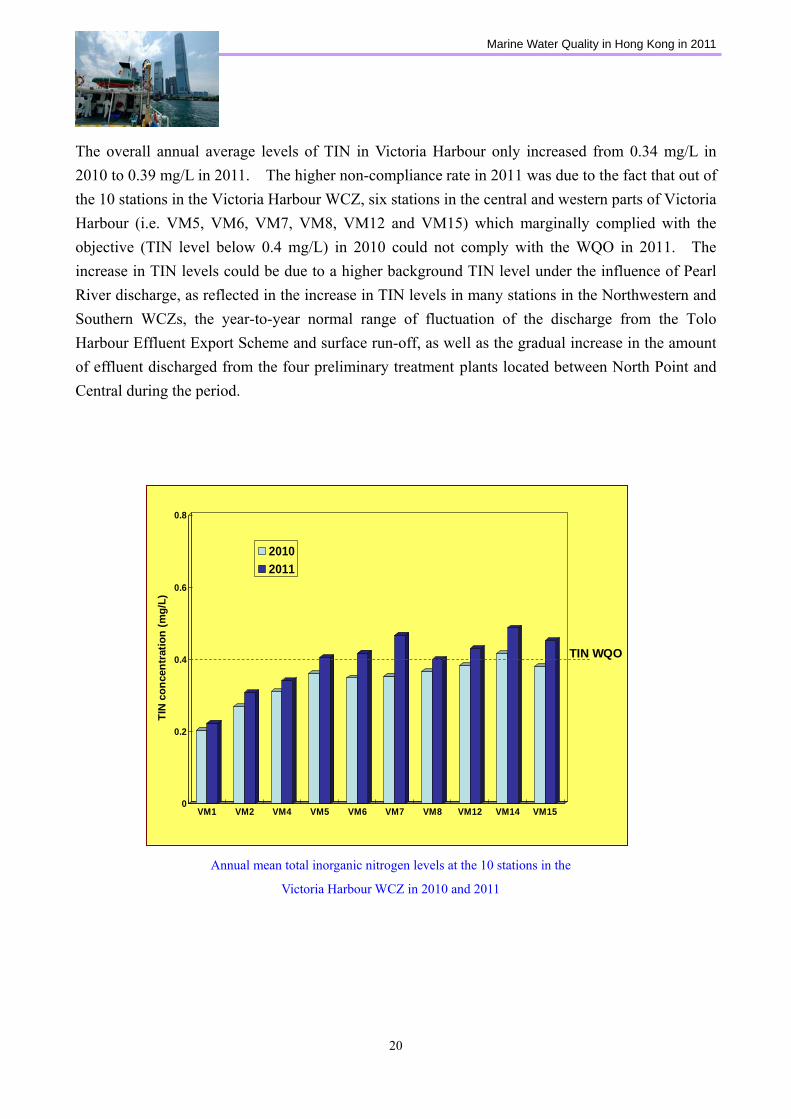
The overall annual average levels of TIN in Victoria Harbour only increased from 0.34 mg/L in 2010 to 0.39 mg/L in 2011. The higher non-compliance rate in 2011 was due to the fact that out of the 10 stations in the Victoria Harbour WCZ, six stations in the central and western parts of Victoria Harbour (i.e. VM5, VM6, VM7, VM8, VM12 and VM15) which marginally complied with the objective (TIN level below 0.4 mg/L) in 2010 could not comply with the WQO in 2011. The increase in TIN levels could be due to a higher background TIN level under the influence of Pearl River discharge, as reflected in the increase in TIN levels in many stations in the Northwestern and Southern WCZs, the year-to-year normal range of fluctuation of the discharge from the Tolo Harbour Effluent Export Scheme and surface run-off, as well as the gradual increase in the amount of effluent discharged from the four preliminary treatment plants located between North Point and Central during the period.
0
0.2
0.4
0.6
0.8
VM1 VM2 VM4 VM5 VM6 VM7 VM8 VM12 VM14 VM15
20102011
TIN WQO
TIN
con
cent
ratio
n (m
g/L)
Annual mean total inorganic nitrogen levels at the 10 stations in the Victoria Harbour WCZ in 2010 and 2011
20

Marine Water Quality in Hong Kong in 2011
At present, sewage discharged from the four remaining preliminary treatment plants in the middle and western parts of Hong Kong Island are still contributing to the relatively high levels of E. coli in central Victoria Harbour. To further improve the water quality of Victoria Harbour, the construction of HATS Stage 2A has proceeded with a view to commissioning by end 2014 (http://www.cleanharbour.gov.hk/english/index.html). Upon comissioning, the sewage tunnels will collect the remaining 25% of the sewage currently generated daily from North Point to Ap Lei Chau in the middle and western parts of Hong Kong Island, and convey the sewage to the SCISTW for treatment. Wan Chai East
Preliminary Treatment Works
Locations of the four preliminary treatment plants between North Point and Central
North Point Preliminary
Treatment Works
Wan Chai West Preliminary
Treatment Works
Central Preliminary Treatment Works
North Point Preliminary
Treatment Works
North Point Preliminary
Treatment Works
North Point Preliminary
Treatment Works
North Point Preliminary
Treatment Works
21

Marine Water Quality in Hong Kong in 2011
Eastern Buffer and Junk Bay Water Control Zones
0
20
40
60
80
100
86 88 90 92 94 96 98 00 02 04 06 08 10
67%
100%
Since the implementation of HATS Stage 1 in 2002 by which all sewage generated from Junk Bay (Tseung Kwan O), the Kowloon Peninsula and east of Hong Kong Island (Chai Wan) was diverted and treated at the SCISTW, the water quality of these two WCZs has improved markedly with increasing DO and decreasing nutrient and bacterical levels. In 2011, the Eastern Buffer and Junk Bay WCZs achieved full compliance (100%) with the WQOs.
Year
% W
QO
com
plia
nce
Eastern Buffer Water Control Zone
0
20
40
60
80
100
86 88 90 92 94 96 98 00 02 04 06 08 10
67%
100%
22
Year
Junk Bay Water Control Zone
% W
QO
com
plia
nce
Marine Water Quality in Hong Kong in 2011
Western Buffer Water Control Zone
0
20
40
60
80
100
86 88 90 92 94 96 98 00 02 04 06 08 10
67%
75%
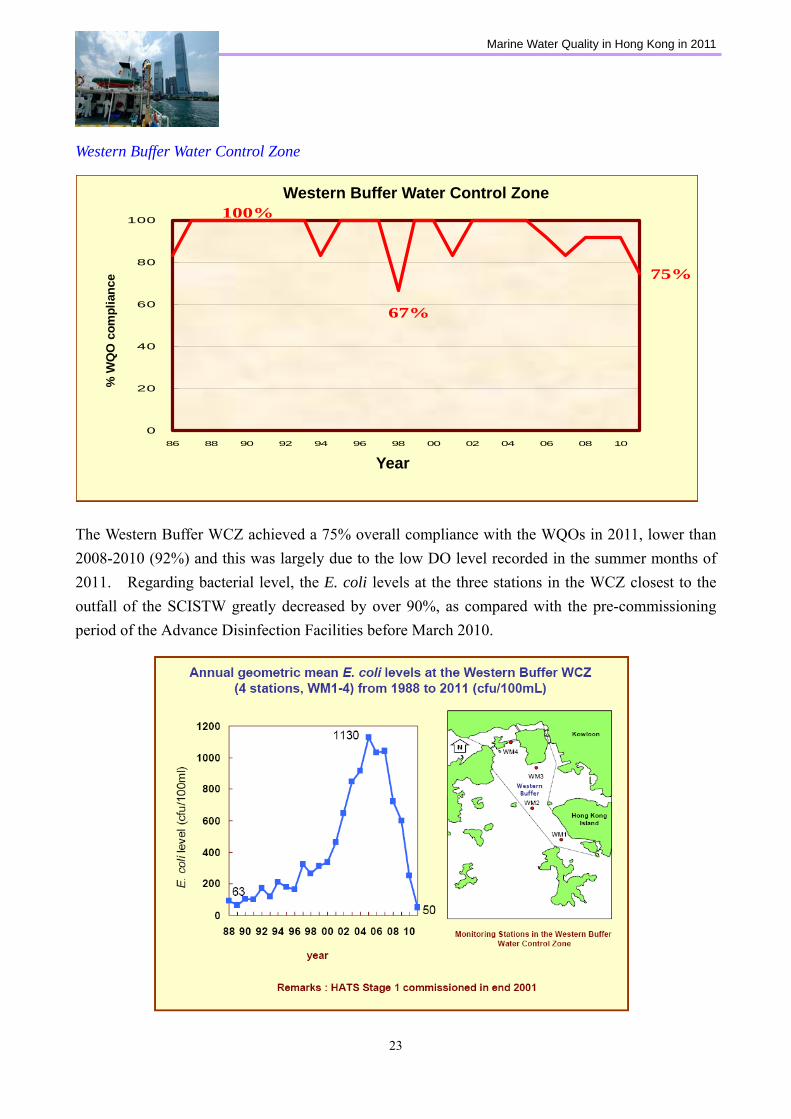
100% The Western Buffer WCZ achieved a 75% overall compliance with the WQOs in 2011, lower than 2008-2010 (92%) and this was largely due to the low DO level recorded in the summer months of 2011. Regarding bacterial level, the E. coli levels at the three stations in the WCZ closest to the outfall of the SCISTW greatly decreased by over 90%, as compared with the pre-commissioning period of the Advance Disinfection Facilities before March 2010.
Year
% W
QO
com
plia
nce
Western Buffer Water Control Zone
23

Marine Water Quality in Hong Kong in 2011
Western Waters
22° 20’ N
22° 10’ N
New Territories
Lantau Island
2
9
Hong Kong Island
Kowloon
3
1
5
7
2S
10.1
810.2
6
4
5
10
Shenzhen
Hong Kong Island
Kowloon
Lantau Island
N
New Territories
0 5 10km
114° 20’ E114° 10’ E114° 00’ E113° 50’ E
22° 30’ N
114° 30’ E
114° 00’ E 114° 10’ E 114° 20’ E
22° 30’ N
Western waters
Deep Bay WCZ
North Western WCZ
113° 50’ E
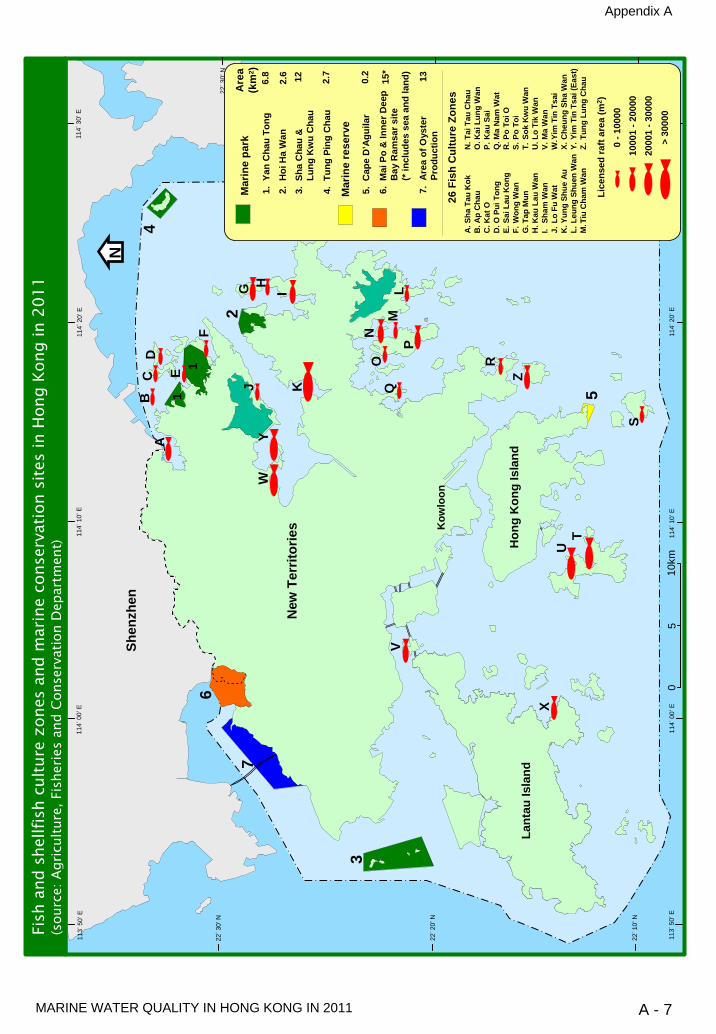
The Deep Bay and North Western WCZs are located to the west of Hong Kong. Other than local discharge, both WCZs were influenced by the discharges from Pearl River during the wet season. The Deep Bay WCZ also receives discharges from Shenzhen River all year round. The Deep Bay WCZ includes the ecologically sensitive Mai Po and Inner Deep Bay Ramsar site, and areas of oyster culture. The Ramsar Site inside Deep Bay supports a high diversity of birds. About 300 species, representing about 70% of the Hong Kong avian fauna, have been recorded there. The site regularly supports over 100,000 waterbirds for the whole year and some 50,000 waterbirds in mid-winter. It is an important feeding and resting ground for wintering and migratory birds, including a number of globally threatened species (e.g. Black-faced Spoonbill, Saunders's Gull and Imperial Eagle). Some common birds in Deep Bay
24
Marine Water Quality in Hong Kong in 2011
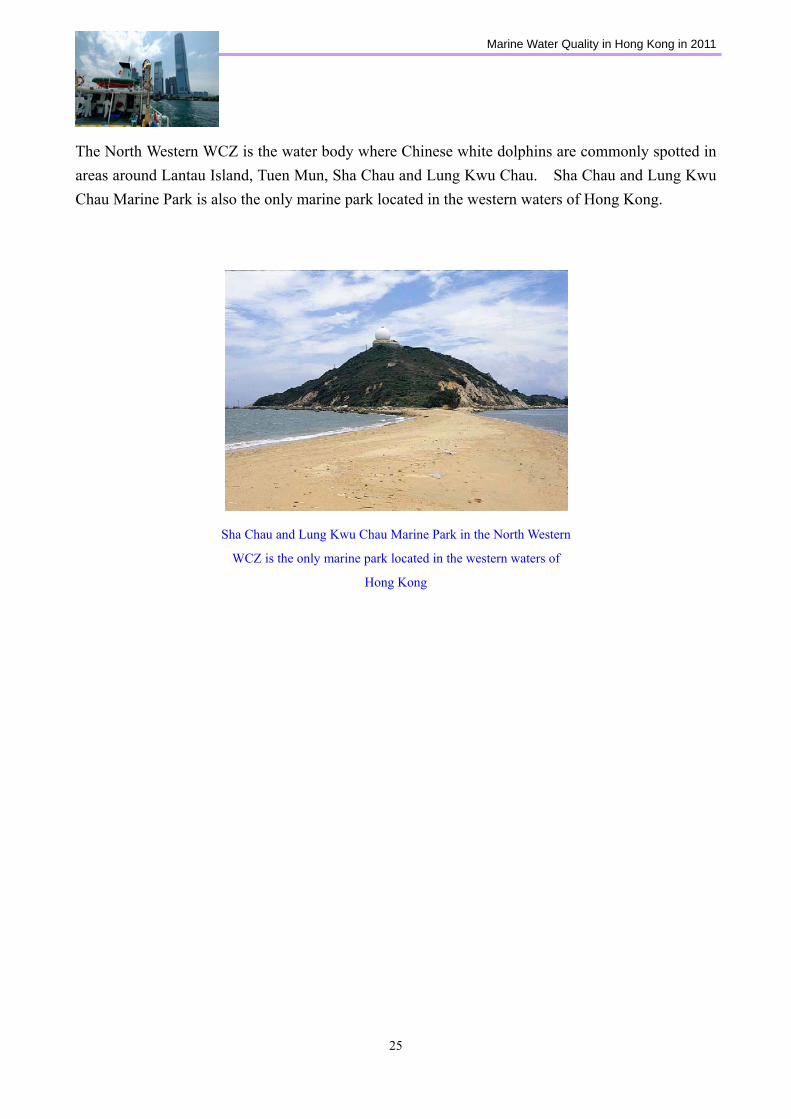
The North Western WCZ is the water body where Chinese white dolphins are commonly spotted in areas around Lantau Island, Tuen Mun, Sha Chau and Lung Kwu Chau. Sha Chau and Lung Kwu Chau Marine Park is also the only marine park located in the western waters of Hong Kong.
Sha Chau and Lung Kwu Chau Marine Park in the North Western
WCZ is the only marine park located in the western waters of
Hong Kong
25
Marine Water Quality in Hong Kong in 2011
26
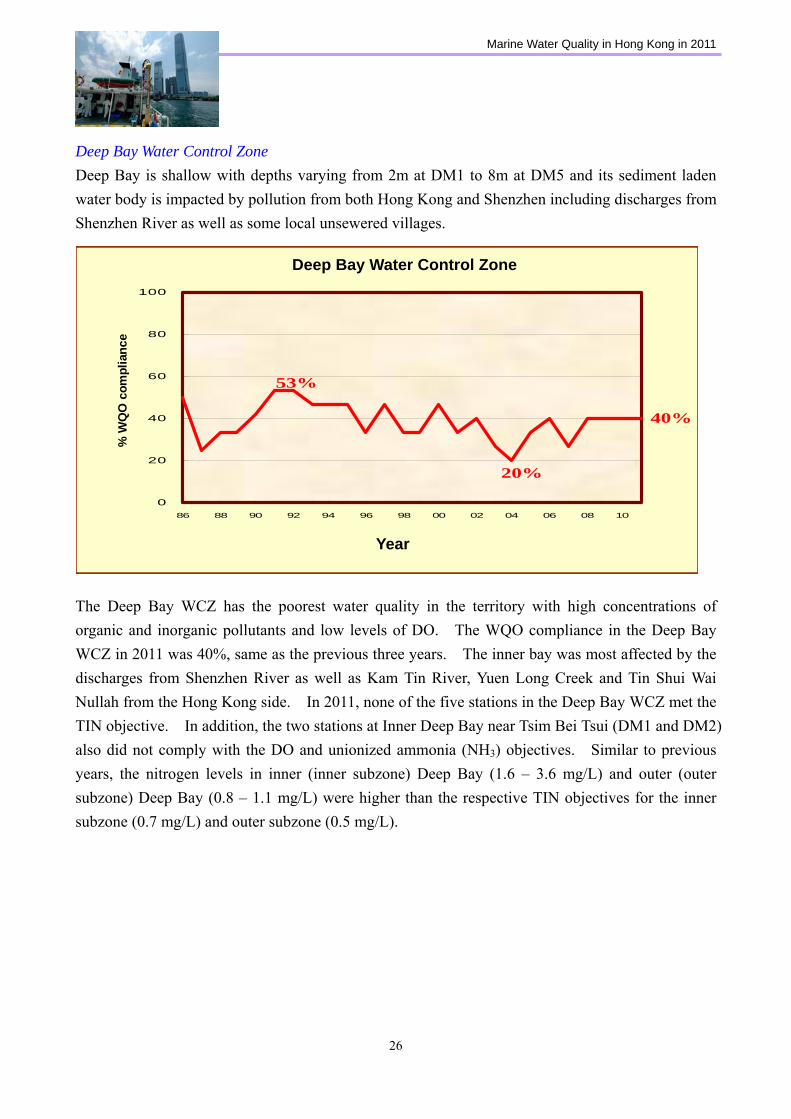
Deep Bay Water Control Zone Deep Bay is shallow with depths varying from 2m at DM1 to 8m at DM5 and its sediment laden water body is impacted by pollution from both Hong Kong and Shenzhen including discharges from Shenzhen River as well as some local unsewered villages.
0
20
40
60
80
100
86 88 90 92 94 96 98 00 02 04 06 08 10
20%
40%
53%
The Deep Bay WCZ has the poorest water quality in the territory with high concentrations of organic and inorganic pollutants and low levels of DO. The WQO compliance in the Deep Bay WCZ in 2011 was 40%, same as the previous three years. The inner bay was most affected by the discharges from Shenzhen River as well as Kam Tin River, Yuen Long Creek and Tin Shui Wai Nullah from the Hong Kong side. In 2011, none of the five stations in the Deep Bay WCZ met the TIN objective. In addition, the two stations at Inner Deep Bay near Tsim Bei Tsui (DM1 and DM2) also did not comply with the DO and unionized ammonia (NH3) objectives. Similar to previous years, the nitrogen levels in inner (inner subzone) Deep Bay (1.6 – 3.6 mg/L) and outer (outer subzone) Deep Bay (0.8 – 1.1 mg/L) were higher than the respective TIN objectives for the inner subzone (0.7 mg/L) and outer subzone (0.5 mg/L).
Year
% W
QO
com
plia
nce
Deep Bay Water Control Zone
Marine Water Quality in Hong Kong in 2011
27
North Western Water Control Zone
0
20
40
60
80
100
86 88 90 92 94 96 98 00 02 04 06 08 10
72%
53%
100%
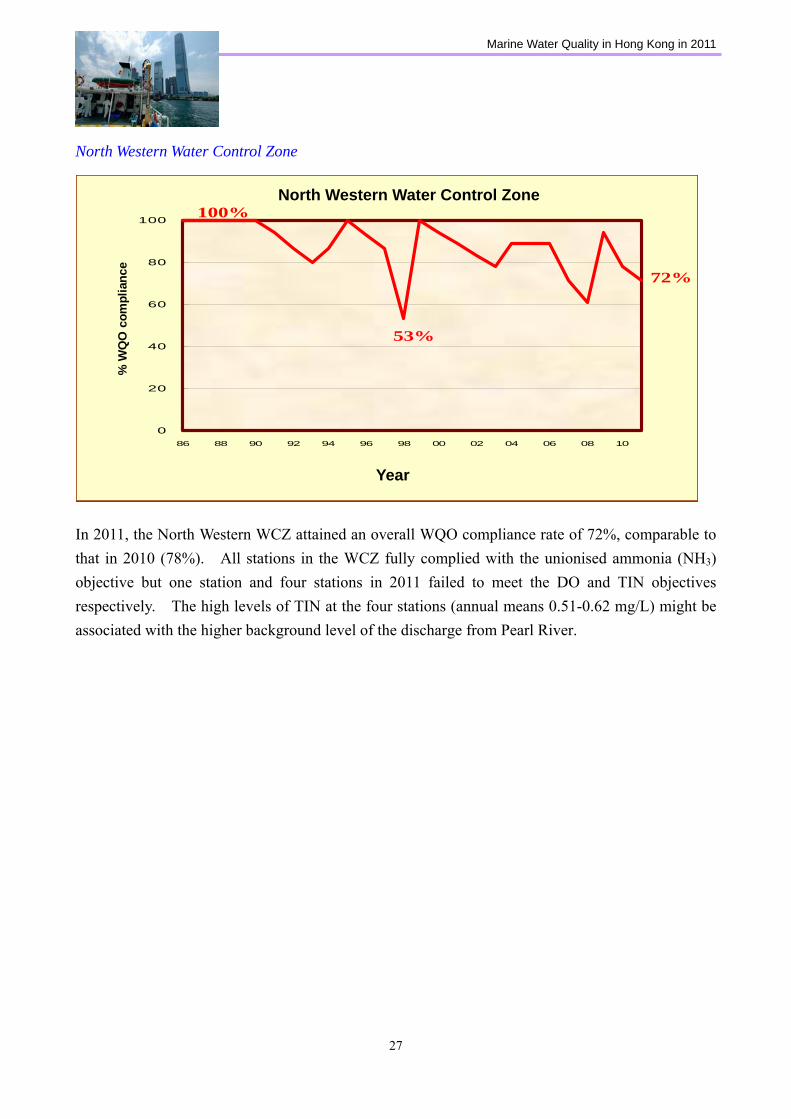
In 2011, the North Western WCZ attained an overall WQO compliance rate of 72%, comparable to that in 2010 (78%). All stations in the WCZ fully complied with the unionised ammonia (NH3) objective but one station and four stations in 2011 failed to meet the DO and TIN objectives respectively. The high levels of TIN at the four stations (annual means 0.51-0.62 mg/L) might be associated with the higher background level of the discharge from Pearl River.
Year
% W
QO
com
plia
nce
North Western Water Control Zone

Marine Water Quality in Hong Kong in 2011
Southern Waters
0
20
40
60
80
100
86 88 90 92 94 96 98 00 02 04 06 08 10
84%
67%
Year
% WQO com
plianc
e
22° 20’ N
22° 10’ N
New Territories
Lantau Island
2
9
Hong Kong Island
Kowloon
3
1
5
7
2S
10.1
810.2
6
4
5
10
Shenzhen
Hong Kong Island
Kowloon
Lantau Island
N
New Territories
0 5 10km
114° 20’ E114° 10’ E114° 00’ E113° 50’ E
22° 30’ N
114° 30’ E
114° 00’ E 114° 10’ E 114° 20’ E
22° 30’ N
Southern waters
Southern WCZ
113° 50’ E
The southern waters consist of only one water control zone. The Southern WCZ stretches from Hong Kong Island south to Lantau Island and faces the South China Sea. The western part of the WCZ is influenced seasonally by the Pearl River flow and the effect diminishes gradually towards the eastern direction. Southern Water Control Zone
Year
Southern Water Control Zone
% W
QO
com
plia
nce
28

Marine Water Quality in Hong Kong in 2011
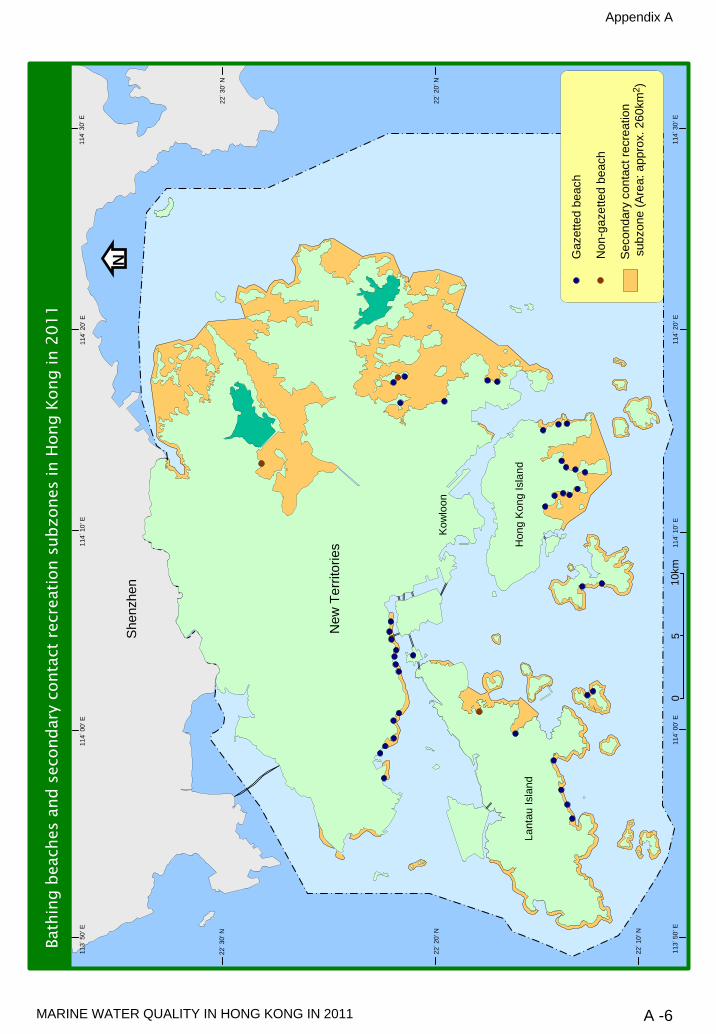
The Southern WCZ attained an overall 67% compliance with the WQOs in 2011, same as that in 2010. High compliance with the WQOs for unionised ammonia (100%) and dissolved oxygen (94%) were achieved in 2011. Nevertheless, all 16 stations within the WCZ failed to comply with the TIN objective in 2011, which could be related to the higher background level of the Pearl River flow. The Southern WCZ also covers a number of secondary contact recreation subzones which are mainly located along the coast in Southern District (Hong Kong Island) and the outlying islands. The secondary contact recreation subzones cover an area of approximately 67 km2, about 26% of the total area of the secondary contact recreation subzones of Hong Kong. In 2011, full compliance (100%) with the E. coli objective was attained in the secondary contact recreation subzones. There are 21 gazetted beaches located in this WCZ : 12 on Hong Kong Island, five on Lantau Island, two on Lamma Island and two on Cheung Chau. In 2011, all 21 gazetted beaches in the southern waters complied with the water quality objective for swimming and most beaches (except the Silvermine Bay Beach on Lantau Island) were ranked as “Good” during the bathing season from March to October.
Silvermine Bay Beach on Lantau Island
29

Marine Water Quality in Hong Kong in 2011
Sediment Quality and Levels of Toxic Substances in Hong Kong Sea bottom sediments are the ultimate sink of pollutants in the marine environment, and are also home to a wide variety of benthic organisms. The quality of marine sediments can therefore reflect the health of the marine environment as a whole. Since the implementation of the marine monitoring programme in 1986, elevated levels of selected heavy metals, in particular copper and silver, could often be detected in the sediments of Victoria Harbour and Tsuen Wan Bay. This was attributed to previous industrial pollution sources in the 60s to 80s before pollution control legislation was introduced. Nevertheless, through EPD’s efforts in enforcing relevant pollution control ordinances, i.e. the Water Pollution Control Ordinance and Waste Disposal Ordinance, and the removal of various industrial pollution sources, we observe a general decreasing trend of total metals in sediments at stations in Victoria Harbour such as VS6 since 1991.
Sediment sample collected by sediment grab
Note : Total metals include cadmium, chromium, copper, mercury, nickel, lead, silver
and zinc
30

Marine Water Quality in Hong Kong in 2011
With regard to trace organic pollutants such as polychlorinated biphenyls (PCBs), they were generally present at low concentrations except for one station in western Victoria Harbour (VS6). The higher levels of PCB at VS6 could be related to the discharges from industries in the past as well as contamination from the waste incineration facility in Kennedy Town which ceased operation in 1993 and was demolished in 2007. Similar to metals, a gradual decreasing trend of total PCBs in sediment could also be observed at VS6 in 2011.
Note : Total PCBs were calculated based on the definition in the 2002 Technical Circular
‘ETWB (W) No. 34/2002 Management of Dredged / Excavated Sediment’ The EPD has been conducting a toxic substances monitoring programme since 2004 based on three-year cycles. The first two years of the cycle (i.e. 2004-2005 and 2007-2008) would focus on samples collected from the natural marine environment, i.e. water, sediment, biota and the third year (i.e. 2006 and 2009) on potential pollution sources as well as rivers. For the first two years of each cycle, 10 marine water and 20 sediment as well as a number of marine biota samples would be collected from different locations throughout the territory. So far, two cycles of sampling in 2004-2009 had been completed. The results show that the levels of toxic substances in the Hong Kong marine environment were generally low as compared with other areas of the Pearl River Estuary, and were largely within the range reported for coastal waters
31
Marine Water Quality in Hong Kong in 2011
of the Mainland and other countries. In general, the levels of toxic substances in marine water, sediment and biota met local and international standards i.e. USA, Canada, European Union, Australia and Japan for the protection of marine life and human health. Nevertheless, elevated levels of some chemicals such as heavy metals were found in marine sediments at some localised “hot spots” areas associated with historical pollution, as well as nonylphenol in sediment at areas near the discharge points of the preliminary treatment plants in central Victoria Harbour. The details of the programme and the summary of the findings can be found at the following link: http://www.epd.gov.hk/epd/english/environmentinhk/water/marine_quality/Tox_details.html
32

Marine Water Quality in Hong Kong in 2011
Typhoon Shelters in Hong Kong Typhoon shelters in Hong Kong are used by small to medium vessels as protection against strong winds and rough sea conditions particularly during the typhoon season. For this reason, typhoon shelters are often semi-enclosed water bodies and vulnerable to pollution from both land and sea. Hong Kong has 17 typhoon shelters (TSs), marinas and dockyard. Some of these are located adjacent to populated residential and/or industrial areas, i.e. Causeway Bay TS and Kwun Tong TS. Others are located in outlying islands or far away from the urban areas, i.e. Cheung Chau TS and Shuen Wan TS. In general, the water quality of all typhoon shelters in Hong Kong was improving in the last decade.
Aldrich Bay Typhoon Shelter
in Hong Kong Island
In 2011, the EPD monitored the water quality of the 17 typhoon shelters, marinas and dockyard around Hong Kong. Same as 2010, the three typhoon shelters located in Sai Kung, namely Yim Tin Tsai TS, Hebe Haven TS and Sai Kung TS had the lowest TIN levels (0.07 - 0.10 mg/L) and E. coli counts (2 - 17 cfu/100mL) in 2011. In 2011, the water quality of typhoon shelters in Victoria Harbour, i.e. Kwun Tong TS, Causeway Bay TS and New Yau Ma Tei TS, was also generally poorer in terms of TIN levels (0.45 – 1.09 mg/L) and E. coli counts (1200-2000 cfu/100mL) as compared with those located in outlying islands which were far away from the urban areas. Regarding sediment quality, the sediments of typhoon shelters located in Victoria Harbour were often contaminated by heavy metals due to historical discharges from the nearby industries. During the period from 2007-2011, the sediment in Kwun Tong TS recorded the highest levels of total heavy metals (i.e. cadmium, chromium, copper, mercury, nickel, lead, silver and zinc) amongst the typhoon shelters in Hong Kong.
For trace organic pollutants, To Kwa Wan TS had the highest level of polyaromatic hydrocarbons (PAHs) as compared with other typhoon shelters in 2011. The presence of PAHs in To Kwa Wan TS could be attributed to contamination from the old industrial areas in San Po Kong and possibly the old Kai Tak Airport which ceased operation in July 1998.
33
Marine Water Quality in Hong Kong in 2011
Phytoplankton and Red Tides in Hong Kong
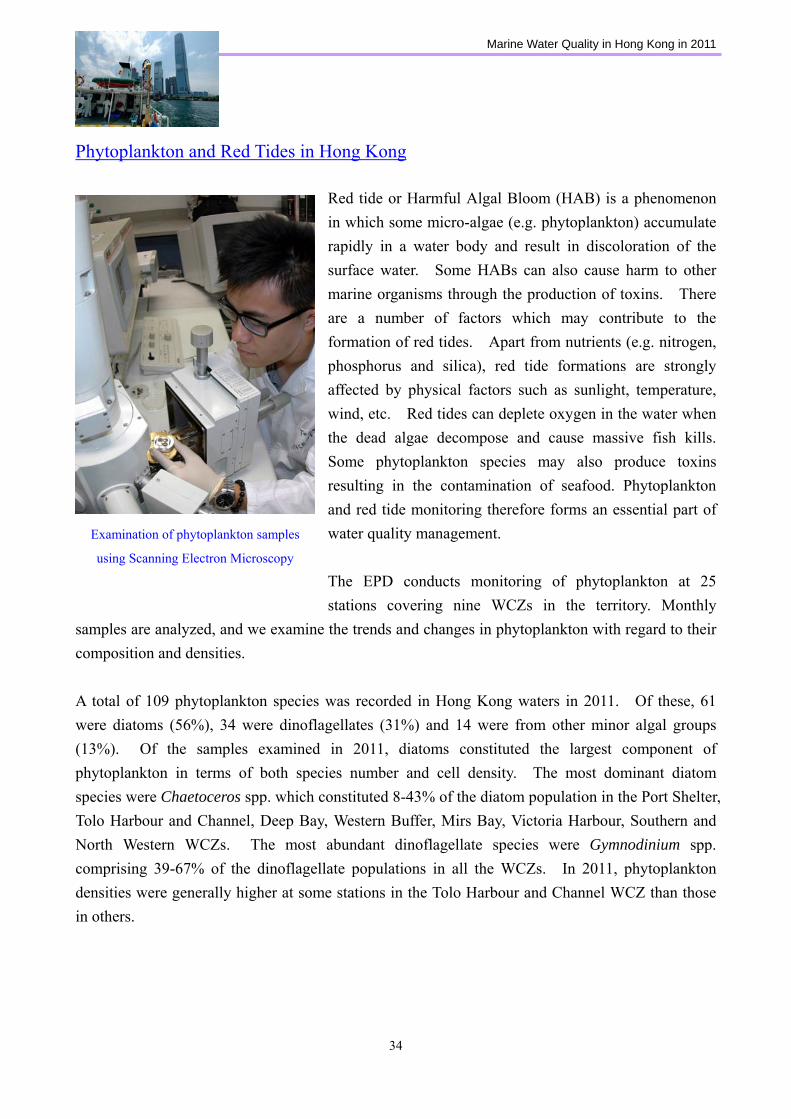
Red tide or Harmful Algal Bloom (HAB) is a phenomenon in which some micro-algae (e.g. phytoplankton) accumulate rapidly in a water body and result in discoloration of the surface water. Some HABs can also cause harm to other marine organisms through the production of toxins. There are a number of factors which may contribute to the formation of red tides. Apart from nutrients (e.g. nitrogen, phosphorus and silica), red tide formations are strongly affected by physical factors such as sunlight, temperature, wind, etc. Red tides can deplete oxygen in the water when the dead algae decompose and cause massive fish kills. Some phytoplankton species may also produce toxins resulting in the contamination of seafood. Phytoplankton and red tide monitoring therefore forms an essential part of water quality management. Examination of phytoplankton samples
using Scanning Electron Microscopy The EPD conducts monitoring of phytoplankton at 25 stations covering nine WCZs in the territory. Monthly
samples are analyzed, and we examine the trends and changes in phytoplankton with regard to their composition and densities.
A total of 109 phytoplankton species was recorded in Hong Kong waters in 2011. Of these, 61 were diatoms (56%), 34 were dinoflagellates (31%) and 14 were from other minor algal groups (13%). Of the samples examined in 2011, diatoms constituted the largest component of phytoplankton in terms of both species number and cell density. The most dominant diatom species were Chaetoceros spp. which constituted 8-43% of the diatom population in the Port Shelter, Tolo Harbour and Channel, Deep Bay, Western Buffer, Mirs Bay, Victoria Harbour, Southern and North Western WCZs. The most abundant dinoflagellate species were Gymnodinium spp. comprising 39-67% of the dinoflagellate populations in all the WCZs. In 2011, phytoplankton densities were generally higher at some stations in the Tolo Harbour and Channel WCZ than those in others.
34

Marine Water Quality in Hong Kong in 2011
35
Percentage contribution of phytoplankton groups to the total number of species in the nine Water Control Zones (2011)
54% Diatom
32% Dinoflagellate14% Others
Port Shelter WCZ
53% Diatom
31% Dinoflagellate16% Others
57% Diatom
28% Dinoflagellate15% Others
Mirs Bay WCZ
59% Diatom
28% Dinoflagellate
13% Others
Western Buffer WCZ
58% Diatom
29% Dinoflagellate
13% Others
Southern WCZ
54% Diatom
31% Dinoflagellate15% Others
Victoria Harbour WCZ
54% Diatom
30% Dinoflagellate16% Others
Eastern Buffer WCZ
50% Diatom
31% Dinoflagellate
19% Others
Deep Bay WCZ
57% Diatom
28% Dinoflagellate
15% Others
North Western WCZ
Shenzhen
New Territories
Hong Kong Island
Kowloon
N
LantauIsland
Tolo Harbour & Channel WCZ
Note : Others refer to minor phytoplankton groups which mainly include Cyanophyta and Chrysophyta.
Algal blooms (red tides) are natural phenomena which occur seasonally in both polluted and unpolluted waters. In Hong Kong, red tides occur more commonly in semi-enclosed bays (e.g. Tolo Harbour) with low tidal flushing rate. A total of 840 red tide incidents were recorded in Hong Kong waters between 1980 and 2011. Locally, red tides occur more frequently in the eastern (72%) and southern (18%) waters. From 1980 to 2011, some 327 of the 840 red tides (39%) occurred in the Tolo Harbour and Channel WCZ, and 151 (18%) in the Mirs Bay WCZ, 127 (15%) in the Port Shelter WCZ and 147 (18%) in the Southern WCZ. The most common red tide forming species in Hong Kong waters was the dinoflagellate Noctiluca scintillans, which accounted for about 29% of the reported red tides between 1980 and 2011. Historically, red tides increased significantly in the 80s and reached a peak in 1988, when a total of 88 incidents were reported. Since the mid 90s, red tides fluctuated between 10 and 45 incidents per year. In 2011, a total of 17 red tides were recorded in Hong Kong waters. Of these, five occurred in the Tolo Harbour and Channel WCZ, five in the Southern WCZ, three in the Port Shelter WCZ, three in the Mirs Bay WCZ and one in the North Western WCZ. These incidents involved 11 red tide species and their distribution is set out below. Most of them are non-toxic species commonly found in Hong Kong waters. Alexandrium catenella is known to be a toxic species locally and this species contains Paralytic Shellfish Poisoning (PSP) which can cause massive fish kills. Both Cochlodinium
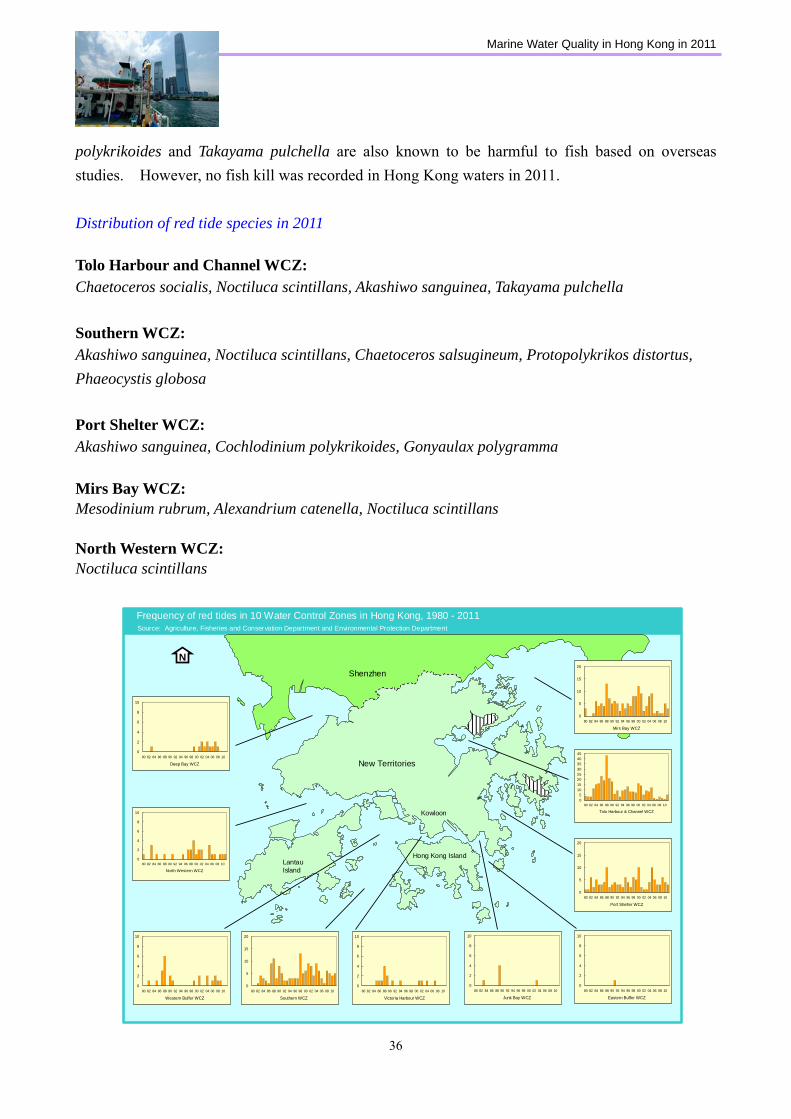
Marine Water Quality in Hong Kong in 2011
polykrikoides and Takayama pulchella are also known to be harmful to fish based on overseas studies. However, no fish kill was recorded in Hong Kong waters in 2011. Distribution of red tide species in 2011 Tolo Harbour and Channel WCZ: Chaetoceros socialis, Noctiluca scintillans, Akashiwo sanguinea, Takayama pulchella Southern WCZ: Akashiwo sanguinea, Noctiluca scintillans, Chaetoceros salsugineum, Protopolykrikos distortus, Phaeocystis globosa Port Shelter WCZ: Akashiwo sanguinea, Cochlodinium polykrikoides, Gonyaulax polygramma Mirs Bay WCZ: Mesodinium rubrum, Alexandrium catenella, Noctiluca scintillans North Western WCZ: Noctiluca scintillans
Frequency of red tides in 10 Water Control Zones in Hong Kong, 1980 - 2011
Shenzhen
New Territories
Hong Kong Island
Kowloon
N
0
5
10
15
20
80 82 84 86 88 90 92 94 96 98 00 02 04 06 08 10
Mirs Bay WCZ
05
1015202530354045
80 82 84 86 88 90 92 94 96 98 00 02 04 06 08 10
Tolo Harbour & Channel WCZ
0
5
10
15
20
80 82 84 86 88 90 92 94 96 98 00 02 04 06 08 10
Port Shelter WCZ
0
2
4
6
8
10
80 82 84 86 88 90 92 94 96 98 00 02 04 06 08 10
Eastern Buffer WCZ
0
2
4
6
8
10
80 82 84 86 88 90 92 94 96 98 00 02 04 06 08 10
Junk Bay WCZ
0
2
4
6
8
10
80 82 84 86 88 90 92 94 96 98 00 02 04 06 08 10
Victoria Harbour WCZ
0
5
10
15
20
80 82 84 86 88 90 92 94 96 98 00 02 04 06 08 10
Southern WCZ
0
2
4
6
8
10
80 82 84 86 88 90 92 94 96 98 00 02 04 06 08 10
Western Buffer WCZ
0
2
4
6
8
10
80 82 84 86 88 90 92 94 96 98 00 02 04 06 08 10
North Western WCZ
0
2
4
6
8
10
80 82 84 86 88 90 92 94 96 98 00 02 04 06 08 10
Deep Bay WCZ
Source: Agriculture, Fisheries and Conservation Department and Environmental Protection Department
LantauIsland
36
05
10km
Hon
g K
ong
Isla
nd
Kow
loon
Lant
au Is
land
N
22°10
’N
113°
50’E
114°
00’E
114°
10’E
114°
20’E
New
Ter
ritor
ies5
1S
1
10.1
1S
810
.2
10.3
10.1
4
3
6
9
2S
2SI
2
2SI
2S
7S
7W
ater
Con
trol
Zon
esFi
rst
App
oint
ed D
ay
1To
lo H
arbo
ur &
Cha
nnel
1.4.
87S
outh
ern
1.8.
88P
ort S
helte
r1.
8.89
Junk
Bay
1.8.
89D
eep
Bay
1.12
.90
Mirs
Bay
1.12
.90
Nor
th W
este
rn1.
4.92
Wes
tern
Buf
fer
1.6.
93E
aste
rn B
uffe
r1.
6.93
Tolo
Har
bour
Sup
plem
enta
ry1.
6.93
Pha
se 1
1.11
.94
Pha
se 2
1.9.
95P
hase
31.
4.96
Sec
ond
Sou
ther
n Su
pple
men
tary
1.10
.99
Nor
th W
este
rn S
uppl
emen
tary
1.10
.99
Sou
ther
n S
uppl
emen
tary
1.6.
93Vi
ctor
ia H
arbo
ur
2 3 4 5 6 7 8 9
10.1
10.2
10.3
1S 2S 10 2SI
7S
Appendix A
MARINE WATER QUALITY IN HONG KONG IN 2011 A - 1
Shen
zhen
114°
20’E
114°
30’E
114°
00’E
113°
50’E
22°30
’N22
°30
’N
22°20
’N
114°
10’E
The
Wat
er C
ontr
ol Z
ones
in H
ong
Kong
(Sou
rce:
Env
ironm
ent B
urea
u–Pl
an N
o. W
P/W
P4/7
5, O
ct 1
999)

Appendix A
MARINE WATER QUALITY IN HONG KONG IN 2011 A - 2
N
05
10km
DM
3
DM
4
DM
5
NM
5
NM
3
NM
6
NM
8
NM
2N
M1
WM
4
WM
3 WM
2
WM
1
SM10
SM11
SM9
SM13
SM17
SM20
SM18
SM7
SM6
SM5
SM4SM
3SM
2
SM1
SM19
VM12
VM8
VM15
VM7
VM6
VM5
VM4
VM2
JM3
JM4
EM1 EM
2 EM3
MM
8
MM
13
MM
14
PM11
PM8
PM9
PM7
PM6
Hon
g K
ong
Isla
nd
SM12
22°20
’N
22°10
’N
114°
00’E
114°
10’E
113°
50’E
114°
20’E
22°10
’N
New
Ter
ritor
ies
Kow
loon
MM
19
DM
1D
M2
Shen
zhen
VM14
PM3
MM
15
TM4
TM2
TM3
TM6
MM
16
PM2PM
1PM
4
TM5
TM7
TM8
MM
6MM
4
MM
2
MM
3
MM
1
MM
17
MM
7M
M5
VM1
114°
30’E
The
76 w
ater
qua
lity
mon
itorin
g st
atio
ns in
the
open
wat
ers
of H
ong
Kong
in 2
011
Lant
auIs
land
114°
20’E
114°
10’E
114°
00’E
113°
50’E
22°20
’N
22°30
’N22
°30
’N
114°
30’E
Bou
ndar
y of
the
Hon
g K
ong
Spe
cial
Adm
inis
trativ
e R
egio
n
Mar
ine
wat
er q
ualit
y m
onito
ring
stat
ion
(mon
itore
d m
onth
ly)
Shen
zhen

Appendix A
MARINE WATER QUALITY IN HONG KONG IN 2011 A - 3
05
10km
Shen
zhen
New
Ter
ritor
ies
Hon
g K
ong
Isla
nd
Kow
loon
DS1
DS2
DS3
DS4
NS4
NS3
NS6
NS2
WS1
WS2
SS5
SS6
SS4 SS3
SS2
SS1
VS1
0
VS6
VS5
VS3
JS2 E
S4 ES1 E
S2
MS8
MS1
3
MS1
4
PS6
PS5
PS3
TS2
TS3
TS4
TS5
MS6
MS1
6
MS1
5
MS1
7
MS7
MS5
MS4
MS2
MS3
MS1
Sed
imen
t mon
itorin
g st
atio
n (m
onito
red
twic
e a
year
)
Bou
ndar
y of
the
Hon
g K
ong
Spe
cial
Adm
inis
trativ
e R
egio
nN
114°
20’E
114°
10’E
114°
00’E
113°
50’E
22°30
’N
22°20
’N
22°10
’N
22°30
’N
22°20
’N
22°10
’N
113°
50’E
114°
00’E
114°
10’E
114°
20’E
114°
30’E
114°
30’E
The
45 s
edim
ent m
onito
ring
stat
ions
in th
e op
en w
ater
s of
Hon
g Ko
ng in
200
8
Lant
au Is
land
VS9
05
10km
New
Ter
ritor
ies
Hon
g K
ong
Isla
nd
Kow
loon
DS1
DS2
DS3
DS4
NS4
NS3
NS6
NS2
WS1
WS2
SS5
SS6
SS4 SS3
SS2
SS1
VS1
0
VS6
VS5
VS3
JS2 E
S4 ES1 E
S2
MS8
MS1
3
MS1
4
PS6
PS5
PS3
TS2
TS3
TS4
TS5
MS6
MS1
6
MS1
5
MS1
7
MS7
MS5
MS4
MS2
MS3
MS1
N
22°20
’N
22°10
’N
113°
50’E
114°
00’E
114°
10’E
114°
20’E
114°
30’E
The
45 s
edim
ent m
onito
ring
stat
ions
in th
e op
en w
ater
s of
Hon
g Ko
ng in
201
1
Lant
au Is
land
VS9
Shen
zhen
Sed
imen
t mon
itorin
g st
atio
n (m
onito
red
twic
e a
year
)
Bou
ndar
y of
the
Hon
g K
ong
Spe
cial
Adm
inis
trativ
e R
egio
n
114°
20’E
114°
10’E
114°
00’E
113°
50’E
22°30
’N
22°20
’N
22°10
’N
22°30
’N
114°
30’E

Appendix A
MARINE WATER QUALITY IN HONG KONG IN 2011 A - 4
05
10km
Kow
loon
1617
18
16
2
8
14
10
13
12
5
11
9
N
3
15
4
7
New
Ter
ritor
ies
Hon
g K
ong
Isla
nd
113°
50’E
114°
00’E
114°
10’E
22°30
’N
22°20
’N
22°10
’N
Mon
itorin
g St
atio
ns
1. T
uen
Mun
2.
Che
ung
Cha
u3.
Hei
Ling
Cha
u4.
Abe
rdee
n (S
outh
)5.
Abe
rdee
n (W
est)
6. R
ambl
er C
hann
el7.
Gov
ernm
ent D
ocky
ard
8. Y
au M
a Te
i9.
Cau
sew
ay B
ay10
. To
Kw
a W
an
11. K
wun
Ton
g 12
. Sam
Ka
Tsue
n13
. Ald
rich
Bay
(Sha
u K
ei W
an)
14. C
hai W
an15
. Heb
e H
aven
16. S
ai K
ung
17. Y
im T
in T
sai
18. S
huen
Wan
NT1
ST1
ST3
W
T1W
T3V
T8V
T12
VT1
0V
T2V
T11
VT4
VT3
E
T2E
T1P
T4P
T2P
T3TT
1
NS
5S
S7
SS
8
VS
17V
S21
VS
19V
S12
VS
20V
S14
VS
13E
S5
ES
3P
S4
PS
2TS
7
Typh
oon
Shel
ters
Wat
erS
edim
ent
Wat
er q
ualit
y m
onito
ring
stat
ions
mon
itore
d on
ce e
very
two
mon
ths
Sed
imen
t mon
itorin
g st
atio
ns m
onito
red
twic
e a
year
Sed
imen
t rem
oved
by
prev
ious
dre
dgin
g*
* * *
Lant
au Is
land
Shen
zhen
114°
20’E
114°
10’E
114°
00’E
113°
50’E
22°30
’N
114°
30’E
The
18 w
ater
qua
lity
mon
itorin
g st
atio
ns a
nd 1
5 se
dim
ent m
onito
ring
stat
ions
in th
e ty
phoo
n sh
elte
rs o
f H
ong
Kong
in 2
011

Appendix A
MARINE WATER QUALITY IN HONG KONG IN 2011 A - 5
Depth ( m)Water Sediment Latitude Longitude approx.TM2 22° 24.744' N 114° 13.085' E 4TM3 TS3 22° 26.857' N 114° 12.181' E 7TM4 TS2 22° 25.964' N 114° 13.176' E 8TM5 22° 27.426' N 114° 13.456' E 4TM6 TS4 22° 26.631' N 114° 14.506' E 12TM7 22° 26.907' N 114° 16.057' E 11TM8 TS5 22° 28.392' N 114° 18.003' E 22*TT1 *TS7 22° 27.270' N 114° 12.717' E 6SM1 SS1 22° 12.738' N 114° 13.885' E 14SM2 SS2 22° 13.447' N 114° 10.691' E 14SM3 22° 13.527' N 114° 8.980' E 33SM4 22° 12.758' N 114° 8.315' E 11SM5 22° 12.141' N 114° 6.728' E 8SM6 SS3 22° 11.500' N 114° 4.743' E 14SM7 SS4 22° 13.740' N 114° 4.473' E 8SM9 22° 16.420' N 114° 4.024' E 8SM10 22° 18.125' N 114° 1.919' E 5SM11 SS5 22° 15.443' N 114° 1.078' E 8SM12 22° 12.861' N 114° 0.869' E 7SM13 SS6 22° 12.957' N 113° 57.724' E 6SM17 22° 9.211' N 113° 57.727' E 12SM18 22° 9.211' N 114° 4.746' E 21SM19 22° 9.211' N 114° 13.077' E 24SM20 22° 10.448' N 113° 52.932' E 7*ST1 *SS7 22° 12.517' N 114° 1.493' E 5*ST3 *SS8 22° 14.734' N 114° 1.928' E 6PM1 22° 23.242' N 114° 17.145' E 6PM2 22° 22.643' N 114° 16.687' E 8PM3 PS3 22° 22.156' N 114° 16.910' E 13PM4 22° 22.940' N 114° 18.819' E 6PM6 22° 21.102' N 114° 16.213' E 11PM7 PS5 22° 20.453' N 114° 17.703' E 17PM8 PS6 22° 19.168' N 114° 18.745' E 20PM9 22° 20.529' N 114° 20.196' E 15PM11 22° 19.240' N 114° 20.163' E 21*PT2 22° 22.798' N 114° 16.540' E 3*PT3 *PS2 22° 22.790' N 114° 18.400' E 6*PT4 *PS4 22° 21.728' N 114° 15.879' E 5JM3 JS2 22° 17.490' N 114° 15.657' E 10JM4 22° 16.873' N 114° 15.378' E 16DM1 DS1 22° 29.769' N 114° 0.644' E 2DM2 22° 30.454' N 113° 59.549' E 2DM3 DS2 22° 28.600' N 113° 57.551' E 3DM4 DS3 22° 27.335' N 113° 55.937' E 4DM5 DS4 22° 25.561' N 113° 53.388' E 8NM1 22° 20.877' N 114° 1.286' E 34NM2 NS2 22° 21.130' N 113° 58.815' E 11NM3 NS3 22° 21.324' N 113° 56.783' E 14NM5 NS4 22° 23.051' N 113° 53.972' E 20NM6 NS6 22° 19.281' N 113° 53.908' E 5NM8 22° 16.695' N 113° 51.886' E 8*NT1 *NS5 22° 22.475' N 113° 58.353' E 4MM1 MS1 22° 32.984' N 114° 14.271' E 6MM2 MS2 22° 32.626' N 114° 16.648' E 11MM3 MS3 22° 33.714' N 114° 18.615' E 16MM4 MS4 22° 33.817' N 114° 21.483' E 18MM5 MS5 22° 31.233' N 114° 23.633' E 20MM6 MS6 22° 27.334' N 114° 20.997' E 12MM7 MS7 22° 31.409' N 114° 17.824' E 13MM8 MS8 22° 12.021' N 114° 19.345' E 31MM13 MS13 22° 13.000' N 114° 26.920' E 28MM14 MS14 22° 17.560' N 114° 26.920' E 25MM15 MS15 22° 22.120' N 114° 26.920' E 24MM16 MS16 22° 26.670' N 114° 26.920' E 22MM17 MS17 22° 30.192' N 114° 20.960' E 17MM19 22° 15.921' N 114° 19.411' E 28WM1 WS2 22° 15.044' N 114° 7.363' E 35WM2 22° 17.074' N 114° 5.730' E 13WM3 WS1 22° 19.203' N 114° 5.826' E 20WM4 22° 20.940' N 114° 4.256' E 26*WT1 22° 14.494' N 114° 9.737' E 7*WT3 22° 14.811' N 114° 8.918' E 10EM1 ES4 22° 16.506' N 114° 15.335' E 16EM2 ES1 22° 15.732' N 114° 15.971' E 21EM3 ES2 22° 14.237' N 114° 16.144' E 21*ET1 *ES3 22° 16.203' N 114° 14.624' E 6*ET2 *ES5 22° 17.078' N 114° 13.783' E 12VM1 22° 17.280' N 114° 13.839' E 38VM2 22° 17.862' N 114° 12.619' E 12
VS3 22° 17.631' N 114° 12.526' E 8VM4 22° 17.860' N 114° 11.654' E 12VM5 22° 17.266' N 114° 10.510' E 11
VS5 22° 17.077' N 114° 10.600' E 8VM6 22° 17.371' N 114° 9.665' E 14VM7 VS6 22° 17.771' N 114° 8.416' E 10VM8 22° 17.564' N 114° 7.175' E 11VM12 VS9 22° 19.757' N 114° 7.278' E 14VM14 VS10 22° 21.935' N 114° 6.527' E 11VM15 22° 18.579' N 114° 8.539' E 13*VT2 *VS12 22° 17.194' N 114° 11.304' E 5*VT3 *VS13 22° 17.448' N 114° 14.250' E 5*VT4 *VS14 22° 18.734' N 114° 12.814' E 6*VT8 *VS17 22° 21.360' N 114° 6.867' E 5*VT10 *VS19 22° 18.590' N 114° 9.430' E 5*VT11 *VS20 22° 18.981' N 114° 11.814' E 6*VT12 *VS21 22° 19.429' N 114° 8.587' E 5
Note : 1. All locations are based on WGS84 datum
2. Water quality and sediment monitor ing stations in typhoon shelters aremarked with an aster isk *
Location of marine water and sediment monitoring stations
Water C ontro l ZoneStat ion Locat ion
Southern Water
Tolo Harbour and Channel
Eastern Buffer
Victoria Harbour
Port Shelter
Western Buffer
Junk Bay
Deep Bay
North Western
Mirs Bay
Appendix A
MARINE WATER QUALITY IN HONG KONG IN 2011 A -6
05
10km
Hon
g K
ong
Isla
ndLa
ntau
Isla
nd
N Sec
onda
ry c
onta
ct re
crea
tion
subz
one
(Are
a: a
ppro
x. 2
60km
2 )
Gaz
ette
d be
ach
22°20
’N22
°20
’N
22°10
’N
113°
50’E
114°
00’E
114°
10’E
114°
20’E
114°
30’E
Bath
ing
beac
hes
and
seco
ndar
y co
ntac
t rec
reat
ion
subz
ones
in H
ong
Kong
in 2
011
Shen
zhen
114°
20’E
114°
10’E
114°
00’E
113°
50’E
22°30
’N22
°30
’N
114°
30’E
Kow
loon
New
Ter
ritor
ies
Non
-gaz
ette
d be
ach
Appendix A
MARINE WATER QUALITY IN HONG KONG IN 2011 A - 7
05
10km
Hon
g K
ong
Isla
nd
Kow
loon
New
Ter
ritor
ies
Lant
auIs
land
N
22°20
’N
22°10
’N
113°
50’E
114°
00’E
114°
10’E
114°
20’E
1
114°
30’E
X
Hon
g K
ong
Isla
nd
Kow
loon
New
Ter
ritor
ies
5
1
C
G H
K
LM
O
P
Z
S
V
1
15*
Lant
auIs
land
Shen
zhen
114°
20’E
114°
10’E
114°
00’E
22°30
’N
114°
30’E
113°
50’E
Fish
and
she
llfis
h cu
lture
zon
es a
nd m
arin
e co
nser
vatio
n si
tes
in H
ong
Kong
in 2
011
(sou
rce:
Agr
icul
ture
, Fis
herie
s an
d Co
nser
vatio
n D
epar
tmen
t)
22°20
’N
22°10
’N
22°30
’N
Mar
ine
park
Are
a(k
m2 )
1. Y
an C
hau
Tong
2. H
oi H
a W
an2.
63.
Sha
Cha
u&
Lung
Kw
uC
hau
12
4. T
ung
Ping
Cha
u2.
7
Mar
ine
rese
rve
5. C
ape
D’A
guila
r0.
2
6. M
ai P
o &
Inne
r Dee
pB
ay R
amsa
rsite
(* in
clud
es s
ea a
nd la
nd)
7. A
rea
of O
yste
rPr
oduc
tion
136.8
26 F
ish
Cul
ture
Zon
esA
.B
.C
.D
.E. F. G
.H
.I. J. K
.L. M
.
N.
O.
P. Q.
R.
S. T. U.
V. W.
X. Y. Z.
Sha
Tau
Kok
Ap
Cha
uK
at O
O P
uiTo
ngSa
i Lau
Kon
gW
ong
Wan
Tap
Mun
Kau
Lau
Wan
Sham
Wan
Lo F
u W
atYu
ng S
hue
AuLe
ung
Shue
nW
anTi
u C
ham
Wan
Tai T
au C
hau
Kai
Lun
g W
an
Kau
Sai
Ma
Nam
Wat
Po T
oiO
Po T
oiSo
kK
wu
Wan
Lo T
ikW
anM
a W
anYi
m T
in T
sai
Che
ung
Sha
Wan
Yim
Tin
Tsa
i (Ea
st)
Tung
Lun
g C
hau
Lice
nsed
raft
area
(m2 )
> 30
000
2000
1 -3
0000
1000
1 -2
0000
0 -1
0000
2
4
3
6
7
F NQ
R
TU
WY
E
B
J
I
DA
15*

22°20
’N
22°10
’N
New
Terri
torie
s
Lant
au Is
land
2
9Ho
ng K
ong
Islan
d
Kowl
oon
3
1
5
7
2S
10.1
810
.2
6
410
Hon
g K
ong
Isla
nd
Kow
loon
Lant
au Is
land
N
New
Ter
ritor
ies
05
10km
114°
00’E
114°
10’E
114°
20’E
22°30
’N
113°
50’E
Lant
auIs
land
Appendix A
MARINE WATER QUALITY IN HONG KONG IN 2011 A - 8
114°
20’E
114°
10’E
114°
00’E
113°
50’E
22°30
’N
114°
30’E
Shen
zhen
Wat
er Q
ualit
y O
bjec
tive
(WQ
O) f
or T
otal
Inor
gani
c N
itrog
en (T
IN) i
n th
e te
n W
ater
Con
trol
Zon
es
114°
30’E
WQ
O fo
rTIN
Tolo
Har
bour
& C
hann
el W
CZ
1
Por
t She
lter W
CZ
3
Mirs
Bay
WC
Z6
Vic
toria
Har
bour
WC
Z10
Junk
Bay
WC
Z4
Wes
tern
Buf
fer W
CZ
8
Sou
ther
n W
CZ
2
Eas
tern
Buf
fer W
CZ
9
Nor
th W
este
rn W
CZ
7Ann
ual m
ean
for d
epth
-ave
rage
dTI
N ≤
0.3
mg/
L
Ann
ual m
ean
for d
epth
-ave
rage
dTI
N ≤
0.4
mg/
L
Ann
ual m
ean
for d
epth
-ave
rage
d TI
N ≤
0.1
mg/
L
No
TIN
WQ
O
Ann
ual m
ean
for d
epth
-ave
rage
d TI
N ≤
0.7
mg/
L
Ann
ual m
ean
for d
epth
-ave
rage
dTI
N ≤
0.5
mg/
L
Dee
p B
ay W
CZ
(Inne
r Sub
zone
)5a
Dee
p B
ay W
CZ
(Out
er S
ubzo
ne)
5b
5a
5bN
ew T
errit
orie
s
Kow
loon

Appendix A
MARINE WATER QUALITY IN HONG KONG IN 2011 A - 9
Parameter Water Quality Objective Water Control Zone (WCZ) / Part(s) of zone /Subzone to which the WQO applies
There should be no objectionable odours ordiscolouration of the water
Tarry residues, floating wood, articles made ofglass, plastic, rubber or of any other substancesshould be absentMineral oil should not be visible on the surface.Surfactants should not give rise to a lastingfoam.There should be no recognisable sewage-deriveddebris.
Floating, submerged and semi-submergedobjects of a size likely to interfere with the freemovement of vessels, or cause damage tovessels, should be absent.
The waters should not contain substances whichsettle to form objectionable deposits.
Dissolved Oxygen(bottom) Not less than 2 mg/L for 90% of samples ; Marine waters of all WCZs except Tolo Harbour & Channel WCZ
Dissolved Oxygen(Depth-averaged) Not less than 4 mg/L for 90% of samples ; Marine waters of all WCZs except Tolo Harbour & Channel WCZ
Not less than 2mg/L Harbour Subzone in Tolo Harbour & Channel WCZ
Not less than 3mg/L Buffer Subzone in Tolo Harbour & Channel WCZ
Not less than 4mg/L Channel Subzone in Tolo Harbour & Channel WCZ
Dissolved Oxygen(the remainder of the water column :means surface to 2m above bottom)
Not less than 4mg/L Harbour Subzone and Buffer Subzone in Tolo Harbour & ChannelWCZ
Dissolved Oxygen(all depths) Not less than 4mg/L Channel Subzone in Tolo Harbour & Channel WCZ
Annual mean depth-averaged total inorganicnitrogen not to exceed 0.1 mg/L Marine waters of Southern WCZ and Port Shelter WCZ
Annual mean depth-averaged total inorganicnitrogen not to exceed 0.3 mg/L
Marine waters of Mirs Bay WCZ, Junk Bay WCZ, North Western WCZ(Castle Peak Subzone)
Annual mean depth-averaged total inorganicnitrogen not to exceed 0.4 mg/L
Marine waters of Eastern Buffer WCZ, Western Buffer WCZ, VictoriaHarbour WCZ.
Annual mean depth-averaged total inorganicnitrogen not to exceed 0.5 mg/L
Marine waters of Deep Bay WCZ (Outer Subzone) and North WesternWCZ (Whole zone except Castle Peak Subzone).
Annual mean depth-averaged total inorganicnitrogen not to exceed 0.7 mg/L Marine waters of Deep Bay WCZ (Inner Subzone)
Unionised ammonia Annual mean not to exceed 0.021 mg/L All WCZs (whole zone) except Tolo Harbour & Channel WCZ
Annual geometric mean not to exceed610 cfu/100mL
Secondary contact recreation subzones in Tolo Habour & ChannelWCZ, Southern WCZ, Port Shelter WCZ, Mirs Bay WCZ, Deep BayWCZ, North Western WCZ, Western Buffer WCZ.
Annual geometric mean not to exceed610 cfu/100mL
Fish culture subzones in Tolo Habour & Channel WCZ, SouthernWCZ, Port Shelter WCZ, Junk Bay, Mirs Bay WCZ, Deep Bay WCZ,Eastern Buffer WCZ, Western Buffer WCZ.
To be in the range 6.5 - 8.5, change due towaste discharge not to exceed 0.2 Marine waters of all WCZs except Tolo Harbour & Channel WCZ
Change due to waste discharge not to begreater than ±0.5 Harbour Subzone in Tolo Harbour & Channel WCZ
Change due to waste discharge not to begreater than ±0.3 Buffer Subzone in Tolo Harbour & Channel WCZ
Change due to waste discharge not to begreater than ±0.1 Channel Subzone in Tolo Harbour & Channel WCZ
Change due to waste discharge not toexceed 10% of natural ambient level All WCZs (Whole zone) except Tolo Harbour & Channel WCZ
Change due to waste discharge not to begreater than ±3% Tolo Harbour & Channel WCZ
Change due to waste discharge not to exceed 2°C All WCZs (Whole zone) except Tolo Harbour & Channel WCZChange due to waste discharge not to exceed 1°C Tolo Harbour & Channel WCZ
Suspended solidsWaste discharge not to raise the natural ambientlevel by 30% nor cause the accumulation ofsuspended solids which may adversely affectaquatic communities
Marine waters of all WCZs except Tolo Harbour & Channel WCZ
Toxicants Not to be present at levels producingsignificant toxic effect All WCZs (Whole zone)
Not to exceed 20mg/m3 (µg/L) calculated asrunning arithmetic mean of 5 dailymeasurements for any location and depth
Harbour Subzone in Tolo Harbour & Channel WCZ
Not to exceed 10mg/m3 (µg/L) calculated asrunning arithmetic mean of 5 dailymeasurements for any location and depth
Buffer Subzone in Tolo Harbour & Channel WCZ
Not to exceed 6mg/m3 (µg/L) calculated asrunning arithmetic mean of 5 dailymeasurements for any location and depth
Channel Subzone in Tolo Harbour & Channel WCZ
Temperature
Chlorophyll-a
Nutrients
E. coli
pH
Salinity
Summary of Water Quality Objectives (WQOs) for marine waters of Hong Kong
Aesthetic Appearance All WCZs (whole zone)
Dissolved Oxygen(bottom)

Appendix A
MARINE WATER QUALITY IN HONG KONG IN 2011 A - 10
ContaminantsLower Chemical
Exceedance Leve l(LCEL)
Upper ChemicalExceedance Leve l
(UCEL)
Metals (mg/kg dry we ight)
Cadmium (Cd) 1.5 4
Chromium (Cr) 80 160
Copper (Cu) 65 110
Mercury (Hg) 0.5 1
Nickel (Ni) 2 40 40
Lead (Pb) 75 110
Silver (Ag) 1 2
Zinc (Zn) 200 270
Metalloid (mg/kg dry we ight)
Arsenic (As) 12 42
Organic-PAHs (µg/kg dry we ight)
Low Molecular Weight PAHs 3 550 3160
High Molecular Weight PAHs 4 1700 9600
Organic-non-PAHs (µg/kg dry we ight)
Total PCBs 23 180
Organometallics (mg TBT/L in Interstitial water)
Tributyltin 2 0.15 0.15Footnote: 1
2
34
5 Total PCBs include 18 congeners: PCB 8, 18, 28, 44, 52, 66, 77, 101, 105, 118, 126, 128, 138, 153, 169, 170, 180, 187.
Sediment Quality Criteria for the Classification of Sediments1
The table is extracted from Appendix A of WBTC (W) No. 34/2002 Management of Dredged / Excavated Sediment(http://www.devb-wb.gov.hk).When the LCEL and UCEL for a contaminant are the same, the contaminant level is considered to have exceeded UCEL if it isgreater than the value shown.Low molecular weight PAHs include acenaphthene, acenaphthylene, anthracene, fluorene, naphthalene, and phenanthrene.High molecular weight PAHs include benzo[a]anthracene, benzo[a]pyrene, chrysene, dibenzo[a,h]anthracene, fluoranthene,pyrene, benzo[b]fluoranthene, benzo[k]fluoranthene, indeno[1,2,3-c,d]pyrene and benzo[g,h,i]perylene.
Appendix A
MARINE WATER QUALITY IN HONG KONG IN 2011 A - 11
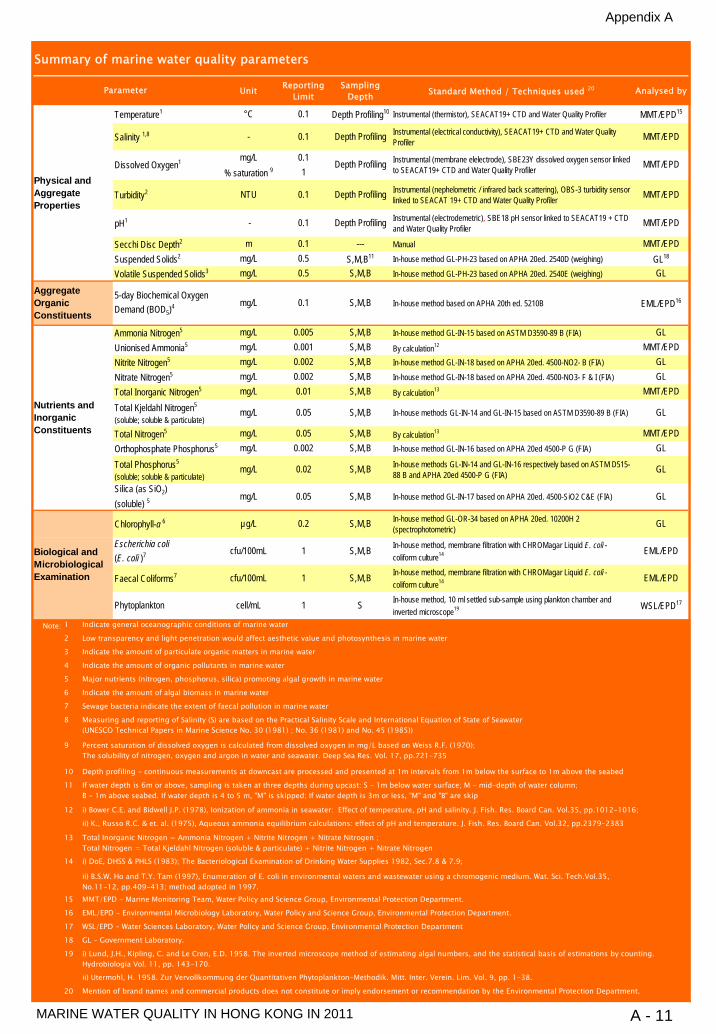
Unit ReportingLimit
SamplingDepth Standard Method / Techniques used 20 Analysed by
Temperature1 °C 0.1 Depth Profiling10 Instrumental (thermistor), SEACAT19+ CTD and Water Quality Profiler MMT/EPD15
Salinity 1,8 - 0.1 Depth Profiling Instrumental (electrical conductivity), SEACAT19+ CTD and Water QualityProfiler MMT/EPD
mg/L 0.1% saturation 9 1
Turbidity2 NTU 0.1 Depth Profiling Instrumental (nephelometric / infrared back scattering), OBS-3 turbidity sensorlinked to SEACAT 19+ CTD and Water Quality Profiler MMT/EPD
pH1 - 0.1 Depth Profiling Instrumental (electrodemetric), SBE18 pH sensor linked to SEACAT19 + CTDand Water Quality Profiler MMT/EPD
Secchi Disc Depth2 m 0.1 --- Manual MMT/EPDSuspended Solids2 mg/L 0.5 S,M,B11 In-house method GL-PH-23 based on APHA 20ed. 2540D (weighing) GL18
Volatile Suspended Solids3 mg/L 0.5 S,M,B In-house method GL-PH-23 based on APHA 20ed. 2540E (weighing) GL
5-day Biochemical OxygenDemand (BOD5)4 mg/L 0.1 S,M,B In-house method based on APHA 20th ed. 5210B EML/EPD16
Ammonia Nitrogen5 mg/L 0.005 S,M,B In-house method GL-IN-15 based on ASTM D3590-89 B (FIA) GLUnionised Ammonia5 mg/L 0.001 S,M,B By calculation12 MMT/EPDNitrite Nitrogen5 mg/L 0.002 S,M,B In-house method GL-IN-18 based on APHA 20ed. 4500-NO2- B (FIA) GLNitrate Nitrogen5 mg/L 0.002 S,M,B In-house method GL-IN-18 based on APHA 20ed. 4500-NO3- F & I (FIA) GLTotal Inorganic Nitrogen5 mg/L 0.01 S,M,B By calculation13 MMT/EPDTotal Kjeldahl Nitrogen5
(soluble; soluble & particulate)mg/L 0.05 S,M,B In-house methods GL-IN-14 and GL-IN-15 based on ASTM D3590-89 B (FIA) GL
Total Nitrogen5 mg/L 0.05 S,M,B By calculation13 MMT/EPDOrthophosphate Phosphorus5 mg/L 0.002 S,M,B In-house method GL-IN-16 based on APHA 20ed 4500-P G (FIA) GLTotal Phosphorus5
(soluble; soluble & particulate)mg/L 0.02 S,M,B In-house methods GL-IN-14 and GL-IN-16 respectively based on ASTM D515-
88 B and APHA 20ed 4500-P G (FIA) GL
Silica (as SiO2)(soluble) 5
mg/L 0.05 S,M,B In-house method GL-IN-17 based on APHA 20ed. 4500-SiO2 C&E (FIA) GL
Chlorophyll-a 6 µg/L 0.2 S,M,B In-house method GL-OR-34 based on APHA 20ed. 10200H 2(spectrophotometric) GL
Escherichia coli(E. coli )7 cfu/100mL 1 S,M,B In-house method, membrane filtration with CHROMagar Liquid E. coli -
coliform culture14 EML/EPD
Faecal Coliforms7 cfu/100mL 1 S,M,B In-house method, membrane filtration with CHROMagar Liquid E. coli -coliform culture14 EML/EPD
Phytoplankton cell/mL 1 S In-house method, 10 ml settled sub-sample using plankton chamber andinverted microscope19 WSL/EPD17
Note: 1
2
3
4
5
6
7
8
9
10
11
12
13
14
15
16
17
18
19
20
ii) Utermohl, H. 1958. Zur Vervollkommung der Quantitativen Phytoplankton-Methodik. Mitt. Inter. Verein. Lim. Vol. 9, pp. 1-38.
Mention of brand names and commercial products does not constitute or imply endorsement or recommendation by the Environmental Protection Department.
EML/EPD - Environmental Microbiology Laboratory, Water Policy and Science Group, Environmental Protection Department.
WSL/EPD - Water Sciences Laboratory, Water Policy and Science Group, Environmental Protection Department
GL - Government Laboratory.
i) Lund, J.H., Kipling, C. and Le Cren, E.D. 1958. The inverted microscope method of estimating algal numbers, and the statistical basis of estimations by counting.Hydrobiologia Vol. 11, pp. 143-170.
Total Inorganic Nitrogen = Ammonia Nitrogen + Nitrite Nitrogen + Nitrate Nitrogen ;Total Nitrogen = Total Kjeldahl Nitrogen (soluble & particulate) + Nitrite Nitrogen + Nitrate Nitrogen
i) DoE, DHSS & PHLS (1983); The Bacteriological Examination of Drinking Water Supplies 1982, Sec.7.8 & 7.9;
ii) B.S.W. Ho and T.Y. Tam (1997), Enumeration of E. coli in environmental waters and wastewater using a chromogenic medium. Wat. Sci. Tech.Vol.35,No.11-12, pp.409-413; method adopted in 1997.MMT/EPD - Marine Monitoring Team, Water Policy and Science Group, Environmental Protection Department.
Depth profiling - continuous measurements at downcast are processed and presented at 1m intervals from 1m below the surface to 1m above the seabed
If water depth is 6m or above, sampling is taken at three depths during upcast: S - 1m below water surface; M - mid-depth of water column;B - 1m above seabed. If water depth is 4 to 5 m, "M" is skipped; If water depth is 3m or less, "M" and "B" are skip
i) Bower C.E. and Bidwell J.P. (1978), Ionization of ammonia in seawater: Effect of temperature, pH and salinity. J. Fish. Res. Board Can. Vol.35, pp.1012-1016;
ii) K., Russo R.C. & et. al. (1975), Aqueous ammonia equilibrium calculations: effect of pH and temperature. J. Fish. Res. Board Can. Vol.32, pp.2379-2383
Indicate the amount of algal biomass in marine water
Sewage bacteria indicate the extent of faecal pollution in marine water
Measuring and reporting of Salinity (S) are based on the Practical Salinity Scale and International Equation of State of Seawater(UNESCO Technical Papers in Marine Science No. 30 (1981) ; No. 36 (1981) and No. 45 (1985))
Percent saturation of dissolved oxygen is calculated from dissolved oxygen in mg/L based on Weiss R.F. (1970);The solubility of nitrogen, oxygen and argon in water and seawater. Deep Sea Res. Vol. 17, pp.721-735
Low transparency and light penetration would affect aesthetic value and photosynthesis in marine water
Indicate the amount of particulate organic matters in marine water
Indicate the amount of organic pollutants in marine water
Major nutrients (nitrogen, phosphorus, silica) promoting algal growth in marine water
AggregateOrganicConstituents
Nutrients andInorganicConstituents
Biological andMicrobiologicalExamination
Indicate general oceanographic conditions of marine water
Summary of marine water quality parameters
Parameter
Physical andAggregateProperties
Dissolved Oxygen1 Depth Profiling Instrumental (membrane elelectrode), SBE23Y dissolved oxygen sensor linkedto SEACAT19+ CTD and Water Quality Profiler MMT/EPD
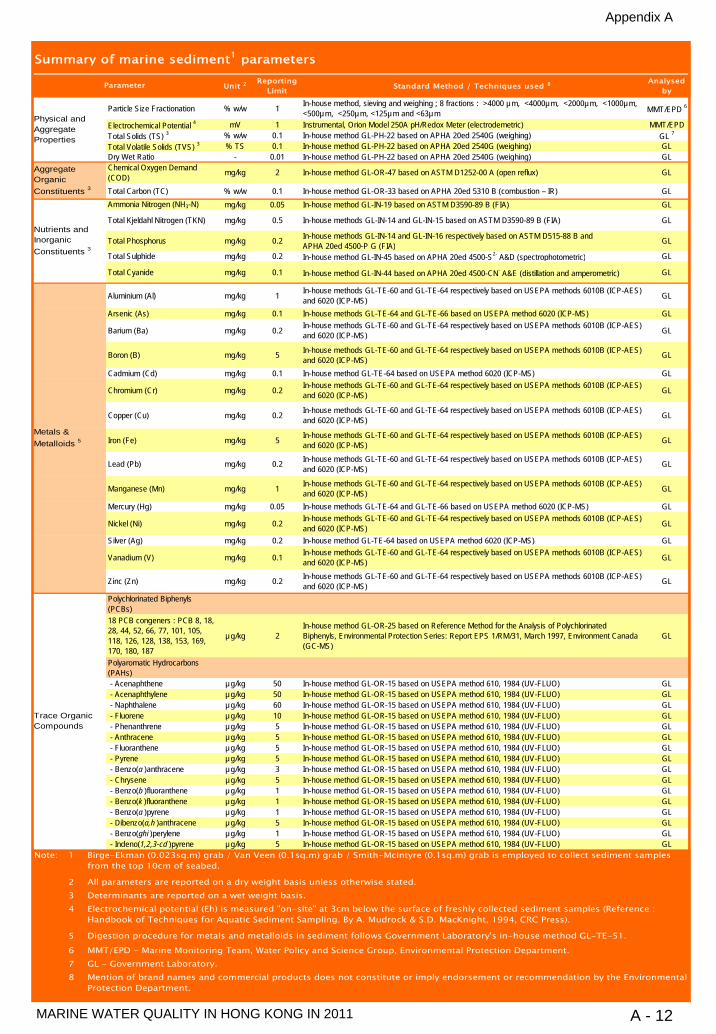
Appendix A
MARINE WATER QUALITY IN HONG KONG IN 2011 A - 12
Unit 2 ReportingLimit Standard Method / Techniques used 8 Analysed
by
Particle Size Fractionation % w/w 1 In-house method, sieving and weighing ; 8 fractions : >4000 µm, <4000µm, <2000µm, <1000µm,<500µm, <250µm, <125µm and <63µm MMT/EPD 6
Electrochemical Potential 4 mV 1 Instrumental, Orion Model 250A pH/Redox Meter (electrodemetric) MMT/EPDTotal Solids (TS) 3 % w/w 0.1 In-house method GL-PH-22 based on APHA 20ed 2540G (weighing) GL 7
Total Volatile Solids (TVS) 3 % TS 0.1 In-house method GL-PH-22 based on APHA 20ed 2540G (weighing) GLDry Wet Ratio - 0.01 In-house method GL-PH-22 based on APHA 20ed 2540G (weighing) GLChemical Oxygen Demand(COD) mg/kg 2 In-house method GL-OR-47 based on ASTM D1252-00 A (open reflux) GL
Total Carbon (TC) % w/w 0.1 In-house method GL-OR-33 based on APHA 20ed 5310 B (combustion – IR) GLAmmonia Nitrogen (NH3-N) mg/kg 0.05 In-house method GL-IN-19 based on ASTM D3590-89 B (FIA) GL
Total Kjeldahl Nitrogen (TKN) mg/kg 0.5 In-house methods GL-IN-14 and GL-IN-15 based on ASTM D3590-89 B (FIA) GL
Total Phosphorus mg/kg 0.2 In-house methods GL-IN-14 and GL-IN-16 respectively based on ASTM D515-88 B andAPHA 20ed 4500-P G (FIA) GL
Total Sulphide mg/kg 0.2 In-house method GL-IN-45 based on APHA 20ed 4500-S2- A&D (spectrophotometric) GL
Total Cyanide mg/kg 0.1 In-house method GL-IN-44 based on APHA 20ed 4500-CN- A&E (distillation and amperometric) GL
Aluminium (Al) mg/kg 1 In-house methods GL-TE-60 and GL-TE-64 respectively based on USEPA methods 6010B (ICP-AES)and 6020 (ICP-MS) GL
Arsenic (As) mg/kg 0.1 In-house methods GL-TE-64 and GL-TE-66 based on USEPA method 6020 (ICP-MS) GL
Barium (Ba) mg/kg 0.2 In-house methods GL-TE-60 and GL-TE-64 respectively based on USEPA methods 6010B (ICP-AES)and 6020 (ICP-MS) GL
Boron (B) mg/kg 5 In-house methods GL-TE-60 and GL-TE-64 respectively based on USEPA methods 6010B (ICP-AES)and 6020 (ICP-MS) GL
Cadmium (Cd) mg/kg 0.1 In-house method GL-TE-64 based on USEPA method 6020 (ICP-MS) GL
Chromium (Cr) mg/kg 0.2 In-house methods GL-TE-60 and GL-TE-64 respectively based on USEPA methods 6010B (ICP-AES)and 6020 (ICP-MS) GL
Copper (Cu) mg/kg 0.2 In-house methods GL-TE-60 and GL-TE-64 respectively based on USEPA methods 6010B (ICP-AES)and 6020 (ICP-MS) GL
Iron (Fe) mg/kg 5 In-house methods GL-TE-60 and GL-TE-64 respectively based on USEPA methods 6010B (ICP-AES)and 6020 (ICP-MS) GL
Lead (Pb) mg/kg 0.2 In-house methods GL-TE-60 and GL-TE-64 respectively based on USEPA methods 6010B (ICP-AES)and 6020 (ICP-MS) GL
Manganese (Mn) mg/kg 1 In-house methods GL-TE-60 and GL-TE-64 respectively based on USEPA methods 6010B (ICP-AES)and 6020 (ICP-MS) GL
Mercury (Hg) mg/kg 0.05 In-house methods GL-TE-64 and GL-TE-66 based on USEPA method 6020 (ICP-MS) GL
Nickel (Ni) mg/kg 0.2 In-house methods GL-TE-60 and GL-TE-64 respectively based on USEPA methods 6010B (ICP-AES)and 6020 (ICP-MS) GL
Silver (Ag) mg/kg 0.2 In-house method GL-TE-64 based on USEPA method 6020 (ICP-MS) GL
Vanadium (V) mg/kg 0.1 In-house methods GL-TE-60 and GL-TE-64 respectively based on USEPA methods 6010B (ICP-AES)and 6020 (ICP-MS) GL
Zinc (Zn) mg/kg 0.2 In-house methods GL-TE-60 and GL-TE-64 respectively based on USEPA methods 6010B (ICP-AES)and 6020 (ICP-MS) GL
Polychlorinated Biphenyls(PCBs)18 PCB congeners : PCB 8, 18,28, 44, 52, 66, 77, 101, 105,118, 126, 128, 138, 153, 169,170, 180, 187
µg/kg 2In-house method GL-OR-25 based on Reference Method for the Analysis of PolychlorinatedBiphenyls, Environmental Protection Series: Report EPS 1/RM/31, March 1997, Environment Canada(GC-MS)
GL
Polyaromatic Hydrocarbons(PAHs) - Acenaphthene µg/kg 50 In-house method GL-OR-15 based on USEPA method 610, 1984 (UV-FLUO) GL - Acenaphthylene µg/kg 50 In-house method GL-OR-15 based on USEPA method 610, 1984 (UV-FLUO) GL - Naphthalene µg/kg 60 In-house method GL-OR-15 based on USEPA method 610, 1984 (UV-FLUO) GL - Fluorene µg/kg 10 In-house method GL-OR-15 based on USEPA method 610, 1984 (UV-FLUO) GL - Phenanthrene µg/kg 5 In-house method GL-OR-15 based on USEPA method 610, 1984 (UV-FLUO) GL - Anthracene µg/kg 5 In-house method GL-OR-15 based on USEPA method 610, 1984 (UV-FLUO) GL - Fluoranthene µg/kg 5 In-house method GL-OR-15 based on USEPA method 610, 1984 (UV-FLUO) GL - Pyrene µg/kg 5 In-house method GL-OR-15 based on USEPA method 610, 1984 (UV-FLUO) GL - Benzo(a )anthracene µg/kg 3 In-house method GL-OR-15 based on USEPA method 610, 1984 (UV-FLUO) GL - Chrysene µg/kg 5 In-house method GL-OR-15 based on USEPA method 610, 1984 (UV-FLUO) GL - Benzo(b )fluoranthene µg/kg 1 In-house method GL-OR-15 based on USEPA method 610, 1984 (UV-FLUO) GL - Benzo(k )fluoranthene µg/kg 1 In-house method GL-OR-15 based on USEPA method 610, 1984 (UV-FLUO) GL - Benzo(a )pyrene µg/kg 1 In-house method GL-OR-15 based on USEPA method 610, 1984 (UV-FLUO) GL - Dibenzo(a,h )anthracene µg/kg 5 In-house method GL-OR-15 based on USEPA method 610, 1984 (UV-FLUO) GL - Benzo(ghi )perylene µg/kg 1 In-house method GL-OR-15 based on USEPA method 610, 1984 (UV-FLUO) GL - Indeno(1,2,3-cd )pyrene µg/kg 5 In-house method GL-OR-15 based on USEPA method 610, 1984 (UV-FLUO) GL
Note: 1
234
5
678
MMT/EPD - Marine Monitoring Team, Water Policy and Science Group, Environmental Protection Department.GL - Government Laboratory.Mention of brand names and commercial products does not constitute or imply endorsement or recommendation by the EnvironmentalProtection Department.
All parameters are reported on a dry weight basis unless otherwise stated.Determinants are reported on a wet weight basis.Electrochemical potential (Eh) is measured "on-site" at 3cm below the surface of freshly collected sediment samples (Reference :Handbook of Techniques for Aquatic Sediment Sampling. By A. Mudrock & S.D. MacKnight, 1994, CRC Press).
Digestion procedure for metals and metalloids in sediment follows Government Laboratory's in-house method GL-TE-51.
Nutrients andInorganicConstituents 3
Metals &Metalloids 5
Trace OrganicCompounds
Birge-Ekman (0.023sq.m) grab / Van Veen (0.1sq.m) grab / Smith-McIntyre (0.1sq.m) grab is employed to collect sediment samplesfrom the top 10cm of seabed.
Summary of marine sediment1 parameters
Parameter
Physical andAggregateProperties
AggregateOrganicConstituents 3
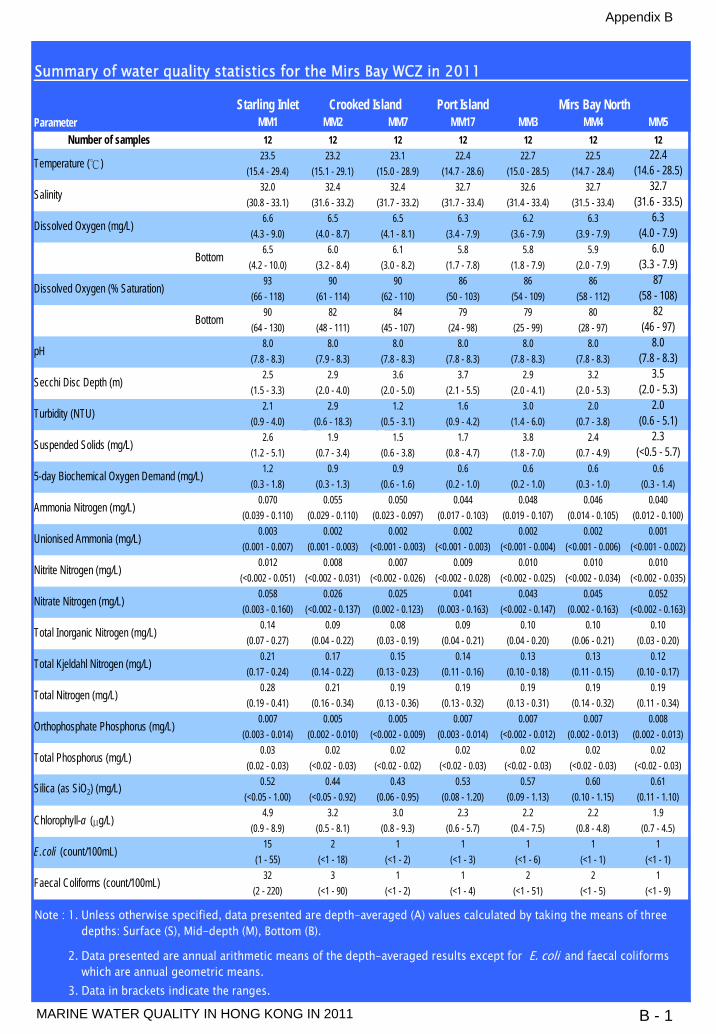
Appendix B
MARINE WATER QUALITY IN HONG KONG IN 2011 B - 1
22.3 x 17.4cm
Summary of water quality statistics for the Mirs Bay WCZ in 2011
Starling Inlet Port IslandParameter MM1 MM2 MM7 MM17 MM3 MM4 MM5
Number of samples 12 12 12 12 12 12 1223.5 23.2 23.1 22.4 22.7 22.5 22.4
(15.4 - 29.4) (15.1 - 29.1) (15.0 - 28.9) (14.7 - 28.6) (15.0 - 28.5) (14.7 - 28.4) (14.6 - 28.5)32.0 32.4 32.4 32.7 32.6 32.7 32.7
(30.8 - 33.1) (31.6 - 33.2) (31.7 - 33.2) (31.7 - 33.4) (31.4 - 33.4) (31.5 - 33.4) (31.6 - 33.5)6.6 6.5 6.5 6.3 6.2 6.3 6.3
(4.3 - 9.0) (4.0 - 8.7) (4.1 - 8.1) (3.4 - 7.9) (3.6 - 7.9) (3.9 - 7.9) (4.0 - 7.9)6.5 6.0 6.1 5.8 5.8 5.9 6.0
(4.2 - 10.0) (3.2 - 8.4) (3.0 - 8.2) (1.7 - 7.8) (1.8 - 7.9) (2.0 - 7.9) (3.3 - 7.9)93 90 90 86 86 86 87
(66 - 118) (61 - 114) (62 - 110) (50 - 103) (54 - 109) (58 - 112) (58 - 108)90 82 84 79 79 80 82
(64 - 130) (48 - 111) (45 - 107) (24 - 98) (25 - 99) (28 - 97) (46 - 97)8.0 8.0 8.0 8.0 8.0 8.0 8.0
(7.8 - 8.3) (7.9 - 8.3) (7.8 - 8.3) (7.8 - 8.3) (7.8 - 8.3) (7.8 - 8.3) (7.8 - 8.3)2.5 2.9 3.6 3.7 2.9 3.2 3.5
(1.5 - 3.3) (2.0 - 4.0) (2.0 - 5.0) (2.1 - 5.5) (2.0 - 4.1) (2.0 - 5.3) (2.0 - 5.3)2.1 2.9 1.2 1.6 3.0 2.0 2.0
(0.9 - 4.0) (0.6 - 18.3) (0.5 - 3.1) (0.9 - 4.2) (1.4 - 6.0) (0.7 - 3.8) (0.6 - 5.1)2.6 1.9 1.5 1.7 3.8 2.4 2.3
(1.2 - 5.1) (0.7 - 3.4) (0.6 - 3.8) (0.8 - 4.7) (1.8 - 7.0) (0.7 - 4.9) (<0.5 - 5.7)1.2 0.9 0.9 0.6 0.6 0.6 0.6
(0.3 - 1.8) (0.3 - 1.3) (0.6 - 1.6) (0.2 - 1.0) (0.2 - 1.0) (0.3 - 1.0) (0.3 - 1.4)0.070 0.055 0.050 0.044 0.048 0.046 0.040
(0.039 - 0.110) (0.029 - 0.110) (0.023 - 0.097) (0.017 - 0.103) (0.019 - 0.107) (0.014 - 0.105) (0.012 - 0.100)0.003 0.002 0.002 0.002 0.002 0.002 0.001
(0.001 - 0.007) (0.001 - 0.003) (<0.001 - 0.003) (<0.001 - 0.003) (<0.001 - 0.004) (<0.001 - 0.006) (<0.001 - 0.002)0.012 0.008 0.007 0.009 0.010 0.010 0.010
(<0.002 - 0.051) (<0.002 - 0.031) (<0.002 - 0.026) (<0.002 - 0.028) (<0.002 - 0.025) (<0.002 - 0.034) (<0.002 - 0.035)0.058 0.026 0.025 0.041 0.043 0.045 0.052
(0.003 - 0.160) (<0.002 - 0.137) (0.002 - 0.123) (0.003 - 0.163) (<0.002 - 0.147) (0.002 - 0.163) (<0.002 - 0.163) 0.14 0.09 0.08 0.09 0.10 0.10 0.10
(0.07 - 0.27) (0.04 - 0.22) (0.03 - 0.19) (0.04 - 0.21) (0.04 - 0.20) (0.06 - 0.21) (0.03 - 0.20)0.21 0.17 0.15 0.14 0.13 0.13 0.12
(0.17 - 0.24) (0.14 - 0.22) (0.13 - 0.23) (0.11 - 0.16) (0.10 - 0.18) (0.11 - 0.15) (0.10 - 0.17)0.28 0.21 0.19 0.19 0.19 0.19 0.19
(0.19 - 0.41) (0.16 - 0.34) (0.13 - 0.36) (0.13 - 0.32) (0.13 - 0.31) (0.14 - 0.32) (0.11 - 0.34)0.007 0.005 0.005 0.007 0.007 0.007 0.008
(0.003 - 0.014) (0.002 - 0.010) (<0.002 - 0.009) (0.003 - 0.014) (<0.002 - 0.012) (0.002 - 0.013) (0.002 - 0.013)0.03 0.02 0.02 0.02 0.02 0.02 0.02
(0.02 - 0.03) (<0.02 - 0.03) (<0.02 - 0.02) (<0.02 - 0.03) (<0.02 - 0.03) (<0.02 - 0.03) (<0.02 - 0.03)0.52 0.44 0.43 0.53 0.57 0.60 0.61
(<0.05 - 1.00) (<0.05 - 0.92) (0.06 - 0.95) (0.08 - 1.20) (0.09 - 1.13) (0.10 - 1.15) (0.11 - 1.10)4.9 3.2 3.0 2.3 2.2 2.2 1.9
(0.9 - 8.9) (0.5 - 8.1) (0.8 - 9.3) (0.6 - 5.7) (0.4 - 7.5) (0.8 - 4.8) (0.7 - 4.5)15 2 1 1 1 1 1
(1 - 55) (<1 - 18) (<1 - 2) (<1 - 3) (<1 - 6) (<1 - 1) (<1 - 1)32 3 1 1 2 2 1
(2 - 220) (<1 - 90) (<1 - 2) (<1 - 4) (<1 - 51) (<1 - 5) (<1 - 9)
Note : 3. Data in brackets indicate the ranges.
Note : 1. Unless otherwise specified, data presented are depth-averaged (A) values calculated by taking the means of threeNote : 1. depths: Surface (S), Mid-depth (M), Bottom (B).
Note : 2. Data presented are annual arithmetic means of the depth-averaged results except for E. coli and faecal coliformsNote : 2. which are annual geometric means.
Crooked Island Mirs Bay North
Bottom
Bottom
Total Phosphorus (mg/L)
Silica (as SiO2) (mg/L)
pH
Total Kjeldahl Nitrogen (mg/L)
Total Nitrogen (mg/L)
Secchi Disc Depth (m)
Turbidity (NTU)
Suspended Solids (mg/L)
Faecal Coliforms (count/100mL)
E.coli (count/100mL)
Chlorophyll-a (µg/L)
5-day Biochemical Oxygen Demand (mg/L)
Orthophosphate Phosphorus (mg/L)
Total Inorganic Nitrogen (mg/L)
Unionised Ammonia (mg/L)
Nitrite Nitrogen (mg/L)
Nitrate Nitrogen (mg/L)
Ammonia Nitrogen (mg/L)
Temperature (℃)
Salinity
Dissolved Oxygen (mg/L)
Dissolved Oxygen (% Saturation)
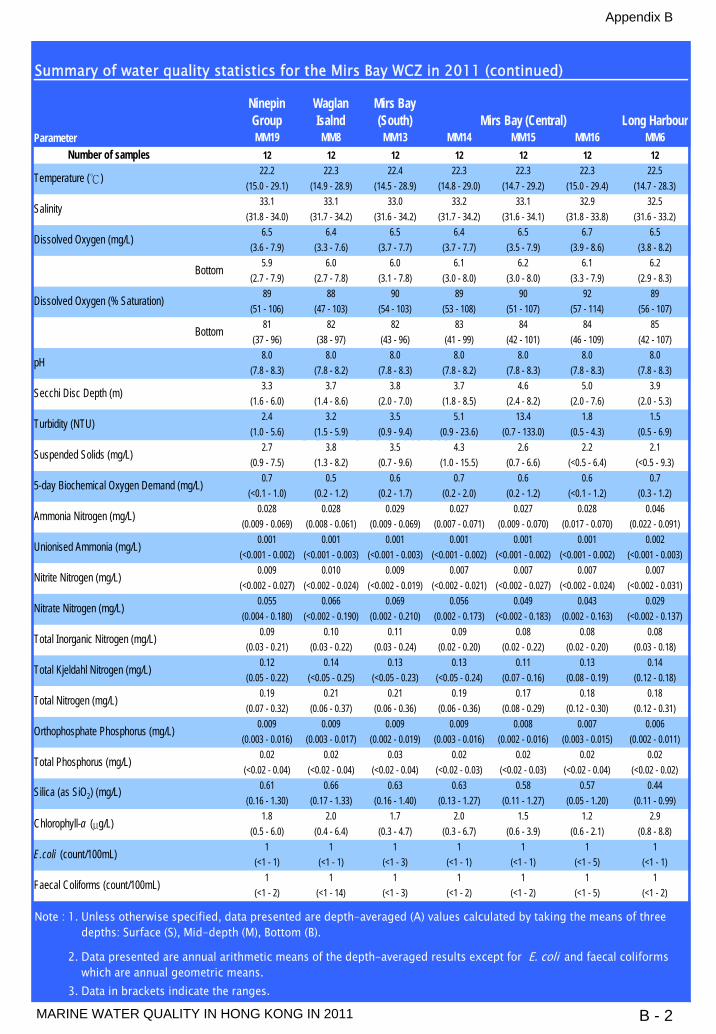
Appendix B
MARINE WATER QUALITY IN HONG KONG IN 2011 B - 2
22.3 x 17.4cm
Summary of water quality statistics for the Mirs Bay WCZ in 2011 (continued)
NinepinGroup
WaglanIsalnd
Mirs Bay(South) Long Harbour
Parameter MM19 MM8 MM13 MM14 MM15 MM16 MM6Number of samples 12 12 12 12 12 12 12
22.2 22.3 22.4 22.3 22.3 22.3 22.5(15.0 - 29.1) (14.9 - 28.9) (14.5 - 28.9) (14.8 - 29.0) (14.7 - 29.2) (15.0 - 29.4) (14.7 - 28.3)
33.1 33.1 33.0 33.2 33.1 32.9 32.5(31.8 - 34.0) (31.7 - 34.2) (31.6 - 34.2) (31.7 - 34.2) (31.6 - 34.1) (31.8 - 33.8) (31.6 - 33.2)
6.5 6.4 6.5 6.4 6.5 6.7 6.5(3.6 - 7.9) (3.3 - 7.6) (3.7 - 7.7) (3.7 - 7.7) (3.5 - 7.9) (3.9 - 8.6) (3.8 - 8.2)
5.9 6.0 6.0 6.1 6.2 6.1 6.2(2.7 - 7.9) (2.7 - 7.8) (3.1 - 7.8) (3.0 - 8.0) (3.0 - 8.0) (3.3 - 7.9) (2.9 - 8.3)
89 88 90 89 90 92 89(51 - 106) (47 - 103) (54 - 103) (53 - 108) (51 - 107) (57 - 114) (56 - 107)
81 82 82 83 84 84 85(37 - 96) (38 - 97) (43 - 96) (41 - 99) (42 - 101) (46 - 109) (42 - 107)
8.0 8.0 8.0 8.0 8.0 8.0 8.0(7.8 - 8.3) (7.8 - 8.2) (7.8 - 8.3) (7.8 - 8.2) (7.8 - 8.3) (7.8 - 8.3) (7.8 - 8.3)
3.3 3.7 3.8 3.7 4.6 5.0 3.9(1.6 - 6.0) (1.4 - 8.6) (2.0 - 7.0) (1.8 - 8.5) (2.4 - 8.2) (2.0 - 7.6) (2.0 - 5.3)
2.4 3.2 3.5 5.1 13.4 1.8 1.5(1.0 - 5.6) (1.5 - 5.9) (0.9 - 9.4) (0.9 - 23.6) (0.7 - 133.0) (0.5 - 4.3) (0.5 - 6.9)
2.7 3.8 3.5 4.3 2.6 2.2 2.1(0.9 - 7.5) (1.3 - 8.2) (0.7 - 9.6) (1.0 - 15.5) (0.7 - 6.6) (<0.5 - 6.4) (<0.5 - 9.3)
0.7 0.5 0.6 0.7 0.6 0.6 0.7(<0.1 - 1.0) (0.2 - 1.2) (0.2 - 1.7) (0.2 - 2.0) (0.2 - 1.2) (<0.1 - 1.2) (0.3 - 1.2)
0.028 0.028 0.029 0.027 0.027 0.028 0.046(0.009 - 0.069) (0.008 - 0.061) (0.009 - 0.069) (0.007 - 0.071) (0.009 - 0.070) (0.017 - 0.070) (0.022 - 0.091)
0.001 0.001 0.001 0.001 0.001 0.001 0.002(<0.001 - 0.002) (<0.001 - 0.003) (<0.001 - 0.003) (<0.001 - 0.002) (<0.001 - 0.002) (<0.001 - 0.002) (<0.001 - 0.003)
0.009 0.010 0.009 0.007 0.007 0.007 0.007(<0.002 - 0.027) (<0.002 - 0.024) (<0.002 - 0.019) (<0.002 - 0.021) (<0.002 - 0.027) (<0.002 - 0.024) (<0.002 - 0.031)
0.055 0.066 0.069 0.056 0.049 0.043 0.029(0.004 - 0.180) (<0.002 - 0.190) (0.002 - 0.210) (0.002 - 0.173) (<0.002 - 0.183) (0.002 - 0.163) (<0.002 - 0.137)
0.09 0.10 0.11 0.09 0.08 0.08 0.08(0.03 - 0.21) (0.03 - 0.22) (0.03 - 0.24) (0.02 - 0.20) (0.02 - 0.22) (0.02 - 0.20) (0.03 - 0.18)
0.12 0.14 0.13 0.13 0.11 0.13 0.14(0.05 - 0.22) (<0.05 - 0.25) (<0.05 - 0.23) (<0.05 - 0.24) (0.07 - 0.16) (0.08 - 0.19) (0.12 - 0.18)
0.19 0.21 0.21 0.19 0.17 0.18 0.18(0.07 - 0.32) (0.06 - 0.37) (0.06 - 0.36) (0.06 - 0.36) (0.08 - 0.29) (0.12 - 0.30) (0.12 - 0.31)
0.009 0.009 0.009 0.009 0.008 0.007 0.006(0.003 - 0.016) (0.003 - 0.017) (0.002 - 0.019) (0.003 - 0.016) (0.002 - 0.016) (0.003 - 0.015) (0.002 - 0.011)
0.02 0.02 0.03 0.02 0.02 0.02 0.02(<0.02 - 0.04) (<0.02 - 0.04) (<0.02 - 0.04) (<0.02 - 0.03) (<0.02 - 0.03) (<0.02 - 0.04) (<0.02 - 0.02)
0.61 0.66 0.63 0.63 0.58 0.57 0.44(0.16 - 1.30) (0.17 - 1.33) (0.16 - 1.40) (0.13 - 1.27) (0.11 - 1.27) (0.05 - 1.20) (0.11 - 0.99)
1.8 2.0 1.7 2.0 1.5 1.2 2.9(0.5 - 6.0) (0.4 - 6.4) (0.3 - 4.7) (0.3 - 6.7) (0.6 - 3.9) (0.6 - 2.1) (0.8 - 8.8)
1 1 1 1 1 1 1(<1 - 1) (<1 - 1) (<1 - 3) (<1 - 1) (<1 - 1) (<1 - 5) (<1 - 1)
1 1 1 1 1 1 1(<1 - 2) (<1 - 14) (<1 - 3) (<1 - 2) (<1 - 2) (<1 - 5) (<1 - 2)
Note : 3. Data in brackets indicate the ranges.
Note : 1. Unless otherwise specified, data presented are depth-averaged (A) values calculated by taking the means of threeNote : 1. depths: Surface (S), Mid-depth (M), Bottom (B).
Note : 2. Data presented are annual arithmetic means of the depth-averaged results except for E. coli and faecal coliformsNote : 2. which are annual geometric means.
Silica (as SiO2) (mg/L)
Mirs Bay (Central)
Temperature (℃)
Salinity
Dissolved Oxygen (mg/L)
Suspended Solids (mg/L)
Bottom
Bottom
Faecal Coliforms (count/100mL)
E.coli (count/100mL)
Chlorophyll-a (µg/L)
5-day Biochemical Oxygen Demand (mg/L)
Orthophosphate Phosphorus (mg/L)
Total Inorganic Nitrogen (mg/L)
Unionised Ammonia (mg/L)
Nitrite Nitrogen (mg/L)
pH
Total Kjeldahl Nitrogen (mg/L)
Total Phosphorus (mg/L)
Dissolved Oxygen (% Saturation)
Total Nitrogen (mg/L)
Secchi Disc Depth (m)
Turbidity (NTU)
Nitrate Nitrogen (mg/L)
Ammonia Nitrogen (mg/L)
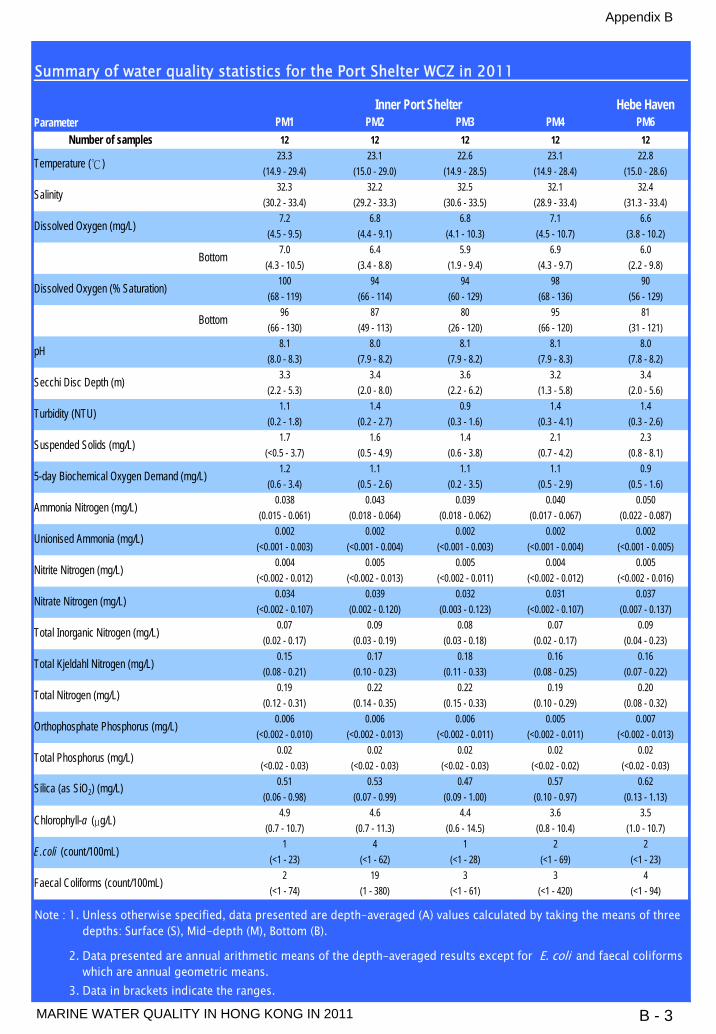
Appendix B
MARINE WATER QUALITY IN HONG KONG IN 2011 B - 3
Summary of water quality statistics for the Port Shelter WCZ in 2011
Hebe HavenParameter PM1 PM2 PM3 PM4 PM6
Number of samples 12 12 12 12 1223.3 23.1 22.6 23.1 22.8
(14.9 - 29.4) (15.0 - 29.0) (14.9 - 28.5) (14.9 - 28.4) (15.0 - 28.6)32.3 32.2 32.5 32.1 32.4
(30.2 - 33.4) (29.2 - 33.3) (30.6 - 33.5) (28.9 - 33.4) (31.3 - 33.4)7.2 6.8 6.8 7.1 6.6
(4.5 - 9.5) (4.4 - 9.1) (4.1 - 10.3) (4.5 - 10.7) (3.8 - 10.2)7.0 6.4 5.9 6.9 6.0
(4.3 - 10.5) (3.4 - 8.8) (1.9 - 9.4) (4.3 - 9.7) (2.2 - 9.8)100 94 94 98 90
(68 - 119) (66 - 114) (60 - 129) (68 - 136) (56 - 129)96 87 80 95 81
(66 - 130) (49 - 113) (26 - 120) (66 - 120) (31 - 121)8.1 8.0 8.1 8.1 8.0
(8.0 - 8.3) (7.9 - 8.2) (7.9 - 8.2) (7.9 - 8.3) (7.8 - 8.2)3.3 3.4 3.6 3.2 3.4
(2.2 - 5.3) (2.0 - 8.0) (2.2 - 6.2) (1.3 - 5.8) (2.0 - 5.6)1.1 1.4 0.9 1.4 1.4
(0.2 - 1.8) (0.2 - 2.7) (0.3 - 1.6) (0.3 - 4.1) (0.3 - 2.6)1.7 1.6 1.4 2.1 2.3
(<0.5 - 3.7) (0.5 - 4.9) (0.6 - 3.8) (0.7 - 4.2) (0.8 - 8.1)1.2 1.1 1.1 1.1 0.9
(0.6 - 3.4) (0.5 - 2.6) (0.2 - 3.5) (0.5 - 2.9) (0.5 - 1.6)0.038 0.043 0.039 0.040 0.050
(0.015 - 0.061) (0.018 - 0.064) (0.018 - 0.062) (0.017 - 0.067) (0.022 - 0.087)0.002 0.002 0.002 0.002 0.002
(<0.001 - 0.003) (<0.001 - 0.004) (<0.001 - 0.003) (<0.001 - 0.004) (<0.001 - 0.005)0.004 0.005 0.005 0.004 0.005
(<0.002 - 0.012) (<0.002 - 0.013) (<0.002 - 0.011) (<0.002 - 0.012) (<0.002 - 0.016)0.034 0.039 0.032 0.031 0.037
(<0.002 - 0.107) (0.002 - 0.120) (0.003 - 0.123) (<0.002 - 0.107) (0.007 - 0.137) 0.07 0.09 0.08 0.07 0.09
(0.02 - 0.17) (0.03 - 0.19) (0.03 - 0.18) (0.02 - 0.17) (0.04 - 0.23)0.15 0.17 0.18 0.16 0.16
(0.08 - 0.21) (0.10 - 0.23) (0.11 - 0.33) (0.08 - 0.25) (0.07 - 0.22)0.19 0.22 0.22 0.19 0.20
(0.12 - 0.31) (0.14 - 0.35) (0.15 - 0.33) (0.10 - 0.29) (0.08 - 0.32)0.006 0.006 0.006 0.005 0.007
(<0.002 - 0.010) (<0.002 - 0.013) (<0.002 - 0.011) (<0.002 - 0.011) (<0.002 - 0.013)0.02 0.02 0.02 0.02 0.02
(<0.02 - 0.03) (<0.02 - 0.03) (<0.02 - 0.03) (<0.02 - 0.02) (<0.02 - 0.03)0.51 0.53 0.47 0.57 0.62
(0.06 - 0.98) (0.07 - 0.99) (0.09 - 1.00) (0.10 - 0.97) (0.13 - 1.13)4.9 4.6 4.4 3.6 3.5
(0.7 - 10.7) (0.7 - 11.3) (0.6 - 14.5) (0.8 - 10.4) (1.0 - 10.7)1 4 1 2 2
(<1 - 23) (<1 - 62) (<1 - 28) (<1 - 69) (<1 - 23)2 19 3 3 4
(<1 - 74) (1 - 380) (<1 - 61) (<1 - 420) (<1 - 94)
Note : 3. Data in brackets indicate the ranges.
Note : 1. Unless otherwise specified, data presented are depth-averaged (A) values calculated by taking the means of threeNote : 1. depths: Surface (S), Mid-depth (M), Bottom (B).
Note : 2. Data presented are annual arithmetic means of the depth-averaged results except for E. coli and faecal coliformsNote : 2. which are annual geometric means.
Dissolved Oxygen (% Saturation)
Secchi Disc Depth (m)
Unionised Ammonia (mg/L)
Nitrite Nitrogen (mg/L)
Turbidity (NTU)
Suspended Solids (mg/L)
Ammonia Nitrogen (mg/L)
Faecal Coliforms (count/100mL)
E.coli (count/100mL)
Chlorophyll-a (µg/L)
5-day Biochemical Oxygen Demand (mg/L)
Orthophosphate Phosphorus (mg/L)
Total Inorganic Nitrogen (mg/L)
Nitrate Nitrogen (mg/L)
Bottom
Total Phosphorus (mg/L)
Silica (as SiO2) (mg/L)
pH
Total Kjeldahl Nitrogen (mg/L)
Total Nitrogen (mg/L)
Inner Port Shelter
Bottom
Temperature (℃)
Salinity
Dissolved Oxygen (mg/L)

Appendix B
MARINE WATER QUALITY IN HONG KONG IN 2011 B - 4
Summary of water quality statistics of the Port Shelter WCZ in 2011 (continued)
Rocky Harbour Bluff IslandParameter PM7 PM8 PM9 PM11
Number of samples 12 12 12 1222.2 21.9 22.3 21.9
(14.9 - 28.6) (14.8 - 28.6) (14.7 - 28.5) (14.7 - 28.6)32.7 32.7 32.5 32.7
(31.8 - 33.6) (31.8 - 33.6) (31.1 - 33.8) (31.9 - 33.9)6.5 6.4 6.7 6.3
(3.6 - 9.8) (3.5 - 8.8) (3.8 - 9.9) (3.5 - 8.1)5.8 5.8 6.1 5.9
(1.7 - 8.5) (2.6 - 8.0) (2.3 - 8.0) (2.7 - 8.0)89 87 92 87
(53 - 123) (51 - 108) (56 - 124) (51 - 100)78 78 82 79
(23 - 110) (37 - 100) (32 - 101) (38 - 100)8.0 8.0 8.0 8.0
(7.9 - 8.2) (7.8 - 8.3) (7.9 - 8.3) (7.8 - 8.3)4.1 4.0 3.8 4.0
(2.2 - 7.0) (2.4 - 6.3) (1.8 - 6.2) (2.0 - 6.5)1.1 1.3 1.2 1.9
(0.4 - 2.7) (0.5 - 1.9) (0.4 - 2.5) (1.0 - 3.5)1.2 1.3 1.4 2.0
(0.5 - 2.2) (0.7 - 2.5) (0.7 - 2.9) (0.6 - 3.9)0.7 0.7 0.9 0.6
(0.3 - 1.9) (0.3 - 1.6) (<0.1 - 3.3) (<0.1 - 1.5)0.039 0.036 0.039 0.037
(0.026 - 0.059) (0.019 - 0.064) (0.022 - 0.066) (0.023 - 0.061)0.001 0.001 0.002 0.001
(<0.001 - 0.003) (<0.001 - 0.003) (<0.001 - 0.003) (<0.001 - 0.003)0.006 0.008 0.007 0.008
(<0.002 - 0.024) (<0.002 - 0.023) (<0.002 - 0.019) (<0.002 - 0.027)0.046 0.062 0.050 0.070
(0.002 - 0.147) (0.002 - 0.170) (<0.002 - 0.160) (<0.002 - 0.190) 0.09 0.11 0.10 0.12
(0.04 - 0.20) (0.04 - 0.23) (0.03 - 0.22) (0.03 - 0.24)0.14 0.13 0.13 0.13
(0.09 - 0.20) (0.08 - 0.19) (0.08 - 0.18) (0.07 - 0.15)0.20 0.20 0.19 0.21
(0.14 - 0.30) (0.12 - 0.31) (0.13 - 0.30) (0.13 - 0.30)0.007 0.009 0.007 0.009
(0.003 - 0.013) (0.004 - 0.016) (0.004 - 0.016) (0.003 - 0.017)0.02 0.02 0.02 0.02
(<0.02 - 0.03) (<0.02 - 0.02) (<0.02 - 0.03) (<0.02 - 0.04)0.56 0.65 0.60 0.67
(0.15 - 1.10) (0.15 - 1.12) (0.15 - 1.17) (0.16 - 1.23)2.8 2.0 3.0 1.5
(0.5 - 8.0) (0.6 - 5.8) (0.3 - 11.1) (0.4 - 3.1)1 1 1 1
(<1 - 4) (<1 - 1) (<1 - 3) (<1 - 2)2 1 2 2
(<1 - 17) (<1 - 3) (<1 - 9) (<1 - 9)
Note : 3. Data in brackets indicate the ranges.
Note : 1. Unless otherwise specified, data presented are depth-averaged (A) values calculated by taking the means of threeNote : 1. depths: Surface (S), Mid-depth (M), Bottom (B).
Note : 2. Data presented are annual arithmetic means of the depth-averaged results except for E. coli and faecal coliformsNote : 2. which are annual geometric means.
pH
Total Kjeldahl Nitrogen (mg/L)
Total Nitrogen (mg/L)
Secchi Disc Depth (m)
Turbidity (NTU)
Nitrite Nitrogen (mg/L)
Faecal Coliforms (count/100mL)
E.coli (count/100mL)
Outer Port Shelter
Bottom
Total Phosphorus (mg/L)
Dissolved Oxygen (% Saturation)
Bottom
Temperature (℃)
Salinity
Dissolved Oxygen (mg/L)
Suspended Solids (mg/L)
Ammonia Nitrogen (mg/L)
Chlorophyll-a (µg/L)
5-day Biochemical Oxygen Demand (mg/L)
Orthophosphate Phosphorus (mg/L)
Total Inorganic Nitrogen (mg/L)
Nitrate Nitrogen (mg/L)
Unionised Ammonia (mg/L)
Silica (as SiO2) (mg/L)

Appendix B
MARINE WATER QUALITY IN HONG KONG IN 2011 B - 5
22.3 x 17.4cm
Summary of water quality statistics for the Tolo Harbour WCZ in 2011
Harbour Subzone Buffer Subzone Channel Subzone Parameter TM2 TM3 TM4 TM5 TM6 TM7 TM8
Number of samples 12 12 12 12 12 12 1223.6 23.4 23.3 23.7 22.8 23.0 22.3
(15.5 - 30.2) (15.5 - 30.2) (15.4 - 29.8) (15.8 - 30.6) (15.3 - 29.8) (15.2 - 29.8) (15.0 - 29.4)31.2 31.6 31.6 31.8 32.3 32.4 32.7
(27.2 - 32.6) (28.9 - 32.7) (27.8 - 33.1) (29.8 - 32.8) (30.4 - 33.1) (31.0 - 33.2) (31.3 - 33.5)6.5 6.2 5.9 6.4 5.7 6.0 5.7
(2.1 - 9.2) (3.0 - 8.1) (2.2 - 8.2) (3.9 - 8.6) (3.0 - 7.7) (3.4 - 7.9) (3.1 - 8.0)6.4 4.6 4.5 6.2 4.8 5.3 4.9
(2.1 - 8.7) (1.6 - 7.5) (1.1 - 7.2) (3.8 - 7.7) (1.1 - 7.4) (2.0 - 7.6) (1.0 - 7.8)90 86 82 90 79 83 79
(32 - 136) (45 - 113) (33 - 108) (54 - 125) (45 - 104) (48 - 104) (46 - 100)90 63 61 87 64 72 66
(33 - 127) (23 - 92) (16 - 95) (52 - 113) (16 - 93) (28 - 98) (14 - 95)7.9 8.0 8.0 8.0 8.0 8.0 8.0
(7.6 - 8.4) (7.8 - 8.3) (7.7 - 8.3) (7.9 - 8.4) (7.8 - 8.2) (7.9 - 8.2) (7.8 - 8.2)2.6 2.5 2.8 2.8 3.0 3.6 3.8
(1.9 - 3.5) (1.9 - 3.1) (2.3 - 3.4) (2.1 - 3.6) (2.0 - 5.0) (2.4 - 5.0) (2.0 - 6.0)1.7 1.6 1.1 1.4 1.3 0.8 1.5
(0.7 - 5.0) (0.8 - 6.0) (0.4 - 1.9) (0.4 - 5.1) (0.5 - 4.4) (0.5 - 1.5) (0.8 - 2.8)2.1 1.7 1.3 1.4 1.8 1.0 1.7
(0.9 - 6.4) (1.0 - 2.3) (0.6 - 2.7) (<0.5 - 4.8) (0.8 - 7.5) (0.6 - 1.4) (1.0 - 3.8)1.7 1.7 1.5 1.7 1.2 1.1 0.9
(0.8 - 2.9) (1.0 - 2.4) (0.8 - 2.6) (0.8 - 3.7) (0.6 - 2.0) (0.7 - 1.8) (0.5 - 2.0)0.076 0.077 0.072 0.051 0.055 0.050 0.047
(0.035 - 0.165) (0.031 - 0.137) (0.032 - 0.123) (0.015 - 0.100) (0.018 - 0.103) (0.022 - 0.107) (0.017 - 0.102)0.003 0.004 0.003 0.002 0.002 0.002 0.002
(<0.001 - 0.008) (<0.001 - 0.012) (<0.001 - 0.009) (<0.001 - 0.005) (<0.001 - 0.003) (<0.001 - 0.004) (<0.001 - 0.003)0.003 0.005 0.006 0.002 0.009 0.005 0.010
(<0.002 - 0.008) (<0.002 - 0.017) (<0.002 - 0.028) (<0.002 - 0.005) (<0.002 - 0.042) (<0.002 - 0.016) (<0.002 - 0.037)0.149 0.012 0.013 0.018 0.013 0.020 0.076
(<0.002 - 1.560) (0.002 - 0.075) (<0.002 - 0.092) (0.002 - 0.101) (0.002 - 0.071) (0.002 - 0.105) (<0.002 - 0.609) 0.23 0.09 0.09 0.07 0.08 0.07 0.13
(0.04 - 1.66) (0.04 - 0.21) (0.04 - 0.21) (0.02 - 0.14) (0.03 - 0.15) (0.03 - 0.14) (0.03 - 0.66)0.26 0.25 0.23 0.20 0.19 0.17 0.17
(0.19 - 0.41) (0.17 - 0.33) (0.17 - 0.32) (0.13 - 0.35) (0.15 - 0.27) (0.11 - 0.22) (0.12 - 0.32)0.41 0.26 0.25 0.22 0.21 0.19 0.25
(0.20 - 1.86) (0.18 - 0.39) (0.17 - 0.41) (0.14 - 0.36) (0.15 - 0.32) (0.11 - 0.28) (0.13 - 0.77)0.005 0.005 0.004 0.005 0.006 0.005 0.008
(<0.002 - 0.029) (<0.002 - 0.007) (<0.002 - 0.008) (<0.002 - 0.009) (0.002 - 0.011) (<0.002 - 0.014) (0.003 - 0.016)0.03 0.03 0.02 0.02 0.02 0.02 0.02
(<0.02 - 0.06) (<0.02 - 0.05) (<0.02 - 0.04) (<0.02 - 0.04) (<0.02 - 0.03) (<0.02 - 0.03) (<0.02 - 0.04)0.90 0.84 0.85 0.59 0.71 0.58 0.64
(0.17 - 1.85) (0.11 - 1.77) (0.09 - 1.77) (0.09 - 1.30) (0.24 - 1.23) (0.21 - 1.04) (0.39 - 1.19)6.6 6.2 4.7 4.2 3.4 2.9 3.8
(3.0 - 13.7) (3.2 - 17.3) (2.2 - 8.4) (1.9 - 6.7) (1.3 - 5.5) (1.0 - 5.5) (0.8 - 17.7)9 6 4 2 1 1 1
(<1 - 390) (<1 - 55) (<1 - 200) (<1 - 18) (<1 - 11) (<1 - 5) (<1 - 3)44 16 12 4 4 2 1
(2 - 2800) (<1 - 210) (1 - 800) (1 - 300) (1 - 140) (<1 - 32) (<1 - 4)
Note : 3. Data in brackets indicate the ranges.
Note : 1. Unless otherwise specified, data presented are depth-averaged (A) values calculated by taking the means of threeNote : 1. depths: Surface (S), Mid-depth (M), Bottom (B).
Note : 2. Data presented are annual arithmetic means of the depth-averaged results except for E. coli and faecal coliformsNote : 2. which are annual geometric means.
Unionised Ammonia (mg/L)
Nitrite Nitrogen (mg/L)
Total Kjeldahl Nitrogen (mg/L)
Total Nitrogen (mg/L)
Bottom
Bottom
Nitrate Nitrogen (mg/L)
Temperature (℃)
Salinity
Dissolved Oxygen (mg/L)
Dissolved Oxygen (% Saturation)
Turbidity (NTU)
Suspended Solids (mg/L)
Ammonia Nitrogen (mg/L)
pH
Secchi Disc Depth (m)
Faecal Coliforms (count/100mL)
E.coli (count/100mL)
Chlorophyll-a (µg/L)
5-day Biochemical Oxygen Demand (mg/L)
Orthophosphate Phosphorus (mg/L)
Total Inorganic Nitrogen (mg/L)
Total Phosphorus (mg/L)
Silica (as SiO2) (mg/L)

Appendix B
MARINE WATER QUALITY IN HONG KONG IN 2011 B - 6
22.3 x 17.4cm
Summary of water quality statistics for the Southern WCZ in 2011
Parameter SM1 SM2 SM19 SM3 SM4Number of samples 12 12 12 12 12
22.4 22.5 22.1 22.1 22.7(14.7 - 28.0) (15.1 - 27.7) (14.6 - 27.4) (14.9 - 26.7) (15.0 - 28.0)
32.5 32.3 32.6 32.6 32.1(30.8 - 34.0) (30.4 - 33.9) (31.1 - 34.0) (30.9 - 33.7) (30.0 - 33.5)
6.4 6.3 6.1 5.9 6.2(4.0 - 8.0) (3.7 - 7.9) (3.8 - 7.8) (3.3 - 7.9) (3.1 - 7.8)
5.7 5.8 5.5 5.4 6.0(2.2 - 7.9) (1.6 - 7.9) (0.9 - 7.8) (1.3 - 7.9) (2.8 - 7.7)
88 87 84 80 86(57 - 99) (53 - 98) (54 - 96) (46 - 97) (45 - 102)
77 80 75 74 83(31 - 97) (23 - 97) (12 - 95) (18 - 97) (41 - 96)
8.0 8.0 8.0 7.9 7.9(7.8 - 8.3) (7.8 - 8.3) (7.8 - 8.3) (7.7 - 8.3) (7.7 - 8.3)
2.8 2.7 2.6 3.1 3.5(2.0 - 3.7) (1.6 - 3.6) (2.0 - 3.3) (1.9 - 4.0) (1.9 - 11.0)
2.8 2.8 3.2 3.5 2.4(1.1 - 6.8) (1.3 - 5.4) (1.3 - 7.2) (1.6 - 4.8) (0.9 - 5.0)
3.2 3.5 3.0 3.9 2.9(1.4 - 8.6) (1.1 - 6.0) (1.0 - 7.5) (1.4 - 6.8) (1.1 - 7.4)
0.8 0.8 0.7 0.8 0.9(0.5 - 1.5) (0.2 - 1.2) (<0.1 - 1.3) (0.3 - 1.2) (0.3 - 1.6)
0.035 0.043 0.032 0.044 0.061(0.013 - 0.070) (0.014 - 0.076) (0.010 - 0.071) (0.014 - 0.113) (0.026 - 0.140)
0.001 0.002 0.001 0.001 0.002(<0.001 - 0.002) (<0.001 - 0.003) (<0.001 - 0.002) (<0.001 - 0.002) (<0.001 - 0.004)
0.015 0.020 0.017 0.022 0.026(0.002 - 0.033) (0.004 - 0.043) (0.004 - 0.033) (0.006 - 0.045) (0.008 - 0.061)
0.092 0.108 0.094 0.111 0.127(0.011 - 0.207) (0.024 - 0.197) (0.019 - 0.210) (0.035 - 0.200) (0.034 - 0.217)
0.14 0.17 0.14 0.18 0.21(0.07 - 0.25) (0.09 - 0.26) (0.08 - 0.25) (0.09 - 0.27) (0.09 - 0.34)
0.12 0.14 0.13 0.14 0.16(0.08 - 0.16) (0.10 - 0.22) (0.06 - 0.17) (0.09 - 0.19) (0.11 - 0.21)
0.23 0.27 0.24 0.27 0.31(0.14 - 0.36) (0.18 - 0.43) (0.17 - 0.35) (0.18 - 0.37) (0.21 - 0.44)
0.010 0.010 0.010 0.012 0.013(0.004 - 0.017) (0.004 - 0.020) (0.004 - 0.018) (0.005 - 0.018) (0.004 - 0.020)
0.02 0.02 0.03 0.03 0.03(<0.02 - 0.03) (<0.02 - 0.03) (<0.02 - 0.04) (<0.02 - 0.04) (0.02 - 0.03)
0.81 0.83 0.82 0.93 0.84(0.18 - 1.30) (0.26 - 1.33) (0.23 - 1.30) (0.31 - 1.51) (0.24 - 1.70)
2.3 2.6 2.2 1.9 3.1(0.6 - 5.6) (0.4 - 5.8) (0.6 - 6.9) (0.4 - 3.3) (0.5 - 8.0)
2 52 1 61 9(<1 - 16) (3 - 2600) (<1 - 8) (9 - 1700) (2 - 47)
2 86 2 110 20(<1 - 32) (5 - 3400) (<1 - 30) (17 - 2300) (5 - 82)
Note : 3. Data in brackets indicate the ranges.
Note : 1. Unless otherwise specified, data presented are depth-averaged (A) values calculated by taking the means of threeNote : 1. depths: Surface (S), Mid-depth (M), Bottom (B).
Note : 2. Data presented are annual arithmetic means of the depth-averaged results except for E. coli and faecal coliformsNote : 2. which are annual geometric means.
East Lamma ChannelHong Kong Island (South)
Bottom
Temperature (℃)
Salinity
Dissolved Oxygen (mg/L)
Bottom
Total Phosphorus (mg/L)
Faecal Coliforms (count/100mL)
E.coli (count/100mL)
Chlorophyll-a (µg/L)
5-day Biochemical Oxygen Demand (mg/L)
Orthophosphate Phosphorus (mg/L)
Total Inorganic Nitrogen (mg/L)
Nitrate Nitrogen (mg/L)
Silica (as SiO2) (mg/L)
Total Kjeldahl Nitrogen (mg/L)
Total Nitrogen (mg/L)
Dissolved Oxygen (% Saturation)
Secchi Disc Depth (m)
Unionised Ammonia (mg/L)
Nitrite Nitrogen (mg/L)
Turbidity (NTU)
Suspended Solids (mg/L)
Ammonia Nitrogen (mg/L)
pH

Appendix B
MARINE WATER QUALITY IN HONG KONG IN 2011 B - 7
22.3 x 17.4cm
Summary of water quality statistics for the Southern WCZ in 2011 (continued)
Parameter SM5 SM6 SM7 SM9 SM18Number of samples 12 12 12 12 12
23.0 22.8 22.9 23.0 22.5(15.0 - 29.0) (14.9 - 28.6) (15.1 - 27.9) (16.8 - 28.4) (14.8 - 28.0)
31.8 31.9 31.6 31.1 32.1(27.2 - 33.8) (28.8 - 33.7) (28.3 - 33.2) (28.1 - 33.2) (29.0 - 33.9)
6.5 6.5 6.2 6.3 6.1(4.2 - 8.1) (3.5 - 8.0) (3.4 - 7.6) (3.2 - 8.6) (3.5 - 7.9)
6.3 5.8 5.9 6.0 5.5(3.8 - 7.9) (2.0 - 8.0) (3.0 - 8.2) (2.9 - 8.6) (0.4 - 7.9)
91 89 86 88 84(60 - 123) (50 - 106) (49 - 102) (47 - 113) (49 - 97)
87 80 80 83 75(55 - 115) (28 - 98) (44 - 103) (42 - 108) (5 - 97)
8.0 8.0 7.9 7.9 8.0(7.8 - 8.4) (7.8 - 8.3) (7.7 - 8.3) (7.5 - 8.3) (7.8 - 8.3)
2.5 2.5 2.4 1.9 2.7(1.8 - 3.8) (1.9 - 4.0) (1.3 - 3.1) (1.0 - 2.6) (1.7 - 4.6)
4.0 4.4 4.5 4.8 3.8(1.2 - 8.6) (1.1 - 9.7) (1.2 - 9.5) (2.4 - 11.6) (0.9 - 10.2)
5.0 4.8 5.0 6.6 3.3(1.0 - 10.7) (0.9 - 12.5) (1.1 - 9.3) (3.3 - 16.7) (0.7 - 7.0)
0.9 1.0 1.1 1.0 0.7(0.2 - 2.1) (0.1 - 2.1) (0.3 - 2.2) (<0.1 - 2.1) (0.1 - 1.1)
0.041 0.052 0.081 0.110 0.038(0.015 - 0.091) (0.014 - 0.110) (0.034 - 0.173) (0.014 - 0.267) (0.013 - 0.070)
0.002 0.002 0.003 0.003 0.001(<0.001 - 0.004) (<0.001 - 0.009) (<0.001 - 0.010) (<0.001 - 0.006) (<0.001 - 0.003)
0.025 0.028 0.039 0.037 0.023(0.007 - 0.071) (0.008 - 0.081) (0.008 - 0.070) (0.009 - 0.062) (0.003 - 0.054)
0.131 0.131 0.176 0.207 0.126(0.040 - 0.280) (0.034 - 0.245) (0.051 - 0.383) (0.070 - 0.383) (0.015 - 0.213)
0.20 0.21 0.30 0.35 0.19(0.10 - 0.38) (0.08 - 0.33) (0.15 - 0.50) (0.19 - 0.55) (0.07 - 0.29)
0.14 0.17 0.20 0.26 0.12(0.10 - 0.25) (0.11 - 0.25) (0.09 - 0.34) (0.13 - 0.39) (0.07 - 0.16)
0.30 0.33 0.41 0.50 0.27(0.19 - 0.51) (0.24 - 0.49) (0.20 - 0.59) (0.29 - 0.71) (0.14 - 0.41)
0.010 0.011 0.016 0.018 0.011(<0.002 - 0.017) (0.004 - 0.025) (0.005 - 0.026) (0.006 - 0.032) (0.004 - 0.018)
0.02 0.03 0.03 0.04 0.02(<0.02 - 0.03) (0.02 - 0.05) (<0.02 - 0.05) (0.03 - 0.06) (<0.02 - 0.04)
0.91 0.93 1.01 1.00 0.95(0.33 - 1.97) (0.28 - 1.83) (0.27 - 1.93) (0.06 - 1.80) (0.19 - 1.83)
3.1 3.4 4.6 5.2 1.8(0.4 - 8.5) (0.5 - 10.0) (0.5 - 14.1) (0.8 - 23.7) (0.4 - 4.7)
1 1 4 5 1(<1 - 4) (<1 - 3) (<1 - 92) (1 - 39) (<1 - 6)
2 2 8 10 2(<1 - 16) (<1 - 88) (<1 - 130) (1 - 86) (<1 - 38)
Note : 3. Data in brackets indicate the ranges.
Note : 1. Unless otherwise specified, data presented are depth-averaged (A) values calculated by taking the means of threeNote : 1. depths: Surface (S), Mid-depth (M), Bottom (B).
Note : 2. Data presented are annual arithmetic means of the depth-averaged results except for E. coli and faecal coliformsNote : 2. which are annual geometric means.
Dissolved Oxygen (% Saturation)
Secchi Disc Depth (m)
Unionised Ammonia (mg/L)
Nitrite Nitrogen (mg/L)
Turbidity (NTU)
Suspended Solids (mg/L)
Ammonia Nitrogen (mg/L)
Faecal Coliforms (count/100mL)
E.coli (count/100mL)
Chlorophyll-a (µg/L)
5-day Biochemical Oxygen Demand (mg/L)
Orthophosphate Phosphorus (mg/L)
Total Inorganic Nitrogen (mg/L)
Nitrate Nitrogen (mg/L)
Bottom
Total Phosphorus (mg/L)
Silica (as SiO2) (mg/L)
pH
Total Kjeldahl Nitrogen (mg/L)
Total Nitrogen (mg/L)
West Lamma Channel
Bottom
Temperature (℃)
Salinity
Dissolved Oxygen (mg/L)
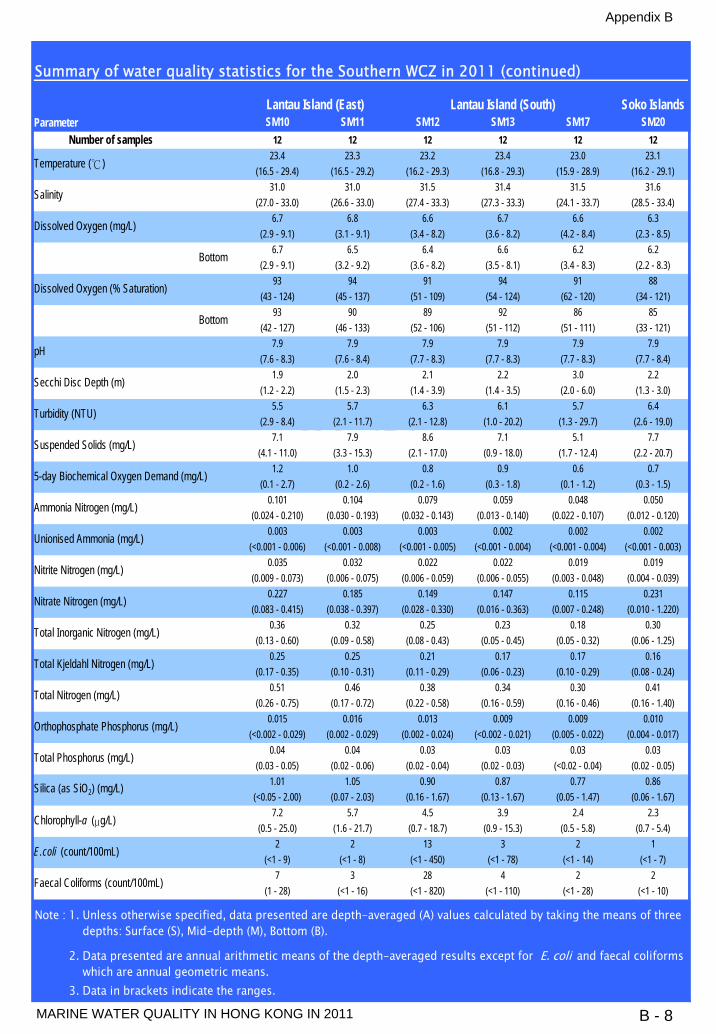
Appendix B
MARINE WATER QUALITY IN HONG KONG IN 2011 B - 8
22.3 x 17.4cm
Summary of water quality statistics for the Southern WCZ in 2011 (continued)
Soko IslandsParameter SM10 SM11 SM12 SM13 SM17 SM20
Number of samples 12 12 12 12 12 1223.4 23.3 23.2 23.4 23.0 23.1
(16.5 - 29.4) (16.5 - 29.2) (16.2 - 29.3) (16.8 - 29.3) (15.9 - 28.9) (16.2 - 29.1)31.0 31.0 31.5 31.4 31.5 31.6
(27.0 - 33.0) (26.6 - 33.0) (27.4 - 33.3) (27.3 - 33.3) (24.1 - 33.7) (28.5 - 33.4)6.7 6.8 6.6 6.7 6.6 6.3
(2.9 - 9.1) (3.1 - 9.1) (3.4 - 8.2) (3.6 - 8.2) (4.2 - 8.4) (2.3 - 8.5)6.7 6.5 6.4 6.6 6.2 6.2
(2.9 - 9.1) (3.2 - 9.2) (3.6 - 8.2) (3.5 - 8.1) (3.4 - 8.3) (2.2 - 8.3)93 94 91 94 91 88
(43 - 124) (45 - 137) (51 - 109) (54 - 124) (62 - 120) (34 - 121)93 90 89 92 86 85
(42 - 127) (46 - 133) (52 - 106) (51 - 112) (51 - 111) (33 - 121)7.9 7.9 7.9 7.9 7.9 7.9
(7.6 - 8.3) (7.6 - 8.4) (7.7 - 8.3) (7.7 - 8.3) (7.7 - 8.3) (7.7 - 8.4)1.9 2.0 2.1 2.2 3.0 2.2
(1.2 - 2.2) (1.5 - 2.3) (1.4 - 3.9) (1.4 - 3.5) (2.0 - 6.0) (1.3 - 3.0)5.5 5.7 6.3 6.1 5.7 6.4
(2.9 - 8.4) (2.1 - 11.7) (2.1 - 12.8) (1.0 - 20.2) (1.3 - 29.7) (2.6 - 19.0)7.1 7.9 8.6 7.1 5.1 7.7
(4.1 - 11.0) (3.3 - 15.3) (2.1 - 17.0) (0.9 - 18.0) (1.7 - 12.4) (2.2 - 20.7)1.2 1.0 0.8 0.9 0.6 0.7
(0.1 - 2.7) (0.2 - 2.6) (0.2 - 1.6) (0.3 - 1.8) (0.1 - 1.2) (0.3 - 1.5)0.101 0.104 0.079 0.059 0.048 0.050
(0.024 - 0.210) (0.030 - 0.193) (0.032 - 0.143) (0.013 - 0.140) (0.022 - 0.107) (0.012 - 0.120)0.003 0.003 0.003 0.002 0.002 0.002
(<0.001 - 0.006) (<0.001 - 0.008) (<0.001 - 0.005) (<0.001 - 0.004) (<0.001 - 0.004) (<0.001 - 0.003)0.035 0.032 0.022 0.022 0.019 0.019
(0.009 - 0.073) (0.006 - 0.075) (0.006 - 0.059) (0.006 - 0.055) (0.003 - 0.048) (0.004 - 0.039)0.227 0.185 0.149 0.147 0.115 0.231
(0.083 - 0.415) (0.038 - 0.397) (0.028 - 0.330) (0.016 - 0.363) (0.007 - 0.248) (0.010 - 1.220) 0.36 0.32 0.25 0.23 0.18 0.30
(0.13 - 0.60) (0.09 - 0.58) (0.08 - 0.43) (0.05 - 0.45) (0.05 - 0.32) (0.06 - 1.25)0.25 0.25 0.21 0.17 0.17 0.16
(0.17 - 0.35) (0.10 - 0.31) (0.11 - 0.29) (0.06 - 0.23) (0.10 - 0.29) (0.08 - 0.24)0.51 0.46 0.38 0.34 0.30 0.41
(0.26 - 0.75) (0.17 - 0.72) (0.22 - 0.58) (0.16 - 0.59) (0.16 - 0.46) (0.16 - 1.40)0.015 0.016 0.013 0.009 0.009 0.010
(<0.002 - 0.029) (0.002 - 0.029) (0.002 - 0.024) (<0.002 - 0.021) (0.005 - 0.022) (0.004 - 0.017)0.04 0.04 0.03 0.03 0.03 0.03
(0.03 - 0.05) (0.02 - 0.06) (0.02 - 0.04) (0.02 - 0.03) (<0.02 - 0.04) (0.02 - 0.05)1.01 1.05 0.90 0.87 0.77 0.86
(<0.05 - 2.00) (0.07 - 2.03) (0.16 - 1.67) (0.13 - 1.67) (0.05 - 1.47) (0.06 - 1.67)7.2 5.7 4.5 3.9 2.4 2.3
(0.5 - 25.0) (1.6 - 21.7) (0.7 - 18.7) (0.9 - 15.3) (0.5 - 5.8) (0.7 - 5.4)2 2 13 3 2 1
(<1 - 9) (<1 - 8) (<1 - 450) (<1 - 78) (<1 - 14) (<1 - 7)7 3 28 4 2 2
(1 - 28) (<1 - 16) (<1 - 820) (<1 - 110) (<1 - 28) (<1 - 10)
Note : 3. Data in brackets indicate the ranges.
Note : 1. Unless otherwise specified, data presented are depth-averaged (A) values calculated by taking the means of threeNote : 1. depths: Surface (S), Mid-depth (M), Bottom (B).
Note : 2. Data presented are annual arithmetic means of the depth-averaged results except for E. coli and faecal coliformsNote : 2. which are annual geometric means.
Lantau Island (East) Lantau Island (South)
Bottom
Bottom
Total Phosphorus (mg/L)
Silica (as SiO2) (mg/L)
pH
Total Kjeldahl Nitrogen (mg/L)
Total Nitrogen (mg/L)
Secchi Disc Depth (m)
Turbidity (NTU)
Suspended Solids (mg/L)
Faecal Coliforms (count/100mL)
E.coli (count/100mL)
Chlorophyll-a (µg/L)
5-day Biochemical Oxygen Demand (mg/L)
Orthophosphate Phosphorus (mg/L)
Total Inorganic Nitrogen (mg/L)
Unionised Ammonia (mg/L)
Nitrite Nitrogen (mg/L)
Nitrate Nitrogen (mg/L)
Ammonia Nitrogen (mg/L)
Temperature (℃)
Salinity
Dissolved Oxygen (mg/L)
Dissolved Oxygen (% Saturation)
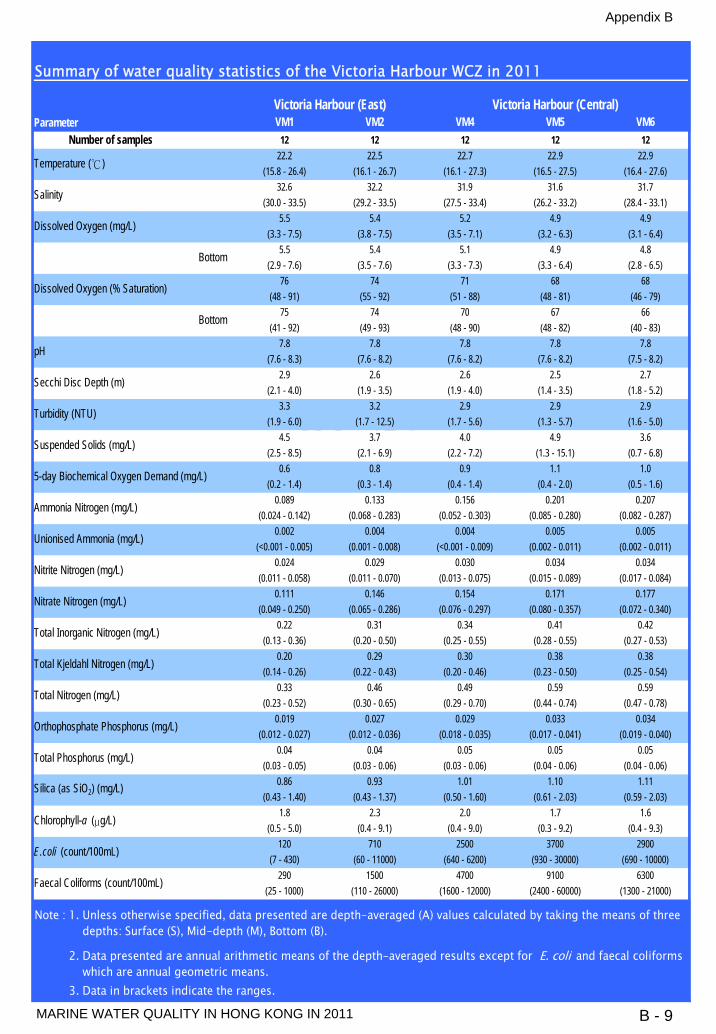
Appendix B
MARINE WATER QUALITY IN HONG KONG IN 2011 B - 9
22.3 x 17.4cm
Summary of water quality statistics of the Victoria Harbour WCZ in 2011
Parameter VM1 VM2 VM4 VM5 VM6Number of samples 12 12 12 12 12
22.2 22.5 22.7 22.9 22.9(15.8 - 26.4) (16.1 - 26.7) (16.1 - 27.3) (16.5 - 27.5) (16.4 - 27.6)
32.6 32.2 31.9 31.6 31.7(30.0 - 33.5) (29.2 - 33.5) (27.5 - 33.4) (26.2 - 33.2) (28.4 - 33.1)
5.5 5.4 5.2 4.9 4.9(3.3 - 7.5) (3.8 - 7.5) (3.5 - 7.1) (3.2 - 6.3) (3.1 - 6.4)
5.5 5.4 5.1 4.9 4.8(2.9 - 7.6) (3.5 - 7.6) (3.3 - 7.3) (3.3 - 6.4) (2.8 - 6.5)
76 74 71 68 68(48 - 91) (55 - 92) (51 - 88) (48 - 81) (46 - 79)
75 74 70 67 66(41 - 92) (49 - 93) (48 - 90) (48 - 82) (40 - 83)
7.8 7.8 7.8 7.8 7.8(7.6 - 8.3) (7.6 - 8.2) (7.6 - 8.2) (7.6 - 8.2) (7.5 - 8.2)
2.9 2.6 2.6 2.5 2.7(2.1 - 4.0) (1.9 - 3.5) (1.9 - 4.0) (1.4 - 3.5) (1.8 - 5.2)
3.3 3.2 2.9 2.9 2.9(1.9 - 6.0) (1.7 - 12.5) (1.7 - 5.6) (1.3 - 5.7) (1.6 - 5.0)
4.5 3.7 4.0 4.9 3.6(2.5 - 8.5) (2.1 - 6.9) (2.2 - 7.2) (1.3 - 15.1) (0.7 - 6.8)
0.6 0.8 0.9 1.1 1.0(0.2 - 1.4) (0.3 - 1.4) (0.4 - 1.4) (0.4 - 2.0) (0.5 - 1.6)
0.089 0.133 0.156 0.201 0.207(0.024 - 0.142) (0.068 - 0.283) (0.052 - 0.303) (0.085 - 0.280) (0.082 - 0.287)
0.002 0.004 0.004 0.005 0.005(<0.001 - 0.005) (0.001 - 0.008) (<0.001 - 0.009) (0.002 - 0.011) (0.002 - 0.011)
0.024 0.029 0.030 0.034 0.034(0.011 - 0.058) (0.011 - 0.070) (0.013 - 0.075) (0.015 - 0.089) (0.017 - 0.084)
0.111 0.146 0.154 0.171 0.177(0.049 - 0.250) (0.065 - 0.286) (0.076 - 0.297) (0.080 - 0.357) (0.072 - 0.340)
0.22 0.31 0.34 0.41 0.42(0.13 - 0.36) (0.20 - 0.50) (0.25 - 0.55) (0.28 - 0.55) (0.27 - 0.53)
0.20 0.29 0.30 0.38 0.38(0.14 - 0.26) (0.22 - 0.43) (0.20 - 0.46) (0.23 - 0.50) (0.25 - 0.54)
0.33 0.46 0.49 0.59 0.59(0.23 - 0.52) (0.30 - 0.65) (0.29 - 0.70) (0.44 - 0.74) (0.47 - 0.78)
0.019 0.027 0.029 0.033 0.034(0.012 - 0.027) (0.012 - 0.036) (0.018 - 0.035) (0.017 - 0.041) (0.019 - 0.040)
0.04 0.04 0.05 0.05 0.05(0.03 - 0.05) (0.03 - 0.06) (0.03 - 0.06) (0.04 - 0.06) (0.04 - 0.06)
0.86 0.93 1.01 1.10 1.11(0.43 - 1.40) (0.43 - 1.37) (0.50 - 1.60) (0.61 - 2.03) (0.59 - 2.03)
1.8 2.3 2.0 1.7 1.6(0.5 - 5.0) (0.4 - 9.1) (0.4 - 9.0) (0.3 - 9.2) (0.4 - 9.3)
120 710 2500 3700 2900(7 - 430) (60 - 11000) (640 - 6200) (930 - 30000) (690 - 10000)
290 1500 4700 9100 6300(25 - 1000) (110 - 26000) (1600 - 12000) (2400 - 60000) (1300 - 21000)
Note : 3. Data in brackets indicate the ranges.
Note : 1. Unless otherwise specified, data presented are depth-averaged (A) values calculated by taking the means of threeNote : 1. depths: Surface (S), Mid-depth (M), Bottom (B).
Note : 2. Data presented are annual arithmetic means of the depth-averaged results except for E. coli and faecal coliformsNote : 2. which are annual geometric means.
Victoria Harbour (East) Victoria Harbour (Central)
Bottom
Bottom
Total Phosphorus (mg/L)
Silica (as SiO2) (mg/L)
pH
Total Kjeldahl Nitrogen (mg/L)
Total Nitrogen (mg/L)
Secchi Disc Depth (m)
Turbidity (NTU)
Suspended Solids (mg/L)
Faecal Coliforms (count/100mL)
E.coli (count/100mL)
Chlorophyll-a (µg/L)
5-day Biochemical Oxygen Demand (mg/L)
Orthophosphate Phosphorus (mg/L)
Total Inorganic Nitrogen (mg/L)
Unionised Ammonia (mg/L)
Nitrite Nitrogen (mg/L)
Nitrate Nitrogen (mg/L)
Ammonia Nitrogen (mg/L)
Temperature (℃)
Salinity
Dissolved Oxygen (mg/L)
Dissolved Oxygen (% Saturation)

Appendix B
MARINE WATER QUALITY IN HONG KONG IN 2011 B - 10
22.3 x 17.4cm
Summary of water quality statistics of the Victoria Harbour WCZ in 2011 (continued)
Stonecutters IslandParameter VM7 VM8 VM15 VM12 VM14
Number of samples 12 12 12 12 1223.2 23.1 23.1 23.1 23.7
(15.0 - 26.7) (15.1 - 26.9) (16.5 - 28.0) (15.3 - 26.5) (15.4 - 28.6)31.7 31.8 31.3 31.7 30.0
(29.6 - 32.7) (29.1 - 32.8) (26.8 - 33.0) (30.2 - 32.8) (23.9 - 32.8)5.0 5.5 5.2 5.2 5.9
(3.2 - 6.6) (3.1 - 7.0) (3.9 - 6.8) (3.0 - 6.6) (3.2 - 8.4)4.7 5.4 4.9 5.0 5.8
(3.0 - 6.7) (2.7 - 7.0) (3.1 - 6.9) (2.9 - 6.6) (2.8 - 8.2)69 76 72 72 83
(46 - 85) (45 - 95) (58 - 84) (42 - 85) (46 - 126)65 74 68 69 80
(43 - 83) (38 - 86) (46 - 85) (42 - 82) (40 - 122)7.8 7.8 7.8 7.8 7.9
(7.5 - 8.1) (7.6 - 8.2) (7.5 - 8.2) (7.5 - 8.1) (7.6 - 8.3)2.7 2.5 2.4 2.1 2.1
(1.8 - 3.6) (1.7 - 3.0) (0.9 - 4.8) (1.6 - 2.9) (1.6 - 3.0)3.5 4.0 3.6 13.3 4.3
(1.7 - 7.6) (1.5 - 6.9) (1.3 - 8.5) (3.8 - 40.4) (2.1 - 10.1)4.4 5.2 4.8 16.4 6.2
(1.7 - 7.6) (2.3 - 10.1) (1.5 - 10.2) (5.4 - 47.6) (2.2 - 15.7)1.2 1.0 0.9 0.9 1.1
(0.2 - 2.2) (0.4 - 2.1) (0.4 - 1.6) (0.4 - 2.0) (0.5 - 2.4)0.251 0.185 0.222 0.176 0.126
(0.140 - 0.387) (0.053 - 0.433) (0.093 - 0.297) (0.059 - 0.307) (0.039 - 0.290)0.006 0.005 0.006 0.004 0.004
(0.002 - 0.010) (0.002 - 0.009) (0.002 - 0.011) (0.002 - 0.008) (0.001 - 0.006)0.043 0.047 0.038 0.050 0.075
(0.016 - 0.084) (0.011 - 0.095) (0.017 - 0.098) (0.012 - 0.120) (0.013 - 0.160)0.174 0.169 0.194 0.205 0.286
(0.103 - 0.367) (0.097 - 0.387) (0.079 - 0.427) (0.117 - 0.423) (0.120 - 0.773) 0.47 0.40 0.45 0.43 0.49
(0.29 - 0.62) (0.28 - 0.63) (0.28 - 0.62) (0.30 - 0.67) (0.29 - 1.00)0.44 0.32 0.38 0.32 0.27
(0.29 - 0.60) (0.17 - 0.59) (0.29 - 0.45) (0.18 - 0.53) (0.14 - 0.40)0.66 0.54 0.61 0.57 0.63
(0.45 - 0.89) (0.41 - 0.78) (0.46 - 0.82) (0.42 - 0.79) (0.37 - 1.29)0.035 0.026 0.034 0.027 0.024
(0.007 - 0.054) (0.003 - 0.037) (0.018 - 0.042) (0.008 - 0.042) (0.003 - 0.038)0.06 0.04 0.05 0.05 0.04
(0.04 - 0.08) (0.02 - 0.06) (0.05 - 0.06) (0.03 - 0.09) (0.03 - 0.06)1.09 1.05 1.17 1.13 1.32
(0.41 - 2.07) (0.35 - 1.93) (0.57 - 1.93) (0.36 - 2.03) (0.30 - 3.40)2.6 2.3 1.9 2.1 4.0
(0.3 - 15.7) (0.3 - 11.7) (0.4 - 9.8) (0.2 - 10.5) (0.4 - 21.0)1700 310 180 210 170
(230 - 12000) (14 - 2600) (10 - 2000) (91 - 520) (7 - 3700)4000 600 510 570 400
(480 - 32000) (26 - 5400) (23 - 4000) (170 - 2200) (26 - 9300)
Note : 3. Data in brackets indicate the ranges.
Note : 1. Unless otherwise specified, data presented are depth-averaged (A) values calculated by taking the means of threeNote : 1. depths: Surface (S), Mid-depth (M), Bottom (B).
Note : 2. Data presented are annual arithmetic means of the depth-averaged results except for E. coli and faecal coliformsNote : 2. which are annual geometric means.
Victoria Harbour (West) Rambler Channel
Temperature (℃)
Salinity
Faecal Coliforms (count/100mL)
E.coli (count/100mL)
Chlorophyll-a (µg/L)
5-day Biochemical Oxygen Demand (mg/L)
Total Phosphorus (mg/L)
Silica (as SiO2) (mg/L)
Bottom
Bottom
Total Nitrogen (mg/L)
Orthophosphate Phosphorus (mg/L)
Total Inorganic Nitrogen (mg/L)
Unionised Ammonia (mg/L)
Nitrite Nitrogen (mg/L)
Dissolved Oxygen (mg/L)
Dissolved Oxygen (% Saturation)
pH
Total Kjeldahl Nitrogen (mg/L)
Secchi Disc Depth (m)
Turbidity (NTU)
Suspended Solids (mg/L)
Nitrate Nitrogen (mg/L)
Ammonia Nitrogen (mg/L)

Appendix B
MARINE WATER QUALITY IN HONG KONG IN 2011 B - 11
22.3 x 17.4cm
Summary of water quality statistics for the Eastern Buffer WCZ in 2011
Chai WanParameter EM1 EM2 EM3
Number of samples 12 12 1222.8 22.9 22.8
(15.4 - 29.2) (15.4 - 29.0) (15.3 - 28.9)32.6 32.7 32.9
(31.7 - 33.9) (31.7 - 33.9) (31.6 - 33.9)6.0 6.3 6.5
(3.9 - 8.0) (4.3 - 8.1) (4.1 - 8.2)5.8 5.8 6.0
(3.1 - 7.9) (3.1 - 8.0) (3.5 - 8.1)84 88 90
(56 - 98) (62 - 98) (59 - 101)80 80 83
(43 - 96) (44 - 96) (48 - 99)7.9 7.9 7.9
(7.7 - 8.1) (7.7 - 8.1) (7.8 - 8.2)2.5 2.6 2.9
(1.2 - 4.0) (1.6 - 4.0) (1.2 - 5.0)3.3 4.0 3.9
(1.4 - 8.3) (1.1 - 7.7) (1.5 - 8.3)3.5 4.3 4.0
(1.5 - 6.5) (1.5 - 10.2) (1.2 - 10.5)0.8 0.8 0.9
(0.2 - 1.4) (0.1 - 2.3) (0.2 - 2.8)0.068 0.055 0.040
(0.016 - 0.133) (0.013 - 0.115) (0.006 - 0.081)0.002 0.002 0.001
(<0.001 - 0.007) (<0.001 - 0.005) (<0.001 - 0.003)0.020 0.018 0.014
(0.003 - 0.042) (0.004 - 0.040) (0.002 - 0.036)0.124 0.111 0.065
(0.018 - 0.395) (0.017 - 0.422) (0.005 - 0.190) 0.21 0.18 0.12
(0.10 - 0.45) (0.09 - 0.47) (0.04 - 0.21)0.17 0.16 0.14
(0.09 - 0.26) (0.08 - 0.25) (0.09 - 0.22)0.32 0.29 0.22
(0.15 - 0.53) (0.16 - 0.56) (0.12 - 0.31)0.015 0.012 0.010
(0.007 - 0.023) (0.005 - 0.019) (0.002 - 0.017)0.03 0.03 0.03
(<0.02 - 0.05) (<0.02 - 0.04) (<0.02 - 0.04)0.81 0.76 0.69
(0.19 - 1.33) (0.19 - 1.17) (0.21 - 1.30)2.3 2.6 2.2
(0.2 - 8.6) (0.4 - 8.8) (0.4 - 8.5)36 12 2
(1 - 1300) (1 - 750) (<1 - 31)82 30 4
(2 - 3100) (1 - 1600) (1 - 87)
Note : 3. Data in brackets indicate the ranges.
Note : 1. Unless otherwise specified, data presented are depth-averaged (A) values calculated by taking the means of threeNote : 1. depths: Surface (S), Mid-depth (M), Bottom (B).
Note : 2. Data presented are annual arithmetic means of the depth-averaged results except for E. coli and faecal coliformsNote : 2. which are annual geometric means.
pH
Total Kjeldahl Nitrogen (mg/L)
Total Nitrogen (mg/L)
Secchi Disc Depth (m)
Turbidity (NTU)
Faecal Coliforms (count/100mL)
E.coli (count/100mL)
Chlorophyll-a (µg/L)
5-day Biochemical Oxygen Demand (mg/L)
Orthophosphate Phosphorus (mg/L)
Total Inorganic Nitrogen (mg/L)
Unionised Ammonia (mg/L)
Nitrite Nitrogen (mg/L)
Nitrate Nitrogen (mg/L)
Ammonia Nitrogen (mg/L)
Silica (as SiO2) (mg/L)
Tathong Channel
Temperature (℃)
Salinity
Dissolved Oxygen (mg/L)
Suspended Solids (mg/L)
Bottom
Bottom
Total Phosphorus (mg/L)
Dissolved Oxygen (% Saturation)
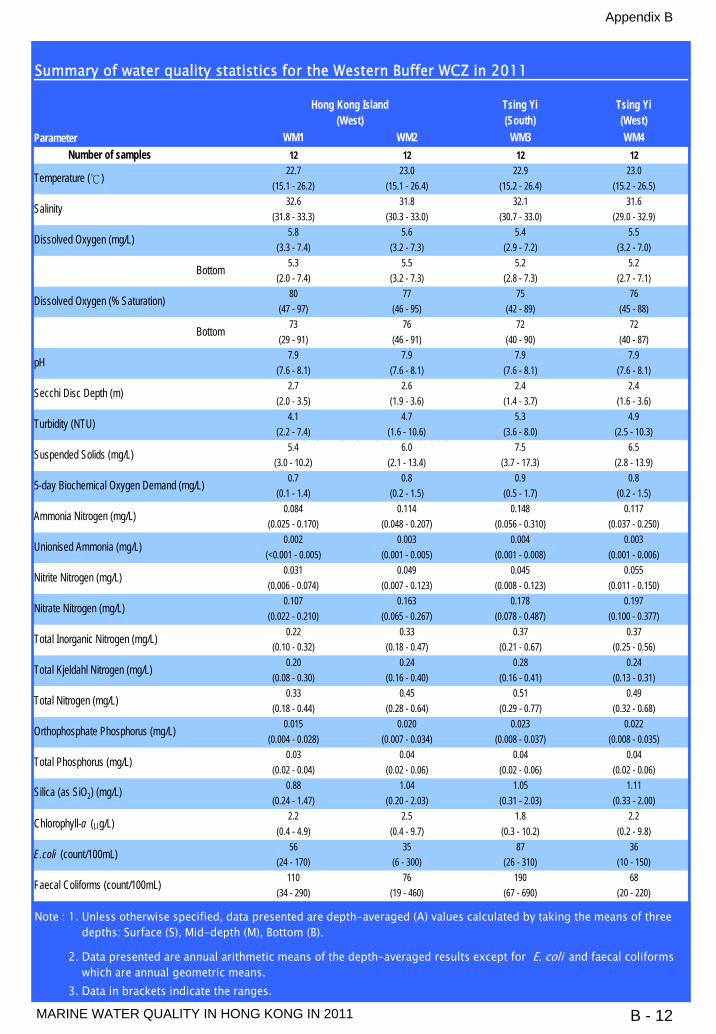
Appendix B
MARINE WATER QUALITY IN HONG KONG IN 2011 B - 12
22.3 x 17.4cm
Summary of water quality statistics for the Western Buffer WCZ in 2011
Parameter WM1 WM2 WM3 WM4Number of samples 12 12 12 12
22.7 23.0 22.9 23.0(15.1 - 26.2) (15.1 - 26.4) (15.2 - 26.4) (15.2 - 26.5)
32.6 31.8 32.1 31.6(31.8 - 33.3) (30.3 - 33.0) (30.7 - 33.0) (29.0 - 32.9)
5.8 5.6 5.4 5.5(3.3 - 7.4) (3.2 - 7.3) (2.9 - 7.2) (3.2 - 7.0)
5.3 5.5 5.2 5.2(2.0 - 7.4) (3.2 - 7.3) (2.8 - 7.3) (2.7 - 7.1)
80 77 75 76(47 - 97) (46 - 95) (42 - 89) (45 - 88)
73 76 72 72(29 - 91) (46 - 91) (40 - 90) (40 - 87)
7.9 7.9 7.9 7.9(7.6 - 8.1) (7.6 - 8.1) (7.6 - 8.1) (7.6 - 8.1)
2.7 2.6 2.4 2.4(2.0 - 3.5) (1.9 - 3.6) (1.4 - 3.7) (1.6 - 3.6)
4.1 4.7 5.3 4.9(2.2 - 7.4) (1.6 - 10.6) (3.6 - 8.0) (2.5 - 10.3)
5.4 6.0 7.5 6.5(3.0 - 10.2) (2.1 - 13.4) (3.7 - 17.3) (2.8 - 13.9)
0.7 0.8 0.9 0.8(0.1 - 1.4) (0.2 - 1.5) (0.5 - 1.7) (0.2 - 1.5)
0.084 0.114 0.148 0.117(0.025 - 0.170) (0.048 - 0.207) (0.056 - 0.310) (0.037 - 0.250)
0.002 0.003 0.004 0.003(<0.001 - 0.005) (0.001 - 0.005) (0.001 - 0.008) (0.001 - 0.006)
0.031 0.049 0.045 0.055(0.006 - 0.074) (0.007 - 0.123) (0.008 - 0.123) (0.011 - 0.150)
0.107 0.163 0.178 0.197(0.022 - 0.210) (0.065 - 0.267) (0.078 - 0.487) (0.100 - 0.377)
0.22 0.33 0.37 0.37(0.10 - 0.32) (0.18 - 0.47) (0.21 - 0.67) (0.25 - 0.56)
0.20 0.24 0.28 0.24(0.08 - 0.30) (0.16 - 0.40) (0.16 - 0.41) (0.13 - 0.31)
0.33 0.45 0.51 0.49(0.18 - 0.44) (0.28 - 0.64) (0.29 - 0.77) (0.32 - 0.68)
0.015 0.020 0.023 0.022(0.004 - 0.028) (0.007 - 0.034) (0.008 - 0.037) (0.008 - 0.035)
0.03 0.04 0.04 0.04(0.02 - 0.04) (0.02 - 0.06) (0.02 - 0.06) (0.02 - 0.06)
0.88 1.04 1.05 1.11(0.24 - 1.47) (0.20 - 2.03) (0.31 - 2.03) (0.33 - 2.00)
2.2 2.5 1.8 2.2(0.4 - 4.9) (0.4 - 9.7) (0.3 - 10.2) (0.2 - 9.8)
56 35 87 36(24 - 170) (6 - 300) (26 - 310) (10 - 150)
110 76 190 68(34 - 290) (19 - 460) (67 - 690) (20 - 220)
Note : 3. Data in brackets indicate the ranges.
Note : 1. Unless otherwise specified, data presented are depth-averaged (A) values calculated by taking the means of threeNote : 1. depths: Surface (S), Mid-depth (M), Bottom (B).
Note : 2. Data presented are annual arithmetic means of the depth-averaged results except for E. coli and faecal coliformsNote : 2. which are annual geometric means.
Tsing Yi(West)
Tsing Yi(South)
Hong Kong Island(West)
Temperature (℃)
Faecal Coliforms (count/100mL)
E.coli (count/100mL)
Chlorophyll-a (µg/L)
5-day Biochemical Oxygen Demand (mg/L)
Orthophosphate Phosphorus (mg/L)
Total Inorganic Nitrogen (mg/L)
Unionised Ammonia (mg/L)
Ammonia Nitrogen (mg/L)
Nitrate Nitrogen (mg/L)
Total Phosphorus (mg/L)
Silica (as SiO2) (mg/L)
Bottom
Bottom
Total Kjeldahl Nitrogen (mg/L)
Total Nitrogen (mg/L)
Secchi Disc Depth (m)
Turbidity (NTU)
Suspended Solids (mg/L)
Nitrite Nitrogen (mg/L)
Salinity
Dissolved Oxygen (mg/L)
Dissolved Oxygen (% Saturation)
pH
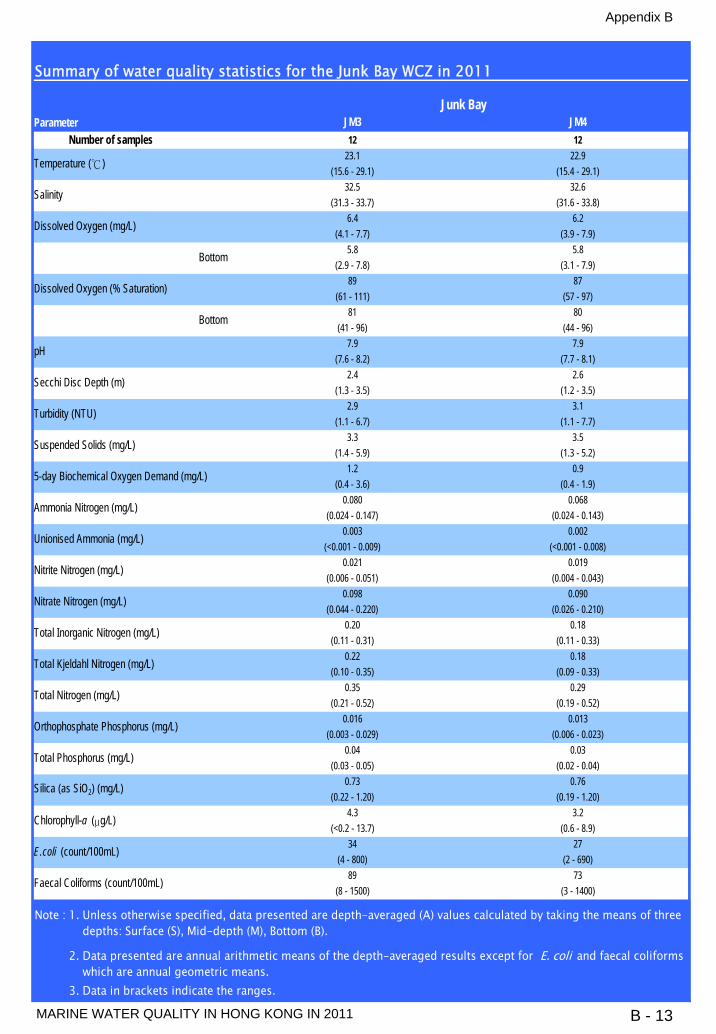
MARINE WATER QUALITY IN HONG KONG IN 2011 B - 13
Appendix B
Summary of water quality statistics for the Junk Bay WCZ in 2011
Parameter JM3 JM4Number of samples 12 12
23.1 22.9(15.6 - 29.1) (15.4 - 29.1)
32.5 32.6(31.3 - 33.7) (31.6 - 33.8)
6.4 6.2(4.1 - 7.7) (3.9 - 7.9)
5.8 5.8(2.9 - 7.8) (3.1 - 7.9)
89 87(61 - 111) (57 - 97)
81 80(41 - 96) (44 - 96)
7.9 7.9(7.6 - 8.2) (7.7 - 8.1)
2.4 2.6(1.3 - 3.5) (1.2 - 3.5)
2.9 3.1(1.1 - 6.7) (1.1 - 7.7)
3.3 3.5(1.4 - 5.9) (1.3 - 5.2)
1.2 0.9(0.4 - 3.6) (0.4 - 1.9)
0.080 0.068(0.024 - 0.147) (0.024 - 0.143)
0.003 0.002(<0.001 - 0.009) (<0.001 - 0.008)
0.021 0.019(0.006 - 0.051) (0.004 - 0.043)
0.098 0.090(0.044 - 0.220) (0.026 - 0.210)
0.20 0.18(0.11 - 0.31) (0.11 - 0.33)
0.22 0.18(0.10 - 0.35) (0.09 - 0.33)
0.35 0.29(0.21 - 0.52) (0.19 - 0.52)
0.016 0.013(0.003 - 0.029) (0.006 - 0.023)
0.04 0.03(0.03 - 0.05) (0.02 - 0.04)
0.73 0.76(0.22 - 1.20) (0.19 - 1.20)
4.3 3.2(<0.2 - 13.7) (0.6 - 8.9)
34 27(4 - 800) (2 - 690)
89 73(8 - 1500) (3 - 1400)
Note : 3. Data in brackets indicate the ranges.
Note : 2. Data presented are annual arithmetic means of the depth-averaged results except for E. coli and faecal coliformsNote : 2. which are annual geometric means.
Junk Bay
Temperature (℃)
Faecal Coliforms (count/100mL)
E.coli (count/100mL)
Chlorophyll-a (µg/L)
5-day Biochemical Oxygen Demand (mg/L)
Orthophosphate Phosphorus (mg/L)
Total Inorganic Nitrogen (mg/L)
Ammonia Nitrogen (mg/L)
Total Phosphorus (mg/L)
Silica (as SiO2) (mg/L)
Note : 1. Unless otherwise specified, data presented are depth-averaged (A) values calculated by taking the means of threeNote : 1. depths: Surface (S), Mid-depth (M), Bottom (B).
Bottom
Bottom
Total Kjeldahl Nitrogen (mg/L)
Total Nitrogen (mg/L)
Secchi Disc Depth (m)
Turbidity (NTU)
Suspended Solids (mg/L)
Nitrite Nitrogen (mg/L)
Nitrate Nitrogen (mg/L)
Unionised Ammonia (mg/L)
Salinity
Dissolved Oxygen (mg/L)
Dissolved Oxygen (% Saturation)
pH

Appendix B
MARINE WATER QUALITY IN HONG KONG IN 2011 B - 14
22.3 x 17.4cm
Summary of water quality statistics for the Deep Bay WCZ in 2011
Parameter DM1 DM2 DM3 DM4 DM5Number of samples 12 12 12 12 12
24.0 24.1 23.9 23.8 23.8(14.5 - 31.1) (14.4 - 31.1) (15.1 - 30.6) (16.4 - 29.8) (16.3 - 29.4)
16.9 19.0 23.6 24.9 27.6(6.0 - 22.0) (6.4 - 26.7) (9.1 - 29.3) (10.3 - 31.2) (12.6 - 32.8)
4.8 5.4 6.8 6.3 6.1(2.6 - 9.3) (3.3 - 9.2) (4.1 - 12.5) (4.0 - 10.8) (4.2 - 10.5)
6.3 6.0(3.9 - 11.1) (4.0 - 10.5)
61 71 90 85 83(37 - 108) (48 - 108) (59 - 157) (60 - 132) (63 - 129)
84 82(59 - 135) (60 - 129)
7.3 7.5 7.7 7.7 7.8(7.0 - 7.9) (7.2 - 8.1) (7.4 - 8.5) (7.5 - 8.1) (7.6 - 8.1)
0.7 0.8 0.9 1.0 1.2(0.5 - 1.0) (0.4 - 1.5) (0.5 - 1.5) (0.5 - 1.5) (0.5 - 2.0)
22.9 16.0 12.5 10.5 10.6(10.8 - 50.7) (3.8 - 31.3) (2.8 - 22.3) (4.2 - 27.3) (4.6 - 30.3)
26.7 16.2 10.6 9.0 10.5(13.0 - 46.0) (4.9 - 32.0) (2.8 - 19.0) (4.0 - 20.5) (3.6 - 28.3)
2.6 2.1 2.1 0.8 0.9(1.0 - 4.4) (0.7 - 4.8) (<0.1 - 8.0) (<0.1 - 1.3) (0.1 - 2.1)
2.520 1.640 0.438 0.239 0.153(1.000 - 7.600) (0.260 - 3.300) (0.079 - 1.400) (0.073 - 0.375) (0.005 - 0.283)
0.024 0.024 0.009 0.005 0.004(0.011 - 0.043) (0.007 - 0.059) (0.002 - 0.018) (0.002 - 0.010) (<0.001 - 0.010)
0.348 0.308 0.187 0.157 0.106(0.140 - 0.510) (0.140 - 0.520) (0.066 - 0.450) (0.042 - 0.425) (0.024 - 0.357)
0.735 0.734 1.010 0.658 0.503(0.390 - 2.000) (0.420 - 2.200) (0.300 - 4.300) (0.320 - 1.750) (0.120 - 1.670)
3.60 2.68 1.63 1.05 0.76(1.53 - 8.32) (1.21 - 4.23) (0.46 - 5.06) (0.48 - 2.25) (0.29 - 2.03)
3.13 2.14 0.79 0.44 0.33(1.60 - 8.30) (0.58 - 3.60) (0.37 - 1.90) (0.32 - 0.59) (0.20 - 0.46)
4.22 3.18 1.99 1.26 0.94(2.13 - 9.02) (1.53 - 4.73) (1.02 - 5.28) (0.71 - 2.49) (0.40 - 2.31)
0.276 0.227 0.080 0.045 0.030(0.180 - 0.370) (0.085 - 0.350) (0.003 - 0.150) (0.006 - 0.068) (0.003 - 0.046)
0.38 0.29 0.13 0.07 0.06(0.31 - 0.56) (0.14 - 0.41) (0.09 - 0.18) (0.05 - 0.09) (0.03 - 0.09)
5.09 4.08 2.32 2.09 1.70(1.50 - 8.60) (0.18 - 6.20) (<0.05 - 4.60) (0.50 - 4.55) (0.06 - 4.50)
8.3 8.6 7.6 2.9 2.3(0.4 - 31.0) (0.7 - 46.0) (0.8 - 36.0) (0.8 - 11.5) (0.7 - 8.5)
1000 270 19 63 210(60 - 33000) (5 - 4700) (1 - 390) (5 - 590) (35 - 920)
1900 590 54 120 430(140 - 51000) (35 - 9100) (5 - 1100) (5 - 1100) (72 - 1800)
Note : 3. Data in brackets indicate the ranges.Note : 4. NM - not measured.
Note : 1. Unless otherwise specified, data presented are depth-averaged (A) values calculated by taking the means of threeNote : 1. depths: Surface (S), Mid-depth (M), Bottom (B).
Note : 2. Data presented are annual arithmetic means of the depth-averaged results except for E. coli and faecal coliformsNote : 2. which are annual geometric means.
Nitrate Nitrogen (mg/L)
Salinity
Dissolved Oxygen (mg/L)
Dissolved Oxygen (% Saturation)
pH
Ammonia Nitrogen (mg/L)
Total Phosphorus (mg/L)
Silica (as SiO2) (mg/L)
Bottom
Bottom
Total Kjeldahl Nitrogen (mg/L)
Total Nitrogen (mg/L)
Secchi Disc Depth (m)
Turbidity (NTU)
Suspended Solids (mg/L)
Nitrite Nitrogen (mg/L)
Outer Deep BayInner Deep Bay
Temperature (℃)
Faecal Coliforms (count/100mL)
E.coli (count/100mL)
Chlorophyll-a (µg/L)
5-day Biochemical Oxygen Demand (mg/L)
Orthophosphate Phosphorus (mg/L)
Total Inorganic Nitrogen (mg/L)
Unionised Ammonia (mg/L)
NM NM NM
NM NM NM

Appendix B
MARINE WATER QUALITY IN HONG KONG IN 2011 B - 15
22.3 x 17.4cm
Summary of water quality statistics for the North Western WCZ in 2011
Lantau Island Pearl Island Pillar Point Urmston Road(North) (North) (West)
Parameter NM1 NM2 NM3 NM5 NM6 NM8Number of samples 12 12 12 12 12 12
22.5 22.9 23.0 23.1 22.9 22.6(15.4 - 28.0) (15.5 - 28.2) (15.5 - 28.1) (15.6 - 28.5) (14.7 - 29.2) (14.8 - 27.9)
31.0 29.8 29.3 28.6 28.6 30.0(27.2 - 33.0) (23.3 - 33.0) (22.7 - 33.0) (20.4 - 33.0) (19.9 - 33.1) (22.2 - 33.3)
5.7 5.8 6.0 5.9 6.4 6.4(2.9 - 7.2) (3.2 - 7.2) (3.2 - 7.7) (3.3 - 7.7) (3.2 - 8.6) (3.3 - 7.5)
5.5 5.5 5.7 5.7 6.1 5.9(2.5 - 7.1) (2.8 - 7.0) (2.8 - 7.4) (2.7 - 7.3) (2.9 - 7.5) (2.6 - 7.5)
78 80 82 81 87 87(41 - 100) (46 - 103) (46 - 102) (47 - 103) (46 - 127) (47 - 111)
75 75 78 77 83 80(35 - 98) (40 - 99) (39 - 100) (39 - 103) (42 - 104) (37 - 109)
7.8 7.8 7.9 7.8 7.9 7.9(7.6 - 8.2) (7.6 - 8.2) (7.6 - 8.2) (7.6 - 8.2) (7.6 - 8.3) (7.6 - 8.3)
2.4 2.3 2.1 1.9 1.8 1.9(1.7 - 4.0) (1.8 - 3.7) (1.5 - 3.0) (1.5 - 2.2) (1.3 - 2.8) (1.0 - 3.0)
6.3 4.2 6.0 7.6 8.4 10.9(1.5 - 16.8) (1.3 - 8.0) (1.4 - 11.6) (2.0 - 10.9) (3.6 - 17.2) (4.1 - 21.1)
8.1 5.9 6.8 9.8 11.2 13.9(2.8 - 19.5) (2.2 - 13.8) (2.5 - 14.3) (3.9 - 16.3) (4.8 - 27.7) (2.7 - 30.7)
0.5 0.6 0.6 0.6 1.0 1.0(0.2 - 1.1) (0.2 - 1.2) (0.3 - 1.5) (0.3 - 1.0) (0.2 - 6.1) (0.2 - 4.0)
0.114 0.119 0.116 0.126 0.078 0.053(0.039 - 0.250) (0.039 - 0.250) (0.048 - 0.247) (0.047 - 0.270) (0.020 - 0.173) (0.009 - 0.173)
0.003 0.004 0.003 0.004 0.003 0.002(0.001 - 0.014) (0.001 - 0.016) (0.001 - 0.012) (0.001 - 0.011) (<0.001 - 0.007) (<0.001 - 0.006)
0.047 0.065 0.074 0.090 0.081 0.054(0.011 - 0.084) (0.011 - 0.143) (0.012 - 0.187) (0.013 - 0.233) (0.009 - 0.237) (0.008 - 0.143)
0.227 0.324 0.351 0.406 0.392 0.294(0.065 - 0.487) (0.062 - 1.010) (0.058 - 0.870) (0.055 - 1.090) (0.043 - 1.110) (0.026 - 1.040)
0.39 0.51 0.54 0.62 0.55 0.40(0.26 - 0.68) (0.27 - 1.28) (0.22 - 1.10) (0.20 - 1.37) (0.14 - 1.37) (0.07 - 1.27)
0.23 0.25 0.25 0.27 0.28 0.22(0.14 - 0.34) (0.16 - 0.36) (0.16 - 0.35) (0.19 - 0.41) (0.13 - 0.99) (0.11 - 0.68)
0.51 0.64 0.68 0.77 0.75 0.57(0.34 - 0.80) (0.33 - 1.46) (0.31 - 1.37) (0.31 - 1.68) (0.25 - 1.77) (0.20 - 1.45)
0.022 0.025 0.025 0.026 0.022 0.015(0.016 - 0.028) (0.015 - 0.033) (0.012 - 0.035) (0.013 - 0.039) (0.006 - 0.041) (0.006 - 0.025)
0.04 0.04 0.05 0.05 0.05 0.04(0.04 - 0.05) (0.04 - 0.06) (0.03 - 0.08) (0.04 - 0.07) (0.03 - 0.15) (0.02 - 0.08)
1.17 1.37 1.39 1.55 1.67 1.41(0.18 - 2.17) (0.19 - 2.70) (0.21 - 2.97) (0.25 - 3.27) (0.23 - 3.33) (0.11 - 2.97)
1.9 2.4 3.4 2.5 6.6 5.4(0.3 - 6.2) (0.5 - 8.0) (0.6 - 11.1) (0.4 - 9.9) (0.9 - 48.0) (0.5 - 37.2)
42 55 100 500 19 2(10 - 140) (5 - 830) (16 - 810) (130 - 1600) (2 - 130) (1 - 15)
86 110 220 1100 39 5(11 - 380) (7 - 2500) (36 - 2200) (190 - 3400) (3 - 210) (1 - 56)
Note : 3. Data in brackets indicate the ranges.
Note : 1. Unless otherwise specified, data presented are depth-averaged (A) values calculated by taking the means of threeNote : 1. depths: Surface (S), Mid-depth (M), Bottom (B).
Note : 2. Data presented are annual arithmetic means of the depth-averaged results except for E. coli and faecal coliformsNote : 2. which are annual geometric means.
Chek Lap Kok
Bottom
Bottom
Total Phosphorus (mg/L)
Temperature (℃)
Salinity
Dissolved Oxygen (mg/L)
Dissolved Oxygen (% Saturation)
Silica (as SiO2) (mg/L)
pH
Total Kjeldahl Nitrogen (mg/L)
Total Nitrogen (mg/L)
Secchi Disc Depth (m)
Turbidity (NTU)
Suspended Solids (mg/L)
Faecal Coliforms (count/100mL)
E.coli (count/100mL)
Chlorophyll-a (µg/L)
5-day Biochemical Oxygen Demand (mg/L)
Orthophosphate Phosphorus (mg/L)
Total Inorganic Nitrogen (mg/L)
Unionised Ammonia (mg/L)
Nitrite Nitrogen (mg/L)
Nitrate Nitrogen (mg/L)
Ammonia Nitrogen (mg/L)
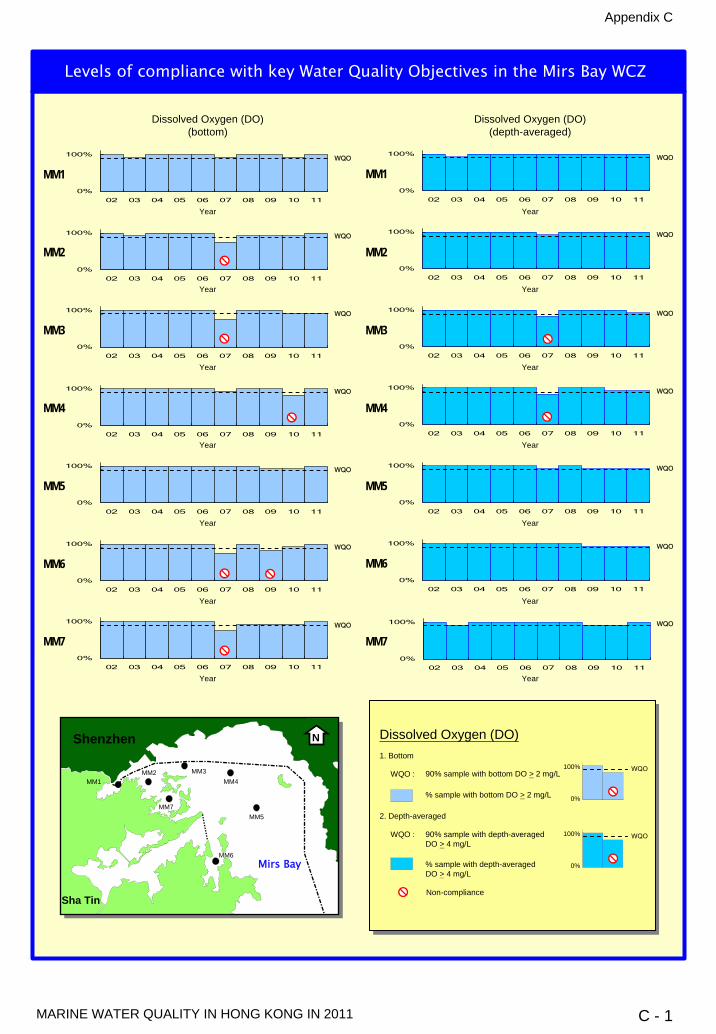
Appendix C
MARINE WATER QUALITY IN HONG KONG IN 2011 C - 1
Dissolved Oxygen (DO)(bottom)
Dissolved Oxygen (DO)(depth-averaged)
0%
100%
02 03 04 05 06 07 08 09 10 11
MM1WQO
Year
0%
100%
02 03 04 05 06 07 08 09 10 11
MM1WQO
Year
0%
100%
02 03 04 05 06 07 08 09 10 11
MM2WQO
Year
0%
100%
02 03 04 05 06 07 08 09 10 11
MM2WQO
Year
0%
100%
02 03 04 05 06 07 08 09 10 11
MM5WQO
Year
0%
100%
02 03 04 05 06 07 08 09 10 11
MM5WQO
Year
Non-compliance
Dissolved Oxygen (DO)
% sample with bottom DO > 2 mg/L
90% sample with bottom DO > 2 mg/LWQO :
2. Depth-averaged
1. Bottom
90% sample with depth-averagedDO > 4 mg/L
WQO :
% sample with depth-averagedDO > 4 mg/L
N
MM1MM2 MM3
MM4
MM7MM5
Sha Tin
Shenzhen
0%
100%
02 03 04 05 06 07 08 09 10 11
MM3WQO
Year
0%
100%
02 03 04 05 06 07 08 09 10 11
MM3WQO
Year
0%
100%
02 03 04 05 06 07 08 09 10 11
MM7WQO
Year
0%
100%
02 03 04 05 06 07 08 09 10 11
MM7WQO
Year
0%
100%
02 03 04 05 06 07 08 09 10 11
MM4WQO
Year
0%
100%
02 03 04 05 06 07 08 09 10 11
MM4
Year
WQO
0%
100%
02 03 04 05 06 07 08 09 10 11
0%
100%
02 03 04 05 06 07 08 09 10 11
MM6WQO
Year
MM6WQO
Year
MM6
WQO100%
0%
WQO100%
0%
Levels of compliance with key Water Quality Objectives in the Mirs Bay WCZ
Mirs Bay

Appendix C
MARINE WATER QUALITY IN HONG KONG IN 2011 C - 2
Dissolved Oxygen (DO)(bottom)
Dissolved Oxygen (DO)(depth-averaged)
0%
100%
02 03 04 05 06 07 08 09 10 11
MM8WQO
Year
0%
100%
02 03 04 05 06 07 08 09 10 11
MM8WQO
Year
0%
100%
02 03 04 05 06 07 08 09 10 11
MM13WQO
Year
0%
100%
02 03 04 05 06 07 08 09 10 11
MM13WQO
Year
0%
100%
02 03 04 05 06 07 08 09 10 11
MM17WQO
Year
0%
100%
02 03 04 05 06 07 08 09 10 11
MM17WQO
Year
0%
100%
02 03 04 05 06 07 08 09 10 11
MM14WQO
Year
0%
100%
02 03 04 05 06 07 08 09 10 11
MM14WQO
Year
0%
100%
02 03 04 05 06 07 08 09 10 11
MM15WQO
Year
0%
100%
02 03 04 05 06 07 08 09 10 11
MM15WQO
Year
0%
100%
02 03 04 05 06 07 08 09 10 11
MM16WQO
Year
0%
100%
02 03 04 05 06 07 08 09 10 11
MM16WQO
Year
0%
100%
02 03 04 05 06 07 08 09 10 110%
100%
02 03 04 05 06 07 08 09 10 11
MM19WQO
Year
MM19WQO
Year
Tai Po
Sai Kung
MM17
MM8
MM15
MM14
MM16
MM13
N
Non-compliance
Dissolved Oxygen (DO)
% sample with bottom DO > 2 mg/L
90% sample with bottom DO > 2 mg/LWQO :
2. Depth-averaged
1. Bottom
90% sample with depth-averagedDO > 4 mg/L
WQO :
% sample with depth-averagedDO > 4 mg/L
WQO
WQO
MM19
100%
0%
100%
0%
Levels of compliance with key Water Quality Objectives in the Mirs Bay WCZ(continued)
Mirs Bay
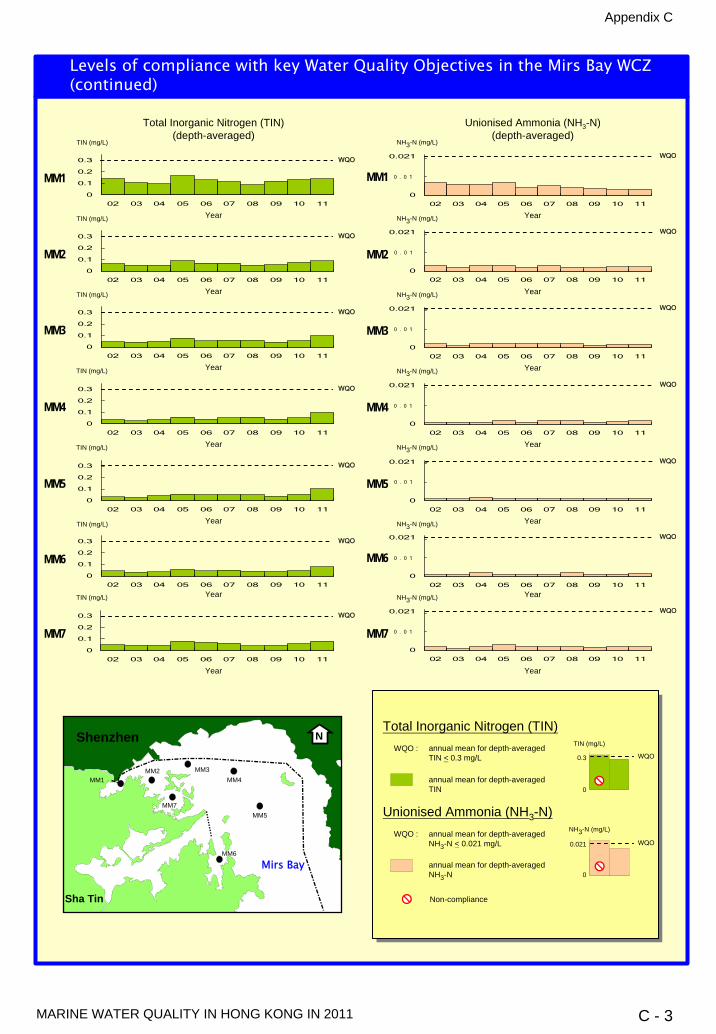
Appendix C
MARINE WATER QUALITY IN HONG KONG IN 2011 C - 3
Total Inorganic Nitrogen (TIN)(depth-averaged)
Unionised Ammonia (NH3-N)(depth-averaged)
N
MM1MM2 MM3
MM4
MM7MM5
Sha Tin
ShenzhenTotal Inorganic Nitrogen (TIN)
annual mean for depth-averagedTIN
annual mean for depth-averagedTIN < 0.3 mg/L
WQO :
annual mean for depth-averagedNH3-N < 0.021 mg/L
WQO :
Non-compliance
annual mean for depth-averagedNH3-N
Unionised Ammonia (NH3-N)
0
0.3 WQO
TIN (mg/L)
0
0.021 WQO
NH3-N (mg/L)
0
0.021
02 03 04 05 06 07 08 09 10 11
Year
NH3-N (mg/L)
WQO
MM10
0.1
0.2
0.3
02 03 04 05 06 07 08 09 10 11
MM1
Year
TIN (mg/L)
WQO
0
0.021
02 03 04 05 06 07 08 09 10 11
MM2
Year
NH3-N (mg/L)
WQO
0
0.1
0.2
0.3
02 03 04 05 06 07 08 09 10 11
MM2
Year
TIN (mg/L)
WQO
0
0.021
02 03 04 05 06 07 08 09 10 11
MM3
Year
NH3-N (mg/L)
WQO
0
0.1
0.2
0.3
02 03 04 05 06 07 08 09 10 11
MM3
Year
TIN (mg/L)
WQO
0
0.021
02 03 04 05 06 07 08 09 10 11
MM4
Year
NH3-N (mg/L)
WQO
0
0.1
0.2
0.3
02 03 04 05 06 07 08 09 10 11
MM4
Year
TIN (mg/L)
WQO
NH3-N (mg/L)
MM50
0.021
02 03 04 05 06 07 08 09 10 11
Year
WQO
0
0.1
0.2
0.3
02 03 04 05 06 07 08 09 10 11
MM5
Year
TIN (mg/L)
WQO
0
0.021
02 03 04 05 06 07 08 09 10 11
MM7
Year
NH3-N (mg/L)
WQO
0
0.1
0.2
0.3
02 03 04 05 06 07 08 09 10 11
MM7
Year
TIN (mg/L)
WQO
0
0.021
02 03 04 05 06 07 08 09 10 11
0
0.1
0.2
0.3
02 03 04 05 06 07 08 09 10 11
Year
NH3-N (mg/L)
WQO
MM6MM6
Year
TIN (mg/L)
WQO
MM6
0.3
0
0.021
0
0 . 0 1
0 . 0 1
0 . 0 1
0 . 0 1
0 . 0 1
0 . 0 1
0 . 0 1
Levels of compliance with key Water Quality Objectives in the Mirs Bay WCZ(continued)
Mirs Bay

Total Inorganic Nitrogen (TIN)(depth-averaged)
Unionised Ammonia (NH3-N)(depth-averaged)
0
0.021
02 03 04 05 06 07 08 09 10 11
0
0.1
0.2
0.3
02 03 04 05 06 07 08 09 10 11
Year
NH3-N (mg/L)WQO
MM19MM19
Year
TIN (mg/L)
WQO
0 . 0 1
Non-compliance
Total Inorganic Nitrogen (TIN)
annual mean for depth-averagedTIN
annual mean for depth-averagedTIN < 0.3 mg/L
WQO :
annual mean for depth-averagedNH3-N < 0.021 mg/L
WQO :
annual mean for depth-averagedNH3-N
Unionised Ammonia (NH3-N)
TIN (mg/L)
NH3-N (mg/L)
Tai Po MM17
MM8
MM15
MM14
MM16
MM13
N
MM19
Sai Kung
MM170
0.021
02 03 04 05 06 07 08 09 10 11
MM17
Year
NH3-N (mg/L)WQO
0
0.1
0.2
0.3
02 03 04 05 06 07 08 09 10 11
Year
TIN (mg/L)
WQO
0 . 0 1
0
0.1
0.2
0.3
02 03 04 05 06 07 08 09 10 11
0
0.021
02 03 04 05 06 07 08 09 10 11
MM16
Year
NH3-N (mg/L)WQO
MM16
Year
TIN (mg/L)
WQO
0 . 0 1
0
0.021
02 03 04 05 06 07 08 09 10 11
NH3-N (mg/L)
MM15
Year
WQO
0
0.1
0.2
0.3
02 03 04 05 06 07 08 09 10 11
MM15
Year
TIN (mg/L)
WQO
0 . 0 1
0
0.021
02 03 04 05 06 07 08 09 10 11
MM14
Year
NH3-N (mg/L)WQO
0
0.1
0.2
0.3
02 03 04 05 06 07 08 09 10 11
MM14
Year
TIN (mg/L)
WQO
0 . 0 1
0
0.021
02 03 04 05 06 07 08 09 10 11
MM13
Year
NH3-N (mg/L)WQO
0
0.1
0.2
0.3
02 03 04 05 06 07 08 09 10 11
MM13
Year
TIN (mg/L)
WQO
0 . 0 1
0
0.021
02 03 04 05 06 07 08 09 10 11
MM8
Year
NH3-N (mg/L)WQO
0
0.1
0.2
0.3
02 03 04 05 06 07 08 09 10 11
MM8
Year
TIN (mg/L)
WQO
0 . 0 1
Levels of compliance with key Water Quality Objectives in the Mirs Bay WCZ(continued)
Mirs Bay
Appendix C
MARINE WATER QUALITY IN HONG KONG IN 2011 C - 4
0
0.3 WQO0.3
0
0
0.021 WQO0.021
0
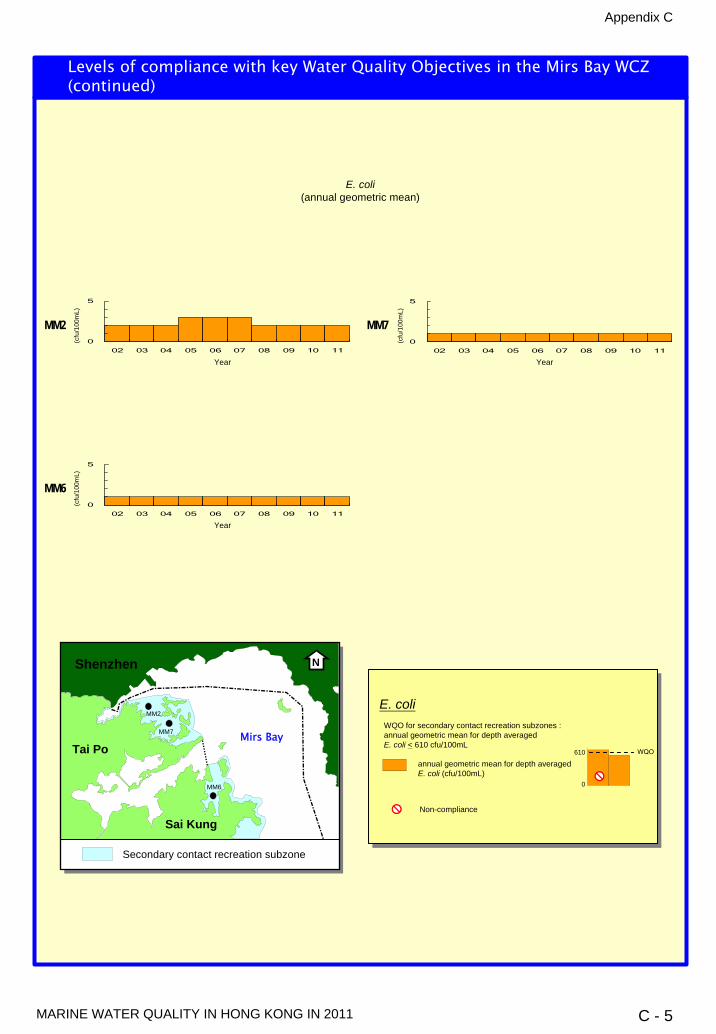
Appendix C
MARINE WATER QUALITY IN HONG KONG IN 2011 C - 5
N
MM2
MM7
MM6
Shenzhen
Secondary contact recreation subzone
Tai Po
Sai Kung
E. coli(annual geometric mean)
E. coli
annual geometric mean for depth averagedE. coli (cfu/100mL)
Non-compliance
0
610 WQO
0
5
02 03 04 05 06 07 08 09 10 11
MM7
Year
0
5
02 03 04 05 06 07 08 09 10 11
MM2
Year
(cfu
/100
mL)
(cfu
/100
mL)
0
5
02 03 04 05 06 07 08 09 10 11
MM6
Year
(cfu
/100
mL)
610
0
Levels of compliance with key Water Quality Objectives in the Mirs Bay WCZ(continued)
Mirs BayWQO for secondary contact recreation subzones :annual geometric mean for depth averagedE. coli < 610 cfu/100mL

Appendix C
MARINE WATER QUALITY IN HONG KONG IN 2011 C - 6
0%
100%
02 03 04 05 06 07 08 09 10 11
0%
100%
02 03 04 05 06 07 08 09 10 11
Dissolved Oxygen (DO)(bottom)
Dissolved Oxygen (DO)(depth-averaged)
0%
100%
02 03 04 05 06 07 08 09 10 11
PM1WQO
Year
0%
100%
02 03 04 05 06 07 08 09 10 11
PM1WQO
Year
PM2WQO
Year
0%
100%
02 03 04 05 06 07 08 09 10 11
PM3WQO
Year
0%
100%
02 03 04 05 06 07 08 09 10 11
PM4WQO
Year
WQO
PM9
Year
0%
100%
02 03 04 05 06 07 08 09 10 11
PM2WQO
Year
0%
100%
02 03 04 05 06 07 08 09 10 11
PM3WQO
Year
0%
100%
02 03 04 05 06 07 08 09 10 11
PM4WQO
Year
0%
100%
02 03 04 05 06 07 08 09 10 11
PM9WQO
Year
Dissolved Oxygen (DO)
% sample with bottom DO > 2 mg/L
90% sample with bottom DO > 2 mg/LWQO :
2. Depth-averaged
1. Bottom
90% sample with depth-averagedDO > 4 mg/L
WQO :
Non-compliance
% sample with depth-averagedDO > 4 mg/L
WQO
WQO100%
0%
100%
0%
Levels of compliance with key Water Quality Objectives in the Port Shelter WCZ
PM9
PM4PM1
PM3
Sai Kung
PM2 N
Port Shelter

Appendix C
MARINE WATER QUALITY IN HONG KONG IN 2011 C - 7
0%
100%
02 03 04 05 06 07 08 09 10 11
0%
100%
02 03 04 05 06 07 08 09 10 11
0%
100%
02 03 04 05 06 07 08 09 10 11
PM6WQO
Year
PM6WQO
Year
Dissolved Oxygen (DO)(bottom)
Dissolved Oxygen (DO)(depth-averaged)
0%
100%
02 03 04 05 06 07 08 09 10 11
PM8WQO
Year
0%
100%
02 03 04 05 06 07 08 09 10 11
PM8WQO
Year
Dissolved Oxygen (DO)
% sample with bottom DO > 2 mg/L
90% sample with bottom DO > 2 mg/LWQO :
2. Depth-averaged
1. Bottom
90% sample with depth-averagedDO > 4 mg/L
WQO :
Non-compliance
% sample with depth-averagedDO > 4 mg/L
WQO
0%
100%
02 03 04 05 06 07 08 09 10 11
PM11
Year
PM11WQO
Year
0%
100%
02 03 04 05 06 07 08 09 10 11
Year
0%
100%
02 03 04 05 06 07 08 09 10 11
Year
PM7WQO
PM7WQO
WQO100%
0%
WQO100%
0%
Levels of compliance with key Water Quality Objectives in the Port Shelter WCZ(continued)
PM11
PM8
PM7
PM6
Sai Kung
N
Port Shelter

Appendix C
MARINE WATER QUALITY IN HONG KONG IN 2011 C - 8
Levels of compliance with key Water Quality Objectives in the Port Shelter WCZ(continued)
Total Inorganic Nitrogen (TIN)(depth-averaged)
Unionised Ammonia (NH3-N)(depth-averaged)
Total Inorganic Nitrogen (TIN)
annual mean for depth-averagedTIN
annual mean for depth-averagedTIN < 0.1 mg/L
WQO :
annual mean for depth-averagedNH3-N < 0.021 mg/L
WQO :
Non-compliance
annual mean for depth-averagedNH3-N
Unionised Ammonia (NH3-N)
0
0.1 WQO
TIN (mg/L)
0
0.021 WQO
NH3-N (mg/L)
0
0.021
02 03 04 05 06 07 08 09 10 11
PM2
Year
NH3-N (mg/L)
WQO
PM30
0.021
02 03 04 05 06 07 08 09 10 11
Year
NH3-N (mg/L)
WQO
0
0.021
02 03 04 05 06 07 08 09 10 11
PM4
Year
NH3-N (mg/L)
WQO
NH3-N (mg/L)
PM90
0.021
02 03 04 05 06 07 08 09 10 11
Year
WQO
0
0.1
0.2
02 03 04 05 06 07 08 09 10 11
PM9
Year
TIN (mg/L)
WQO
0
0.1
0.2
02 03 04 05 06 07 08 09 10 11
PM4
Year
TIN (mg/L)
WQO
0
0.1
0.2
02 03 04 05 06 07 08 09 10 11
PM2
Year
TIN (mg/L)
WQO
0
0.021
02 03 04 05 06 07 08 09 10 11
Year
NH3-N (mg/L)
WQO
PM10
0.1
0.2
02 03 04 05 06 07 08 09 10 11
PM1
Year
TIN (mg/L)
WQO
0
0.1
0.2
02 03 04 05 06 07 08 09 10 11
PM3
Year
TIN (mg/L)
WQO
0.1
0
0.021
0
0 . 0 1
0 . 0 1
0 . 0 1
0 . 0 1
0 . 0 1
PM9
PM4PM1
PM3
Sai Kung
PM2 N
Port Shelter
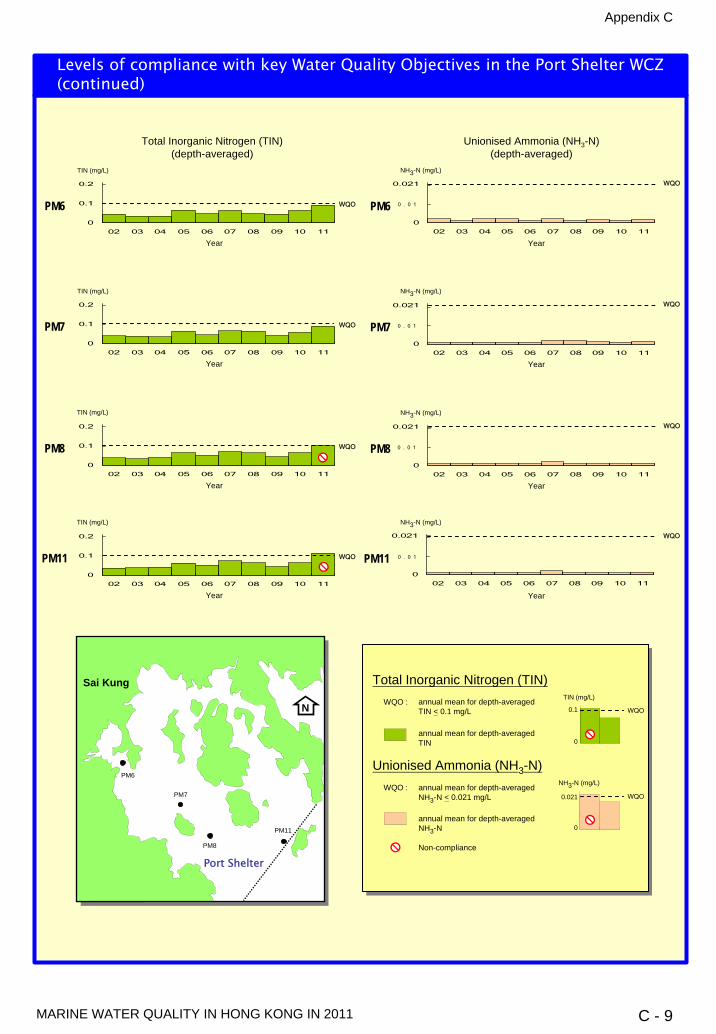
Appendix C
MARINE WATER QUALITY IN HONG KONG IN 2011 C - 9
0
0.021
02 03 04 05 06 07 08 09 10 11
PM6
Year
NH3-N (mg/L)
WQO
0
0.1
0.2
02 03 04 05 06 07 08 09 10 11
PM6
Year
TIN (mg/L)
WQO
Total Inorganic Nitrogen (TIN)(depth-averaged)
Unionised Ammonia (NH3-N)(depth-averaged)
NH3-N (mg/L)TIN (mg/L)
0
0.021
02 03 04 05 06 07 08 09 10 11
PM8
Year
WQO
0
0.1
0.2
02 03 04 05 06 07 08 09 10 11
PM8
Year
WQO
NH3-N (mg/L)TIN (mg/L)
NH3-N (mg/L)TIN (mg/L)
PM70
0.021
02 03 04 05 06 07 08 09 10 11
Year
WQO
0
0.1
0.2
02 03 04 05 06 07 08 09 10 11
PM7
Year
WQO
Total Inorganic Nitrogen (TIN)
annual mean for depth-averagedTIN
annual mean for depth-averagedTIN < 0.1 mg/L
WQO :
annual mean for depth-averagedNH3-N < 0.021 mg/L
WQO :
Non-compliance
annual mean for depth-averagedNH3-N
Unionised Ammonia (NH3-N)
0
0.1 WQO
TIN (mg/L)
0
0.021 WQO
NH3-N (mg/L)
PM110
0.021
02 03 04 05 06 07 08 09 10 11
Year
WQO
0
0.1
0.2
02 03 04 05 06 07 08 09 10 11
PM11
Year
WQO
0.1
0
0.021
0
0 . 0 1
0 . 0 1
0 . 0 1
0 . 0 1
Levels of compliance with key Water Quality Objectives in the Port Shelter WCZ(continued)
PM11
PM8
PM7
PM6
Sai Kung
N
Port Shelter

Appendix C
MARINE WATER QUALITY IN HONG KONG IN 2011 C - 10
E. coli(annual geometric mean)
0
5
10
02 03 04 05 06 07 08 09 10 11
PM2
Year
(cfu
/100
mL)
0
5
10
02 03 04 05 06 07 08 09 10 11
PM7
Year
(cfu
/100
mL)
0
5
10
02 03 04 05 06 07 08 09 10 11
PM3
Year
(cfu
/100
mL)
0
5
10
02 03 04 05 06 07 08 09 10 11
PM8
Year
(cfu
/100
mL)
0
5
10
02 03 04 05 06 07 08 09 10 11
PM4
Year
(cfu
/100
mL)
0
5
10
02 03 04 05 06 07 08 09 10 11
PM9
Year
(cfu
/100
mL)
0
5
10
02 03 04 05 06 07 08 09 10 11
PM1
Year
(cfu
/100
mL)
0
5
10
02 03 04 05 06 07 08 09 10 11
PM6
Year
(cfu
/100
mL)
E. coli
annual geometric mean for depth averagedE. coli (cfu/100mL)
Non-compliance
0
610 WQO
0
5
10
02 03 04 05 06 07 08 09 10 11
PM11
Year
(cfu
/100
mL)
PM11
PM8
PM7
PM6
Sai Kung
N
PM9
PM4PM1
PM3
PM2
Secondary contact recreation subzone
610
0
Levels of compliance with key Water Quality Objectives in the Port Shelter WCZ(continued)
Port Shelter
WQO for secondary contact recreation subzones :annual geometric mean for depth averagedE. coli < 610 cfu/100mL
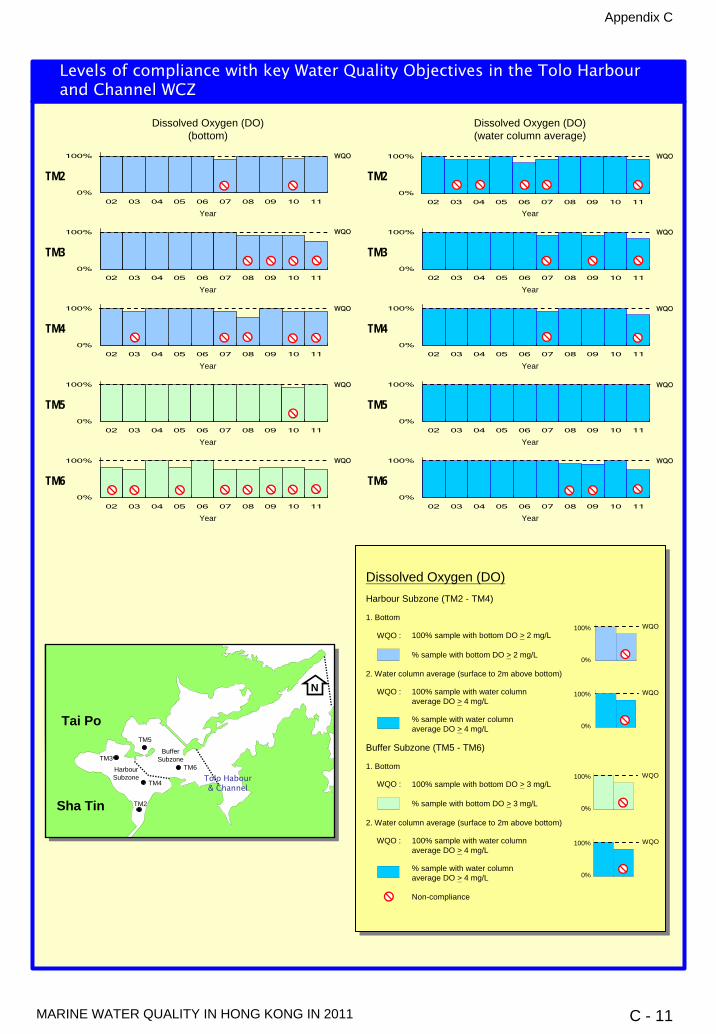
Appendix C
MARINE WATER QUALITY IN HONG KONG IN 2011 C - 11
Dissolved Oxygen (DO)(bottom)
BufferSubzone
HarbourSubzone
Sha Tin TM2
TM4
TM3
TM5
TM6
Tai Po
N
Dissolved Oxygen (DO)(water column average)
0%
100%
02 03 04 05 06 07 08 09 10 11
TM2
WQO
Year
0%
100%
02 03 04 05 06 07 08 09 10 11
TM2
WQO
Year
0%
100%
02 03 04 05 06 07 08 09 10 11
TM3
WQO
Year
0%
100%
02 03 04 05 06 07 08 09 10 11
TM4
WQO
Year
0%
100%
02 03 04 05 06 07 08 09 10 11
TM5
WQO
Year
0%
100%
02 03 04 05 06 07 08 09 10 11
TM6
WQO
Year
0%
100%
02 03 04 05 06 07 08 09 10 11
TM3
Year
0%
100%
02 03 04 05 06 07 08 09 10 11
TM4
Year
0%
100%
02 03 04 05 06 07 08 09 10 11
TM5
Year
0%
100%
02 03 04 05 06 07 08 09 10 11
TM6
Year
Dissolved Oxygen (DO)Harbour Subzone (TM2 - TM4)
% sample with bottom DO > 2 mg/L
100% sample with bottom DO > 2 mg/LWQO :
Buffer Subzone (TM5 - TM6)
2. Water column average (surface to 2m above bottom)
2. Water column average (surface to 2m above bottom)
1. Bottom
% sample with water columnaverage DO > 4 mg/L
% sample with bottom DO > 3 mg/L
1. Bottom
WQO : 100% sample with water columnaverage DO > 4 mg/L
% sample with water columnaverage DO > 4 mg/L
WQO
Non-compliance
100% sample with water columnaverage DO > 4 mg/L
WQO :
100% sample with bottom DO > 3 mg/LWQO :
WQO
WQO
WQO
WQO
WQO
WQO
WQO100%
0%
100%
0%
100%
0%
100%
0%
Levels of compliance with key Water Quality Objectives in the Tolo Harbourand Channel WCZ
Tolo Habour& Channel

Appendix C
MARINE WATER QUALITY IN HONG KONG IN 2011 C - 12
0%
100%
02 03 04 05 06 07 08 09 10 11
Dissolved Oxygen (DO)(surface)
Dissolved Oxygen (DO)(bottom)
0%
100%
02 03 04 05 06 07 08 09 10 11
TM7
Year
0%
100%
02 03 04 05 06 07 08 09 10 11
TM7
Year
0%
100%
02 03 04 05 06 07 08 09 10 11
TM8
Year
0%
100%
02 03 04 05 06 07 08 09 10 11
TM7
Year
0%
100%
02 03 04 05 06 07 08 09 10 11
TM8
Year
TM8
Year
Dissolved Oxygen (DO)(middle)
Sha Tin
Tai Po
N
TM8
TM7
ChannelSubzone
Dissolved Oxygen (DO)
Channel Subzone (TM7 - TM8)
% sample with surface DO > 4 mg/L
100% sample with surface DO > 4 mg/LWQO :
2. Middle
1. Surface
3. Bottom
100% sample with middle DO > 4 mg/LWQO :
100% sample with bottom DO > 4 mg/LWQO :
Non-compliance
% sample with middle DO > 4 mg/L
% sample with bottom DO > 4 mg/L
WQO
WQO
WQO
WQO
WQO
WQO
WQO100%
0%
WQO100%
0%
Levels of compliance with key Water Quality Objectives in the Tolo Harbourand Channel WCZ (continued)
Tolo Habour& Channel
WQO100%
0%

Appendix C
MARINE WATER QUALITY IN HONG KONG IN 2011 C - 13
0
100
200
02 03 04 05 06 07 08 09 10 11
E. coli(annual geometric mean)
0
5
10
02 03 04 05 06 07 08 09 10 11
TM6
Year
TM2
Year
0
50
100
02 03 04 05 06 07 08 09 10 11
TM3
Year
0
5
10
02 03 04 05 06 07 08 09 10 11
TM5
Year
0
5
10
02 03 04 05 06 07 08 09 10 11
TM7
Year
0
5
10
02 03 04 05 06 07 08 09 10 11
TM8
Year
E. coli
annual geometric mean for depth averagedE. coli (cfu/100mL)
Non-compliance
0
10
20
02 03 04 05 06 07 08 09 10 11
TM4
Year
(cfu
/100
mL)
(cfu
/100
mL)
(cfu
/100
mL)
(cfu
/100
mL)
(cfu
/100
mL)
(cfu
/100
mL)
(cfu
/100
mL)
BufferSubzone
HarbourSubzone
Sha TinTM2
TM4
TM3
TM5
TM6
Tai Po
N
TM8
TM7
ChannelSubzone
Secondary contact recreation subzone
Levels of compliance with key Water Quality Objectives in the Tolo Harbourand Channel WCZ (continued)
Tolo Habour& Channel 0
610 WQO610
0
WQO for secondary contact recreation subzones :annual geometric mean for depth averagedE. coli < 610 cfu/100mL

Appendix C
MARINE WATER QUALITY IN HONG KONG IN 2011 C - 14
Chlorophyll-a
TM50%
100%
02 03 04 05 06 07 08 09 10 11
Year
0%
100%
02 03 04 05 06 07 08 09 10 11
TM2
Year
0%
100%
02 03 04 05 06 07 08 09 10 11
TM3
Year
0%
100%
02 03 04 05 06 07 08 09 10 11
TM6
Year
0%
100%
02 03 04 05 06 07 08 09 10 11
TM4
Year
0%
100%
02 03 04 05 06 07 08 09 10 11
TM7
Year
0%
100%
02 03 04 05 06 07 08 09 10 11
TM8
Year
BufferSubzone
HarbourSubzone
Sha TinTM2
TM4
TM3
TM5
TM6
Tai Po
N
TM8
TM7
ChannelSubzone
Chlorophyll-a
% sample (S, M, B) withChlorophyll-a < 20 μg/L
Chlorophyll-a < 20 μg/LWQO :
2. Buffer Subzone
1. Harbour Subzone
3. Channel Subzone
Chlorophyll-a < 10 μg/LWQO :
Chlorophyll-a < 6 μg/LWQO :
% sample (S, M, B) withChlorophyll-a < 10 μg/L
% sample (S, M, B) withChlorophyll-a < 6 μg/L
2. Buffer Subzone1. Harbour Subzone
3. Channel Subzone
Levels of chlorophyll-a in the Tolo Harbour and Channel WCZ
Tolo Habour& Channel

Appendix C
MARINE WATER QUALITY IN HONG KONG IN 2011 C - 15
0
0.021
02 03 04 05 06 07 08 09 10 11
BufferSubzone
HarbourSubzone
Sha TinTM2
TM4
TM3
TM5
TM6
Tai Po
N
TM8
TM7
ChannelSubzone
Total Inorganic Nitrogen (TIN)(depth-averaged)
Unionised Ammonia (NH3-N)(depth-averaged)
Total Inorganic Nitrogen (TIN)
annual mean for depth-averagedTIN (mg/L)
annual mean for depth-averagedNH3-N (mg/L)
Unionised Ammonia (NH3-N)
0
0.2
0.4
02 03 04 05 06 07 08 09 10 11
TM2
Year
TIN (mg/L)
0
0.2
0.4
02 03 04 05 06 07 08 09 10 11
TM8
Year
TIN (mg/L)
0
0.2
0.4
02 03 04 05 06 07 08 09 10 11
TM3
Year
TIN (mg/L)
0
0.2
0.4
02 03 04 05 06 07 08 09 10 11
TM4
Year
TIN (mg/L)
0
0.2
0.4
02 03 04 05 06 07 08 09 10 11
TM5
Year
TIN (mg/L)
0
0.2
0.4
02 03 04 05 06 07 08 09 10 11
TM6
Year
TIN (mg/L)
0
0.2
0.4
02 03 04 05 06 07 08 09 10 11
TM7
Year
TIN (mg/L)
0
0.021
02 03 04 05 06 07 08 09 10 11
TM2
Year
NH3-N (mg/L)
0
0.021
02 03 04 05 06 07 08 09 10 11
TM3
Year
NH3-N (mg/L)
0
0.021
02 03 04 05 06 07 08 09 10 11
TM4
Year
NH3-N (mg/L)
0
0.021
02 03 04 05 06 07 08 09 10 11
TM5
Year
NH3-N (mg/L)
TM60
0.021
02 03 04 05 06 07 08 09 10 11
Year
NH3-N (mg/L)
0
0.021
02 03 04 05 06 07 08 09 10 11
TM7
Year
NH3-N (mg/L)
TM8
Year
NH3-N (mg/L)
0 . 0 1
0 . 0 1
0 . 0 1
0 . 0 1
0 . 0 1
0 . 0 1
0 . 0 1
Levels of total inorganic nitrogen and unionised ammonia in the Tolo Harbourand Channel WCZ
Tolo Habour& Channel

Appendix C
MARINE WATER QUALITY IN HONG KONG IN 2011 C - 16
0%
100%
02 03 04 05 06 07 08 09 10 11
SM1WQO
Year
0%
100%
02 03 04 05 06 07 08 09 10 11
SM1WQO
Year
0%
100%
02 03 04 05 06 07 08 09 10 11
SM2WQO
Year
0%
100%
02 03 04 05 06 07 08 09 10 11
SM2WQO
Year
0%
100%
02 03 04 05 06 07 08 09 10 11
SM19WQO
Year
WQO
0%
100%
02 03 04 05 06 07 08 09 10 11
SM19
Year
Dissolved Oxygen (DO)
% sample with bottom DO > 2 mg/L
90% sample with bottom DO > 2 mg/LWQO :
2. Depth-averaged
1. Bottom
90% sample with depth-averagedDO > 4 mg/L
WQO :
Non-compliance
% sample with depth-averagedDO > 4 mg/L
0%
100%
02 03 04 05 06 07 08 09 10 11
SM3WQO
Year
0%
100%
02 03 04 05 06 07 08 09 10 11
SM3WQO
Year
0%
100%
02 03 04 05 06 07 08 09 10 11
SM4WQO
Year
0%
100%
02 03 04 05 06 07 08 09 10 11
SM4WQO
Year
Dissolved Oxygen (DO)(bottom)
Dissolved Oxygen (DO)(depth-averaged)
WQO100%
0%
WQO100%
0%
Levels of compliance with key Water Quality Objectives in the Southern WCZ
Hong Kong Island
Kowloon
SM2
SM19
SM1SM4
SM3
N
Lantau Island
Southern
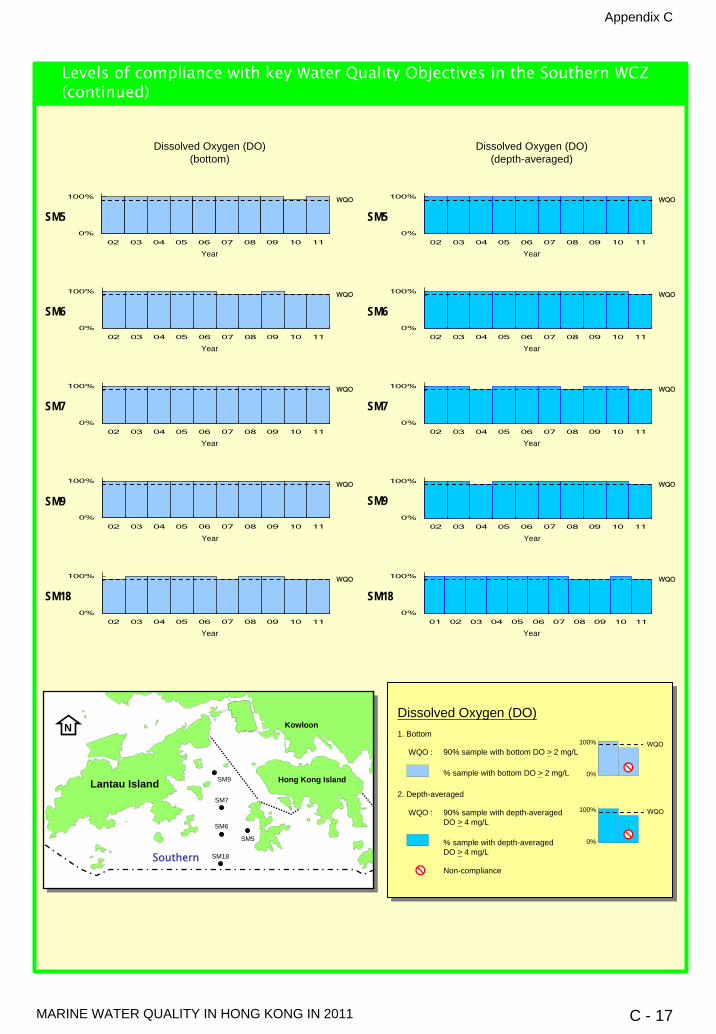
Dissolved Oxygen (DO)(bottom)
Dissolved Oxygen (DO)(depth-averaged)
0%
100%
02 03 04 05 06 07 08 09 10 11
SM5WQO
Year
0%
100%
02 03 04 05 06 07 08 09 10 11
SM5WQO
Year
0%
100%
02 03 04 05 06 07 08 09 10 11
SM6WQO
Year
0%
100%
02 03 04 05 06 07 08 09 10 11
SM6WQO
Year
WQO
0%
100%
02 03 04 05 06 07 08 09 10 11
SM7
Year
0%
100%
02 03 04 05 06 07 08 09 10 11
SM7WQO
Year
Dissolved Oxygen (DO)
% sample with bottom DO > 2 mg/L
90% sample with bottom DO > 2 mg/LWQO :
2. Depth-averaged
1. Bottom
90% sample with depth-averagedDO > 4 mg/L
WQO :
Non-compliance
% sample with depth-averagedDO > 4 mg/L
Hong Kong Island
Kowloon
SM5
0%
100%
01 02 03 04 05 06 07 08 09 10 11
SM18WQO
Year
WQO
0%
100%
02 03 04 05 06 07 08 09 10 11
SM18
Year
0%
100%
02 03 04 05 06 07 08 09 10 11
SM9WQO
Year
0%
100%
02 03 04 05 06 07 08 09 10 11
SM9WQO
Year
Levels of compliance with key Water Quality Objectives in the Southern WCZ(continued)
N
Lantau Island
SM18
SM6
SM7
SM9
Southern
Appendix C
MARINE WATER QUALITY IN HONG KONG IN 2011 C - 17
WQO100%
0%
WQO100%
0%
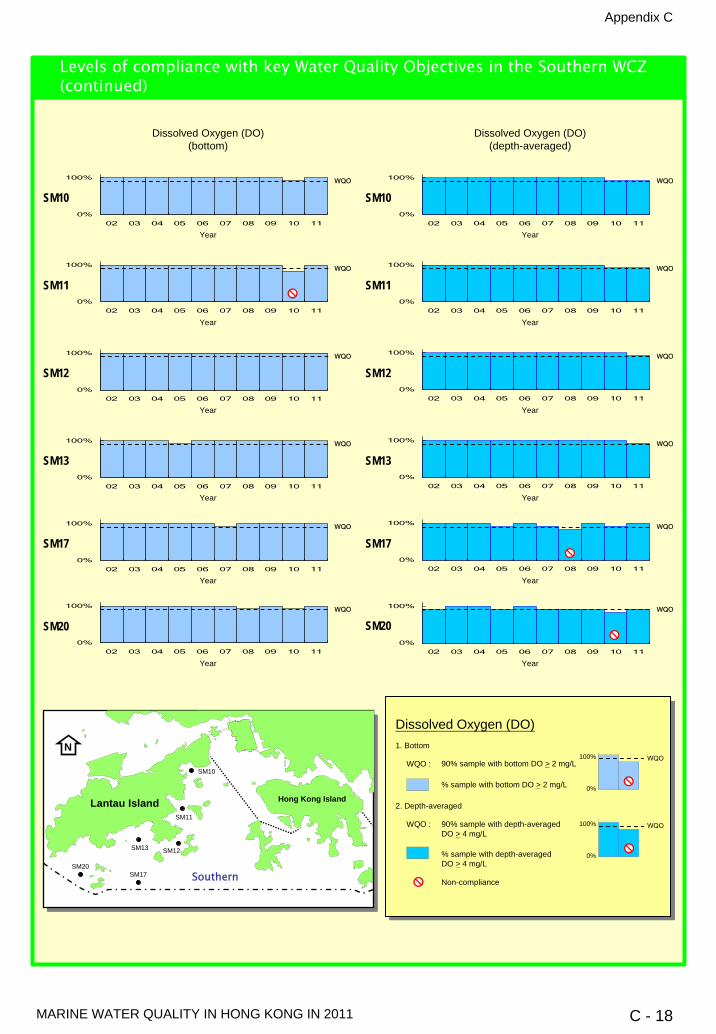
Appendix C
MARINE WATER QUALITY IN HONG KONG IN 2011 C - 18
0%
100%
02 03 04 05 06 07 08 09 10 11
0%
100%
02 03 04 05 06 07 08 09 10 11
SM20WQO
Year
0%
100%
02 03 04 05 06 07 08 09 10 11
SM20WQO
Year
0%
100%
02 03 04 05 06 07 08 09 10 11
SM17WQO
Year
WQO
0%
100%
02 03 04 05 06 07 08 09 10 11
SM17
Year
Dissolved Oxygen (DO)(bottom)
Dissolved Oxygen (DO)(depth-averaged)
SM10WQO
Year
0%
100%
02 03 04 05 06 07 08 09 10 11
SM10WQO
Year
0%
100%
02 03 04 05 06 07 08 09 10 11
SM11WQO
Year
0%
100%
02 03 04 05 06 07 08 09 10 11
SM11WQO
Year
0%
100%
02 03 04 05 06 07 08 09 10 11
SM12WQO
Year
0%
100%
02 03 04 05 06 07 08 09 10 11
SM12WQO
Year
WQO
0%
100%
02 03 04 05 06 07 08 09 10 11
SM13
Year
0%
100%
02 03 04 05 06 07 08 09 10 11
SM13WQO
Year
Hong Kong Island
Kowloon
Dissolved Oxygen (DO)
% sample with bottom DO > 2 mg/L
90% sample with bottom DO > 2 mg/LWQO :
2. Depth-averaged
1. Bottom
90% sample with depth-averagedDO > 4 mg/L
WQO :
Non-compliance
% sample with depth-averagedDO > 4 mg/L
WQO
WQO100%
0%
100%
0%
Levels of compliance with key Water Quality Objectives in the Southern WCZ(continued)
N
SM17
SM13 SM12
SM11
SM10
Lantau Island
SM20
Southern

Appendix C
MARINE WATER QUALITY IN HONG KONG IN 2011 C - 19
0
0.1
0.2
02 03 04 05 06 07 08 09 10 11
NH3-N (mg/L)
SM190
0.021
02 03 04 05 06 07 08 09 10 11
Year
WQO
0
0.1
0.2
02 03 04 05 06 07 08 09 10 11
SM19
Year
TIN (mg/L)
WQO
Total Inorganic Nitrogen (TIN)(depth-averaged)
Unionised Ammonia (NH3-N)(depth-averaged)
SM20
0.021
02 03 04 05 06 07 08 09 10 11
Year
NH3-N (mg/L)
WQO
0
0.1
0.2
02 03 04 05 06 07 08 09 10 11
SM2
Year
TIN (mg/L)
WQO
0
0.021
02 03 04 05 06 07 08 09 10 11
Year
NH3-N (mg/L)
WQO
SM1SM1
Year
TIN (mg/L)
WQO
SM40
0.021
02 03 04 05 06 07 08 09 10 11
Year
NH3-N (mg/L)
WQO
0
0.1
0.2
0.3
02 03 04 05 06 07 08 09 10 11
SM4
Year
TIN (mg/L)
WQO
0
0.021
02 03 04 05 06 07 08 09 10 11
Year
NH3-N (mg/L)
WQO
SM30
0.1
0.2
02 03 04 05 06 07 08 09 10 11
SM3
Year
TIN (mg/L)
WQO
Total Inorganic Nitrogen (TIN)
annual mean for depth-averagedTIN
annual mean for depth-averagedTIN < 0.1 mg/L
WQO :
annual mean for depth-averagedNH3-N < 0.021 mg/L
WQO :
Non-compliance
annual mean for depth-averagedNH3-N
Unionised Ammonia (NH3-N)
TIN (mg/L)
NH3-N (mg/L)
0 . 0 1
0 . 0 1
0 . 0 1
0 . 0 1
0 . 0 1
0
0.021 WQO0.021
0
Levels of compliance with key Water Quality Objectives in the Southern WCZ(continued)
0
0.1 WQO0.1
0Hong Kong Island
Kowloon
SM2
SM19
SM1SM4
SM3
N
Lantau Island
Southern
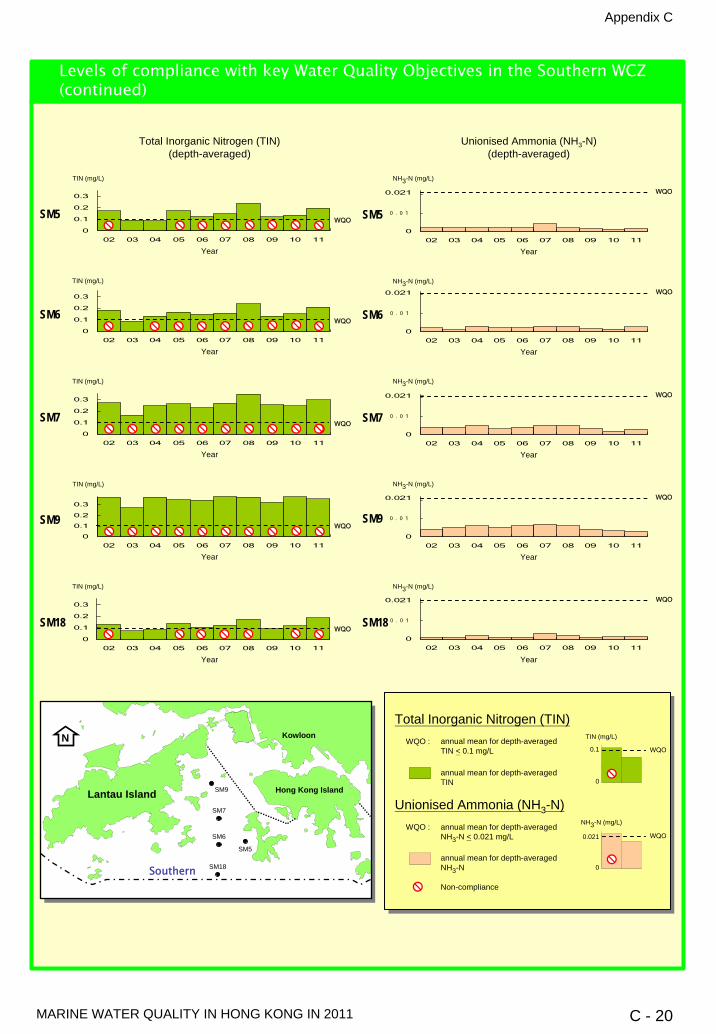
Hong Kong Island
Kowloon
SM18
SM6
SM5
SM7
SM9
Total Inorganic Nitrogen (TIN)
annual mean for depth-averagedTIN
annual mean for depth-averagedTIN < 0.1 mg/L
WQO :
annual mean for depth-averagedNH3-N < 0.021 mg/L
WQO :
Non-compliance
annual mean for depth-averagedNH3-N
Unionised Ammonia (NH3-N)
TIN (mg/L)
NH3-N (mg/L)
0
0.021
02 03 04 05 06 07 08 09 10 11
SM18
Year
NH3-N (mg/L)
WQO
0
0.1
0.2
0.3
02 03 04 05 06 07 08 09 10 11
SM18
Year
TIN (mg/L)
WQO
NH3-N (mg/L)
SM70
0.021
02 03 04 05 06 07 08 09 10 11
Year
WQO
0
0.1
0.2
0.3
02 03 04 05 06 07 08 09 10 11
SM7
Year
TIN (mg/L)
WQO
0
0.021
02 03 04 05 06 07 08 09 10 11
SM6
Year
WQO
0
0.1
0.2
0.3
02 03 04 05 06 07 08 09 10 11
SM6
Year
WQO
NH3-N (mg/L)TIN (mg/L)
0
0.021
02 03 04 05 06 07 08 09 10 11
SM5
Year
NH3-N (mg/L)
WQO
0
0.1
0.2
0.3
02 03 04 05 06 07 08 09 10 11
SM5
Year
TIN (mg/L)
WQO
0
0.021
02 03 04 05 06 07 08 09 10 11
Year
NH3-N (mg/L)
WQO
SM90
0.1
0.2
0.3
02 03 04 05 06 07 08 09 10 11
SM9
Year
TIN (mg/L)
WQO
Total Inorganic Nitrogen (TIN)(depth-averaged)
Unionised Ammonia (NH3-N)(depth-averaged)
0 . 0 1
0 . 0 1
0 . 0 1
0 . 0 1
0 . 0 1
Levels of compliance with key Water Quality Objectives in the Southern WCZ(continued)
N
Lantau Island
Southern
Appendix C
MARINE WATER QUALITY IN HONG KONG IN 2011 C - 20
0
0.1 WQO0.1
0
0
0.021 WQO0.021
0

Appendix C
MARINE WATER QUALITY IN HONG KONG IN 2011 C - 21
Total Inorganic Nitrogen (TIN)(depth-averaged)
Unionised Ammonia (NH3-N)(depth-averaged)
NH3-N (mg/L)
SM130
0.021
02 03 04 05 06 07 08 09 10 11
Year
WQO
0
0.1
0.2
0.3
02 03 04 05 06 07 08 09 10 11
SM13
Year
TIN (mg/L)
WQO
0
0.021
02 03 04 05 06 07 08 09 10 11
SM12
Year
NH3-N (mg/L)
WQO
0
0.1
0.2
0.3
02 03 04 05 06 07 08 09 10 11
SM12
Year
TIN (mg/L)
WQO
0
0.021
02 03 04 05 06 07 08 09 10 11
SM11
Year
NH3-N (mg/L)
WQO
0
0.1
0.2
0.3
02 03 04 05 06 07 08 09 10 11
SM11
Year
TIN (mg/L)
WQO
0
0.021
02 03 04 05 06 07 08 09 10 11
SM10
Year
NH3-N (mg/L)
WQO
0
0.1
0.2
0.3
0.4
02 03 04 05 06 07 08 09 10 11
SM10
Year
TIN (mg/L)
WQO
0
0.021
02 03 04 05 06 07 08 09 10 11
Year
NH3-N (mg/L)
WQO
SM200
0.1
0.2
0.3
02 03 04 05 06 07 08 09 10 11
SM20
Year
TIN (mg/L)
WQO
0
0.021
02 03 04 05 06 07 08 09 10 11
SM17
Year
NH3-N (mg/L)
WQO
0
0.1
0.2
0.3
02 03 04 05 06 07 08 09 10 11
SM17
Year
TIN (mg/L)
WQO
Total Inorganic Nitrogen (TIN)
annual mean for depth-averagedTIN
annual mean for depth-averagedTIN < 0.1 mg/L
WQO :
annual mean for depth-averagedNH3-N < 0.021 mg/L
WQO :
Non-compliance
annual mean for depth-averagedNH3-N
Unionised Ammonia (NH3-N)
TIN (mg/L)
NH3-N (mg/L)
0
0.1 WQO0.1
0
0
0.021 WQO0.021
0
0 . 0 1
0 . 0 1
0 . 0 1
0 . 0 1
0 . 0 1
0 . 0 1
Levels of compliance with key Water Quality Objectives in the Southern WCZ(continued)
Hong Kong Island
KowloonN
SM17
SM13 SM12
SM11
SM10
Lantau Island
SM20
Southern

E. coli(annual geometric mean)
0
5
10
02 03 04 05 06 07 08 09 10 11
SM1
Year
(cfu
/100
mL)
0
10
20
02 03 04 05 06 07 08 09 10 11
SM11
Year
(cfu
/100
mL)
0
25
50
02 03 04 05 06 07 08 09 10 11
SM10
Year
(cfu
/100
mL)
0
50
100
150
02 03 04 05 06 07 08 09 10 11
SM2
Year
(cfu
/100
mL)
E. coli
annual geometric mean for depth averagedE. coli (cfu/100mL)
Non-compliance
Hong Kong Island
Kowloon
SM2SM1
Secondary contact recreation subzone
Levels of compliance with key Water Quality Objectives in the Southern WCZ(continued)
SM10
N
Lantau IslandSM11
Southern
Appendix C
MARINE WATER QUALITY IN HONG KONG IN 2011 C - 22
WQO for secondary contact recreation subzones :annual geometric mean for depth averagedE. coli < 610 cfu/100mL
0
610 WQO610
0

WQO100%
0%
WQO100%
0%
Appendix C
MARINE WATER QUALITY IN HONG KONG IN 2011 C - 23
Dissolved Oxygen (DO)(bottom)
Dissolved Oxygen (DO)(depth-averaged)
0%
100%
02 03 04 05 06 07 08 09 10 11
VM1WQO
Year
WQO
0%
100%
02 03 04 05 06 07 08 09 10 11
VM1
Year
0%
100%
02 03 04 05 06 07 08 09 10 11
VM2WQO
Year
0%
100%
02 03 04 05 06 07 08 09 10 11
VM4WQO
Year
0%
100%
02 03 04 05 06 07 08 09 10 11
VM5WQO
Year
WQO
0%
100%
02 03 04 05 06 07 08 09 10 11
VM6
Year
0%
100%
02 03 04 05 06 07 08 09 10 11
VM2WQO
Year
0%
100%
02 03 04 05 06 07 08 09 10 11
VM4WQO
Year
0%
100%
02 03 04 05 06 07 08 09 10 11
VM5WQO
Year
0%
100%
02 03 04 05 06 07 08 09 10 11
VM6WQO
Year
Dissolved Oxygen (DO)
% sample with bottom DO > 2 mg/L
90% sample with bottom DO > 2 mg/LWQO :
2. Depth-averaged
1. Bottom
90% sample with depth-averagedDO > 4 mg/L
WQO :
Non-compliance
% sample with depth-averagedDO > 4 mg/L
Levels of compliance with key Water Quality Objectives in the Victoria HarbourWCZ
WQO100%
0%
WQO100%
0%
VM2
Hong Kong Island
VM6
VM5
VM4
Kowloon
VM1
N
VictoriaHarbour

Appendix C
MARINE WATER QUALITY IN HONG KONG IN 2011 C - 24
Dissolved Oxygen (DO)(bottom)
Dissolved Oxygen (DO)(depth-averaged)
0%
100%
02 03 04 05 06 07 08 09 10 11
VM8WQO
Year
0%
100%
02 03 04 05 06 07 08 09 10 11
VM8WQO
Year
Dissolved Oxygen (DO)
% sample with bottom DO > 2 mg/L
90% sample with bottom DO > 2 mg/LWQO :
2. Depth-averaged
1. Bottom
90% sample with depth-averagedDO > 4 mg/L
WQO :
Non-compliance
% sample with depth-averagedDO > 4 mg/L
WQO
0%
100%
02 03 04 05 06 07 08 09 10 11
VM14
Year
0%
100%
02 03 04 05 06 07 08 09 10 11
VM14WQO
Year
0%
100%
02 03 04 05 06 07 08 09 10 11
VM12WQO
Year
0%
100%
02 03 04 05 06 07 08 09 10 11
VM12WQO
Year
0%
100%
02 03 04 05 06 07 08 09 10 11
VM7WQO
Year
WQO
0%
100%
02 03 04 05 06 07 08 09 10 11
VM7
Year
WQO
0%
100%
02 03 04 05 06 07 08 09 10 11
VM15
Year
0%
100%
02 03 04 05 06 07 08 09 10 11
VM15WQO
Year
WQO100%
0%
WQO100%
0%
Levels of compliance with key Water Quality Objectives in the Victoria HarbourWCZ (continued)
Hong Kong Island
Kowloon
N
VM7
VM14
VM15
VM8
VM12
VictoriaHarbour

Appendix C
MARINE WATER QUALITY IN HONG KONG IN 2011 C - 25
Total Inorganic Nitrogen (TIN)(depth-averaged)
Unionised Ammonia (NH3-N)(depth-averaged)
Total Inorganic Nitrogen (TIN)
annual mean for depth-averagedTIN
annual mean for depth-averagedTIN < 0.4 mg/L
WQO :
annual mean for depth-averagedNH3-N < 0.021 mg/L
WQO :
Non-compliance
annual mean for depth-averagedNH3-N
Unionised Ammonia (NH3-N)
0
0.021
02 03 04 05 06 07 08 09 10 11
VM2
Year
NH3-N (mg/L)
WQO
0
0.021
02 03 04 05 06 07 08 09 10 11
VM4
Year
NH3-N (mg/L)
WQO
0
0.021
02 03 04 05 06 07 08 09 10 11
VM5
Year
NH3-N (mg/L)
WQO
NH3-N (mg/L)
VM60
0.021
02 03 04 05 06 07 08 09 10 11
Year
WQO
0
0.2
0.4
0.6
02 03 04 05 06 07 08 09 10 11
VM6
Year
TIN (mg/L)
WQO
0
0.2
0.4
0.6
02 03 04 05 06 07 08 09 10 11
VM5
Year
TIN (mg/L)
WQO
0
0.2
0.4
0.6
02 03 04 05 06 07 08 09 10 11
VM2
Year
TIN (mg/L)
WQO
0
0.021
02 03 04 05 06 07 08 09 10 11
Year
NH3-N (mg/L)
WQO
VM10
0.2
0.4
0.6
02 03 04 05 06 07 08 09 10 11
VM1
Year
TIN (mg/L)
WQO
0
0.2
0.4
0.6
02 03 04 05 06 07 08 09 10 11
VM4
Year
TIN (mg/L)
WQO
0 . 0 1
0 . 0 1
0 . 0 1
0 . 0 1
0 . 0 1
0
0.3 WQO
TIN (mg/L)
0.4
0
0
0.021 WQO
NH3-N (mg/L)
0.021
0
Levels of compliance with key Water Quality Objectives in the Victoria HarbourWCZ (continued)
VM2
Hong Kong Island
VM6
VM5
VM4
Kowloon
VM1
N
VictoriaHarbour

Total Inorganic Nitrogen (TIN)(depth-averaged)
Unionised Ammonia (NH3-N)(depth-averaged)
0
0.021
02 03 04 05 06 07 08 09 10 11
VM8
Year
NH3-N (mg/L)
WQO
0
0.4
0.8
02 03 04 05 06 07 08 09 10 11
VM8
Year
TIN (mg/L)
WQO
Total Inorganic Nitrogen (TIN)
annual mean for depth-averagedTIN
annual mean for depth-averagedTIN < 0.4 mg/L
WQO :
annual mean for depth-averagedNH3-N < 0.021 mg/L
WQO :
Non-compliance
annual mean for depth-averagedNH3-N
Unionised Ammonia (NH3-N)
NH3-N (mg/L)
VM140
0.021
02 03 04 05 06 07 08 09 10 11
Year
WQO
0
0.4
0.8
02 03 04 05 06 07 08 09 10 11
VM14
Year
TIN (mg/L)
WQO
0
0.021
02 03 04 05 06 07 08 09 10 11
VM12
Year
NH3-N (mg/L)
WQO
0
0.4
0.8
02 03 04 05 06 07 08 09 10 11
VM12
Year
TIN (mg/L)
WQO
0
0.021
02 03 04 05 06 07 08 09 10 11
Year
NH3-N (mg/L)
WQO
VM70
0.4
0.8
02 03 04 05 06 07 08 09 10 11
VM7
Year
TIN (mg/L)
WQO
NH3-N (mg/L)
VM150
0.021
02 03 04 05 06 07 08 09 10 11
Year
WQO
0
0.4
0.8
02 03 04 05 06 07 08 09 10 11
VM15
Year
TIN (mg/L)
WQO 0 . 0 1
0 . 0 1
0 . 0 1
0 . 0 1
0 . 0 1
Levels of compliance with key Water Quality Objectives in the Victoria HarbourWCZ (continued)
Appendix C
MARINE WATER QUALITY IN HONG KONG IN 2011 C - 26
0
0.3 WQO
TIN (mg/L)
0.4
0
0
0.021 WQO
NH3-N (mg/L)
0.021
0
Hong Kong Island
Kowloon
N
VM7
VM14
VM15
VM8
VM12
VictoriaHarbour
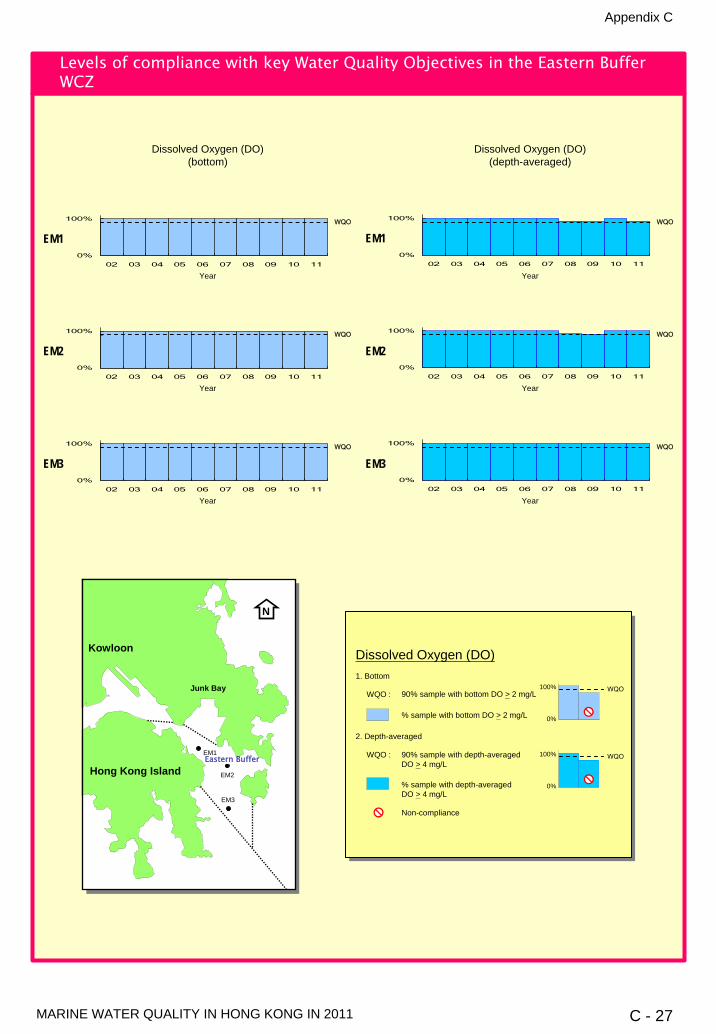
Appendix C
MARINE WATER QUALITY IN HONG KONG IN 2011 C - 27
Dissolved Oxygen (DO)(bottom)
Dissolved Oxygen (DO)(depth-averaged)
0%
100%
02 03 04 05 06 07 08 09 10 11
EM1WQO
Year
0%
100%
02 03 04 05 06 07 08 09 10 11
EM1WQO
Year
0%
100%
02 03 04 05 06 07 08 09 10 11
EM2WQO
Year
0%
100%
02 03 04 05 06 07 08 09 10 11
EM2WQO
Year
0%
100%
02 03 04 05 06 07 08 09 10 11
EM3WQO
Year
0%
100%
02 03 04 05 06 07 08 09 10 11
EM3WQO
Year
Dissolved Oxygen (DO)
% sample with bottom DO > 2 mg/L
90% sample with bottom DO > 2 mg/LWQO :
2. Depth-averaged
1. Bottom
90% sample with depth-averagedDO > 4 mg/L
WQO :
Non-compliance
% sample with depth-averagedDO > 4 mg/L
N
EM2
EM1
EM3
Hong Kong Island
Kowloon
Junk Bay WQO100%
0%
WQO100%
0%
Levels of compliance with key Water Quality Objectives in the Eastern Buffer WCZ
Eastern Buffer

Appendix C
MARINE WATER QUALITY IN HONG KONG IN 2011 C - 28
0
0.021 WQO
NH3-N (mg/L)
0.021
0
0
0.021
02 03 04 05 06 07 08 09 10 11
EM3
Year
NH3-N (mg/L)
WQO
0
0.2
0.4
02 03 04 05 06 07 08 09 10 11
EM3
Year
TIN (mg/L)
WQO
Total Inorganic Nitrogen (TIN)(depth-averaged)
Unionised Ammonia (NH3-N)(depth-averaged)
Total Inorganic Nitrogen (TIN)
annual mean for depth-averagedTIN
annual mean for depth-averagedTIN < 0.4 mg/L
WQO :
annual mean for depth-averagedNH3-N < 0.021 mg/L
WQO :
Non-compliance
annual mean for depth-averagedNH3-N
Unionised Ammonia (NH3-N)
0
0.021
02 03 04 05 06 07 08 09 10 11
EM2
Year
NH3-N (mg/L)
WQO
0
0.2
0.4
02 03 04 05 06 07 08 09 10 11
EM2
Year
TIN (mg/L)
WQO
0
0.021
02 03 04 05 06 07 08 09 10 11
Year
NH3-N (mg/L)
WQO
EM10
0.2
0.4
02 03 04 05 06 07 08 09 10 11
EM1
Year
TIN (mg/L)
WQO
0 . 0 1
0 . 0 1
0 . 0 1
Levels of compliance with key Water Quality Objectives in the Eastern BufferWCZ (continued)
N
EM2
EM1
EM3
Hong Kong Island
Kowloon
Junk Bay
Eastern Buffer
0
0.3 WQO
TIN (mg/L)
0.4
0
0
0.021 WQO
NH3-N (mg/L)
0.021
0

Appendix C
MARINE WATER QUALITY IN HONG KONG IN 2011 C - 29
Dissolved Oxygen (DO)(bottom)
Dissolved Oxygen (DO)(depth-averaged)
0%
100%
02 03 04 05 06 07 08 09 10 11
WM1WQO
Year
0%
100%
02 03 04 05 06 07 08 09 10 11
WM1WQO
Year
0%
100%
02 03 04 05 06 07 08 09 10 11
WM2WQO
Year
0%
100%
02 03 04 05 06 07 08 09 10 11
WM2WQO
Year
0%
100%
02 03 04 05 06 07 08 09 10 11
WM3WQO
Year
0%
100%
02 03 04 05 06 07 08 09 10 11
WM3WQO
Year
0%
100%
02 03 04 05 06 07 08 09 10 11
WM4WQO
Year
0%
100%
02 03 04 05 06 07 08 09 10 11
WM4WQO
Year
Dissolved Oxygen (DO)
% sample with bottom DO > 2 mg/L
90% sample with bottom DO > 2 mg/LWQO :
2. Depth-averaged
1. Bottom
90% sample with depth-averagedDO > 4 mg/L
WQO :
Non-compliance
% sample with depth-averagedDO > 4 mg/L
Levels of compliance with key Water Quality Objectives in the Western BufferWCZ
WQO100%
0%
WQO100%
0%
N
WM1
WM3
WM2
WM4
Kowloon
Hong KongIsland
WesternBuffer
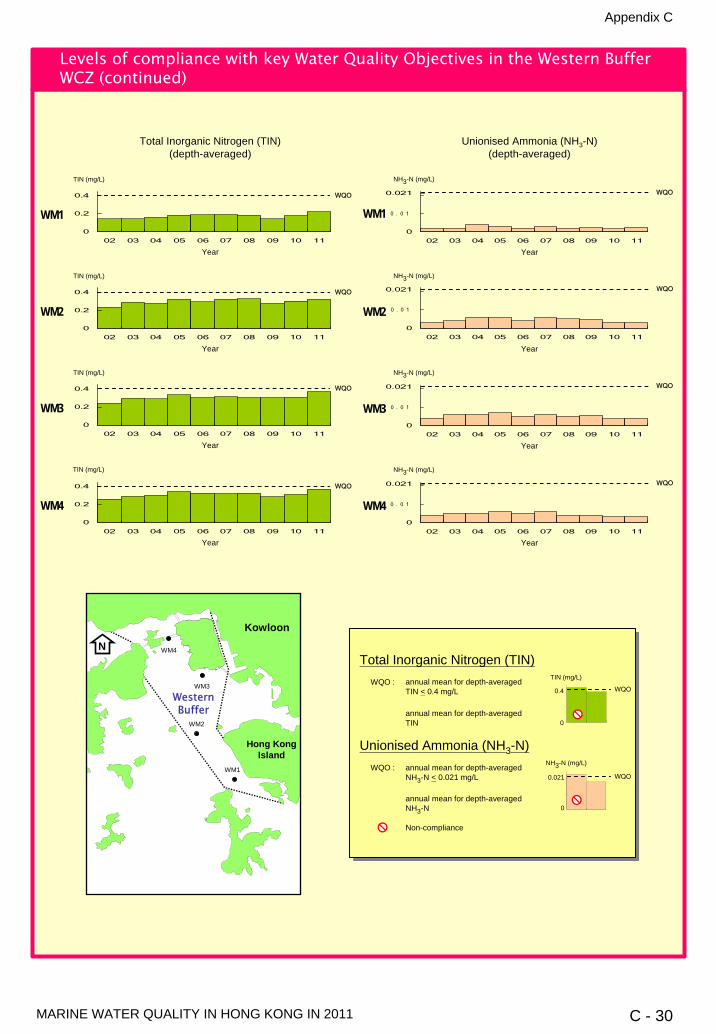
Appendix C
MARINE WATER QUALITY IN HONG KONG IN 2011 C - 30
Total Inorganic Nitrogen (TIN)(depth-averaged)
Unionised Ammonia (NH3-N)(depth-averaged)
Total Inorganic Nitrogen (TIN)
annual mean for depth-averagedTIN
annual mean for depth-averagedTIN < 0.4 mg/L
WQO :
annual mean for depth-averagedNH3-N < 0.021 mg/L
WQO :
Non-compliance
annual mean for depth-averagedNH3-N
Unionised Ammonia (NH3-N)
0
0.021
02 03 04 05 06 07 08 09 10 11
WM4
Year
NH3-N (mg/L)
WQO
0
0.2
0.4
02 03 04 05 06 07 08 09 10 11
WM4
Year
TIN (mg/L)
WQO
0
0.021
02 03 04 05 06 07 08 09 10 11
WM2
Year
NH3-N (mg/L)
WQO
0
0.2
0.4
02 03 04 05 06 07 08 09 10 11
WM2
Year
TIN (mg/L)
WQO
0
0.021
02 03 04 05 06 07 08 09 10 11
Year
NH3-N (mg/L)
WQO
WM10
0.2
0.4
02 03 04 05 06 07 08 09 10 11
WM1
Year
TIN (mg/L)
WQO
0
0.021
02 03 04 05 06 07 08 09 10 11
WM3
Year
NH3-N (mg/L)
WQO
0
0.2
0.4
02 03 04 05 06 07 08 09 10 11
WM3
Year
TIN (mg/L)
WQO
0 . 0 1
0 . 0 1
0 . 0 1
0 . 0 1
Levels of compliance with key Water Quality Objectives in the Western BufferWCZ (continued)
0
0.3 WQO
TIN (mg/L)
0.4
0
0
0.021 WQO
NH3-N (mg/L)
0.021
0
N
WM1
WM3
WM2
WM4
Kowloon
Hong KongIsland
WesternBuffer
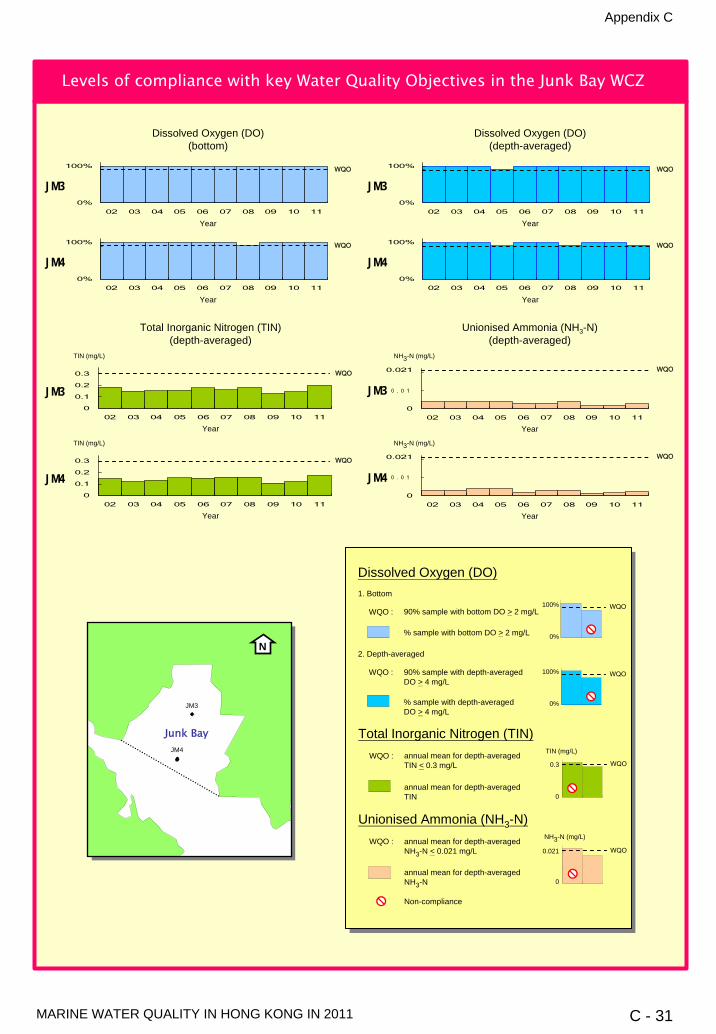
Appendix C
MARINE WATER QUALITY IN HONG KONG IN 2011 C - 31
0
0.1
0.2
0.3
02 03 04 05 06 07 08 09 10 11
0%
100%
02 03 04 05 06 07 08 09 10 11
Dissolved Oxygen (DO)(bottom)
Dissolved Oxygen (DO)(depth-averaged)
JM3WQO
Year
0%
100%
02 03 04 05 06 07 08 09 10 11
JM3WQO
Year
0%
100%
02 03 04 05 06 07 08 09 10 11
JM4WQO
Year
0%
100%
02 03 04 05 06 07 08 09 10 11
JM4WQO
Year
Total Inorganic Nitrogen (TIN)(depth-averaged)
Unionised Ammonia (NH3-N)(depth-averaged)
0
0.021
02 03 04 05 06 07 08 09 10 11
Year
NH3-N (mg/L)
WQO
JM3JM3
Year
TIN (mg/L)
WQO
0
0.021
02 03 04 05 06 07 08 09 10 11
Year
NH3-N (mg/L)
WQO
JM40
0.1
0.2
0.3
02 03 04 05 06 07 08 09 10 11
JM4
Year
TIN (mg/L)
WQO
Dissolved Oxygen (DO)
% sample with bottom DO > 2 mg/L
90% sample with bottom DO > 2 mg/LWQO :
2. Depth-averaged
1. Bottom
90% sample with depth-averagedDO > 4 mg/L
WQO :
% sample with depth-averagedDO > 4 mg/L
WQO
WQO
Total Inorganic Nitrogen (TIN)
annual mean for depth-averagedTIN
annual mean for depth-averagedTIN < 0.3 mg/L
WQO :
annual mean for depth-averagedNH3-N < 0.021 mg/L
WQO :
Non-compliance
annual mean for depth-averagedNH3-N
Unionised Ammonia (NH3-N)
WQO
0
0.3TIN (mg/L)
WQO
0
0.021NH3-N (mg/L)
JM4
JM3
N
100%
0%
100%
0%
0.3
0
0.021
0
0 . 0 1
0 . 0 1
Levels of compliance with key Water Quality Objectives in the Junk Bay WCZ
Junk Bay
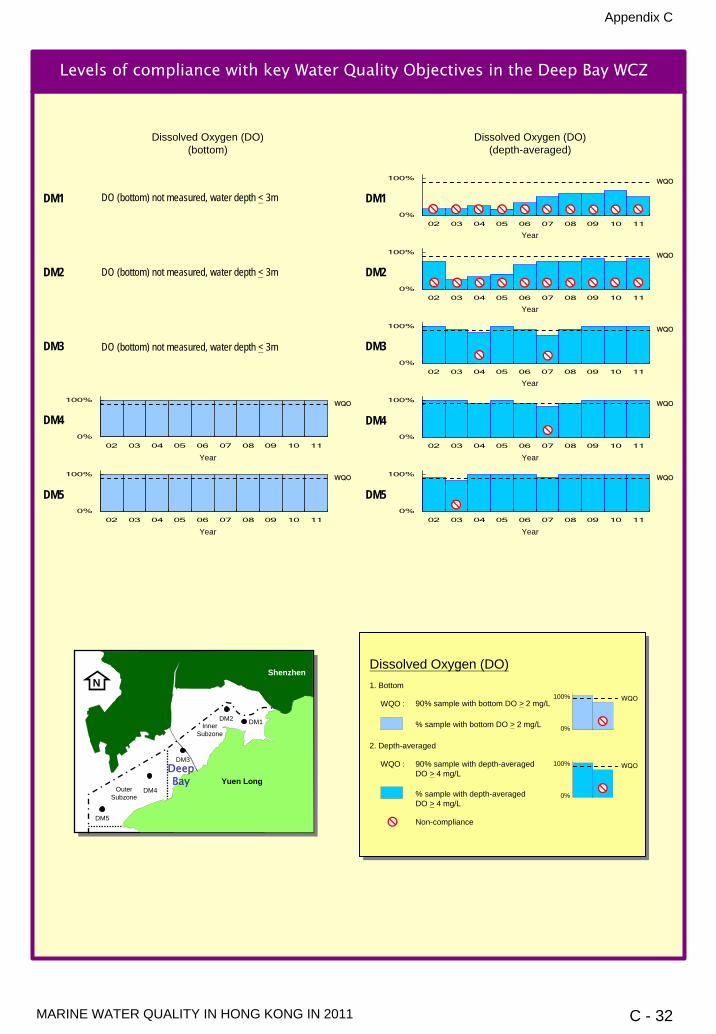
Appendix C
MARINE WATER QUALITY IN HONG KONG IN 2011 C - 32
Dissolved Oxygen (DO)(bottom)
0%
100%
02 03 04 05 06 07 08 09 10 11
DM4WQO
Year
0%
100%
02 03 04 05 06 07 08 09 10 11
DM3WQO
Year
0%
100%
02 03 04 05 06 07 08 09 10 11
DM5WQO
Year
0%
100%
02 03 04 05 06 07 08 09 10 11
DM4WQO
Year
0%
100%
02 03 04 05 06 07 08 09 10 11
DM5WQO
Year
Dissolved Oxygen (DO)(depth-averaged)
0%
100%
02 03 04 05 06 07 08 09 10 11
DM1WQO
Year
0%
100%
02 03 04 05 06 07 08 09 10 11
DM2WQO
Year
DM3
DM1
DM2
DO (bottom) not measured, water depth < 3m
DO (bottom) not measured, water depth < 3m
DO (bottom) not measured, water depth < 3m
Dissolved Oxygen (DO)
% sample with bottom DO > 2 mg/L
90% sample with bottom DO > 2 mg/LWQO :
2. Depth-averaged
1. Bottom
90% sample with depth-averagedDO > 4 mg/L
WQO :
Non-compliance
% sample with depth-averagedDO > 4 mg/L
WQO100%
0%
WQO100%
0%
Levels of compliance with key Water Quality Objectives in the Deep Bay WCZ
OuterSubzone
DM5
InnerSubzone
DM4
DM1DM2
N
Yuen Long
DM3
Shenzhen
DeepBay

Appendix C
MARINE WATER QUALITY IN HONG KONG IN 2011 C - 33
Levels of compliance with key Water Quality Objectives in the Deep Bay WCZ(continued)
0
1
2
3
4
02 03 04 05 06 07 08 09 10 11
WQO
Total Inorganic Nitrogen (TIN)(depth-averaged)
Unionised Ammonia (NH3-N)(depth-averaged)
0
0.1
0.2
02 03 04 05 06 07 08 09 10 11
DM2
Year
NH3-N (mg/L)
WQO
0
0.05
0.1
02 03 04 05 06 07 08 09 10 11
DM3
Year
NH3-N (mg/L)
WQO
0
0.021
02 03 04 05 06 07 08 09 10 11
DM4
Year
NH3-N (mg/L)
WQO
NH3-N (mg/L)
DM50
0.021
02 03 04 05 06 07 08 09 10 11
Year
WQO
0
0.5
1
02 03 04 05 06 07 08 09 10 11
DM5
Year
TIN (mg/L)
WQO
0
0.5
1
02 03 04 05 06 07 08 09 10 11
DM4
Year
TIN (mg/L)
WQO
0
2
4
6
8
02 03 04 05 06 07 08 09 10 11
DM2
Year
TIN (mg/L)
WQO
0
0.1
0.2
02 03 04 05 06 07 08 09 10 11
Year
NH3-N (mg/L)
WQO
DM10
2
4
6
8
02 03 04 05 06 07 08 09 10 11
DM1
Year
TIN (mg/L)
WQO
DM3
Year
TIN (mg/L)
Non-compliance
Total Inorganic Nitrogen (TIN)
annual mean for depth-averagedTIN < 0.7 mg/L
WQO :
annual mean for depth-averagedNH3-N < 0.021 mg/L
WQO :
annual mean for depth-averagedNH3-N
Unionised Ammonia (NH3-N)
TIN (mg/L)
NH3-N (mg/L)
Inner Subzone (DM1 - DM3)
Outer Subzone (DM4 - DM5)
annual mean for depth-averagedTIN
annual mean for depth-averagedTIN
annual mean for depth-averagedTIN < 0.5 mg/L
WQO :
TIN (mg/L)
0
0.5 WQO0.5
0
0
0.021 WQO0.021
0
0 . 0 1
0 . 0 1
0
0.7 WQO0.7
0
OuterSubzone
InnerSubzone
DM5
DM4
DM1DM2
Shenzhen
Yuen Long
N
DeepBay
DM3
Shenzhen
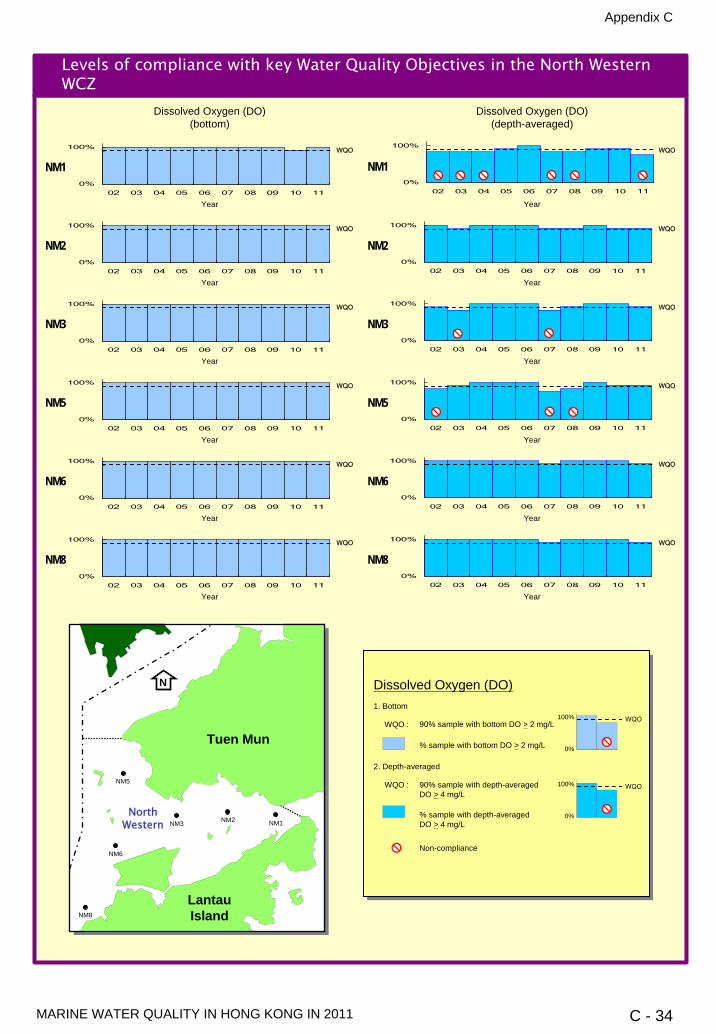
Appendix C
MARINE WATER QUALITY IN HONG KONG IN 2011 C - 34
Dissolved Oxygen (DO)(bottom)
Dissolved Oxygen (DO)(depth-averaged)
0%
100%
02 03 04 05 06 07 08 09 10 11
NM1WQO
Year
0%
100%
02 03 04 05 06 07 08 09 10 11
NM1WQO
Year
0%
100%
02 03 04 05 06 07 08 09 10 11
NM2WQO
Year
0%
100%
02 03 04 05 06 07 08 09 10 11
NM2WQO
Year
0%
100%
02 03 04 05 06 07 08 09 10 11
NM3WQO
Year
0%
100%
02 03 04 05 06 07 08 09 10 11
NM3WQO
Year
0%
100%
02 03 04 05 06 07 08 09 10 11
NM5WQO
Year
0%
100%
02 03 04 05 06 07 08 09 10 11
NM5WQO
Year
WQO
0%
100%
02 03 04 05 06 07 08 09 10 11
NM6
Year
0%
100%
02 03 04 05 06 07 08 09 10 11
NM6WQO
Year
Non-compliance
Dissolved Oxygen (DO)
% sample with bottom DO > 2 mg/L
90% sample with bottom DO > 2 mg/LWQO :
2. Depth-averaged
1. Bottom
90% sample with depth-averagedDO > 4 mg/L
WQO :
% sample with depth-averagedDO > 4 mg/L
WQO
0%
100%
02 03 04 05 06 07 08 09 10 11
NM8
Year
0%
100%
02 03 04 05 06 07 08 09 10 11
NM8WQO
Year
WQO100%
0%
WQO100%
0%
Levels of compliance with key Water Quality Objectives in the North WesternWCZ
N
NM2NM3
NM5
NM6
NM1
NM8
Tuen Mun
LantauIsland
NorthWestern

Appendix C
MARINE WATER QUALITY IN HONG KONG IN 2011 C - 35
Total Inorganic Nitrogen (TIN)(depth-averaged)
Unionised Ammonia (NH3-N)(depth-averaged)
Non-compliance
Total Inorganic Nitrogen (TIN)
annual mean for depth-averagedTIN
annual mean for depth-averagedTIN < 0.5 mg/L
WQO :
annual mean for depth-averagedNH3-N < 0.021 mg/L
WQO :
annual mean for depth-averagedNH3-N
Unionised Ammonia (NH3-N)
TIN (mg/L)
NH3-N (mg/L)
0
0.021
02 03 04 05 06 07 08 09 10 11
NM8
Year
NH3-N (mg/L)
WQO
0
0.25
0.5
02 03 04 05 06 07 08 09 10 11
NM8
Year
TIN (mg/L)
WQO
NH3-N (mg/L)
NM60
0.021
02 03 04 05 06 07 08 09 10 11
Year
WQO
0
0.25
0.5
02 03 04 05 06 07 08 09 10 11
NM6
Year
TIN (mg/L)
WQO
0
0.021
02 03 04 05 06 07 08 09 10 11
NM2
Year
NH3-N (mg/L)
WQO
0
0.25
0.5
02 03 04 05 06 07 08 09 10 11
NM2
Year
TIN (mg/L)
WQO
0
0.021
02 03 04 05 06 07 08 09 10 11
Year
NH3-N (mg/L)
WQO
NM10
0.25
0.5
02 03 04 05 06 07 08 09 10 11
NM1
Year
TIN (mg/L)
WQO
0
0.021
02 03 04 05 06 07 08 09 10 11
NM3
Year
NH3-N (mg/L)
WQO
0
0.25
0.5
02 03 04 05 06 07 08 09 10 11
NM3
Year
TIN (mg/L)
WQO
0
0.021
02 03 04 05 06 07 08 09 10 11
NM5
Year
NH3-N (mg/L)
WQO
0
0.25
0.5
02 03 04 05 06 07 08 09 10 11
NM5
Year
TIN (mg/L)
WQO
0
0.5 WQO0.5
0
0
0.021 WQO0.021
0
0 . 0 1
0 . 0 1
0 . 0 1
0 . 0 1
0 . 0 1
0 . 0 1
Levels of compliance with key Water Quality Objectives in the North WesternWCZ (continued)
N
NM2NM3
NM5
NM6
NM1
NM8
Tuen Mun
LantauIsland
NorthWestern

Appendix D
MARINE WATER QUALITY IN HONG KONG IN 2011 D - 1
Monitoring Station MM1 MM2 MM3 MM4 MM5 MM6 MM7
1991 1991 1991 1991 1991 1991 1991I I I I I I I
2011 2011 2011 2011 2011 2011 2011Parameter Water Depth 21 21 21 21 21 21 21
Surface - - - - - - -Temperature (℃) Middle - - - - - - -
Bottom - - - - - - -Average - - - - - - -Surface - - - - - - -
Salinity Middle - - - - - - -Bottom - - - - - - -Average - - - - - - -Surface - - - - - - -
Dissolved Oxygen (mg/L) Middle - - - - - - -Bottom - - - - - - -Average - - - - - - -Surface - - - - - - -
Dissolved Oxygen (%) Middle - - - - - - -Bottom - - - - - - -Average - - - - - - -Surface - - - - - - -
pH Middle - - - - - - -Bottom - - - - - - -Average - - - - - - -
Secchi disc depth (m) -Surface - - - - - -
Turbidity (NTU) Middle - - - - - -Bottom - - - - - - -Average - - - - - -Surface - - - - -
Suspended Solids (mg/L) Middle - - - -Bottom - - - -Average - - -Surface - - - -
Volatile suspended solids (mg/L) Middle - - - -Bottom - - - - -Average - - -Surface - - - - -
5-day Biochemical Oxygen Demand (mg/L) Middle - - - - - - -Bottom - - - - - - -Average - - - - - - -Surface - - - - - -
Ammonia nitrogen (mg/L) Middle - - - - - -Bottom - - - - - - -Average - - - - - -Surface - - - -
Unionised Ammonia (mg/L) Middle - - - - -Bottom - - - - - - -Average - - - - - -Surface - - - - - - -
Nitrite nitrogen (mg/L) Middle - - - - - - -Bottom - - - - - - -Average - - - - - - -Surface - - - - - -
Nitrate nitrogen (mg/L) Middle - - - - - -Bottom - - - - -Average - - - - - -Surface - - - - - - -
Total inorganic nitrogen (mg/L) Middle - - - - - - -Bottom - - - - - - -Average - - - - - - -Surface - - - -
Total Kjeldahl nitrogen (mg/L) Middle - - - - - -Bottom - - -Average - - - -Surface - - - - -
Total nitrogen (mg/L) Middle - - - -Bottom - - - -Average - - - - -Surface
Orthophosphate phosphorus (mg/L) MiddleBottomAverageSurface - - - - -
Total phosphorus (mg/L) Middle - - -BottomAverageSurface - - -
Silica (mg/L) Middle -BottomAverageSurface - -
Chlorophyll-a (μg/L) Middle -Bottom - - -Average -Surface - - - - - - -
E. coli (cfu/100mL) Middle - - - - - -Bottom - - - - - -Average - - - - - - -Surface - - - - - - -
Faecal coliforms (cfu/100mL) Middle - - - - - - -Bottom - - - - - - -Average - - - - - -
Note: 1. Results of the Seasonal Kendall Test statistically significant at p < 0.05Note: 2. - indicates no significant trendNote: 3. significant increaseNote: 4. significant decrease
Results of the Seasonal Kendall Test for water quality trends in the Mirs Bay WCZ, 1991 - 2011
Monitoring Period
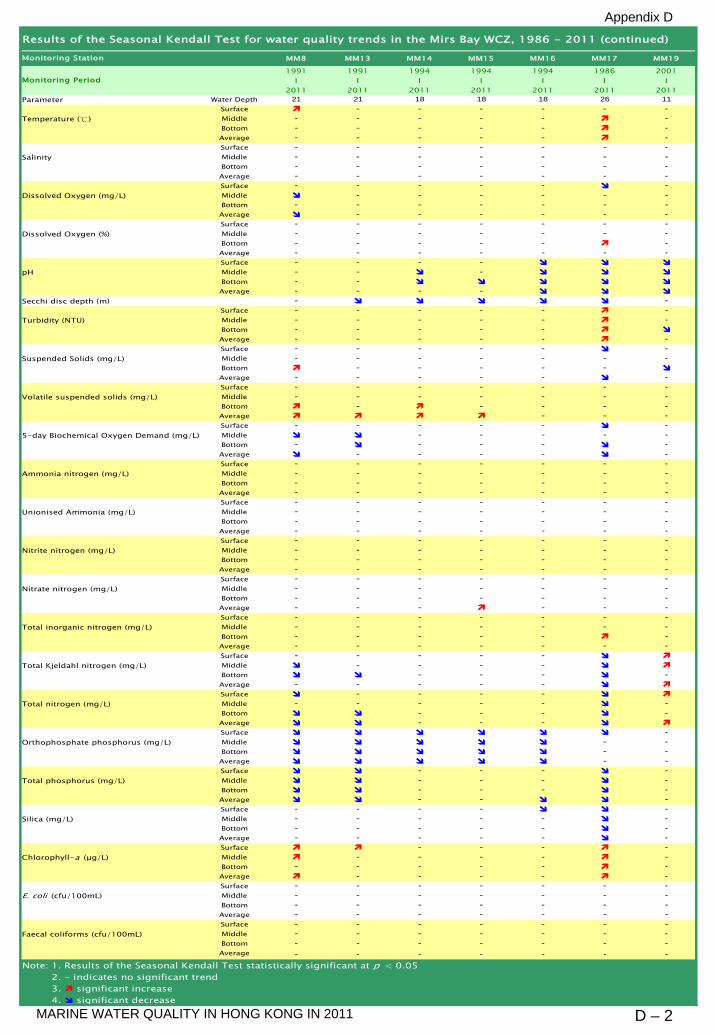
Appendix D
MARINE WATER QUALITY IN HONG KONG IN 2011 D – 2
MM8 MM13 MM14 MM15 MM16 MM17 MM19
1991 1991 1994 1994 1994 1986 2001I I I I I I I
2011 2011 2011 2011 2011 2011 2011Parameter Water Depth 21 21 18 18 18 26 11
Surface - - - - - -Temperature (℃) Middle - - - - - -
Bottom - - - - - -Average - - - - - -Surface - - - - - - -
Salinity Middle - - - - - - -Bottom - - - - - - -Average - - - - - - -Surface - - - - - -
Dissolved Oxygen (mg/L) Middle - - - - - -Bottom - - - - - - -Average - - - - - -Surface - - - - - - -
Dissolved Oxygen (%) Middle - - - - - - -Bottom - - - - - -Average - - - - - - -Surface - - - -
pH Middle - - -Bottom - -Average - - - -
Secchi disc depth (m) - -Surface - - - - - -
Turbidity (NTU) Middle - - - - - -Bottom - - - - -Average - - - - - -Surface - - - - - -
Suspended Solids (mg/L) Middle - - - - - - -Bottom - - - - -Average - - - - - -Surface - - - - - - -
Volatile suspended solids (mg/L) Middle - - - - - - -Bottom - - - - -Average - - -Surface - - - - - -
5-day Biochemical Oxygen Demand (mg/L) Middle - - - - -Bottom - - - - -Average - - - - -Surface - - - - - - -
Ammonia nitrogen (mg/L) Middle - - - - - - -Bottom - - - - - - -Average - - - - - - -Surface - - - - - - -
Unionised Ammonia (mg/L) Middle - - - - - - -Bottom - - - - - - -Average - - - - - - -Surface - - - - - - -
Nitrite nitrogen (mg/L) Middle - - - - - - -Bottom - - - - - - -Average - - - - - - -Surface - - - - - - -
Nitrate nitrogen (mg/L) Middle - - - - - - -Bottom - - - - - - -Average - - - - - -Surface - - - - - - -
Total inorganic nitrogen (mg/L) Middle - - - - - - -Bottom - - - - - -Average - - - - - - -Surface - - - - -
Total Kjeldahl nitrogen (mg/L) Middle - - - -Bottom - - - -Average - - - - -Surface - - - -
Total nitrogen (mg/L) Middle - - - - - -Bottom - - - -Average - - -Surface -
Orthophosphate phosphorus (mg/L) Middle - -Bottom - -Average - -Surface - - - -
Total phosphorus (mg/L) Middle - - - -Bottom - - - -Average - - -Surface - - - - -
Silica (mg/L) Middle - - - - - -Bottom - - - - - -Average - - - - - -Surface - - - -
Chlorophyll-a (μg/L) Middle - - - - -Bottom - - - - - -Average - - - - -Surface - - - - - - -
E. coli (cfu/100mL) Middle - - - - - - -Bottom - - - - - - -Average - - - - - - -Surface - - - - - - -
Faecal coliforms (cfu/100mL) Middle - - - - - - -Bottom - - - - - - -Average - - - - - - -
Note: 1. Results of the Seasonal Kendall Test statistically significant at p < 0.05Note: 2. - indicates no significant trendNote: 3. significant increaseNote: 4. significant decrease
Results of the Seasonal Kendall Test for water quality trends in the Mirs Bay WCZ, 1986 - 2011 (continued)
Monitoring Period
Monitoring Station

Appendix D
MARINE WATER QUALITY IN HONG KONG IN 2011 D - 3
PM1 PM2 PM3 PM4 PM6 PM7 PM8 PM9 PM11
1986 1986 1986 1986 1986 1986 1986 1986 1993I I I I I I I I I
2011 2011 2011 2011 2011 2011 2011 2011 2011Parameter Water Depth 26 26 26 26 26 26 26 26 19
Surface - -Temperature (℃) Middle - -
Bottom -Average -Surface - - - - - - - -
Salinity Middle - - - - - - - - -Bottom - - - - - - - - -Average - - - - - - - - -Surface - -
Dissolved Oxygen (mg/L) Middle - - - - - - - - -Bottom - - - - - - - -Average - - - - - - - - -Surface - - - - - - - - -
Dissolved Oxygen (%) Middle - - - - - - - -Bottom - - - - -Average - - - - - - - -Surface
pH Middle -Bottom - -Average
Secchi disc depth (m) - - - - - -Surface -
Turbidity (NTU) Middle - -Bottom -Average -Surface - - -
Suspended Solids (mg/L) Middle - - - -Bottom - - - - - -Average - - -Surface - - - - - - - - -
Volatile suspended solids (mg/L) Middle - - - - - - - - -Bottom - - - - - - - -Average - - - - - - - -Surface - - - - - - -
5-day Biochemical Oxygen Demand (mg/L) Middle - - - - - - - -Bottom - - - - - - - - -Average - - - - - - -Surface - - - - - - - -
Ammonia nitrogen (mg/L) Middle - - - - - - - - -Bottom - - - - - - - - -Average - - - - - - - - -Surface - - - - - - -
Unionised Ammonia (mg/L) Middle - - - - - -Bottom - - - - - - - -Average - - - - - -Surface - - - - - - - - -
Nitrite nitrogen (mg/L) Middle - - - - - - - - -Bottom - - - - - - - - -Average - - - - - - - -Surface - - - - - - - - -
Nitrate nitrogen (mg/L) Middle - - - - - - - -Bottom - - - - -Average - - - - - -Surface - - - - - - - - -
Total inorganic nitrogen (mg/L) Middle - - - - - - - - -Bottom - - - - - - - - -Average - - - - - - - - -Surface -
Total Kjeldahl nitrogen (mg/L) Middle -Bottom -Average -Surface -
Total nitrogen (mg/L) Middle -Bottom -Average -Surface
Orthophosphate phosphorus (mg/L) Middle - - -Bottom - - -Average -Surface - - - - -
Total phosphorus (mg/L) Middle - - - - -Bottom -AverageSurface - - -
Silica (mg/L) Middle - -Bottom - - - - - -Average - - -Surface - -
Chlorophyll-a (μg/L) Middle - -Bottom - -Average - - -Surface - - - - - - -
E. coli (cfu/100mL) Middle - - - - - - -Bottom - - - - - - - -Average - - - - - -Surface - - - - - - - -
Faecal coliforms (cfu/100mL) Middle - - - - - - - -Bottom - - - - - - - -Average - - - - - -
Note: 1. Results of the Seasonal Kendall Test statistically significant at p < 0.05Note: 2. - indicates no significant trendNote: 3. significant increaseNote: 4. significant decrease
Results of the Seasonal Kendall Test for water quality trends in the Port Shelter WCZ, 1986 - 2011
Monitoring Period
Monitoring Station

Appendix D
MARINE WATER QUALITY IN HONG KONG IN 2011 D - 4
TM2 TM3 TM4 TM5 TM6 TM7 TM8
1986 1986 1986 1988 1986 1988 1986I I I I I I I
2011 2011 2011 2011 2011 2011 2011Parameter Water Depth 26 26 26 24 26 24 26
SurfaceTemperature (℃) Middle NA NA
BottomAverageSurface
Salinity Middle NA - NA - - -Bottom - - - - -Average - -Surface -
Dissolved Oxygen (mg/L) Middle NA - - NA - - -Bottom - -Average - - - - - - -Surface -
Dissolved Oxygen (%) Middle NA - - NA -Bottom -Average - - - - - -Surface
pH Middle NA NABottomAverage
Secchi disc depth (m) -Surface - - - - - -
Turbidity (NTU) Middle NA - - NA -Bottom - - -Average - - - - -Surface
Suspended Solids (mg/L) Middle NA NABottom - -AverageSurface - -
Volatile suspended solids (mg/L) Middle NA NA - -Bottom - - - -Average - - -Surface
5-day Biochemical Oxygen Demand (mg/L) Middle NA NABottom - -AverageSurface
Ammonia nitrogen (mg/L) Middle NA NA -Bottom -Average -Surface
Unionised Ammonia (mg/L) Middle NA NA -Bottom -AverageSurface - - - - -
Nitrite nitrogen (mg/L) Middle NA NA - -Bottom - -Average -Surface
Nitrate nitrogen (mg/L) Middle NA NA -Bottom -Average -Surface
Total inorganic nitrogen (mg/L) Middle NA NA -Bottom -Average -Surface
Total Kjeldahl nitrogen (mg/L) Middle NA NABottomAverageSurface
Total nitrogen (mg/L) Middle NA NABottomAverageSurface
Orthophosphate phosphorus (mg/L) Middle NA NABottom -AverageSurface
Total phosphorus (mg/L) Middle NA NABottomAverageSurface - - - - - - -
Silica (mg/L) Middle NA - - NA -Bottom - - - - -Average - - - - - -Surface - - -
Chlorophyll-a (μg/L) Middle NA - - NA - - -Bottom - - - - -Average - - - - -Surface - -
E. coli (cfu/100mL) Middle NA NA - -Bottom - -Average -Surface - - - - -
Faecal coliforms (cfu/100mL) Middle NA NA - -Bottom - - -Average - - -
Note: 1. Results of the Seasonal Kendall Test statistically significant at p < 0.05Note: 2. - indicates no significant trendNote: 3. NA (Not Applicable) indicates the measurement was not made due to shallow waterNote: 4. significant increaseNote: 5. significant decrease
Results of the Seasonal Kendall Test for water quality trends in the Tolo Habour and Channel WCZ, 1986 - 2011
Monitoring Period
Monitoring Station

Appendix D
MARINE WATER QUALITY IN HONG KONG IN 2011 D - 5
SM1 SM2 SM3 SM4 SM5 SM6 SM7 SM9
1986 1986 1986 1986 1986 1986 1986 1988I I I I I I I I
2011 2011 2011 2011 2011 2011 2011 2011Parameter Water Depth 26 26 26 26 26 26 26 24
Surface - -Temperature (℃) Middle -
Bottom - -Average - - -Surface - - - - - - - -
Salinity Middle - - - - - - - -Bottom - - - - - - - -Average - - - - - - - -Surface - - - - - - -
Dissolved Oxygen (mg/L) Middle - - - - - - -Bottom - - - - - - -Average - - - - - - -Surface - - - - - - - -
Dissolved Oxygen (%) Middle - - - - - - - -Bottom - - - - - - - -Average - - - - - - -Surface - -
pH Middle - - -Bottom - -Average - - -
Secchi disc depth (m) - - - - - - -Surface - - - - -
Turbidity (NTU) Middle - - - - -Bottom - - - - - -Average - - - - - -Surface - - - - - - - -
Suspended Solids (mg/L) Middle - - - - - - - -Bottom - - - - - - - -Average - - - - - - - -Surface - - - - - - - -
Volatile suspended solids (mg/L) Middle - - - - - - - -Bottom - - - - - - - -Average - - - - - - - -Surface - - - - - - - -
5-day Biochemical Oxygen Demand (mg/L) Middle - - - - - - - -Bottom - - - - - - - -Average - - - - - - - -Surface - - - - - - -
Ammonia nitrogen (mg/L) Middle - - - - - -Bottom - - - - - - -Average - - - - - - -Surface - - - - - - - -
Unionised Ammonia (mg/L) Middle - - - - - - -Bottom - - - - - - - -Average - - - - - - -Surface
Nitrite nitrogen (mg/L) Middle -Bottom - - - - -Average -Surface - -
Nitrate nitrogen (mg/L) Middle - -Bottom - - - - -Average -Surface - - -
Total inorganic nitrogen (mg/L) Middle - - -Bottom - - - - -Average - - -Surface -
Total Kjeldahl nitrogen (mg/L) Middle -BottomAverage -Surface - - - -
Total nitrogen (mg/L) Middle - - - - -Bottom - - - -Average - - - - -Surface - -
Orthophosphate phosphorus (mg/L) Middle - - - - -Bottom - - - - - -Average - -Surface -
Total phosphorus (mg/L) Middle -BottomAverageSurface - - - - - - -
Silica (mg/L) Middle - - - - - - -Bottom - - - - - - - -Average - - - - - - -Surface - - - - - -
Chlorophyll-a (μg/L) Middle - - - - - - -Bottom - - - - - - -Average - - - - - - -Surface - - - - - - - -
E. coli (cfu/100mL) Middle - - - - - - - -Bottom - - - - - - -Average - - - - - - -Surface - - - - -
Faecal coliforms (cfu/100mL) Middle - - - - -Bottom - - - - -Average - - - -
Note: 1. Results of the Seasonal Kendall Test statistically significant at p < 0.05Note: 2. - indicates no significant trendNote: 3. significant increaseNote: 4. significant decrease
Monitoring Period
Monitoring Station
Results of the Seasonal Kendall Test for water quality trends in the Southern WCZ, 1986 - 2011
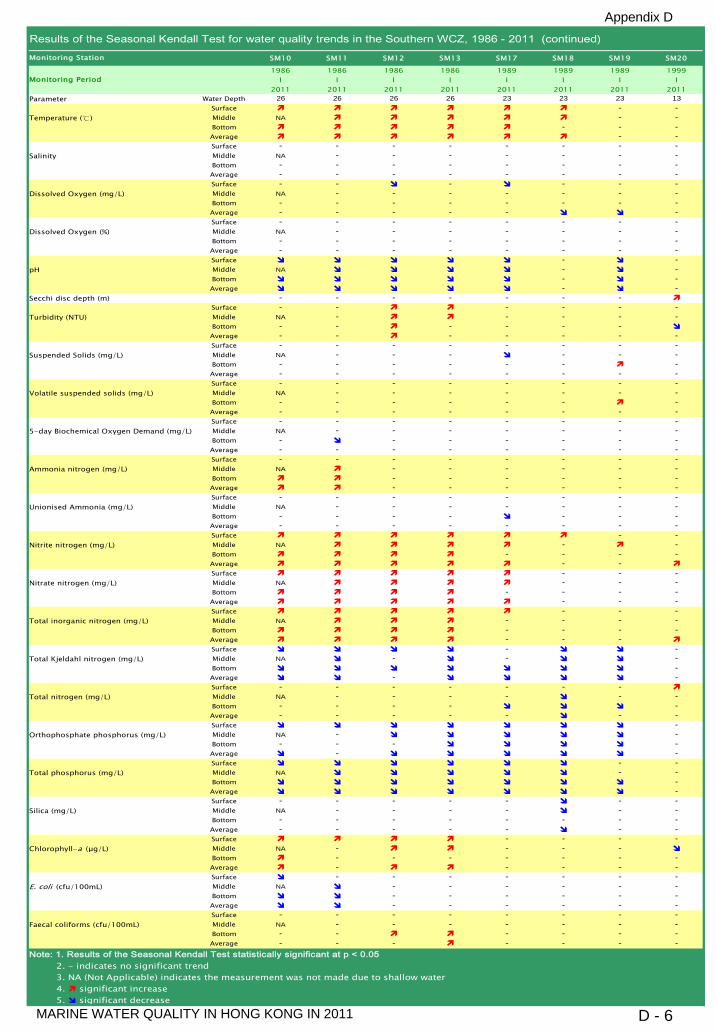
Appendix D
MARINE WATER QUALITY IN HONG KONG IN 2011 D - 6
SM10 SM11 SM12 SM13 SM17 SM18 SM19 SM20
1986 1986 1986 1986 1989 1989 1989 1999I I I I I I I I
2011 2011 2011 2011 2011 2011 2011 2011Parameter Water Depth 26 26 26 26 23 23 23 13
Surface - -Temperature (℃) Middle NA - -
Bottom - - -Average - -Surface - - - - - - - -
Salinity Middle NA - - - - - - -Bottom - - - - - - - -Average - - - - - - - -Surface - - - - - -
Dissolved Oxygen (mg/L) Middle NA - - - - - - -Bottom - - - - - - - -Average - - - - - -Surface - - - - - - - -
Dissolved Oxygen (%) Middle NA - - - - - - -Bottom - - - - - - - -Average - - - - - - - -Surface - -
pH Middle NA - -Bottom - -Average - -
Secchi disc depth (m) - - - - - - -Surface - - - - - -
Turbidity (NTU) Middle NA - - - - -Bottom - - - - - -Average - - - - - - -Surface - - - - - - - -
Suspended Solids (mg/L) Middle NA - - - - - -Bottom - - - - - - -Average - - - - - - - -Surface - - - - - - - -
Volatile suspended solids (mg/L) Middle NA - - - - - - -Bottom - - - - - - -Average - - - - - - - -Surface - - - - - - - -
5-day Biochemical Oxygen Demand (mg/L) Middle NA - - - - - - -Bottom - - - - - - -Average - - - - - - - -Surface - - - - - - - -
Ammonia nitrogen (mg/L) Middle NA - - - - - -Bottom - - - - - -Average - - - - - -Surface - - - - - - - -
Unionised Ammonia (mg/L) Middle NA - - - - - - -Bottom - - - - - - -Average - - - - - - - -Surface - -
Nitrite nitrogen (mg/L) Middle NA - -Bottom - - - -Average - -Surface - - -
Nitrate nitrogen (mg/L) Middle NA - - -Bottom - - - -Average - - -Surface - - -
Total inorganic nitrogen (mg/L) Middle NA - - - -Bottom - - - -Average - - -Surface - -
Total Kjeldahl nitrogen (mg/L) Middle NA - - -Bottom -Average - -Surface - - - - - - -
Total nitrogen (mg/L) Middle NA - - - - - -Bottom - - - - -Average - - - - - - -Surface -
Orthophosphate phosphorus (mg/L) Middle NA - -Bottom - - - -Average - -Surface - -
Total phosphorus (mg/L) Middle NA - -Bottom -Average -Surface - - - - - - -
Silica (mg/L) Middle NA - - - - - -Bottom - - - - - - - -Average - - - - - - -Surface - - - -
Chlorophyll-a (μg/L) Middle NA - - - -Bottom - - - - - - -Average - - - - -Surface - - - - - - -
E. coli (cfu/100mL) Middle NA - - - - - -Bottom - - - - - -Average - - - - - -Surface - - - - - - - -
Faecal coliforms (cfu/100mL) Middle NA - - - - - - -Bottom - - - - - -Average - - - - - - -
Note: 1. Results of the Seasonal Kendall Test statistically significant at p < 0.05Note: 2. - indicates no significant trendNote: 3. NA (Not Applicable) indicates the measurement was not made due to shallow waterNote: 4. significant increaseNote: 5. significant decrease
Results of the Seasonal Kendall Test for water quality trends in the Southern WCZ, 1986 - 2011 (continued)
Monitoring Period
Monitoring Station
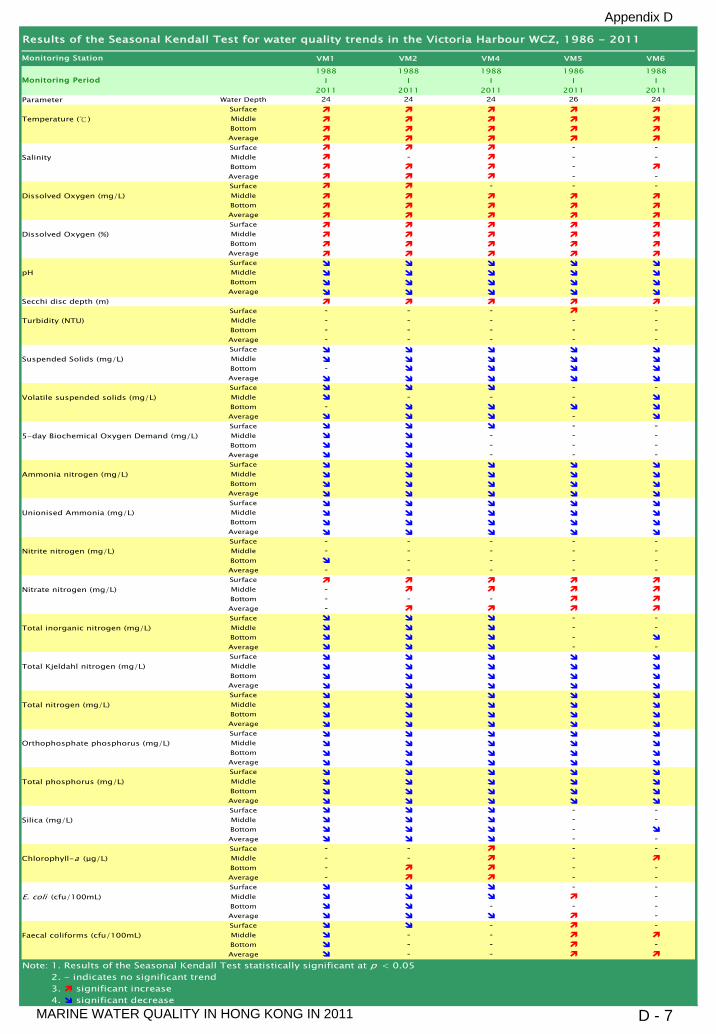
Appendix D
MARINE WATER QUALITY IN HONG KONG IN 2011 D - 7
VM1 VM2 VM4 VM5 VM6
1988 1988 1988 1986 1988I I I I I
2011 2011 2011 2011 2011Parameter Water Depth 24 24 24 26 24
SurfaceTemperature (℃) Middle
BottomAverageSurface - -
Salinity Middle - - -Bottom -Average - -Surface - - -
Dissolved Oxygen (mg/L) MiddleBottomAverageSurface
Dissolved Oxygen (%) MiddleBottomAverageSurface
pH MiddleBottomAverage
Secchi disc depth (m)Surface - - - -
Turbidity (NTU) Middle - - - - -Bottom - - - - -Average - - - - -Surface
Suspended Solids (mg/L) MiddleBottom -AverageSurface - -
Volatile suspended solids (mg/L) Middle - - -Bottom -Average -Surface - -
5-day Biochemical Oxygen Demand (mg/L) Middle - - -Bottom - - -Average - - -Surface
Ammonia nitrogen (mg/L) MiddleBottomAverageSurface
Unionised Ammonia (mg/L) MiddleBottomAverageSurface - - - - -
Nitrite nitrogen (mg/L) Middle - - - - -Bottom - - - -Average - - - - -Surface
Nitrate nitrogen (mg/L) Middle -Bottom - - -Average -Surface - -
Total inorganic nitrogen (mg/L) Middle - -Bottom -Average - -Surface
Total Kjeldahl nitrogen (mg/L) MiddleBottomAverageSurface
Total nitrogen (mg/L) MiddleBottomAverageSurface
Orthophosphate phosphorus (mg/L) MiddleBottomAverageSurface
Total phosphorus (mg/L) MiddleBottomAverageSurface - -
Silica (mg/L) Middle - -Bottom -Average - -Surface - - - -
Chlorophyll-a (μg/L) Middle - - -Bottom - - -Average - - -Surface - -
E. coli (cfu/100mL) Middle -Bottom - - -Average -Surface - -
Faecal coliforms (cfu/100mL) Middle - -Bottom - - -Average - -
Note: 1. Results of the Seasonal Kendall Test statistically significant at p < 0.05Note: 2. - indicates no significant trendNote: 3. significant increaseNote: 4. significant decrease
Results of the Seasonal Kendall Test for water quality trends in the Victoria Harbour WCZ, 1986 - 2011
Monitoring Period
Monitoring Station

Appendix D
MARINE WATER QUALITY IN HONG KONG IN 2011 D - 8
VM7 VM8 VM12 VM14 VM15
1986 1986 1986 1986 1993I I I I I
2011 2011 2011 2011 2011Parameter Water Depth 26 26 26 26 19
Surface -Temperature (℃) Middle -
Bottom -Average -Surface - - - - -
Salinity Middle - - - - -Bottom - - - - -Average - - - - -Surface - - -
Dissolved Oxygen (mg/L) Middle -Bottom -Average -Surface - -
Dissolved Oxygen (%) Middle -Bottom -Average -Surface -
pH Middle -Bottom -Average -
Secchi disc depth (m)Surface - - -
Turbidity (NTU) Middle - - - -Bottom - - - -Average - - -Surface - -
Suspended Solids (mg/L) Middle - -Bottom - - -Average - -Surface - - - -
Volatile suspended solids (mg/L) Middle - - -Bottom - - - -Average - - -Surface - - -
5-day Biochemical Oxygen Demand (mg/L) Middle - - -Bottom - - - -Average - - -Surface
Ammonia nitrogen (mg/L) MiddleBottom - -AverageSurface - -
Unionised Ammonia (mg/L) Middle -Bottom -Average -Surface
Nitrite nitrogen (mg/L) Middle -Bottom - - -Average -Surface
Nitrate nitrogen (mg/L) MiddleBottom -AverageSurface - - -
Total inorganic nitrogen (mg/L) Middle - -Bottom - -Average - - -Surface
Total Kjeldahl nitrogen (mg/L) MiddleBottomAverageSurface -
Total nitrogen (mg/L) Middle -BottomAverage -Surface -
Orthophosphate phosphorus (mg/L) Middle -BottomAverage -Surface
Total phosphorus (mg/L) MiddleBottomAverageSurface - - -
Silica (mg/L) Middle - - - -Bottom - - - -Average - - -Surface - - - -
Chlorophyll-a (μg/L) Middle - - - - -Bottom - - - - -Average - - - - -Surface -
E. coli (cfu/100mL) Middle - -Bottom - -Average -Surface - - -
Faecal coliforms (cfu/100mL) Middle - - -Bottom - -Average - - -
Note: 1. Results of the Seasonal Kendall Test statistically significant at p < 0.05Note: 2. - indicates no significant trendNote: 3. significant increaseNote: 4. significant decrease
Results of the Seasonal Kendall Test for water quality trends in the Victoria Harbour WCZ, 1986 - 2011 (continued)
Monitoring Period
Monitoring Station

Appendix D
MARINE WATER QUALITY IN HONG KONG IN 2011 D - 9
EM1 EM2 EM3
1986 1986 1988I I I
2011 2011 2011Parameter Water Depth 26 26 24
SurfaceTemperature (℃) Middle
BottomAverageSurface -
Salinity Middle -Bottom -Average - -Surface - - -
Dissolved Oxygen (mg/L) Middle - - -Bottom - - -Average - - -Surface - -
Dissolved Oxygen (%) Middle -Bottom - -Average -Surface - -
pH Middle -BottomAverage -
Secchi disc depth (m) - - -Surface
Turbidity (NTU) Middle -BottomAverageSurface - -
Suspended Solids (mg/L) Middle - -Bottom - -Average - -Surface - - -
Volatile suspended solids (mg/L) Middle - -Bottom - - -Average - -Surface - -
5-day Biochemical Oxygen Demand (mg/L) Middle -Bottom - -Average - -Surface
Ammonia nitrogen (mg/L) MiddleBottom -AverageSurface
Unionised Ammonia (mg/L) MiddleBottomAverageSurface - -
Nitrite nitrogen (mg/L) Middle -BottomAverageSurface - - -
Nitrate nitrogen (mg/L) Middle - - -Bottom - - -Average - - -Surface -
Total inorganic nitrogen (mg/L) Middle -Bottom -Average -Surface
Total Kjeldahl nitrogen (mg/L) MiddleBottomAverageSurface
Total nitrogen (mg/L) MiddleBottomAverageSurface
Orthophosphate phosphorus (mg/L) MiddleBottomAverageSurface
Total phosphorus (mg/L) MiddleBottomAverageSurface - -
Silica (mg/L) Middle - - -Bottom - - -Average - - -Surface - - -
Chlorophyll-a (μg/L) Middle - - -Bottom - - -Average - - -Surface
E. coli (cfu/100mL) MiddleBottomAverageSurface
Faecal coliforms (cfu/100mL) MiddleBottomAverage
Note: 1. Results of the Seasonal Kendall Test statistically significant at p < 0.05Note: 2. - indicates no significant trendNote: 3. significant increaseNote: 4. significant decrease
Results of the Seasonal Kendall Test for water quality trends in the Eastern Buffer WCZ, 1986 - 2011
Monitoring Period
Monitoring Station

Appendix D
MARINE WATER QUALITY IN HONG KONG IN 2011 D - 10
WM1 WM2 WM3 WM4
1988 1988 1986 1986I I I I
2011 2011 2011 2011Parameter Water Depth 24 24 26 26
SurfaceTemperature (℃) Middle
BottomAverageSurface - -
Salinity Middle - - -Bottom - - -Average - -Surface - - - -
Dissolved Oxygen (mg/L) Middle - - - -Bottom - - - -Average - - - -Surface - - - -
Dissolved Oxygen (%) Middle - - - -Bottom - - - -Average - - - -Surface -
pH MiddleBottomAverage
Secchi disc depth (m) - - -Surface - - - -
Turbidity (NTU) Middle - - -Bottom - - -Average - - -Surface - - -
Suspended Solids (mg/L) Middle - - - -Bottom - - -Average - - - -Surface - - - -
Volatile suspended solids (mg/L) Middle - - - -Bottom - - - -Average - - - -Surface - - - -
5-day Biochemical Oxygen Demand (mg/L) Middle - - - -Bottom - - - -Average - - - -Surface - - -
Ammonia nitrogen (mg/L) Middle - -Bottom - - -Average - -Surface - - - -
Unionised Ammonia (mg/L) Middle - - -Bottom - -Average - - -Surface
Nitrite nitrogen (mg/L) Middle -Bottom - - -Average - -Surface -
Nitrate nitrogen (mg/L) Middle -Bottom - -Average -Surface -
Total inorganic nitrogen (mg/L) Middle -Bottom - - -Average -Surface
Total Kjeldahl nitrogen (mg/L) MiddleBottomAverageSurface -
Total nitrogen (mg/L) Middle -BottomAverageSurface - -
Orthophosphate phosphorus (mg/L) Middle -Bottom - -Average - -Surface
Total phosphorus (mg/L) MiddleBottomAverageSurface - -
Silica (mg/L) Middle - - - -Bottom - - - -Average - -Surface -
Chlorophyll-a (μg/L) Middle -Bottom -Average -Surface -
E. coli (cfu/100mL) Middle -Bottom -Average -Surface -
Faecal coliforms (cfu/100mL) Middle -Bottom -Average -
Note: 1. Results of the Seasonal Kendall Test statistically significant at p < 0.05Note: 2. - indicates no significant trendNote: 3. significant increaseNote: 4. significant decrease
Results of the Seasonal Kendall Test for water quality trends in the Western Buffer WCZ, 1986 - 2011
Monitoring Period
Monitoring Station

Appendix D
MARINE WATER QUALITY IN HONG KONG IN 2011 D - 11
JM3 JM4
1986 1986I I
2011 2011Parameter Water Depth 26 26
SurfaceTemperature (℃) Middle
BottomAverageSurface - -
Salinity Middle - -Bottom - -Average - -Surface - -
Dissolved Oxygen (mg/L) MiddleBottom -Average - -Surface -
Dissolved Oxygen (%) MiddleBottomAverageSurface
pH MiddleBottomAverage
Secchi disc depth (m) - -Surface
Turbidity (NTU) MiddleBottomAverageSurface -
Suspended Solids (mg/L) Middle - -Bottom - -Average - -Surface - -
Volatile suspended solids (mg/L) Middle - -Bottom - -Average - -Surface - -
5-day Biochemical Oxygen Demand (mg/L) Middle - -Bottom -Average - -Surface
Ammonia nitrogen (mg/L) MiddleBottomAverageSurface
Unionised Ammonia (mg/L) MiddleBottomAverageSurface - -
Nitrite nitrogen (mg/L) Middle -Bottom -Average - -Surface -
Nitrate nitrogen (mg/L) Middle - -Bottom - -Average - -Surface
Total inorganic nitrogen (mg/L) MiddleBottomAverageSurface
Total Kjeldahl nitrogen (mg/L) MiddleBottomAverageSurface
Total nitrogen (mg/L) MiddleBottomAverageSurface
Orthophosphate phosphorus (mg/L) MiddleBottomAverageSurface
Total phosphorus (mg/L) MiddleBottomAverageSurface - -
Silica (mg/L) Middle - -Bottom - -Average - -Surface - -
Chlorophyll-a (μg/L) Middle - -Bottom - -Average - -Surface
E. coli (cfu/100mL) MiddleBottomAverageSurface - -
Faecal coliforms (cfu/100mL) Middle -BottomAverage - -
Note: 1. Results of the Seasonal Kendall Test statistically significant at p < 0.05Note: 2. - indicates no significant trendNote: 3. significant increaseNote: 4. significant decrease
Results of the Seasonal Kendall Test for water quality trends in the Junk Bay WCZ, 1986 - 2011
Monitoring Period
Monitoring Station

Appendix D
MARINE WATER QUALITY IN HONG KONG IN 2011 D - 12
DM1 DM2 DM3 DM4 DM5
1986 1986 1986 1986 1991I I I I I
2011 2011 2011 2011 2011Parameter Water Depth 26 26 26 26 21
Surface -Temperature (℃) Middle NA NA NA NA
Bottom NA NA NAAverage -Surface - -
Salinity Middle NA NA NA NA -Bottom NA NA NA - -Average - - -Surface - -
Dissolved Oxygen (mg/L) Middle NA NA NA NA -Bottom NA NA NA -Average - -Surface - -
Dissolved Oxygen (%) Middle NA NA NA NA -Bottom NA NA NA -Average - -Surface
pH Middle NA NA NA NABottom NA NA NAAverage
Secchi disc depth (m) - - - -Surface - -
Turbidity (NTU) Middle NA NA NA NABottom NA NA NA - -Average - - - -Surface - - - -
Suspended Solids (mg/L) Middle NA NA NA NA -Bottom NA NA NA -Average - - - -Surface - - - -
Volatile suspended solids (mg/L) Middle NA NA NA NA -Bottom NA NA NA - -Average - - - -Surface - -
5-day Biochemical Oxygen Demand (mg/L) Middle NA NA NA NA -Bottom NA NA NA - -Average - -Surface
Ammonia nitrogen (mg/L) Middle NA NA NA NABottom NA NA NAAverageSurface - - - -
Unionised Ammonia (mg/L) Middle NA NA NA NA -Bottom NA NA NA -Average - - - -Surface
Nitrite nitrogen (mg/L) Middle NA NA NA NABottom NA NA NAAverageSurface - -
Nitrate nitrogen (mg/L) Middle NA NA NA NABottom NA NA NAAverage - -Surface
Total inorganic nitrogen (mg/L) Middle NA NA NA NABottom NA NA NAAverageSurface - - - -
Total Kjeldahl nitrogen (mg/L) Middle NA NA NA NA -Bottom NA NA NA - -Average - - - -Surface - -
Total nitrogen (mg/L) Middle NA NA NA NA -Bottom NA NA NA -Average - -Surface - - -
Orthophosphate phosphorus (mg/L) Middle NA NA NA NA -Bottom NA NA NA -Average - - -Surface - - -
Total phosphorus (mg/L) Middle NA NA NA NABottom NA NA NA -Average - - -Surface - - -
Silica (mg/L) Middle NA NA NA NA -Bottom NA NA NA - -Average - - - - -Surface - -
Chlorophyll-a (μg/L) Middle NA NA NA NABottom NA NA NAAverage - -Surface - - - -
E. coli (cfu/100mL) Middle NA NA NA NA -Bottom NA NA NA -Average - - - -Surface - - -
Faecal coliforms (cfu/100mL) Middle NA NA NA NA -Bottom NA NA NA -Average - - -
Note: 1. Results of the Seasonal Kendall Test statistically significant at p < 0.05Note: 2. - indicates no significant trendNote: 3. NA (Not Applicable) indicates the measurement was not made due to shallow waterNote: 4. significant increaseNote: 5. significant decrease
Results of the Seasonal Kendall Test for water quality trends in the Deep Bay WCZ, 1986 - 2011
Monitoring Period
Monitoring Station
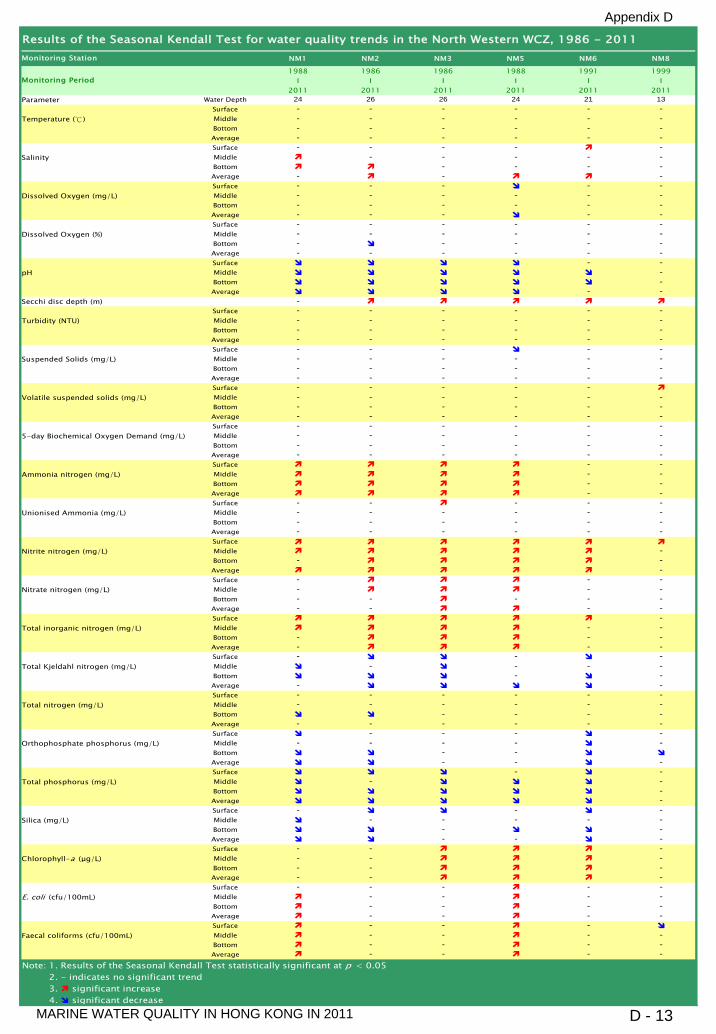
Appendix D
MARINE WATER QUALITY IN HONG KONG IN 2011 D - 13
NM1 NM2 NM3 NM5 NM6 NM8
1988 1986 1986 1988 1991 1999I I I I I I
2011 2011 2011 2011 2011 2011Parameter Water Depth 24 26 26 24 21 13
Surface - - - - - -Temperature (℃) Middle - - - - - -
Bottom - - - - - -Average - - - - - -Surface - - - - -
Salinity Middle - - - - -Bottom - - - -Average - - -Surface - - - - -
Dissolved Oxygen (mg/L) Middle - - - - - -Bottom - - - - - -Average - - - - -Surface - - - - - -
Dissolved Oxygen (%) Middle - - - - - -Bottom - - - - -Average - - - - - -Surface - -
pH Middle -Bottom -Average - -
Secchi disc depth (m) -Surface - - - - - -
Turbidity (NTU) Middle - - - - - -Bottom - - - - - -Average - - - - - -Surface - - - - -
Suspended Solids (mg/L) Middle - - - - - -Bottom - - - - - -Average - - - - - -Surface - - - - -
Volatile suspended solids (mg/L) Middle - - - - - -Bottom - - - - - -Average - - - - - -Surface - - - - - -
5-day Biochemical Oxygen Demand (mg/L) Middle - - - - - -Bottom - - - - - -Average - - - - - -Surface - -
Ammonia nitrogen (mg/L) Middle - -Bottom - -Average - -Surface - - - - -
Unionised Ammonia (mg/L) Middle - - - - - -Bottom - - - - - -Average - - - - - -Surface
Nitrite nitrogen (mg/L) Middle -Bottom - -Average -Surface - - -
Nitrate nitrogen (mg/L) Middle - - -Bottom - - - - -Average - - - -Surface -
Total inorganic nitrogen (mg/L) Middle - -Bottom - - -Average - - -Surface - - -
Total Kjeldahl nitrogen (mg/L) Middle - - - -Bottom - -Average - -Surface - - - - - -
Total nitrogen (mg/L) Middle - - - - - -Bottom - - - -Average - - - - - -Surface - - - -
Orthophosphate phosphorus (mg/L) Middle - - - - -Bottom - -Average - - -Surface - -
Total phosphorus (mg/L) Middle - -Bottom -Average -Surface - - -
Silica (mg/L) Middle - - - - -Bottom - -Average - - -Surface - - -
Chlorophyll-a (μg/L) Middle - - -Bottom - - -Average - - -Surface - - - - -
E. coli (cfu/100mL) Middle - - - -Bottom - - - -Average - - - -Surface - - -
Faecal coliforms (cfu/100mL) Middle - - - -Bottom - - - -Average - - - -
Note: 1. Results of the Seasonal Kendall Test statistically significant at p < 0.05Note: 2. - indicates no significant trendNote: 3. significant increaseNote: 4. significant decrease
Results of the Seasonal Kendall Test for water quality trends in the North Western WCZ, 1986 - 2011
Monitoring Period
Monitoring Station

Appendix E
MARINE WATER QUALITY IN HONG KONG IN 2011 E - 1
BufferSubzone
ChannelSubzone
Parameter TS2 TS3 TS4 TS5 SS1 SS2 SS3 SS410 10 10 10 10 10 10 1069 80 66 88 73 80 75 86
(58 - 81) (65 - 98) (53 - 76) (80 - 97) (61 - 93) (62 - 94) (66 - 83) (69 - 98)-298 -295 -301 -340 -175 -184 -181 -174
(-354 - -241) (-348 - -258) (-376 - -231) (-380 - -262) (-382 - -82) (-362 - -88) (-366 - -64) (-385 - -68)37 34 40 31 58 49 51 47
(32 - 40) (29 - 43) (30 - 61) (28 - 37) (47 - 63) (46 - 60) (40 - 54) (42 - 55)Total Volatile Soilds (%w/w) 8.7 8.5 8.3 9.9 5.4 6.3 6.4 6.1
(7.6 - 10.0) (6.8 - 10.0) (4.7 - 9.6) (9.4 - 11.0) (4.6 - 6.2) (5.4 - 7.0) (5.8 - 8.5) (4.9 - 7.1)20800 19900 18000 17400 9670 11880 15180 13900
(17000 - 24000) (15000 - 23000) (14000 - 21000) (15000 - 20000) (7700 - 12000) (9800 - 14000) (9800 - 18000) (11000 - 16000)0.9 0.7 1.0 0.8 0.9 0.7 0.9 0.6
(0.7 - 1.1) (0.6 - 0.8) (0.8 - 1.3) (0.7 - 1.0) (0.7 - 1.0) (0.6 - 0.9) (0.6 - 1.1) (0.5 - 0.7)6.7 2.8 7.7 12.3 6.3 4.5 5.1 3.4
(1.0 - 13.0) (<0.1 - 6.7) (3.2 - 15.0) (7.6 - 21.0) (2.2 - 15.0) (0.1 - 6.8) (0.8 - 11.0) (1.0 - 8.8)560 530 620 710 370 450 380 440
(420 - 690) (350 - 630) (400 - 810) (590 - 870) (210 - 440) (290 - 600) (320 - 470) (260 - 710)170 160 170 200 220 220 210 200
(140 - 190) (140 - 190) (130 - 190) (160 - 230) (110 - 290) (160 - 290) (150 - 240) (150 - 290)56 57 71 76 8 14 15 22
(8 - 120) (10 - 160) (11 - 220) (21 - 170) (5 - 15) (1 - 44) (3 - 55) (2 - 73)0.2 0.2 0.2 0.2 <0.1 0.1 0.1 0.1
(0.1 - 0.3) (0.1 - 0.3) (0.1 - 0.3) (0.1 - 0.2) (0.1 - <0.1) (0.1 - 0.2) (0.1 - 0.2) (0.1 - 0.2)8.6 9.4 7.0 6.0 6.8 8.4 7.1 7.8
(5.9 - 10.0) (7.4 - 11.0) (5.7 - 8.0) (5.3 - 6.6) (6.1 - 7.9) (7.9 - 9.5) (5.8 - 8.4) (7.1 - 8.9)0.5 0.6 0.4 0.3 <0.1 <0.1 <0.1 <0.1
(0.2 - 0.8) (0.3 - 0.7) (0.2 - 0.5) (0.3 - 0.3) (0.1 - <0.1) (0.1 - <0.1) (0.1 - <0.1) (0.1 - <0.1)25 24 22 33 23 31 31 37
(19 - 27) (20 - 29) (16 - 27) (31 - 37) (20 - 28) (27 - 38) (25 - 39) (31 - 47)32 36 21 21 10 19 18 31
(15 - 50) (24 - 59) (15 - 36) (17 - 25) (9 - 13) (16 - 22) (14 - 25) (26 - 38)79 88 58 49 26 34 34 41
(66 - 89) (76 - 99) (43 - 68) (46 - 54) (22 - 31) (30 - 41) (28 - 46) (32 - 46)0.07 0.07 0.06 0.06 0.05 0.09 0.10 0.13
(0.05 - 0.10) (0.05 - 0.10) (0.05 - 0.07) (0.05 - 0.08) (0.05 - 0.06) (0.06 - 0.13) (0.07 - 0.15) (0.10 - 0.20)16 15 15 24 16 21 21 22
(12 - 21) (12 - 20) (11 - 24) (19 - 31) (14 - 21) (18 - 26) (17 - 26) (19 - 25)0.4 0.5 0.2 <0.2 <0.2 0.2 <0.2 0.4
(0.2 - 0.6) (0.3 - 0.7) (0.2 - 0.3) (0.2 - <0.2) (0.2 - <0.2) (0.2 - 0.3) (0.2 - <0.2) (0.3 - 0.4)210 250 140 120 67 94 87 110
(130 - 320) (140 - 370) (82 - 190) (110 - 150) (51 - 81) (77 - 110) (68 - 120) (94 - 140)18 18 18 18 18 18 18 18
(18 - 18) (18 - 18) (18 - 18) (18 - 18) (18 - 18) (18 - 18) (18 - 18) (18 - 18)90 90 93 95 94 98 95 99
(90 - 90) (90 - 94) (90 - 110) (90 - 140) (90 - 120) (90 - 150) (90 - 110) (90 - 160)46 47 39 55 61 73 60 110
(24 - 63) (26 - 69) (24 - 65) (28 - 72) (25 - 230) (34 - 210) (22 - 130) (57 - 160)Note: 1
23
4
5
6 Low and high molecular weight PAHs results are derived from the summation of the corresponding congeners. If the concentration of acongener is below report limit (RL), the result will be taken as 0.5xRL in the calculation.
Summary statistics for bottom sediment quality in the Tolo Harbour and Channel and SouthernWCZs, 2007 - 2011
Arsenic (mg/kg)
Chemical Oxygen Demand (mg/kg)
Total Carbon (%w/w)
Ammonical Nitrogen (mg/kg)
West LammaChannel
Tolo Harbour and Channel
Harbour Subzone
Hong Kong Island
Number of samples
Particle Size Fractionation <63µm (%w/w)
Electrochemical Potential (mV)
(South)
Total Solids (%w/w)
Total Kjeldahl Nitrogen (mg/kg)
Total Phosphorus (mg/kg)
Total Sulphide (mg/kg)
Total Cyanide (mg/kg)
Cadmium (mg/kg)
Chromium (mg/kg)
Copper (mg/kg)
Lead (mg/kg)
Mercury (mg/kg)
Nickel (mg/kg)
Silver (mg/kg)
Zinc (mg/kg)
Total Polychlorinated Biphenyls (PCBs)(µg/kg) (3)
Low Molecular Weight Polycylic AromaticHydrocarbons (PAHs) (µg/kg) (4)
High Molecular Weight Polycylic AromaticHydrocarbons (PAHs) (µg/kg) (5) (6)
High molecular weight polyaromatic hydrocarbons (PAHs) include 10 congeners of molecular weight above 200, namely : Fluoranthene,Pyrene, Benzo(a)anthracene, Chrysene, Benzo(b)fluoranthene, Benzo(k)fluoranthene, Benzo(a)pyrene, Dibenzo(a,h)anthracene,Benzo(g,h,i)perylene and Indeno(1,2,3-cd)pyrene.
Data presented are arithmetic means ; data in brackets indicate ranges.All data are based on the analyses of bulk (unsieved) sediment and are reported on a dry weight basis unless stated otherwise.Total PCBs results are derived from the summation of 18 congeners. If the concentration of a congener is below report limit (RL), the resultwill be taken as 0.5xRL in the calculation.
Low molecular weight polyaromatic hydrocarbons (PAHs) include 6 congeners of molecular weight below 200, namely : Acenaphthene,Acenaphthylene, Anthracene, Flourene, Naphthalene and Phenanthrene.

Appendix E
MARINE WATER QUALITY IN HONG KONG IN 2011 E - 2
Junk Bay
(East) (South)Parameter SS5 SS6 JS2 DS1 DS2 DS3 DS4
10 10 10 10 10 10 1091 69 85 60 63 77 63
(85 - 98) (52 - 87) (68 - 96) (18 - 94) (17 - 82) (44 - 95) (40 - 80)-185 -140 -167 -228 -191 -220 -195
(-258 - -115) (-270 - -71) (-265 - -115) (-298 - -154) (-228 - -105) (-396 - -115) (-370 - -93)39 64 44 51 47 48 55
(38 - 41) (62 - 66) (40 - 51) (37 - 61) (41 - 53) (42 - 67) (48 - 63)7.2 3.8 6.3 5.9 6.3 6.3 5.5
(6.8 - 7.7) (3.2 - 4.5) (5.6 - 7.0) (3.3 - 8.8) (5.0 - 8.5) (3.2 - 8.1) (4.7 - 6.7)14100 9310 14300 21900 17500 12880 13200
(12000 - 17000) (6900 - 18000) (11000 - 18000) (16000 - 29000) (13000 - 22000) (9900 - 16000) (10000 - 16000)0.6 0.5 0.7 0.7 0.8 0.5 0.6
(0.5 - 0.6) (0.4 - 0.6) (0.6 - 0.8) (0.5 - 1.2) (0.5 - 1.3) (0.4 - 0.6) (0.4 - 0.9)7.9 4.3 3.5 120.2 8.8 1.6 5.1
(0.1 - 15.0) (1.2 - 9.4) (0.1 - 8.2) (12.0 - 600.0) (0.1 - 42.0) (<0.1 - 4.5) (0.1 - 14.0)480 320 460 620 420 310 260
(300 - 580) (260 - 500) (320 - 550) (320 - 1700) (260 - 680) (160 - 450) (100 - 490)190 200 190 330 280 200 150
(130 - 220) (180 - 240) (150 - 210) (230 - 530) (120 - 490) (100 - 280) (60 - 220)30 3 22 300 94 19 25
(2 - 93) (1 - 7) (2 - 81) (1 - 960) (1 - 360) (0 - 83) (1 - 140)0.1 0.1 0.2 0.3 0.2 0.2 0.1
(0.1 - 0.2) (0.1 - 0.3) (0.1 - 0.2) (0.2 - 0.5) (0.1 - 0.4) (0.1 - 0.3) (0.1 - 0.2)7.5 5.4 7.4 9.2 11.7 11.7 11.7
(6.6 - 8.0) (4.4 - 6.0) (6.7 - 8.5) (7.1 - 12.0) (8.6 - 15.0) (5.5 - 15.0) (9.7 - 15.0)<0.1 <0.1 0.1 0.4 0.3 0.1 <0.1
(0.1 - <0.1) (0.1 - <0.1) (0.1 - 0.2) (0.2 - 0.7) (0.1 - 0.6) (0.1 - 0.2) (0.1 - <0.1)42 21 44 45 44 39 35
(38 - 45) (17 - 23) (39 - 49) (35 - 66) (28 - 79) (22 - 53) (26 - 49)37 10 85 84 60 69 31
(33 - 42) (8 - 13) (73 - 100) (47 - 210) (28 - 100) (27 - 230) (10 - 65)51 24 49 54 50 45 39
(42 - 56) (20 - 28) (41 - 54) (42 - 84) (32 - 84) (32 - 61) (27 - 51)0.15 0.08 0.23 0.17 0.16 0.11 0.08
(0.13 - 0.16) (0.05 - 0.18) (0.17 - 0.29) (0.08 - 0.40) (0.11 - 0.26) (0.05 - 0.16) (0.05 - 0.14)26 13 23 37 25 25 20
(24 - 29) (11 - 17) (19 - 31) (19 - 140) (17 - 37) (12 - 33) (15 - 29)0.5 <0.2 1.7 1.0 0.7 0.4 0.3
(0.4 - 0.6) (0.2 - <0.2) (1.4 - 2.0) (0.5 - 2.9) (0.2 - 1.6) (0.2 - 0.6) (0.2 - 0.4)140 57 140 260 200 130 97
(120 - 160) (44 - 73) (110 - 150) (150 - 560) (100 - 420) (65 - 170) (63 - 140)18 18 18 18 18 18 18
(18 - 18) (18 - 18) (18 - 20) (18 - 18) (18 - 18) (18 - 18) (18 - 18)92 91 98 200 96 93 92
(90 - 100) (90 - 94) (90 - 110) (90 - 540) (90 - 120) (90 - 99) (90 - 100)83 23 280 870 150 90 48
(63 - 100) (21 - 29) (90 - 430) (140 - 4100) (23 - 360) (34 - 280) (16 - 91)Note: 1
23
4
5
6
Total Volatile Soilds (%w/w)
Summary statistics for bottom sediment quality in the Southern, Junk Bay and Deep BayWCZs, 2007 - 2011
Inner Deep Bay Outer Deep Bay
Total Solids (%w/w)
Number of samples
Particle Size Fractionation <63µm (%w/w)
Electrochemical Potential (mV)
Lantau Island
Chemical Oxygen Demand (mg/kg)
Total Cyanide (mg/kg)
Arsenic (mg/kg)
Cadmium (mg/kg)
Total Kjeldahl Nitrogen (mg/kg)
Total Phosphorus (mg/kg)
Total Sulphide (mg/kg)
Total Carbon (%w/w)
Ammonical Nitrogen (mg/kg)
Chromium (mg/kg)
Total PCBs results are derived from the summation of 18 congeners. If the concentration of a congener is below report limit (RL), the result will be takenas 0.5xRL in the calculation.
Copper (mg/kg)
Lead (mg/kg)
Mercury (mg/kg)
Nickel (mg/kg)
Low molecular weight polyaromatic hydrocarbons (PAHs) include 6 congeners of molecular weight below 200, namely : Acenaphthene, Acenaphthylene,Anthracene, Flourene, Naphthalene and Phenanthrene.
Silver (mg/kg)
High molecular weight polyaromatic hydrocarbons (PAHs) include 10 congeners of molecular weight above 200, namely : Fluoranthene, Pyrene,Benzo(a)anthracene, Chrysene, Benzo(b)fluoranthene, Benzo(k)fluoranthene, Benzo(a)pyrene, Dibenzo(a,h)anthracene, Benzo(g,h,i)perylene andIndeno(1,2,3-cd)pyrene.
Low and high molecular weight PAHs results are derived from the summation of the corresponding congeners. If the concentration of a congener isbelow report limit (RL), the result will be taken as 0.5xRL in the calculation.
Zinc (mg/kg)
Total Polychlorinated Biphenyls (PCBs)(µg/kg) (3)
Low Molecular Weight Polycylic AromaticHydrocarbons (PAHs) (µg/kg) (4)
High Molecular Weight Polycylic AromaticHydrocarbons (PAHs) (µg/kg) (5) (6)
Data presented are arithmetic means ; data in brackets indicate ranges.All data are based on the analyses of bulk (unsieved) sediment and are reported on a dry weight basis unless stated otherwise.

Appendix E
MARINE WATER QUALITY IN HONG KONG IN 2011 E - 3
Port Island Mirs Bay
(North)Parameter PS3 PS5 PS6 MS1 MS2 MS7 MS17 MS3
10 10 10 10 10 10 10 1087 59 73 86 91 92 87 78
(58 - 94) (24 - 92) (48 - 91) (64 - 95) (76 - 99) (83 - 96) (77 - 94) (45 - 93)-211 -158 -174 -246 -265 -332 -215 -218
(-310 - -39) (-381 - -21) (-378 - -65) (-367 - -121) (-367 - -109) (-368 - -277) (-295 - -63) (-371 - -113)37 51 52 40 33 30 35 47
(35 - 41) (38 - 63) (46 - 55) (36 - 45) (31 - 34) (27 - 35) (32 - 41) (38 - 61)Total Volatile Soilds (%w/w) 10.7 7.6 7.3 7.1 8.3 9.5 8.6 6.5
(8.5 - 12.0) (4.7 - 10.0) (6.4 - 8.3) (6.4 - 7.8) (7.5 - 9.4) (8.9 - 11.0) (7.8 - 9.3) (3.1 - 8.9)17300 11690 12100 15200 15200 16500 15300 12790
(14000 - 20000) (9900 - 14000) (11000 - 14000) (11000 - 19000) (13000 - 17000) (13000 - 19000) (13000 - 18000) (9900 - 17000)1.2 1.9 1.4 0.7 0.6 0.7 0.8 0.7
(1.0 - 1.4) (0.9 - 3.7) (1.1 - 1.6) (0.6 - 0.8) (0.5 - 0.8) (0.6 - 0.9) (0.6 - 1.0) (0.5 - 1.1)5.0 6.5 11.3 6.3 9.9 9.5 4.4 5.3
(0.1 - 11.0) (1.3 - 11.0) (0.4 - 60.0) (0.1 - 13.0) (0.1 - 20.0) (4.8 - 14.0) (0.2 - 7.1) (1.4 - 10.0)560 420 440 440 560 600 640 410
(340 - 680) (210 - 680) (210 - 580) (290 - 520) (460 - 610) (340 - 710) (580 - 740) (250 - 510)170 160 190 160 170 180 200 150
(110 - 210) (83 - 210) (89 - 230) (95 - 190) (150 - 190) (140 - 210) (180 - 220) (100 - 170)14 8 16 44 31 24 13 17
(4 - 41) (1 - 23) (1 - 98) (11 - 120) (1 - 69) (2 - 96) (1 - 35) (2 - 54)0.1 0.1 <0.1 0.2 0.2 0.2 0.2 0.1
(0.1 - 0.2) (0.1 - 0.2) (0.1 - <0.1) (0.1 - 0.2) (0.1 - 0.2) (0.1 - 0.2) (0.1 - 0.2) (0.1 - 0.2)5.7 4.1 5.7 8.2 7.1 6.7 6.3 6.3
(4.8 - 6.3) (0.2 - 5.6) (5.2 - 6.5) (6.9 - 9.2) (5.7 - 7.9) (5.8 - 7.6) (5.6 - 6.9) (5.0 - 7.3)<0.1 <0.1 <0.1 0.3 0.3 0.2 <0.1 <0.1
(0.1 - <0.1) (0.1 - <0.1) (0.1 - <0.1) (0.1 - 0.4) (0.1 - 0.3) (0.1 - 0.5) (0.1 - <0.1) (0.1 - <0.1)26 22 24 28 36 35 33 27
(20 - 34) (13 - 31) (20 - 30) (25 - 32) (33 - 39) (31 - 39) (29 - 38) (19 - 35)20 11 11 29 21 20 16 13
(12 - 25) (6 - 16) (9 - 14) (20 - 39) (14 - 23) (16 - 26) (14 - 19) (10 - 17)36 28 30 47 46 43 44 34
(30 - 41) (15 - 38) (26 - 35) (41 - 56) (39 - 51) (38 - 48) (40 - 49) (24 - 42)0.08 0.05 <0.05 0.07 0.06 0.07 0.06 0.06
(0.07 - 0.10) (0.05 - 0.06) (0.05 - <0.05) (0.06 - 0.10) (0.05 - 0.07) (0.06 - 0.09) (0.05 - 0.07) (0.05 - 0.13)18 16 18 18 24 24 24 19
(15 - 21) (9 - 24) (15 - 22) (16 - 20) (21 - 25) (22 - 27) (21 - 28) (13 - 23)0.2 <0.2 <0.2 0.9 0.3 0.2 <0.2 <0.2
(0.2 - 0.3) (0.2 - <0.2) (0.2 - <0.2) (0.5 - 1.4) (0.2 - 0.5) (0.2 - 0.3) (0.2 - <0.2) (0.2 - <0.2)91 66 66 100 100 100 96 74
(69 - 130) (29 - 93) (51 - 82) (88 - 130) (92 - 120) (82 - 120) (87 - 110) (51 - 96)18 18 18 18 18 18 18 18
(18 - 18) (18 - 18) (18 - 18) (18 - 18) (18 - 18) (18 - 18) (18 - 18) (18 - 18)96 93 94 96 91 98 93 92
(90 - 140) (90 - 110) (90 - 130) (90 - 140) (90 - 100) (90 - 160) (90 - 110) (90 - 100)60 28 25 55 40 69 36 28
(38 - 82) (19 - 36) (20 - 40) (28 - 190) (25 - 51) (28 - 170) (29 - 44) (18 - 67)Note: 1
23
4
5
6 Low and high molecular weight PAHs results are derived from the summation of the corresponding congeners. If the concentration of acongener is below report limit (RL), the result will be taken as 0.5xRL in the calculation.
Summary statistics for bottom sediment quality in the Port Shelter and Mirs BayWCZs, 2007 - 2011
Arsenic (mg/kg)
Chemical Oxygen Demand (mg/kg)
Total Carbon (%w/w)
Ammonical Nitrogen (mg/kg)
Inner PortShelter
OuterPort Shelter
StarlingInlet
Crooked Island
Number of samples
Particle Size Fractionation <63µm (%w/w)
Electrochemical Potential (mV)
Total Solids (%w/w)
Total Kjeldahl Nitrogen (mg/kg)
Total Phosphorus (mg/kg)
Total Sulphide (mg/kg)
Total Cyanide (mg/kg)
Cadmium (mg/kg)
Chromium (mg/kg)
Copper (mg/kg)
Lead (mg/kg)
Mercury (mg/kg)
Nickel (mg/kg)
Silver (mg/kg)
Zinc (mg/kg)
Total Polychlorinated Biphenyls (PCBs)(µg/kg) (3)
Low Molecular Weight Polycylic AromaticHydrocarbons (PAHs) (µg/kg) (4)
High Molecular Weight Polycylic AromaticHydrocarbons (PAHs) (µg/kg) (5) (6)
Data presented are arithmetic means ; data in brackets indicate ranges.All data are based on the analyses of bulk (unsieved) sediment and are reported on a dry weight basis unless stated otherwise.Total PCBs results are derived from the summation of 18 congeners. If the concentration of a congener is below report limit (RL), the resultwill be taken as 0.5xRL in the calculation.
Low molecular weight polyaromatic hydrocarbons (PAHs) include 6 congeners of molecular weight below 200, namely : Acenaphthene,Acenaphthylene, Anthracene, Flourene, Naphthalene and Phenanthrene.
High molecular weight polyaromatic hydrocarbons (PAHs) include 10 congeners of molecular weight above 200, namely : Fluoranthene,Pyrene, Benzo(a)anthracene, Chrysene, Benzo(b)fluoranthene, Benzo(k)fluoranthene, Benzo(a)pyrene, Dibenzo(a,h)anthracene,Benzo(g,h,i)perylene and Indeno(1,2,3-cd)pyrene.

Appendix E
MARINE WATER QUALITY IN HONG KONG IN 2011 E - 4
Mirs Bay
(South)Parameter MS4 MS5 MS6 MS8 MS13 MS14 MS15 MS16
10 10 10 10 10 10 10 1087 86 92 94 92 92 91 85
(69 - 97) (79 - 94) (81 - 98) (90 - 97) (82 - 99) (84 - 96) (82 - 97) (64 - 96)-190 -168 -247 -157 -152 -155 -150 -154
(-267 - -82) (-253 - -95) (-300 - -91) (-249 - -92) (-208 - -59) (-250 - -88) (-260 - -106) (-267 - -99)38 43 34 46 50 50 50 55
(33 - 42) (41 - 47) (31 - 39) (44 - 48) (46 - 53) (46 - 56) (44 - 57) (49 - 61)Total Volatile Soilds (%w/w) 7.6 7.1 9.7 6.2 5.9 5.6 5.9 5.5
(6.3 - 8.6) (6.6 - 8.0) (9.0 - 11.0) (5.6 - 7.1) (5.7 - 6.3) (4.9 - 6.3) (5.4 - 6.5) (4.7 - 6.0)14100 13200 16500 11030 10310 10620 9980 10910
(12000 - 16000) (10000 - 17000) (12000 - 21000) (8800 - 18000) (8100 - 18000) (7700 - 18000) (8000 - 21000) (7800 - 27000)0.7 0.7 0.9 0.6 0.6 0.5 0.6 0.6
(0.6 - 0.8) (0.6 - 0.8) (0.7 - 1.0) (0.5 - 0.7) (0.5 - 0.6) (0.5 - 0.6) (0.5 - 0.6) (0.6 - 0.7)5.3 4.9 7.1 2.7 1.9 1.8 2.8 3.4
(0.9 - 22.0) (0.1 - 9.6) (4.7 - 10.0) (0.4 - 6.9) (0.7 - 3.1) (0.1 - 4.0) (0.2 - 5.4) (1.6 - 5.7)500 490 670 410 340 380 430 380
(430 - 590) (390 - 560) (580 - 770) (270 - 480) (200 - 460) (200 - 510) (310 - 500) (240 - 540)180 190 200 200 190 200 220 210
(150 - 190) (160 - 210) (180 - 230) (150 - 230) (98 - 250) (130 - 240) (180 - 250) (160 - 250)7 11 14 6 43 4 6 7
(1 - 19) (1 - 24) (2 - 44) (1 - 15) (0 - 390) (1 - 9) (1 - 17) (1 - 16)0.1 0.1 0.2 0.1 0.1 0.1 0.1 <0.1
(0.1 - 0.3) (0.1 - 0.2) (0.1 - 0.2) (0.1 - 0.2) (0.1 - 0.2) (0.1 - 0.2) (0.1 - 0.2) (0.1 - <0.1)6.3 6.5 6.0 6.5 6.9 6.7 6.1 6.1
(5.5 - 7.1) (6.1 - 7.0) (5.2 - 6.9) (5.4 - 7.2) (5.7 - 8.1) (5.7 - 7.5) (5.2 - 7.3) (5.3 - 6.6)<0.1 <0.1 0.1 <0.1 <0.1 <0.1 <0.1 <0.1
(0.1 - <0.1) (0.1 - <0.1) (0.1 - 0.2) (0.1 - <0.1) (0.1 - <0.1) (0.1 - <0.1) (0.1 - <0.1) (0.1 - <0.1)34 29 33 30 31 30 27 27
(30 - 38) (25 - 32) (29 - 39) (25 - 35) (27 - 34) (28 - 34) (24 - 30) (21 - 33)14 12 17 12 11 11 10 10
(10 - 16) (10 - 14) (14 - 19) (8 - 16) (9 - 14) (7 - 13) (7 - 12) (6 - 12)38 39 42 33 32 32 29 31
(34 - 44) (31 - 45) (39 - 48) (29 - 42) (27 - 38) (29 - 36) (23 - 33) (26 - 35)0.05 0.05 0.07 0.05 0.05 <0.05 <0.05 <0.05
(0.05 - 0.06) (0.05 - 0.06) (0.05 - 0.11) (0.05 - 0.06) (0.05 - 0.07) (0.05 - <0.05) (0.05 - <0.05) (0.05 - <0.05)24 22 24 22 23 22 20 20
(21 - 31) (18 - 25) (21 - 27) (18 - 26) (20 - 27) (19 - 26) (17 - 24) (17 - 23)<0.2 <0.2 <0.2 <0.2 <0.2 <0.2 <0.2 <0.2
(0.2 - <0.2) (0.2 - <0.2) (0.2 - <0.2) (0.2 - <0.2) (0.2 - <0.2) (0.2 - <0.2) (0.2 - <0.2) (0.2 - <0.2)87 83 100 79 78 78 69 70
(73 - 110) (64 - 100) (89 - 150) (64 - 91) (71 - 85) (66 - 87) (64 - 75) (55 - 84)18 18 18 18 18 18 18 18
(18 - 18) (18 - 18) (18 - 18) (18 - 18) (18 - 18) (18 - 18) (18 - 18) (18 - 18)92 90 93 98 91 91 95 94
(90 - 110) (90 - 90) (90 - 120) (90 - 160) (90 - 95) (90 - 97) (90 - 140) (90 - 120)34 31 53 33 34 26 28 30
(28 - 57) (19 - 63) (29 - 74) (17 - 67) (19 - 59) (19 - 40) (19 - 51) (17 - 91)Note: 1
23
4
5
6
Ammonical Nitrogen (mg/kg)
Low and high molecular weight PAHs results are derived from the summation of the corresponding congeners. If the concentration of acongener is below report limit (RL), the result will be taken as 0.5xRL in the calculation.
Summary statistics for bottom sediment quality in the Mirs Bay WCZ, 2007 - 2011
(North)
Mirs Bay LongHarbour
WaglanIsland
Mirs Bay (Central)
Lead (mg/kg)
Chemical Oxygen Demand (mg/kg)
Total Carbon (%w/w)
Number of samples
Particle Size Fractionation <63µm (%w/w)
Electrochemical Potential (mV)
Total Solids (%w/w)
Total Kjeldahl Nitrogen (mg/kg)
Total Phosphorus (mg/kg)
Total Sulphide (mg/kg)
Total Cyanide (mg/kg)
Arsenic (mg/kg)
Cadmium (mg/kg)
Chromium (mg/kg)
Copper (mg/kg)
Mercury (mg/kg)
Nickel (mg/kg)
Silver (mg/kg)
Zinc (mg/kg)
Total Polychlorinated Biphenyls (PCBs)(µg/kg) (3)
Low Molecular Weight Polycylic AromaticHydrocarbons (PAHs) (µg/kg) (4)
High Molecular Weight Polycylic AromaticHydrocarbons (PAHs) (µg/kg) (5) (6)
Data presented are arithmetic means ; data in brackets indicate ranges.All data are based on the analyses of bulk (unsieved) sediment and are reported on a dry weight basis unless stated otherwise.Total PCBs results are derived from the summation of 18 congeners. If the concentration of a congener is below report limit (RL), the resultwill be taken as 0.5xRL in the calculation.
Low molecular weight polyaromatic hydrocarbons (PAHs) include 6 congeners of molecular weight below 200, namely : Acenaphthene,Acenaphthylene, Anthracene, Flourene, Naphthalene and Phenanthrene.
High molecular weight polyaromatic hydrocarbons (PAHs) include 10 congeners of molecular weight above 200, namely : Fluoranthene,Pyrene, Benzo(a)anthracene, Chrysene, Benzo(b)fluoranthene, Benzo(k)fluoranthene, Benzo(a)pyrene, Dibenzo(a,h)anthracene,Benzo(g,h,i)perylene and Indeno(1,2,3-cd)pyrene.
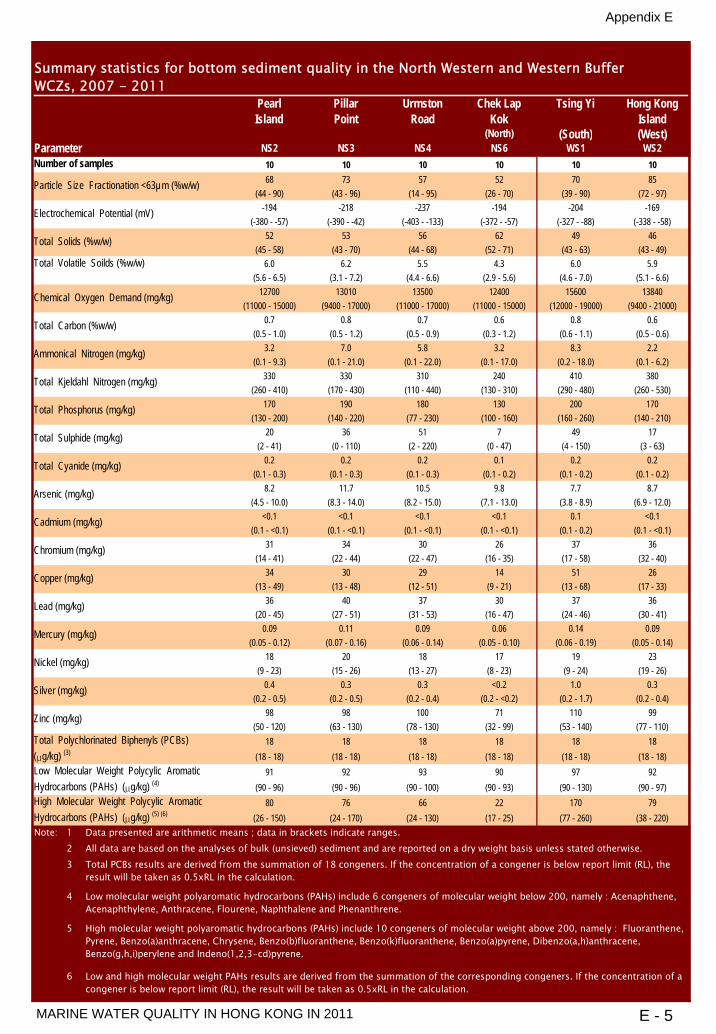
Appendix E
MARINE WATER QUALITY IN HONG KONG IN 2011 E - 5
Chek LapKok
Tsing Yi Hong KongIsland
(North) (South) (West)Parameter NS2 NS3 NS4 NS6 WS1 WS2
10 10 10 10 10 1068 73 57 52 70 85
(44 - 90) (43 - 96) (14 - 95) (26 - 70) (39 - 90) (72 - 97)-194 -218 -237 -194 -204 -169
(-380 - -57) (-390 - -42) (-403 - -133) (-372 - -57) (-327 - -88) (-338 - -58)52 53 56 62 49 46
(45 - 58) (43 - 70) (44 - 68) (52 - 71) (43 - 63) (43 - 49)Total Volatile Soilds (%w/w) 6.0 6.2 5.5 4.3 6.0 5.9
(5.6 - 6.5) (3.1 - 7.2) (4.4 - 6.6) (2.9 - 5.6) (4.6 - 7.0) (5.1 - 6.6)12700 13010 13500 12400 15600 13840
(11000 - 15000) (9400 - 17000) (11000 - 17000) (11000 - 15000) (12000 - 19000) (9400 - 21000)0.7 0.8 0.7 0.6 0.8 0.6
(0.5 - 1.0) (0.5 - 1.2) (0.5 - 0.9) (0.3 - 1.2) (0.6 - 1.1) (0.5 - 0.6)3.2 7.0 5.8 3.2 8.3 2.2
(0.1 - 9.3) (0.1 - 21.0) (0.1 - 22.0) (0.1 - 17.0) (0.2 - 18.0) (0.1 - 6.2)330 330 310 240 410 380
(260 - 410) (170 - 430) (110 - 440) (130 - 310) (290 - 480) (260 - 530)170 190 180 130 200 170
(130 - 200) (140 - 220) (77 - 230) (100 - 160) (160 - 260) (140 - 210)20 36 51 7 49 17
(2 - 41) (0 - 110) (2 - 220) (0 - 47) (4 - 150) (3 - 63)0.2 0.2 0.2 0.1 0.2 0.2
(0.1 - 0.3) (0.1 - 0.3) (0.1 - 0.3) (0.1 - 0.2) (0.1 - 0.2) (0.1 - 0.2)8.2 11.7 10.5 9.8 7.7 8.7
(4.5 - 10.0) (8.3 - 14.0) (8.2 - 15.0) (7.1 - 13.0) (3.8 - 8.9) (6.9 - 12.0)<0.1 <0.1 <0.1 <0.1 0.1 <0.1
(0.1 - <0.1) (0.1 - <0.1) (0.1 - <0.1) (0.1 - <0.1) (0.1 - 0.2) (0.1 - <0.1)31 34 30 26 37 36
(14 - 41) (22 - 44) (22 - 47) (16 - 35) (17 - 58) (32 - 40)34 30 29 14 51 26
(13 - 49) (13 - 48) (12 - 51) (9 - 21) (13 - 68) (17 - 33)36 40 37 30 37 36
(20 - 45) (27 - 51) (31 - 53) (16 - 47) (24 - 46) (30 - 41)0.09 0.11 0.09 0.06 0.14 0.09
(0.05 - 0.12) (0.07 - 0.16) (0.06 - 0.14) (0.05 - 0.10) (0.06 - 0.19) (0.05 - 0.14)18 20 18 17 19 23
(9 - 23) (15 - 26) (13 - 27) (8 - 23) (9 - 24) (19 - 26)0.4 0.3 0.3 <0.2 1.0 0.3
(0.2 - 0.5) (0.2 - 0.5) (0.2 - 0.4) (0.2 - <0.2) (0.2 - 1.7) (0.2 - 0.4)98 98 100 71 110 99
(50 - 120) (63 - 130) (78 - 130) (32 - 99) (53 - 140) (77 - 110)18 18 18 18 18 18
(18 - 18) (18 - 18) (18 - 18) (18 - 18) (18 - 18) (18 - 18)91 92 93 90 97 92
(90 - 96) (90 - 96) (90 - 100) (90 - 93) (90 - 130) (90 - 97)80 76 66 22 170 79
(26 - 150) (24 - 170) (24 - 130) (17 - 25) (77 - 260) (38 - 220)Note: 1
23
4
5
6
Summary statistics for bottom sediment quality in the North Western and Western BufferWCZs, 2007 - 2011
Cadmium (mg/kg)
PearlIsland
PillarPoint
UrmstonRoad
Number of samples
Particle Size Fractionation <63µm (%w/w)
Electrochemical Potential (mV)
Total Solids (%w/w)
Chemical Oxygen Demand (mg/kg)
Total PCBs results are derived from the summation of 18 congeners. If the concentration of a congener is below report limit (RL), theresult will be taken as 0.5xRL in the calculation.
Low molecular weight polyaromatic hydrocarbons (PAHs) include 6 congeners of molecular weight below 200, namely : Acenaphthene,Acenaphthylene, Anthracene, Flourene, Naphthalene and Phenanthrene.
High molecular weight polyaromatic hydrocarbons (PAHs) include 10 congeners of molecular weight above 200, namely : Fluoranthene,Pyrene, Benzo(a)anthracene, Chrysene, Benzo(b)fluoranthene, Benzo(k)fluoranthene, Benzo(a)pyrene, Dibenzo(a,h)anthracene,Benzo(g,h,i)perylene and Indeno(1,2,3-cd)pyrene.
Low and high molecular weight PAHs results are derived from the summation of the corresponding congeners. If the concentration of acongener is below report limit (RL), the result will be taken as 0.5xRL in the calculation.
Total Carbon (%w/w)
Ammonical Nitrogen (mg/kg)
Total Kjeldahl Nitrogen (mg/kg)
Total Phosphorus (mg/kg)
Total Sulphide (mg/kg)
Total Cyanide (mg/kg)
Arsenic (mg/kg)
Chromium (mg/kg)
Copper (mg/kg)
Lead (mg/kg)
Mercury (mg/kg)
Nickel (mg/kg)
High Molecular Weight Polycylic AromaticHydrocarbons (PAHs) (µg/kg) (5) (6)
Data presented are arithmetic means ; data in brackets indicate ranges.All data are based on the analyses of bulk (unsieved) sediment and are reported on a dry weight basis unless stated otherwise.
Silver (mg/kg)
Zinc (mg/kg)
Total Polychlorinated Biphenyls (PCBs)(µg/kg) (3)
Low Molecular Weight Polycylic AromaticHydrocarbons (PAHs) (µg/kg) (4)
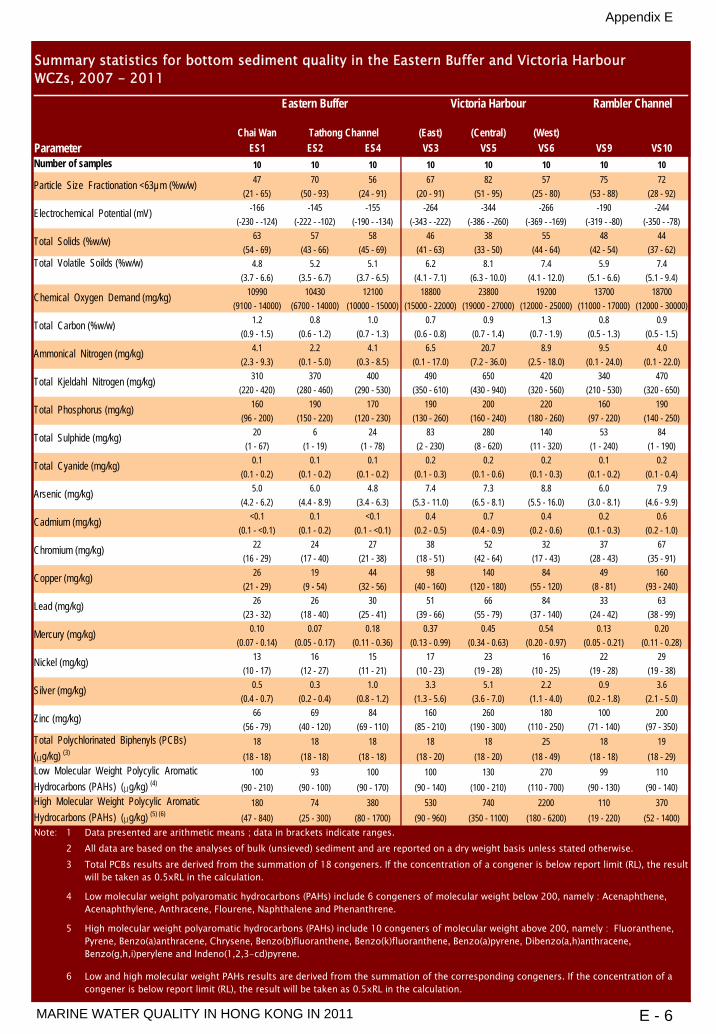
Appendix E
MARINE WATER QUALITY IN HONG KONG IN 2011 E - 6
Chai Wan (East) (Central) (West)Parameter ES1 ES2 ES4 VS3 VS5 VS6 VS9 VS10
10 10 10 10 10 10 10 1047 70 56 67 82 57 75 72
(21 - 65) (50 - 93) (24 - 91) (20 - 91) (51 - 95) (25 - 80) (53 - 88) (28 - 92)-166 -145 -155 -264 -344 -266 -190 -244
(-230 - -124) (-222 - -102) (-190 - -134) (-343 - -222) (-386 - -260) (-369 - -169) (-319 - -80) (-350 - -78)63 57 58 46 38 55 48 44
(54 - 69) (43 - 66) (45 - 69) (41 - 63) (33 - 50) (44 - 64) (42 - 54) (37 - 62)Total Volatile Soilds (%w/w) 4.8 5.2 5.1 6.2 8.1 7.4 5.9 7.4
(3.7 - 6.6) (3.5 - 6.7) (3.7 - 6.5) (4.1 - 7.1) (6.3 - 10.0) (4.1 - 12.0) (5.1 - 6.6) (5.1 - 9.4)10990 10430 12100 18800 23800 19200 13700 18700
(9100 - 14000) (6700 - 14000) (10000 - 15000) (15000 - 22000) (19000 - 27000) (12000 - 25000) (11000 - 17000) (12000 - 30000)1.2 0.8 1.0 0.7 0.9 1.3 0.8 0.9
(0.9 - 1.5) (0.6 - 1.2) (0.7 - 1.3) (0.6 - 0.8) (0.7 - 1.4) (0.7 - 1.9) (0.5 - 1.3) (0.5 - 1.5)4.1 2.2 4.1 6.5 20.7 8.9 9.5 4.0
(2.3 - 9.3) (0.1 - 5.0) (0.3 - 8.5) (0.1 - 17.0) (7.2 - 36.0) (2.5 - 18.0) (0.1 - 24.0) (0.1 - 22.0)310 370 400 490 650 420 340 470
(220 - 420) (280 - 460) (290 - 530) (350 - 610) (430 - 940) (320 - 560) (210 - 530) (320 - 650)160 190 170 190 200 220 160 190
(96 - 200) (150 - 220) (120 - 230) (130 - 260) (160 - 240) (180 - 260) (97 - 220) (140 - 250)20 6 24 83 280 140 53 84
(1 - 67) (1 - 19) (1 - 78) (2 - 230) (8 - 620) (11 - 320) (1 - 240) (1 - 190)0.1 0.1 0.1 0.2 0.2 0.2 0.1 0.2
(0.1 - 0.2) (0.1 - 0.2) (0.1 - 0.2) (0.1 - 0.3) (0.1 - 0.6) (0.1 - 0.3) (0.1 - 0.2) (0.1 - 0.4)5.0 6.0 4.8 7.4 7.3 8.8 6.0 7.9
(4.2 - 6.2) (4.4 - 8.9) (3.4 - 6.3) (5.3 - 11.0) (6.5 - 8.1) (5.5 - 16.0) (3.0 - 8.1) (4.6 - 9.9)<0.1 0.1 <0.1 0.4 0.7 0.4 0.2 0.6
(0.1 - <0.1) (0.1 - 0.2) (0.1 - <0.1) (0.2 - 0.5) (0.4 - 0.9) (0.2 - 0.6) (0.1 - 0.3) (0.2 - 1.0)22 24 27 38 52 32 37 67
(16 - 29) (17 - 40) (21 - 38) (18 - 51) (42 - 64) (17 - 43) (28 - 43) (35 - 91)26 19 44 98 140 84 49 160
(21 - 29) (9 - 54) (32 - 56) (40 - 160) (120 - 180) (55 - 120) (8 - 81) (93 - 240)26 26 30 51 66 84 33 63
(23 - 32) (18 - 40) (25 - 41) (39 - 66) (55 - 79) (37 - 140) (24 - 42) (38 - 99)0.10 0.07 0.18 0.37 0.45 0.54 0.13 0.20
(0.07 - 0.14) (0.05 - 0.17) (0.11 - 0.36) (0.13 - 0.99) (0.34 - 0.63) (0.20 - 0.97) (0.05 - 0.21) (0.11 - 0.28)13 16 15 17 23 16 22 29
(10 - 17) (12 - 27) (11 - 21) (10 - 23) (19 - 28) (10 - 25) (19 - 28) (19 - 38)0.5 0.3 1.0 3.3 5.1 2.2 0.9 3.6
(0.4 - 0.7) (0.2 - 0.4) (0.8 - 1.2) (1.3 - 5.6) (3.6 - 7.0) (1.1 - 4.0) (0.2 - 1.8) (2.1 - 5.0)66 69 84 160 260 180 100 200
(56 - 79) (40 - 120) (69 - 110) (85 - 210) (190 - 300) (110 - 250) (71 - 140) (97 - 350)18 18 18 18 18 25 18 19
(18 - 18) (18 - 18) (18 - 18) (18 - 20) (18 - 20) (18 - 49) (18 - 18) (18 - 29)100 93 100 100 130 270 99 110
(90 - 210) (90 - 100) (90 - 170) (90 - 140) (100 - 210) (110 - 700) (90 - 130) (90 - 140)180 74 380 530 740 2200 110 370
(47 - 840) (25 - 300) (80 - 1700) (90 - 960) (350 - 1100) (180 - 6200) (19 - 220) (52 - 1400)Note: 1
23
4
5
6
Summary statistics for bottom sediment quality in the Eastern Buffer and Victoria HarbourWCZs, 2007 - 2011
Rambler ChannelVictoria HarbourEastern Buffer
Tathong Channel
Total PCBs results are derived from the summation of 18 congeners. If the concentration of a congener is below report limit (RL), the resultwill be taken as 0.5xRL in the calculation.
Low molecular weight polyaromatic hydrocarbons (PAHs) include 6 congeners of molecular weight below 200, namely : Acenaphthene,Acenaphthylene, Anthracene, Flourene, Naphthalene and Phenanthrene.
High molecular weight polyaromatic hydrocarbons (PAHs) include 10 congeners of molecular weight above 200, namely : Fluoranthene,Pyrene, Benzo(a)anthracene, Chrysene, Benzo(b)fluoranthene, Benzo(k)fluoranthene, Benzo(a)pyrene, Dibenzo(a,h)anthracene,Benzo(g,h,i)perylene and Indeno(1,2,3-cd)pyrene.
Low and high molecular weight PAHs results are derived from the summation of the corresponding congeners. If the concentration of acongener is below report limit (RL), the result will be taken as 0.5xRL in the calculation.
Particle Size Fractionation <63µm (%w/w)
Electrochemical Potential (mV)
Total Solids (%w/w)
Chemical Oxygen Demand (mg/kg)
Arsenic (mg/kg)
Cadmium (mg/kg)
Total Carbon (%w/w)
Ammonical Nitrogen (mg/kg)
Total Kjeldahl Nitrogen (mg/kg)
Total Phosphorus (mg/kg)
All data are based on the analyses of bulk (unsieved) sediment and are reported on a dry weight basis unless stated otherwise.
Nickel (mg/kg)
Silver (mg/kg)
Zinc (mg/kg)
Total Polychlorinated Biphenyls (PCBs)(µg/kg) (3)
Number of samples
Low Molecular Weight Polycylic AromaticHydrocarbons (PAHs) (µg/kg) (4)
High Molecular Weight Polycylic AromaticHydrocarbons (PAHs) (µg/kg) (5) (6)
Data presented are arithmetic means ; data in brackets indicate ranges.
Chromium (mg/kg)
Copper (mg/kg)
Lead (mg/kg)
Mercury (mg/kg)
Total Sulphide (mg/kg)
Total Cyanide (mg/kg)

Appendix F
MARINE WATER QUALITY IN HONG KONG IN 2011 F - 1
0 5 10km
DS1
DS2
DS3
DS4
NS4
NS3
NS6
NS2
WS1
WS2SS5
SS6SS4
SS3
SS2
SS1
VS10
VS9
VS6VS5 VS3
ES1
ES2
MS8
MS13
MS14
PS6
PS5
PS3
TS2
TS3 TS4
TS5
MS16
MS15
MS17
MS7 MS5
MS4MS2
MS3
MS1
N
JS2
ES4
MS6
New Territories
Lantau Island Hong Kong Island
Kowloon
Mean particle size fractionation <63 µm levels in marine sediments in Hong Kong, 2007 – 2011
0 5 10km
DS1
DS2
DS3
DS4
NS4
NS3
NS6
NS2
WS1
WS2SS5
SS6SS4
SS3
SS2
SS1
VS10
VS9
VS6VS5 VS3
ES1
ES2
MS8
MS13
MS14
PS6
PS5
PS3
TS2
TS3 TS4
TS5
MS16
MS15
MS17
MS7 MS5
MS4MS2
MS3
MS1
N
JS2
ES4
MS6
New Territories
Hong Kong Island
Kowloon
Lantau Island
Lantau Island
ShenzhenParticle Size
Fractionation <63μm(%w/w)
>80
40 - 80
<40
Shenzhen
Mean cadmium levels in marine sediments in Hong Kong, 2007 – 2011
Cadmium(mg/kg dry weight)
> 4.0
1.6 – 4.0
0 - 1.5
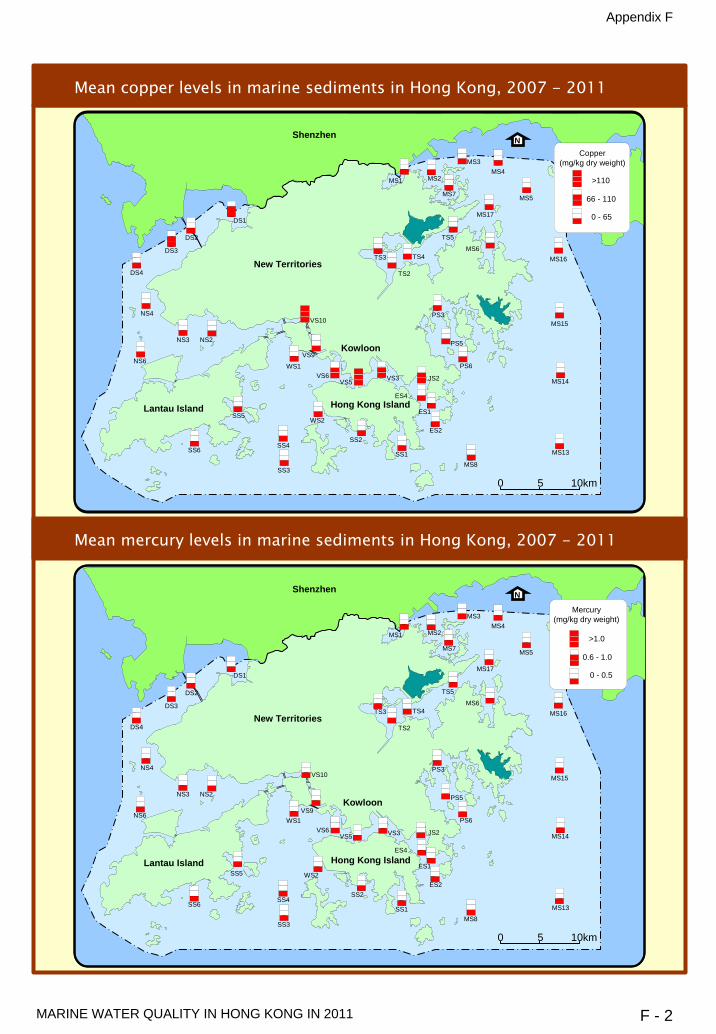
Appendix F
MARINE WATER QUALITY IN HONG KONG IN 2011 F - 2
0 5 10km
DS1
DS2
DS3
DS4
NS4
NS3
NS6
NS2
WS1
WS2SS5
SS6SS4
SS3
SS2
SS1
VS10
VS9
VS6VS5 VS3
ES1
ES2
MS8
MS13
MS14
PS6
PS5
PS3
TS2
TS3 TS4
TS5
MS16
MS15
MS17
MS7 MS5
MS4MS2
MS3
MS1
N
JS2
ES4
MS6
New Territories
Hong Kong Island
Kowloon
0 5 10km
DS1
DS2
DS3
DS4
NS4
NS3
NS6
NS2
WS1
WS2SS5
SS6SS4
SS3
SS2
SS1
VS10
VS9
VS6VS5 VS3
ES1
ES2
MS8
MS13
MS14
PS6
PS5
PS3
TS2
TS3 TS4
TS5
MS16
MS15
MS17
MS7 MS5
MS4MS2
MS3
MS1
N
JS2
ES4
MS6
New Territories
Lantau Island Hong Kong Island
Kowloon
Mean mercury levels in marine sediments in Hong Kong, 2007 - 2011
Mean copper levels in marine sediments in Hong Kong, 2007 - 2011
Lantau Island
Shenzhen
Copper(mg/kg dry weight)
>110
66 - 110
0 - 65
Mercury(mg/kg dry weight)
>1.0
0.6 - 1.0
0 - 0.5
Shenzhen
Lantau Island

Appendix F
MARINE WATER QUALITY IN HONG KONG IN 2011 F - 3
0 5 10km
DS1
DS2
DS3
DS4
NS4
NS3
NS6
NS2
WS1
WS2
SS6SS4
SS3
SS2
SS1
VS10
VS9
VS6VS5 VS3
ES1
ES2
MS8
MS13
MS14
PS6
PS5
PS3
TS2
TS3 TS4
TS5
MS16
MS15
MS17
MS7 MS5
MS4MS2
MS3
MS1
N
JS2
ES4
MS6
New Territories
Lantau Island Hong Kong Island
Kowloon
0 5 10km
DS1
DS2
DS3
DS4
NS4
NS3
NS6
NS2
WS1
WS2
SS6SS4
SS3
SS2
SS1
VS10
VS9
VS6VS5 VS3
ES1
ES2
MS8
MS13
MS14
PS6
PS5
PS3
TS2
TS3 TS4
TS5
MS16
MS15
MS17
MS7 MS5
MS4MS2
MS3
MS1
N
JS2
ES4
MS6
New Territories
Lantau Island Hong Kong Island
Kowloon
Mean silver levels in marine sediments in Hong Kong, 2007 - 2011
Mean total polychlorinated biphenyls (PCBs) levels in marine sediments in Hong Kong, 2007 - 2011
Lantau Island
Lantau IslandSS5
SS5
Silver(mg/kg dry weight)
>2
1.1 - 2
0 - 1
Shenzhen
Shenzhen
Total PCBs(μg/kg dry weight)
>180
24 - 180
0 - 23

Appendix F
MARINE WATER QUALITY IN HONG KONG IN 2011 F - 4
0 5 10km
DS1
DS2
DS3
DS4
NS4
NS3
NS6
NS2
WS1
WS2
SS6SS4
SS3
SS2
SS1
VS10
VS9
VS6VS5 VS3
ES1
ES2
MS8
MS13
MS14
PS6
PS5
PS3
TS2
TS3 TS4
TS5
MS16
MS15
MS17
MS7 MS5
MS4MS2
MS3
MS1
N
JS2
ES4
MS6
New Territories
Hong Kong Island
Kowloon
0 5 10km
DS1
DS2
DS3
DS4
NS4
NS3
NS6
NS2
WS1
WS2
SS6SS4
SS3
SS2
SS1
VS10
VS9
VS6VS5 VS3
ES1
ES2
MS8
MS13
MS14
PS6
PS5
PS3
TS2
TS3 TS4
TS5
MS16
MS15
MS17
MS7 MS5
MS4MS2
MS3
MS1
N
JS2
ES4
MS6
New Territories
Lantau IslandHong Kong Island
Kowloon
Mean high molecular weight polycyclic aromatic hydrocarbons (PAHs) levelsin marine sediments in Hong Kong, 2007 - 2011
Mean low molecular weight polycyclic aromatic hydrocarbons (PAHs) levels in marine sediments in Hong Kong, 2007 - 2011
SS5
SS5Lantau Island
Low molecular weight PAHs
(μg/kg dry weight)
>3160
551 - 3160
0 - 550
Shenzhen
High molecular weight PAHs
(μg/kg dry weight)
>9600
0 - 1700
1701 - 9600
Shenzhen
Lantau Island

0
2
4
6
8
10
12
NT1 ST1 ST3 WT1 WT3 VT8 VT12 VT10 VT2 VT11 VT4 VT3 ET2 ET1 PT4 PT3 PT2 TT1
Dep
th-a
vera
ged
Dis
solv
ed O
xyge
n (m
g/L)
Dep
th-a
vera
ged
5-da
y Bi
oche
mic
al O
xyge
n D
eman
d(m
g/L)
0
1
2
3
4
NT1 ST1 ST3 WT1 WT3 VT8 VT12 VT10 VT2 VT11 VT4 VT3 ET2 ET1 PT4 PT3 PT2 TT1
Tuen
Mun
Chue
ngCh
au
Ram
bler
Cha
nnel
Caus
eway
Bay
To K
wa
Wan
Sai K
ung
Kwun
Tong
Yau
Ma
Tei
Aldr
ich
Bay
(Sha
uKe
i Wan
)
Sam
Ka
Tsue
n
Chai
Wan
Yim
Tin
Tsai
(in S
aiKu
ng)
Shue
nW
an
Aber
deen
(Sou
th)
Aber
deen
(Wes
t)
Hei L
ing
Chau
Gove
rnm
ent
Dock
yard
Hebe
Hav
en
0
10
20
NT1 ST1 ST3 WT1 WT3 VT8 VT12 VT10 VT2 VT11 VT4 VT3 ET2 ET1 PT4 PT3 PT2 TT1
Dep
th-a
vera
ged
Susp
ende
d So
lids
(mg/
L)Water quality of typhoon shelters in Hong Kong in 2011
Mean
Min
Max
Appendix G
MARINE WATER QUALITY IN HONG KONG IN 2011 G - 1

Mean
Min
Max
NT1 ST1 ST3 WT1 WT3 VT8 VT12 VT10 VT2 VT11 VT4 VT3 ET2 ET1 PT4 PT3 PT2 TT1
102
103
104
105
1
Dep
th-a
vera
ged
E. c
oli (
cfu/
100m
L)D
epth
-ave
rage
dAm
mon
ia N
itrog
en (m
g/L)
0
0.2
0.4
0.6
0.8
NT1 ST1 ST3 WT1 WT3 VT8 VT12 VT10 VT2 VT11 VT4 VT3 ET2 ET1 PT4 PT3 PT2 TT1
0
0.5
1
1.5
2
NT1 ST1 ST3 WT1 WT3 VT8 VT12 VT10 VT2 VT11 VT4 VT3 ET2 ET1 PT4 PT3 PT2 TT1
Dep
th-a
vera
ged
Tota
l Ino
rgan
ic N
itrog
en (m
g/L)
101
Tuen
Mun
Chue
ngCh
au
Ram
bler
Cha
nnel
Caus
eway
Bay
To K
wa
Wan
Sai K
ung
Kwun
Tong
Yau
Ma
Tei
Aldr
ich
Bay
(Sha
uKe
i Wan
)
Sam
Ka
Tsue
n
Chai
Wan
Yim
Tin
Tsai
(in S
aiKu
ng)
Shue
nW
an
Aber
deen
(Sou
th)
Aber
deen
(Wes
t)
Hei L
ing
Chau
Gove
rnm
ent
Dock
yard
Hebe
Hav
en
Water quality of typhoon shelters in Hong Kong in 2011 (continued)
Appendix G
MARINE WATER QUALITY IN HONG KONG IN 2011 G - 2

Appendix G
MARINE WATER QUALITY IN HONG KONG IN 2011 G - 3
Monitoring Station NT1 ST1 ST3 WT3 WT1 VT8 VT10 VT2 VT11
1986 1986 2000 1986 1986 1986 1993 1986 1994
I I I I I I I I I
2011 2011 2011 2011 2011 2011 2011 2011 2011
Parameter Water Depth 26 26 12 26 26 26 19 26 18
Surface - - - - - - - - -
Temperature (℃) Middle NA - - - - - -
Bottom NA - - - - - - -
Average - - - - - - - -
Surface - - - - - - - - -
Salinity Middle NA - - - - - - -
Bottom NA - - - - - - - -
Average - - - - - - - - -
Surface - - - - -
Dissolved Oxygen (mg/L) Middle NA - - - -
Bottom NA - - -
Average - - - - -
Surface - - - -
Dissolved Oxygen (%) Middle NA - - -
Bottom NA - - -
Average - - -
Surface - - - - - -
pH Middle NA - - - - - -
Bottom NA - - -
Average - - - - -
Secchi disc depth (m) - -
Surface - - - - - - -
Turbidity (NTU) Middle NA - - - - - - - -
Bottom NA - - - - -
Average - - - - - -
Surface - - - - - -
Suspended Solids (mg/L) Middle NA - - - - -
Bottom NA - - - - - - -
Average - - - - - -
Surface - - - - - -
Volatile suspended solids (mg/L) Middle NA - - - - -
Bottom NA - - - - - - - -
Average - - - - - -
Surface - - - - - - -
5-day Biochemical Oxygen Demand (mg/L) Middle NA - - - - - -
Bottom NA - - - - - -
Average - - - - - - -
Surface - - - -
Ammonia nitrogen (mg/L) Middle NA - - - -
Bottom NA - - - -
Average - - - -
Surface - - -
Unionised Ammonia (mg/L) Middle NA - - - -
Bottom NA - -
Average - - -
Surface - - - - - - -
Nitrite nitrogen (mg/L) Middle NA - - - - - - -
Bottom NA - - - - - - -
Average - - - - - - -
Surface - - -
Nitrate nitrogen (mg/L) Middle NA - - - -
Bottom NA - - - -
Average - - - -
Surface - - - - - -
Total inorganic nitrogen (mg/L) Middle NA - - - - - -
Bottom NA - - - - -
Average - - - - - -
Surface - - - -
Total Kjeldahl nitrogen (mg/L) Middle NA - - - - -
Bottom NA - - - -
Average - - - -
Surface - - -
Total nitrogen (mg/L) Middle NA - - - - -
Bottom NA - - - -
Average - - -
Surface - - - -
Orthophosphate phosphorus (mg/L) Middle NA - - - -
Bottom NA - - - -
Average - -
Surface - - - -
Total phosphorus (mg/L) Middle NA - - - -
Bottom NA - - - -
Average - - - -
Surface - - - - - -
Silica (mg/L) Middle NA - - - - - - -
Bottom NA - - - - - - -
Average - - - - - - -
Surface - - - - - - - -
Chlorophyll-a (μg/L) Middle NA - - - - - - -
Bottom NA - - - - -
Average - - - - - -
Surface - - -
E. coli (cfu/100mL) Middle NA -
Bottom NA - - - -
Average - - - -
Surface - - - - - -
Faecal coliforms (cfu/100mL) Middle NA - - - - - -
Bottom NA - - - - -
Average - - - - - -
Note: 1. Results of the Seasonal Kendall Test statistically significant at p < 0.05
Note: 2. - indicates no significant trend
Note: 3. NA (Not Applicable) indicates the measurement was not made due to shallow water
Note: 4. significant increase
Note: 5. significant decrease
Results of the Seasonal Kendall Test for water quality trends in typhoon shelters, 1986 - 2011
Monitoring Period

Appendix G
MARINE WATER QUALITY IN HONG KONG IN 2011 G - 4
Monitoring Station VT12 VT4 VT3 ET2 ET1 PT4 PT3 PT2 TT1
2000 1987 1986 1993 1986 1986 1986 1986 1986
I I I I I I I I I
2011 2011 2011 2011 2011 2011 2011 2011 2011
Parameter Water Depth 12 25 26 19 26 26 26 26 26
Surface - - -
Temperature (℃) Middle - - - - NA - NA -
Bottom - - - - -
Average - - - -
Surface - - - - - - - - -
Salinity Middle - - - - NA - NA -
Bottom - - - - - - - -
Average - - - - - - - - -
Surface - - - -
Dissolved Oxygen (mg/L) Middle - - NA - NA -
Bottom - - - - - -
Average - - - - -
Surface - - - -
Dissolved Oxygen (%) Middle - NA - NA -
Bottom - - - - -
Average - - - - -
Surface - - - -
pH Middle - - - NA NA
Bottom - - - - -
Average - - - -
Secchi disc depth (m) - - -
Surface - - - - - - - - -
Turbidity (NTU) Middle - - - - NA - NA -
Bottom - - - - - - - - -
Average - - - - - - - -
Surface - - - - -
Suspended Solids (mg/L) Middle - - - NA - NA
Bottom - - - - - -
Average - - - - -
Surface - - - - - - - - -
Volatile suspended solids (mg/L) Middle - - - NA - NA
Bottom - - - - - - - -
Average - - - - - -
Surface - -
5-day Biochemical Oxygen Demand (mg/L) Middle - - NA - NA
Bottom - - - -
Average - - -
Surface - - - -
Ammonia nitrogen (mg/L) Middle - - NA - NA -
Bottom - - - - -
Average - - - -
Surface - - -
Unionised Ammonia (mg/L) Middle - - NA - NA
Bottom - - - -
Average - - -
Surface - - - - - - - -
Nitrite nitrogen (mg/L) Middle - - - - NA - NA -
Bottom - - - - - - - -
Average - - - - - - - -
Surface - - - - - - -
Nitrate nitrogen (mg/L) Middle - - - NA - NA -
Bottom - - - - - - -
Average - - - - - - -
Surface - - - - -
Total inorganic nitrogen (mg/L) Middle - - NA - NA -
Bottom - - - - -
Average - - - -
Surface - - -
Total Kjeldahl nitrogen (mg/L) Middle - - NA - NA
Bottom - - - -
Average - - - -
Surface - - - -
Total nitrogen (mg/L) Middle - - NA - NA
Bottom - - - -
Average - - - -
Surface - -
Orthophosphate phosphorus (mg/L) Middle - - NA - NA
Bottom - -
Average - - -
Surface - - - -
Total phosphorus (mg/L) Middle - NA - NA
Bottom - -
Average - - -
Surface - - - - - -
Silica (mg/L) Middle - - - NA - NA -
Bottom - - - - - -
Average - - - - - -
Surface - - - - - -
Chlorophyll-a (μg/L) Middle - - - - NA - NA
Bottom - - - - - -
Average - - - - - -
Surface - - -
E. coli (cfu/100mL) Middle - - NA - NA
Bottom - - -
Average - -
Surface - - -
Faecal coliforms (cfu/100mL) Middle - - - NA - NA
Bottom - -
Average - -
Note: 1. Results of the Seasonal Kendall Test statistically significant at p < 0.05
Note: 2. - indicates no significant trend
Note: 3. NA (Not Applicable) indicates the measurement was not made due to shallow water
Note: 4. significant increase
Note: 5. significant decrease
Results of the Seasonal Kendall Test for water quality trends in typhoon shelters, 1986 - 2011(continued)
Monitoring Period

Appendix G
MARINE WATER QUALITY IN HONG KONG IN 2011 G - 5
Summary of water quality statistics for typhoon shelters in 2011
Tuen MunParameter NT1 ST1 ST3 WT1 WT3 VT8
Number of samples 6 6 6 6 6 623.6 23.4 23.4 23.1 23.1 23.0
(16.7 - 28.1) (16.3 - 28.9) (16.2 - 28.8) (15.7 - 27.3) (15.7 - 27.6) (16.9 - 27.0)28.2 31.2 30.8 32.0 31.7 30.8
(20.2 - 32.8) (26.8 - 32.9) (26.7 - 32.7) (30.1 - 33.2) (29.1 - 33.1) (28.4 - 32.8)5.3 5.4 5.8 5.5 5.8 4.8
(3.5 - 6.6) (3.3 - 6.8) (3.0 - 8.3) (3.5 - 7.3) (3.4 - 7.0) (3.5 - 6.4)5.5 5.8 5.5 5.6 5.0
(3.5 - 7.2) (3.0 - 8.1) (3.5 - 7.4) (3.5 - 7.1) (3.6 - 6.5)72 75 81 76 81 67
(50 - 82) (49 - 85) (44 - 104) (50 - 89) (49 - 98) (51 - 79)76 80 77 78 69
(52 - 90) (45 - 101) (50 - 90) (50 - 88) (52 - 81)7.7 7.8 7.8 7.8 7.8 7.8
(6.8 - 8.2) (7.7 - 8.0) (7.7 - 8.0) (7.7 - 7.9) (7.7 - 7.9) (7.6 - 8.2)1.9 2.1 2.0 2.9 2.9 2.0
(0.9 - 2.2) (1.7 - 2.5) (1.6 - 2.4) (2.2 - 3.3) (2.4 - 3.3) (1.6 - 2.3)4.2 5.8 5.4 2.0 2.2 5.6
(2.5 - 6.8) (2.5 - 10.7) (2.4 - 9.5) (1.4 - 2.6) (1.4 - 3.7) (3.4 - 8.5)5.3 8.7 5.7 2.7 3.0 8.5
(2.6 - 7.7) (2.0 - 16.3) (2.7 - 10.0) (1.4 - 3.5) (2.0 - 5.6) (4.7 - 15.3)0.6 0.9 1.1 0.9 1.0 0.7
(<0.1 - 0.8) (0.6 - 1.4) (0.7 - 1.4) (0.5 - 1.4) (0.6 - 1.5) (0.4 - 1.5)0.148 0.115 0.105 0.099 0.094 0.178
(0.056 - 0.210) (0.104 - 0.140) (0.032 - 0.150) (0.044 - 0.167) (0.044 - 0.180) (0.049 - 0.273)0.004 0.003 0.003 0.003 0.002 0.004
(<0.001 - 0.014) (0.001 - 0.006) (0.001 - 0.004) (<0.001 - 0.004) (<0.001 - 0.004) (0.002 - 0.005)0.066 0.030 0.041 0.028 0.035 0.047
(0.021 - 0.140) (0.010 - 0.061) (0.012 - 0.071) (0.006 - 0.055) (0.006 - 0.071) (0.019 - 0.066)0.361 0.171 0.221 0.135 0.160 0.221
(0.076 - 0.860) (0.050 - 0.295) (0.120 - 0.395) (0.062 - 0.293) (0.056 - 0.400) (0.110 - 0.310) 0.57 0.32 0.37 0.26 0.29 0.45
(0.28 - 1.16) (0.17 - 0.46) (0.24 - 0.52) (0.16 - 0.45) (0.17 - 0.56) (0.37 - 0.64)0.26 0.23 0.22 0.19 0.21 0.29
(0.17 - 0.35) (0.15 - 0.29) (0.19 - 0.29) (0.07 - 0.29) (0.10 - 0.32) (0.22 - 0.35)0.69 0.43 0.48 0.36 0.40 0.55
(0.38 - 1.31) (0.29 - 0.65) (0.36 - 0.66) (0.18 - 0.62) (0.22 - 0.78) (0.45 - 0.71)0.031 0.019 0.018 0.013 0.012 0.026
(0.027 - 0.038) (0.011 - 0.029) (0.005 - 0.029) (0.009 - 0.018) (0.003 - 0.017) (0.005 - 0.033)0.05 0.04 0.04 0.03 0.03 0.05
(0.04 - 0.06) (0.03 - 0.05) (0.02 - 0.05) (0.02 - 0.04) (0.02 - 0.04) (0.04 - 0.05)1.85 1.15 1.15 0.85 0.88 1.23
(1.10 - 3.50) (0.53 - 1.70) (0.81 - 1.70) (0.51 - 1.80) (0.46 - 1.93) (0.74 - 1.80)1.6 2.4 4.5 2.3 3.3 2.1
(0.7 - 2.7) (0.8 - 4.2) (1.1 - 8.7) (0.5 - 4.8) (0.2 - 9.6) (0.4 - 9.4)150 98 3 340 1100 500
(19 - 2500) (61 - 130) (<1 - 29) (85 - 1100) (590 - 2300) (160 - 770)830 260 4 900 2000 1500
(30 - 11000) (190 - 330) (1 - 60) (140 - 4800) (770 - 5500) (340 - 3200)
Note : 3. Data in brackets indicate the ranges.Note : 4. N.M. - not measured.
Orthophosphate Phosphorus (mg/L)
Faecal Coliforms (count/100mL)
Note : 1. Unless otherwise specified, data presented are depth-averaged (A) values calculated by taking the means of threeNote : 1. depths: Surface (S), Mid-depth (M), Bottom (B).
Note : 2. Data presented are annual arithmetic means of the depth-averaged results except for E. coli and faecal coliformsNote : 2. which are annual geometric means.
Total Phosphorus (mg/L)
Silica (as SiO2) (mg/L)
Chlorophyll-a (μg/L)
E.coli (count/100mL)
Nitrate Nitrogen (mg/L)
Total Inorganic Nitrogen (mg/L)
Total Kjeldahl Nitrogen (mg/L)
Total Nitrogen (mg/L)
5-day Biochemical Oxygen Demand (mg/L)
Ammonia Nitrogen (mg/L)
Unionised Ammonia (mg/L)
Nitrite Nitrogen (mg/L)
pH
Secchi Disc Depth (m)
Turbidity (NTU)
Suspended Solids (mg/L)
N.M.
N.M.
Bottom
Dissolved Oxygen (% Saturation)
Bottom
RamblerChannel
Temperature (℃)
Salinity
Dissolved Oxygen (mg/L)
Cheung Chau Hei Ling ChauAberdeen
(South)Aberdeen
(West)
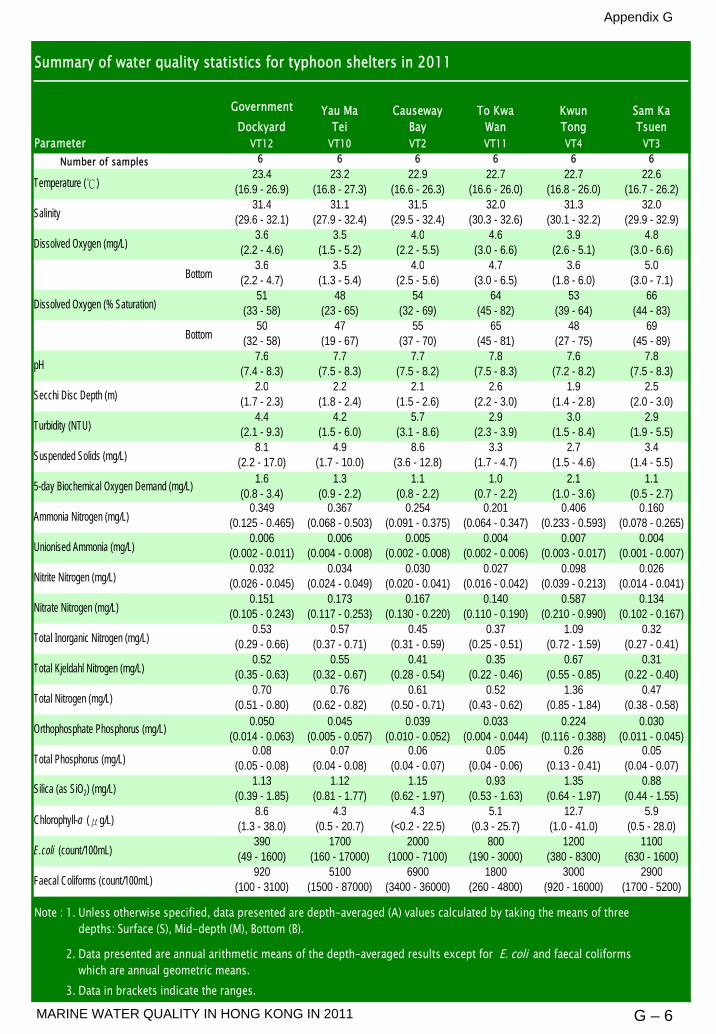
Appendix G
MARINE WATER QUALITY IN HONG KONG IN 2011 G – 6
Summary of water quality statistics for typhoon shelters in 2011
GovernmentDockyard
Parameter VT12 VT10 VT2 VT11 VT4 VT3Number of samples 6 6 6 6 6 6
23.4 23.2 22.9 22.7 22.7 22.6(16.9 - 26.9) (16.8 - 27.3) (16.6 - 26.3) (16.6 - 26.0) (16.8 - 26.0) (16.7 - 26.2)
31.4 31.1 31.5 32.0 31.3 32.0(29.6 - 32.1) (27.9 - 32.4) (29.5 - 32.4) (30.3 - 32.6) (30.1 - 32.2) (29.9 - 32.9)
3.6 3.5 4.0 4.6 3.9 4.8(2.2 - 4.6) (1.5 - 5.2) (2.2 - 5.5) (3.0 - 6.6) (2.6 - 5.1) (3.0 - 6.6)
3.6 3.5 4.0 4.7 3.6 5.0(2.2 - 4.7) (1.3 - 5.4) (2.5 - 5.6) (3.0 - 6.5) (1.8 - 6.0) (3.0 - 7.1)
51 48 54 64 53 66(33 - 58) (23 - 65) (32 - 69) (45 - 82) (39 - 64) (44 - 83)
50 47 55 65 48 69(32 - 58) (19 - 67) (37 - 70) (45 - 81) (27 - 75) (45 - 89)
7.6 7.7 7.7 7.8 7.6 7.8(7.4 - 8.3) (7.5 - 8.3) (7.5 - 8.2) (7.5 - 8.3) (7.2 - 8.2) (7.5 - 8.3)
2.0 2.2 2.1 2.6 1.9 2.5(1.7 - 2.3) (1.8 - 2.4) (1.5 - 2.6) (2.2 - 3.0) (1.4 - 2.8) (2.0 - 3.0)
4.4 4.2 5.7 2.9 3.0 2.9(2.1 - 9.3) (1.5 - 6.0) (3.1 - 8.6) (2.3 - 3.9) (1.5 - 8.4) (1.9 - 5.5)
8.1 4.9 8.6 3.3 2.7 3.4(2.2 - 17.0) (1.7 - 10.0) (3.6 - 12.8) (1.7 - 4.7) (1.5 - 4.6) (1.4 - 5.5)
1.6 1.3 1.1 1.0 2.1 1.1(0.8 - 3.4) (0.9 - 2.2) (0.8 - 2.2) (0.7 - 2.2) (1.0 - 3.6) (0.5 - 2.7)
0.349 0.367 0.254 0.201 0.406 0.160(0.125 - 0.465) (0.068 - 0.503) (0.091 - 0.375) (0.064 - 0.347) (0.233 - 0.593) (0.078 - 0.265)
0.006 0.006 0.005 0.004 0.007 0.004(0.002 - 0.011) (0.004 - 0.008) (0.002 - 0.008) (0.002 - 0.006) (0.003 - 0.017) (0.001 - 0.007)
0.032 0.034 0.030 0.027 0.098 0.026(0.026 - 0.045) (0.024 - 0.049) (0.020 - 0.041) (0.016 - 0.042) (0.039 - 0.213) (0.014 - 0.041)
0.151 0.173 0.167 0.140 0.587 0.134(0.105 - 0.243) (0.117 - 0.253) (0.130 - 0.220) (0.110 - 0.190) (0.210 - 0.990) (0.102 - 0.167)
0.53 0.57 0.45 0.37 1.09 0.32(0.29 - 0.66) (0.37 - 0.71) (0.31 - 0.59) (0.25 - 0.51) (0.72 - 1.59) (0.27 - 0.41)
0.52 0.55 0.41 0.35 0.67 0.31(0.35 - 0.63) (0.32 - 0.67) (0.28 - 0.54) (0.22 - 0.46) (0.55 - 0.85) (0.22 - 0.40)
0.70 0.76 0.61 0.52 1.36 0.47(0.51 - 0.80) (0.62 - 0.82) (0.50 - 0.71) (0.43 - 0.62) (0.85 - 1.84) (0.38 - 0.58)
0.050 0.045 0.039 0.033 0.224 0.030(0.014 - 0.063) (0.005 - 0.057) (0.010 - 0.052) (0.004 - 0.044) (0.116 - 0.388) (0.011 - 0.045)
0.08 0.07 0.06 0.05 0.26 0.05(0.05 - 0.08) (0.04 - 0.08) (0.04 - 0.07) (0.04 - 0.06) (0.13 - 0.41) (0.04 - 0.07)
1.13 1.12 1.15 0.93 1.35 0.88(0.39 - 1.85) (0.81 - 1.77) (0.62 - 1.97) (0.53 - 1.63) (0.64 - 1.97) (0.44 - 1.55)
8.6 4.3 4.3 5.1 12.7 5.9(1.3 - 38.0) (0.5 - 20.7) (<0.2 - 22.5) (0.3 - 25.7) (1.0 - 41.0) (0.5 - 28.0)
390 1700 2000 800 1200 1100(49 - 1600) (160 - 17000) (1000 - 7100) (190 - 3000) (380 - 8300) (630 - 1600)
920 5100 6900 1800 3000 2900(100 - 3100) (1500 - 87000) (3400 - 36000) (260 - 4800) (920 - 16000) (1700 - 5200)
Note : 3. Data in brackets indicate the ranges.
E.coli (count/100mL)
Faecal Coliforms (count/100mL)
Note : 1. Unless otherwise specified, data presented are depth-averaged (A) values calculated by taking the means of threeNote : 1. depths: Surface (S), Mid-depth (M), Bottom (B).
Note : 2. Data presented are annual arithmetic means of the depth-averaged results except for E. coli and faecal coliformsNote : 2. which are annual geometric means.
Orthophosphate Phosphorus (mg/L)
Total Phosphorus (mg/L)
Silica (as SiO2) (mg/L)
Chlorophyll-a (μg/L)
Nitrate Nitrogen (mg/L)
Total Inorganic Nitrogen (mg/L)
Total Kjeldahl Nitrogen (mg/L)
Total Nitrogen (mg/L)
5-day Biochemical Oxygen Demand (mg/L)
Ammonia Nitrogen (mg/L)
Unionised Ammonia (mg/L)
Nitrite Nitrogen (mg/L)
pH
Secchi Disc Depth (m)
Turbidity (NTU)
Suspended Solids (mg/L)
Dissolved Oxygen (mg/L)
Bottom
Dissolved Oxygen (% Saturation)
Bottom
KwunTong
Sam KaTsuen
Temperature (℃)
Salinity
Yau MaTei
CausewayBay
To KwaWan

Appendix G
MARINE WATER QUALITY IN HONG KONG IN 2011 G – 7
Summary of water quality statistics for typhoon shelters in 2011
Aldrich Bay(Shau Kei Wan)
Parameter ET2 ET1 PT4 PT3 PT2 TT1Number of samples 6 6 6 6 6 6
23.4 23.6 23.8 23.4 23.6 23.5(18.1 - 28.6) (17.9 - 29.2) (15.3 - 28.5) (15.0 - 28.0) (15.2 - 28.7) (15.7 - 30.7)
32.1 32.2 32.0 32.2 31.9 31.7(29.9 - 32.9) (30.9 - 32.8) (29.8 - 32.9) (30.1 - 33.2) (29.0 - 33.1) (29.6 - 32.6)
4.7 5.7 7.0 7.1 6.6 5.9(2.7 - 6.2) (4.1 - 6.8) (3.8 - 10.1) (4.3 - 10.7) (4.4 - 10.2) (4.0 - 7.9)
4.6 5.6 7.0 7.1 7.0 5.2(2.9 - 6.3) (4.1 - 6.9) (3.8 - 10.1) (4.2 - 10.9) (4.4 - 10.5) (3.0 - 7.6)
66 80 98 98 92 82(39 - 80) (61 - 98) (59 - 130) (65 - 137) (66 - 130) (55 - 109)
64 79 97 99 97 71(44 - 81) (60 - 89) (59 - 131) (64 - 138) (66 - 134) (44 - 98)
7.8 7.9 8.0 8.1 8.0 8.0(7.6 - 7.9) (7.7 - 8.1) (7.9 - 8.1) (7.9 - 8.3) (7.9 - 8.2) (7.8 - 8.2)
3.3 2.8 2.9 3.9 2.8 2.5(3.0 - 4.0) (2.4 - 3.2) (2.0 - 4.5) (2.6 - 5.5) (2.4 - 3.5) (2.0 - 3.1)
1.6 1.7 2.7 1.4 1.4 1.3(1.2 - 2.2) (1.0 - 2.4) (0.5 - 8.8) (0.3 - 2.5) (0.4 - 2.4) (0.7 - 2.2)
2.1 2.8 3.8 1.4 2.1 1.7(1.6 - 3.0) (1.7 - 4.2) (1.0 - 12.5) (<0.5 - 2.2) (0.6 - 4.1) (0.9 - 2.9)
0.8 1.1 1.3 1.2 1.3 1.9(0.6 - 1.3) (0.6 - 1.9) (0.6 - 2.3) (0.6 - 3.6) (0.6 - 3.0) (1.4 - 2.9)
0.142 0.100 0.062 0.034 0.044 0.082(0.070 - 0.197) (0.048 - 0.137) (0.027 - 0.125) (0.014 - 0.057) (0.018 - 0.056) (0.056 - 0.120)
0.004 0.003 0.003 0.002 0.002 0.003(0.001 - 0.009) (0.001 - 0.007) (0.001 - 0.008) (<0.001 - 0.003) (<0.001 - 0.004) (0.001 - 0.006)
0.027 0.021 0.007 0.005 0.007 0.002(0.011 - 0.060) (0.007 - 0.039) (<0.002 - 0.016) (<0.002 - 0.014) (<0.002 - 0.016) (<0.002 - 0.004)
0.123 0.094 0.035 0.036 0.048 0.013(0.071 - 0.207) (0.041 - 0.123) (0.003 - 0.118) (<0.002 - 0.098) (<0.002 - 0.120) (<0.002 - 0.021)
0.29 0.21 0.10 0.07 0.10 0.10(0.23 - 0.38) (0.14 - 0.26) (0.04 - 0.21) (0.02 - 0.16) (0.02 - 0.19) (0.06 - 0.14)
0.25 0.23 0.20 0.15 0.17 0.24(0.18 - 0.32) (0.16 - 0.29) (0.11 - 0.25) (0.13 - 0.18) (0.12 - 0.26) (0.12 - 0.29)
0.40 0.35 0.24 0.19 0.23 0.25(0.32 - 0.52) (0.27 - 0.42) (0.12 - 0.34) (0.14 - 0.28) (0.12 - 0.30) (0.14 - 0.32)
0.025 0.015 0.007 0.006 0.006 0.005(0.017 - 0.032) (0.003 - 0.029) (0.003 - 0.015) (0.003 - 0.010) (0.003 - 0.012) (<0.002 - 0.009)
0.04 0.03 0.03 0.02 0.02 0.03(0.04 - 0.05) (0.03 - 0.04) (<0.02 - 0.05) (<0.02 - 0.02) (<0.02 - 0.03) (<0.02 - 0.04)
0.80 0.53 0.86 0.60 0.71 0.85(0.58 - 1.07) (0.29 - 1.07) (0.35 - 1.60) (0.26 - 0.88) (0.29 - 1.02) (0.27 - 1.67)
2.7 8.8 7.3 3.3 4.9 6.9(0.6 - 7.2) (2.4 - 24.7) (2.0 - 25.5) (1.1 - 5.7) (0.6 - 13.0) (2.9 - 11.0)
540 300 4 2 17 18(150 - 1200) (160 - 600) (1 - 69) (<1 - 13) (<1 - 210) (4 - 95)
1300 630 17 3 100 47(560 - 2100) (300 - 1100) (3 - 300) (<1 - 140) (2 - 1100) (18 - 260)
Note : 3. Data in brackets indicate the ranges.
Faecal Coliforms (count/100mL)
Note : 1. Unless otherwise specified, data presented are depth-averaged (A) values calculated by taking the means of threeNote : 1. depths: Surface (S), Mid-depth (M), Bottom (B).
Note : 2. Data presented are annual arithmetic means of the depth-averaged results except for E. coli and faecal coliformsNote : 2. which are annual geometric means.
Total Phosphorus (mg/L)
Silica (as SiO2) (mg/L)
Chlorophyll-a (μg/L)
E.coli (count/100mL)
Total Inorganic Nitrogen (mg/L)
Total Kjeldahl Nitrogen (mg/L)
Total Nitrogen (mg/L)
Orthophosphate Phosphorus (mg/L)
Ammonia Nitrogen (mg/L)
Unionised Ammonia (mg/L)
Nitrite Nitrogen (mg/L)
Nitrate Nitrogen (mg/L)
Secchi Disc Depth (m)
Turbidity (NTU)
Suspended Solids (mg/L)
5-day Biochemical Oxygen Demand (mg/L)
Bottom
Dissolved Oxygen (% Saturation)
Bottom
pH
ShuenWan
Temperature (℃)
Salinity
Dissolved Oxygen (mg/L)
ChaiWan
HebeHaven
Yim TinTsai
SaiKung

Appendix G
MARINE WATER QUALITY IN HONG KONG IN 2011 G – 8
TuenMun
CheungChau
Hei LingChau
RamblerChannel
GovernmentDockyard
Yau MaTei
CausewayBay
Parameter NS5 SS7 SS8 VS17 VS21 VS19 VS1210 10 10 10 10 10 1078 87 95 74 95 73 85
(68 - 92) (66 - 97) (91 - 99) (47 - 89) (83 - 99) (55 - 88) (65 - 97)-274 -220 -206 -256 -289 -322 -332
(-366 - -189) (-306 - -152) (-287 - -155) (-329 - -144) (-350 - -162) (-397 - -106) (-388 - -209)45 41 36 44 37 50 39
(38 - 50) (29 - 50) (32 - 40) (36 - 57) (34 - 39) (40 - 59) (33 - 51)Total Volatile Soilds (%w/w) 6.7 6.4 7.6 6.9 6.7 6.3 8.5
(6.2 - 7.3) (5.4 - 7.4) (6.7 - 8.4) (4.6 - 8.3) (6.2 - 6.9) (5.2 - 7.4) (5.9 - 9.4)18800 16300 12400 19900 15200 16300 25900
(14000 - 22000) (12000 - 23000) (10000 - 14000) (16000 - 25000) (13000 - 17000) (13000 - 23000) (21000 - 31000)0.8 0.7 0.5 1.0 0.5 1.0 0.9
(0.6 - 1.0) (0.5 - 1.1) (0.5 - 0.6) (0.8 - 1.3) (0.5 - 0.6) (0.7 - 1.4) (0.8 - 1.1)9.9 7.4 6.2 8.1 5.9 23.0 20.1
(0.9 - 22.0) (1.3 - 15.0) (1.0 - 16.0) (0.2 - 19.0) (3.6 - 8.0) (4.1 - 47.0) (4.8 - 39.0)420 450 510 470 370 420 610
(230 - 620) (330 - 540) (300 - 1000) (340 - 590) (310 - 410) (210 - 600) (450 - 720)210 240 180 200 190 200 210
(150 - 260) (170 - 440) (140 - 340) (150 - 240) (170 - 200) (110 - 240) (190 - 250)94 48 58 210 52 130 140
(19 - 220) (14 - 100) (2 - 390) (23 - 540) (3 - 160) (18 - 350) (23 - 290)0.2 0.2 0.1 0.3 0.2 0.2 0.2
(0.1 - 0.3) (0.1 - 0.3) (0.1 - 0.4) (0.2 - 0.5) (0.1 - 0.5) (0.1 - 0.2) (0.1 - 0.3)10.6 7.9 7.0 8.8 7.9 5.3 7.9
(7.3 - 28.0) (6.7 - 9.3) (5.8 - 7.9) (7.6 - 10.0) (7.0 - 9.0) (4.4 - 6.7) (6.1 - 9.0)0.3 <0.1 <0.1 0.7 0.3 0.3 0.9
(0.2 - 0.4) (0.1 - <0.1) (0.1 - <0.1) (0.6 - 1.0) (0.3 - 0.4) (0.1 - 0.6) (0.6 - 1.1)37 48 41 130 46 34 61
(28 - 53) (39 - 61) (33 - 48) (85 - 150) (43 - 50) (22 - 44) (50 - 70)56 89 36 210 150 78 230
(31 - 65) (57 - 130) (30 - 43) (150 - 280) (130 - 170) (35 - 130) (180 - 290)53 50 49 87 52 58 86
(38 - 85) (45 - 57) (42 - 58) (65 - 140) (48 - 57) (29 - 110) (59 - 120)0.09 0.18 0.12 0.21 0.19 0.19 0.76
(0.07 - 0.12) (0.12 - 0.28) (0.09 - 0.15) (0.14 - 0.27) (0.15 - 0.24) (0.13 - 0.29) (0.54 - 1.30)23 21 25 44 25 21 26
(16 - 47) (13 - 24) (21 - 29) (31 - 74) (22 - 28) (15 - 28) (18 - 34)2.0 0.3 0.5 4.2 1.7 1.4 5.5
(1.2 - 2.9) (0.2 - 0.4) (0.4 - 0.7) (2.9 - 6.1) (1.4 - 1.9) (0.5 - 2.5) (3.0 - 7.4)170 140 130 280 220 170 320
(120 - 220) (110 - 230) (100 - 160) (200 - 350) (200 - 240) (98 - 320) (190 - 450)18 18 18 46 20 18 41
(18 - 18) (18 - 22) (18 - 18) (33 - 71) (18 - 24) (18 - 20) (27 - 71)94 100 95 220 96 110 130
(90 - 99) (90 - 130) (90 - 110) (100 - 1100) (90 - 100) (90 - 140) (100 - 170)180 240 81 1600 210 450 790
(22 - 530) (130 - 590) (62 - 100) (480 - 5600) (120 - 280) (140 - 940) (640 - 1000)Note: 1
23
4
5
6
All data are based on the analyses of bulk (unsieved) sediment and are reported on a dry weight basis unless stated otherwise.Total PCBs results are derived from the summation of 18 congeners. If the concentration of a congener is below report limit (RL), theresult will be taken as 0.5xRL in the calculation.
Low molecular weight polyaromatic hydrocarbons (PAHs) include 6 congeners of molecular weight below 200, namely : Acenaphthene,Acenaphthylene, Anthracene, Flourene, Naphthalene and Phenanthrene.
High molecular weight polyaromatic hydrocarbons (PAHs) include 10 congeners of molecular weight above 200, namely : Fluoranthene,Pyrene, Benzo(a)anthracene, Chrysene, Benzo(b)fluoranthene, Benzo(k)fluoranthene, Benzo(a)pyrene, Dibenzo(a,h)anthracene,Benzo(g,h,i)perylene and Indeno(1,2,3-cd)pyrene.
Total Polychlorinated Biphenyls (PCBs)(µg/kg) (3)
Low Molecular Weight Polycylic AromaticHydrocarbons (PAHs) (µg/kg) (4)
High Molecular Weight Polycylic AromaticHydrocarbons (PAHs) (µg/kg) (5) (6)
Data presented are arithmetic means ; data in brackets indicate ranges.
Mercury (mg/kg)
Nickel (mg/kg)
Silver (mg/kg)
Zinc (mg/kg)
Cadmium (mg/kg)
Chromium (mg/kg)
Copper (mg/kg)
Lead (mg/kg)
Chemical Oxygen Demand (mg/kg)
Total Carbon (%w/w)
Ammonical Nitrogen (mg/kg)
Total Kjeldahl Nitrogen (mg/kg)
Summary statistics of bottom sediment quality of typhoon shelters, 2007- 2011
Low and high molecular weight PAHs results are derived from the summation of the corresponding congeners. If the concentration of acongener is below report limit (RL), the result will be taken as 0.5xRL in the calculation.
Total Phosphorus (mg/kg)
Total Sulphide (mg/kg)
Total Cyanide (mg/kg)
Arsenic (mg/kg)
Number of samples
Particle Size Fractionation <63µm (%w/w)
Electrochemical Potential (mV)
Total Solids (%w/w)

Appendix G
MARINE WATER QUALITY IN HONG KONG IN 2011 G – 9
To KwaWan
KwunTong
Sam KaTsuen
Aldrich Bay(Shau Kei Wan)
ChaiWan
HebeHaven
Yim TinTsai
ShuenWan
Parameter VS20 VS14 VS13 ES5 ES3 PS4 PS2 TS710 10 10 10 10 10 10 1074 80 82 89 89 87 74 67
(55 - 94) (65 - 92) (60 - 90) (84 - 94) (80 - 96) (81 - 97) (28 - 92) (46 - 90)-311 -355 -288 -366 -280 -199 -178 -319
(-378 - -65) (-383 - -252) (-377 - -84) (-399 - -339) (-356 - -136) (-361 - -21) (-300 - -30) (-375 - -220)47 34 40 31 41 40 50 38
((36 - 54)) ((27 - 45)) ((37 - 43)) ((27 - 35)) ((36 - 49)) ((37 - 43)) ((44 - 65)) ((23 - 52))Total Volatile Soilds (%w/w) 7.4 10.2 9.4 9.2 7.7 8.9 9.2 7.8
(5.2 - 11.0) (8.4 - 11.0) (8.6 - 11.0) (7.8 - 10.0) (5.7 - 8.9) (7.8 - 10.0) (5.5 - 11.0) (5.5 - 12.0)25900 27200 24700 20300 24000 22000 16200 23000
(18000 - 35000) (16000 - 39000) (21000 - 28000) (17000 - 24000) (18000 - 30000) (17000 - 24000) (11000 - 20000) (19000 - 28000)1.2 1.0 1.0 0.8 0.9 0.9 2.1 0.8
(0.8 - 2.0) (0.7 - 1.5) (0.8 - 1.3) (0.7 - 1.1) (0.7 - 1.0) (0.7 - 1.2) (1.4 - 4.3) (0.7 - 1.0)16.4 37.7 9.9 24.2 2.7 6.3 8.1 7.0
(6.7 - 34.0) (13.0 - 76.0) (0.5 - 19.0) (4.2 - 37.0) (0.3 - 6.2) (0.3 - 22.0) (3.4 - 13.0) (2.5 - 12.0)520 610 600 620 510 590 480 640
(460 - 670) (410 - 720) (530 - 760) (530 - 730) (410 - 630) (290 - 740) (280 - 610) (490 - 890)210 200 330 210 240 180 150 230
(190 - 240) (160 - 220) (240 - 670) (170 - 280) (180 - 400) (120 - 220) (77 - 190) (170 - 360)100 380 270 490 110 35 12 99
(12 - 270) (25 - 770) (5 - 970) (59 - 790) (18 - 320) (2 - 140) (1 - 57) (53 - 180)0.2 0.3 0.3 0.2 0.2 0.2 <0.1 0.3
(0.1 - 0.3) (0.1 - 0.4) (0.1 - 0.5) (0.1 - 0.3) (0.1 - 0.3) (0.1 - 0.3) (0.1 - <0.1) (0.1 - 0.5)7.9 6.4 8.0 7.9 9.3 8.1 3.9 9.0
(6.9 - 8.7) (5.4 - 8.4) (6.7 - 10.0) (6.1 - 10.0) (8.0 - 10.0) (6.4 - 9.1) (2.6 - 5.1) (6.6 - 12.0)0.8 2.2 0.9 0.6 0.6 0.2 <0.1 0.4
(0.4 - 1.5) (1.2 - 5.0) (0.7 - 1.0) (0.4 - 1.1) (0.3 - 0.8) (0.1 - 0.3) (0.1 - <0.1) (0.2 - 0.8)83 210 73 58 97 28 16 22
(53 - 110) (100 - 570) (45 - 110) (51 - 66) (75 - 120) (22 - 33) (8 - 19) (14 - 29)550 1500 210 290 270 48 18 170
(240 - 960) (720 - 4200) (170 - 270) (210 - 420) (220 - 330) (37 - 60) (7 - 34) (65 - 680)110 130 100 73 89 39 30 95
(60 - 220) (81 - 400) (93 - 120) (64 - 82) (68 - 130) (36 - 43) (13 - 35) (71 - 120)1.15 0.68 0.96 0.31 0.47 0.13 0.06 0.15
(0.50 - 2.20) (0.41 - 1.40) (0.61 - 2.10) (0.24 - 0.61) (0.32 - 0.65) (0.09 - 0.16) (0.05 - 0.07) (0.05 - 0.27)32 65 24 26 29 9 11 11
(19 - 45) (31 - 170) (20 - 31) (24 - 30) (22 - 40) (7 - 10) (6 - 14) (7 - 17)4.6 7.3 2.8 7.3 17.3 0.3 <0.2 0.4
(3.1 - 5.8) (4.8 - 13.0) (2.4 - 3.3) (5.7 - 9.0) (5.2 - 30.0) (0.2 - 0.3) (0.2 - <0.2) (0.2 - 0.7)250 390 360 370 340 150 70 310
(150 - 380) (270 - 620) (280 - 490) (280 - 550) (250 - 440) (120 - 170) (28 - 80) (180 - 470)77 170 43 24 45 18 18 18
(31 - 130) (63 - 470) (33 - 51) (18 - 29) (29 - 71) (18 - 18) (18 - 18) (18 - 18)18000 150 140 110 120 100 110 92
(560 - 66000) (98 - 300) (100 - 220) (94 - 160) (100 - 170) (90 - 160) (90 - 160) (90 - 96)230000 1100 850 740 570 82 90 130
(7700 - 1100000) (560 - 1900) (410 - 1400) (220 - 1500) (270 - 1000) (60 - 150) (21 - 540) (61 - 240)Note: 1
23
4
5
6
All data are based on the analyses of bulk (unsieved) sediment and are reported on a dry weight basis unless stated otherwise.Total PCBs results are derived from the summation of 18 congeners. If the concentration of a congener is below report limit (RL), the resultwill be taken as 0.5xRL in the calculation.
Low molecular weight polyaromatic hydrocarbons (PAHs) include 6 congeners of molecular weight below 200, namely : Acenaphthene,Acenaphthylene, Anthracene, Flourene, Naphthalene and Phenanthrene.
High molecular weight polyaromatic hydrocarbons (PAHs) include 10 congeners of molecular weight above 200, namely : Fluoranthene,Pyrene, Benzo(a)anthracene, Chrysene, Benzo(b)fluoranthene, Benzo(k)fluoranthene, Benzo(a)pyrene, Dibenzo(a,h)anthracene,Benzo(g,h,i)perylene and Indeno(1,2,3-cd)pyrene.
Total Polychlorinated Biphenyls (PCBs)(µg/kg) (3)
Low Molecular Weight Polycylic AromaticHydrocarbons (PAHs) (µg/kg) (4)
High Molecular Weight Polycylic AromaticHydrocarbons (PAHs) (µg/kg) (5) (6)
Data presented are arithmetic means ; data in brackets indicate ranges.
Mercury (mg/kg)
Nickel (mg/kg)
Silver (mg/kg)
Zinc (mg/kg)
Cadmium (mg/kg)
Chromium (mg/kg)
Copper (mg/kg)
Lead (mg/kg)
Total Kjeldahl Nitrogen (mg/kg)
Total Phosphorus (mg/kg)
Total Sulphide (mg/kg)
Total Cyanide (mg/kg)
Summary statistics of bottom sediment quality of typhoon shelters, 2007- 2011 (continued)
Low and high molecular weight PAHs results are derived from the summation of the corresponding congeners. If the concentration of acongener is below report limit (RL), the result will be taken as 0.5xRL in the calculation.
Chemical Oxygen Demand (mg/kg)
Total Carbon (%w/w)
Ammonical Nitrogen (mg/kg)
Arsenic (mg/kg)
Number of samples
Particle Size Fractionation <63µm (%w/w)
Electrochemical Potential (mV)
Total Solids (%w/w)
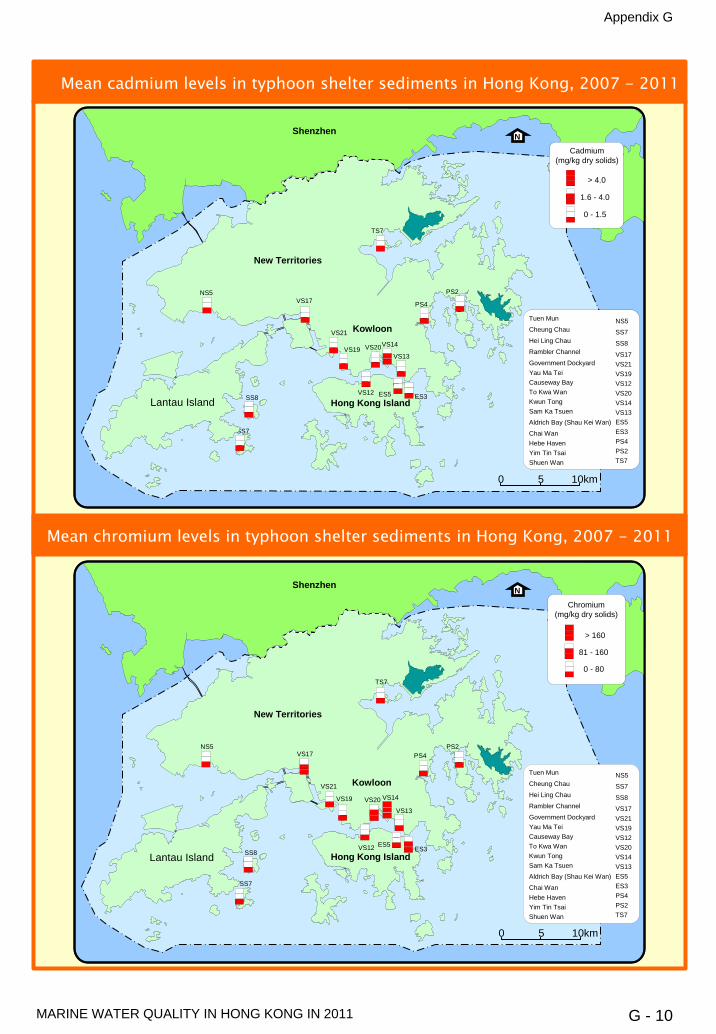
Appendix G
MARINE WATER QUALITY IN HONG KONG IN 2011 G - 10
0 5 10km
N
New Territories
Lantau Island Hong Kong Island
Kowloon
TS7
PS2
VS13
VS14VS20VS19
ES5 ES3
SS7
NS5VS17
VS12
VS21
SS8
PS4
Tuen Mun
Cheung Chau
Hei Ling Chau
Rambler Channel
Government DockyardYau Ma TeiCauseway BayTo Kwa WanKwun TongSam Ka TsuenAldrich Bay (Shau Kei Wan)
Chai WanHebe Haven Yim Tin TsaiShuen Wan
NS5
SS7
SS8
VS17VS21VS19VS12VS20VS14VS13ES5ES3PS4PS2TS7
0 5 10km
N
New Territories
Lantau Island Hong Kong Island
Kowloon
TS7
PS2
VS13
VS14VS20VS19
ES5ES3
SS7
NS5VS17
VS12
VS21
PS4
SS8
Tuen Mun
Cheung Chau
Hei Ling Chau
Rambler Channel
Government DockyardYau Ma TeiCauseway BayTo Kwa WanKwun TongSam Ka TsuenAldrich Bay (Shau Kei Wan)
Chai WanHebe Haven Yim Tin TsaiShuen Wan
NS5
SS7
SS8
VS17VS21VS19VS12VS20VS14VS13ES5ES3PS4PS2TS7
Mean chromium levels in typhoon shelter sediments in Hong Kong, 2007 - 2011
Mean cadmium levels in typhoon shelter sediments in Hong Kong, 2007 - 2011
Lantau Island
Lantau Island
Shenzhen
Cadmium(mg/kg dry solids)
> 4.0
1.6 - 4.0
0 - 1.5
Shenzhen
Chromium(mg/kg dry solids)
> 160
81 - 160
0 - 80

0 5 10km
N
New Territories
Lantau Island Hong Kong Island
Kowloon
TS7
PS2
VS13
VS14VS20VS19
ES5 ES3
SS7
NS5VS17
VS12SS8
PS4
VS21
Tuen Mun
Cheung Chau
Hei Ling Chau
Rambler Channel
Government DockyardYau Ma TeiCauseway BayTo Kwa WanKwun TongSam Ka TsuenAldrich Bay (Shau Kei Wan)
Chai WanHebe Haven Yim Tin TsaiShuen Wan
NS5
SS7
SS8
VS17VS21VS19VS12VS20VS14VS13ES5ES3PS4PS2TS7
0 5 10km
N
New Territories
Lantau Island Hong Kong Island
Kowloon
TS7
PS2
VS13
VS14VS20VS19
ES5ES3
SS7
NS5VS17
VS12
VS21
PS4
SS8
Tuen Mun
Cheung Chau
Hei Ling Chau
Rambler Channel
Government DockyardYau Ma TeiCauseway BayTo Kwa WanKwun TongSam Ka TsuenAldrich Bay (Shau Kei Wan)
Chai WanHebe Haven Yim Tin TsaiShuen Wan
NS5
SS7
SS8
VS17VS21VS19VS12VS20VS14VS13ES5ES3PS4PS2TS7
Mean copper levels in typhoon shelter sediments in Hong Kong, 2007 - 2011
Mean mercury levels in typhoon shelter sediments in Hong Kong, 2007 - 2011
Lantau Island
Lantau Island
Appendix G
MARINE WATER QUALITY IN HONG KONG IN 2011 G - 11
Shenzhen
Copper(mg/kg dry solids)
> 110
66 - 110
0 - 65
Shenzhen
Mercury(mg/kg dry solids)
> 1.0
0.6 - 1.0
0 - 0.5

0 5 10km
N
New Territories
Lantau Island Hong Kong Island
Kowloon
TS7
PS2
VS13
VS14VS20VS19
ES5 ES3
NS5VS17
VS12
PS4
SS8
VS21
Tuen Mun
Cheung Chau
Hei Ling Chau
Rambler Channel
Government DockyardYau Ma TeiCauseway BayTo Kwa WanKwun TongSam Ka TsuenAldrich Bay (Shau Kei Wan)
Chai WanHebe Haven Yim Tin TsaiShuen Wan
NS5
SS7
SS8
VS17VS21VS19VS12VS20VS14VS13ES5ES3PS4PS2TS7
0 5 10km
N
New Territories
Lantau Island Hong Kong Island
Kowloon
TS7
PS2
VS13
VS14VS20VS19
ES5 ES3
NS5VS17
VS12SS8
PS4
VS21
Tuen Mun
Cheung Chau
Hei Ling Chau
Rambler Channel
Government DockyardYau Ma TeiCauseway BayTo Kwa WanKwun TongSam Ka TsuenAldrich Bay (Shau Kei Wan)
Chai WanHebe Haven Yim Tin TsaiShuen Wan
NS5
SS7
SS8
VS17VS21VS19VS12VS20VS14VS13ES5ES3PS4PS2TS7
Mean Lead levels in typhoon shelter sediments in Hong Kong, 2007 - 2011
Mean nickel levels in typhoon shelter sediments in Hong Kong, 2007 - 2011
SS7
Lantau Island
Lantau Island
SS7
Appendix G
MARINE WATER QUALITY IN HONG KONG IN 2011 G - 12
Shenzhen
Nickel(mg/kg dry solids)
> 40
35 - 40
0 - 34
Shenzhen
Lead(mg/kg dry solids)
> 110
76 - 110
0 - 75

0 5 10km
N
New Territories
Hong Kong Island
Kowloon
TS7
PS2
VS13
VS14VS20VS19
ES5 ES3
NS5VS17
VS12SS8
PS4
VS21
Tuen Mun
Cheung Chau
Hei Ling Chau
Rambler Channel
Government DockyardYau Ma TeiCauseway BayTo Kwa WanKwun TongSam Ka TsuenAldrich Bay (Shau Kei Wan)
Chai WanHebe Haven Yim Tin TsaiShuen Wan
NS5
SS7
SS8
VS17VS21VS19VS12VS20VS14VS13ES5ES3PS4PS2TS7
Mean zinc levels in typhoon shelter sediments in Hong Kong, 2007 - 2011
Mean silver levels in typhoon shelter sediments in Hong Kong, 2007 - 2011
Lantau Island
SS7
Appendix G
MARINE WATER QUALITY IN HONG KONG IN 2011 G - 13
0 5 10km
N
New Territories
Hong Kong Island
Kowloon
TS7
PS2
VS13
VS14VS20VS19
ES5ES3
SS7
NS5VS17
VS12
VS21
SS8
PS4
Tuen Mun
Cheung Chau
Hei Ling Chau
Rambler Channel
Government DockyardYau Ma TeiCauseway BayTo Kwa WanKwun TongSam Ka TsuenAldrich Bay (Shau Kei Wan)
Chai WanHebe Haven Yim Tin TsaiShuen Wan
NS5
SS7
SS8
VS17VS21VS19VS12VS20VS14VS13ES5ES3PS4PS2TS7
Lantau Island
Shenzhen
Silver(mg/kg dry solids)
>2
1.1 – 2.0
0 – 1.0
Shenzhen
Zinc(mg/kg dry solids)
>270
201 - 270
0 - 200

Appendix G
MARINE WATER QUALITY IN HONG KONG IN 2011 G - 14
0 5 10km
N
New Territories
Lantau Island Hong Kong Island
Kowloon
TS7
PS2
VS13
VS14VS20VS19
ES5 ES3
NS5VS17
VS12
PS4
VS21
SS8
Tuen Mun
Cheung Chau
Hei Ling Chau
Rambler Channel
Government DockyardYau Ma TeiCauseway BayTo Kwa WanKwun TongSam Ka TsuenAldrich Bay (Shau Kei Wan)
Chai WanHebe Haven Yim Tin TsaiShuen Wan
NS5
SS7
SS8
VS17VS21VS19VS12VS20VS14VS13ES5ES3PS4PS2TS7
0 5 10km
N
New Territories
Lantau Island Hong Kong Island
Kowloon
TS7
PS2
VS13
VS14VS20VS19
ES5 ES3
NS5VS17
VS12SS8
PS4
VS21
Tuen Mun
Cheung Chau
Hei Ling Chau
Rambler Channel
Government DockyardYau Ma TeiCauseway BayTo Kwa WanKwun TongSam Ka TsuenAldrich Bay (Shau Kei Wan)
Chai WanHebe Haven Yim Tin TsaiShuen Wan
NS5
SS7
SS8
VS17VS21VS19VS12VS20VS14VS13ES5ES3PS4PS2TS7
Mean total polychlorinated biphenyls (PCBs) levels in typhoon shelter sediments in Hong Kong, 2007 - 2011
Mean arsenic levels in typhoon shelter sediments in Hong Kong, 2007 - 2011
Lantau Island
SS7
Lantau Island
SS7
Shenzhen
Arsenic(mg/kg dry solids)
>42
13 - 42
0 - 12
Shenzhen
Total PCBs(μg/kg dry solids)
>180
24 - 180
0 - 23
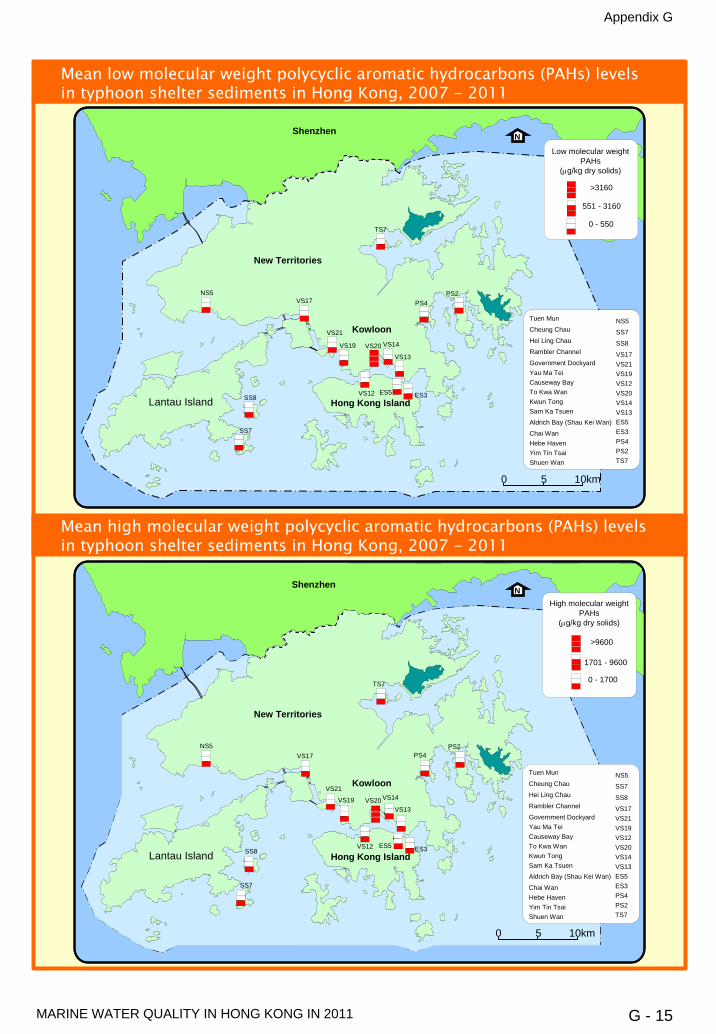
Appendix G
MARINE WATER QUALITY IN HONG KONG IN 2011 G - 15
0 5 10km
N
New Territories
Lantau Island Hong Kong Island
Kowloon
TS7
PS2
VS13
VS14VS20VS19
ES5 ES3
SS7
NS5VS17
VS12SS8
VS21
PS4
Tuen Mun
Cheung Chau
Hei Ling Chau
Rambler Channel
Government DockyardYau Ma TeiCauseway BayTo Kwa WanKwun TongSam Ka TsuenAldrich Bay (Shau Kei Wan)
Chai WanHebe Haven Yim Tin TsaiShuen Wan
NS5
SS7
SS8
VS17VS21VS19VS12VS20VS14VS13ES5ES3PS4PS2TS7
Mean high molecular weight polycyclic aromatic hydrocarbons (PAHs) levelsin typhoon shelter sediments in Hong Kong, 2007 - 2011
Mean low molecular weight polycyclic aromatic hydrocarbons (PAHs) levelsin typhoon shelter sediments in Hong Kong, 2007 - 2011
Lantau Island
Lantau Island
Shenzhen
Low molecular weight PAHs
(μg/kg dry solids)
>3160
551 - 3160
0 - 550
Shenzhen
High molecular weight PAHs
(μg/kg dry solids)
>9600
0 - 1700
1701 - 9600
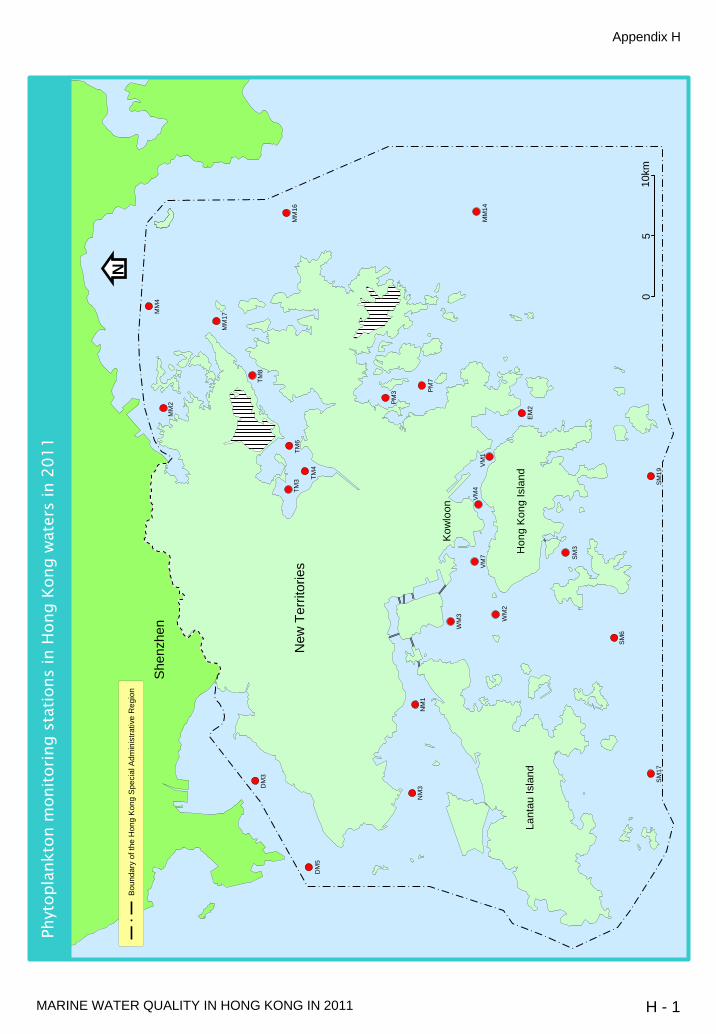
Appendix H
MARINE WATER QUALITY IN HONG KONG IN 2011 H - 1
N
05
10km
DM
3
DM
5
NM
3N
M1
WM
3 WM
2
SM17
SM6
SM3
SM19
VM7
VM4
EM2
MM
14
PM7
Hon
g K
ong
Isla
nd
New
Ter
ritor
ies
Kow
loon
Shen
zhen
PM3
TM4
TM3
TM6
MM
16
TM8
MM
4
MM
2
MM
17
VM1
Bou
ndar
y of
the
Hon
g K
ong
Spe
cial
Adm
inis
trativ
e R
egio
n
Phyt
opla
nkto
n m
onito
ring
stat
ions
in H
ong
Kong
wat
ers
in 2
011
Lant
au Is
land
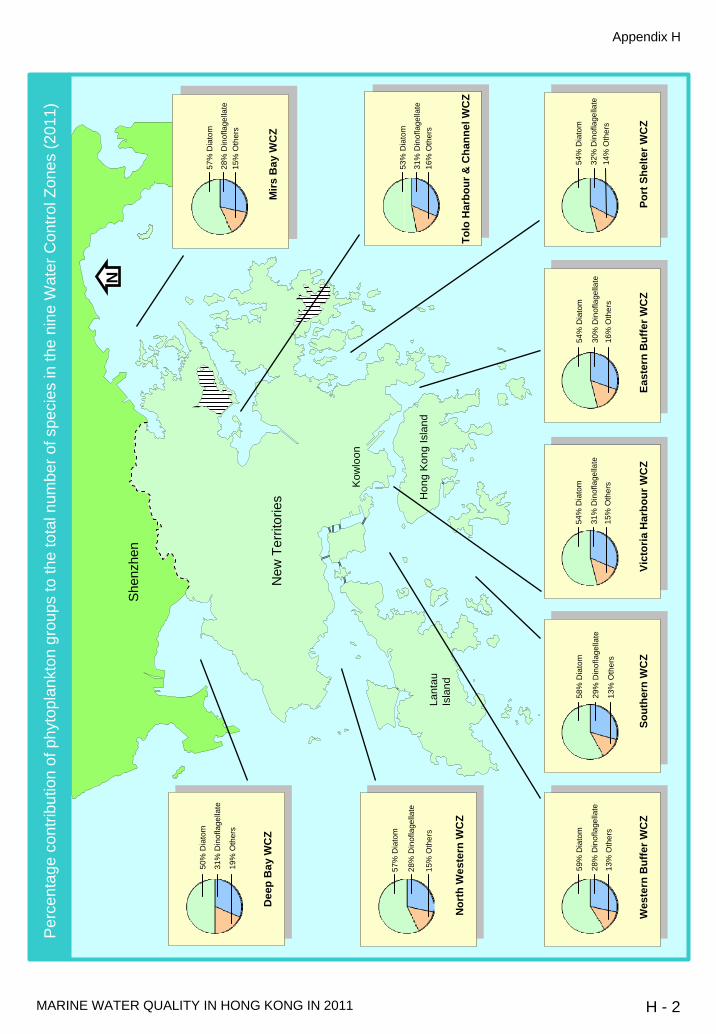
Appendix H
MARINE WATER QUALITY IN HONG KONG IN 2011 H - 2
Per
cent
age
cont
ribut
ion
of p
hyto
plan
kton
gro
ups
to th
e to
tal n
umbe
r of s
peci
es in
the
nine
Wat
er C
ontro
l Zon
es (2
011)
54%
Dia
tom
32%
Din
ofla
gella
te14
% O
ther
s
Port
She
lter W
CZ
53%
Dia
tom
31%
Din
ofla
gella
te16
% O
ther
s
57%
Dia
tom
28%
Din
ofla
gella
te15
% O
ther
s
Mirs
Bay
WC
Z
59%
Dia
tom
28%
Din
ofla
gella
te
13%
Oth
ers
Wes
tern
Buf
fer W
CZ
58%
Dia
tom
29%
Din
ofla
gella
te
13%
Oth
ers
Sout
hern
WC
Z
54%
Dia
tom
31%
Din
ofla
gella
te
15%
Oth
ers
Vict
oria
Har
bour
WC
Z
54%
Dia
tom
30%
Din
ofla
gella
te16
% O
ther
s
East
ern
Buf
fer W
CZ
50%
Dia
tom
31%
Din
ofla
gella
te
19%
Oth
ers
Dee
p B
ay W
CZ
57%
Dia
tom
28%
Din
ofla
gella
te
15%
Oth
ers
Nor
th W
este
rn W
CZ
Shen
zhen
New
Ter
ritor
ies H
ong
Kon
g Is
land
Kow
loon
N
Lant
au
Isla
nd
Tolo
Har
bour
& C
hann
el W
CZ

Appendix H
MARINE WATER QUALITY IN HONG KONG IN 2011 H - 3
Per
cent
age
cont
ribut
ion
of p
hyto
plan
kton
gro
ups
to th
e to
tal d
ensi
ty in
the
nine
Wat
er C
ontro
l Zon
es (2
011)
Shen
zhen
New
Ter
ritor
ies H
ong
Kon
g Is
land
Kow
loon
65%
Dia
tom
3% D
inof
lage
llate
32%
Oth
ers
Port
She
lter W
CZ
76%
Dia
tom
2% D
inof
lage
llate
22%
Oth
ers
East
ern
Buf
fer W
CZ
62%
Dia
tom
1% D
inof
lage
llate
37%
Oth
ers
Vict
oria
Har
bour
WC
Z
71%
Dia
tom
2% D
inof
lage
llate
27%
Oth
ers
Sout
hern
WC
Z
55%
Dia
tom
3% D
inof
lage
llate
42%
Oth
ers
Wes
tern
Buf
fer W
CZ
54%
Dia
tom
3% D
inof
lage
llate
43%
Oth
ers
Mirs
Bay
WC
Z
49%
Dia
tom
1% D
inof
lage
llate
50%
Oth
ers
Dee
p B
ay W
CZ
N
Lant
au
Isla
ndN
orth
Wes
tern
WC
Z
45%
Dia
tom
2% D
inof
lage
llate
53%
Oth
ers
Tolo
Har
bour
& C
hann
el W
CZ
60%
Dia
tom
4% D
inof
lage
llate
36%
Oth
ers

Appendix H
MARINE WATER QUALITY IN HONG KONG IN 2011 H - 4
Ann
ual m
ean
dens
ities
(cel
l/mL)
of t
otal
phy
topl
ankt
on a
t 25
mon
itorin
g st
atio
ns in
Hon
g K
ong
wat
ers
in 2
011
N
05
10km
Hon
g K
ong
Isla
nd
New
Ter
ritor
ies
Kow
loon
Shen
zhen
DM
3
DM
5
NM
3N
M1
WM
3 WM
2
SM17
SM6
SM3
SM19
VM7
VM4
VM1
EM2
MM
14
PM7
PM3
TM4
TM3
TM6
TM8
MM
16
MM
17
MM
4M
M2
Tota
l phy
topl
ankt
onde
nsity
(cel
l/mL)
> 90
00
7501
-90
00
6001
-75
00
4501
-60
00
3001
-45
00
1501
-30
00
0
-150
0
Bou
ndar
y of
the
Hon
g K
ong
Spe
cial
Adm
inis
trativ
e R
egio
n
Lant
au Is
land

Appendix H
MARINE WATER QUALITY IN HONG KONG IN 2011 H - 5
Ann
ual m
ean
dens
ities
(cel
l/mL)
of d
iato
ms
at 2
5 m
onito
ring
stat
ions
in H
ong
Kon
g w
ater
s in
201
1
N
05
10km
Hon
g K
ong
Isla
nd
New
Ter
ritor
ies
Kow
loon
Shen
zhen
MM
14
Dia
tom
den
sity
(cel
l/mL)
> 90
00
7501
-90
00
6001
-75
00
4501
-60
00
3001
-45
00
1501
-30
00
0
-150
0
TM8
MM
16
MM
17
MM
4M
M2
DM
3
DM
5
NM
3N
M1
WM
3 WM
2
SM17
SM6
SM3
SM19
VM7
VM4
VM1
EM2
PM7
PM3
TM4
TM3
TM6
Bou
ndar
y of
the
Hon
g K
ong
Spe
cial
Adm
inis
trativ
e R
egio
n
Lant
au Is
land
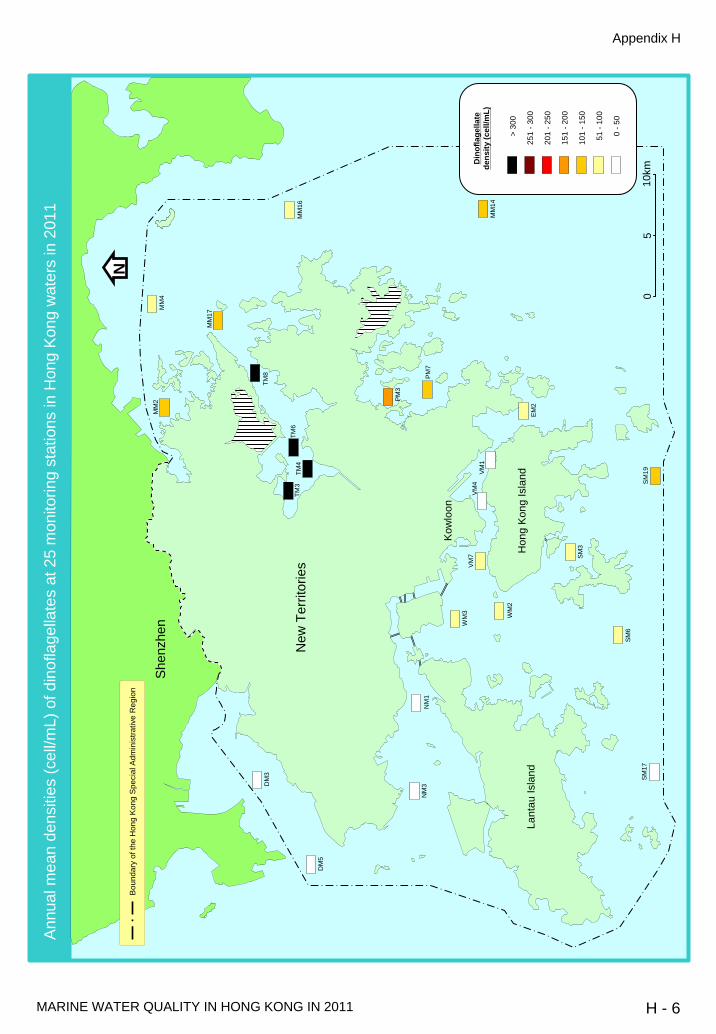
Appendix H
MARINE WATER QUALITY IN HONG KONG IN 2011 H - 6
Ann
ual m
ean
dens
ities
(cel
l/mL)
of d
inof
lage
llate
s at
25
mon
itorin
g st
atio
ns in
Hon
g K
ong
wat
ers
in 2
011
N
05
10km
Hon
g K
ong
Isla
nd
New
Ter
ritor
ies
Kow
loon
Shen
zhen
EM2
MM
14
PM7
PM3
TM4
TM3
TM6
TM8
MM
16
MM
17
MM
4M
M2
Din
ofla
gella
tede
nsity
(cel
l/mL)
> 30
0
251
-300
201
-250
151
-200
101
-150
51 -
100
0 -5
0
DM
3
DM
5
NM
3N
M1
WM
3 WM
2
SM17
SM6
SM3
SM19
VM7
VM4
VM1
Bou
ndar
y of
the
Hon
g K
ong
Spe
cial
Adm
inis
trativ
e R
egio
n
Lant
au Is
land

Appendix H
MARINE WATER QUALITY IN HONG KONG IN 2011 H - 7
Ann
ual m
ean
dens
ities
(cel
l/mL)
of o
ther
phy
topl
ankt
on g
roup
s at
25
mon
itorin
g st
atio
ns in
Hon
g K
ong
wat
ers
in 2
011
N
05
10km
Hon
g K
ong
Isla
ndLa
ntau
Isla
nd
New
Ter
ritor
ies
Kow
loon
Shen
zhen
MM
14
Oth
er p
hyto
plan
kton
grou
ps d
ensi
ty (c
ell/m
L)
> 30
00
2501
-30
00
2001
-25
00
1501
-20
00
1001
-15
00
501
-100
0
0 -
500
DM
3
DM
5
NM
3N
M1
WM
3 WM
2
SM17
SM6
SM3
SM19
VM7
VM4
VM1
EM2
PM7
PM3
TM4
TM3
TM6
TM8
MM
16
MM
17
MM
4M
M2
Bou
ndar
y of
the
Hon
g K
ong
Spe
cial
Adm
inis
trativ
e R
egio
n
Lant
auIs
land

Appendix H
MARINE WATER QUALITY IN HONG KONG IN 2011 H - 8
Freq
uenc
y of
red
tides
in 1
0 W
ater
Con
trol Z
ones
in H
ong
Kon
g, 1
980
-201
1
Shen
zhen
New
Ter
ritor
ies H
ong
Kon
g Is
land
Kow
loon
N
05101520
8082
8486
8890
9294
9698
0002
0406
0810
Mirs
Bay
WC
Z
051015202530354045
8082
8486
8890
9294
9698
0002
0406
0810
Tolo
Har
bour
& C
hann
el W
CZ
05101520
8082
8486
8890
9294
9698
0002
0406
0810
Port
Shel
ter W
CZ
0246810
8082
8486
8890
9294
9698
0002
0406
0810
East
ern
Buffe
r WC
Z
0246810
8082
8486
8890
9294
9698
0002
0406
0810
Junk
Bay
WC
Z
0246810
8082
8486
8890
9294
9698
0002
0406
0810
Vict
oria
Har
bour
WC
Z
05101520
8082
8486
8890
9294
9698
0002
0406
0810
Sout
hern
WC
Z
0246810
8082
8486
8890
9294
9698
0002
0406
0810
Wes
tern
Buf
fer W
CZ
0246810
8082
8486
8890
9294
9698
0002
0406
0810
Nor
th W
este
rn W
CZ
0246810
8082
8486
8890
9294
9698
0002
0406
0810
Dee
p Ba
y W
CZ
Sou
rce:
Agr
icul
ture
, Fis
herie
s an
d C
onse
rvat
ion
Dep
artm
ent a
nd E
nviro
nmen
tal P
rote
ctio
n D
epar
tmen
t
Lant
auIs
land

Appendix H
MARINE WATER QUALITY IN HONG KONG IN 2011 H - 9
Occurrence of red tides in Hong Kong waters, 1980 – 2011(Sources: Agriculture, Fisheries and Conservation Department and Environmental Protection Department)
Yearly Distribution
Monthly Distribution
Total red tide occurrences1980 - 2011 : 840 cases
- Red tide occurrences in 2011

Appendix H
MARINE WATER QUALITY IN HONG KONG IN 2011 H - 10
Seasonal occurrence of red tides caused by different phytoplankton groups in Hong Kong, 1980 – 2011(Sources: Agriculture, Fisheries and Conservation Department and Environmental Protection Department)
Red tides caused by other minor algal groups : 145 cases
Red tides caused by dinoflagellates : 538 cases
Red tides caused by diatoms : 137 cases

Appendix H
MARINE WATER QUALITY IN HONG KONG IN 2011 H - 11
Abun
danc
e an
d fre
quen
cy o
f the
dom
inan
t phy
topl
ankt
on s
peci
es in
diffe
rent
Wat
er C
ontro
l Zon
es (W
CZs
) in
2011
.
Spec
ies
%
Abu
ndan
ce1
Freq
uenc
y2
Spec
ies
% A
bund
ance
1 Fr
eque
ncy2
Sp
ecie
s %
Abu
ndan
ce1
Freq
uenc
y2
To
lo H
arbo
ur &
Cha
nnel
Port
She
lter
N
orth
Wes
tern
D
iato
ms
D
iato
ms
D
iato
ms
Cha
etoc
eros
spp.
40
.2
12
C
haet
ocer
os sp
p.
43.3
11
Thal
assi
osir
a sp
p.
71.0
12
Th
alas
sios
ira
spp.
13
.9
12
C
ylin
drot
heca
clo
ster
ium
16
.6
12
Skel
eton
ema
cost
atum
10
.6
12
Cyl
indr
othe
ca c
lost
eriu
m
12.5
11
Thal
assi
osir
a sp
p.
13.0
12
Cha
etoc
eros
spp.
7.
9 8
Din
ofla
gella
tes
D
inof
lage
llate
s
Din
ofla
gella
tes
Gym
nodi
nium
spp.
61
.9
12
G
ymno
dini
um sp
p.
42.0
11
Gym
nodi
nium
spp.
45
.6
9 Ka
reni
a m
ikim
otoi
6.
8 5
Sc
ripp
siel
la sp
p.
16.2
8
G
yrod
iniu
m fu
sifo
rme
13.6
7
Prot
oper
idin
ium
spp.
6.
0 6
Am
phid
iniu
m sp
p.
11.1
11
Am
phid
iniu
msp
p.
10.2
5
Oth
ers
O
ther
s
Oth
ers
smal
l fla
gella
tes
84.6
12
smal
l fla
gella
tes
87.1
12
smal
l fla
gella
tes
80.8
12
Pl
agio
selm
is p
rolo
nga
10.8
12
Pl
agio
selm
is p
rolo
nga
9.1
12
Plag
iose
lmis
pro
long
a 14
.0
12
Het
eros
igm
a ak
ashi
wo
2.4
3
Tele
aula
x ac
uta
3.3
11
Tele
aula
x ac
uta
4.1
12
Mir
s Bay
Vic
tori
a H
arbo
ur
W
este
rn B
uffe
r
D
iato
ms
D
iato
ms
D
iato
ms
Cha
etoc
eros
spp.
24
.6
12
Sk
elet
onem
a co
stat
um
38.2
12
Cha
etoc
eros
spp.
27
.2
9 C
ylin
drot
heca
clo
ster
ium
12
.4
11
C
haet
ocer
os sp
p.
22.0
11
Skel
eton
ema
cost
atum
25
.1
11
Lept
ocyl
indr
us d
anic
us
12.1
11
Th
alas
sios
ira
spp.
14
.1
12
Thal
assi
osir
a sp
p.
12.7
12
D
inof
lage
llate
s
Din
ofla
gella
tes
D
inof
lage
llate
s
G
ymno
dini
um sp
p.
41.3
12
G
ymno
dini
um sp
p.
47.5
11
G
ymno
dini
um sp
p.
67.2
12
Ak
ashi
wo sa
ngui
ne
13.4
3
G
yrod
iniu
m fu
sifo
rme
14.9
9
Am
phid
iniu
m sp
p.
10.1
8
Kare
nia
mik
imot
oi
12.2
6
Pr
otop
erid
iniu
m sp
p.
7.7
6
Gyr
odin
ium
spp.
5.
3 4
Oth
ers
O
ther
s
Oth
ers
smal
l fla
gella
tes
82.6
12
smal
l fla
gella
tes
81.9
12
smal
l fla
gella
tes
81.1
12
Pl
agio
selm
is p
rolo
nga
12.1
12
Pl
agio
selm
is p
rolo
nga
12.8
12
Pl
agio
selm
is p
rolo
nga
14.6
12
Te
leau
lax
acut
a 4.
5 12
Tele
aula
x ac
uta
4.4
12
Te
leau
lax
acut
a 3.
2 12
E
aste
rn B
uffe
r
Sout
hern
Dee
p B
ay
Dia
tom
s
Dia
tom
s
Dia
tom
s
As
teri
onel
lops
is g
laci
alis
31
.8
2
Thal
assi
osir
a sp
p.
18.9
12
Cha
etoc
eros
spp.
34
.8
8 Sk
elet
onem
a co
stat
um
26.1
8
Sk
elet
onem
a co
stat
um
18.1
10
Sk
elet
onem
a co
stat
um
27.2
12
Ps
eudo
-nitz
schi
a sp
p.
12.1
7
Cha
etoc
eros
spp.
15
.4
12Th
alas
sios
ira
spp.
19
.8
12
Din
ofla
gella
tes
D
inof
lage
llate
s
Din
ofla
gella
tes
Gym
nodi
nium
spp.
38
.9
7
Gym
nodi
nium
spp.
53
.4
11
Gym
nodi
nium
spp.
50
.2
9Pr
otop
erid
iniu
m sp
p.
11.7
7
Am
phid
iniu
m sp
p.
13.4
11
Gyr
odin
ium
fusi
form
e 11
.3
7 Am
phid
iniu
m sp
p.
9.2
6
Prot
oper
idin
ium
spp.
8.
9 8
Sc
ripp
siel
la sp
p.
11.0
3
Oth
ers
O
ther
s
Oth
ers
smal
l fla
gella
tes
82.0
12
sm
all f
lage
llate
s 86
.0
12
smal
l fla
gella
tes
73.1
12
Pl
agio
selm
is p
rolo
nga
11.6
12
Pl
agio
selm
is p
rolo
nga
11.0
12
Pl
agio
selm
is p
rolo
nga
15.1
12
Te
leau
lax
acut
a 5.
4 11
Tele
aula
x ac
uta
2.4
12
Te
leau
lax
acut
a 8.
0 12
1
% o
f spe
cies
/gro
up in
dia
tom
s, di
nofla
gella
tes a
nd o
ther
phy
topl
ankt
on
2 N
umbe
r of o
ccur
renc
es o
ut o
f 12
sam
plin
g oc
casi
ons.

Occurrence and distribution of red tide species in different Water Control Zones (WCZs), 1980 -2011 Number of occurrences
Species Tolo Harbour
& Channel WCZ
Mirs Bay WCZ
Eastern Buffer WCZ
Port Shelter
WCZ
Junk Bay WCZ
Victoria Harbour
WCZ
Southern Waters WCZ
North Western
WCZ
Western Buffer WCZ
Deep Bay WCZ
Total
Noctiluca scintillans 64 69 57 58 6 7 261 Skeletonema costatum 23 3 1 3 9 12 3 9 2 65 Mesodinium rubrum 8 9 10 1 17 7 2 2 56 Gonyaulax polygramma 21 8 15 6 1 51 Prorocentrum minimum 44 1 45 Ceratium furca 15 7 13 35 Prorocentrum triestinum 33 33 Scrippsiella trochoidea 15 5 3 1 24 Heterosigma akashiwo 15 2 3 1 21 Heterocapsa circularisquama 13 3 16 Prorocentrum sigmoides 14 1 1 16 Prorocentrum dentatum 8 4 1 1 14 Trichodesmium erythraeum 6 5 3 14 Thalassiosira nordenskioeldii 2 3 1 4 2 12 Akashiwo sanguinea 3 3 1 1 2 1 11 Karenia mikimotoi 6 2 3 11 Phaeocystis globosa 1 9 1 11 Prorocentrum micans 4 4 1 1 1 11 Leptocylindrus minimus 10 10 Cryptomonas spp. 8 8 Dactyliosolen fragilissimus 6 1 1 8 Karenia digitata 1 3 2 2 8 Thalassiosira mala 6 2 8 Chaetoceros spp. 6 1 7 Plagioselmis prolonga 7 7 Thalassiosira proschkinae 6 1 7 Cochlodinium spp. 2 2 1 1 6 Gyrodinium instriatum 1 1 2 1 1 6 Dictyocha speculum 2 2 1 5 Thalassiosira spp. 2 1 2 5 Eutreptiella spp. 4 4 Haematococcus pluvialis 4 4 Leptocylindrus danicus 3 1 4 Pseudo-nitzschia pseudodelicatissima 1 2 1 4 Chaetoceros curvisetus 1 1 1 3 Chaetoceros socialis 1 2 3 Chattonella marina 2 1 3 Chattonella ovata 2 1 3 Cochlodinium polykrikoides 1 2 3 Gymnodinium simplex 3 3 Karenia longicanalis 1 1 1 3 Prorocentrum balticum 1 1 1 3 Pseudo-nitzschia seriata 1 2 3 Teleaulax acuta 3 3 Trichodesmium spp. 1 1 1 3 Alexandrium catenella 1 1 2 Alexandrium tamarense 2 2 Cerataulina pelagica 2 2 Chaetoceros salsugineum 1 1 2 Chattonella spp. 1 1 2 Eucampia zodiacus 1 1 2 Fibrocapsa japonica 1 1 2 Gymnodinium spp. X 2 2 Heterocapsa rotundata 2 2 Nitzschia longissima 1 1 2 Prorocentrum spp. 1 1 2 Protopolykrokos distortus 1 1 2 Pseudo-nitzschia spp. 2 2 Thalassiosira tealata 2 2 Thalassiosira weissflogii 2 2 Chaetoceros pseudocrinitus 1 1 Chaetoceros pseudocurvisetus 1 1 Chaetoceros spp.0105 1 1 Chaetoceros tenuissimus 1 1 Chlamydomonas spp. 1 1 Chlamydomonas uva-maris 1 1 Cyclotella caspia 1 1 Cyclotella spp. 1 1 Cylindrotheca closterium 1 1 Cyttarocylis spp. 1 1 Guinardia delicatula 1 1 Guinardia striata 1 1 Gymnodinium spp. 1 1 Gyrodinium spirale 1 1 Hermesinum adriaticum 1 1 Karenia papilionacea 1 1 Karlodinium micrum 1 1 Katodinium rotundatum 1 1 Leptocylindrus spp. 1 1 Navicula spp. 1 1 Odontella mobiliensis 1 1 Odontella sinensis 1 1 Pedinomonadaceae spp. 1 1 Protoperidinium quinquecorne 1 1 Takayama pulchella 1 1 Thalassomonas spp. 1 1 Trichodesmium thiebautii 1 1 Total : 87 species 388 152 1 128 7 14 144 29 23 12 898
Note: a red tide incident may involve more than one causative species. Source: Agriculture, Fisheries and Conservation Department and Environmental Protection Department
Appendix H
MARINE WATER QUALITY IN HONG KONG IN 2011 H - 12

Appendix I
MARINE WATER QUALITY IN HONG KONG IN 2011 I - 1
WaterControl Zone
Tolo Harbour& Channel
Southern
Port Shelter
Junk Bay
Deep Bay
Mirs Bay
NorthWestern
WesternBuffer
EasternBuffer
VictoriaHarbour
OverallDissolvedOxygen E. coli
UnionisedAmmonia
Total InorganicNitrogen
% co
mpl
ianc
e%
com
plia
nce
% co
mpl
ianc
e%
com
plia
nce
% co
mpl
ianc
e%
com
plia
nce
% co
mpl
ianc
e%
com
plia
nce
% co
mpl
ianc
e%
com
plia
nce
YearYear YearYearYear
Level of compliance with key marine Water Quality Objectives for10 Water Control Zones in Hong Kong, 2002 - 2011
020406080
100
02 03 04 05 06 07 08 09 10 11
NOT APPLICABLE
020406080
100
02 03 04 05 06 07 08 09 10 11
NOT APPLICABLE
020406080
100
02 03 04 05 06 07 08 09 10 11
NOT APPLICABLE
020406080
100
02 03 04 05 06 07 08 09 10 11
NOT APPLICABLE
020406080
100
02 03 04 05 06 07 08 09 10 11
NOT APPLICABLE
020406080
100
02 03 04 05 06 07 08 09 10 11
NOT APPLICABLE
020406080
100
02 03 04 05 06 07 08 09 10 11
NOT APPLICABLE
020406080
100
02 03 04 05 06 07 08 09 10 110
20406080
100
02 03 04 05 06 07 08 09 10 110
20406080
100
02 03 04 05 06 07 08 09 10 11
NOT APPLICABLE
020406080
100
02 03 04 05 06 07 08 09 10 110
20406080
100
02 03 04 05 06 07 08 09 10 11
020406080
100
02 03 04 05 06 07 08 09 10 110
20406080
100
02 03 04 05 06 07 08 09 10 110
20406080
100
02 03 04 05 06 07 08 09 10 110
20406080
100
02 03 04 05 06 07 08 09 10 11
020406080
100
02 03 04 05 06 07 08 09 10 110
20406080
100
02 03 04 05 06 07 08 09 10 110
20406080
100
02 03 04 05 06 07 08 09 10 110
20406080
100
02 03 04 05 06 07 08 09 10 11
020406080
100
02 03 04 05 06 07 08 09 10 110
20406080
100
02 03 04 05 06 07 08 09 10 110
20406080
100
02 03 04 05 06 07 08 09 10 110
20406080
100
02 03 04 05 06 07 08 09 10 11
020406080
100
02 03 04 05 06 07 08 09 10 110
20406080
100
02 03 04 05 06 07 08 09 10 110
20406080
100
02 03 04 05 06 07 08 09 10 110
20406080
100
02 03 04 05 06 07 08 09 10 110
20406080
100
02 03 04 05 06 07 08 09 10 11
020406080
100
02 03 04 05 06 07 08 09 10 110
20406080
100
02 03 04 05 06 07 08 09 10 110
20406080
100
02 03 04 05 06 07 08 09 10 110
20406080
100
02 03 04 05 06 07 08 09 10 11
020406080
100
02 03 04 05 06 07 08 09 10 110
20406080
100
02 03 04 05 06 07 08 09 10 110
20406080
100
02 03 04 05 06 07 08 09 10 110
20406080
100
02 03 04 05 06 07 08 09 10 11
020406080
100
02 03 04 05 06 07 08 09 10 110
20406080
100
02 03 04 05 06 07 08 09 10 110
20406080
100
02 03 04 05 06 07 08 09 10 110
20406080
100
02 03 04 05 06 07 08 09 10 110
20406080
100
02 03 04 05 06 07 08 09 10 11
020406080
100
02 03 04 05 06 07 08 09 10 110
20406080
100
02 03 04 05 06 07 08 09 10 110
20406080
100
02 03 04 05 06 07 08 09 10 110
20406080
100
02 03 04 05 06 07 08 09 10 110
20406080
100
02 03 04 05 06 07 08 09 10 11
020406080
100
02 03 04 05 06 07 08 09 10 110
20406080
100
02 03 04 05 06 07 08 09 10 110
20406080
100
02 03 04 05 06 07 08 09 10 11

Appendix I
MARINE WATER QUALITY IN HONG KONG IN 2011 I - 2
Overall level of compliance with key marine Water Quality Objectives in Hong Kong, 1986 - 2011
Level of compliance with key marine Water Quality Objectives in Hong Kong, 2002 - 2011
79 81
87
79
75
87
808383
87 87 8785
70
79
87
73 73
76
8581
77
82
76 80
81
50
60
70
80
90
100
86 87 88 89 90 91 92 93 94 95 96 97 98 99 00 01 02 03 04 05 06 07 08 09 10 11Year
% co
mpl
iance
E. coli
0
20
40
60
80
100
02 03 04 05 06 07 08 09 10 11Year
% co
mpl
iance
Unionised Ammonia
0
20
40
60
80
100
02 03 04 05 06 07 08 09 10 11Year
% co
mpl
iance
Dissolved Oxygen
0
20
40
60
80
100
02 03 04 05 06 07 08 09 10 11Year
% co
mpl
iance
Total Inorganic Nitrogen
0
20
40
60
80
100
02 03 04 05 06 07 08 09 10 11Year
% co
mpl
iance

Appendix I
MARINE WATER QUALITY IN HONG KONG IN 2011 I - 3
N
05
10km
Hon
g K
ong
Isla
nd
22°20
’N
22°10
’N
114°
00’E
114°
10’E
113°
50’E
114°
20’E
22°20
’N
22°10
’N
New
Ter
ritor
ies
Kow
loon
22°30
’N
114°
30’E
VM14
VM4
VM5
VM6
VM7
VM12
DM
2
Lant
auIs
land
VM15
VM2
VM1
SM3
NM
5
MM
8
114°
20’E
114°
10’E
114°
00’E
113°
50’E
Shen
zhen
22°30
’N
114°
30’E
Incr
easi
ng T
rend
Dec
reas
ing
Tren
d
Long
-ter
m c
hang
es in
dis
solv
ed o
xyge
n in
mar
ine
wat
ers
of H
ong
Kong
, 198
6 -
2011
DM
4
DM
3
SM19
SM20

Appendix I
MARINE WATER QUALITY IN HONG KONG IN 2011 I - 4
N
05
10km
Hon
g K
ong
Isla
nd
22°20
’N
22°10
’N
114°
00’E
114°
10’E
113°
50’E
114°
20’E
22°20
’N
22°10
’N
New
Ter
ritor
ies
Kow
loon
22°30
’N
114°
30’E
DM
1
TM7
TM5
TM4
TM8
TM2
TM3
TM6
PM6
DM
2
Lant
auIs
land
DM
3
PM2
EM1
VM1
VM2
114°
20’E
114°
10’E
114°
00’E
113°
50’E
Shen
zhen
22°30
’N
114°
30’E
Incr
easi
ng T
rend
Dec
reas
ing
Tren
d
Long
-ter
m c
hang
es in
5-d
ay B
ioch
emic
al O
xyge
n D
eman
d in
mar
ine
wat
ers
of H
ong
Kong
, 198
6 -
2011
VM14
VM12
MM
8
MM
17

Appendix I
MARINE WATER QUALITY IN HONG KONG IN 2011 I - 5
N
05
10km
Hon
g K
ong
Isla
ndLa
ntau
Isla
nd
22°20
’N
22°10
’N
114°
00’E
114°
10’E
113°
50’E
114°
20’E
22°20
’N
22°10
’N
New
Ter
ritor
ies
Kow
loon
22°30
’N
114°
30’E
NM
1
NM
5
WM
2
WM
3
WM
4
VM7
VM8
PM2
PM6
TM4 TM
2
VM5
EM2
EM3
Lant
auIs
land
TM3
TM6
VM1
EM1
TM5
TM7
PM3
JM3
JM4
VM2
VM4
SM11
SM1
114°
20’E
114°
10’E
114°
00’E
113°
50’E
Shen
zhen
22°30
’N
114°
30’E
Incr
easi
ng T
rend
Dec
reas
ing
Tren
d
Long
-ter
m c
hang
es in
E. c
olii
n m
arin
e w
ater
s of
Hon
g Ko
ng, 1
986
-20
11
DM
4
SM12
VM15
VM14
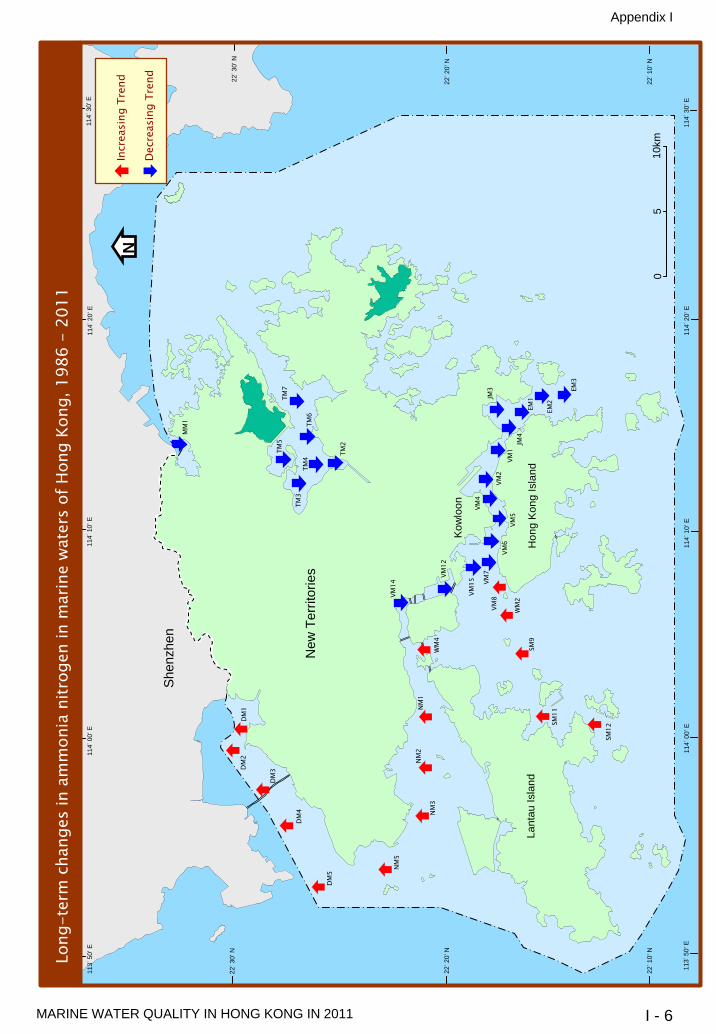
Appendix I
MARINE WATER QUALITY IN HONG KONG IN 2011 I - 6
N
05
10km
Hon
g K
ong
Isla
nd
22°20
’N
22°10
’N
114°
00’E
114°
10’E
113°
50’E
114°
20’E
22°20
’N
22°10
’N
New
Ter
ritor
ies
Kow
loon
22°30
’N
114°
30’E
DM
4
DM
1
NM
3
DM
3DM
2
NM
5
DM
5
NM
2
VM1
VM2
VM12
VM15
NM
1
TM2
TM3
TM4
TM6
TM7
Lant
auIs
land
SM9
SM11
VM8
VM6
VM4
JM3
EM1
EM2
EM3
TM5
WM
2VM
5JM
4MM
1
VM14 VM
7
114°
20’E
114°
10’E
114°
00’E
113°
50’E
Shen
zhen
22°30
’N
114°
30’E
Incr
easi
ng T
rend
Dec
reas
ing
Tren
d
Long
-ter
m c
hang
es in
am
mon
ia n
itrog
en in
mar
ine
wat
ers
of H
ong
Kong
, 198
6 -
2011
SM12
WM
4

Appendix I
MARINE WATER QUALITY IN HONG KONG IN 2011 I - 7
N
05
10km
Hon
g K
ong
Isla
nd
22°20
’N
22°10
’N
114°
00’E
114°
10’E
113°
50’E
114°
20’E
22°20
’N
22°10
’N
New
Ter
ritor
ies
Kow
loon
22°30
’N
114°
30’E
DM
4
VM14
WM
4N
M3
SM12
SM11
SM13
VM8
VM7
VM6
VM5
DM
3
TM2
TM3
TM5
TM4
TM6
TM7
Lant
auIs
land
SM10
VM12
DM
5
SM9
SM2
SM4
SM7W
M3
WM
2
VM4
SM1
MM
1
114°
20’E
114°
10’E
114°
00’E
113°
50’E
Shen
zhen
22°30
’N
114°
30’E
Incr
easi
ng T
rend
Dec
reas
ing
Tren
d
Long
-ter
m c
hang
es in
nitr
ate
nitr
ogen
in m
arin
e w
ater
s of
Hon
g Ko
ng, 1
986
-20
11
NM
5
SM17
VM2
PM8
MM
15
VM15
PM11PM
9
SM3
SM5
SM18

Appendix I
MARINE WATER QUALITY IN HONG KONG IN 2011 I - 8
N
05
10km
Hon
g K
ong
Isla
nd
22°20
’N
22°10
’N
114°
00’E
114°
10’E
113°
50’E
114°
20’E
22°20
’N
22°10
’N
New
Ter
ritor
ies
Kow
loon
22°30
’N
114°
30’E
DM
4
DM
3
DM
2D
M1
WM
4N
M3
NM
5
SM12
SM11
SM13
DM
5
VM8
TM2
TM3
TM5
TM4
TM6
TM7
NM
2
VM1
VM15
WM
2SM
9La
ntau
Isla
ndLa
ntau
Isla
nd
SM7
SM4
JM3
SM10
EM1
EM2
VM2
VM4
WM
3
JM4
114°
20’E
114°
10’E
114°
00’E
113°
50’E
Shen
zhen
22°30
’N
114°
30’E
Incr
easi
ng T
rend
Dec
reas
ing
Tren
d
Long
-ter
m c
hang
es in
tota
l ino
rgan
ic n
itrog
en in
mar
ine
wat
ers
of H
ong
Kong
, 198
6 -
2011
SM2
SM3
SM17
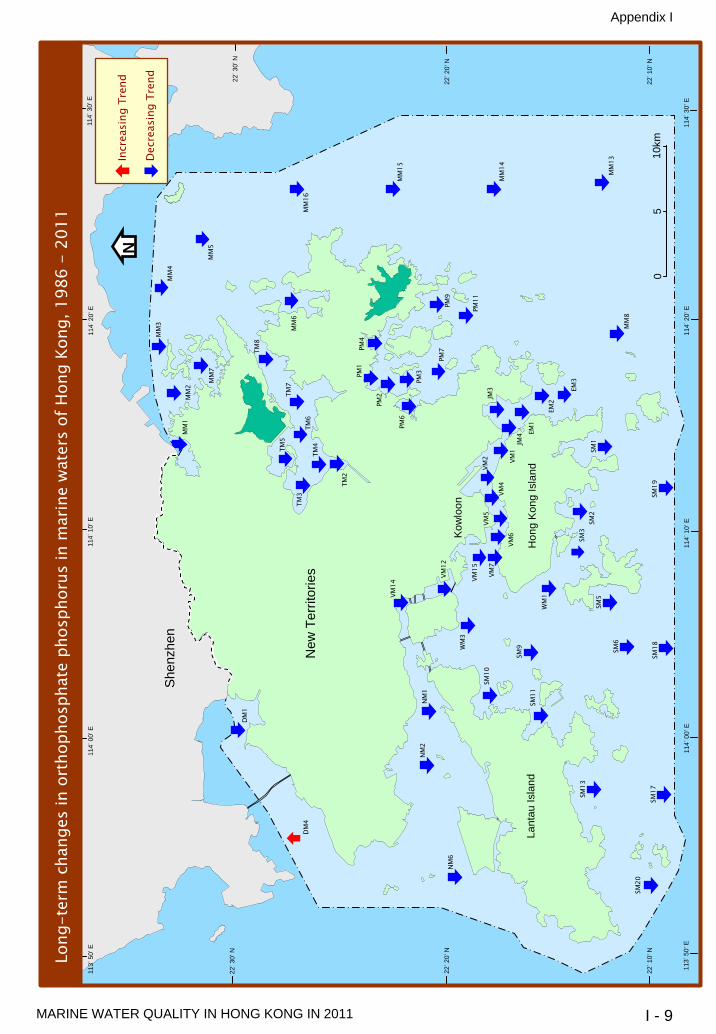
Appendix I
MARINE WATER QUALITY IN HONG KONG IN 2011 I - 9
N
05
10km
Hon
g K
ong
Isla
nd
22°20
’N
22°10
’N
114°
00’E
114°
10’E
113°
50’E
114°
20’E
22°20
’N
22°10
’N
New
Ter
ritor
ies
Kow
loon
22°30
’N
114°
30’E
TM2
VM14
VM15
MM
3
SM17
PM11
MM
16
MM
6
MM
15
MM
1
MM
14
NM
6
TM7
TM3
TM5
TM4
TM6
VM12
MM
2
MM
4
MM
5M
M7
MM
8
SM18
VM1
VM2
VM4
VM5
VM6
MM
13
DM
4
SM19
Lant
auIs
land
WM
1
PM2
PM1
EM1
EM2
EM3
JM3
JM4
PM4
PM6
TM8
SM1
SM2
SM5
SM6
SM9
SM10
VM7
WM
3
114°
20’E
114°
10’E
114°
00’E
113°
50’E
Shen
zhen
22°30
’N
114°
30’E
Incr
easi
ng T
rend
Dec
reas
ing
Tren
d
Long
-ter
m c
hang
es in
ort
hoph
osph
ate
phos
phor
us in
mar
ine
wat
ers
of H
ong
Kong
, 198
6 -
2011
DM
1
NM
1N
M2
SM13
PM3
PM7
PM9
SM3
SM11
SM20

Appendix I
MARINE WATER QUALITY IN HONG KONG IN 2011 I - 10
N
05
10km
Hon
g K
ong
Isla
nd
22°20
’N
22°10
’N
114°
00’E
114°
10’E
113°
50’E
114°
20’E
22°20
’N
22°10
’N
New
Ter
ritor
ies
Kow
loon
22°30
’N
114°
30’E
NM
6
MM
2M
M3
MM
7
SM10
Lant
auIs
land
DM
2
MM
4
DM
5
NM
3
NM
5
SM13
WM
4
WM
2
WM
1
VM2
VM4
SM9
PM1
PM7
PM8
PM3
PM4
MM
5
MM
6
MM
8
114°
20’E
114°
10’E
114°
00’E
113°
50’E
Shen
zhen
22°30
’N
114°
30’E
Incr
easi
ng T
rend
Dec
reas
ing
Tren
d
Long
-ter
m c
hang
es in
chl
orop
hyll-
ain
mar
ine
wat
ers
of H
ong
Kong
, 198
6 -
2011
MM
17 PM9
TM2
TM4
SM11
SM17DM
3
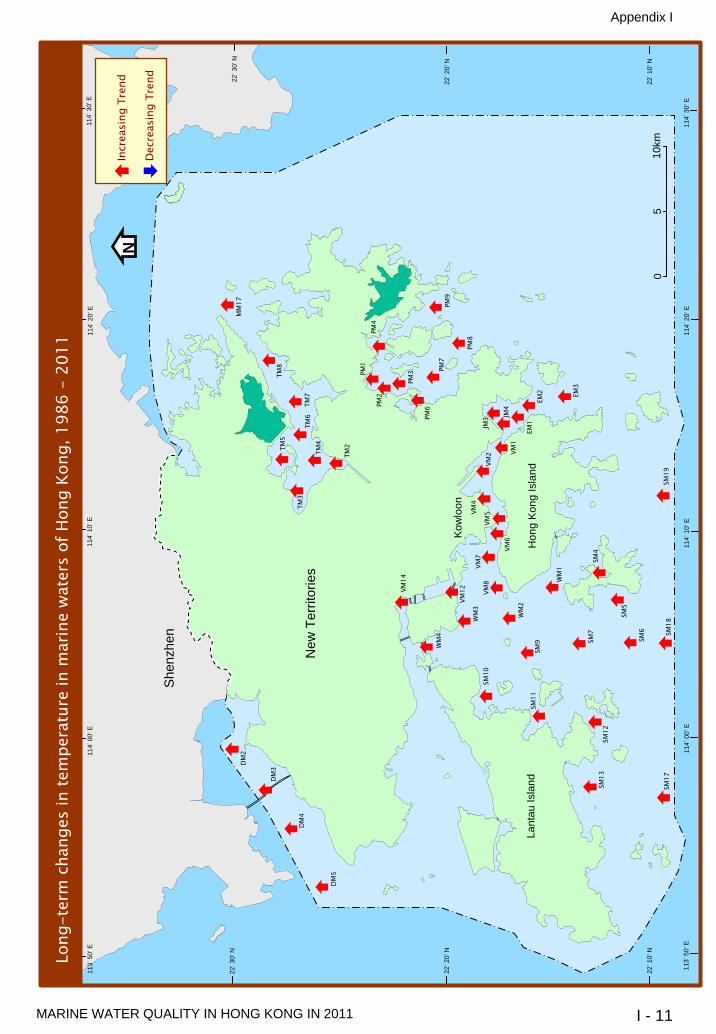
Appendix I
MARINE WATER QUALITY IN HONG KONG IN 2011 I - 11
N
05
10km
Hon
g K
ong
Isla
nd
22°20
’N
22°10
’N
114°
00’E
114°
10’E
113°
50’E
114°
20’E
22°20
’N
22°10
’N
New
Ter
ritor
ies
Kow
loon
22°30
’N
114°
30’E
TM7
SM9
VM12
WM
3
VM14
WM
4
VM8
SM18
SM7
WM
2
TM8
VM5
VM6
VM7
SM5
VM1
VM2
VM4
WM
1
TM2
TM3
EM3
PM2
TM6
TM5
TM4
EM1
EM2
JM4
JM3
PM1
PM9
PM7
PM8
PM6
PM3
PM4
SM6
SM11
SM4
DM
5
DM
4
Lant
auIs
land
SM10
SM12
SM13
SM17DM
3
DM
2
114°
20’E
114°
10’E
114°
00’E
113°
50’E
Shen
zhen
22°30
’N
114°
30’E
Incr
easi
ng T
rend
Dec
reas
ing
Tren
d
Long
-ter
m c
hang
es in
tem
pera
ture
in m
arin
e w
ater
s of
Hon
g Ko
ng, 1
986
-20
11
MM
17
SM19