marine weather ship handling in rough sea · 2019-09-06 · p&i loss prevention bulletin the...
TRANSCRIPT
P&I Loss Prevention BulletinThe Japan Ship Owners'Mutual Protection & Indemnity Association Loss Prevention and Ship Inspection Department
JAPAN P& I CLUB Vol.45 April 2019
Marine Weather
Ship Handling in Rough SeaHead and countering / Following Seas

§1 Introduction …………………………………………………………………………………… 1
§2 Global Circulation of the Atmosphere ………………………………………… 1
§3 Air Mass …………………………………………………………………………………………… 5
§4 Tropical Cyclones ………………………………………………………………………6
4-1 Extra-tropical Cyclones ……………………………………………………………………… 94-2 Tropical Cyclones and Typhoons ………………………………………………………… 23
§5 How to Obtain Weather Information …………………………………………385-1 Surface Weather Charts ……………………………………………………………………… 395-2 Wave Charts ……………………………………………………………………………………… 405-3 Upper-air Weather Charts (Upper-air Charts) ……………………………………… 43
§6 Wind and Waves and Undulations (Swells) ………………………………47
6-1 Basic Form of a Wave ………………………………………………………………………… 476-2 Diff erences between Wind and Waves and Undulations (Swells) ………… 48
§7 Ship Handling in Rough Sea: Head and countering / Following Seas ………………………………………… 49
7-1 Ship Handling in Head and Countering Seas ………………………………………… 497-2 Ship Handling in Following Seas of Rough Weather …………………………… 72
§8 Conclusion ……………………………………………………………………………………… 98
References ……………………………………………………………………………………………………… 99Attachment: MSC.1/Circ. 1228(11 January 2007) ………………………………………………… 100
INDEX
1
Although accidents due to dragging anchor occur during gales, in particular, most of them are
caused by typhoons. It has not been so long since a coastal tanker(after discharging jet fuel)
collided with and seriously damaged a connecting bridge at Kansai Airport, in September
2018, as a result of dragging anchor caused by Typhoon No. 21 that had landed in the Kansai
region. A few months prior to this accident, we held a Loss Prevention seminar in Japan titled
“Dragging Anchor - Case Studies and Preventive Measures -” (April through June 2018).
We issued our “Dragging Anchor - Case Studies and Preventive Measures - (Vol.43)” in
July, 2018, compiled from the contents of the seminar of which a large number of members
thankfully participated. In this bulletin, we discussed typhoons.
This time, we are going to introduce “Ship Handling in Head and Countering Seas”. This is
something that deserves extra attention from ship operators when navigating in rough seas.
We will focus on the generation mechanisms behind rough weather and sea conditions. When
reading this guide, please refer to the above-mentioned bulletin No.43.
§2§2 Global Circulation of the Atmosphere
Although the motion (circulation) of the
atmosphere is extremely complicated,
a characteristically large and constant
motion (circulation) can be observed from
outer space. This is known as the global
circulation of the atmosphere.
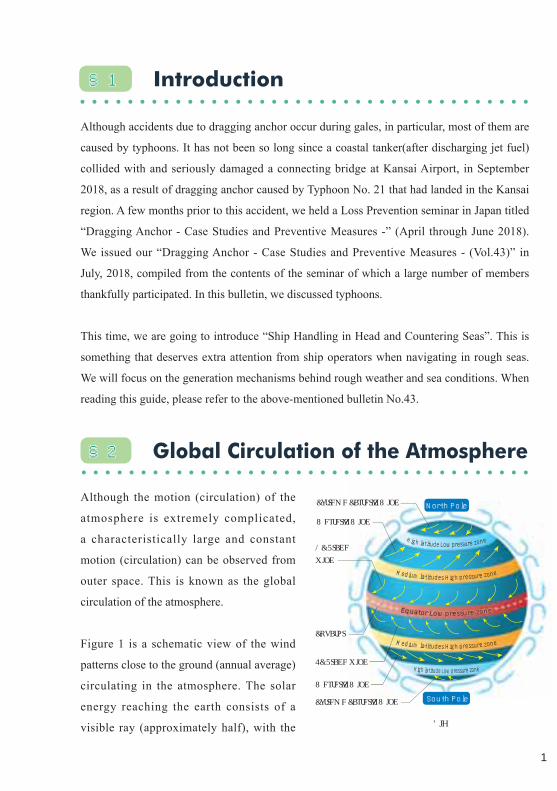
Figure 1 is a schematic view of the wind
patterns close to the ground (annual average)
circulating in the atmosphere. The solar
energy reaching the earth consists of a
visible ray (approximately half), with the
§1§1 Introduction
High latitude Low pressure zone
High latitude Low pressure zone
Medium latitudes High pressure zone
Medium latitudes High pressure zone
Equator Low pressure zoneEquator Low pressure zone
Extreme Easterly Wind
Extreme Easterly Wind
Westerly Wind
NE Trade wind
Westerly Wind
Equator
North Pole
South Pole
SE Trade wind
Fig. 1

2
remainder consisting mostly of infra-red rays. The earth radiates the received solar energy
as infra-red rays back into space. However, the actual radiant energy remaining in the
atmosphere is positive at low latitudes and negative at high latitudes. Therefore, there will be
a huge temperature diff erence between both latitudes as a result of this radiation.
If the heat were not carried from the equator to either of the poles, the equator zone would
become too hot for any creature to live. On the contrary, if there were a large amount of snow
near both poles, they would end up being glaciers that never melt. However, in reality heat
in the vicinity of the equator is carried to each pole direction and the earth temperature is
comfortably adjusted for animals and plants to survive.
It is the wind that moderately adjusts the temperature diff erences between the north and south
poles of the globe. Winds are generated due to the temperature diff erences in the atmosphere
and play a role in reducing the temperature differences. In addition to regulating global
temperatures, the atmosphere serves the following three roles:
● To supply oxygen necessary for living creatures and carbon dioxide necessary for
photosynthesis of plants.
● The ozone layer absorbs ultraviolet rays which are harmful to living creatures.
● To prevent meteorites reaching the surface of the earth. Meteorites disintegrate once
having entered the atmosphere.
Figure 2 illustrates the sizes of the sun and earth and their relative positions. While the earth
has a radius of 6,369 km, the sun has a radius of 695,508 km which is 109 times that of the
earth. And, the distance from the earth is 149 million kms. The sun is 23,395 times the radius
109 times of the earthRadius:695,508km
Radius: 6,369km
Sun Earth
Distance: 149 million kms
The ratio of the distance of the earth's radius is only 0.0004% . The distance to the sun from the earth is equivalent to 23,395 times the radius of the earth.
1111
Fig.2

3
of the earth, and the ratio of the distance of the earth's radius by comparison is only 0.0004%.
Yet, the temperature difference between the equator and poles is more than 60 degrees
centigrade.
Over the recent years, issues such as global warming and environmental pollution are becom-
ing more serious. It is said that the earth was born approximately 4.6 billion years ago. Let us
assume that this 4.6 billion years was compressed into 1 year and that the birth of the earth
was set to 00:00 on January 1. The progressive emission of carbon dioxide began during the
industrial revolution during the middle of the 18th century. Applying the compressed time
frame, human beings started air pollution around “December 31 at 23:59:58”, which can be
said to mean that a large amount of fossil fuel was consumed in only 2 seconds, which has
led to the expansion of global environmental problems giving us global warming.
Marine pollution caused by microplastic started in the 1980s; if the one-year time frame
was applied, it would have begun on December 31 at 23:59:59.6 seconds - which is only 0.4
seconds before the end of the year.
Next, on closely examining the structure of the atmosphere, the layers of the atmosphere can
be classifi ed as follows (Fig. 3):
January
January
31st 19:00
FebruaryMarchApril
MayJune
JulyAugust
SeptemberOctober
NovemberDecember
The earth was born
The sea was formed
The birth of multicellular organisms December 31 23:59:58
The industrial revolution Air pollution
19:31 December 31Dawn of humans
December 31 23:59:30
Japan archipelago topography
December 31 23: 59: 59.6 secondsMarine pollution caused by microplastic

4Fig. 3
10,000km
690km
85km
100km (Kármán Line)
50km
6-20km
0km
Troposphere
Everest
Weather Observation Balloon
Schematic diagram of each layer of the atmosphere(Scale is incorrect)
Meteor
Airplane
Outhside Atmosphere
Middle Zone
Stratosphere
85km
100km (Kármán Line)
50km
6-20km
0kmmmmmmmmmmm
Tropospheeeeeeeeeeeeeeeerrrrrrrrrrrrrrrrreeeeeeeeeeeee
Everest
Weather ObservationBalloon
Airplane
Middle Zone
Stratosphere
MeteorZ
Aurora
Space Shuttle
Exosphere: As this exists in such small quantity, this is not classified as an atmospheric layer in general.
Thermosphere: Layer from 80kms up to approximately 700 to 800kms. The higher the altitude, the greater the temperature increases. The boundary of the Exosphere is named the Thermopause or Exobase. It is difficult to define the boundary between the Thermosphere and Exosphere, because there is a large distance of 500 to 1,000kms.
Kármán line (100kms up in the atmosphere):Fédération Aéronautique Internationale (FAI) and the National Aeronautics and Space Administration(NASA) define that anything outside Kármán line is outer space, as a convenient definition in order to carry out their activities smoothly. Anything under this line is referred to as the atmosphere in general. However, atmospheric pressure at this altitude is only a millionth of the ground surface.
Mesopause:Layer from 50 to 85kms. The higher the altitude, the lower the temperature. The boundary of the Thermosphere is named the Mesopause.
Stratosphere:Layer from 9 to 17kms up to 50kms. The higher the altitude, the greater the temperature increases. The ozone layer is found here. The boundary of the Mesopause is named the Stratopause.
Troposphere:Layer from 0 - 9/17 ~ 20km. The higher the altitude, the lower the temperature. Various weather phenomena occur. The water (vapour) ratio is higher than that of the upper layer. According to mass ratio, more than half of the atmospheric elements exist in the Troposphere.In the vicinity of the equator, it is thick at 17km, and at the pole, it is thin at 9km. The boundary of the Mesopause is named the Tropopause.
Thermosphere

5
Comparing the diameter of the Earth (12,739 km)
with the Kármán line (100 km), as can be seen in
Fig.4, it is understood that the atmosphere occupies
a thin range (only 0.8% of the diameter of the
Earth).
Thus, it is easy to imagine how we, humankind,
have dramatically changed the global environment,
in a very short time, and within an extremely thin
range of atmosphere that was created more than
4.6 billion years ago. Still, it is important that we
understand the significant role of the atmosphere
and continue to tackle the impending environmental issues.
§3§3 Air Mass
Viewing the earth from outer space, there are fl at areas of land and sea that stretch out more
than 1,000 kms around the earth. In addition, these areas almost all look homogeneous. While
the air remains over these continents and oceans for extended periods of time (for instance,
over a week), it will gradually assume particular characteristics associated with each region.
This large mass of air is referred to as Air Mass, and the area where the air mass generates is
called the point/place of origin.
Air masses change seasonally and influence the climatic changes in the regions covered.
Figure 5 illustrates air mass by classifi cation.
Moist Oceanic Air Masses in the Lower Layer
Classification by Humidity Place of Occurrence
Classification by Humidity
Tropical Air Masses
North/South Pole Air Masses
Cold Air Massess
Continental Dry Air Mass
Fig. 5
6,396 Km
100 Km
Fig. 4

6
Air masses do not originate in the vicinity of Japan. However, Japan is located in the
mid-latitude where the vast Eurasian Continent meets the Pacifi c Ocean, thus its climate is
strongly infl uenced by several air masses that change seasonally.
Figure 6 illustrates air masses that very much infl uence the climates of Japan.
A warm and dry migratory tropical-continental air mass
Air masses that are generated in spring and autumnAir masses that are generated in spring and autumn
Yangtze-River Air Mass
A cold and dry polar-continental air mass
Very Influential Air MassVery Influential Air Mass
Siberian Continental Air MassA cold and humid polar-maritime air mass
Very Influential Air MassVery Influential Air Mass
Air masses that are generated in spring and autumnAir masses that are generated in spring and autumn
Okhotsk Sea Air Mass
A warm and humid tropical-maritime air mass. In Japan, the North Pacific Tropical Air Mass is also referred to as the “Ogasawara Air Mass.”
North Pacific Tropical Air Mass
A tropical-maritime air mass
Air mass that is carried with typhoonsAir mass that is carried with typhoons
Equatorial Air Mass
Fig. 6 Cited from Japan Captains’ Association, DVD
§4§4 Tropical Cyclones
It is a Tropical Cyclone when the air pressure in the middle is lower than that of the
surrounding air pressure. When the shapes of the isobars are vague and lack coherence, they
are simply referred to as an air pressure depression. In the northern hemisphere, winds within
low pressures blow counter clockwise into its centre, due to the rotation of the earth. This
blown wind converges to become an updraft. Because adiabatic cooling [Note 1] is caused by
an ascending air current which produces clouds and consequently rain, in general the weather
is bad inside tropical cyclones.
Tropical cyclones are defi ned as follows according to the location and cause of generation.

7
Extra-tropical cyclones are most frequently generated, and when referred to as tropical
cyclones, an extra-tropical cyclone is usually what is being referred to.
An Extra-tropical Cyclone It is generated in middle and high latitudes and has fronts.
A Cold-core Cyclone/Orographic Cyclone/Thermal low
It is generated in middle and high latitudes and has no fronts.
Tropical Cyclones
Tropical cyclones generated in tropical waters at low latitudes. Because these completely differ from extra-tropical cyclones in that their generation and structures are diff erent, these will be covered in 4-2.
Note 1: Adiabatic cooling
“Adiabatic change” refers to a change in air state whereby no heat is exchanged with the surrounding air. When gas adiabatically expands, the temperature naturally decreases without cooling down (adiabatic cooling). On the contrary, when gas is adiabatically compressed, the temperature increases naturally (rise in adiabatic temperature).The fact that gas adiabatically expands, under the condition that energy (heat) is not transferred, and because volume increases against the external pressure, this means that it is working against the external pressure. In other words, it uses its own (thermal) energy which means that the temperature decreases. Adiabatic compression is the opposite of this.With the updraft of air mass, it will expand naturally because the nearby pressure decreases. At this moment when it expands, there is almost no transfer of heat between the external and internal pressure. However, because the adiabatic expansion releases energy, the temperature drops. The proportion is 1.0°centigrade for every 100 meters of updraft. However, the condition at this time assumes that the water vapour is still unsaturated (the temperature has not dropped to dew-point), even if the temperature of the air mass has decreased. The way this water vapor descends, due to the high temperature as the air mass rises, along with water vapor that has not yet reached saturation, is referred to as dry adiabatic lapse rate. When the air

8
mass drops, the temperature rises in proportion to the dry adiabatic lapse rate because of the adiabatic compression.
Dry adiabatic lapse rate = 1.0℃ /100mHowever, general air mass contains water vapour. This is when it reaches dew-point, because the water vapour changes into water while the temperature of the updrafting air mass has been dropping. As the water vapour contained in the air mass condenses, fi ne moisture is generated and clouds are then formed. It is necessary to understand that latent heat will be released as the water vapour condenses, when the air mass rises while clouds are being generated (air mass in which water vapour has become saturated). Because the latent heat warms the air mass, the extent to which the air mass temperature decreases while clouds are forming is smaller than the proportion of dry adiabatic lapse. The moisted adiabatic lapse rate can be defined as: the temperature that has dropped due to altitude, when the air mass rises while clouds are being generated (air mass in which water vapour has become saturated). This proportion can differ depending on the conditions, but on average it is approximately 0.5 ℃ per 100 meters of altitude. On the contrary, when air mass containing clouds descends, it absorbs (vaporization) heat when the moisture evaporates. As the temperature does not increase in proportion with the dry adiabatic lapse rate, it increases in proportion with moisted adiabatic lapse rate. It is for this reason that a can of compressed gas is cold.
Moisted adiabatic lapse rate = 0.5℃ /100mLet's take a closer look at the circulation of the atmosphere. For instance, in the event that the temperature drops at the moisted adiabatic lapse rate, while moist southeast wind blows into the Japanese islands in the summer and even if it is raining at an updraft of 2,000 meters along the mountain range, the temperature of the top of the mountain will be 20℃ , which is 10℃ lower, when the temperature near the sea surface is 30℃ (moisted adiabatic lapse rate: 0.5℃/100m x 2,000 meters). When this atmosphere descends down the slope of the mountain, the temperature will reach 40℃ (2,000 meters x 1℃ /100m) at the sea surface. Because the temperature increases at the dry adiabatic lapse rate if there is no vapour present. Foehn phenomenon on the Japan Sea side is generated by this mechanism.
9
4-1 Extra-tropical Cyclones
4-1-1 The Generation Stage
Fig. 7 Masanori Shiraki, 2007, Shin Hyakuman-nin no Tenki Kyōshitsu: Seizando
Warm air
Cold air
Cold Front
Fig. 8 Japan Captains’ Association,
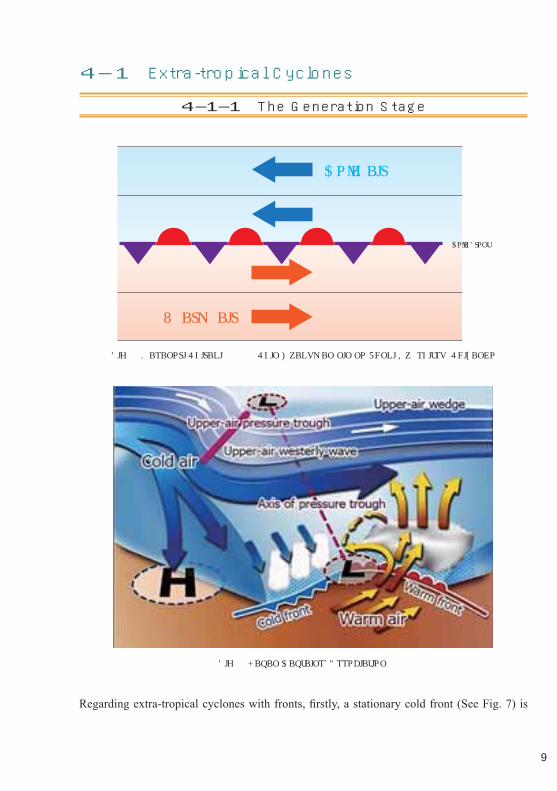
Regarding extra-tropical cyclones with fronts, fi rstly, a stationary cold front (See Fig. 7) is

10
generated where the cold air mass and open subtropical air mass converge at almost the same
force. The energy needed to generate and develop an extra-tropical cyclone is the potential
energy diff erence between the temperatures of those air masses.
Before long, when the diff erence between the wind speed of the cold and warm air exceeds
a certain degree around this cold front, the wave of the front (air swell) starts to form. The
same principle is true for waves that are formed by wind blowing across the sea. In other
words, waves are generated on the boundary surface between two fl uids that have diff erent
characteristics. Although sea waves go up and down, the wave of a front moves up and down
from south to north. Figure 8 illustrates this.
At the point where the front swells and the warm air convects into the cold air, a depression
of pressure is generated due to a pressure drop in the surrounding air pressure. In the
northern hemisphere, on the eastern side of the front’s bulge, because wind tends to blow in
a northerly direction and the warm air rises up, seemingly creeping, over the cold air, it will
become a warm front.
On the other hand, on the western side of the front’s bulge, because wind tends to blow in a
southerly direction and the cold air rises up, seemingly creeping, over the warm air, it will
become a cold front. Other air pressure depressions other than these form at the junction of
two fronts. In addition, the axis which connects the center of the surface air pressure depres-
sion with that of the upper-air pressure depression is referred to as the “axis of pressure”.
This axis inclines to the west.
11
4-1-2 The Structure and Development of Extra-tropical Cyclones
Warm air
Warm air
Warm region
Warm air
Cold air
Cold air
Cold air
Cold airAltostratus
Cumulonimbus
LowLow
CirrusAltocumulus
Nimbostratus AltostratusAltostratus
NimbostratusAltocumulus
Cirrus
Fig. 9 The structure of Extra-tropical Cyclones Masanori Shiraki, 2007, Shin Hyakuman-nin no Tenki Kyōshitsu: Seizando
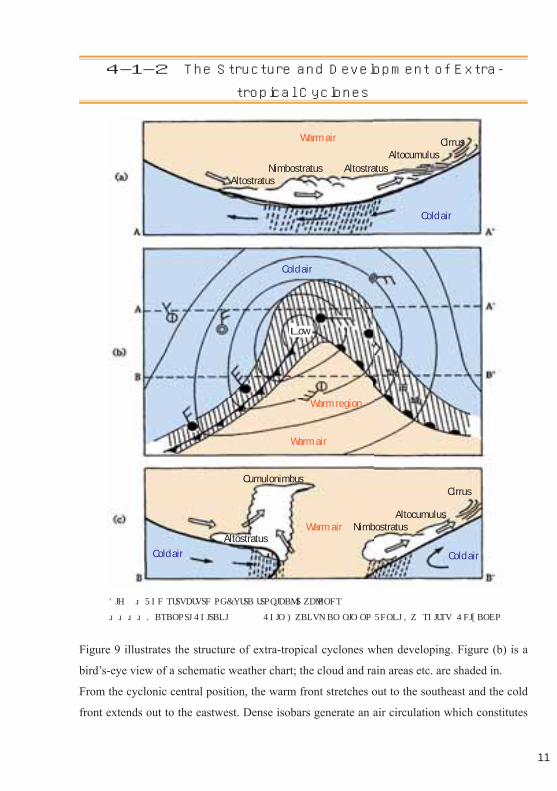
Figure 9 illustrates the structure of extra-tropical cyclones when developing. Figure (b) is a
bird’s-eye view of a schematic weather chart; the cloud and rain areas etc. are shaded in.
From the cyclonic central position, the warm front stretches out to the southeast and the cold
front extends out to the eastwest. Dense isobars generate an air circulation which constitutes

12
even stronger low-pressure air, and the winds blow counterclockwise into the centre of the
cyclone. Figure (a) is a cross-sectional diagram taken from fi gure (b) where A-A’ is in the
direction of east-west and to the north from the centre of the Tropical Cyclone.
Figure (c) is also a cross-sectional diagram taken from (b) where B - B ‘ is in the direction of
east-west to the south from the centre of the Tropical Cyclone.
Westerlies and the jet stream’s core are located on the upper layer of a developing
extra-tropical cyclone (see Fig.8), where the lowest centre of the pressure is on the west side
of the surface cyclone and where wave amplitude (degree of meandering) remains large. This
structure is a common characteristic of developing extra-tropical cyclones. Another feature
is that there is upward motion on the east side of the upper-level pressure and a downward
fl ow on the west side.
Fig. 10 The structure of Extra-tropical Cyclones Masanori Shiraki, 2007, Shin Hyakuman-nin no Tenki Kyōshitsu: Seizando
Due to the upper-level pressure trough that moves eastward, the front undulates dramatically
and unstably. The extra-tropical cyclone passes in the vicinity of Japan as it continues to
develop (Fig.11).

13
Fig. 11 Japan Captains’ Association, DVD
4-1-3 The Mature Stage of Extra-tropical Cyclones
The central air pressure of the extra-tropical cyclone reaches its lowest in the sea east of
Japan. At this stage, the front begins to be occluded and forms the occluded front. This is
when the force of the extra-tropical cyclone reaches its peak (Fig. 12).
Fig. 12 Japan Captains’ Association, DVD
14
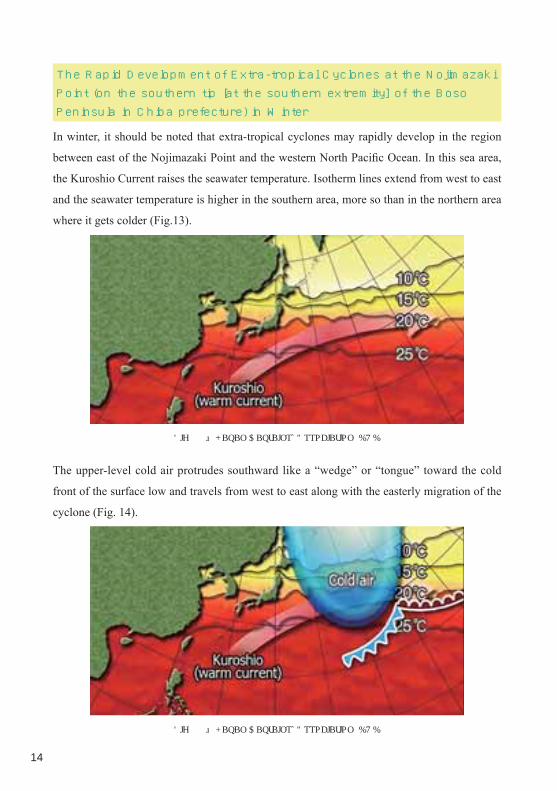
The Rapid Development of Extra-tropical Cyclones at the Nojimazaki Point (on the southern tip [at the southern extremity] of the Boso Peninsula in Chiba prefecture) in Winter
In winter, it should be noted that extra-tropical cyclones may rapidly develop in the region
between east of the Nojimazaki Point and the western North Pacifi c Ocean. In this sea area,
the Kuroshio Current raises the seawater temperature. Isotherm lines extend from west to east
and the seawater temperature is higher in the southern area, more so than in the northern area
where it gets colder (Fig.13).
Fig. 13 Japan Captains’ Association, DVD
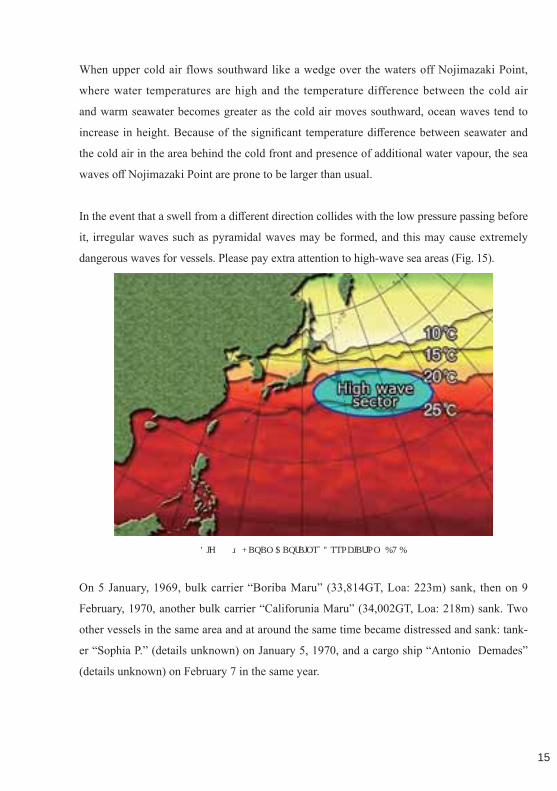
The upper-level cold air protrudes southward like a “wedge” or “tongue” toward the cold
front of the surface low and travels from west to east along with the easterly migration of the
cyclone (Fig. 14).
Fig. 14 Japan Captains’ Association, DVD
15
When upper cold air flows southward like a wedge over the waters off Nojimazaki Point,
where water temperatures are high and the temperature difference between the cold air
and warm seawater becomes greater as the cold air moves southward, ocean waves tend to
increase in height. Because of the signifi cant temperature diff erence between seawater and
the cold air in the area behind the cold front and presence of additional water vapour, the sea
waves off Nojimazaki Point are prone to be larger than usual.
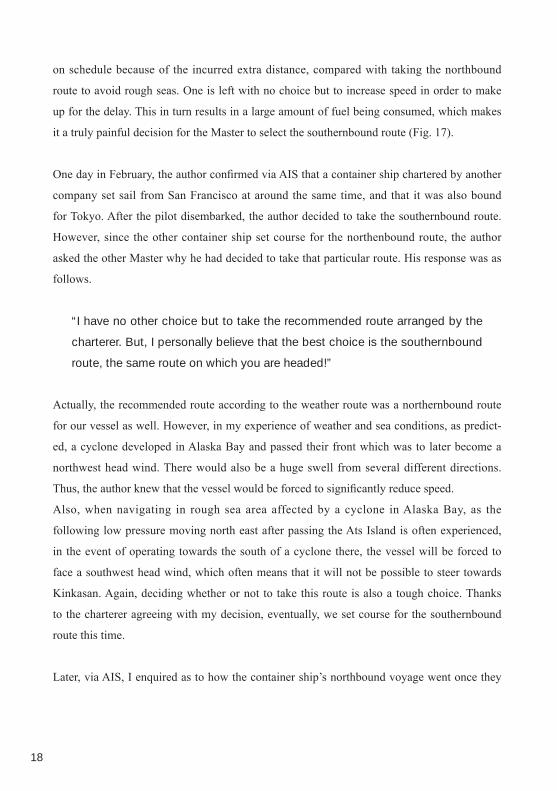
In the event that a swell from a diff erent direction collides with the low pressure passing before
it, irregular waves such as pyramidal waves may be formed, and this may cause extremely
dangerous waves for vessels. Please pay extra attention to high-wave sea areas (Fig. 15).
Fig. 15 Japan Captains’ Association, DVD
On 5 January, 1969, bulk carrier “Boriba Maru” (33,814GT, Loa: 223m) sank, then on 9
February, 1970, another bulk carrier “Califorunia Maru” (34,002GT, Loa: 218m) sank. Two
other vessels in the same area and at around the same time became distressed and sank: tank-
er “Sophia P.” (details unknown) on January 5, 1970, and a cargo ship “Antonio Demades”
(details unknown) on February 7 in the same year.

16
4-1-4 The Attenuation Stage of Extra-tropical Cyclones On approaching or almost reaching the waters around the Aleutian Islands, and the front
of the cyclone has completely occluded, at this point, the lowest centre of the upper-level
pressure is almost above the centre of the surface cyclone causing the axis of pressure (See
Fig. 8) to become vertical, and the cyclone becomes an isolated air-eddy without fronts and
is completely merged with a cold air mass. The extra-tropical cyclone begins to attenuate and
fi nally decays (Fig. 16).
Fig. 16 Japan Captains’ Association, DVD
However, in more recent years, during the winter season in the North Pacifi c Ocean, cyclones
have been crossing east to south of the Aleutian Archipelago while maintaining full force to
frequently land in North America where they dissipate, after having peaked in force in the
vicinity of Alaska bay. Therefore, in the winter season of the North Pacifi c Ocean, especially
when navigating en route North America to Japan, it is always diffi cult to choose from the
following routes: 1) through the rough sea area: North America ⇒ Umnak Strait ⇒ Bering
Sea ⇒ Ats Island ⇒ Kinkasan (or Inubozaki) ⇒ Tokyo (total distance is 4,610 nautical
miles) or 2) via a longer southernbound route (total distance is 4,890 miles) which avoids the
rough sea area, that will add an extra 280 nautical miles to the distance.

17
The author has also frequently experienced winter season operation of a container ship via a
North American route. However, during the Pacifi c West Coast voyage, taking into account
that the ports of departure would be in the North America, namely, Vancouver, Seattle and
Portland, I decided on taking the northbound route, but would be preoccupied with rough
sea countermeasures. Meanwhile, given that the ports of departure, San Francisco and Los
Angeles, were located in the south, I was closely checking the weather chart until the very
last minute of departure, and also discussed the recommended route in a straight-forward
manner with a weather information provider i.e. a weather routing service arranged by the
charterer.
As mentioned above, when operating a container ship between San Francisco and Tokyo,
if one is to choose the southernbound route, it means that the total distance will be longer
than that of the northernbound route via the Bering Sea by 280 nautical miles. In addition, it
would take an extra 14 hours when navigating at 20 kts, meaning that one would be behind
Trans Pacific Route(example)Trans Pacific Route(example)
San Francisco ~ Tokyo
50 Miles
280 Miles330 Miles
Distance differenceRough Sea Route
Bering Sea
South Route
4,560Miles
4,610 Miles
4,890Miles
4,610 Miles Bering Sea Route4,610 Miles Bering Sea Route
4,890 Miles 34N Line South Route4,890 Miles 34N Line South Route
4,560 Miles 44N Rough Sea Route4,560 Miles 44N Rough Sea Route
San FranciscoSan FranciscoTokyoTokyo
Fig. 17
18
on schedule because of the incurred extra distance, compared with taking the northbound
route to avoid rough seas. One is left with no choice but to increase speed in order to make
up for the delay. This in turn results in a large amount of fuel being consumed, which makes
it a truly painful decision for the Master to select the southernbound route (Fig. 17).
One day in February, the author confi rmed via AIS that a container ship chartered by another
company set sail from San Francisco at around the same time, and that it was also bound
for Tokyo. After the pilot disembarked, the author decided to take the southernbound route.
However, since the other container ship set course for the northenbound route, the author
asked the other Master why he had decided to take that particular route. His response was as
follows.
“I have no other choice but to take the recommended route arranged by the
charterer. But, I personally believe that the best choice is the southernbound
route, the same route on which you are headed!”
Actually, the recommended route according to the weather route was a northernbound route
for our vessel as well. However, in my experience of weather and sea conditions, as predict-
ed, a cyclone developed in Alaska Bay and passed their front which was to later become a
northwest head wind. There would also be a huge swell from several different directions.
Thus, the author knew that the vessel would be forced to signifi cantly reduce speed.
Also, when navigating in rough sea area affected by a cyclone in Alaska Bay, as the
following low pressure moving north east after passing the Ats Island is often experienced,
in the event of operating towards the south of a cyclone there, the vessel will be forced to
face a southwest head wind, which often means that it will not be possible to steer towards
Kinkasan. Again, deciding whether or not to take this route is also a tough choice. Thanks
to the charterer agreeing with my decision, eventually, we set course for the southernbound
route this time.
Later, via AIS, I enquired as to how the container ship’s northbound voyage went once they

19
had reached the coast of Chiba. The following had occurred:
● In Alaska bay, the cyclone passed in front of the ship and the height of the wave was 12 meters, which was greatly diff erent to the originally predicted 5 meters as recommended. Because of such a high wave together with swell, the Master was forced to reduce speed down to 8 kts.
● The Bering Sea was calm, however, once passing Ats Island, the ship encountered a cyclone which came about as a result of a blocking anticyclone (discussed below in 4-1-5). The Master was obliged to return to North America on a course of <150> navigating southward at 36° north latitude. Then, the Master headed for Tokyo.
● The Master noted that he should have taken the southbound route similar to me at the time of setting sail from San Francisco. As a result, the navigation detour and considerable reduction in speed caused by the cyclone, meant that in order to make up for the delay, the Master had no choice but to navigate at the highest possible speed after having set sail southward at 36°north latitude, and consequently, the amount of fuel that was consumed ended up being far more than that used by the southbound route.
When navigating the North Pacifi c Ocean en route North America to Japan during the winter
season, it is important that the safest and most suitable route be selected. This example
illustrates the importance of a mutual agreement between related parties: consideration of
the Master’s judgement and in-depth pre-meetings with the ship management company and
charterer are paramount.