mario g8ode - rsars · pdf filethe analyser hardware is designed to work with two pic’s...
TRANSCRIPT

THE FOX DELTA ANTENNA ANALYZER FD-AAZ-0912 ( HF 1-30 MHZ SWR-ANALYSER )
Windows XP & Windows 7
INTRODUCTION
I have a special interest in HF antenna and have been writing the RSARS antenna articles for a number of years. For my investigations the AutekTM VA1 antenna analyser is used to measure the SWR, R+jX characteristics of the antenna under test. This compact battery powered device works very well, but it only provides spot readings for each set frequency. For a comprehensive analysis of an antenna many readings are required, followed by the tedious exercise inputting these into a spreadsheet to obtain a graph. However I was fortunate to discover the SWR-Analyser (SWR-A) developed by Tony, I2TZX and now made available on the FOX DELTA web site http://www.foxdelta.com/products/aaz.htm.
Tony, I2TZK, recognised that many VNA’s were too expensive for many amateur users, so he developed a much simpler, yet accurate, easy to use device, that just measures the forward and reflected voltages from a simple resistive 50 ohms bridge. The SWR Analyser ( SWR-A) is connected to the USB port of a MS WindowsTM PC running his software program. The analyser was designed to scan each of HF bands - (160m-10m), with full scan across 1-35MHz. Each scan consisting of 500 steps, with the PC calculating the SWR for each one and plotting the results on graph on the PC screen. There were other interesting features and I decided to buy a kit.
Looking at the Web site, I had some concerns about the kit as there are some surface mount components, so I ordered a ready built version. The SWR-A arrived a week or so later from India and all I had to do was to download the PC software from Tony’s web site. The analyser worked first time using firmware 3.02, however, I soon noticed a number of bugs in the PC software and PIC firmware, suggesting the need for some further improvements.
After contacting the three developers Dinesh - VU2FD, Frank - K7SFN and Tony - I2TZK with my initial suggestions I became a beta tester. During the next six weeks of extensive testing using five antennas at my QTH, email exchanges and a few Skype calls, some minor bugs were eliminated and several important improvements were identified. These have all been implemented by Tony in version 4.0 release of the SWR-A software. However the SWR-A design is not “bombproof”! It will be damaged if accidentally connected to a 5w-100w transmitter. The resistive bridge will fry if nothing else.
For this article I re-edited the user manual so it is more concise and on fewer pages, with some additional photographs and results taken during beta testing as examples of the analyser being used.
Mario G8ODE
During Sept 2013, a Bluetooth adapter and Android software have been produced, enabling smart phones or tablet PCs to operate the analyser and display the SWR results graphically. The analyser PIC processor also stores the results in its non-volatile RAM so that they can imported to a Windows PC using version 5 software for further analysis. This will be the subject of a new RSARS article.
Oct 2013 Ver 1.3 Page 1

PIC1
8F25
50 / 2
553
THE FOX DELTA ANTENNA ANALYZER FD-AAZ-0912 ( HF 1-30 MHZ SWR-ANALYSER )
Windows XP & Windows 7
The pages 2-16 are a summary of the main features of the Fox-Delta SWR-A
SWR Analyser’s main features :
Smart and very cheap hardware implementation Free firmware and software for the Ham Radio Community USB connection to the PC IARU Region HF Bands Highlighted on plots Plots of SWR in any HF Band
easuring Cursor indicates SWR & dB Values anywhere on a trace Compare 3 SWR traces on a single graph RF generator (1- 35 MHz) with SWR ref 50ohms Export data in CSV format & graphs as PNG BMP JPEG Print graphics and data table Return Loss Bridge: Range > 40dB, open/short ratio < 1dB
1. SWR Analyzer Concept The “SWR Analyzer” is a Scalar (or single port) Network Analyzer, the following figure shows the hardware architecture
Basic Operation.
The analyser hardware is designed to work with two PIC’s and software that automatically identifies which PIC is installed. However, later versions of the analyser will only use PIC 18F2550. The PIC’s USB interface enables the PC to communicate with the DDS RF generator to set frequencies within the HF band selected. The DDS then energises the 50 ohms Return Loss Bridge connected to the antenna. Each scan steps through 500 individual frequencies. The bridge’s forward and reflected voltage values are detected by the AD8307 detector. These are then sent to the PIC and then forwarded to the PC via the USB interface so that they can be displayed as the SWR graph.
Oct 2013 Ver 1.3 Page 2

THE FOX DELTA ANTENNA ANALYZER FD-AAZ-0912 ( HF 1-30 MHZ SWR-ANALYSER )
Windows XP & Windows 7
2. General Calibration
2.1 The “SWR Analyzer” Calibration request appears the first time the software runs. Click on “Calibrate” on the menu bar, and follow the instructions in the new window that appears. The bridge calibration requires two simple steps:
i). The BNC connector with an Open Circuit. Ii). The BNC connector with a short circuit applied.
e.g. Using a paper clip cut in half.
2.2 The DDS oscillator frequency can be fine-tuned using a calibrated frequency counter connected to the BNC connector. This is done by clicking on Generator Tab in the Calibration window. Since the DDS uses a crystal reference, further calibration is not usually necessary. ( see hardware section)
3. Exploring the antenna’s resonance(s)
Selecting the “SWR” tab. opens up the screen on the left with a set HF band buttons at the bottom. Clicking on one of HF bands or “Full” button sets the “START” & “STOP” frequencies, These can be changed later If required using the thumbwheel controls.
1. For a continuous real-time analysis click on “Start”, the SWR plot is overwritten as each scan refreshes. This is useful when adjusting the antenna, especially a multiband antenna such as a G5RV.
2. Clicking on “One Shot” provides a snapshot of the antenna’s resonances, e.g. minimum SWR dip(s) positions on the graph.
3. Three buttons numbered 1-3 are available for pre- defining custom frequency ranges and names. The name is limited to 20 Characters.
3.1 IARU HF Band Limits – grey band markers
To select the correct IARU Region, click on “SetUp” In the menu bar. In the new window select the IARU Region ( 1,2 or 3) . This sets the HF band edge frequencies and width of the grey transparent vertical bands that appear on the graph area of the screen.
Oct 2013 Ver 1.3 Page 3

THE FOX DELTA ANTENNA ANALYZER FD-AAZ-0912 ( HF 1-30 MHZ SWR-ANALYSER )
Windows XP & Windows 7
4. Data at cursor position
By moving the mouse over the graph area, the data- cursor vertical line appears. This is used to indicate the values of a particular point on the graph where it intersects a trace and these are shown adjacent to the corresponding axes. The values will continuously change as the cursor moves across the screen.
i.e. frequency (Hz), SWR and return Loss ( dB)
values appear adjacent to the SWR, dB and frequency scaled axes.
The power loss (dB) and ERP% (effective radiated power) value are also repeated in two panels at the bottom of the screen.
5. Resonance Analysis
The “Resonance Analysis” algorithm searches the 600 plotted values for the resonance dips. To activate this feature click on the “Analyze” button on Bottom right of the SWR Screen.
In the example shown on the left, at each dip in the plot, identified by a purple vertical line, the SWR, Return Loss, Bandwidth at SWR 1.5 and SWR 2.00 are calculated and displayed in the pop-up window.
N.B In the current version of software the SWR Analysis window’s values cannot be printed out directly.
However by using a screen grab [CTRL] [PrtScn] , Cut & Paste [CTRL] V to insert this into a document a record can be made that you can print out later.
Oct 2013 Ver 1.3 Page 4

THE FOX DELTA ANTENNA ANALYZER FD-AAZ-0912 ( HF 1-30 MHZ SWR-ANALYSER )
Windows XP & Windows 7
6. Markers
Four markers lines are available: Two vertical (M1 and M2) Two horizontal (M3 and M4)
Clicking on the “Marker” button opens a new window. Checking the “Show marker” box makes them appear on the graph area
# Special Features, the four markers lines can move to specific places on the graph by using the mouse control buttons and keyboard.
Move the M1 or M2 vertical markers over the pointer position, with a right or left click on the mouse button. Move the M3 or M4 horizontal markers over the pointer position, with a Ctrl+right and Ctrl+left click. Move the M1/M3 or M2/M4 pair to the SWR closet to the pointer position, with a Shift+right or shift+left click.
Fig 1
Markers can be used to highlight a specific point of interest on the graph that needs to be measured.
Markers are initially set using the frequency thumb wheels in the pop up window, and the positions set for the HF band the marker window is opened on.
This sets a relative position on the x- axis.
Fig 2
Oct 2013 Ver 1.3
Therefore markers remain in the same position when the band changes. The marker window will update to show the frequency marker..
i.e. comparing the two figures on the left, The range in Fig. 1 is 3.2 - 4.0MHz The range in Fig. 2 is 3.6 - 4.0MHz.
The new values in the lower figure’s “Scan Table” & “Marker “ correspond to the position on the graph that the marker now intersects. The M1 marker’s values in the two figures are thus different
Page 5

THE FOX DELTA ANTENNA ANALYZER FD-AAZ-0912 ( HF 1-30 MHZ SWR-ANALYSER )
Windows XP & Windows 7
7. Data Table
The 600 measurements per scan are saved In the PC’s memory as a data table. Clicking on the “Table” button opens up a new window showing the stored data.
For a more detailed analysis, the data set can be exported. Select [File] [Export] to export the data as a CSV (Comma Separated Variable) format file to a new folder on the PC.
The file can then be imported into any spread sheet e.g. MS Excel or other program capable of reading the CSV format.
7. Comparing Graph Plots
The “MultiScan” screen has 3 channels, which allow a comparison of up to 3 different plots in the same frequency band or user defined frequency range i.e. specific start & stop frequencies. Each channel can have a 20-character user defined name. To rename any of these, You simply click on the area next to the number and type in the name.
7.1 Using the MultiScan feature,
From the SWR Tab select the required HF band button and then Select the MultiScan Tab. You can tailor the frequency to suit your needs later using the Start & Stop Frequency thumbwheels.
Next, Select a channel ( fuschia, white or green) and start the scan by clicking on the “One Shot” button.
When the scan completes, make the required antenna or filter changes and select the next channel and click on the “One Shot” again.
If required, similarly select the last channel and repeat the steps above. When the new scan finishes you will see two ( or three) traces on the graph area and be able to compare them..
Oct 2013 Ver 1.3 Page 6

THE FOX DELTA ANTENNA ANALYZER FD-AAZ-0912 ( HF 1-30 MHZ SWR-ANALYSER )
Windows XP & Windows 7
8. Printing and Exporting Data for Analysis
8.1 To print the graph Click on [ File] [Print Graphic ] on the Windows menu bar to open the “Print Graph” window. This also shows you the basic style of the print as it will appear on paper.
dd a title for the graph, and if notes are required
click on the Notes button to open a second window for the notes. Click on the new window, delete any previous text and add the new notes. Close the notes window
On the Print Graph window click on the Print button to initiate the printing or generate a PDF instead.
On the printed paper the title will appear over the graph and the notes underneath
N.B. The same procedure is used to print a MultiScreen graph.
8.2 To print the data table
From the Windows menu bar select [File] [ Print Data Table] to open a new window. Next select which data-set you require (SWR or MultiScan (1-3)).
Next add a title to the data table so that it appears on the print for future reference.
Finally click on the Print button to initiate the printing or generate PDF instead.
On the printed paper the title will appears over the table.
Oct 2013 Ver 1.3 Page 7

THE FOX DELTA ANTENNA ANALYZER FD-AAZ-0912 ( HF 1-30 MHZ SWR-ANALYSER )
Windows XP & Windows 7
9. Exporting Graphics & Data Tables
9.1 To “Export a “Graphic” image select [File] [Export Graphic] on the Widows menu bar to open a new window with the PC’s current directory displayed Offering.
Change the file name “Graphic “ to the name the file will be saved as .
Select the File Type i.e format in which the file will be saved, e.g. PNG, JPEG or BMP.
Finally click on the Save button to save the file in the PC’s directory that is currently open.
“Saved Graphic “
9.2 To export a “Data Table” with “Frequency”, “SWR” and “Return Loss” as a CSV ( Comma Separated Variable) file format for later analysis in a spread sheet such as MS Excel.
Select [ Export ] [Data Table] from the windows menu bar. This opens a new window, the Save button to save the file in the PC’s directory that is currently open, but this can be changed if necessary.
Change the File name “SWR” to the one the Data Table is to be saved as.
Click on save to export the file in the CSV format that Spreadsheets can open.
Oct 2013 Ver 1.3 Page 8

THE FOX DELTA ANTENNA ANALYZER FD-AAZ-0912 ( HF 1-30 MHZ SWR-ANALYSER )
Windows XP & Windows 7
10. Noise filter
The SWR Analyzer applies very low power to make antenna measurements, using a very sensitive wide-band amplifier chip to detect the forward and reflected voltages. Occasionally the antenna may receive bursts of local electrical noise or powerful broadcast signals that swamp the amplifier resulting in false readings.
To overcome this type of inference, activate the Noise filter by clicking on the “ NF” button on the left of the screen. This averages out the noise and smoothes out the trace.
Deselect the noise filter by clicking on the
button.
The red circle highlights the effect of noise n the channel 1 trace, channel 2 repeats the sweep but with the NF Filter selected.
The NF filter’s averaging parameter can be changed by clicking on the “ Setup “ Tab on the menu bar and in the pop-up window selecting “RL Bridge”. The default value is 100.
Sine Wave Signal Generator (50 Ohms)
The generator function is designed to help users tune their wire antennas, mobile whips, traps, band-pass filters easily, or even align their transceiver using a suitable external attenuator.
Select the “Generator “tab. This opens a new window,
Set the generator frequency with the thumbwheels to a resolution of 1 Hz, and connect the antenna / filter / device for testing to the BNC connector.
The bar graph and digital readout for the measured SWR (50 ohms ref.) enables the “device” to be tuned precisely for a min SWR
The bandwidth of the device can then be checked using either the SWR or MultiScan functions described earlier
Sine wave generator
Testing a band-pass filter t
Oct 2013 Ver 1.3 Page 9

HE FOX DELTA ANTENNA ANALYZER FD-AAZ-0912 ( HF 1-30 MHZ SWR-ANALYSER )
Windows XP & Windows 7
11 Firmware update
The SWR Analyser employs MicrochipTM
PIC18F2550 / 2553 28 DIP chip. The FoxDelta kit is supplied with the PIC chip pre-programed with the latest issue of firmware. The firmware includes the Microchip TM boot-loader that is used to update the PIC18F2550/2553 via the USB port, no external pic programmer is required.
Please refer to: http://www.microchip.com for details of the hex code linked to the SWR Analyser firmware and their copyright notice.
11.1 The Updating Procedure
The program “HIDBootLoader.exe” (provided by Microchip) is Required, This is the Windows interface to access the bootloader function and flash the To verify the installed version: Go to Windows menu and microprocessor memory. select [Help ] [ About} Latest firmware release is available
from: http://www.i2tzk.com
11.2 To “burn” a new PIC flash memory a PIC programmer is required. Included in the firmware releases is the file Swr Analyzer vX.XX FULL.hex supplied for new PICs. This file also includes an embedded copy of the boot- loader that enables future firmware updates to be loaded as described above.
Firmware Update procedure: 11.3 Download the latest software from
http://www.i2tzk.com
Create a temporary folder and copy/unzip there.
Disconnect the USB cable to the PC
Navigate to the folder, select and run “HIDBootLoader.exe”
At this stage all The buttons are disabled & message: “Device not detected” is highlighted
Now choose Step 1A or 1B on page 11 .
Step 1A. For Hardware with SNo. Prior to AAZ0912
To activated the “Bootloader” routine, solder a temporary link as shown in the picture to ground pin 25 of PIC18F2550/2553.
The bootloader will run when the SWR-A is powered up.
Oct 2013 Ver 1.3 Page 10

THE FOX DELTA ANTENNA ANALYZER FD-AAZ-0912 ( HF 1-30 MHZ SWR-ANALYSER )
Windows XP & Windows 7
Step 1B. For Hardware with SNo. After AAZ0911
There are two pins marked “H2” next to the BNC connector - highlighted in the picture on the left.
Short the two H2 pins together marked “FW UPDATE”
Step 3. Connect the PC to the SWR-A using a USB “printer” cable
After a while, the Microchip Bootloader software identifies the Analyzer is ready to program and a green line appears along with the message “Device attached” appears and the programming buttons are enabled.
Step 4. Click On the button “Open Hex File” then navigate to the folder where the new firmware hex file has been unzipped and select it
Carefully select the “UPDATE” file
Oct 2013 Ver 1.3 Page 11

THE FOX DELTA ANTENNA ANALYZER FD-AAZ-0912 ( HF 1-30 MHZ SWR-ANALYSER )
Windows XP & Windows 7
Step 5. Click On the button “Program / Verify”, do not remove the USB cable or power off the Analyzer, Wait for the message: “Erase/Program/ Verify Completed Successfully” to appear.
Close the PC program
Remove the USB cable Analyzer – PC
Remove either the soldered shorting link or the FW UPDATE “H2” jumper.
Step 6. Finally reconnect the cable, launch SWRAnalyzer.exe and verify that firmware has been updated
On the Windows menu bar, select [Help] [About].
Check the details in the pop-up window show the latest version.
Oct 2013 Ver 1.3 Page 12

THE FOX DELTA ANTENNA ANALYZER FD-AAZ-0912 ( HF 1-30 MHZ SWR-ANALYSER )
Windows XP & Windows 7
12. Hardware implementation
The circuit diagram (FD-AAZ-0912) of the SWR-Analyzer
Please refer to: http://www.foxdelta.com/products/aaz.htm for more details about the hardware documentation and available kits. Also look in the “Builder Gallery” at http://www.i2tzk.com
Oct 2013 Ver 1.3 Page13

THE FOX DELTA ANTENNA ANALYZER FD-AAZ-0912 ( HF 1-30 MHZ SWR-ANALYSER )
Windows XP & Windows 7
12.1. PICs Chips Supported.
For SWR-A versions 3.00 onwards, the hardware will work with the Following microcontrollers:
PIC18F2550 (10-bit Analog-to-Digital Converter) PIC18F2553 (12-bit Analog-to-Digital Converter)
SWR Analyzer.exe program automatically detects which microcontroller is installed and indicates the number of bits the DAC uses at the top left of the screen.
12.2 DDS Chips Supported.
The two Analogue Devices DDS Synthesizer chips That are supported are:-
AD9850 125 MHz Clock Rate AD9851 180 MHz Clock Rate
N.B. Pin26 Must be connected to Ground (0V) when the AD9850 is installed.
13 SWR-A Set Up
13.1 SWR and Return Loss Scaling.
By default the software the SWR scale is set to 10:1max and 1.2:1min this corresponds to return losses of -6.0dB and 20db.
Note the return loss is a positive number .
To Customize the graph’s two vertical scales; select [SetUP] [ Graphic] on the Windows menu bar.
In the pop-up window, use the thumbwheel controls to set the max and offset Return Loss dB scale. The SWR scale is set automatically from these values.
1.2
Save and restart the program. Use this procedure is when checking the accuracy needs of the SWR-A.
Oct 2013 Ver 1.3 Page 14

THE FOX DELTA ANTENNA ANALYZER FD-AAZ-0912 ( HF 1-30 MHZ SWR-ANALYSER )
Windows XP & Windows 7
13.2 Return Loss Bridge (RL Bridge) accuracy
13.3.1 A basic check can be made by comparing the return loss traces for an open and short circuit on the MultiScan screen.
On the SWR Tab click on FULL HF button to set the scan to cover 1-35MHz.
Select the “MultiScan” Tab to carry out the Open/Short ratio checks of the RL Bridge
Select channel 1 (fuchsia) and connect a short circuit. Click on the “One Shot” button
Select Channel 2 (white) and remove the short. Click on “one shot “ button again.
The gap between the two traces should be <1dB as shown on the figure on the right.
13.3.2 More accurate check using calibrated terminators.
Ensure the SWR Analyzer calibration procedure has been carried out previously.
Change the graph scales by selecting the menu [SetUp] and “Graphic” tab on the floating window.
60
20 Set the SWR/ dB scale to Max = 60 and Offset =20Click on the “Save” button and restart program. The scales will change Once the program restarts.
Select the “MultiScan” tab.
Select any graph ( 1-3) and connect a calibrated 50 ohm terminator and click on “One Shot” button to start a scan.
The trace should lie close to SWR= 1.0 line across the whole of the 1.0—35MHz .
This will prove that the return loss bridge is functioning correctly.
You may wish to repeat the exercise using different termination resistances
N.B. A 25 ohm terminator ( a “T” adaptor with 2x50 ohms terminators) will have an SWR=2:1. A 200 ohms or 12.5 ohms resistor Will produce an SWR reading of 4:1 .
Oct 2013 Ver 1.3 Page 15

THE FOX DELTA ANTENNA ANALYZER FD-AAZ-0912 ( HF 1-30 MHZ SWR-ANALYSER )
Windows XP & Windows 7
14. Return Loss Bridge Minor Calibration Adjustments.
The trace for a 50 ohms purely resistive termination should be a horizontal “flat” line, but stray capacitances associated with the BNC, printed circuit board layout and self- inductance of the bridge resistors can cause the trace to deviate from the horizontal. Any deviation below 30dB loss is not important, nevertheless, it can be compensated by adding a very small capacitor in parallel to the resistor R4 (named Cx on the circuit diagram (FD-AAZ-0912). See the figure below the capacitor is circled in red.
This must be done adhering to good ESD practice so that semiconductors are not damaged
N.B. If a capacitor this size is not readily available, try two thin single core insulated wires twisted together tightly and soldered in the same place. Try a length 1-2 cm and trim the DIY capacitor until the bridge works correctly.
2.7 pF capacitor added in parallel to R4
slight variation
The figure on the right shows a 50 ohm terminator corrected trace. This has a slight variation over the whole HF spectrum (40.5dB 2 dB @1MHz & 38.5dB @35MHz).
Oct 2013 Ver 1.3 Page 16
THE FOX DELTA ANTENNA ANALYZER FD-AAZ-0912 ( HF 1-30 MHZ SWR-ANALYSER )
Windows XP & Windows 7
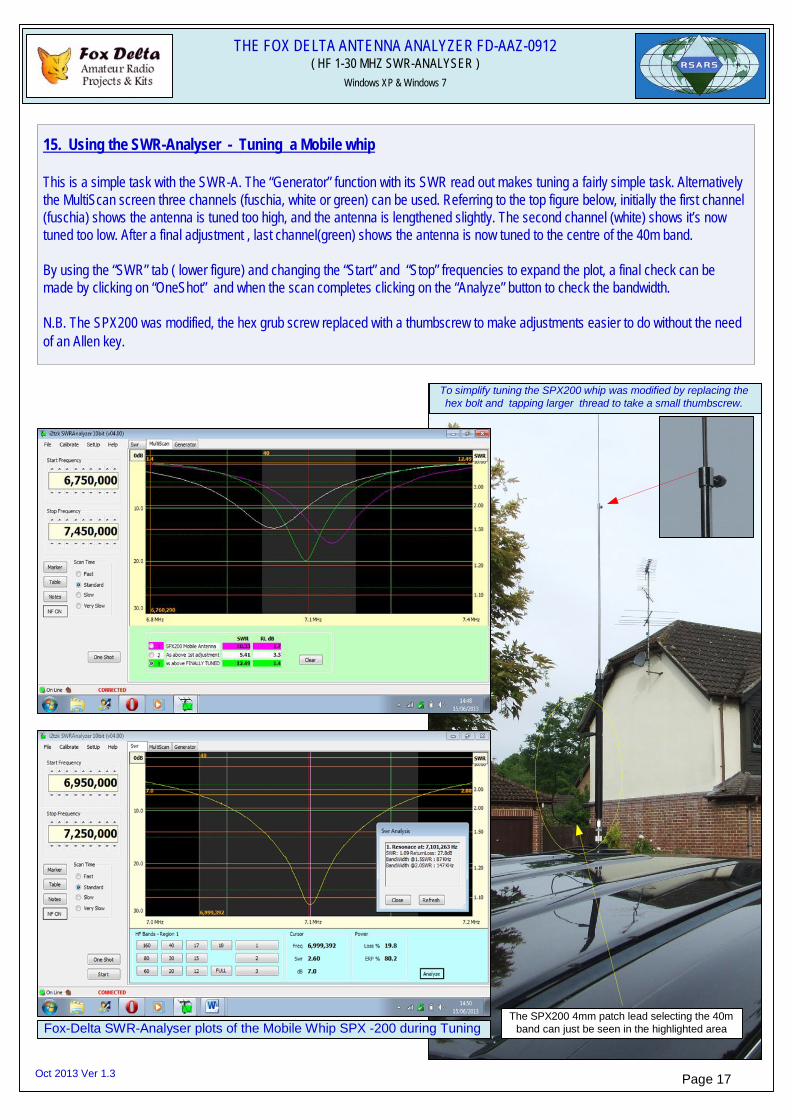
15. Using the SWR-Analyser - Tuning a Mobile whip
This is a simple task with the SWR-A. The “Generator” function with its SWR read out makes tuning a fairly simple task. Alternatively the MultiScan screen three channels (fuschia, white or green) can be used. Referring to the top figure below, initially the first channel (fuschia) shows the antenna is tuned too high, and the antenna is lengthened slightly. The second channel (white) shows it’s now tuned too low. After a final adjustment , last channel(green) shows the antenna is now tuned to the centre of the 40m band.
By using the “SWR” tab ( lower figure) and changing the “Start” and “Stop” frequencies to expand the plot, a final check can be made by clicking on “OneShot” and when the scan completes clicking on the “Analyze” button to check the bandwidth.
N.B. The SPX200 was modified, the hex grub screw replaced with a thumbscrew to make adjustments easier to do without the need of an Allen key.
To simplify tuning the SPX200 whip was modified by replacing the hex bolt and tapping larger thread to take a small thumbscrew.
Fox-Delta SWR-Analyser plots of the Mobile Whip SPX -200 during Tuning The SPX200 4mm patch lead selecting the 40m
band can just be seen in the highlighted area
Oct 2013 Ver 1.3 Page 17

THE FOX DELTA ANTENNA ANALYZER FD-AAZ-0912 ( HF 1-30 MHZ SWR-ANALYSER )
Windows XP & Windows 7
Comparing Different Antennas.
The MultiScan function is ideal for doing this. The figure below is a “Graphics” print using an earlier version of the SWR Analyser ver 3.02 . The print was saved as a PDF using http://www.nitropdf.com/free/# The print does not show the band edges that SWR-A ver 4.0 overlays on the screen . Also visible is the effect of noise at the low frequency end of the plot . The noise filter option was not available in ver 3.02. The PDF shows where the three antennas overlap but on such a wide frequency plot without the band edges being marked its difficult to judge how close the min SWR is to the centre of each HF band.
KEY
Elevated 20m quarter wave antenna @3m height
40m Vertical antenna during tuning -fibreglass fishing pole.
G7FEK Antenna 80m+40M quarter wave inverted “L” antennas
Version 4.0 of the SWR Analyser provides IARU bands makers, and helps with tuning the antenna on the various bands.
User Notes. Modified G7FEK antenna (80m+40m inv “L” antennas, both cut long and connected to the same feed point i.e. parallel connection with a 30cm spacer at the top or vertical 7m section. The 80m antenna brought to resonance on 3.6MHz with a tuner. This is the result.
Oct 2013 Ver 1.3 Page 18

THE FOX DELTA ANTENNA ANALYZER FD-AAZ-0912 ( HF 1-30 MHZ SWR-ANALYSER )
Windows XP & Windows 7
TESTING a “US ARMY” type Mag Loop Tuner Designed for 40m
Test set up for the High Power Mag Loop Tuner with thick insulated copper braid (see text)
A “Safari” 40m mag loop made from heavy-duty green PVC insulated earth braid 12.5mm x 2.5mm tuned using an “US Army Patterson Loop” matching unit (aka tuner). The test set up for tuning and recording measurements used an Acer Netbook and the Fox-Delta SWR-Analyser .
For safety reasons the loop’s SWR was re-checked with 5 watts RF provided by a Yaesu FT817 QRP transceiver using an Avair 20 SWR meter. A external 2500MA 12 volts battery pack powered the FT817.
This ensured that the exposure to the electromagnetic energy field was kept to safe levels.
Oct 2013 Ver 1.3 Page 19

THE FOX DELTA ANTENNA ANALYZER FD-AAZ-0912 ( HF 1-30 MHZ SWR-ANALYSER )
Windows XP & Windows 7
TESTING a “US ARMY” type Mag Loop Tuner Designed for 40m
COMPARING TWO LOOPS USING DIFFERENT TYPES OF COPPER BRAID
The two screenshots below were obtained during beta testing of the SWR-A software.
The heavy-duty earth braid and the BT type coax were recovered from a computer room during a refurbishment. The idea was to use these for a “Safari” mag loop using this 40m “Army Loop” tuner as all the items can easily be packed away for traveling. The second choice was the BT type 2003 75 ohms coax used in PCM transmission systems to deliver 2MB services. Both loops were supported from a horizontal pole at 2m above the ground. (See photo on the previous page)
Insulted heavy duty earth braid - 12.5 mm wide & 2.5mm thick 4.3m long
BT 2003 75 ohms Coax (double screened) 4.5m long
Rather surprising is the fact that the thinner BT2003 coax has a narrower bandwidth suggesting that this are fewer resistive losses because the Q of the tuned loop is higher. .
Oct 2013 Ver 1.3 Page 20