marital biography, social security, and poverty · pdf filemarital biography, social security,...
TRANSCRIPT
Marital Biography, Social Security, and Poverty
I-Fen Lin Department of Sociology
Bowling Green State University
Susan L. Brown
Department of Sociology and National Center for Family & Marriage Research
Bowling Green State University
Anna M. Hammersmith
Department of Sociology Bowling Green State University
National Center for Family & Marriage Research Working Paper Series
WP-15-01 November 2015
An earlier version of this paper was presented at the Social Insurance and Lifecycle Events among Older Americans Conference on December 5, 2014. This research was supported by a grant from the National Institute on Aging (R15AG047588) and by the BGSU Center for Family and Demographic Research, which is funded by the Eunice Kennedy Shriver National Institute of Child Health and Human Development (R24HD050959). Any opinions expressed here are solely those of the authors and not of the funding agency or center.
Marital Biography, Social Security Receipt, and Poverty
Abstract
Increasingly, older adults are unmarried, which could mean a larger share is at risk of
economic disadvantage. Using data from the 2010 Health and Retirement Study, we chart the
diverse range of marital biographies, capturing marital sequences and timing, of adults who are
age eligible for Social Security and examine three indicators of economic well-being: Social
Security receipt, Social Security benefit levels, and poverty status. Partnereds are
disproportionately likely to receive Social Security and they enjoy relatively high Social Security
benefits and very low poverty levels. Among singles, economic well-being varies by marital
biography and gender. Gray divorced and never-married women face considerable economic
insecurity. Their Social Security benefits are relatively low and their poverty rates are quite high
(over 25%), indicating Social Security alone is not sufficient to prevent these women from
falling into poverty. By comparison, late widoweds are the most advantaged singles.
Key words: gender, gray divorce, marital biography, poverty, Social Security
Dramatic changes in U.S. family life are evident across the life course. Perhaps the most
fundamental shift is that a growing share of midlife and older adults is unmarried (Lin & Brown,
2012; Sassler, 2010). Although widowhood is less common nowadays, gray divorce is on the rise
(Brown & Lin, 2012). And, those who form unions in later life are increasingly likely to cohabit
rather than marry (Brown, Bulanda, & Lee, 2012; Vespa, 2012). This retreat from marriage
among middle-aged and older adults has wide-ranging consequences for individual health and
well-being (Dupre & Meadows, 2007; Hughes & Waite, 2009; Pienta, Hayward, & Jenkins,
2000). An extensive literature links marriage with numerous benefits, and foremost among these
is financial resources (Wilmoth & Koso, 2002; Zissimopoulos, 2013). The declining share of
older adults who are married raises critical questions about the role of changing marital
biographies for later life economic well-being.
As more adults confront old age alone, how do they fare economically? In particular, to
what extent do public programs such as Social Security help to mitigate economic disadvantage
for unmarried older adults? The increasingly varied marital biographies of the older adult
population are potentially altering usage patterns for various federal programs such as Social
Security (Iams & Tamborini, 2012; United States Government Accountability Office, 2014). At
the same time, Social Security was designed during an era when most elders were married, a
scenario that is less common today and is likely to be even less typical in the future. In fact, the
decline in marriage is linked to reduced spouse and widow benefit eligibility for Social Security
among women (Tamborini, Iams, & Whitman, 2009). This is particularly concerning given the
outsize role that Social Security plays in economic well-being for many Americans, particularly
those who are poor. Moreover, poor elders are disproportionately single women (Torres, 2014).
Using data from the 2010 Health and Retirement Study, we address how marital
biographies, capturing marital sequences and timing, are related to Social Security benefits and
to poverty. Our goal is to describe marital biographies for adults who are age eligible for Social
Security benefits (i.e., over age 62), emphasizing the diversity among the unmarried population.
We move beyond the traditional, narrow emphasis of much gerontological research that has
focused on marriage and widowhood to encompass other unmarrieds: cohabitors, the separated
and divorced, and the never married (de Jong Gierveld, 2004). In addition to capturing the
sequencing of marital status by examining marital history pathways (e.g., remarried following
divorce versus widowhood), we consider whether the timing of marital dissolution matters by
differentiating between dissolutions that occurred before versus after age 50. This approach
allows us to evaluate the potential impact of a gray divorce, which is an increasingly common
but still off-time event, versus divorce that occurs earlier in the life course. Similarly, we can
evaluate whether early widowhood (prior to age 50), a nonnormative event, is more detrimental
to economic security in later life than widowhood after age 50. Unmarrieds are examined
separately by gender because unmarried women tend to have lower economic well-being than
unmarried men (Holden & Smock, 1991).
Background
Older adults enjoy the lowest overall levels of poverty largely because of the social
insurance provided by programs such as Social Security, which are critical to economic well-
being, especially for those who are economically disadvantaged. Nevertheless, poverty levels
vary by marital status among late middle-aged and older adults with singles four times as likely
to be poor as marrieds (Lin & Brown, 2012; Holden & Kuo, 1996). Further, single women are
more likely to be poor than single men. These differentials partially reflect the rules governing
the distribution of Social Security benefits, which rest on the now outmoded assumption that

nearly all adults marry and remain married until spousal death. Couples who divorce can access
spousal benefits provided they were married at least ten years and they do not remarry before age
60. But, the share of divorced women who qualify for spousal benefits is projected to decline for
successive cohorts (Tamborini & Whitman, 2010). This is especially troubling because among
older unmarried women, the divorced are most likely to be poor, followed by never-marrieds,
and lastly widows (Butricia & Smith, 2012). And, we can expect the shares of single women
who are either divorced or never-married will increase in the coming years (Lin & Brown, 2012).
Lowering this 10 year marriage rule by just a few years would substantially reduce poverty
levels among low-income divorced women, according to a recent study (Tamborini & Whitman,
2010). The salient role of Social Security for the economic well-being of the most vulnerable
elders underscores the need to examine how older adult marital biographies are linked to not
only Social Security receipt and benefit levels but also poverty.
Marital Biographies
Prior research demonstrates that older adult economic well-being varies by marital status
(Gustman & Juster, 1995; Seigel, 1993), but the work to date has not adequately captured the full
range of marital histories characterizing older adults (Holden & Kuo, 1996; Wilmoth & Koso,
2002; Zissimopulos, Karney, & Rauer, 2008). Moreover, most research on the enduring legacy
of marital transitions is now rather dated (drawing on the 1992 HRS) and thus is not necessarily
reflective of the financial circumstances of today’s older adults, who have more diverse marital
biographies compared with earlier generations (although see Addo & Lichter, 2013). Prior work
has focused on sequencing of marital events but ignored the timing of transitions. Finally, very
few studies have examined either Social Security or poverty status according to marital
biography. Our goal is to consider how various marital biographies that encompass both the

sequencing and timing of marital transitions are related to economic security among older adults.
From a life course perspective, we anticipate that one’s marital biography is more salient
for well-being in later life than a simple measure of current marital status because marital
biography captures the sequencing and timing of life events that contribute to the accumulation
of (dis)advantage (O’Rand, 1996; Wilmoth & Koso, 2002). One’s marital biography also is
associated with eligibility for various types (e.g., spousal, survivor) of Social Security benefits,
shaping the magnitude of the overall level of benefits received. Marital biography is relevant for
poverty status. For example, among the currently married, those ever widowed are more likely to
be poor than those in a first marriage. There is no comparable penalty for ever divorced currently
marrieds (Holden & Kuo, 1996).
Partnered Older Adults
A majority of older adults are married and marriage is associated with economic
advantage. The continuously married enjoy higher levels of economic well-being than remarried
couples in late midlife (Addo & Lichter, 2013; Holden & Kuo, 1996; Wilmoth & Koso, 2004).
Unlike those who have experienced marital dissolution, the continuously married have had a
lifetime together to accumulate resources. In contrast, those in remarriages have had to surmount
the financial shock that often accompanies marital dissolution. The remarried are also
disadvantaged compared with the continuously married because of their shorter average marital
durations and competition for resources that support prior unions. Nevertheless, all marrieds
presumably benefit from economies of scale. In fact, men and women can often achieve pre-
divorce levels of financial well-being through repartnering (Jansen, Motelmans, & Snoeckx,
2009; Wilmoth & Koso, 2002).
The number of older adults who co-reside with a partner outside of marriage is
skyrocketing with close to three million individuals ages 50 and older cohabiting in 2010 versus
less than one million in 2000 (Brown et al., 2012). Cohabitation allows older adults to enjoy
many of the benefits of marriage without the legal constraints (Chevan, 1996; Hatch, 1995). In
particular, individuals point to the economic autonomy afforded through cohabitation that
enables them to protect their assets for the next generation. Cohabitors can continue to receive a
former spouse’s benefits, such as Social Security, that would not be available were they to
remarry. One study indicated that cohabitors may be largely comparable to their married
counterparts in terms of economic well-being (Brown et al., 2006), although another found that
cohabitors were more economically disadvantaged, on average, than either continuously married
or remarried couples (Wilmoth & Koso, 2002). The prevalence of poverty among older
cohabitors appears similar to that for single older adults (Chevan, 1996).
Unpartnered Older Adults
Roughly one in three Baby Boomers is unmarried in contrast to just one in five midlife
adults in 1980 (Lin & Brown, 2012). Even at midlife, unmarrieds tend to be worse off compared
with their married counterparts. The share of Baby Boomers living in poverty is nearly five times
higher among unmarrieds (19%) than marrieds (4%). Whereas marrieds enjoy a median
household income of over $105,000, unmarried Boomers are in households with a median
income of about $57,000. There was some variation among unmarrieds, with widowed women
and never-married men most vulnerable, on average (Lin & Brown, 2012).
The marital status composition of older adults has shifted in recent decades such that a
larger proportion is divorced and a smaller share is widowed (Manning & Brown, 2011). Early
research indicated that divorce and widowhood have comparable, negative ramifications for
economic well-being in late mid-life (Holden & Kuo, 1996). Couch and his colleagues (2013)

considered the earnings trajectories and initial Social Security benefits experienced by women
who divorced prior to age 41 during the 1970s. They found that women who divorced and did
not remarry enjoyed a higher earnings trajectory than either continuously married women or
divorced women who remarried. Divorced women who did not remarry claimed Social Security
benefits at later ages, on average, and had the highest initial benefit level, too. Nonetheless, the
overall economic picture for divorced women remains grim since they do not have a spouse who
is also drawing Social Security. Continuously married and remarried women typically have more
economic resources because of the husband’s contributions.
Prior research on economic well-being in later life has overlooked gray divorce (i.e.,
divorce after age 50), an increasingly common event. Gray divorce has doubled since 1990 even
though the overall U.S. divorce rate remains stable (Brown & Lin, 2012). Gray divorce is more
common among remarrieds, the less educated, and those with fewer economic resources. The
consequences of gray divorce are unknown, but it is likely that this experience could have
devastating financial consequences for those who have been out of the labor force (e.g., stay-at-
home wives) or have few economic resources.
Timing
The timing of marital dissolution in the adult life course may have implications for post-
divorce adjustment, including late life economic well-being. Divorce tends to be more normative
at younger ages whereas widowhood becomes increasingly likely with age. From a life course
perspective, the timing of an event can magnify or reduce its influence on well-being (Elder,
1994; Uhlenberg, 1996). Off-time events are associated with poorer outcomes than on-time
events. Thus, divorce prior to age 50 may be less detrimental to economic well-being than
divorce after age 50. Those who divorce earlier in adulthood have more time to recoup the
financial losses divorce usually entails. In contrast, those who divorce later have fewer years of
working life remaining and may not be able to fully recover economically from a gray divorce.
Indeed, gray divorce appears to diminish wealth more than an earlier divorce (Zissimopoulos,
2013). Similarly, widowhood prior to age 50 is an off-time event that is not a normative life
course experience. Young widows are more likely to become poor compared with older widows
(Holden, Burkhauser, & Feaster, 1988). Couples tend to be overly optimistic about the likelihood
they both will survive to an old age (Holden & Kuo, 1996). Thus they may not have adequately
planned for this unlikely possibility and ultimately may be less able to recover fully.
The Role of Gender
Women are economically disadvantaged compared with men and this gender disparity
widens with age. Despite rising female labor force participation in recent decades, a majority of
women receive Social Security through spousal or widow benefits rather than on the basis of
their own contributions (Meyer, Wolf, & Himes, 2006). Given the broader retreat from marriage,
fewer older women may be eligible for spousal or widow benefits, whether because they
divorced less than ten years into their marriage, they did not remarry, or they never married in
the first place. These shifts in women’s marital biographies are linked to reduced benefits levels
(Tamborini et al., 2009). For these reasons, we anticipate that marital biographies will play a
larger role in the economic well-being of older women than men, an expectation that aligns with
results from prior studies (Holden & Kuo, 1996; Wilmoth & Koso, 2002).
The Present Study
The current study documents the complex marital biographies characterizing today’s
older adults and addresses how these biographies are linked to economic well-being in later life.
Specifically, we examine the proportions of age eligible older adults who receive Social Security

benefits and the average level of annual benefits by marital biography. Additionally, we consider
poverty status because Social Security benefits play a large role in the economic well-being of
those who are poor. Social Security benefits keep many older adults from falling into poverty.
Our analyses control for factors linked with both marital biography and economic well-being,
including age, race and ethnicity, education, work history, current work status, health status,
home ownership, and receipt of Social Security prior to full retirement age. Also, we include a
measure of whether the individual was married for at least ten years (i.e., eligible for spousal
Social Security benefits) and the presence of any dependents. Additional analyses address
whether gender modifies the association between marital biography and economic well-being
because prior work demonstrates women are more disadvantaged by divorce and widowhood
than are men (Wilmoth & Koso, 2002).
Method
Data used in the analysis come from the Health and Retirement Study (HRS), a
longitudinal study of a nationally representative, continuous cohort of individuals born before
1960. The original HRS cohort consists of respondents who were aged 51-61 in 1992. The panel
has been refreshed every six years—in 1998, 2004, and 2010—with a new sample of persons
aged 51-56. The HRS respondents and their spouses/partners are interviewed every other year
until their death. The response rates for the original baseline interviews hover around 70-80%.
The re-interview response rates are around 90% in each wave. We drew most information from
the RAND HRS file (Version M, 2013) and combined it with the original HRS data to construct
respondents’ marital biographies. The HRS is arguably the best available data source to study
marital biography and economic well-being in late life because respondents are asked at initial
interview about up to three previous marriages and their subsequent union transitions are tracked
over time. The study also includes detailed questions about Social Security receipt and income.
The analytic sample is restricted to the HRS respondents and their spouses/partners who
were age 63 and older in 2010 because Social Security receipt is measured for the past year and
to be eligible individuals would have to be at least 62 years of age. In 2010, 20,508 HRS
respondents and their spouses/partners were interviewed, of which 10,134 were younger than age
63 (49%). We further excluded 33 respondents who were in a same-sex relationship (< 1%), 370
respondents for whom their marital biographies cannot be ascertained from the data (< 2%), and
322 respondents who moved into nursing homes by 2010 (< 2%). In total, the analysis consisted
of 9,649 individuals.
Measures
Marital biography was assessed using respondents’ reports on their previous marriages
and subsequent union transitions. When respondents first joined the study, they were asked about
their marital history. Ever-married respondents reported the beginning and ending years/months
of three previous marriages and the most recent marriage.1 The HRS also collected information
on how each previous marriage ended—through divorce or widowhood. At each subsequent
interview, respondents were asked whether their spouse/partner at the previous interview was
still their current spouse/partner. If not, the ending year/month of the union and how the union
was ended were recorded. For respondents who had not been partnered in the previous wave but
were currently partnered, the starting year/month of the current union was asked. Based on the
retrospective reports on previous marriages and the prospective follow-up on subsequent union
transitions, we created 11 groups of respondents with various marital biographies: continuously
1 Respondents were asked about their previous marriages (up to three) and current marriage at all waves
except the 1994 and 1996 waves. In 1994, only the first marriage was asked. In 1996, only the first and
most recent marriages were asked.
marrieds, remarrieds after divorce (before versus after age 50), remarrieds after widowhood
(before versus after age 50), cohabitors, widoweds (before versus after age 50), divorceds (before
versus after age 50), and never-marrieds.2
Social Security receipt (Yes = 1, No =0) and benefit level were measured in 2010 dollars,
including income from Social Security retirement, spousal, or survival benefits. For respondents
who were partnered, this measure combined both respondents’ and their spouse/partner’s Social
Security receipt and benefits.
Poverty status (Yes = 1, No = 0) captures whether income for the last calendar year was
below the poverty threshold, using the U.S. Census definition and poverty thresholds. HRS
income was measured at the household level, including both respondent’s and spouse/partner’s
earnings, capital income, employer pension or annuity, Social Security disability or
Supplemental Security income, Social Security, unemployment or workers compensation, and
other sources of income. The poverty measure adjusted for household size.
Other covariates comprise age (in year), gender (women = 1, men = 0), race and
ethnicity (White, Black, Hispanics, and others), education (attended college = 1, did not attend
college = 0), the number of years worked, current work status (working = 1, not working = 0),
poor health status (fair or poor health = 1; excellent, very good, and good health = 0), length of
the longest marriage is at least equal to 10 years (Yes = 1, No = 0), home ownership (Yes = 1,
No = 0), presence of any family members who depended on the respondent for more than half of
their support (Yes = 1, No = 0), and whether respondents received Social Security before full
2 For the few cases in which respondents experienced multiple marital transitions across the life course
(e.g., divorce both prior to and after age 50), respondents were classified on the basis of the most recent
transition (i.e., divorce after 50 in this example). We combined respondents with different pathways
leading to cohabitation because sample sizes were too small to permit finer distinctions. Of 234
cohabitors, 22 were never married, 58 were divorced prior to age 50, 73 were divorced after age 50, 13
were widowed prior to age 50, and 68 were widowed after age 50.

retirement age (Yes = 1, No = 0).
Analytic Strategy
Four analyses were conducted. First, we unpacked the complexity of marital biography
by illustrating the various marital status pathways in old age. Second, we examined the
proportion of individuals who receive Social Security, the mean value of Social Security
benefits, and percentage poor across the 11 marital biography groups, paying attention to gender
differences among the unpartnered. Third, we provided descriptive statistics for all
sociodemographic characteristics according to marital biography. Fourth, we estimated a logistic
regression model predicting receipt of Social Security to assess whether marital biography
variation is an artifact of sociodemographic characteristics (full sample, n = 9,649 households).
Similarly, we conducted ordinary least squares regression to estimate Social Security benefit
levels among individuals who received Social Security (n = 8,965). We also used logistic
regression to predict the likelihood of being poor across marital biographies, net of
sociodemographic factors (n = 9,649).3 Because less than 2% of the analytic sample is missing in
at least one of the measures, we used mode and mean to impute missing value in categorical and
continuous variables, respectively. We also weighted all analyses to adjust for HRS’s complex
survey design, the clustering of respondents and their spouse/partner, and the oversample of
African Americans, Hispanics, and Florida residents (Willis, 1999).
Results
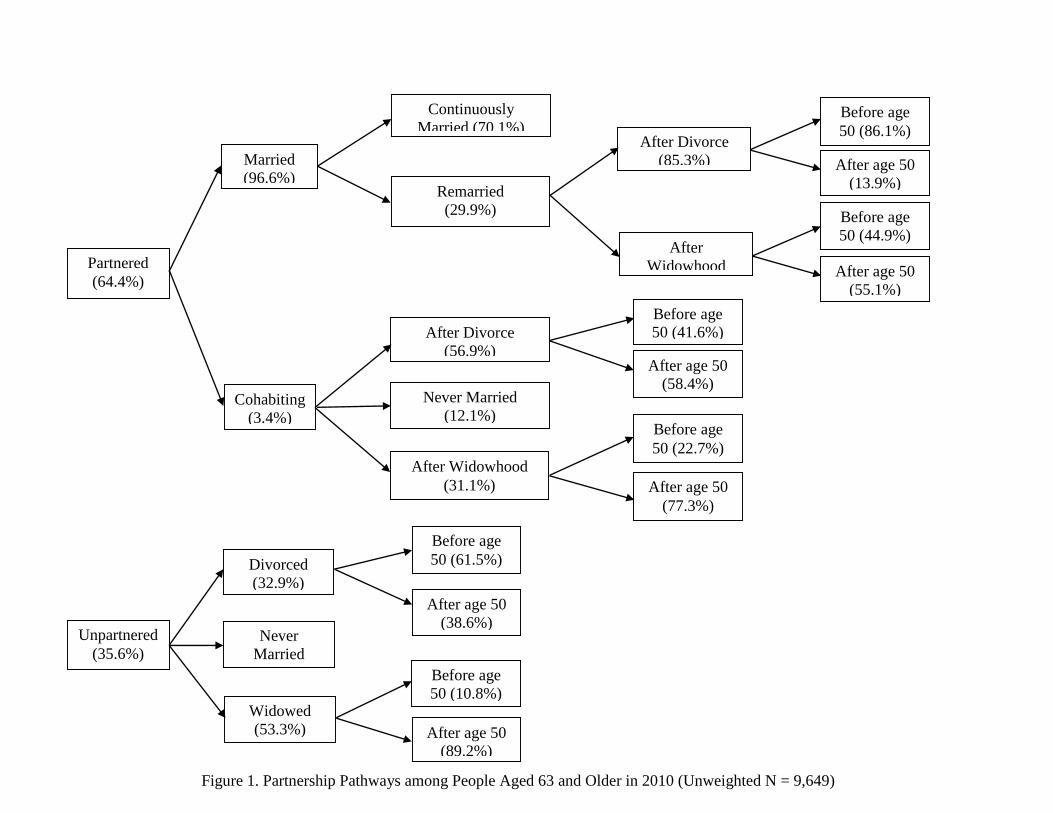
Among individuals who were age eligible for Social Security benefits in 2010, their
marital biographies are diverse. As shown in Figure 1, nearly two-thirds of individuals are
partnered, with 96.6% married and 3.4% in a cohabiting union. Of those who are married, 70.1%
3 Whether respondents received Social Security prior to full retirement age was considered only in the
regressions predicting Social Security benefit levels and the likelihood of being poor.

are in a continuous first marriage and 29.9% are in a remarriage. The pathway to remarriage is
more likely to have been through divorce (85.3%) than widowhood (14.7%). Divorce is more
common than widowhood for those who experienced marital dissolution prior to age 50 (86.1%
versus 44.9%). Of those who are in a cohabiting union, roughly six in ten are divorced, three in
ten are widowed, and one in ten are never-married. Divorced individuals are more often
remarried than cohabiting if their divorce occurred prior to age 50 (86.1% versus 41.6%), but
they are more often cohabiting than remarried if their divorce occurred after age 50 (58.4%
versus 13.9%). A similar pattern is found among widoweds. Turning now to the more than one-
third of individuals who remain unpartnered, 53.3% are widowed, 32.9% are divorced, and
13.8% are never-married. Remaining unpartnered is far more common for individuals who were
widowed than for individuals who divorced after age 50 (89.2% versus 38.6%). Marital
biographies are distinctive for men and women, as illustrated by the gender-specific figures
provided as online supplemental files.
[Figure 1 about here]
Table 1 shows how older adults classified across 11 distinct marital biography categories
fare on several indicators of economic well-being. The table presents the proportions of
individuals who receive Social Security. And, for those who receive Social Security, it depicts
the mean value of Social Security benefits. It also shows the percentage poor.
[Table 1 about here]
About 91% of continuously married couples receive Social Security. Compared with
continuously marrieds, a smaller proportion of remarrieds after gray divorce (83%) but a larger
proportion of remarrieds after late widowhood (98%) receive Social Security. Relative to those
who remarried following a gray divorce (83%), larger shares of those who remarried following
late widowhood (98%) or who are cohabiting (93%) receive Social Security benefits. Overall,
the unpartnered are less likely to receive Social Security than their respective remarried
counterparts. Relative to late widoweds (93%), smaller shares of gray divorceds (80%) and never
marrieds (76%) receive Social Security.
For those receiving Social Security, the mean benefit values are comparable between
continuously marrieds and remarrieds except for one group: remarrieds after an early divorce
receive a lower mean level of benefits than continuously marrieds ($20,807 versus $22,607),
suggesting an enduring influence of divorce across the life course. Among unpartnereds there is
considerable variation in benefits levels, with late widoweds ($13,800) enjoying higher benefits
than either gray divorceds ($12,332) or never marrieds ($11,804). Some notable gender
differences emerge among unpartnered individuals. Women’s ($10,995) benefits are lower, on
average, than men’s ($13,633) among those who experienced a gray divorce. And among late
widoweds, widowers tend to receive higher benefits than widows ($15,026 versus $13,462).
Turning now to poverty status, unmarrieds are clearly at a higher risk of poverty than are
marrieds. Poverty levels for marrieds are quite low, hovering around just 1-3%, illustrating the
role Social Security plays in lifting older adults out of poverty. Nearly 4% of cohabitors are poor.
By comparison, much larger shares of various unmarried groups are poor. Among the
unpartnered, notable differences in poverty emerge that mirror those obtained for Social
Security: relative to late widoweds (13%), larger shares of gray divorceds (19%) and never-
marrieds (20%) are poor.
The feminization of poverty is evident with a whopping 27% of gray divorce women
poor. Just 11% of gray divorce men are in poverty. Gray divorce women are much more
disadvantaged than other unmarried women. The proportion of gray divorce women living in

poverty is higher than that for early divorce women (19%) and late widowed women (14%).
Gray divorced women (27%) are comparable to never married women (25%).
The means or percentages of the individual’s sociodemographic characteristics are shown
in Table 2a for partnereds and Table 2b for unpartnereds. The average age of continuously
marrieds is 71. Those who remarried following an early divorce tend to be younger while those
who remarried after late widowhood are older. Among those remarried after a gray divorce, most
are men; just 28% are women. Similarly, 36% of those remarried after late widowhood are
women. The modal racial and ethnic category across all couple households is white, although
cohabitors (11%), early widoweds (22%), and never marrieds (18%) are disproportionately
black. About one-half of continuously marrieds have at least some college. Cohabitors tend to be
less educated than marrieds and remarrieds after divorce. Early and late widoweds are less
educated at about one-third with some college. Years worked ranges from lows of about 33 years
for early and late widoweds and remarrieds following early widowhood to highs of 41 years for
those remarried after a gray divorce. About 28% of continuously marrieds are currently working.
Those who remarried after late widowhood or who are late widoweds are unlikely to be working
at about 15%. There is some marital biography variation in poor health, ranging from just 22% of
continuously marrieds to about one-third of early and late widoweds and early and gray
divorceds reporting poor health. By comparison, only 27% of never-marrieds report poor health.
Nearly all individuals have (had) a marriage that lasted at least 10 years, even among cohabitors
and divorceds. About 7% of partnered have a dependent versus 5% of unpartnereds. More than
three-quarters of partnereds received Social Security prior to full retirement age, although the
shares among cohabitors and remarrieds following a gray divorce were comparatively modest at
70% and 66%, respectively. Among unpartnereds, smaller shares of never-marrieds (59%) and

early (61%) and gray (64%) divorceds received Social Security early compared with early (72%)
and late (73%) widoweds.
[Tables 2A and 2B about here]
Table 3 shows the multivariate models testing whether the marital biography differentials
in economic well-being are due to compositional factors. Social Security receipt varies by
partnership status, net of sociodemographic factors. Relative to the continuously married,
remarrieds and cohabitors are similarly likely to receive Social Security with one exception:
those who are remarried following gray divorce. The odds of receiving Social Security are about
two-thirds lower for remarrieds after gray divorce compared with continuously marrieds. In fact,
remarrieds after gray divorce appear more similar to all unpartnered groups, whose odds of
Social Security receipt tend to hover around one-third of that enjoyed by the continuously
married. The other covariates operate largely as expected, with the likelihood of Social Security
receipt positively associated with age, being a woman, years worked, and negatively related to
education and current work status. Contrary to our expectations, Social Security receipt is
negatively related to poor health.
[Table 3 about here]
Taking into account sociodemographic characteristics, there is little variation in Social
Security benefits levels for partnered individuals. The one difference is that those who remarried
after an early divorce receive fewer benefits than the continuously married. Relative to the
continuously married, all unpartnereds receive smaller benefits. The associations of other
covariates with Social Security benefits are consistent with our expectations. Age, gender,
education, the length of employment history, a marriage lasting at least 10 years, and home
ownership are positively associated with Social Security benefits. Minority status, current

employment, and poor health are negatively related to Social Security benefits.
The logistic regression predicting poverty status yields similar conclusions in that the
unpartnered face considerably higher odds of poverty than do marrieds and cohabitors. And, late
widoweds have lower odds of being poor than do gray divorceds. Never marrieds have higher
odds of poverty than late widoweds, but do not differ from either early or late divorceds. Late
widoweds who remarried have lower odds of being poor than the continuously married. The
covariates operate in the expected directions, with minorities and poor health positively
associated with poverty and education, years worked, currently working, home ownership, and
receiving benefits prior to full retirement age negatively related to poverty.
Finally, we consider interactions between gender and marital biography with results
shown in Table 4. All possible interactions were included in the models but only those for the
unpartnereds are shown in the table. We use gray divorced women as the reference category
because they are arguably the most disadvantaged group (based on results shown in Table 1).
The odds of Social Security receipt are largely comparable among unpartnered groups and only
one significant gender difference within marital biography type emerges: late widows are much
more likely to receive Social Security than late widowers. But Social Security benefits levels
vary such that relative to gray divorced women, all other unpartnereds, excluding early divorced
women, experience significantly higher average Social Security benefit levels. Gender
differences within marital biography type are few. The only other marital biography type in
which there is a gender gap is early divorceds, with women faring worse than men. The pattern
of findings for poverty status are similar, although never-marrieds are no less likely to be poor
than gray divorced women. The odds that gray divorced men are poor are about 67% lower than
the odds for gray divorced women. Otherwise, there are no significant gender differences within

marital biography type. Together, these marital biography and gender differentials underscore
the economic disadvantage characterizing gray divorced women and to a lesser extent never
married women and men.
[Table 4 about here]
Discussion
Our primary goal was to establish how the complex marital biographies of older adults
are linked to key markers of economic well-being. Social Security is critical to keeping many
older adults from falling into poverty. However, our results indicate that Social Security receipt
and benefits levels as well as poverty vary dramatically by marital biography. This means that
the social safety net is more effective for some groups than others. Social security receipt is more
common and benefits levels are significantly higher for couples than for singles. This difference
reflects in part the number of adults in the household but recall many singles (primarily women)
receive spousal or survivor benefits rather than benefits based on their own work history
(Tamborini et al., 2009). Similarly, poverty is more widespread among singles than partnereds.
Poverty levels for singles range from 13-20% versus a mere 1-4% for partnereds.
Among partnereds, those who are married enjoy largely comparable benefits regardless
of whether they are in a first or remarriage. Moreover, whether the remarriage followed a divorce
or widowhood (and the timing of that marital dissolution) is largely immaterial (although
remarrieds following gray divorce are less likely to receive Social Security). For marrieds then,
marital status arguably trumps marital biography. Cohabitors appear similar to continuously
marrieds and remarrieds.
There is considerable variation in economic well-being among the unpartnered,
illustrating the utility of capturing the marital biographies of singles. Relative to other singles,

late widoweds are most likely to receive Social Security and they receive the highest average
levels of benefits, which is not surprising given that this program is designed to assist long-term
marrieds who experience spousal death. This advantage extends to poverty status. Late
widoweds are much less likely to be poor than either never marrieds or gray divorceds. In fact,
gray divorceds appear to be the most vulnerable group of singles with relatively low Social
Security benefits and high poverty levels. This is a significant policy concern because even if the
gray divorce rate does not rise in the next 20 years (an arguably conservative assumption), the
number of older adults experiencing gray divorce is projected to increase by one-third due to the
aging of the population (Brown & Lin, 2012), resulting in a larger share of singles at risk of
economic insecurity.
Gender plays a role in the economic well-being of singles. Gray divorced women face
considerable economic disadvantage. They receive smaller Social Security benefits, on average,
than all other single women and men. They also confront exceptionally high poverty levels at
roughly 27%. By comparison, gray divorced men’s poverty is 50% lower. Late widowed women
also enjoy a 50% lower poverty rate. Among men, economic well-being is comparable for gray
divorceds and late widowers. Thus, it is gray divorced women who are left behind when a
marital dissolution occurs in late life. Divorce timing matters for women: early divorced women
enjoy a 30% lower poverty rate than gray divorced women. Either early divorce is less
financially devastating than gray divorce, or early divorced women are able to recoup divorce-
related financial losses over time. Nearly all gray divorceds were married at least 10 years,
meaning they are eligible for spousal benefits. Yet, the Social Security benefits received by gray
divorced women are insufficient to keep them out of poverty.
Gray divorced women are the most economically disadvantaged group, but never married
women are also economically insecure. The two groups are comparable in terms of poverty and
mean Social Security benefits level. These stark findings elucidate vulnerable groups of singles.
Traditionally, widowed women garnered concern but for contemporary cohorts it appears that
two growing demographic groups—gray divorceds and never-marrieds—are at greatest risk of
economic insecurity. The fact that late widowed women fare better than gray divorced and never
married women illustrates the effectiveness of social programs in minimizing economic
disadvantage.
At the same time, these differentials expose gaps in current policy as social programs
have not been adequately reformulated to accommodate shifting demographics. Without changes
to the eligibility rules for Social Security, we anticipate a growing share of older adults,
especially women, will be economically disadvantaged in the coming years. Social Security is
predicated on the traditional marital biography of long-term marriage followed by spousal death,
yet this pathway is experienced by a declining proportion of older adults. Alterations to the
eligibility rules could substantially improve the economic well-being of older adults, providing a
stronger safety net for vulnerable elders regardless of their marital biographies. Modest rule
changes, such as reducing the 10 year marriage rule by just a couple of years, have the potential
to significantly improve the economic well-being of older adults (Tamborini & Whitman, 2010).
This study is enhanced by careful attention to the marital biography, but it has some
limitations. Perhaps a key shortcoming is that we cannot directly account for selection into
various marital biographies. For example, married couples who are economically disadvantaged
are more likely to get divorced. And, the propensity of divorced individuals to remarry and the
timing of remarriage also vary by sociodemographic characteristics and other unmeasured
factors. Although we accounted for several possible confounding variables, the differences

documented here may be attributable to selection rather than marital biography per se. Another
limitation is that we do not account for couple-level marital biographies for marrieds and
cohabitors. Future work should aim to decipher both the respondent’s and the spouse’s or
partner’s marital biographies. Also, our approach assumes that couples commingle their finances
and share resources. This is an entirely reasonable assumption for married couples but
questionable for cohabitors given that many choose to cohabit so they can keep their assets
separate (Brown et al., 2006; Chevan, 1996). Also, our study is not generalizable to the oldest
old (i.e., ages 85+) because of the cohort design of HRS. Only about 10% of persons ages 63 and
older are over age 85 (authors’ calculations using American Community Survey data), and thus
their inclusion would be unlikely to substantially change the results. Still, to the extent that they
are disproportionately late widowed women, their inclusion may alter the pattern of economic
well-being observed for this group.
Our paper adds to the growing literature on how the increasingly diverse marital
biographies of older adults, especially women, are weakening the safety net and financial
security of a growing share of elders. The Social Security system was designed during an era
marked by nearly universal marriage and low levels of divorce. Protections are lacking for a
growing share of adults, including never marrieds, those divorced but married less than ten years,
and even cohabiting couples. These gaps in protection correspond with the marital biographies of
those groups that are disproportionately likely to be poor and thus rely heavily on Social Security
benefits to make ends meet. In particular, gray divorced and never married women confront high
poverty levels despite receiving Social Security benefits. Moreover, both groups are expected to
increase as a proportion of the older adult population in the coming years. In short, more older
Americans are economically insecure, without an adequate safety net to respond to major life

events, such as the onset of disability or chronic disease, that can be financially devastating.
Future research should address how marital biographies are linked to the health and well-being
of older adults.
References
Addo, F. R., & Lichter, D. T. (2013). Marriage, marital history, and Black–White wealth
differentials among older women. Journal of Marriage and Family, 75, 342-362.
Brown, S. L., Lee, G. R., & Bulanda, J. R. (2006). Cohabitation among older adults: A national
portrait. Journal of Gerontology: Social Sciences, 61, S71-S79.
Brown, S. L., Bulanda, J. R., & Lee, G. R. (2012). Transitions into and out of cohabitation in
later life. Journal of Marriage and Family, 74, 774-793.
Brown, S. L., & Lin, I.-F. (2012). The gray divorce revolution: Rising divorce among middle-
aged and older adults, 1990-2010. The Journals of Gerontology, Series B: Psychological
Sciences and Social Sciences, 67, 731-741.
Butricia, B. A., & Smith, K. E. (2012). The retirement prospects of divorced women. Social
Security Bulletin, 72, 11-22.
Chevan, A. (1996). As cheaply as one: Cohabitation in the older population. Journal of Marriage
and the Family, 58, 656-667.
Couch, K. A., Tamborini, C. R., Reznik, G. L., & Phillips, J. W. R. (2013). Divorce, women’s
earnings, and retirement over the life course. In K. A. Couch, M. C. Daly, & J. M.
Zissimopoulos (Eds.), Lifecycle events and their consequences: Job loss, family change, and
declines in health (pp. 133-157). Stanford, CA: Stanford University Press.
de Jong Gierveld, J. (2004). Remarriage, unmarried cohabitation, living apart together: Partner
relationships following bereavement or divorce. Journal of Marriage and Family, 66, 236-
243.
Dupre, M. E., & Meadows, S. O. (2007). Disaggregating the effects of marital trajectories on
health. Journal of Family Issues, 28, 623-652.
Elder Jr, G. H. (1994). Time, human agency, and social change: Perspectives on the life course.
Social Psychology Quarterly, 57, 4-15.
Gustman, A. L., & Juster, F. T. (1995). Income and wealth of older American households:
modeling issues for public policy analysis (No. w4996). National Bureau of Economic
Research.
Hatch, R. (1995). Aging and cohabitation. Garland Pub.
Holden, K. C., Burkhauser, R. V., & Feaster, D. J. (1988). The timing of falls into poverty after
retirement and widowhood. Demography, 25, 405-414.
Holden, K. C., & Kuo, H. H. D. (1996). Complex marital histories and economic well-being: The
continuing legacy of divorce and widowhood as the HRS cohort approaches retirement. The
Gerontologist, 36, 383-390.
Holden, K. C., & Smock, P. J. (1991). The economic costs of marital dissolution: Why do
women bear a disproportionate cost? Annual Review of Sociology, 17, 51-78.
Hughes, M. E., & Waite, L. J. (2009). Marital biography and health at mid-life. Journal of
Health and Social Behavior, 50, 344-358.
Iams, H. M., & Tamborini, C. R. (2012). Implications of Marital History Change on Women's
Eligibility for Social Security Wife and Widow Benefits, 1990-2009, Social Security
Bulletin, 72, 23-36.
Jansen, M., Mortelmans, D., & Snoeckx, L. (2009). Repartnering and (Re)employment:
Strategies to cope with the economic consequences of partnership dissolution. Journal of
Marriage and Family, 71, 1271-1293.
Lin, I.-F., & Brown, S. L. (2012). Unmarried boomers confront old age: A national portrait. The

Gerontologist, 52, 153-165.
Manning, W. D., & Brown, S. L. (2011). The demography of unions among older Americans,
1980-present: A family change approach. In R. A. Settersten, Jr., & J. L. Angel (Eds.),
Handbook of sociology of aging (pp. 193–210). New York, NY: Springer.
Meyer, M. H., Wolf, D. A., & Himes, C. L. (2006). Declining Eligibility for Social Security
Spouse and Widow Benefits in the United States? Research on Aging, 28, 240-260.
O‘Rand, A. M. (1996). The precious and the precocious: Understanding cumulative disadvantage
and cumulative advantage over the life course. The Gerontologist, 36, 230-238.
Pienta, A. M., Hayward, M. D., & Jenkins, K. R. (2000). Health consequences of marriage for
the retirement years. Journal of Family Issues, 21, 559-586.
Sassler, S. (2010). Partnering across the life course: Sex, relationships, and mate selection.
Journal of Marriage and Family, 72, 557-575.
Seigel, J. S. (1993). A generation of change: A profile of America’s older population. New York:
Russell Sage Foundation.
Tamborini, C. R., Iams, H. M., & Whitman, K. (2009). Marital history, race, and social security
spouse and widow benefit eligibility in the United States. Research on Aging, 31, 577-605.
Tamborini, C. R., & Whitman, K. (2010). Lowering Social Security’s duration-of-marriage
requirement: Distributional effects for future female retirees. Journal of Women & Aging, 22,
184-203.
Torres, S. (2014). Aging women, living poorer. Contexts, 13, 72-74.
Uhlenberg, P. (1996). Mutual attraction: Demography and life-course analysis. The
Gerontologist, 36, 226-229.
United States Government Accountability Office. (2014). Retirement security: Trends in

marriage and work patterns may increase economic vulnerability for some retirees. Report to
Chairman, Special Committee on Aging, U.S. Senate. Retrieved from
http://www.gao.gov/assets/670/660202.pdf
Vespa, J. (2012). Union formation in later life: economic determinants of cohabitation and
remarriage among older adults. Demography, 49, 1103-1125.
Willis, R. J. (1999). Theory confronts data: How the HRS is shaped by the economics of aging
and how the economics of aging will be shaped by the HRS. Labour Economics, 6, 119-145.
Wilmoth, J., & Koso, G. (2002). Does marital history matter? Marital status and wealth
outcomes among preretirement adults. Journal of Marriage and Family, 64, 254-268.
Zissimopoulos, J. M. (2013). Marriage and wealth changes at older ages. In K. A. Couch, M. C.
Daly, & J. M. Zissimopoulos (Eds.), Lifecycle events and their consequences: Job loss,
family change, and declines in health (pp. 158-177). Stanford, CA: Stanford University
Press.
Zissimopoulos, J., Karnet, B., & Rauer, A. (2008). Marital histories and economic well-being.
University of Michigan Retirement Research Center Working Paper, WP 2008-180.
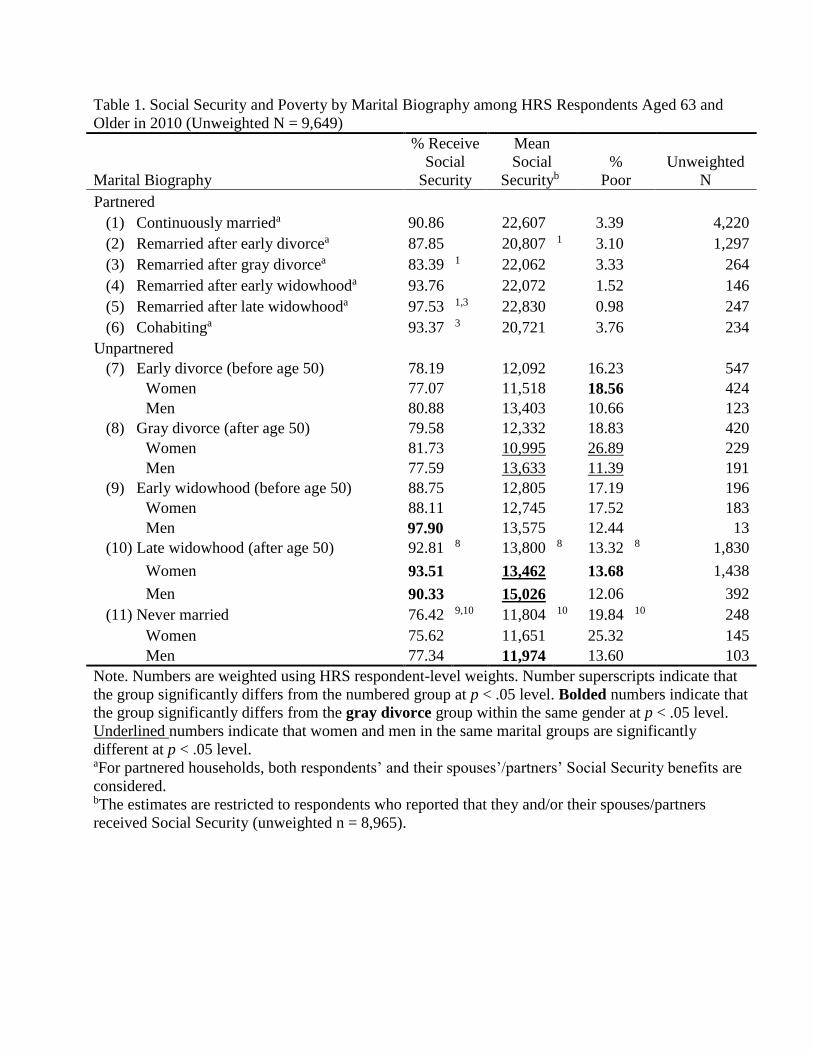
Table 1. Social Security and Poverty by Marital Biography among HRS Respondents Aged 63 and
Older in 2010 (Unweighted N = 9,649)
Marital Biography
% Receive
Social
Security
Mean
Social
Securityb
%
Poor
Unweighted
N
Partnered
(1) Continuously marrieda 90.86 22,607 3.39 4,220
(2) Remarried after early divorcea 87.85 20,807 1 3.10 1,297
(3) Remarried after gray divorcea 83.39 1 22,062 3.33 264
(4) Remarried after early widowhooda 93.76 22,072 1.52 146
(5) Remarried after late widowhooda 97.53 1,3 22,830 0.98 247
(6) Cohabitinga 93.37 3 20,721 3.76 234
Unpartnered
(7) Early divorce (before age 50) 78.19 12,092 16.23 547
Women 77.07 11,518 18.56 424
Men 80.88 13,403 10.66 123
(8) Gray divorce (after age 50) 79.58 12,332 18.83 420
Women 81.73 10,995 26.89 229
Men 77.59 13,633 11.39 191
(9) Early widowhood (before age 50) 88.75 12,805 17.19 196
Women 88.11 12,745 17.52 183
Men 97.90 13,575 12.44 13
(10) Late widowhood (after age 50) 92.81 8 13,800 8 13.32 8 1,830
Women 93.51 13,462 13.68 1,438
Men 90.33 15,026 12.06 392
(11) Never married 76.42 9,10 11,804 10 19.84 10 248
Women 75.62 11,651 25.32 145
Men 77.34 11,974 13.60 103
Note. Numbers are weighted using HRS respondent-level weights. Number superscripts indicate that
the group significantly differs from the numbered group at p < .05 level. Bolded numbers indicate that
the group significantly differs from the gray divorce group within the same gender at p < .05 level.
Underlined numbers indicate that women and men in the same marital groups are significantly
different at p < .05 level. aFor partnered households, both respondents’ and their spouses’/partners’ Social Security benefits are
considered. bThe estimates are restricted to respondents who reported that they and/or their spouses/partners
received Social Security (unweighted n = 8,965).

Table 2A. Weighted Means or Percentages of Sociodemographic Characteristics of HRS Partnered Respondents Aged 63 and Older in 2010
Total
Continuously
married
(1)
Remarried
after early
divorce
(2)
Remarried
after gray
divorce
(3)
Remarried
after early
widowhood
(4)
Remarried
after late
widowhood
(5)
Cohabiting
(6)
Age 70.79 71.01 69.22 1 71.81 2 72.16 2 76.56 1,3,4 70.40 4,5
Women 44.16 45.34 43.81 27.67 1,2 57.87 1,2 35.87 1,4 37.53 1,3,4
Race and ethnicity
White 86.15 85.85 88.48 84.43 83.99 89.84 4 77.85 1,2,5
Black 5.46 4.77 6.69 6.63 7.11 3.24 4 10.80 1.2.5
Hispanic 6.61 7.43 3.72 1 7.02 2 6.67 5.16 8.88 2
Others 1.79 1.95 1.10 1.91 2.23 1.76 2.48
Some college or higher 50.26 49.45 54.86 1 60.83 1 38.85 2 42.79 3 38.52 1,2,3
Years worked 37.95 37.41 39.68 1 40.90 1 34.39 1,2 38.22 4 36.83 2,3
Currently working 28.44 27.38 33.10 1 33.05 26.74 15.39 1,3,4 25.83 5
Poor health 21.64 20.86 22.77 21.10 25.46 24.09 26.81
Length of the longest marriage ≥ 10
years 98.07 98.84 98.24 98.67 97.71 100.00 79.74 1,2,3,4,5
Owns home 82.34 83.02 83.82 81.18 86.93 84.15 56.67 1,2,3,4,5
Any dependent 7.43 7.48 8.07 7.34 6.59 4.80 5.03
Receives Social Security before FRAa 77.94 79.85 75.66 66.36 1 78.60 71.85 1 69.60 1
Unweighted N 6,408 4,220 1,297 264 146 247 234
Note. Numbers are weighted using HRS respondent-level weights. Number superscripts indicate that the group significantly differs from the
numbered group at p < .05 level. aFRA = full retirement age
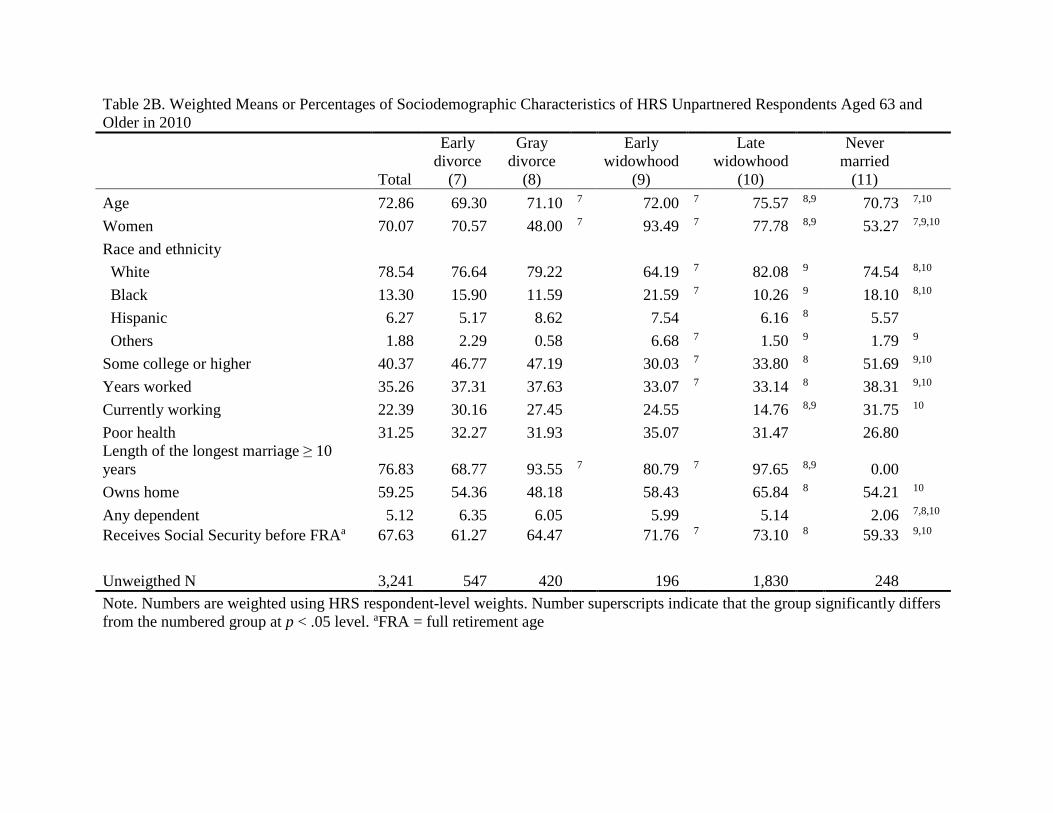
Table 2B. Weighted Means or Percentages of Sociodemographic Characteristics of HRS Unpartnered Respondents Aged 63 and
Older in 2010
Total
Early
divorce
(7)
Gray
divorce
(8)
Early
widowhood
(9)
Late
widowhood
(10)
Never
married
(11)
Age 72.86 69.30 71.10 7 72.00 7 75.57 8,9 70.73 7,10
Women 70.07 70.57 48.00 7 93.49 7 77.78 8,9 53.27 7,9,10
Race and ethnicity
White 78.54 76.64 79.22 64.19 7 82.08 9 74.54 8,10
Black 13.30 15.90 11.59 21.59 7 10.26 9 18.10 8,10
Hispanic 6.27 5.17 8.62 7.54 6.16 8 5.57
Others 1.88 2.29 0.58 6.68 7 1.50 9 1.79 9
Some college or higher 40.37 46.77 47.19 30.03 7 33.80 8 51.69 9,10
Years worked 35.26 37.31 37.63 33.07 7 33.14 8 38.31 9,10
Currently working 22.39 30.16 27.45 24.55 14.76 8,9 31.75 10
Poor health 31.25 32.27 31.93 35.07 31.47 26.80
Length of the longest marriage ≥ 10
years 76.83 68.77 93.55 7 80.79 7 97.65 8,9 0.00
Owns home 59.25 54.36 48.18 58.43 65.84 8 54.21 10
Any dependent 5.12 6.35 6.05 5.99 5.14 2.06 7,8,10
Receives Social Security before FRAa 67.63 61.27 64.47 71.76 7 73.10 8 59.33 9,10
Unweigthed N 3,241 547 420 196 1,830 248
Note. Numbers are weighted using HRS respondent-level weights. Number superscripts indicate that the group significantly differs
from the numbered group at p < .05 level. aFRA = full retirement age

Table 3. Weighted Regressions of Social Security Receipt (Logistic), Social Security Level (OLS), and Poverty
(Logistic) on HRS Respondents’ Sociodemographic Characteristics (Unweighted N = 9,649)
Social Security
Receipt
Social Security
Levela
Poverty
Odds Ratio Coef. S.E. Odds Ratio
Marital biography
Partnered
(1) Continuously married (reference group)
(2) Remarried after early divorce 0.91 -1,761 ** 592 1.08
(3) Remarried after gray divorce 0.37 *** 2 -906
941 1.14
(4) Remarried after early widowhood 1.29 -441 1,145 0.40
(5) Remarried after late widowhood 1.10 -379 968 0.28
*
(6) Cohabiting 1.73 3 -917 1,094 0.70
Unpartnered
(7) Early divorce 0.36 *** -9,662
*** 543 4.20 ***
(8) Gray divorce 0.28 *** -9,576
*** 436 5.56 ***
(9) Early widowhood 0.45 * -8,899
*** 984 3.31 ***
(10) Late widowhood 0.30 *** -8,872
*** 271 3.16
*** 8
(11) Never married 0.34 ** -9,246
*** 618 5.23 *** 10
Age 1.37 *** 94
** 26 0.99
Women 2.01 *** 1,006
*** 141 1.10
Race and ethnicity
White (reference group)
Black 0.84 -2,065 *** 386 3.12
***
Hispanic 0.88 -2,965 *** 530 4.08
***
Others 1.00 -986 1,508 1.20
Some college or higher 0.70 ** 1,186
*** 287 0.49 ***
Years worked 1.02 *** 50
*** 7 0.99 ***
Currently working 0.35 *** -872
* 353 0.30 ***
Poor health 0.72 * -850
** 285 1.53 **
Length of the longest marriage ≥ 10 years 1.20 1,195 ** 437 0.88
Owns home 0.98 1,449
*** 354 0.66 **
Any dependent 0.76 -1,310
686 1.02
Receives Social Security before FRAb - -84
416 0.60 **
Constant 0.00 ** 11,433
*** 2,214 0.21 *
F statistics 31.00 118.88 27.25
* p < .05, ** p < .01, *** p < .001
Note. Number superscripts indicate that the group significantly differs from the numbered group at p < .05 level. aOLS regression includes only respondents who received Social Security (unweighted n = 8,965). bFRA = full
retirement age.

Table 4. Weighted Regressions of Social Security Receipt (Logistic), Social Security Level (OLS), and Poverty
(Logistic) on HRS Respondents’ Sociodemographic Characteristics with Gender-Marital Biography Variation
(Unweighted N = 9,649)a
Social
Security
Receipt
Social Security
Levelb
Poverty
Odds Ratio Coef. S.E. Odds Ratio
Unpartnered x Gender
(7) Early divorce, Women 1.21 687 c
592 0.57 *
Early divorce, Men 1.47 3,072 ** c
1,048 0.26 **
(8) Gray divorce, Women (reference group)
Gray divorce, Men 0.73 2,425 *** 638 0.33
**
(9) Early widowhood, Women 1.87 2,336 * 1,099 0.38
**
Early widowhood, Men 4.80 3,002 * 1,223 0.23
*
(10) Late widowhood, Women 1.41 c 2,085 *** 408 0.34
***
Late widowhood, Men 0.59 c 2,690 *** 496 0.41
**
(11) Never married, Women 1.09 1,785 * 839 0.66
Never married, Men 1.11 1,853 * 761 0.40
F statistics 24.60 85.11 23.32
* p < .05, ** p < .01, *** p < .001 aRespondents’ age, gender, race and ethnicity, education, number of years working, current work status, health,
marriage duration, home ownership, any dependent, whether receiving Social Security before the full retirement
age, and the interaction terms between gender and partnered groups are included in the model but are not shown. bOLS regression includes only respondents who received Social Security (unweighted n = 8,965). cWomen and men in the same marital groups are significantly different at p < .05 level.
Partnered
(64.4%)
Unpartnered
(35.6%)
Married
(96.6%)
Cohabiting
(3.4%)
Widowed
(53.3%)
Never
Married
(13.8%)
Divorced
(32.9%)
Remarried
(29.9%)
Continuously
Married (70.1%)
After Divorce
(56.9%)
Never Married
(12.1%)
After Widowhood
(31.1%)
After Divorce
(85.3%)
After
Widowhood
(14.7%)
Before age
50 (86.1%)
After age 50
(13.9%)
Before age
50 (44.9%)
After age 50
(55.1%)
Before age
50 (22.7%)
After age 50
(77.3%)
Before age
50 (41.6%)
After age 50
(58.4%)
Before age
50 (61.5%)
After age 50
(38.6%)
Before age
50 (10.8%)
After age 50
(89.2%)
Figure 1. Partnership Pathways among People Aged 63 and Older in 2010 (Unweighted N = 9,649)