maritime skills availability study
TRANSCRIPT

Thompson Clarke Suite 8 11 Beach St, PO Box 419
Shipping Pty Ltd Port Melbourne Vic 3207 ACN 078 004 798 Australia November, 2002 Telephone + 61 3 9646 3155 Facsimile: + 61 3 9646 3437
Email [email protected]
MARITIME SKILLS AVAILABILITY STUDY
Client: Australian Maritime Safety Authority

Australian Maritime Safety Authority Maritime Skills Availability Study
Thompson Clarke Shipping Pty Ltd Page i
TABLE OF CONTENTS
1. Introduction.......................................................................................................................... 1 1.1 Background .................................................................................................................. 1 1.2 Study Objective ............................................................................................................ 1 1.3 Study Terms of Reference............................................................................................ 2 1.4 Methodology................................................................................................................. 2
2. Executive Summary............................................................................................................. 3 2.1 Aims ............................................................................................................................. 3 2.2 Study Structure............................................................................................................. 3 2.3 Overseas Sea-Going Manpower Studies for Australia ................................................. 3
2.3.1 BIMCO/ISF Manpower Update 1995 ............................................................. 3 2.3.2 BIMCO/ISF Manpower Update 2000 ............................................................. 4 2.3.3 United Kingdom Seafarers Analysis 1997 ...................................................... 5 2.3.4 Implications of Sea-Going Manpower Studies for Australia.............................. 6
2.4 Overseas Shore-Based Manpower Studies ................................................................. 7 2.4.1 A study of the UK economy’s requirements for people with
experience of working at sea 1996 ............................................................... 7 2.4.2 British Shipping: Charting a New Course 1998............................................... 8 2.4.3 UK Independent Enquiry into a Tonnage Tax 1999......................................... 8 2.4.4 Seafarers and the Land Based Jobs Market 1999 ......................................... 8 2.4.5 Communication from the EU Commission ........................................................ 8
2.5 Australian Shipping Industry Manpower Supply Situation ............................................ 9 2.5.1 Shipping Industry Employment 1998 (Australian Bureau of
Statistics) .......................................................................................................... 9 2.5.2 Shipping Industry Employment 1999 (Australian Shipowners
Association) ...................................................................................................... 9 2.5.3 Summary of the Numbers of Superior Certificates by Maritime
Industry Sector................................................................................................ 10 2.5.4 AMOU Membership ........................................................................................ 11 2.5.5 AIMPE Membership ........................................................................................ 12 2.5.6 Certificates of Competency............................................................................. 12 2.5.7 AMC Maritime Related Qualifications ............................................................. 14 2.5.8 Naval Architects.............................................................................................. 14 2.5.9 Trainee Intake................................................................................................. 15 2.5.10 Age Profile ...................................................................................................... 15 2.5.11 Wastage.......................................................................................................... 15 2.5.12 Future Australian Officer Supply..................................................................... 16 2.5.13 Future Demand for Maritime Skills in Shore-Based Positions in
Australia.......................................................................................................... 16
Australian Maritime Safety Authority Maritime Skills Availability Study
Thompson Clarke Shipping Pty Ltd Page ii
2.5.14 Distribution...................................................................................................... 16 2.6 Recruitment ................................................................................................................ 17
2.6.1 AMSA.............................................................................................................. 17 2.6.2 Coastal Pilots.................................................................................................. 18
3. Overseas Sea-Going Manpower Studies......................................................................... 20 3.1 BIMCO/ISF Manpower Update 1995.......................................................................... 20 3.2 BIMCO/ISF Manpower Update 2000.......................................................................... 23
3.2.1 Regional Distribution....................................................................................... 24 3.2.2 Age Profile ...................................................................................................... 26 3.2.3 Wastage.......................................................................................................... 27 3.2.4 Inflows............................................................................................................. 28 3.2.5 Future Supply ................................................................................................. 28 3.2.6 Future Balance ............................................................................................... 29 3.2.7 Training........................................................................................................... 29 3.2.8 Australia’s 2000 Manpower Update Return .................................................... 30 3.2.9 Key Issues ...................................................................................................... 31
3.3 United Kingdom Seafarers Analysis 1997................................................................. 33 3.4 Implications of Sea-Going Manpower Studies for Australia ....................................... 35
4. Overseas Shore-Based Manpower Studies..................................................................... 37 4.1 A study of the UK economy’s requirements for people with experience of
working at sea 1996 ................................................................................................... 37 4.2 British Shipping: Charting a New Course 1998 ......................................................... 38 4.3 UK Independent Enquiry into a Tonnage Tax 1999 .................................................. 39 4.4 Seafarers and the Land-based Jobs Market 1999 .................................................... 40
4.4.1 Demand .......................................................................................................... 40 4.4.2 Supply............................................................................................................. 41 4.4.3 Communication from the Commission of European Communities
on the Training and Recruitment of Seafarers 2001...................................... 42
5. Australian Shipping Industry Manpower Position.......................................................... 46 5.1 Report on the Maritime Skills Base in Australia 1999 ................................................ 46
5.1.1 Personnel Numbers Employed in the Shipping Industry in Australia (ABS) 1999 ............................................................................................... 47
5.1.2 Personnel Numbers Employed in the Shipping Industry in Australia (TCS) 1999 ............................................................................................... 48
5.2 Principal Sources of Recruitment by Maritime Industry Sector .................................. 50 5.2.1 Ship Crews ..................................................................................................... 51 5.2.2 Port Authorities ............................................................................................... 54 5.2.3 Maritime Safety ............................................................................................... 55 5.2.4 Ship Repairers ................................................................................................ 56
Australian Maritime Safety Authority Maritime Skills Availability Study
Thompson Clarke Shipping Pty Ltd Page iii
5.2.5 Ship Managers................................................................................................ 57 5.2.6 Classification Societies ................................................................................... 58 5.2.7 Marine Surveyors............................................................................................ 59 5.2.8 Maritime Education ......................................................................................... 61 5.2.9 Harbour Towage ............................................................................................. 63 5.2.10 Pilotage Services ............................................................................................ 64 5.2.11 Summary of Numbers of Superior Certificates by Maritime Industry
Sector ............................................................................................................. 66 5.3 Maritime Officer Union Membership ........................................................................... 67
5.3.1 Australian Maritime Officers Union ................................................................. 67 5.3.2 Australian Institute of Marine and Power Engineers ....................................... 70
5.4 Australian Maritime Related Qualifications................................................................. 71 5.4.1 Certificates of Competency............................................................................. 71 5.4.2 AMC Maritime Related Qualifications ............................................................. 76 5.4.3 Naval Architects.............................................................................................. 78
5.5 Manpower Supply Issues ........................................................................................... 80 5.5.1 Training........................................................................................................... 80 5.5.2 Age Profile ...................................................................................................... 81 5.5.3 Wastage.......................................................................................................... 82 5.5.4 Future Australian Officer Supply..................................................................... 83 5.5.5 Future Demand for Maritime Skills in Shore-Based Positions in
Australia.......................................................................................................... 84 5.5.6 Distribution...................................................................................................... 84 5.5.7 Implications of Australian Shipping Industry Manpower Position.................... 85
6. Recruitment........................................................................................................................ 89 6.1 AMSA Employment .................................................................................................... 89 6.2 Coastal Pilots Employment......................................................................................... 94

Australian Maritime Safety Authority Maritime Skills Availability Study
Thompson Clarke Shipping Pty Ltd Page iv
TABLES
Table 1: Examples of Major Suppliers of Officers to Foreign Ships (1995) ................................ 22 Table 2: Recent Trends in the Supply of Officers by Region...................................................... 24 Table 3:Structure of Officer Supply by Region ........................................................................... 25 Table 4: Officer Age Profile 2000 ............................................................................................... 26 Table 5: Officer Annual Wastage Rates ..................................................................................... 27 Table 6: Net Annual Inflow Rates into the Supply of Officers 1995 - 2000................................. 28 Table 7: Projected Officer Supply............................................................................................... 28 Table 8: Officer Supply/Demand Balance for 2010 .................................................................... 29 Table 9: Australian Officers ........................................................................................................ 30 Table 10: Estimated UK and Irish Seafarer Numbers (as at 30 June 1997)............................... 34 Table 11: Projected annual supply of ship’s officers to fill shore based job vacancies in the
essential category .................................................................................................... 41 Table 12: Balance of supply and demand for ship’s officers to fill shore based job vacancies
in the essential category .......................................................................................... 42 Table 13: Number of EU and non-EU seafarers employed on board EU registered ships......... 43 Table 14: Shipping and Related Industries Wage and Salary Earners, Australia
(ABS Catalogue 6248.0) Indicative Estimates as at June 1998 and June 1998...... 47 Table 15: Employment numbers & maritime related qualifications in the shipping
industry in Australia 1999......................................................................................... 48 Table 16: Comparison of ABS and TCS Estimates of persons employed in the shipping
industry in Australia.................................................................................................. 49 Table 17: Sectors from which AMSA and Coastal Pilots might recruit ....................................... 51 Table 18: Typical ship’s complement ......................................................................................... 52 Table 19: Officers employed in the Australian trading fleet 2001 ............................................... 52 Table 20: Officers employed in the Australian offshore industry 2002 ....................................... 52 Table 21: Employment of surveyors by classification societies in Australia ............................... 59 Table 22: Marine Pilotage in Australia ........................................................................................ 65 Table 23: Summary of number of superior certificates by maritime industry sector 2002 .......... 66 Table 24: AMOU membership profile ......................................................................................... 67 Table 25: Location of AMOU membership.................................................................................. 68 Table 26: Employment of AMOU membership ........................................................................... 69 Table 27: Age Profile of AMOU membership.............................................................................. 69 Table 28: Summary of active certificates of competency as at 27 March 2002.......................... 71 Table 29: Age profile and residency of selected active certificates of competency as at
27 March 2002 ......................................................................................................... 72 Table 30: No. of Seafarers with valid STCW78 certificates who did not upgrade to STCW95... 73 Table 31: No. of certificates issued between 1982 - 2002.......................................................... 75 Table 32: Increase in average number of certificates issued ..................................................... 76 Table 33: AMC maritime related qualifications 1994 - 2001....................................................... 77 Table 34: Location of RINA membership.................................................................................... 78 Table 35: Age profile of RINA membership ................................................................................ 79 Table 36: Employment of RINA membership ............................................................................. 79 Table 37: Officer recruitment & training in Australia ................................................................... 80 Table 38: Age Profile of Australian seagoing officers................................................................. 81 Table 39: Age profile comparison............................................................................................... 82 Table 40: Future officer supply variables.................................................................................... 83 Table 41: Forecast size of seagoing Australian resident officer pool ......................................... 83 Table 42: AMSA employment by position classification ............................................................. 89
Australian Maritime Safety Authority Maritime Skills Availability Study
Thompson Clarke Shipping Pty Ltd Page v
Table 43: Location of AMSA employees with marine qualifications around Australia ................ 90 Table 44: Type of marine qualification of AMSA employees ...................................................... 90 Table 45: Background of AMSA employees with marine related qualifications.......................... 91 Table 46: Age profile of AMSA employees with marine related qualifications............................ 91 Table 47: Length of service of AMSA employees with marine relate qualifications.................... 91 Table 48: Age of AMSA employees with marine relate qualifications at recruitment.................. 92 Table 49: Year of recruitment of AMSA employees with marine related qualifications .............. 92 Table 50: Forecast retirement date of AMSA employees with marine qualifications.................. 92 Table 51: Location of AMSA employees with marine qualifications before being employed...... 93 Table 52: Recent applications for Marine Surveyor positions..................................................... 93 Table 53: Numbers and age profile of coastal pilots .................................................................. 94 Table 54: Forecast retirement date of AMSA employees with marine qualifications.................. 94 Table 55: Recruitment age for coastal pilots .............................................................................. 95
Australian Maritime Safety Authority Maritime Skills Availability Study
Thompson Clarke Shipping Pty Ltd Page 1
1. Introduction
1.1 Background
The Australian Maritime Safety Authority (“AMSA”) is the national safety agency with responsibility for maritime safety, protection of the marine environment and aviation and maritime search and rescue.
There is anecdotal evidence that there is likely to be a downturn in the future availability within the Australian maritime industry of qualified and experienced seagoing personnel for positions requiring maritime skills. This deteriorating trend in maritime skills availability causes AMSA concern on a number of fronts:
AMSA’s ability to be able to recruit suitable personnel with seagoing qualifications and experience at a senior level in the future into operational and policy positions at both senior management and surveyor levels within the organisation;
availability of suitably qualified and experienced seagoing personnel in relation to its responsibility for the regulation of coastal pilotage services under the Navigation Act 1912;
ensuring the safety training and maritime qualifications of crew operating ships under the Navigation Act 1912 meet international convention standards.
Accordingly, Thompson Clarke Shipping Pty Ltd (“TCS”) has been engaged by AMSA to undertake a Maritime Skills Availability Study (“the Study”).
1.2 Study Objective
This Study is being undertaken to gain a clearer understanding of the characteristics of human resources and maritime skills in the shipping and related industries in Australia with particular reference to trends that may impact on its sources of personnel with maritime skills in the future. The objectives of the Study are to:
provide a more informed basis for AMSA’s internal manpower planning policies, including necessary modification to recruitment, development and succession policies;
exercise of AMSA’s regulatory responsibilities for coastal pilots; and,
administration of the marine qualification system.
Australian Maritime Safety Authority Maritime Skills Availability Study
Thompson Clarke Shipping Pty Ltd Page 2
1.3 Study Terms of Reference
The Terms of Reference for the Study are to:
Collate and analyse information on the current characteristics of the workforce in the Australian shipping and related industries utilising personnel with maritime skills.
Identify and examine existing and emerging trends in the supply and demand of personnel with maritime skills within the Australian shipping industry and related industries.
The Study is a “stocktake” of current maritime skills availability in Australia as it impacts upon employment with AMSA and regulation of coastal pilots.
1.4 Methodology
TCS approach to this consultancy has been to:
comprehensively canvass businesses and organisations operating in the shipping industry in Australia, including AMSA, in order to determine their employment numbers and skills base;
conduct desktop correspondence with overseas marine safety administrations comparable to AMSA to determine the human resource issues that they are confronting in maintaining a maritime skills base;
conduct desktop research and analysis of relevant maritime manpower studies;
analyse the quantitative and qualitative data gathered;
prepare a comprehensive report on the maritime skills availability position in Australia.
Where information was unavailable directly from industry sources TCS has made informed estimates derived from its knowledge of the industry. Where a third party has provided information, TCS gives no warranty as to the accuracy or reliability of this information. TCS wishes to acknowledge the cooperation that it has received from all sectors of the shipping industry in Australia in undertaking this Study.
Australian Maritime Safety Authority Maritime Skills Availability Study
Thompson Clarke Shipping Pty Ltd Page 3
2. Executive Summary
2.1 Aims
The aims of this Study are to:
Collate and analyse information on the current characteristics of the workforce in the Australian shipping and related industries utilising personnel with maritime skills.
Identify and examine existing and emerging trends in the supply and demand of personnel with maritime skills within the Australian shipping industry and related industries.
Essentially, the Study is a “stocktake” of current maritime skills availability in Australia as it impacts upon employment with AMSA and regulation of coastal pilots.
2.2 Study Structure
This Study addresses the following key issues in assessing the availability of maritime skills in Australia:
recent overseas sea-going manpower studies Section 3
recent overseas shore-based manpower studies Section 4
an assessment of Australia’s shipping industry manpower position Section 5
the future recruitment requirements of AMSA and coastal pilots Section 6
The results of a survey of overseas maritime safety administrations (Canada, New Zealand, United Kingdom, USA) into the maritime skills availability in these jurisdictions will comprise a supplementary report to this Study once the completed surveys have all been returned.
2.3 Overseas Sea-Going Manpower Studies for Australia
2.3.1 BIMCO/ISF Manpower Update 1995
The gap between supply and demand for officers appears to be continuing to deteriorate, with shortages reported by most national associations with a global shortage of 30,000 officers forecast by 2000 rising to 45,000 by 2005.
The average age of senior officers appears to have continued to increase, re-emphasising the question concerning where the next generation of senior officers is going to come from.
Australian Maritime Safety Authority Maritime Skills Availability Study
Thompson Clarke Shipping Pty Ltd Page 4
Recruitment of new trainees does not appear to have increased significantly, and in many countries the number of recruits appears to have declined, suggesting that if the size of the world trading fleet increases significantly during the next few years – at a time when large numbers of senior officers are due to retire – the industry could be confronted with an increasingly serious manpower problem.
The need to differentiate between “qualified” and “active” seafarers in quantifying the maritime skills base in Australia.
The quality implications arising out of issuing certificates of competency to non-residents serving on foreign flag vessels and how jurisdictions intend to manage the ongoing “quality” of these certificates and their holders.
In this regard, it is apparent that Australian issued certificates of competency and the maritime education system that underpins these qualifications are highly regarded overseas as “quality” documents.
2.3.2 BIMCO/ISF Manpower Update 2000
A similar situation applied in 2000 as for 1995 such that with a global supply of 404,000 (1995: 409,000) and demand of 420,000 (1995: 427,000) there was a global shortage of 16,000 (1995: 18,000) officers representing 4% of the total officer pool.
This global shortage was forecast to increase to 46,000 by 2010.
The changing nationality of seafarers away from most of the traditional maritime countries in Europe, Japan and North America towards countries in the Far East, the Indian sub-continent and Eastern Europe. However, from a global perspective the overall decline of only 4% in the proportion of OECD seafarers over a five year period suggests that the changes are evolutionary rather than revolutionary.
Recruitment has increased but still needs to improve. Specifically, it is recommended that officer recruitment and training levels need to increase from 1 in 10 to 1 in 7, which equates to approximately 1.5 trainees per ship.
An increased future demand for seafarers can only be accommodated if recruitment and training are increased (unless wastage is reduced).
There is an urgent need to reduce the number of seafarers who leave the industry each year to pursue careers in other industries. This is particularly relevant in the case of officer trainees where around 30% fail to complete their training.
The world fleet continues to rely upon large numbers of ageing officers from OECD countries. However, over 40% of these officers are over 50 years old, and 18% are aged over 55. Most of these officers are in senior positions as Masters or Chief Engineers. The impact on the industry of their retirement, without adequate numbers of well-trained and experienced replacements, could be severe.
Australian Maritime Safety Authority Maritime Skills Availability Study
Thompson Clarke Shipping Pty Ltd Page 5
Unlike seafarers from OECD countries, relatively few officers from the Far East or the Indian sub-continent choose to remain at sea after the age of 50. If substantial numbers of these officers continue to retire at or around the age of 50, this may challenge the assumption that officers from these nations will automatically replace retiring senior officers from OECD countries.
The measures in STCW95 which might have the effect of reducing the number of qualified seafarers, such as the “white list”, additional flag state requirements and stricter certificate revalidation procedures, have not yet taken full effect.
2.3.3 United Kingdom Seafarers Analysis 1997
Whilst an ageing workforce brings stability to the industry in the immediate term, if current trends are allowed to persist, the long-term cost will be a dwindling resource of highly skilled seafarers.
Not all certificated officers are necessarily actively employed at sea. It has been estimated that 9% of the active officer stock is shore-based, revalidating their certificates for other reasons (such as working in shipping and kindred industries ashore). TCS are of the view that this estimate of shore based officer stock is to significantly understate the true case.
71% of UK officers were aged between 40 and 65. This compares with an estimate of 43% for the total UK male workforce. To highlight the potential problems for the industry of an ageing workforce, consider that in 1971 59% of all seafarers were less than 35 years old, but by 1997 83% of officers were over 35 years of age.
66% of deck officers and 44% of engineer officers hold Class 1 certificates.
It is estimated that 55% of UK officers are employed by UK companies with the balance employed by foreign owned companies.
It is estimated that the number of officers will only recover if the cadet intake averages 1,000 per year. The intake for 1997/98 seems likely to be 450, but the average intake in the past five years is only 211, well short of the target required for stabilisation.
On the basis of the most likely set of assumptions for cadet (8% pa) and officer (6% pa between 20 and 50 years of age and 1% thereafter) wastage rates, the number of UK officers is projected to decline further by 19% over the next 5 years on the basis of a retirement age of 65. If a more realistic officer retirement age of 57 is assumed, then the decline is almost 30%.
The key issue that arises from this analysis is that if the industry is to remain at its present operational size, whether it wishes to continue to employ indigenous personnel, which has major policy ramifications for both government and the shipping industry.
Australian Maritime Safety Authority Maritime Skills Availability Study
Thompson Clarke Shipping Pty Ltd Page 6
2.3.4 Implications of Sea-Going Manpower Studies for Australia
It would be drawing a long bow to infer that the employment and recruitment situation of seafarers that applies overseas, even in OECD countries, has a direct relationship to the situation that pertains in Australia. Nevertheless, there are distinct parallels between the two countries from which useful inferences can be drawn.
The manpower implications for Australia if the overall OECD trends were replicated in this country should be readily apparent, particularly in regard to officer shortages, an ageing officer population and insufficient training. As will be demonstrated elsewhere in this Study these trends are already manifesting themselves in Australia.
The flow-on recruitment implications of a diminishing pool of “quality” officers in Australia for organisations like AMSA and coastal pilots.
Surprisingly, Australia is considered a major supplier of officers (ie > 1,000) to foreign flag vessels may serve to diminish the pool of available indigenous maritime skills in Australia.
Australian certificates of competency issued to non-residents comprise an important potential secondary source of maritime skills that Australia might usefully tap in the event that difficulties are experienced at home in sourcing suitable or sufficient recruits for either seagoing or shore-based positions.
The significant suppliers of officers to the world fleet in the Far East and the Indian sub-continent could provide Australia with an abundant source of marine skills for the future provided that language, cultural, management style and immigration issues can be resolved. However, if substantial numbers of officers from these regions continue to retire at or around the age of 50, this may challenge the assumption that officers from these areas could replace ageing/retiring personnel in an OECD country such as Australia.
The significant surplus of officers in countries such as the UK and Canada that share the same language and similar educational and cultural norms to Australians might also be attracted to relocating to Australia. However, this is likely to represent only a short-term solution given that 40% of OECD officers are due for retirement within 10 years.
Australia is unable to quarantine itself from the implications of a worldwide shortage of “quality” officers as identified in these sea-going manpower studies. As a major trading nation Australia must be able to access a pool of appropriate maritime skills in order to be able to properly service its substantial shipping task on which its economy is founded. However, Australia will not necessarily be able to rely in future on the importation of overseas sea-going officers to augment its domestically trained personnel if it is to maintain an appropriate pool of skilled and experienced officers to service its shipping task. Australia is no longer as attractive or welcoming to qualified and experienced officers as a place to migrate to as it was once; migration qualifications are higher and the financial rewards to be gained from working in Australia are comparatively lower than in many other OECD countries with which Australia is competing. Accordingly, the world will not necessarily be making a beaten path to our door to meet the shortfall resulting from a possible decline in Australia's maritime skills availability.

Australian Maritime Safety Authority Maritime Skills Availability Study
Thompson Clarke Shipping Pty Ltd Page 7
2.4 Overseas Shore-Based Manpower Studies
2.4.1 A study of the UK economy’s requirements for people with experience of working at sea 1996
Approximately 17,000 jobs were identified in the UK that employers would prefer to fill with ex-seafarers. For 70% of these, seafaring experience was considered ‘essential’; most such jobs (87.5%) were filled by former officers with Class 1 certificates. ie 10,400 jobs.
Demand for ex-seafarers ashore is estimated at between 640 and 740 per annum over the next nine years. Demand for those filling posts where seafaring experience was considered 'essential' is estimated at between 450 and 580 a year.
Supply projections range from about 450 at present, falling to about 175 in 2004/5. Supply is strongly driven by industry intake and projections are relatively insensitive to wastage rates.
While demand and supply are roughly in balance at present, the forecast reduction in supply will result in an increasing shortfall, reaching approximately 275 by 2004/5.
Recruitment by shipping companies of approximately 1,200 cadets a year is required to maintain the present status quo at sea and ashore, once the effects of under recruitment since 1981/82 have worked themselves out. Current intake is about 400 a year.
The market response to the shortfall is expected to be an increase in salaries in relevant shore based jobs. This is likely to increase seafarer wastage rates, causing shipping companies to reduce training of UK cadets, thus further reducing the future pool of UK officers.
Merchant navy service still appears to provide the most cost effective training for these shore-based jobs. Neither third party training nor the employment of foreign ex-seafarers is likely to provide a ready remedy to offset this shortage of UK officers. Reliance on non-seafarers would lead to quality loss.
Those shore-based businesses that are sufficiently flexible may relocate relevant activities abroad to obtain the required ex-seafaring staff. The long-term effect of this may be a considerable erosion of London's maritime related sector.
The required expansion in merchant navy training and sea-based employment opportunities to meet the demand of the shore based marine related sector for ex-seafarers – as well as the demand of the shipping industry itself at sea and ashore – would require intervention in the form of external financing by the 'end user' and/or the taxpayer.

Australian Maritime Safety Authority Maritime Skills Availability Study
Thompson Clarke Shipping Pty Ltd Page 8
2.4.2 British Shipping: Charting a New Course 1998
This enquiry essentially endorses the conclusions reached in the Study of the UK economy’s requirements for people with experience of working at sea referred to in Section 2.4.1 above.
Most importantly, the paper acknowledges the need to share the training cost amongst all beneficiaries, particularly where the ultimate end-user of seafaring skills is the shore-based maritime-related sector.
2.4.3 UK Independent Enquiry into a Tonnage Tax 1999
Whilst this enquiry is concerned mainly with fiscal measures, it makes a number of observations that relate to training and employment particularly in shore-based positions.
Whilst still significant, the UK industry has been in steady decline for the past 20 years yet growth in world trade offers significant prospects for expansion. The stock of skilled seafarers is dwindling and their average age is increasing. Without a revival, especially of the number of trained officers, there will soon be a shortfall well below the needs of the shipping and shore-based related maritime industries.
The UK shipping industry is currently in danger of dying a gradual death such that now is “make or break” time that has brought the Government, the industry and the trades unions together in a partnership to secure its future and which has led to the industry’s willingness to accept a formal commitment to training.
2.4.4 Seafarers and the Land Based Jobs Market 1999
These papers examine the supply/demand equation for seafarers in shore-based jobs in the UK in some considerable detail.
The study concluded that the required expansion in Merchant Navy training and sea-based employment opportunities to meet the demand of the shore based maritime sector for ex-seafarers – as well as the demand of the shipping industry itself at sea and ashore – would require intervention in the form of external financing by the ‘end user’ and/or taxpayer.
2.4.5 Communication from the EU Commission
It can be expected that senior OECD officers will, on retirement over the next few years, be replaced by nationals of less developed nations. The clear message is that the current shortage of officers will worsen unless remedial action is taken immediately.
Australian Maritime Safety Authority Maritime Skills Availability Study
Thompson Clarke Shipping Pty Ltd Page 9
EU shipowners have already taken the opportunity to replace seafarers from the EU with non-EU labour and consequently to lower, inter alia, their wage costs.
Despite the wage difference, shipowners appear more inclined to hire EU officers for a number of reasons ranging from safety considerations, type of ship and technical standards on board (the more expensive officers tend to be better educated and trained) to cultural links.
Despite there being a shortage of qualified seafarers, fewer and fewer European youngsters are choosing maritime careers, considering them socially and financially unattractive compared with positions on shore. An important indicator of the fact that young people do not regard seafaring jobs as an interesting occupation is the high dropout rate from maritime education and training.
The EU cannot afford to lose this basic pool of experience if it wants to avoid endangering safety and the environment and jeopardising the competitiveness of its shipping and related maritime industry.
The shortfall of EU seafarers may also impact negatively on a whole range of related industries. A wide range of land-based employers looks upon seafaring experience as an advantage or a pre-requisite when recruiting personnel. For a number of reasons ranging from cultural similarities and language to knowledge of local/national customs and regulations, positions within these companies are not easily filled by non-European former seafarers.
2.5 Australian Shipping Industry Manpower Supply Situation
2.5.1 Shipping Industry Employment 1998 (Australian Bureau of Statistics)
In 1998 the Australian Bureau of Statistics estimated the size of the shipping and related industries workforce at 22,600.
Over the 10-year period to 1998, the shipping industry workforce in Australia has declined by 66%; almost without exception, this decline has been across all sectors of the industry.
2.5.2 Shipping Industry Employment 1999 (Australian Shipowners Association)
In 1999 TCS conducted a similar study for ASA and estimated the size of the shipping industry workforce in Australia at 41,165, which was approximately double the number estimated by ABS, but was by and large based on real figures rather than statistical estimates from a representative sample from each sector with the attendant interpretive cautions.

Australian Maritime Safety Authority Maritime Skills Availability Study
Thompson Clarke Shipping Pty Ltd Page 10
Total number of employees with maritime related qualifications was of the order of 4,150.
Total number of employees with maritime related qualifications in shore-based employment was of the order of 2,460.
Total numbers of Master/Engineer 1 level qualifications in those sectors that AMSA was likely to recruit from was of the order of 1,045 Master 1 and 880 Engineer 1 providing a total of 1,925.
Total number of Master 1 level qualifications in those sectors that coastal pilots are likely to recruit from was of the order of 1,290.
Following on from overseas studies into shore base employment, it would seem reasonable to conclude that most of the 2,460 in shore based employment with maritime related qualifications in Australia are in those positions because the possession of these qualifications was either an essential or preferred requirement.
The more closely related the employment sector is to the actual operation and safety of the ship, the greater reliance there is on shore-based personnel with valid maritime related qualifications.
If the Australian trading and offshore fleets were to be disbanded, the shore based shipping industry in Australia would remain virtually intact apart from reductions in those sectors and organisations directly related to the operation of the Australian flag fleet such as Ship Managers and Maritime Education. However, it is considered that such reductions in the requirement for qualified personnel would only be at the margins.
Anecdotal evidence obtained during the collection of information for this Study suggests that many sectors of the shipping industry in Australia prefer to employ people in shore-based positions who have Australian maritime related qualifications and sea-going experience because of the breadth of their local knowledge. The importation of foreign nationals or the training of non-seafarers was felt to give rise to an unacceptable quality loss in the delivery of shipping services.
2.5.3 Summary of the Numbers of Superior Certificates by Maritime Industry Sector
Given that the focus of this Study is on determining the “pool” of personnel with maritime skills that AMSA and coastal pilots can recruit from, TCS has identified those specific sectors of the industry from where recruitment is likely and then recalculated the number of personnel in these sectors with Master 1/Engineer 1 certificates as follows:

Australian Maritime Safety Authority Maritime Skills Availability Study
Thompson Clarke Shipping Pty Ltd Page 11
AMSA Coastal
Pilots TCS Sector Description
Master 1 Engineer 1
Total Master 1 only
Ship Crews Trading Fleet
Offshore Fleet
215 195
215 145
430 340
215 195
Port Authorities 100 100 100 Maritime Safety 65 65 130 65 Ship Repair 50 50 Ship Managers 20 20 40 Classification Societies 40 40 Marine Surveyors 80 10 90 Maritime Education 50 50 100 Harbour Towage 100 Pilotage Services 250 TOTAL 725 595 1,320 925
Total numbers of Master/Engineer 1 level qualifications in those sectors that AMSA is likely to recruit from is of the order of 725 Master 1 and 595 Engineer 1 providing a total of 1,320.
Total number of Master 1 level qualifications in those sectors that coastal pilots are likely to recruit from is of the order of 925.
2.5.4 AMOU Membership
Australian Maritime Officer Union (“AMOU”) membership provides a good indication of employment of Masters and deck officers in the shipping industry given the high levels of union membership.
Total AMOU membership is of the order of 1,900.
Total number of AMOU members holding unlimited certificates of competency is 792 comprising Master 1: 580, Ch. Mate: 83, 2nd Mate: 129.
Of this number, 540 (68%) are employed in the Offshore Division on trading and offshore industry vessels, including 350 Master 1.
There is a serious shortfall in the numbers joining the AMOU with less than half the numbers of junior grade certificates available to eventually replace current holders of Master 1 certificates. This situation deteriorates further to less than 25% if it is assumed that any holder of a junior grade certificate aged over 40 is unlikely to progress to Master 1.
With 42% of the membership aged over 50, 30% aged between 40 & 50 and only 28% aged less than 40, the Australian shipping industry will be facing a serious shortage of personnel with seagoing experience and qualifications in less than 10 years.

Australian Maritime Safety Authority Maritime Skills Availability Study
Thompson Clarke Shipping Pty Ltd Page 12
With 51% of the membership that hold a Master 1 certificate aged over 50, the Australian shipping industry will be facing a serious shortage of Master 1 certificates in less than 10 years.
The distribution of AMOU members throughout Australia is largely as might be expected to reflect the overall population distribution, economic activity and maritime activity.
2.5.5 AIMPE Membership
Total AIMPE membership numbers around 2,200.
Membership of the “Seagoing” category numbers around 1,400, but this includes members employed tugs, ferries, dredgers, etc). However, not all members of the “Seagoing” category will possess unlimited certificates.
Engineer officers working on foreign flag vessels often retain their AIMPE membership by transferring to the “Ashore” category.
2.5.6 Certificates of Competency
The number of valid certificates of competency issued by AMSA to resident seafarer officers provides a good indication of the available pool of maritime skills in Australia.
Total number of valid AMSA issued certificates of competency as at March 2002 is 3,914 comprising:
Certificate Resident Non-Resident Total Deck 1,369 1,008 2,377Engine 1,366 171 1,537Total 2,735 1,179 3,914
Total number of valid AMSA issued superior certificates of competency as at March 2002 is 2,242 comprising:
Certificate Resident Non-Resident Total Master 1 922 470 1,392Engineer 1 785 65 850Total 1,707 535 2,242
The primary potential pool of recruitment for both AMSA and coastal pilots will be from Australian residents holding valid superior certificates comprising Master 1: 922 and Engineer 1: 785, providing a total potential pool of 1,707 for AMSA and 922 for coastal pilots.
A significant proportion (42%) of Australian issued deck certificates of competency are now held by non-residents:
Australian Maritime Safety Authority Maritime Skills Availability Study
Thompson Clarke Shipping Pty Ltd Page 13
• Master 1 34%
• Chief Mate 42%
• Second Mate 71%
It is apparent that this situation is amplified in the junior grades of certificates, given that the majority of these junior officers will eventually progress to Master 1 level, but will likely use this certificate overseas on foreign ships and in foreign shore-based positions unless they become Australian residents;
This situation is in marked contrast to the situation that applies to Australian issued engineer certificates of competency where only 11% are now held by non-residents:
• Engineer 1 8%
• Engineer 2 22%
There is expected to be a shortage of junior grades of certificates held by Australian residents that might at some future time be converted to either a Master 1 or Engineer 1 certificates to replace those Australian residents that are current holders of superior certificates who will progressively retire over time ie
• Master 1: 922 active, but only 447 active junior certificates (48%)
• Engineer 1: 785 active, but only 581 active junior certificates (74%)
The age profile of Australian resident holders of certificates:
• 41% of Australian residents that hold Master 1 certificates aged over 50, and a further 35% aged over 40, there may be a shortfall of these skilled Australian resident certificate holders in 10 years;
• 48% of Australian residents that hold Engineer 1 certificates aged over 50, and a further 33% aged over 40, there may be a shortfall of these skilled Australian resident certificate holders in 10 years;
• the shortfall in Engineer 1 qualifications is expected to be exacerbated when it is considered that 59% of Australian residents that hold Engineer 2 qualifications are aged over 50, and therefore unlikely to progress to an Engineer 1 level.
TCS estimate the number of additional expired superior certificates held by Australian residents available to AMSA of Master 1: 78 and Engineer 1: 50 providing a total of 128.
Employment as a coastal pilot requires a valid Master 1 so the pool of expired certificates is immaterial.
Paradoxically, it would appear that interest in obtaining marine qualifications, particularly superior certificates at Master 1/Engineer 1 level, has increased substantially between the 1980’s and the 1990’s from:
Australian Maritime Safety Authority Maritime Skills Availability Study
Thompson Clarke Shipping Pty Ltd Page 14
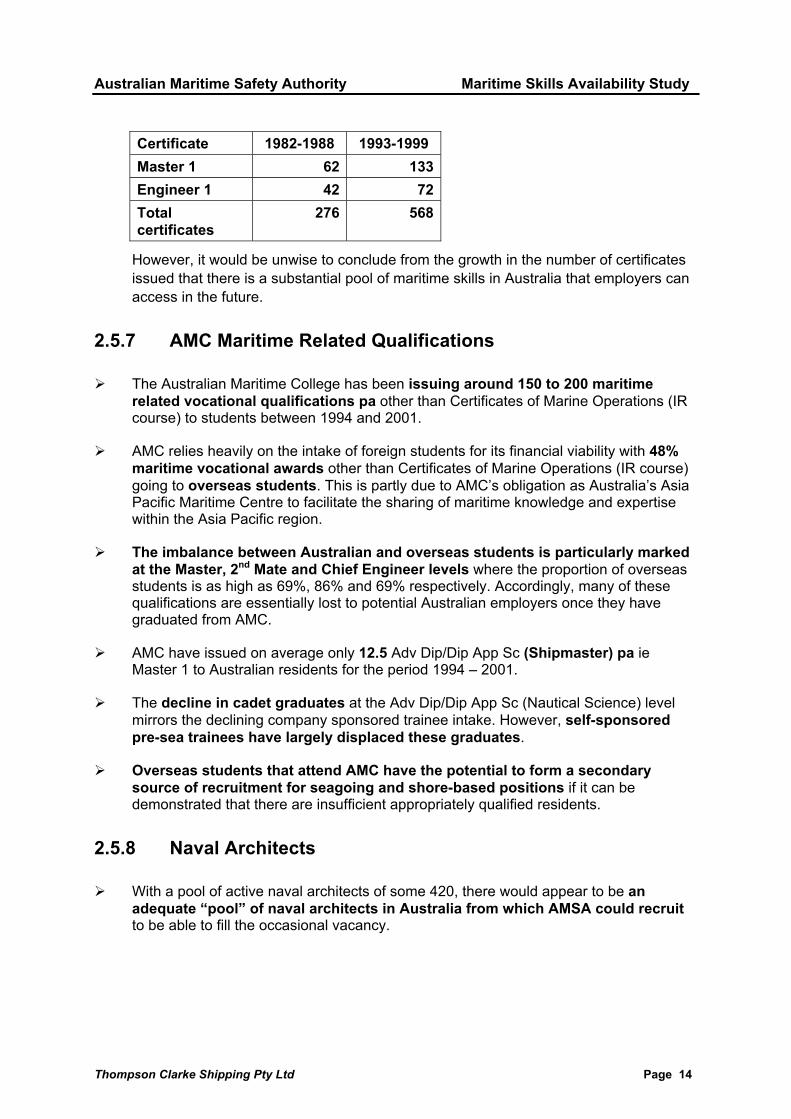
Certificate 1982-1988 1993-1999 Master 1 62 133 Engineer 1 42 72 Total certificates
276 568
However, it would be unwise to conclude from the growth in the number of certificates issued that there is a substantial pool of maritime skills in Australia that employers can access in the future.
2.5.7 AMC Maritime Related Qualifications
The Australian Maritime College has been issuing around 150 to 200 maritime related vocational qualifications pa other than Certificates of Marine Operations (IR course) to students between 1994 and 2001.
AMC relies heavily on the intake of foreign students for its financial viability with 48% maritime vocational awards other than Certificates of Marine Operations (IR course) going to overseas students. This is partly due to AMC’s obligation as Australia’s Asia Pacific Maritime Centre to facilitate the sharing of maritime knowledge and expertise within the Asia Pacific region.
The imbalance between Australian and overseas students is particularly marked at the Master, 2nd Mate and Chief Engineer levels where the proportion of overseas students is as high as 69%, 86% and 69% respectively. Accordingly, many of these qualifications are essentially lost to potential Australian employers once they have graduated from AMC.
AMC have issued on average only 12.5 Adv Dip/Dip App Sc (Shipmaster) pa ie Master 1 to Australian residents for the period 1994 – 2001.
The decline in cadet graduates at the Adv Dip/Dip App Sc (Nautical Science) level mirrors the declining company sponsored trainee intake. However, self-sponsored pre-sea trainees have largely displaced these graduates.
Overseas students that attend AMC have the potential to form a secondary source of recruitment for seagoing and shore-based positions if it can be demonstrated that there are insufficient appropriately qualified residents.
2.5.8 Naval Architects
With a pool of active naval architects of some 420, there would appear to be an adequate “pool” of naval architects in Australia from which AMSA could recruit to be able to fill the occasional vacancy.

Australian Maritime Safety Authority Maritime Skills Availability Study
Thompson Clarke Shipping Pty Ltd Page 15
2.5.9 Trainee Intake
A declining Australian merchant fleet has resulted in a corresponding decline in trainee numbers as employers display a certain caution in their recruitment policies in the face of uncertainty over the fleet's future. Numbers of trainees serving on Australian ships has progressively declined from an intake of 81 in 1993 to almost zero in 2000 & 2001.
TCS understands from industry sources that trainee recruitment has resumed in 2002 on a limited basis. As previously discussed, the AMC has been running a pre-sea training course since 1999 at an intake of around 40 pa with most entrants being self-sponsored although some Australian companies have taken up a number of these entrants.
Using a BIMCO/ISF 2000 Manpower Update rule of thumb ratio of 1.0 to 1.5 officer trainees per vessel, with 48 vessels in the Australian trading fleet there would require to be a trainee population in Australia of between 48 and 72 at any one time. This estimate ignores the recruitment requirements of the offshore industry and of shore-based sectors of the shipping industry that require superior certificates. If this requirement is factored in then this training requirement needs to be increased by a factor of 3 to provide a trainee population of between 144 and 216.
Alternatively, if the proportion of officer trainees as a percentage of OECD officer stock of between 5 and 12 % is used to approximate the number of officer trainees required in Australia then a trainee population of between 21 and 51 is required at any one time. Again, this number needs to be increased by a factor of 3 to provide a trainee population of between 63 and 153.
Assuming the UK Tonnage Tax training requirement of one newly recruited cadet for every 15 officers employed pa this will require an annual intake of 59 officer trainees in order to supply both the seagoing and shore-based sectors of the industry.
2.5.10 Age Profile
The age profile of this substantial sample of Australian officers employed in the Australian trading fleet appears reasonably balanced over a nominal working life of 45 years with 36% aged over 50 and 35% aged under 35 with 29% aged between 36 and 50 in the middle stage of their career, from which it would appear that Australia has a slightly better balanced age profile than that for OECD officers overall, and, as a consequence, may not experience the same shortfall in its officer supply position as other OECD countries;
2.5.11 Wastage
Based upon previous studies, TCS has employed annual natural wastage rates amongst officers of 6.5% and amongst trainees of 10%.
Australian Maritime Safety Authority Maritime Skills Availability Study
Thompson Clarke Shipping Pty Ltd Page 16
2.5.12 Future Australian Officer Supply
Based upon an officer wastage rate of 6.5%, a trainee wastage rate of 10% and an officer trainee intake of 40 pa, TCS has forecast the size of the Australian resident officer pool in the trading fleet declining from 859 in 2001 to 711 by 2011, a decline of 15%.
As officer supply is highly intake driven, if the officer trainee intake is halved to 20 pa then the decline doubles to 30% such that the pool shrinks from 859 to 571 by 2011. In order to maintain a constant pool size of the order of 860 seagoing Australian resident officers in the Australian trading fleet, then the required trainee intake is around 60 pa.
However, the pool of suitable Australian resident officers aged holding superior certificates and of an appropriate recruitment age of, say, 35-50 available to the shore based sector each year could be as low as 15 pa.
These forecasts take no account of either the officer trainees required to maintain the pool of seagoing Australian resident officers in the offshore industry that would require around double the intake of trainees, and makes no allowance for the importation of qualified officers from overseas into Australia to augment the pool of Australian resident officers in the Australian trading and offshore fleets;
2.5.13 Future Demand for Maritime Skills in Shore-Based Positions in Australia
From recent UK studies, annual demand for ex-seafarers ashore is estimated to be running at between 4% and 5%. If this rate of demand is applied to the ~1,500 positions in the Australian shipping industry requiring a Class 1 certificate, then annual demand for filling these positions is of the order of 60 to 75.
It will be evident that without either an increased trainee intake and/or the importation of maritime skills from overseas, Australia will be facing a serious skills shortage in the near future and increased competition amongst employers for such personnel;
2.5.14 Distribution
The distribution of maritime industry personnel around Australia would not appear to present any difficulties in that it is reasonably dispersed between the States.
Australian Maritime Safety Authority Maritime Skills Availability Study
Thompson Clarke Shipping Pty Ltd Page 17
2.6 Recruitment
2.6.1 AMSA
As at 30 June 2001 AMSA employed 238 permanent personnel of which some 68 (30%) of employees have obtained certificates of competency or degrees in naval architecture at some stage in their careers, and many have either obtained tertiary qualifications such as BSc (Nautical Studies), BEng (Marine) or hold Extra Class 1 certificates. Of this number Maritime Operations accounts for the bulk with 54 (80%), MSES with 13 (19%) and AusSAR with 1 (1%).
All Area Managers and Surveyors in the Maritime Operations division require a certificate of competency as Master Class 1 or Engineer Class 1 or equivalent qualifications and relevant industry experience.
There are 21 (30%) of the AMSA employees with marine qualifications located in Canberra.
There would appear to be a tendency for AMSA to recruit more from the engineering rather than the nautical side of the industry.
A primary recruitment source for AMSA is from the seagoing sector (40% of recruits).
With 36% of AMSA employees with marine qualifications aged over 55 and a further 22% aged over 50 AMSA needs to consider its recruitment strategy carefully if it is to avoid a shortage of personnel as current employees approach retirement. It is also apparent that there may well be insufficient surveyors aged under 50 of the appropriate calibre to succeed retiring senior surveyors and managers, such that external recruitment will be necessary in the future at these senior levels as well as at base grade surveyor level.
Despite the older age profile of AMSA employees with marine related qualifications, AMSA has a relatively new workforce with 34% employed for 5 years or less and a further 26% employed for 10 years or less. This is as a consequence of not recruiting these employees until relatively late in their careers.
It is apparent that the age of recruits with marine qualifications into AMSA is becoming older with at least 3 recruits in the last 5 years aged 55 and the youngest recruit aged 33 with most well in their 40s.
AMSA has been recruiting between 2 and 7 new employees with marine related qualifications pa assuming that there have been no resignations/redundancies/ dismissals of recruits once employed during this period.
Given the forecast retirement dates of AMSA employees with marine qualifications, AMSA will require to recruit ~3 surveyors pa over the next 15 years. However, TCS has no knowledge of the wastage rate from AMSA for reasons other than retirement; if this is running at around 3% then an additional 2 recruits will be required annually for a total of ~5 on average.

Australian Maritime Safety Authority Maritime Skills Availability Study
Thompson Clarke Shipping Pty Ltd Page 18
Given that the pool of suitable Australian resident officers holding superior certificates available to the shore based sector each year could be as low as 15, then an annual recruitment target of ~5 becomes significantly more difficult if AMSA is competing with other shore-based employers with similar recruitment targets.
75% of recruits were already resident in Australia before being employed. Of those resident overseas before employment, 57% were from the UK, but these employees were recruited during the 1970’s and 1980’s.
On the basis of 2 marine surveyor positions advertised in 2001, there was no shortage of interest for these positions, with 44 applications being received.
At face value it would seem that a recruitment target ~5 pa would not appear to be an insurmountable objective for AMSA to achieve. The issues for AMSA are:
• competing with other Australian shipping industry sectors for quality candidates with marine related qualifications and expertise from a shrinking Australian resident pool of seafarers; and,
• in considering alternative sources of recruitment and training for the next generation of AMSA surveyors and managers
2.6.2 Coastal Pilots
Three pilotage providers provide compulsory pilotage on vessels transiting the Great Barrier Reef: Torres Pilots, Australian Reef Pilots and Hydro Pilots, by contracting individual licensed pilots.
Coastal pilots must be entitled to permanent residency in Australia and hold a valid certificate as Master Class 1.
There are currently 58 licensed coastal pilots in Australia.
With 88% of coastal pilots aged over 50, pilotage providers are facing a major recruitment program over the next 15 years assuming a nominal retirement age of 65.
Given the forecast retirement dates, providers will require to recruit ~3 coastal pilots pa over the next 15 years. However, TCS has no knowledge of the wastage rate from the coastal pilot service for reasons other than retirement; if this is running at around 3% then an additional 2 recruits will be required annually for a total of ~5 on average.
Given that the pool of suitable Australian resident officers holding superior certificates available to the shore based sector each year could be as low as 15, then an annual recruitment target of ~5 becomes significantly more difficult if coastal pilots are competing with other shore-based employers.
Coastal pilots are recruited in a considerably older age range than is the case in other shore-based sectors of the industry. It is noted that both Torres and Australian Reef Pilots have recently recruited pilots of 55+.
Australian Maritime Safety Authority Maritime Skills Availability Study
Thompson Clarke Shipping Pty Ltd Page 19
It is noted that the background of the majority of coastal pilots has been as Masters and officers on either regular Queensland coastal trading vessels or on international carriers trading between East coat Australia and Asian ports.
Both major coastal pilot providers reported no difficulties in attracting unsolicited applications from Australia and from overseas.
It would seem that an aggregate recruitment target of ~5 pa would not appear to be an insurmountable objective for coastal pilot providers to achieve. The issues for coastal pilots are:
• competing with other Australian shipping industry sectors for quality candidates with Master 1 certificates and appropriate experience from a shrinking Australian resident pool of seafarers; and,
• in considering alternative sources of recruitment and training for the next generation of coastal pilots.
Australian Maritime Safety Authority Maritime Skills Availability Study
Thompson Clarke Shipping Pty Ltd Page 20
3. Overseas Sea-Going Manpower Studies
The Baltic and International Maritime Council (BIMCO) and the International Shipping Federation (ISF) have jointly sponsored three studies into the global supply and demand for merchant seafarers in 1990, 1995 and 2000. The 2000 update is by far the most comprehensive and relevant to this Maritime Skills Availability Study, and sought to:
describe the worldwide supply and demand situation for seafarers in 2000; and,
make predictions as to the likely situation in 5-10 years’ time
Additionally, the situation that applies to seafarers, particularly qualified officers, in the UK is set out in the United Kingdom Seafarers Analysis 1997, Centre for International Transport Management, London Guildhall University, 1998. The Department of the Environment, Transport and the Regions, the Royal Navy through the Ministry of Defence, the Chamber of Shipping and London Guildhall University sponsored this analysis. This study made as accurate an assessment as possible of the size and major characteristics of the active UK sea-going labour force.
These surveys deal solely with the supply and demand for seagoing labour and do not address the shore-based situation. For the purposes of this Study, TCS has therefore concentrated its attention on those aspects that deal with the supply of deck and engineer officers particularly from OECD countries (including Australia) that are most relevant to the future recruitment of seafarers into shore based positions such as marine surveyors and coastal pilots in Australia.
3.1 BIMCO/ISF Manpower Update 1995
The 1995 BIMCO/ISF Manpower Update1 indicated that with a global supply of 409,000 and demand of 427,000 there was a global shortage of 18,000 officers representing 4% of the total officer pool. This shortage in officer numbers was forecast to increase to 30,000 by 2000 and to 42,000 by 2005.
However, this assessment needs to be considered in the context of a continuing decline in the number of officers from OECD countries (by 9% since 1990), whereas the availability of officers from the Far East had increased substantially (up 22%). Nevertheless, the worldwide industry was still heavily dependent on senior officers from OECD countries in 1995 with more than 50% being OECD nationals. This situation was likely to be exacerbated post 1995 as the age profile of OECD officers was higher than that from other regions, and OECD recruitment levels were amongst the lowest.
1 Institute for Employment Research, University of Warwick, The Worldwide Demand for and Supply of Seafarers, 1995, BIMCO/ISF

Australian Maritime Safety Authority Maritime Skills Availability Study
Thompson Clarke Shipping Pty Ltd Page 21
The implications of the 1995 Manpower Update were summarised in the following editorial2:
“The latest report from the International Shipping Federation indicates that the officer shortage is continuing to deteriorate. This is mainly a result of large numbers of western European senior officers retiring and insufficient replacements having been recruited and trained over many years. There are now real questions being asked as to where new senior officers are to come from during the next few years as many more come up to retirement. This will have knock-on effects for the recruitment of pilots, surveyors and so on.
... The demand is there. The potential recruits are there. What is needed is the financial backing, the berths onboard ships and a career structure which takes in possible graduation to shore-based positions and not only a lifetime at sea. This is especially relevant in Europe where a large proportion of shore-based activities requiring maritime experience are based such as class, insurance and P&I “ [Emphasis added]
Such was the global maritime manpower situation that applied in 1995 as surveyed by BIMCO/ISF. Amongst the tentative conclusions reached from the 1995 Manpower Update were:
the gap between supply and demand for officers appears to be continuing to deteriorate, with shortages reported by most national associations with a global shortage of 30,000 officers forecast by 2000 rising to 45,000 by 2005;
the average age of senior officers appears to have continued to increase, re-emphasising the question concerning where the next generation of senior officers is going to come from;
recruitment of new trainees does not appear to have increased significantly, and in many countries the number of recruits appears to have declined, suggesting that if the size of the world trading fleet increases significantly during the next few years – at a time when large numbers of senior officers are due to retire – the industry could be confronted with an increasingly serious manpower problem.
The manpower implications for Australia if the overall OECD trends were replicated in this country should be readily apparent, particularly in regard to officer shortages, an ageing officer population and insufficient training. As will be demonstrated elsewhere in this Study these trends are already manifesting themselves in Australia.
However, it has been suggested by Li and Wonham3 that improvements could have been made to 1995 Manpower Update in terms of its data collection, methodology and conclusions. In the context of this Study, Li and Wonham suggested that:
2 Lloyd’s Ship Manager, January 1999 3 Li, KX, Wonham, J, 1999, Who mans the world fleet? A follow-up to the BIMCO/ISF manpower survey, Maritime Policy & Management, 26, 3, pp 295-303

Australian Maritime Safety Authority Maritime Skills Availability Study
Thompson Clarke Shipping Pty Ltd Page 22
Qualified v Active: a distinction needs to be made between “qualified” and “active” seafarers in estimating the actual number of seafarers eg a recent UK study showed that about 9% of all qualified officers had no desire to work at sea for whatever reason. As a consequence, “active” was considered a more accurate concept than “qualified” in studies of maritime labour supply/demand;
Quality: there is no lack of seafarers in number, but in quality where a ‘quality seafarer could be defined as one who has been certified for on-board service by his national administration’. Li and Wonham argue that ‘those who have been trained and certified for their national fleet may not be considered quality seafarers when they serve on foreign fleets with different language, cultural and management styles, which could ... affect safety at sea.’
Suppliers/Demanders of Maritime Labour: some developed maritime nations, due to their maritime traditions and decline in their own fleets have become maritime labour suppliers eg:
Table 1: Examples of Major Suppliers of Officers to Foreign Ships (1995)
Flag Supply Own Demand Surplus China 117,800 26,447 91,353
Philippines 49,430 7,251 42,179
India 12,000 3,748 8,252
Italy 14,500 8,507 5,993
Indonesia 14,510 8,743 5,767
UK 11,000 5,264 5,736
Poland 5,500 2,724 2,776
Canada 4,557 2,151 2,406
Pakistan 2,400 273 2,127
Bangladesh 2,554 1,102 1,452
Australia 1,400 397 1,003
The major demanders of seafarers are open registry flags, together with some developed countries eg Japan, Greece, Norway, USA, Denmark, Singapore, Hong Kong.
Li and Wonham conclude their critique of the 1995 Manpower Update in the following terms:
“It can be confidently concluded that the main problem the shipping industry is facing, or will face, is not the number but the quality of crew. Seafarers who can competently man different ships, whatever their type, size, ownership or management, with a good command of English and skill in communicating with colleagues and managers from different cultures and backgrounds, will continue to be in great demand. While some traditional maritime nations, eg Japan, USA, Germany, Norway and Greece, continue to face problems in recruitment of their national seamen to man their flags, some traditional maritime nations, eg UK, Italy, Canada, Poland, Spain, Australia and France, have become important suppliers of officers on ships flying foreign flags.” [Emphasis added]
Australian Maritime Safety Authority Maritime Skills Availability Study
Thompson Clarke Shipping Pty Ltd Page 23
The implications of Li and Wonham’s follow-up to the 1995 Manpower Update have important implications for this Study, most notably:
the need to differentiate between “qualified” and “active” seafarers in quantifying the maritime skills base in Australia;
the quality implications arising out of Australia issuing certificates of competency to non-residents serving on foreign flag vessels and how Australia intends to manage the ongoing “quality” of these certificates and their holders;
conversely, it is apparent that Australian issued certificates of competency and the maritime education system that underpins these qualifications are highly regarded overseas as “quality” documents;
Australian certificates of competency issued to non-residents comprise an important secondary source of maritime skills that Australia might usefully tap in the event that difficulties are experienced in sourcing suitable or sufficient recruits for either seagoing or shore-based positions;
that Australia is considered a major supplier of officers to foreign flag vessels may serve to diminish the pool of available indigenous maritime skills in Australia;
conversely, the significant suppliers of officers to the world fleet to our north in China, the Philippines, India and Indonesia could foreseeably provide Australia with an abundant source of marine skills for the future provided that language, cultural, management style and immigration issues can be resolved. Likewise, the significant surplus of officers in the UK and Canada that share the same language and similar educational and cultural norms might be attracted to relocating to Australia.
3.2 BIMCO/ISF Manpower Update 2000
The BIMCO/ISF 2000 Manpower Update4 was updated again in 2000. A similar situation applied in 2000 as for 1995 such that with a global supply of 404,000 (1995: 409,000) and demand of 420,000 (1995: 427,000) there was a global shortage of 16,000 (1995: 18,000) officers representing 4% of the total officer pool. It will be recalled that the 1995 Manpower Update forecast an officer shortage of 30,000 by 2000, whereas a modest reduction of 2,000 to the shortage has in fact occurred. This continued, albeit small, shortfall in the numbers of officers needs to be considered in the context of:
a rate of growth in the world fleet of only 1% pa between 1995 and 2000;
the phasing out of older ships with higher manning levels;
some indication of increased recruitment that was tempered by the Asian economic crisis that occurred in 1999.
It should be noted that the definition of “qualified seafarers” includes nationals serving on national flag ships, foreign flag ships or currently unemployed, but does not include ex-
4 Institute for Employment Research, University of Wrawick, The Worldwide Demand for and Supply of Seafarers, 2000, BIMCO/ISF
Australian Maritime Safety Authority Maritime Skills Availability Study
Thompson Clarke Shipping Pty Ltd Page 24
seafarers working ashore or retired from the profession and non-resident foreigners serving on national flag vessels.
However, the 2000 Manpower Update cautions that:
“In practice, however, the estimated shortfall of 16,000 officers is more severe if account is taken of the obstacles which prevent surpluses of some nationalities of seafarer from compensating shortages experienced by other countries. such barriers include cultural and language differences, lack of international experience and the nationality restrictions that apply to many flags.”
Similar barriers are likely to apply to importing maritime skills into Australia; therefore overseas sources of maritime skills cannot necessarily be relied upon to solve any shortfall that Australia might experience.
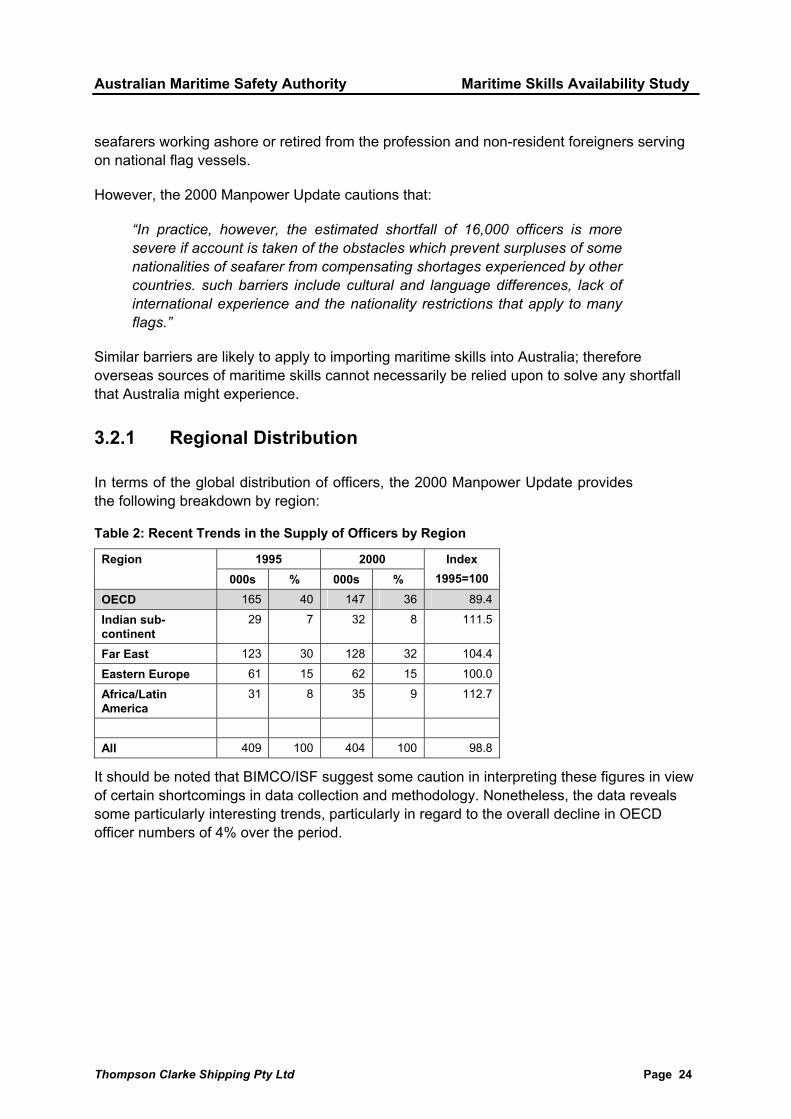
3.2.1 Regional Distribution
In terms of the global distribution of officers, the 2000 Manpower Update provides the following breakdown by region:
Table 2: Recent Trends in the Supply of Officers by Region
1995 2000 Region 000s % 000s %
Index 1995=100
OECD 165 40 147 36 89.4
Indian sub-continent
29 7 32 8 111.5
Far East 123 30 128 32 104.4
Eastern Europe 61 15 62 15 100.0
Africa/Latin America
31 8 35 9 112.7
All 409 100 404 100 98.8
It should be noted that BIMCO/ISF suggest some caution in interpreting these figures in view of certain shortcomings in data collection and methodology. Nonetheless, the data reveals some particularly interesting trends, particularly in regard to the overall decline in OECD officer numbers of 4% over the period.

Australian Maritime Safety Authority Maritime Skills Availability Study
Thompson Clarke Shipping Pty Ltd Page 25
If the global officer supply is disaggregated further then:
Table 3:Structure of Officer Supply by Region
Total Officers by Region (000s) Officer Type Date OECD Far East Indian
sub- continent
Eastern Europe
Africa/Latin America
Total
Deck - Senior 1995 43 17 5 12 3 80
2000 43 19 6 14 5 87
Deck – Junior 1995 28 35 6 12 5 86
2000 20 32 6 11 6 75
Engineer – Senior
1995 40 16 5 11 5 78
2000 36 18 6 15 6 82
Engineer - Junior 1995 33 36 7 16 8 100
2000 21 32 6 12 9 81
Other 1995 12 7 2 7 5 34
2000 10 13 3 5 2 32
All 1995 165 123 29 61 31 409
2000 147 128 32 62 35 404
There have been significant shifts in the regional distribution of officers in the 5 years to 2000:
the expected decline in the numbers of senior officers from OECD countries has continued, and this is particularly marked amongst senior engineer officer positions (10% decline);
numbers of OECD junior officers have declined even more markedly amongst both deck (29% decline) and engineer (36% decline), which begs the question of where the next generation of OECD senior officers is going to come from;
officer numbers in all other regions have increased, particularly amongst senior deck and engineer officer positions;
even so, 49% of all senior deck officer positions and 44% of senior engineer officer positions are still held by OECD officers, which implies that industry is likely to prefer to rely upon such officers for many years to come.

Australian Maritime Safety Authority Maritime Skills Availability Study
Thompson Clarke Shipping Pty Ltd Page 26
3.2.2 Age Profile
The age profiles of OECD officers continue to pose substantial problems:
Table 4: Officer Age Profile 2000
% of Number of Officers in each Age Category < 20 20 - 25 26 - 30 31 - 40 41 - 50 51 - 55 > 55 Total OECD 0.4 5.7 9.4 18.8 27.5 24.0 17.8 100
Indian sub-continent
0.9 10.0 19.6 30.8 31.4 4.7 2.6 100
Far East 0.3 7.0 18.1 35.5 31.9 4.7 2.4 100
Eastern Europe 0.1 4.2 17.5 35.0 27.9 11.5 3.9 100
Africa/Latin America 1.2 6.5 22.1 35.3 26.4 8.0 0.5 100
All 0.7 7.7 15.9 30.5 28.3 12.0 5.0 100
Figure 1: OECD Officer Age Profile
0
10
20
30
40
%
< 31 31-40 41-50 > 50
OECD Officer Age Profile
199019952000
the proportion of OECD officers aged over 50 has increased from 17% in 1990 to 42%
in 2000 whereas the proportion of officers in all other age profiles has declined over the same period;
specifically, the number of officers from OECD countries aged over 55 years has increased from some 5,800 in 1990 to some 26,000 in 2000, whereas the number of officers of a similar age from the Far East and Indian sub-continent has remained relatively constant;
OECD officer age profile demonstrates a regular progression over time as the population moves on from one age bracket to the next towards retirement, the Far East and Indian sub-continent officer population by age plateaus at around 50 that indicates that these officers tend to retire earlier than there OECD counterparts.

Australian Maritime Safety Authority Maritime Skills Availability Study
Thompson Clarke Shipping Pty Ltd Page 27
3.2.3 Wastage
Wastage depends upon a number of factors including the age profile:
the 2000 Manpower Update makes the assumption that if most of the OECD officers aged over 55 today will retire in 5 years time and that they are currently serving as senior officers, then the OECD senior officer pool could decrease by 18% in the next 5 years;
if a similar assumption is applied to OECD officers aged in the 51-55 age bracket that these officers will retire in 10 years time and that they are currently serving as senior officers, then the OECD senior officer pool could decrease by a further 24% in the next 10 years ie a total of 42% over the next 10 years;
the 2000 Manpower Update cautions that considerable doubts remain concerning the validity of data on general wastage rates due to lack of objective information, however officer wastage has been estimated as follows:
Table 5: Officer Annual Wastage Rates
Region Annual Wastage Rate
% OECD 6.6
Indian sub-continent
5.0
Far East 5.4
Eastern Europe 4.6
Africa/Latin America 1.8
whereas the OECD has the highest wastage rate for officers, it appears that most of this occurs at a relatively early stage in their sea-going career;
the consensus amongst industry suggests that the average length of seafarers’ careers may decrease slightly during the next 5-10 years. Cited reasons include:
• growth of more attractive career alternatives
• trend towards the recognition of marine qualifications as being equivalent to tertiary qualifications
• increasing social pressure and desire to live ashore with families
• improving employment opportunities ashore
• improving pay and conditions ashore
• higher career expectations of young people

Australian Maritime Safety Authority Maritime Skills Availability Study
Thompson Clarke Shipping Pty Ltd Page 28
3.2.4 Inflows
As for wastage rates, it was difficult to obtain estimates of overall inflows into the active stock of seafarers ie those actively searching for employment. Instead, future wastage and inflow rates were combined into one figure that represents the annual net change in the officer stock. Because these figures are net of wastage they can assume negative values, as is the case for the OECD.
Table 6: Net Annual Inflow Rates into the Supply of Officers 1995 - 2000
Region 1990-1995 %
1995-2000 %
Annual Net
Change % OECD 0 -4.3 -2.4
Indian sub-continent
+1.6 8.3 2.2
Far East +1.1 5.4 0.9
Eastern Europe -0.2 10.0 0.0
Africa/Latin America -1.1 2.2 2.5
3.2.5 Future Supply
Based upon current training and wastage levels, the total officer supply will fall to 397,000 by 2010 as follows:
Table 7: Projected Officer Supply
Region 2000 2005 2010 OECD 147 129 113
Indian sub-continent
32 35 39
Far East 128 134 140
Eastern Europe 62 62 62
Africa/Latin America 35 39 44 All 404 399 397
The supply of OECD officers will pose significant problems in the future declining by 18,000 (12%) by 2005 and by a further 16,000 (12%) by 2010.
These figures are quite sensitive to changes in assumed training and wastage levels eg an increase of 1% in the officer wastage rate will result in the total officer stock falling to <360,000 by 2010. Similarly, increasing training by 33% will improve the total officer stock to almost 500,000 by 2010.

Australian Maritime Safety Authority Maritime Skills Availability Study
Thompson Clarke Shipping Pty Ltd Page 29
3.2.6 Future Balance
The expected balance between supply and demand is expected to change significantly over the next 10 years:
Table 8: Officer Supply/Demand Balance for 2010
Region Supply: 2000 stock + net inflow
Forecast Demand
Difference
OECD 113 166 - 54
Indian sub-continent
39 15 24
Far East 140 91 49
Eastern Europe 62 37 25
Africa/Latin America 44 134 - 90 All 397 443 - 46
The shortage in officers widens from 4% in 2000 to 12% by 2010.
The shortage indicated in the Africa/Latin America region includes many open registries such as Panama and Liberia that are not significant labour suppliers.
It is evident that the situation in OECD countries will become particularly severe with a shortfall of 33%.
Such forecasts in the officer supply/demand balance are very sensitive to changes in the underlying assumptions made as to world fleet growth, wastage rates, vessel manning scales and training effort.
3.2.7 Training
The 2000 Manpower Update revealed that officer training was improving although wastage continues to be a problem:
Officer trainee/cadet inflows had improved from 8.3% of officer stock in 1995 to 9.3% by 1999, reaching almost 12% in 1998.
The improvement in the OECD is most marked improving from 15.7% of the total under training to 29.9% in 2000.
As a proportion of the total regional officer stock, officer trainees in the OECD improved from 5.3% to 11.9%.
Of considerable concern is the substantial number of officer trainees that fail to complete their training. In the OECD 13% of officer trainees decide not to pursue a career at sea each year, which amounts to around one third of all trainees failing to complete their courses.

Australian Maritime Safety Authority Maritime Skills Availability Study
Thompson Clarke Shipping Pty Ltd Page 30
Indications are that the trainee intake ratio must improve to closer to 1.5 officer trainees per vessel in order to meet future officer supply targets.
3.2.8 Australia’s 2000 Manpower Update Return
The return made by the Australian Shipowners’ Association (“ASA”) for the 2000 Manpower Update contained the following relevant data:
3.2.8.1 Officer Numbers
Table 9: Australian Officers
1990 1995 2000 No. Officers 2,042 1,400 1,700
These numbers include:
only seafarers that are Australian nationals
all qualified national seafarers
These numbers do not include:
Australian nationals working on foreign flag vessels
retired seafarers
seafarers not actively looking for work at sea
fishermen
hotel staff
seafarers on harbour tugs
The 1999 ASA estimate of 1,700 Australian officers on Australian ships is comparable to the 1998 TCS estimate of 1,686. However, with the further decline in the Australian trading fleet, the 2002 TCS estimate of officer numbers is now 1,415 representing a decline of 16%, which is roughly proportional to the decline in the Australian trading fleet from 59 to 51 vessels representing a decline of about 14%. (see Section 6.2.1)
3.2.8.2 Recruitment & Training
ASA estimate that the average number of newly qualified officers who completed their training each year between 1995 and 1999 at 45 pa.
3.2.8.3 Wastage Rate
ASA did not provide any data on wastage rates for either officers or ratings.

Australian Maritime Safety Authority Maritime Skills Availability Study
Thompson Clarke Shipping Pty Ltd Page 31
3.2.8.4 Availability
The availability of Australian officers was reported by ASA to be at a position where supply more or less matches demand.
3.2.9 Key Issues
The following key issues were identified in the Summary of the 2000 Manpower Update that are particularly relevant to the maritime skills availability position in Australia:
The changing nationality of seafarers
The 2000 results confirm that the centre of gravity of the manpower industry has continued to move away from most of the traditional maritime countries in Europe, Japan and North America towards countries in the Far East, the Indian sub-continent and Eastern Europe. Seafarers from OECD countries currently constitute some 27.5 per cent of the marine global workforce compared to 31.5 per cent in 1995 and there have been particularly substantial reductions in the numbers of junior deck and engine officers from OECD nations. But while these changes may well have been quite dramatic at the level of an individual company or country, from a global perspective the overall decline of 4 per cent in the proportion of OECD seafarers over a five-year period suggests that the changes are evolutionary rather than revolutionary. [Emphasis added]
Recruitment has increased but still needs to improve
Encouragingly, overall levels of recruitment and training appear to have increased significantly, with officer trainees comprising 1 in 10 officers compared to 1 in 13 in 1995. The numbers under training appear to have increased in virtually all nationality groups, with a particularly substantial increase in trainees recruited from OECD countries. However, the Update indicates that recruitment levels still need to increase further to meet anticipated demand for qualified officers. Specifically, the Update recommends that officer recruitment and training levels need to increase from 1 in 10 to 1 in 7 which equates to approximately 1.5 trainees per ship. This target will clearly represent a major challenge. [Emphasis added]
Australian Maritime Safety Authority Maritime Skills Availability Study
Thompson Clarke Shipping Pty Ltd Page 32
Increased future demand for seafarers
During the past decade, the number of ships in the commercial trading fleet has increased by an average of some 1 per cent per annum. Although this might suggest that demand for seafarers should have increased by a similar amount, this has not proved to be the case. Overall levels of demand for both officers and ratings have remained largely static, and may even have decline marginally, principally as a result of lower manning scales on more modern vessels. However, this Update suggests that this situation is likely to reverse in the future. There is little scope for further manning reductions if account is taken of the impact of international regulations such as working time legislation, and because back-up requirements may well need to increase to accommodate additional training or increased leave. Therefore, even a modest future increase in the number of ships in the world fleet will result in additional demand for seafarers which can only be accommodated if recruitment and training are increased (unless wastage is reduced). [Emphasis added]
Need to reduce wastage
While levels of recruitment and training need to increase in future, the other side of this coin is the need to reduce the number of seafarers who leave the industry each year to pursue careers in other industries. This is particularly relevant in the case of officer trainees since the Update indicates that around 30 per cent fail to complete their training. This points to the need to improve selection techniques and to improve perceptions of the industry as a career. In certain countries, consideration might possibly be given to upgrading training for ratings with the necessary education and aptitude to allow them promotion to officer grades, both as a means of improving career prospects and of increasing the supply of qualified officers. [Emphasis added]
Dependence on ageing OECD officers
The world fleet continues to rely upon large numbers of officers from Europe, North America, Japan and other OECD countries. However, over 40 per cent of these officers are over 50 years old, and 18 per cent are aged over 55. Most of these officers are in senior positions as Masters or Chief Engineers. The impact on the industry of their retirement, without adequate numbers of well-trained and experienced replacements, could be severe. While senior shipping executives questioned in this survey forecast that within the next 5 – 10 years most senior officers will be from Asian or East European supply countries, other data in this Upgrade suggests that the situation may prove more complicated. [Emphasis added]
Australian Maritime Safety Authority Maritime Skills Availability Study
Thompson Clarke Shipping Pty Ltd Page 33
Progress of Asian seafarers to senior positions
The data presented in this Update suggests that, unlike seafarers from OECD countries, relatively few officers from the Far East or the Indian sub-continent choose to remain at sea after the age of 50. To some extent this explains why these nationalities remain under-represented in senior officer positions, though this may not be the only reason. It is possible that this trend might be expected in newer labour supply countries and that the age profiles will mature into something closer to the OECD pattern over time. But analysis of the evolution of age profiles over the last 10 years suggests that in Asia the trend has remained remarkably consistent. If substantial numbers of officers continue to retire at or around the age of 50, this may challenge the assumption that officers from these nations will automatically replace retiring senior officers from OECD countries. [Emphasis added]
Impact of the revised STCW Convention
The new competence standards required by the revised IMO Convention on Standards of Training, Certification and Watchkeeping for Seafarers (STCW95) will not fully take effect until 2002, and in practice their full impact will not be apparent until the middle of the current decade. Publication by IMO of the “white list” of countries which are considered, in principle, to meet the standards set by the Convention has been delayed. Fears that seafarers holding certificates issued by countries which failed to gain a place on the “white list” would become unemployable have not therefore been tested. There is evidence that many countries have upgraded training standards, and most of the senior shipping executives questioned in this survey expressed confidence that standards of competence would show an overall improvement. However, the measures in STCW95 which might have the effect of reducing the number of qualified seafarers, such as the “white list”, additional flag state requirements and stricter certificate revalidation procedures, have not yet taken full effect. [Emphasis added]
3.3 United Kingdom Seafarers Analysis 1997
The situation that applies to seafarers, particularly qualified officers, in the UK is set out in the United Kingdom Seafarers Analysis 19975. The aim of the analysis was to quantify the “active” labour force in the sense of seafarers presently employed at sea or in related maritime industries.
5 Centre for International Transport Management, United Kingdom Seafarers Analysis 1997, London Guildhall University
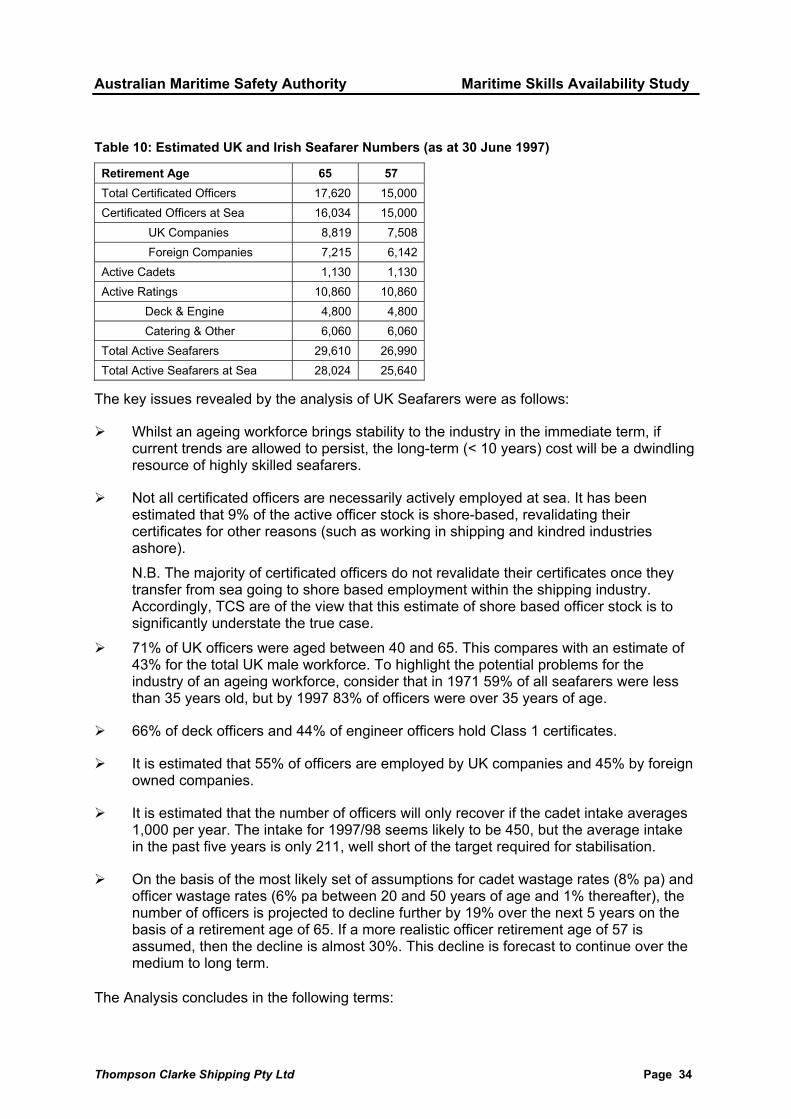
Australian Maritime Safety Authority Maritime Skills Availability Study
Thompson Clarke Shipping Pty Ltd Page 34
Table 10: Estimated UK and Irish Seafarer Numbers (as at 30 June 1997)
Retirement Age 65 57 Total Certificated Officers 17,620 15,000 Certificated Officers at Sea 16,034 15,000 UK Companies 8,819 7,508 Foreign Companies 7,215 6,142 Active Cadets 1,130 1,130 Active Ratings 10,860 10,860 Deck & Engine 4,800 4,800 Catering & Other 6,060 6,060 Total Active Seafarers 29,610 26,990 Total Active Seafarers at Sea 28,024 25,640
The key issues revealed by the analysis of UK Seafarers were as follows:
Whilst an ageing workforce brings stability to the industry in the immediate term, if current trends are allowed to persist, the long-term (< 10 years) cost will be a dwindling resource of highly skilled seafarers.
Not all certificated officers are necessarily actively employed at sea. It has been estimated that 9% of the active officer stock is shore-based, revalidating their certificates for other reasons (such as working in shipping and kindred industries ashore). N.B. The majority of certificated officers do not revalidate their certificates once they transfer from sea going to shore based employment within the shipping industry. Accordingly, TCS are of the view that this estimate of shore based officer stock is to significantly understate the true case.
71% of UK officers were aged between 40 and 65. This compares with an estimate of 43% for the total UK male workforce. To highlight the potential problems for the industry of an ageing workforce, consider that in 1971 59% of all seafarers were less than 35 years old, but by 1997 83% of officers were over 35 years of age.
66% of deck officers and 44% of engineer officers hold Class 1 certificates.
It is estimated that 55% of officers are employed by UK companies and 45% by foreign owned companies.
It is estimated that the number of officers will only recover if the cadet intake averages 1,000 per year. The intake for 1997/98 seems likely to be 450, but the average intake in the past five years is only 211, well short of the target required for stabilisation.
On the basis of the most likely set of assumptions for cadet wastage rates (8% pa) and officer wastage rates (6% pa between 20 and 50 years of age and 1% thereafter), the number of officers is projected to decline further by 19% over the next 5 years on the basis of a retirement age of 65. If a more realistic officer retirement age of 57 is assumed, then the decline is almost 30%. This decline is forecast to continue over the medium to long term.
The Analysis concludes in the following terms:

Australian Maritime Safety Authority Maritime Skills Availability Study
Thompson Clarke Shipping Pty Ltd Page 35
The key issue that arises from this analysis is that if the industry is to remain at its present operational size, does it wish to employ UK [ie indigenous] personnel? The answer to this question has not only ramifications for the shipping industry, but also for government strategy. Assuming that the answer to this question is affirmative, there will have to be some rapid and substantial changes made at the level of the individual companies, the industry, and appropriate government departments, to reverse the [deteriorating] trends…
It would be drawing a long bow to infer that the employment and recruitment situation of seafarers that applies to the UK shipping industry has a direct relationship to the situation that pertains in Australia. Nevertheless, there are distinct parallels between the two from which useful inferences can be drawn.
3.4 Implications of Sea-Going Manpower Studies for Australia
The maritime skills availability implications for Australia from the 1995 & 2000 Manpower Updates and the UK Seafarers Analysis will be self-evident:
The manpower implications for Australia if the overall OECD trends were replicated in this country should be readily apparent, particularly in regard to officer shortages, an ageing officer population and insufficient training. As will be demonstrated elsewhere in this Study these trends are already manifesting themselves in Australia.
if Australia is considered to be a major supplier of officers to foreign flag vessels as a consequence of the “quality” of these officers then this may serve to diminish the pool of available indigenous maritime skills in Australia from which AMSA and coastal pilots might recruit in future;
Australian certificates of competency issued to non-residents comprise an important secondary source of maritime skills that Australia might usefully tap in the event that difficulties are experienced in sourcing suitable or sufficient recruits for either seagoing or shore-based positions;
the significant suppliers of officers to the world fleet in the Far East and the Indian sub-continent could provide Australia with an abundant source of marine skills for the future provided that language, cultural, management style and immigration issues can be resolved. However, if substantial numbers of officers from these regions continue to retire at or around the age of 50, this may challenge the assumption that officers from these areas could replace ageing/retiring personnel in an OECD country such as Australia;
the significant surplus of officers in countries such as the UK and Canada that share the same language and similar educational and cultural norms to Australians might also be attracted to relocating to Australia. However, as the Manpower Updates demonstrates, this is likely to represent only a short term solution given that 40% of OECD officers are due for retirement within 10 years;
Australian Maritime Safety Authority Maritime Skills Availability Study
Thompson Clarke Shipping Pty Ltd Page 36
with officer training at already low levels in the OECD including Australia, the reported wastage levels amongst officer trainees of almost 1/3 that fail to complete their training reduces inflow to replace retiring senior officers;
the future impacts of STCW95 on the available pool of maritime skills from which Australia could draw are still to be worked through.
Australia is unable to quarantine itself from the implications of a worldwide shortage of “quality” officers as identified in the Manpower Updates. As a major trading nation Australia must be able to access a pool of appropriate maritime skills in order to be able to properly service its substantial shipping task on which its economy is founded. However, Australia will not necessarily be unable to rely in future on the importation of overseas sea-going officers to augment its domestically trained personnel if it is to maintain an appropriate pool of skilled and experienced officers to service its shipping task. Australia is no longer as attractive or welcoming to qualified and experienced officers as a place to migrate to as it was once; migration qualifications are higher and the financial rewards to be gained from working in Australia are comparatively lower than in many other OECD countries with which Australia is competing. Accordingly, the world will not necessarily be making a beaten path to our door to meet the shortfall resulting from a possible decline in Australia's maritime skills availability.
Australian Maritime Safety Authority Maritime Skills Availability Study
Thompson Clarke Shipping Pty Ltd Page 37
4. Overseas Shore-Based Manpower Studies
4.1 A study of the UK economy’s requirements for people with experience of working at sea 1996
In 1995 a report was commissioned a report entitled A study of the UK economy's requirements for people with experience of working at sea. 6 The key issues revealed by this study were:
Approximately 17,000 jobs were identified which employers would prefer to fill with ex-seafarers. For 70% of these, seafaring experience was considered ‘essential’; most such jobs (87.5%) were filled by former officers with Class 1 certificates. [Emphasis added]
Demand for ex-seafarers ashore is estimated at between 640 and 740 per annum over the next nine years. Demand for those filling posts where seafaring experience was considered 'essential' is estimated at between 450 and 580 a year. [Emphasis added]
Supply projections range from about 450 upwards at present, falling to about 175 in 2004/5. Supply is strongly driven by industry intake and projections are relatively insensitive to wastage rates.
While demand and supply are roughly in balance at present, the forecast reduction in supply will result in an increasing shortfall, reaching approximately 275 by 2004/5. [Emphasis added]
Recruitment by shipping companies of approximately 1,200 cadets a year is required to maintain the present status quo at sea and ashore, once the effects of under recruitment since 1981/82 have worked themselves out. Current intake is about 400 a year. [Emphasis added]
The market response to the shortfall is expected to be an increase in salaries in relevant shore based jobs. This is likely to increase seafarer wastage rates, causing shipping companies to reduce training of UK cadets, thus further reducing the future pool of UK officers. [Emphasis added]
In the context of maintaining a viable, domestic shore based workforce in support of an essential service industry, the study draws the following conclusions that are of direct relevance to Australia's situation:
Merchant navy service still appears to provide the most cost effective training for these shore-based jobs. Neither third party training nor the employment of foreign ex-seafarers is likely to provide a ready remedy to offset this shortage of
6 Gardner, BM, Pettit, SJ, (1998), A study of the UK economy’s requirements for people with experience of working at sea, commissioned by Department of Transport, Chamber of Shipping and Marine Society, University of Wales Cardiff

Australian Maritime Safety Authority Maritime Skills Availability Study
Thompson Clarke Shipping Pty Ltd Page 38
UK officers. Reliance on non-seafarers would lead to quality loss. [Emphasis added]
Those shore-based businesses which are sufficiently flexible may relocate relevant activities abroad to obtain the required ex-seafaring staff. The long-term effect of this may be a considerable erosion of London's maritime related sector. [Emphasis added]
The required expansion in merchant navy training and sea-based employment opportunities to meet the demand of the shore based marine related sector for ex-seafarers – as well as the demand of the shipping industry itself at sea and ashore – would require intervention in the form of external financing by the 'end user' and/or the taxpayer. [Emphasis added]
The implications for Australia arising from this report into UK demand for seafaring skills in the shore based shipping industry are discussed in Section 4.5.
4.2 British Shipping: Charting a New Course 1998
The paper British Shipping: Charting a New Course 7 sets out the UK Government’s strategy for reviving the shipping industry within the context of an integrated shipping policy that includes:
“to promote the employment and training of British seafarers in order to keep open a wide range of job opportunities for young people and to maintain the supply of skills and experience vital to the economy.”8
The paper is more concerned with the development of policy initiatives to redress the decline in UK shipping. As a consequence it findings and recommendations are not directly related to this Study, yet the commentary made in respect of maritime skills is highly relevant. The paper draws heavily on the findings of the study undertaken by Gardner and Pettit referred to previously in Section 4.1.
The requirement for maritime skills in the UK is expressed in the following terms:
the need to be assured of a continued supply of people with seafaring skills and experience not merely to man our ships but to fill a wide range of jobs in a wide range of shore-based maritime related businesses in London and throughout the country, including shipyards, repairers, equipment producers/suppliers, marine insurance, shipbroking, maritime law, class, and overseas ship-owning interests;
the high proportion (70%) of such shore-based jobs where seafaring experience and possession of a Class 1 certificate is considered essential;
service in the merchant navy provided the most cost-effective training for these shore-based jobs and that a declining shipping industry would deprive the many maritime-related industries of essential skills;
7 British Shipping: Charting a New Course, Department of the Environment, Transport and the Regions, 1998 8 White Paper on the Future of Transport, 1998, para. 3.181

Australian Maritime Safety Authority Maritime Skills Availability Study
Thompson Clarke Shipping Pty Ltd Page 39
neither third party training nor the employment of foreign ex-seafarers (the skills shortage is world-wide) was considered likely to provide a ready remedy to offset the shortage of British seafarers.
4.3 UK Independent Enquiry into a Tonnage Tax 1999
In 1999 the UK Treasury commissioned an independent enquiry 9 into the application of a tonnage tax to stimulate the UK flag fleet. Whilst this enquiry is concerned mainly with fiscal measures, it makes a number of observations that relate to training and employment particularly in shore-based positions. In fact the Executive Summary commences in the following terms:
i. “Our shipping industry and the skills of our seafarers have long been part of our success as a trading nation.
ii. Whilst still significant, the industry has been in steady decline for the past 20 years yet growth in world trade offers significant prospects for expansion. The stock of skilled seafarers is dwindling and their average age is increasing. Without a revival, especially of the number of trained officers, there will soon be a shortfall well below the needs of the shipping and shore-based related maritime industries.” [Emphasis added]
In that section of the enquiry dealing with Training and Employment, a number of pertinent observations are made that are relevant to this Study:
UK officers are highly regarded throughout the world with 17,000 employed:
• 45% foreign flag
• 30% UK flag
• 25% UK owned but flagged elsewhere
The need for more officers is highlighted by the strength and requirements of our shore-based infrastructure (Gardner and Pettit: 17,000 jobs in more than 25 shore-based sectors that employers would prefer to fill with seafarers mostly with Class 1 certificates).
Government noted that ‘practical seafaring experience generally remains the key element in the mix of competences which is sought by shore-based sectors in appointing seafarers.’
The Baltic Exchange believes that ‘the pool of maritime excellence is fast diminishing and the strengthening of the UK fleet is probably the only way of reversing that process.’ The Baltic Exchange also points to the decline in the once
9 Lord Alexander of Weedon QC, Independent Enquiry into a Tonnage Tax, 1999, HM Treasury
Australian Maritime Safety Authority Maritime Skills Availability Study
Thompson Clarke Shipping Pty Ltd Page 40
strong New York shipping infrastructure which followed the decline of its shipping industry and say that ‘without a national shipping industry and the associated skills base, London’s position as the world’s biggest maritime centre would be vulnerable.’ This is a view shared by the paper’s author, Lord Alexander of Weedon who concludes:
“xv. It is obviously for the Government to decide on the priorities for public finances. But, as “Charting a new course” recognised, our shipping industry is currently in danger of dying a gradual death. I am not surprised that several interests have made the point to me that this is “make or break” time. It may well be this realisation which has brought the Government, the industry and the trades unions together in a partnership to secure its future and which has led to the industry’s willingness to accept a formal commitment to training.”
4.4 Seafarers and the Land-based Jobs Market 1999
Gardner and Pettit published a series of papers concerned with the supply and demand aspects arising from their earlier study of the UK economy’s requirements for people with experience of working at sea undertaken in 1996 and discussed at Section 4.1 of this Study. These papers were entitled:
Seafarers and the land based jobs market10 dealing with demand
The land-based jobs market for seafarers11 dealing with supply
4.4.1 Demand
At least a third and possibly a half of employers in the maritime related sector of the UK economy require people with seafaring experience and skills to fill certain shore based positions.
The best estimate of the total number of positions to be filled by ex-seafarers is of the order of 16,825.
Of this number, 70% are positions where seafaring qualifications and experience are considered to be essential for employment ie 11,778 and 30% are positions where seafaring qualifications and experience are considered to be desirable for employment ie 5,047.
Former officers holding at least a Class 1 deck or engineer certificate fill 87.5% of the positions where seafaring qualifications and experience are considered to be essential for employment ie 10,305.
Former British deck or engineer officers fill 65% of total number of positions to be filled by ex-seafarers ie 10,998.
10 Gardner, BM, Pettit, SJ, Seafarers and the land based jobs market, Marine Policy, 1998, 23(1), 103-115 11 Gardner, BM, Pettit, SJ, The land based jobs market for seafarers, Marine Policy, 1998, 23(2), 161-175

Australian Maritime Safety Authority Maritime Skills Availability Study
Thompson Clarke Shipping Pty Ltd Page 41
Best estimate of the likely annual demand for ex-seafarers to net vacancies in shore-based positions is 810. However, due to sampling errors and confusion amongst employers between gross and net wastage rates, this estimate may overstate the actual level of mean demand.
4.4.2 Supply
The main source of supply for shore-based positions in the essential category has traditionally been wastage from the sea-going side of the UK’s shipping industry.
Projections about the future annual supply of ships’ officers with Class 1 certificates to fill positions in the essential category were derived from yearly intake of trainees, wastage rates, an assumption that a Class 1 certificate is unlikely to be obtained before the age of 25 and no recruitment into shore based jobs after 45.
Table 11: Projected annual supply of ship’s officers to fill shore based job vacancies in the essential category
Age Profile Year 25-28 29-32 33-36 37-40 41-44 Total
95/96 29 112 112 83 106 442
96/97 23 80 108 76 92 379
97/98 23 51 98 78 76 326
98/99 26 28 93 74 63 284
99/00 34 19 73 74 54 254
00/01 46 16 53 71 49 235
01/ 02 56 15 33 65 52 221
02/03 58 17 18 60 48 201
03/04 59 21 13 49 47 189
04/05 56 29 10 34 46 175
05/06 51 38 10 22 42 163
06/07 57 39 10 12 40 158
Supply projections are not particularly sensitive to different assumptions about wastage as they are highly intake driven. Consequently different assumptions about wastage within a plausible range of 10 +/- 3% are unlikely to alter the supply projections markedly.

Australian Maritime Safety Authority Maritime Skills Availability Study
Thompson Clarke Shipping Pty Ltd Page 42
Table 12: Balance of supply and demand for ship’s officers to fill shore based job vacancies in the essential category
Year Lower Limit
Central Projection
Upper Limit
95/96 +98 -112 -122
96/97 +35 -75 -185
97/98 -18 -128 -238
98/99 -60 -170 -280
99/00 -90 -199 -310
00/01 -109 -219 -329
01/ 02 -123 -233 -343
02/03 -143 -253 -363
03/04 -155 -265 -375
04/05 -169 -279 -389
05/06 -181 -291 -401
06/07 -186 -296 -406
It is inevitable that a considerable shortfall in the supply of officers to fill vacancies shore based positions for which seafaring experience is essential will occur by 2006/07;
This conclusion is supported by the growing concern of employers surveyed in the ports and none shipping company sector about the prospect of an increasing shortfall over time.
The paper goes on to make conclusions about the policy implications of addressing this shortfall, including the introduction of a levy on organisations employing professionally qualified seafarers but that had not been engaged in their training before coming ashore.
4.4.3 Communication from the Commission of European Communities on the Training and Recruitment of Seafarers 2001
This Commission Communication12 provides ‘an update on the decline in the number of EU seafarers and an analysis of the reasons behind it, the possible implications for the EU shipping community and the measures necessary to reverse it.’13 Amongst the salient observations arising from this Communication include:
4.4.3.1 EU Officer Numbers
The following table shows clearly how the number of EU seafarers on board EU-registered ships has declined, while the number of non-EU seafarers has increased.
12 Commission of the European Communities, Communication from the Commission to the Council and the European Parliament, COM(2001) 188 final, 6 April 2001 13 ibid, p4

Australian Maritime Safety Authority Maritime Skills Availability Study
Thompson Clarke Shipping Pty Ltd Page 43
Table 13: Number of EU and non-EU seafarers employed on board EU registered ships
Year Officers EU Non-EU
1985 85,140 1,144 1995 52,255 2,551
It is estimated that the shortage of officers in the EU might reach around 13,000 in 2001, rising to some 36,000 by 2006. This dramatic situation is exacerbated by the age element: the average age of officers in the OECD countries is much higher than that of the Far Eastern, Eastern and Indian workforce. There are two main reasons for this: first of all, service at sea in the OECD countries is becoming shorter, with most seafarers moving to careers on shore long before they are forty; secondly, financial pressures have forced many shipping companies to take on board junior officers from third countries, as they are less expensive than their OECD counterparts. At present, most OECD officers are in the senior ranks (60% of EU officers are aged over 40), while most developing country officers are in the senior ranks (60% of EU officers are aged over 40), while most developing country officers are in the junior ranks. It can be expected that the senior OECD officers will, on retirement over the next few years, be replaced by nationals of less developed nations. The clear message is that the current shortage of officers will worsen unless remedial action is taken immediately.14 [Emphasis added]
4.4.3.2 Causes
There are two sides to the general issue addressed in this Communication: demand for EU seafarers is falling, and so is the supply of trained seafarers. The main reasons for this are the financial considerations of EU shipowners, and social aspects which discourage young people from considering a career at sea.
1.2.1 The financial considerations of EU shipowners
... EU shipowners took the opportunity to replace seafarers from the EU with non-EU labour and consequently to lower, inter alia, their wage costs.
... Despite the wage difference, shipowners appear more inclined to hire EU officers for a number of reasons ranging from safety considerations, type of ship and technical standards on board (the more expensive officers tend to be better educated and trained) to cultural links. [Emphasis added]
1.2.2 The social aspects of employment as a seafarer
Despite there being a shortage of qualified seafarers, fewer and fewer European youngsters are choosing maritime careers, considering
14 Commission of the European Communities, op cit, p.6

Australian Maritime Safety Authority Maritime Skills Availability Study
Thompson Clarke Shipping Pty Ltd Page 44
them socially and financially unattractive compared with positions on shore ...
An important indicator of the fact that young people do not regard seafaring jobs as an interesting occupation is the high dropout rate from maritime education and training : the average dropout rate in the EU is between 22% and 32%, but can be as high as 60% or 70% in some Member States. [Emphasis added]
1.3 Implications
The current lack of EU seafarers could have dramatic consequences. Well trained seafarers means safe navigation, efficient operations, good maintenance of ships and a reduction in the number of accidents and marine pollution (80% of all accidents are caused by human error). Personnel from certain labour-supplying countries outside the Community are – generally speaking – less well trained than Community personnel (e.g. seafarers holding third-country certificates which fail to meet the requirements of the IMO Convention on Standards of Training, Certification and Watchkeeping (STCW Convention) and are not recognised by Member States). Shipping being a vital activity for the EU (90% of the Union’s external trade and over 35% of its internal trade relies on maritime transport), it cannot afford to lose this basic pool of experience if it wants to avoid endangering safety and the environment and jeopardising the competitiveness of its shipping and related maritime industry. It should be emphasised that these considerations apply to both officers and ratings, since safe and efficient ship operations depend upon the technical skills and team-working ability of the entire crew, irrespective of rank ... [Emphasis added]
The shortfall of EU seafarers may also impact negatively on a whole range of related industries. A wide range of land-based employers look upon seafaring experience as an advantage or a pre-requisite when recruiting personnel. Ports, shipping companies, inspection bodies (classification societies, port State control authorities, flag administrations), insurance companies, shipbuilders and ship-repair companies, marine equipment manufacturers, etc. prefer or are obliged to recruit former seafarers. For a number of reasons ranging from cultural similarities and language to knowledge of local/national customs and regulations, positions within these companies are not easily filled by non-European former seafarers. It is therefore evident that the expected shortage of EU seafarers will lead in the longer term to a shortage of personnel for the EU’s shipping-related activities. The now-how and experience gained by EU seafarers during their time at sea needs to be retained if the EU wants to avoid a loss to the shipping industry as a whole.15 [Emphasis added]
The concern of the EU in regard to the ability of member countries to fill shore-based positions with suitably skilled ex-seafarers is patently apparent.
15 Commission of the European Communities, op. cit., pp. 7-9
Australian Maritime Safety Authority Maritime Skills Availability Study
Thompson Clarke Shipping Pty Ltd Page 45
Australian Maritime Safety Authority Maritime Skills Availability Study
Thompson Clarke Shipping Pty Ltd Page 46
5. Australian Shipping Industry Manpower Position
5.1 Report on the Maritime Skills Base in Australia 1999
In 1999, TCS undertook a Report on the Maritime Skills Base in Australia 16for the Australian Shipowners Association. This report was used as input into the Federal Government’s Shipping Reform Working Group. The objectives of this report were to describe:
the demand from the shipping industry in Australia for skilled personnel, particularly those with maritime related qualifications;
the shipping task that is required to be serviced by the shipping industry in Australia;
the expertise required to manage the shipping industry in Australia and the sources of such expertise;
the composition of the shipping industry in Australia.
The primary focus of the report was on the human resources and maritime skills base required to support the shipping industry in Australia, which has relied traditionally upon Australian seafarers and other Australians trained in commercial shipping practice.
Australia has a relatively small but vital shipping industry that has experienced significant structural change in all sectors: waterfront, shipping, ports and towage. In other respects productivity has improved and the various sectors have become more concentrated.
Shipping does not simply involve the carriage of cargoes for it embraces a far broader range of activities within its scope that are necessary to achieve the fundamental commercial objective of moving cargoes. These ancillary functions may be regulatory in nature such as those performed by AMSA, or involve the provision of necessary infrastructure and services to facilitate the movement of ships and their cargoes such as those provided by coastal pilots. Due to the highly specialised nature of most shipping functions many of these will be contracted out rather than performed in-house. As a consequence, the shipping industry comprises a range of service sectors whose purpose is to facilitate the movement of cargoes in one way or another.
Shipping is an integral part of almost every manufacturing and production activity in Australia. Whereas shipping may not be specifically recognised as a discrete function within many organisations, nevertheless it is essential activity without which the organisation could not operate. The important point to note is that the shipping industry in Australia is not just about “ships”, but is quite catholic in its structure yet requires a highly specialised workforce with specific qualifications and competencies to support the broader shipping function.
16 Thompson Clarke Shipping Pty Ltd, Shipping in Australia, A Report on the Maritime Skills Base, 1999, Australian Shipowners Association
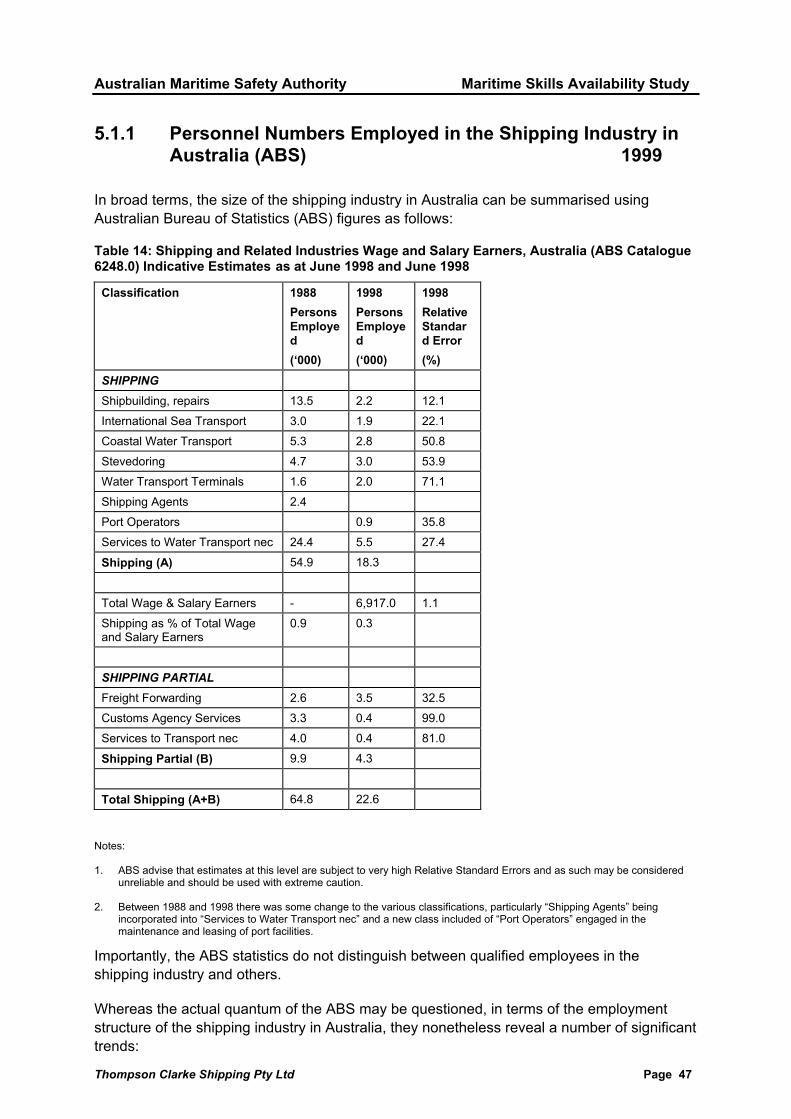
Australian Maritime Safety Authority Maritime Skills Availability Study
Thompson Clarke Shipping Pty Ltd Page 47
5.1.1 Personnel Numbers Employed in the Shipping Industry in Australia (ABS) 1999
In broad terms, the size of the shipping industry in Australia can be summarised using Australian Bureau of Statistics (ABS) figures as follows:
Table 14: Shipping and Related Industries Wage and Salary Earners, Australia (ABS Catalogue 6248.0) Indicative Estimates as at June 1998 and June 1998
Classification 1988 Persons Employed (‘000)
1998 Persons Employed (‘000)
1998 Relative Standard Error (%)
SHIPPING
Shipbuilding, repairs 13.5 2.2 12.1 International Sea Transport 3.0 1.9 22.1 Coastal Water Transport 5.3 2.8 50.8 Stevedoring 4.7 3.0 53.9 Water Transport Terminals 1.6 2.0 71.1 Shipping Agents 2.4 Port Operators 0.9 35.8 Services to Water Transport nec 24.4 5.5 27.4
Shipping (A) 54.9 18.3
Total Wage & Salary Earners - 6,917.0 1.1 Shipping as % of Total Wage and Salary Earners
0.9 0.3
SHIPPING PARTIAL
Freight Forwarding 2.6 3.5 32.5 Customs Agency Services 3.3 0.4 99.0 Services to Transport nec 4.0 0.4 81.0
Shipping Partial (B) 9.9 4.3
Total Shipping (A+B) 64.8 22.6 Notes: 1. ABS advise that estimates at this level are subject to very high Relative Standard Errors and as such may be considered
unreliable and should be used with extreme caution. 2. Between 1988 and 1998 there was some change to the various classifications, particularly “Shipping Agents” being
incorporated into “Services to Water Transport nec” and a new class included of “Port Operators” engaged in the maintenance and leasing of port facilities.
Importantly, the ABS statistics do not distinguish between qualified employees in the shipping industry and others.
Whereas the actual quantum of the ABS may be questioned, in terms of the employment structure of the shipping industry in Australia, they nonetheless reveal a number of significant trends:
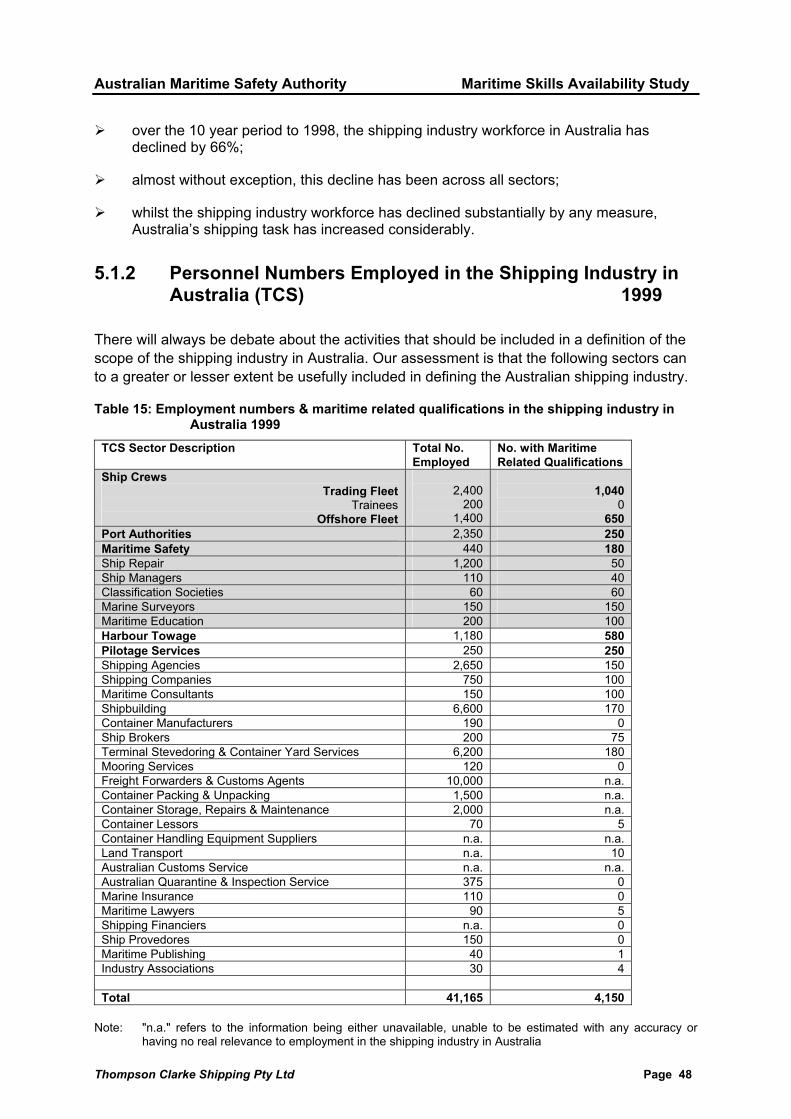
Australian Maritime Safety Authority Maritime Skills Availability Study
Thompson Clarke Shipping Pty Ltd Page 48
over the 10 year period to 1998, the shipping industry workforce in Australia has declined by 66%;
almost without exception, this decline has been across all sectors;
whilst the shipping industry workforce has declined substantially by any measure, Australia’s shipping task has increased considerably.
5.1.2 Personnel Numbers Employed in the Shipping Industry in Australia (TCS) 1999
There will always be debate about the activities that should be included in a definition of the scope of the shipping industry in Australia. Our assessment is that the following sectors can to a greater or lesser extent be usefully included in defining the Australian shipping industry.
Table 15: Employment numbers & maritime related qualifications in the shipping industry in Australia 1999
TCS Sector Description Total No. Employed
No. with Maritime Related Qualifications
Ship Crews Trading Fleet
Trainees Offshore Fleet
2,400
200 1,400
1,040
0 650
Port Authorities 2,350 250 Maritime Safety 440 180 Ship Repair 1,200 50 Ship Managers 110 40 Classification Societies 60 60 Marine Surveyors 150 150 Maritime Education 200 100 Harbour Towage 1,180 580 Pilotage Services 250 250 Shipping Agencies 2,650 150 Shipping Companies 750 100 Maritime Consultants 150 100 Shipbuilding 6,600 170 Container Manufacturers 190 0 Ship Brokers 200 75 Terminal Stevedoring & Container Yard Services 6,200 180 Mooring Services 120 0 Freight Forwarders & Customs Agents 10,000 n.a. Container Packing & Unpacking 1,500 n.a. Container Storage, Repairs & Maintenance 2,000 n.a. Container Lessors 70 5 Container Handling Equipment Suppliers n.a. n.a. Land Transport n.a. 10 Australian Customs Service n.a. n.a. Australian Quarantine & Inspection Service 375 0 Marine Insurance 110 0 Maritime Lawyers 90 5 Shipping Financiers n.a. 0 Ship Provedores 150 0 Maritime Publishing 40 1 Industry Associations 30 4 Total 41,165 4,150
Note: "n.a." refers to the information being either unavailable, unable to be estimated with any accuracy or
having no real relevance to employment in the shipping industry in Australia

Australian Maritime Safety Authority Maritime Skills Availability Study
Thompson Clarke Shipping Pty Ltd Page 49
The 1998 ABS estimates of employment in the shipping industry in Australia would appear to significantly understate the numbers actually employed when compared to TCS estimates of the position:
Table 16: Comparison of ABS and TCS Estimates of persons employed in the shipping industry in Australia
Classification ABS Estimate 1998 Persons Employed
TCS Estimate 1998 Persons Employed
Shipping 18,300 25,790 Shipping Partial 4,300 13,500 Unclassified - 1,865 Total Shipping 22,600 41,155
Note: In this analysis TCS has examined sectors of the shipping industry in Australia that undertake activities that do not
appear to be covered by the relevant ANZSIC Class/Description of shipping industry activities. Accordingly, TCS has grouped these activities together under the description 'Unclassified'.
TCS is confident that the estimates made of employment and maritime related qualifications in 1999 represented an accurate reflection of the employment and skills base of the shipping industry in Australia at the time. By and large they were real figures, rather than statistical estimates from a representative sample from each sector with the attendant interpretive cautions. Where it was not possible to obtain real figures from employers, TCS extrapolated from the available data using its knowledge of the shipping industry in Australia to make informed estimates. After all, the shipping industry in Australia is not that large as to be unable to make reasonably accurate estimates, particularly of the employment of persons with Master/Engineer 1 qualifications.
For the purposes of this Study, an analysis of TCS estimates of employment numbers and marine related qualifications in Australia made in 1999 reveals the following:
total employment is of the order of 41,000;
total number of employees with maritime related qualifications is of the order of 4,150;
number of employees with maritime related qualifications in shore based employment is of the order of 2,460;
assuming that those sectors highlighted in Table 15 above will be the principal sources of recruitment for AMSA, the number of employees with maritime related qualifications available to AMSA is of the order of 2,520. However, around 75% of these qualifications will be at a Master/Engineer 1 level;
in contrast, the likely sectors shown in bold in Table 15 above that coastal pilots are likely to recruit from is more limited comprising Ships Crews, Harbour Towage, Port Authorities, Pilotage Providers & Maritime Safety, the number of employees with maritime related qualifications is of the order of 2,950. However, only a third of these qualifications will be at a Master 1 level;
Australian Maritime Safety Authority Maritime Skills Availability Study
Thompson Clarke Shipping Pty Ltd Page 50
TCS conducted a detailed analysis of the skills base in all sectors of the shipping industry in Australia from which it can be estimated that numbers of Master/Engineer 1 level qualifications in those sectors that AMSA is likely to recruit from is of the order of 1,045 Master 1 and 880 Engineer 1 providing a total of 1,925;
similarly, the number of Master 1 level qualifications in those sectors that coastal pilots are likely to recruit from is of the order of 1,290;
it is unrealistic to assume that all identified individuals with superior certificates would wish to join either AMSA or the coastal pilot service. However, reaching an estimate of the number of potential candidates that would be interested in employment is best addressed by examining the numbers of applications received for advertised positions from individuals currently employed in the Australian shipping industry (see Section 6.1of this Study);
following on from overseas studies into the shore base employment, it would seem reasonable to conclude that most of the 2,460 in shore based employment with maritime related qualifications are in those positions because the possession of these qualifications was either an essential or preferred requirement;
the more closely related the actual employment sector is to the actual operation and safety of the ship, the greater reliance there is on shore based personnel with maritime related qualifications;
if the Australian trading and offshore fleets were to be disbanded, the shore based shipping industry in Australia would remain virtually intact apart from reductions in those sectors and organisations directly related to the operation of the Australian flag fleet such as Ship Managers and Maritime Education. However, it is considered that such reductions in the requirement for qualified personnel would only be at the margins.
anecdotal evidence obtained during the collection of information for this Study suggests that many sectors of the shipping industry in Australia prefer to employ people in shore-based positions who have Australian maritime related qualifications and sea-going experience because of the breadth of their local knowledge. The importation of foreign nationals or the training of non-seafarers was felt to give rise to an unacceptable quality loss in the delivery of shipping services.
This report was produced 3 years ago in February 1999. Since that time the Australian trading fleet (1,000 tonnes dwt and over) has declined from 59 to 51 vessels as at 30 June 2001 with further reductions underway such that the Australian trading fleet is soon to comprise some 48 vessels. In 1992 the Australian trading fleet comprised 78 vessels.
Accordingly, assuming that employment in all other sectors has remained relatively constant, the number of positions at sea in the trading and offshore fleets nominally requiring Master 1 and Engineer 1 qualifications remains largely unchanged.
5.2 Principal Sources of Recruitment by Maritime Industry Sector
In order to refine the definition of the available “pool” of maritime skills available to AMSA and coastal pilots, based on its knowledge of the shipping industry in Australia TCS has assessed the following industry sectors as providing the most likely sources of recruitment.

Australian Maritime Safety Authority Maritime Skills Availability Study
Thompson Clarke Shipping Pty Ltd Page 51
Selection of these 10 sectors from the 32 originally examined is a subjective assessment by TCS based upon its knowledge of the industry, traditional recruitment practice and current pay & condition relativities between sectors.
Table 17: Sectors from which AMSA and Coastal Pilots might recruit
TCS Sector Description
AMSA Coastal Pilots
Ship Crews Trading Fleet
Trainees Offshore Fleet
✔
✔
✔
✔ Port Authorities ✔ ✔ Maritime Safety ✔ ✔ Ship Repair ✔
Ship Managers ✔
Classification Societies ✔
Marine Surveyors ✔
Maritime Education ✔
Harbour Towage ✔ Pilotage Services ✔
In 1999, TCS analysed each of these shipping industry sectors in detail to determine:
Sector Description
Sector Composition
Employment Numbers
Skills Base ie personnel with maritime related qualifications
TCS has updated this information in the light of changed circumstances that have occurred in the intervening years for those industry sectors that AMSA and coastal pilots are more likely to recruit from as follows:
5.2.1 Ship Crews
5.2.1.1 Sector Description/Definition
This sector includes seafarers employed in the Australian flag fleet involved in the carriage of cargoes and in the Australian offshore fleet; it does not include seafarers employed in harbour towage or other industry sectors.
5.2.1.2 Sector Composition
As at 30 June 2001, the Australian trading fleet stood at 51 vessels (1,000 tonnes dwt and over) of various types and employing Australian seafarers. All seafarers are now employed directly by the ship owner or manager. Prior to 1998, ratings were engaged from the Seamen’s Engagement System that was administered by AMSA.
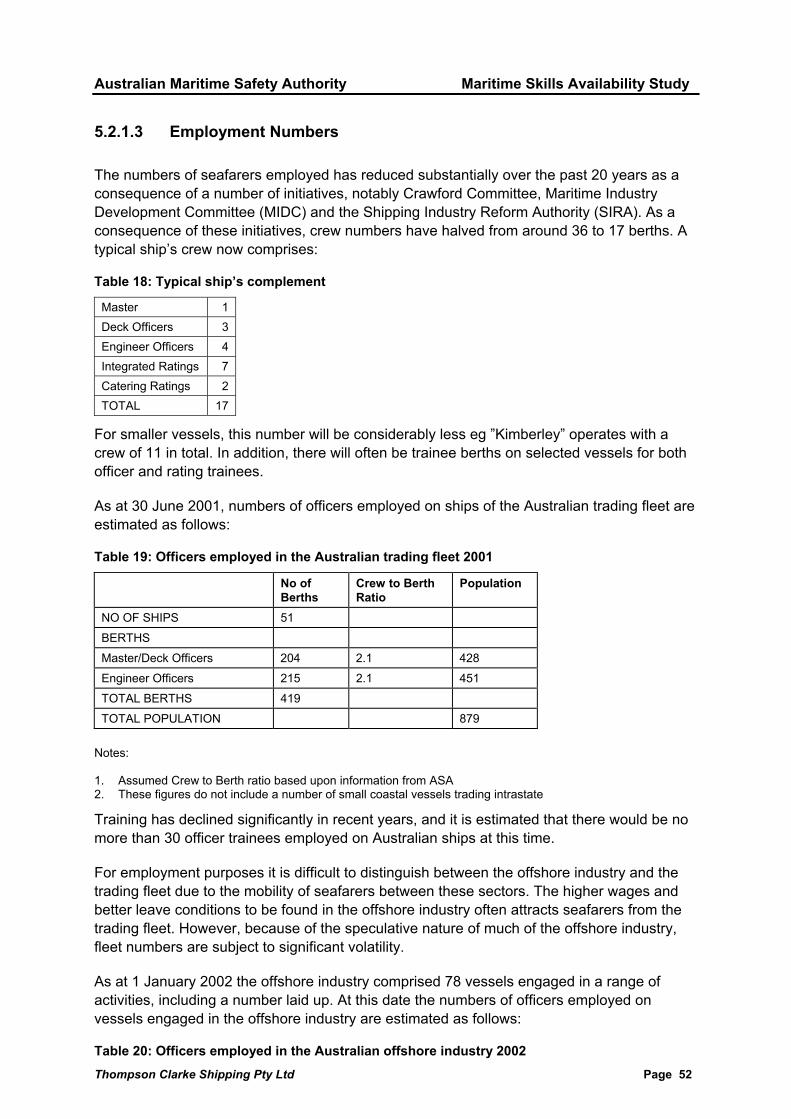
Australian Maritime Safety Authority Maritime Skills Availability Study
Thompson Clarke Shipping Pty Ltd Page 52
5.2.1.3 Employment Numbers
The numbers of seafarers employed has reduced substantially over the past 20 years as a consequence of a number of initiatives, notably Crawford Committee, Maritime Industry Development Committee (MIDC) and the Shipping Industry Reform Authority (SIRA). As a consequence of these initiatives, crew numbers have halved from around 36 to 17 berths. A typical ship’s crew now comprises:
Table 18: Typical ship’s complement
Master 1 Deck Officers 3 Engineer Officers 4 Integrated Ratings 7 Catering Ratings 2 TOTAL 17
For smaller vessels, this number will be considerably less eg ”Kimberley” operates with a crew of 11 in total. In addition, there will often be trainee berths on selected vessels for both officer and rating trainees.
As at 30 June 2001, numbers of officers employed on ships of the Australian trading fleet are estimated as follows:
Table 19: Officers employed in the Australian trading fleet 2001
No of Berths
Crew to Berth Ratio
Population
NO OF SHIPS 51 BERTHS Master/Deck Officers 204 2.1 428 Engineer Officers 215 2.1 451 TOTAL BERTHS 419 TOTAL POPULATION 879
Notes: 1. Assumed Crew to Berth ratio based upon information from ASA 2. These figures do not include a number of small coastal vessels trading intrastate
Training has declined significantly in recent years, and it is estimated that there would be no more than 30 officer trainees employed on Australian ships at this time.
For employment purposes it is difficult to distinguish between the offshore industry and the trading fleet due to the mobility of seafarers between these sectors. The higher wages and better leave conditions to be found in the offshore industry often attracts seafarers from the trading fleet. However, because of the speculative nature of much of the offshore industry, fleet numbers are subject to significant volatility.
As at 1 January 2002 the offshore industry comprised 78 vessels engaged in a range of activities, including a number laid up. At this date the numbers of officers employed on vessels engaged in the offshore industry are estimated as follows:
Table 20: Officers employed in the Australian offshore industry 2002
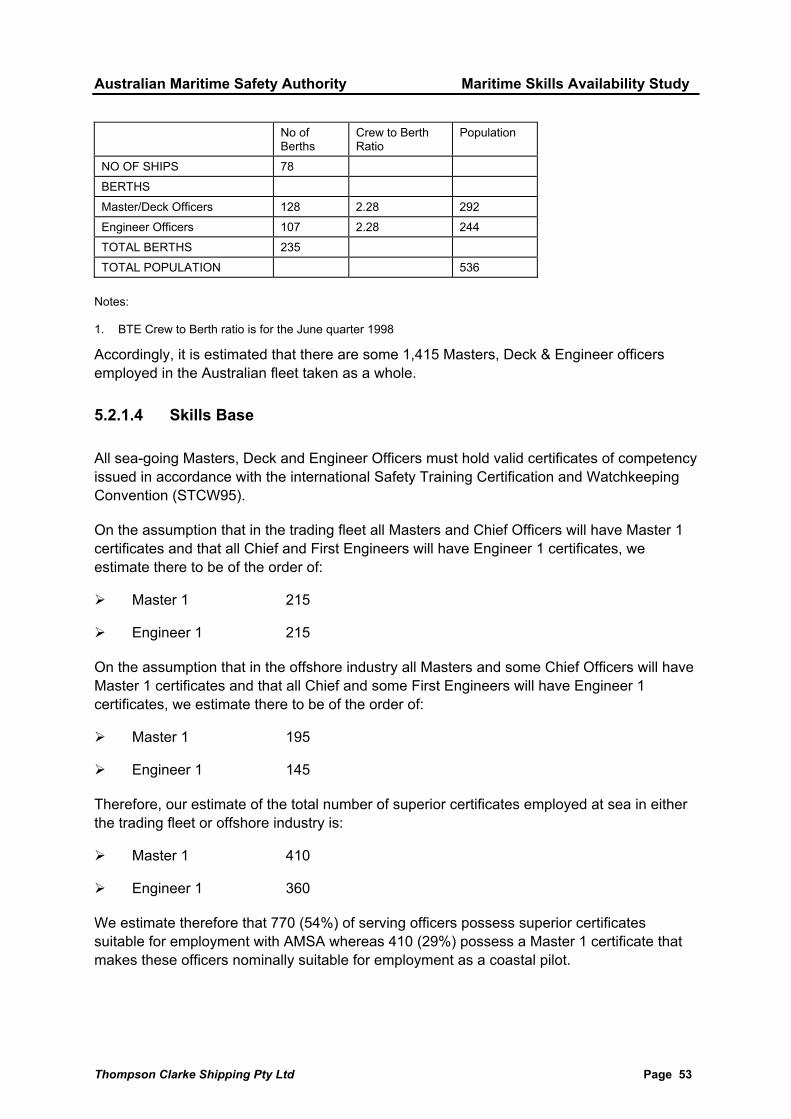
Australian Maritime Safety Authority Maritime Skills Availability Study
Thompson Clarke Shipping Pty Ltd Page 53
No of Berths
Crew to Berth Ratio
Population
NO OF SHIPS 78 BERTHS Master/Deck Officers 128 2.28 292 Engineer Officers 107 2.28 244 TOTAL BERTHS 235 TOTAL POPULATION 536
Notes: 1. BTE Crew to Berth ratio is for the June quarter 1998
Accordingly, it is estimated that there are some 1,415 Masters, Deck & Engineer officers employed in the Australian fleet taken as a whole.
5.2.1.4 Skills Base
All sea-going Masters, Deck and Engineer Officers must hold valid certificates of competency issued in accordance with the international Safety Training Certification and Watchkeeping Convention (STCW95).
On the assumption that in the trading fleet all Masters and Chief Officers will have Master 1 certificates and that all Chief and First Engineers will have Engineer 1 certificates, we estimate there to be of the order of:
Master 1 215
Engineer 1 215
On the assumption that in the offshore industry all Masters and some Chief Officers will have Master 1 certificates and that all Chief and some First Engineers will have Engineer 1 certificates, we estimate there to be of the order of:
Master 1 195
Engineer 1 145
Therefore, our estimate of the total number of superior certificates employed at sea in either the trading fleet or offshore industry is:
Master 1 410
Engineer 1 360
We estimate therefore that 770 (54%) of serving officers possess superior certificates suitable for employment with AMSA whereas 410 (29%) possess a Master 1 certificate that makes these officers nominally suitable for employment as a coastal pilot.

Australian Maritime Safety Authority Maritime Skills Availability Study
Thompson Clarke Shipping Pty Ltd Page 54
5.2.2 Port Authorities
5.2.2.1 Sector Description/Definition
Ports provide the intermodal interface between the sea carriage of passengers and cargo, and the land transport/storage/ production/ consumption of the same.
Traditionally ports were fully integrated providing a portfolio of services, both terminal operating and maritime. In Australia today, most are State Government corporations, and are landlord ports, ie they provide the infrastructure both in terms of wharves and berths and marine access (ie channels and navigation services) but little else with remaining services provided by private sector operators under leases or licenses from the port. In Victoria, the land facilities and the channels in Port Philip Bay are divided between the Port Corporations on the one hand and the Victorian Channels Authority on the other.
The ports sector is subject to all laws pertaining to Corporations, with few exceptions, primarily in WA (eg Fremantle which is still a State Authority), and in some case are subject to conforming to a Port Safety Operating Licence issued by the Minister (e.g. Sydney Ports Corporation). Owing to distance and inadequate land transport infrastructure and high operating costs, there is little competition between ports even those in the private sector such as Portland, Geelong and Hastings in Victoria. South Australian ports have recently been sold to the private sector, and Queensland Port Corporation operates many of the smaller more remote ports in the State.
Most are members of the Association of Australian Ports and Marine Authorities ("AAPMA").
5.2.2.2 Sector Composition
There are 48 commercial ports in Australia that handle more than 25,000 vessel calls annually and more than 0.5 billion mass tonnes of cargo.
5.2.2.3 Employment Numbers
These ports employed over 2,350 people in 1998, in a range of categories (management, marketing, property, marine and technical services).
5.2.2.4 Skills Base
A wide range of skills is required to operate these corporations, who are increasingly measured by their shareholders (public and private sector) in terms of revenue and profit generation, service standards, productivity and dividends. These skills range from business and strategic management through the highest levels of marine operations (safety, environment and cost efficiency) and infrastructure engineering.
Our estimate is that other than Marine Pilots there are 250 staff employed by Port Authorities with maritime related qualifications, of which approximately 100 will possess Master 1 qualifications in either managerial, harbour master, port traffic management or commercial roles.
Australian Maritime Safety Authority Maritime Skills Availability Study
Thompson Clarke Shipping Pty Ltd Page 55
5.2.3 Maritime Safety
5.2.3.1 Sector Description/Definition
Maritime Safety comprises those Commonwealth and State/NT regulatory agencies that oversee the safety of vessels within their jurisdiction.
For the purposes of this Study, TCS has focussed on the commercial vessel safety function within these agencies, rather than cast a wider net to catch recreational boating, search & rescue and marine pollution response functions. For the purpose of simplification, TCS has included the Commonwealth Department of Transport and Regional Services within this sector, including the Australian Transport Safety Bureau. In some instances the Maritime Safety agency is a distinct statutory body, whereas in others it is a division of a larger government department, usually Transport or Infrastructure.
5.2.3.2 Sector Composition
All States/NT and the Commonwealth have a maritime safety regulatory agency as follows:
Australian Maritime Safety Authority (AMSA)
Department of Transport and Regional Services
Marine Safety Victoria
Waterways Authority (NSW)
Queensland Transport
Department of Transport and Works (NT)
Department of Planning and Infrastructure (WA)
Department of Transport (SA)
Maritime Safety Tasmania
In some instances, the safety regulatory authority is delegated to third parties such as to Classification Societies or private sector Marine Surveyors.
5.2.3.3 Employment Numbers
We estimate that there are about 440 employed in Australia in the Maritime Safety sector, including AMSA.
5.2.3.4 Skills Base
Maritime Safety surveyors generally possess either a Master 1 or Engineer 1 certificate of competency in approximately equal proportion, together with a small number of naval architects, shipwrights and tradesmen. Most surveyors may possess other formal

Australian Maritime Safety Authority Maritime Skills Availability Study
Thompson Clarke Shipping Pty Ltd Page 56
qualifications eg such as a Graduate Certificate in Marine Surveying. However, it is noted that some State administrations are either outsourcing the survey function to the private sector or are recruiting surveyors from less traditional sources such as Defence.
Almost all surveyors have obtained some or all of their qualifications and sea-going experience in Australia.
We estimate there to be about 180 Maritime Safety personnel with maritime related qualifications comprising 65 x Master 1, 65 x Engineer 1, 20 x naval architects and 30 x other marine related qualifications.
5.2.4 Ship Repairers
5.2.4.1 Sector Description/Definition
This sector embraces those firms contracted by shipowners to perform hull and machinery repairs to vessels, including drydock and slipway operators. Unfortunately it is difficult to be precise in defining this sector as Ship Repairers also perform refits for Defence Force vessels and undertake general engineering work for clients outside the shipping industry.
5.2.4.2 Sector Composition
In servicing commercial shipping, the Ship Repair sector has been in decline for some years as a consequence of a number of factors:
Firms not keeping pace with changes in ship technology.
Increasing intervals between dockings.
Ship turnaround times reducing.
Low freight rates impacting on the available funds available to undertake ship repair.
Diminishing returns on investment in equipment and training in Ship Repair.
Declining Australian fleet.
The traditional marine engineering and repair firms in capital city ports have contracted substantially in recent years owing to the decline in demand to the extent that there is usually only one or two firms now operating in each port. Similarly, the number of operational drydocks and shiplifts has declined considerably.
5.2.4.3 Employment Numbers
It is estimated that there are of the order of 1,200 employed in the provision of Ship Repair services to the shipping industry in Australia.
Australian Maritime Safety Authority Maritime Skills Availability Study
Thompson Clarke Shipping Pty Ltd Page 57
5.2.4.4 Skills Base
Ship Repair requires similar trade skills to shipbuilding: fitters, boilermakers, welders, shipwrights, electricians. Additionally, some ship repair management and supervisory staff have marine engineering qualifications and experience. However, it is estimated that only about 50 will have marine engineering qualifications. Very few ship repair firms are taking on trade apprentices these days and the skills base is deteriorating as a consequence.
5.2.5 Ship Managers
5.2.5.1 Sector Description/Definition
Ship managers are contracted by ship owners to provide to a vessel all onboard services, crewing, storing, repair & maintenance, together with their shore supervision, for an agreed management fee.
Ship managers may be concerned solely with the management of third party tonnage or may manage third party tonnage in addition to their own.
Ship management is international in its coverage. However, in Australia, ship managers have traditionally restricted their activities to the management of Australian flag shipping, which has been mainly due to the industrial relations implications of operating ships with Australian crews. This distinction is changing, as some of Australia’s more significant ship managers are taking on a more international character eg Teekay and ASP. This change in emphasis is driven by a number of factors: a contracting Australian fleet, a greater concentration in this industry sector and a highly skilled ship management resource both at sea and onshore.
5.2.5.2 Sector Composition
Major Ship Managers of third party tonnage in Australia are:
ASP Ship Management
Teekay Shipping
Other than Teekay, the major international Ship Managers, such as Wallem, Denholm and Columbia, have yet to make inroads into the management of Australian flag tonnage. This situation could alter with the removal of cabotage or other changes in the industrial environment governing the employment of Australian crews.
5.2.5.3 Employment Numbers
It is estimated that a total of around 100 staff are employed by the major Australian Ship Managers.

Australian Maritime Safety Authority Maritime Skills Availability Study
Thompson Clarke Shipping Pty Ltd Page 58
5.2.5.4 Skills Base
Ship Managers employ highly skilled and well-qualified personnel to provide the level of shore supervision required by the Ship Management Agreements covering those vessels under third party management.
Typically, marine operational personnel have a minimum Master 1 and engineer superintendents have a minimum Engineer 1; personnel and industrial relations staff are likely to be tertiary qualified; senior financial managers will have professional accounting qualifications. All will be highly experienced in ship management operations.
It is estimated that there are 40 employed in ship management in Australia with sea-going experience and qualifications at Master 1 and Engineer 1 level.
5.2.6 Classification Societies
5.2.6.1 Sector Description/Definition
The role of the classification societies is to survey the standard of hull and machinery on commercial vessels in accordance with the rules of the society with whom a particular vessel is “classed”. Additionally, certain of the major classification societies in Australia are delegated to issue certain maritime safety related certificates to Australian registered vessels on behalf of AMSA.
5.2.6.2 Sector Composition
Whereas classification societies are based in their country of origin being the world’s principal ship operating countries, they are truly international organisations, which is reflective of the international nature of shipping. In Australia, all major classification societies are represented either by way of in-house surveyors working from strategic locations around the country or through third party “non-exclusive” surveyors.
Principal classification societies represented in Australia are:
American Bureau of Shipping
Det Norske Veritas
Lloyds Register of Shipping
Other classification societies with a smaller country office in Australia and correspondingly fewer surveyors are:
Bureau Veritas
Germanisher Lloyd
Nippon Kaiji Kyokai
The latter tend to rely on the use of non-exclusive surveyors at ports around Australia.
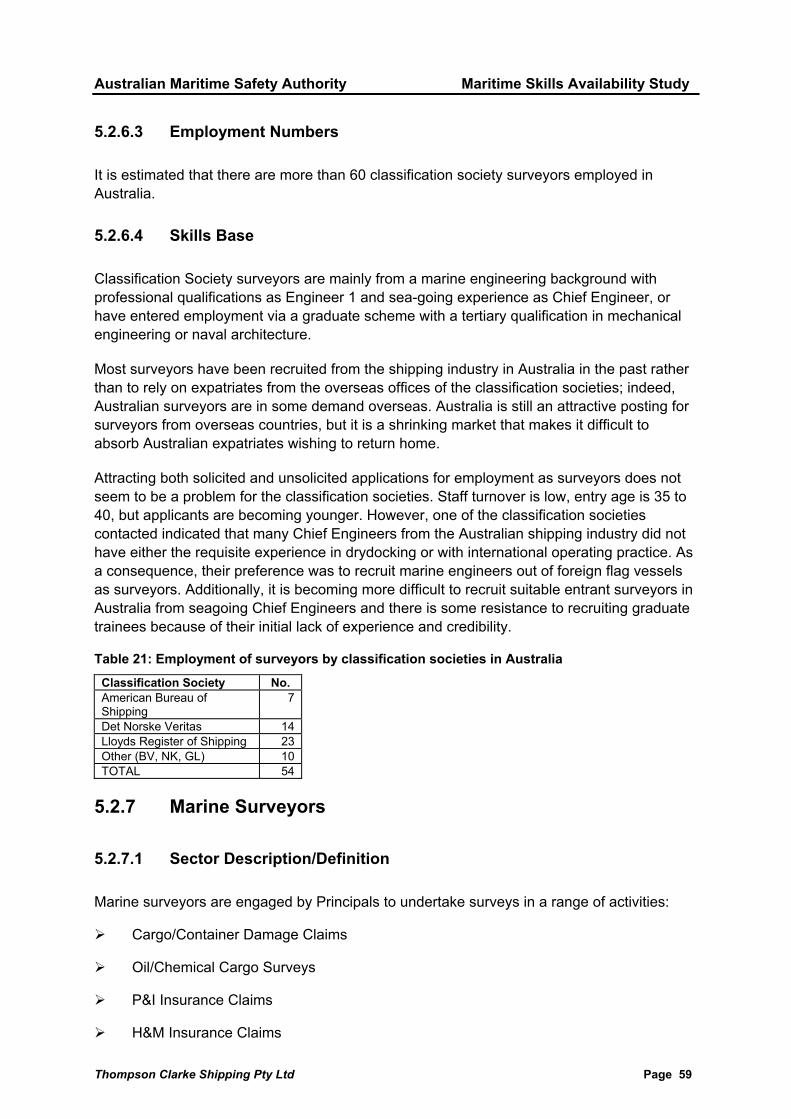
Australian Maritime Safety Authority Maritime Skills Availability Study
Thompson Clarke Shipping Pty Ltd Page 59
5.2.6.3 Employment Numbers
It is estimated that there are more than 60 classification society surveyors employed in Australia.
5.2.6.4 Skills Base
Classification Society surveyors are mainly from a marine engineering background with professional qualifications as Engineer 1 and sea-going experience as Chief Engineer, or have entered employment via a graduate scheme with a tertiary qualification in mechanical engineering or naval architecture.
Most surveyors have been recruited from the shipping industry in Australia in the past rather than to rely on expatriates from the overseas offices of the classification societies; indeed, Australian surveyors are in some demand overseas. Australia is still an attractive posting for surveyors from overseas countries, but it is a shrinking market that makes it difficult to absorb Australian expatriates wishing to return home.
Attracting both solicited and unsolicited applications for employment as surveyors does not seem to be a problem for the classification societies. Staff turnover is low, entry age is 35 to 40, but applicants are becoming younger. However, one of the classification societies contacted indicated that many Chief Engineers from the Australian shipping industry did not have either the requisite experience in drydocking or with international operating practice. As a consequence, their preference was to recruit marine engineers out of foreign flag vessels as surveyors. Additionally, it is becoming more difficult to recruit suitable entrant surveyors in Australia from seagoing Chief Engineers and there is some resistance to recruiting graduate trainees because of their initial lack of experience and credibility.
Table 21: Employment of surveyors by classification societies in Australia Classification Society No. American Bureau of Shipping
7
Det Norske Veritas 14 Lloyds Register of Shipping 23 Other (BV, NK, GL) 10 TOTAL 54
5.2.7 Marine Surveyors
5.2.7.1 Sector Description/Definition
Marine surveyors are engaged by Principals to undertake surveys in a range of activities:
Cargo/Container Damage Claims
Oil/Chemical Cargo Surveys
P&I Insurance Claims
H&M Insurance Claims
Australian Maritime Safety Authority Maritime Skills Availability Study
Thompson Clarke Shipping Pty Ltd Page 60
On/Off Hire Surveys
Small Craft Surveys
Non-exclusive Classification Society Surveys
Draft Surveys
Compass Adjusting
Marine surveyors may be engaged by shipowner, insurance or cargo interests. Approximately 70% of the marine surveyor's work involves assessing cargo claims.
Anecdotal research suggests that demand for the services of marine surveyors is declining.
5.2.7.2 Sector Composition
Most marine surveyors are either sole practitioners or small companies of 2 or 3 surveyors operating in a particular port or in a group of regional ports. Marine surveying firms of significance that operate on a national basis are:
Intertec Oil/Chemical Cargoes
SGS Oil/Chemical Cargoes
McLarens Toplis Insurance
It is estimated that 50% of marine surveyors are members of the Australian Institute of Marine Surveyors ("AIMS").
5.2.7.3 Employment Numbers
Our research puts the number of AIMS members at around 90 that would place the approximate number of marine surveyors in Australia at around 180. However, many of these are retired or else operating in a part-time capacity.
5.2.7.4 Skills Base
It is a condition of membership of AIMS that Marine Surveyors have either a Master 1, Engineer 1 or equivalent together with appropriate experience as a marine surveyor. Additionally, AIMS are currently developing a Graduate Certificate in Marine Surveying course in conjunction with the Australian Maritime College. Of the active surveyors only around 10% are marine engineers.

Australian Maritime Safety Authority Maritime Skills Availability Study
Thompson Clarke Shipping Pty Ltd Page 61
5.2.8 Maritime Education
5.2.8.1 Sector Description/Definition
Maritime Education comprises those organisations in Australia that provide education and training to Australian seafarers and others engaged in the shipping industry in Australia.
5.2.8.2 Sector Composition
The Australian Maritime College (“AMC”) was established by a Commonwealth Act of Parliament in 1978 as an autonomous national institution for tertiary education of persons who wish to become, or are otherwise engaged in connection with, the shipping or the fishing industry. The AMC may also conduct on behalf of the Commonwealth short courses of maritime training and examinations and assessments for marine competency in accordance with the Navigation Act 1912 ie certificates of competency, revalidation certificates, certificates of proficiency, certificate endorsements.
Apart from certificate of competency courses, AMC also offers a broad range of tertiary courses in commercial shipping ranging from Certificate courses to PhD and Masters degrees as well as operational short courses for seafarers.
Importantly, as an institution recognised as a world leader in maritime education and training, AMC is an export earner in providing full fee education to overseas students.
Apart from the AMC, regional maritime education establishments are located at:
Fremantle TAFE
Sydney Technical College
Hunter Institute Newcastle
These institutions are more concerned with delivering certificates of competency, including lower grade certificates.
Commercial shipping courses are also available through the Australian Chamber of Shipping and the Australian Institute of Export.
5.2.8.3 Employment Numbers
In the delivery of commercial shipping and sea-going qualifications, our research indicates that there is around 100 persons engaged full time in the delivery of marine education in Australia. This number will be supported by a similar number of administrative, library and residential staff.

Australian Maritime Safety Authority Maritime Skills Availability Study
Thompson Clarke Shipping Pty Ltd Page 62
5.2.8.4 Skills Base
Those engaged in the delivery of maritime education are highly qualified. Typically a Lecturer in this area will have professional qualifications as Master 1 or Engineer 1 together with graduate tertiary or teaching qualifications.
Australian Maritime Safety Authority Maritime Skills Availability Study
Thompson Clarke Shipping Pty Ltd Page 63
It is worth noting the background of those delivering maritime education. Of the lecturing staff on the Faculty of Maritime Transport & Engineering at AMC in 1998:
56% trained in Australia
20% trained in a mix of Australia and overseas
24% trained solely overseas
It is apparent therefore that maritime education in Australia is heavily reliant on recruiting academic staff developed in Australia and who have served on Australian flag vessels.
5.2.9 Harbour Towage
5.2.9.1 Sector Description/Definition
The provision of harbour towage services at Australian ports is an essential service to facilitate the safe movement of ships and their cargoes. Tugs are required to berth and unberth all but the smallest commercial vessels. Tugs are ordered to attend a vessel by the ship’s agent in accordance with the pilot's or master’s requirements.
5.2.9.2 Sector Composition
In recent years the towage industry has become highly concentrated following the withdrawal of operators from a number of major ports: McIlwraith McEacharn from Melbourne, Westernport and Dalrymple Bay, P&O from Fremantle/Kwinana, Brambles from NSW, BHP from Newcastle and, most recently, Howard Smith from all its Australian and overseas towage operations. As a consequence, the Australian towage industry is now a virtual monopoly of Adsteam Marine at the majority of major Australian ports. Apart from these two major operators, Brambles service Tasmanian ports and Portland through North West Shipping & Towage and the mining and oil/gas companies provide in-house towage services at a number of bulk exporting ports, particularly in Western Australia. There are around 120 harbour tugs located at ports around Australia.
5.2.9.3 Employment Numbers
The size of a tug’s crew has been significantly reduced in recent years from as many as 8/crew to an industry norm of 3/crew comprising Tug Master x 1, Engineer x 1, Rating x 1. These manning reductions and changes to the roster system have taken time to achieve, but have not been accompanied by major industrial disruption.
TCS has been unable to obtain precise information from towage operators on the number of tug crews employed. For the purposes of estimation, TCS has used 120 tugs at 3 berths/tug and applied a crew to berth ratio of 2.25. On this basis it is estimated that there are around 810 employed as tug crews around Australia (ie 270 in each category) with a further 90 employed in shore administration.
Australian Maritime Safety Authority Maritime Skills Availability Study
Thompson Clarke Shipping Pty Ltd Page 64
5.2.9.4 Skills Base
Tug Masters are traditionally recruited from either the Australian sea-going fleet, the offshore industry or from vessels engaged in port operations. As a consequence, the qualifications of Tug Masters tend to be a mix of Master 1 through to Master IV qualifications. In contrast, Tug Engineers tend to come from the sea going fleet and many will hold Engineer 1 certificates of competency.
The towage industry is now following a structured recruitment policy involving such selection techniques as psychological testing in order to identify those recruits that are best suited to make the best Tug Masters; these may not necessarily be from the sea going fleet or hold a Master 1 certificate.
Shore based operational management tend to be a mix of executives with Master 1 and Engineer 1 qualifications. Other administrative staff usually have a background in towage or shipping and may have professional qualifications.
Our estimate is that around 580 will have maritime related qualifications, but not all will be superior certificates. We estimate there to be of the order of 100 holders of a Master 1 to be employed as Tug Masters, 150 holders of Engineer 1 and, say, 10 Master 1/Engineer 1 in shore based positions.
5.2.10 Pilotage Services
5.2.10.1 Sector Description/Definition
Harbour pilots provide pilotage services to trading vessels calling at all Australian commercial ports generally on a fee for service basis. Pilotage is generally compulsory at all Australian ports, except where the Master of an Australian registered vessel is in possession of a valid Pilotage Exemption Certificate.
In addition to harbour pilots, there are Torres Strait and Great Barrier Reef marine pilots engaged to assist vessels in navigating these hazardous and environmentally sensitive waters. Pilotage is compulsory for the Inner Route between Cairns and Cape York and for Hydrographers Passage on all vessels of 70 metres or more in length and all loaded oil, chemical and gas tankers utilising the services of pilots licensed by AMSA.
5.2.10.2 Sector Composition
Harbour pilots are licensed by the State/NT marine regulatory or port authority and, dependent upon the circumstances that apply at the particular port, are employed by:
Pilotage companies
Port authorities/corporations
Port operating companies (private ports, mining & oil companies)

Australian Maritime Safety Authority Maritime Skills Availability Study
Thompson Clarke Shipping Pty Ltd Page 65
Whereas Port Phillip Sea Pilots have been established as a private sector supplier of pilotage services to Melbourne, Geelong and Hastings since 1839, there has been a trend in recent years as major ports are progressively corporatised and otherwise commercialised for harbour pilotage to be outsourced to private sector pilotage companies eg Sydney, Fremantle, Brisbane.
5.2.10.3 Employment Numbers
TCS estimated that there were 250 marine pilots in Australia in 1999. It is thought that this number has remained relatively unchanged. This figure does not include harbour masters and port managers who perform occasional pilotage duties.
Table 22: Marine Pilotage in Australia
State/NT No. Victoria 31 Port Phillip (private pilotage company)
Portland (private port operator) 30 1
New South Wales 30 Sydney (private pilotage company) Port Corporations
17 13
South Australia 16 SA PortsCorp Private port operators
11 5
Western Australia 42 Fremantle (private pilotage company) Regional port authorities Private port operators/pilotage companies
10 16 16
Northern Territory 4 Darwin Port Authority Private port operators
2 2
Queensland 46 Brisbane (private pilotage company) Bundaberg (pilotage contract) Port Corporations Queensland Department of Transport
24 1 9
12 Tasmania 11 Port Corporations
Private port operator 10 1
Barrier Reef 70 Australian Reef Pilots Coastal Pilots Hydro Pilots
35 32 3
Total 250
5.2.10.4 Skills Base
Prerequisite qualifications for becoming a harbour pilot are a valid Master 1 Certificate of Competency, command experience and a Pilotage Exemption Certificate for the port concerned. Largely as a consequence of the latter requirement, Pilots have traditionally been recruited from the Australian shipping industry, rather than from overseas. Anecdotally, the preference would appear to be to continue to rely on this pool of domestic expertise, because of the familiarity that Australian ship’s masters have with local pilotage, towage and harbour control conditions.
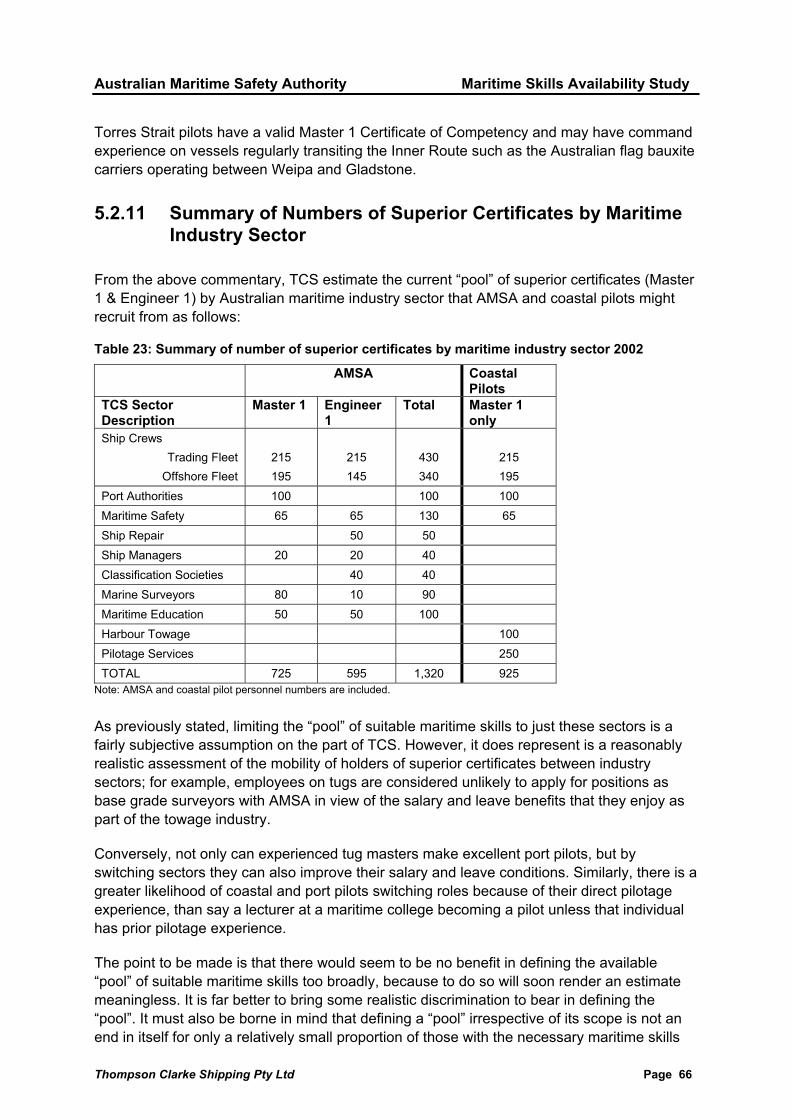
Australian Maritime Safety Authority Maritime Skills Availability Study
Thompson Clarke Shipping Pty Ltd Page 66
Torres Strait pilots have a valid Master 1 Certificate of Competency and may have command experience on vessels regularly transiting the Inner Route such as the Australian flag bauxite carriers operating between Weipa and Gladstone.
5.2.11 Summary of Numbers of Superior Certificates by Maritime Industry Sector
From the above commentary, TCS estimate the current “pool” of superior certificates (Master 1 & Engineer 1) by Australian maritime industry sector that AMSA and coastal pilots might recruit from as follows:
Table 23: Summary of number of superior certificates by maritime industry sector 2002
AMSA Coastal Pilots
TCS Sector Description
Master 1 Engineer 1
Total Master 1 only
Ship Crews Trading Fleet
Offshore Fleet
215 195
215 145
430 340
215 195
Port Authorities 100 100 100 Maritime Safety 65 65 130 65 Ship Repair 50 50 Ship Managers 20 20 40 Classification Societies 40 40 Marine Surveyors 80 10 90 Maritime Education 50 50 100 Harbour Towage 100 Pilotage Services 250 TOTAL 725 595 1,320 925
Note: AMSA and coastal pilot personnel numbers are included.
As previously stated, limiting the “pool” of suitable maritime skills to just these sectors is a fairly subjective assumption on the part of TCS. However, it does represent is a reasonably realistic assessment of the mobility of holders of superior certificates between industry sectors; for example, employees on tugs are considered unlikely to apply for positions as base grade surveyors with AMSA in view of the salary and leave benefits that they enjoy as part of the towage industry.
Conversely, not only can experienced tug masters make excellent port pilots, but by switching sectors they can also improve their salary and leave conditions. Similarly, there is a greater likelihood of coastal and port pilots switching roles because of their direct pilotage experience, than say a lecturer at a maritime college becoming a pilot unless that individual has prior pilotage experience.
The point to be made is that there would seem to be no benefit in defining the available “pool” of suitable maritime skills too broadly, because to do so will soon render an estimate meaningless. It is far better to bring some realistic discrimination to bear in defining the “pool”. It must also be borne in mind that defining a “pool” irrespective of its scope is not an end in itself for only a relatively small proportion of those with the necessary maritime skills

Australian Maritime Safety Authority Maritime Skills Availability Study
Thompson Clarke Shipping Pty Ltd Page 67
will wish to pursue careers with either AMSA or coastal pilots. The issue is that if the overall size of this “pool” of maritime skills declines, then this must also diminish the standard and potential number of suitable applicants for employment with either AMSA or coastal pilots.
5.3 Maritime Officer Union Membership
In so far as employment with either AMSA or coastal pilots is concerned given the likely industry sectors that personnel will be recruited from, data on maritime officer union membership provides a good approximation of the available “pool” of maritime skills in Australia given the high level of union membership particularly amongst sea-going employees.
5.3.1 Australian Maritime Officers Union
The Australian Maritime Officers Union (“AMOU”) represents the interests of Masters, deck officers and stevedores in Australia. The AMOU has been particularly helpful in providing a profile of its membership by number, age, certificate held, location by State and type of employment.
Total AMOU membership is around 1,900.The profile AMOU members holding unlimited certificates of competency is as follows:
Table 24: AMOU membership profile
MASTER CLASS 1 AGE GROUPS
STATE < 20 20-25 26-30 31-40 41-50 51-55 > 55 TOTA
L NSW 2 25 65 24 73 189 Q’LAND 2 16 51 27 45 141 W.A. 10 25 12 27 74 S.A. 2 12 5 21 40 VICTORIA 9 37 17 26 89 TASMANIA 1 13 10 4 10 38 NT 1 1 2 3 7 NEW ZEALAND 1 1 2 TOTAL 5 76 202 92 205 580
DIVISION
PORT 1 5 6 OFFSHORE 5 53 137 49 106 350 PORT & MARINE 3 15 4 18 40 TUG 8 12 21 22 63 STEVEDORING 1 9 2 13 25 RADIO OFFICER PILOTS 11 30 15 40 96 TOTAL 5 76 203 92 204 580

Australian Maritime Safety Authority Maritime Skills Availability Study
Thompson Clarke Shipping Pty Ltd Page 68
1ST MATE OR CHIEF MATE CLASS 1
AGE GROUPS
STATE
< 20 20-25 26-30 31-40 41-50 51-55 > 55 TOTAL
NSW 4 5 2 2 3 16 Q’LAND 8 9 4 1 6 29 W.A. 3 3 2 8 S.A. 1 1 1 3 VICTORIA 2 6 3 2 13 TASMANIA 6 7 1 14 TOTAL 23 31 11 6 12 83
DIVISION
PORT 3 1 4 OFFSHORE 23 28 11 4 10 76 PORT & MARINE TUG 1 1 STEVEDORING 2 2 RADIO OFFICER PILOTS INACTIVE TOTAL 23 31 11 6 12 83
SECOND MATE CLASS 1
AGE GROUPS STATE < 20 20-25 26-30 31-40 41-50 51-55 >55 TOTA
L NSW 9 15 5 4 33 Q’LAND 1 2 12 7 2 6 30 W.A. 2 3 4 4 2 3 18 S.A. 2 3 5 VICTORIA 3 6 9 3 3 2 26 TASMANIA 3 7 5 1 1 17 TOTAL 9 27 47 23 8 15 129
DIVISION
PORT 1 2 3 OFFSHORE 9 27 46 18 4 10 114 PORT & MARINE TUG 4 2 2 8 STEVEDORING 1 1 2 RADIO OFFICER 1 1 PILOTS INACTIVE 1 1 TOTAL 9 27 47 23 8 15 129
The above membership figures relate only to holders of unlimited certificates. No analysis has been undertaken Master Class II through to Master V, Coxswain and MED certificates as these are likely to be irrelevant to employment by either AMSA or coastal pilots. Second Mate and Chief Mate certificates have been analysed as some, but not all, of the holders of these junior grades of certificates are more likely to make the progression to Master 1.
If these figures are aggregated then the AMOU membership profile can be described in the following terms:
Table 25: Location of AMOU membership

Australian Maritime Safety Authority Maritime Skills Availability Study
Thompson Clarke Shipping Pty Ltd Page 69
LOCATION 2nd Mate 1st Mate Master 1
Total %
NSW 33 16 189 238 30
QLD 30 29 141 200 25
VIC 26 13 89 128 15
WA 18 8 74 100 13
TAS 17 14 38 69 9
SA 5 3 40 48 6
NT - - 7 7 <1
NZ - - 2 2 <1
Total 129 83 580 792 100
The distribution of AMOU members throughout Australia is largely as might be expected to reflect the overall population distribution, economic activity and maritime activity. However, it is noted that:
Tasmania supports a membership out of proportion to its population that is considered to be as a consequence of the location of the Australian Maritime College and relatively affordable housing for deck officers employed in the trading and offshore industry who do not have to be located proximate to their work.
South Australia has relatively few junior grades of certificate when compared to other States and to the number of Master 1 in South Australia.
Table 26: Employment of AMOU membership
EMPLOYMENT 2nd Mate 1st Mate Master 1
Total %
Offshore 114 76 350 540 68
Pilots - - 96 96 12
Tugs 8 1 63 72 9
Ports & Marine - - 40 40 5
Ports 3 4 6 13 1
Stevedoring 2 2 25 29 4
Radio Officer 1 - - 1 <1
Inactive 1 - - 1 <1
Total 129 83 580 792 100
The employment of members is largely as might be expected with the majority (68%) employed in the Offshore division of the AMOU at sea on trading or offshore industry vessels. It needs to be borne in mind that the figure of 540 in the Offshore division relates to holders of unlimited certificates only. There are a further 223 members engaged in the Offshore division that hold lesser grade certificates, providing at total membership of the Offshore division of 773, which compares to TCS estimate of 720. AMOU membership in the Offshore division holding Master 1 certificates of 350 compares to TCS estimate of 410.
Table 27: Age Profile of AMOU membership
AGE PROFILE
2nd Mate 1st Mate Master 1
Total %
< 20 - - - - 0
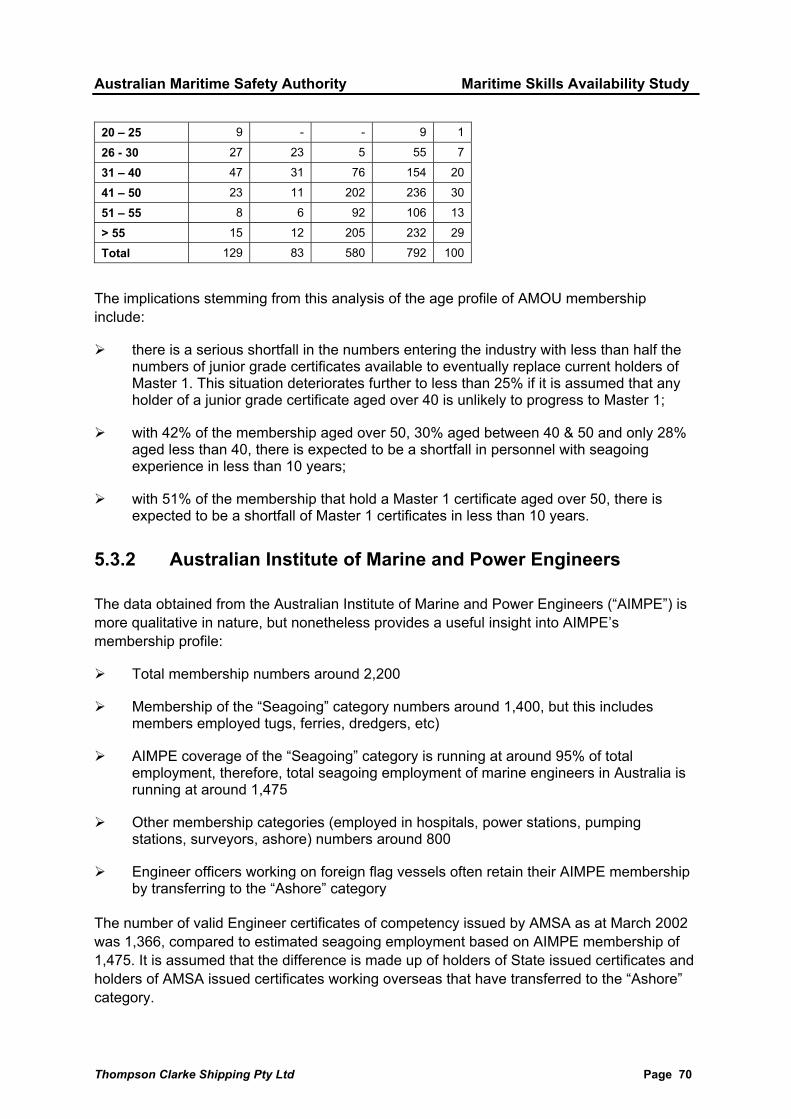
Australian Maritime Safety Authority Maritime Skills Availability Study
Thompson Clarke Shipping Pty Ltd Page 70
20 – 25 9 - - 9 1
26 - 30 27 23 5 55 7
31 – 40 47 31 76 154 20
41 – 50 23 11 202 236 30
51 – 55 8 6 92 106 13
> 55 15 12 205 232 29
Total 129 83 580 792 100
The implications stemming from this analysis of the age profile of AMOU membership include:
there is a serious shortfall in the numbers entering the industry with less than half the numbers of junior grade certificates available to eventually replace current holders of Master 1. This situation deteriorates further to less than 25% if it is assumed that any holder of a junior grade certificate aged over 40 is unlikely to progress to Master 1;
with 42% of the membership aged over 50, 30% aged between 40 & 50 and only 28% aged less than 40, there is expected to be a shortfall in personnel with seagoing experience in less than 10 years;
with 51% of the membership that hold a Master 1 certificate aged over 50, there is expected to be a shortfall of Master 1 certificates in less than 10 years.
5.3.2 Australian Institute of Marine and Power Engineers
The data obtained from the Australian Institute of Marine and Power Engineers (“AIMPE”) is more qualitative in nature, but nonetheless provides a useful insight into AIMPE’s membership profile:
Total membership numbers around 2,200
Membership of the “Seagoing” category numbers around 1,400, but this includes members employed tugs, ferries, dredgers, etc)
AIMPE coverage of the “Seagoing” category is running at around 95% of total employment, therefore, total seagoing employment of marine engineers in Australia is running at around 1,475
Other membership categories (employed in hospitals, power stations, pumping stations, surveyors, ashore) numbers around 800
Engineer officers working on foreign flag vessels often retain their AIMPE membership by transferring to the “Ashore” category
The number of valid Engineer certificates of competency issued by AMSA as at March 2002 was 1,366, compared to estimated seagoing employment based on AIMPE membership of 1,475. It is assumed that the difference is made up of holders of State issued certificates and holders of AMSA issued certificates working overseas that have transferred to the “Ashore” category.
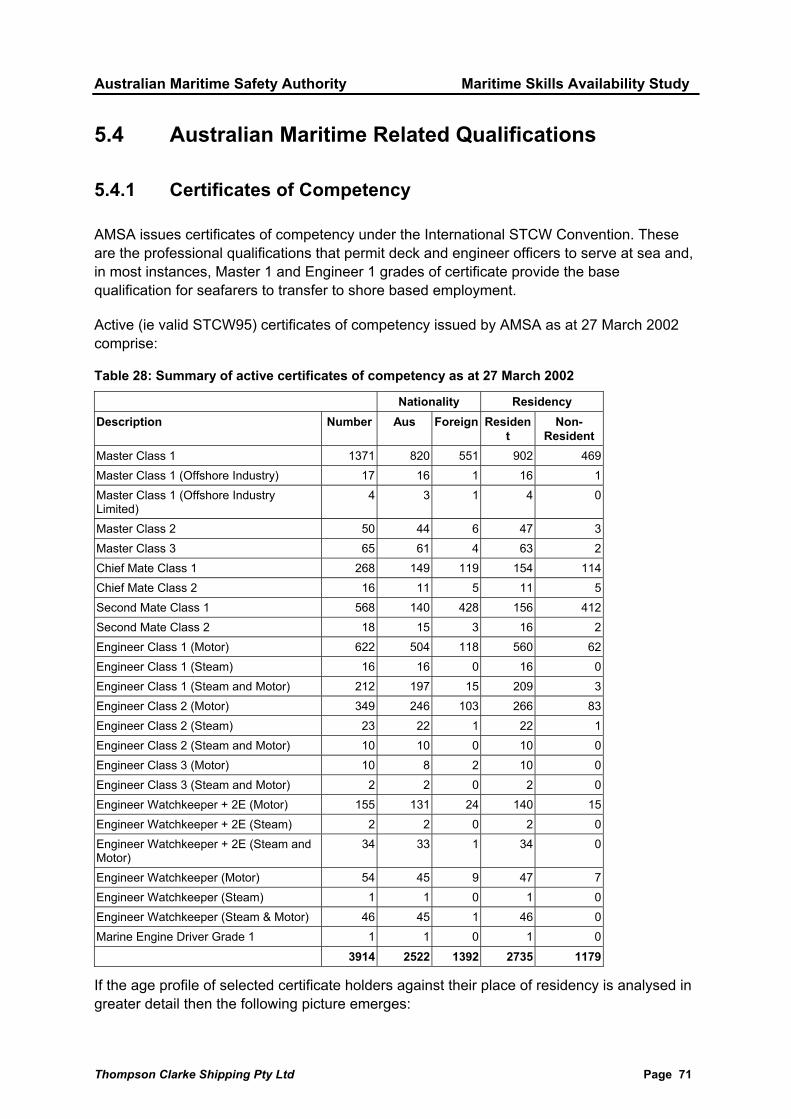
Australian Maritime Safety Authority Maritime Skills Availability Study
Thompson Clarke Shipping Pty Ltd Page 71
5.4 Australian Maritime Related Qualifications
5.4.1 Certificates of Competency
AMSA issues certificates of competency under the International STCW Convention. These are the professional qualifications that permit deck and engineer officers to serve at sea and, in most instances, Master 1 and Engineer 1 grades of certificate provide the base qualification for seafarers to transfer to shore based employment.
Active (ie valid STCW95) certificates of competency issued by AMSA as at 27 March 2002 comprise:
Table 28: Summary of active certificates of competency as at 27 March 2002
Nationality Residency Description Number Aus Foreign Residen
t Non-
Resident Master Class 1 1371 820 551 902 469 Master Class 1 (Offshore Industry) 17 16 1 16 1 Master Class 1 (Offshore Industry Limited)
4 3 1 4 0
Master Class 2 50 44 6 47 3 Master Class 3 65 61 4 63 2 Chief Mate Class 1 268 149 119 154 114 Chief Mate Class 2 16 11 5 11 5 Second Mate Class 1 568 140 428 156 412 Second Mate Class 2 18 15 3 16 2 Engineer Class 1 (Motor) 622 504 118 560 62 Engineer Class 1 (Steam) 16 16 0 16 0 Engineer Class 1 (Steam and Motor) 212 197 15 209 3 Engineer Class 2 (Motor) 349 246 103 266 83 Engineer Class 2 (Steam) 23 22 1 22 1 Engineer Class 2 (Steam and Motor) 10 10 0 10 0 Engineer Class 3 (Motor) 10 8 2 10 0 Engineer Class 3 (Steam and Motor) 2 2 0 2 0 Engineer Watchkeeper + 2E (Motor) 155 131 24 140 15 Engineer Watchkeeper + 2E (Steam) 2 2 0 2 0 Engineer Watchkeeper + 2E (Steam and Motor)
34 33 1 34 0
Engineer Watchkeeper (Motor) 54 45 9 47 7 Engineer Watchkeeper (Steam) 1 1 0 1 0 Engineer Watchkeeper (Steam & Motor) 46 45 1 46 0 Marine Engine Driver Grade 1 1 1 0 1 0 3914 2522 1392 2735 1179
If the age profile of selected certificate holders against their place of residency is analysed in greater detail then the following picture emerges:
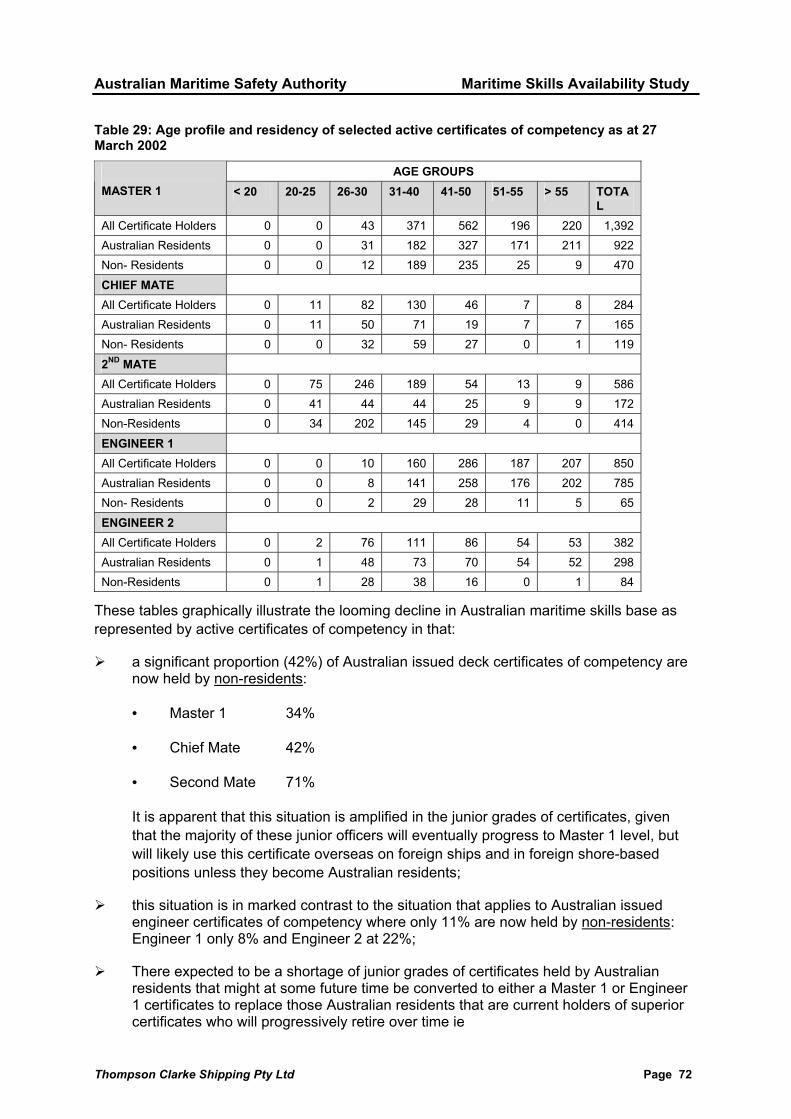
Australian Maritime Safety Authority Maritime Skills Availability Study
Thompson Clarke Shipping Pty Ltd Page 72
Table 29: Age profile and residency of selected active certificates of competency as at 27 March 2002
AGE GROUPS MASTER 1 < 20 20-25 26-30 31-40 41-50 51-55 > 55 TOTA
L All Certificate Holders 0 0 43 371 562 196 220 1,392 Australian Residents 0 0 31 182 327 171 211 922 Non- Residents 0 0 12 189 235 25 9 470 CHIEF MATE All Certificate Holders 0 11 82 130 46 7 8 284 Australian Residents 0 11 50 71 19 7 7 165 Non- Residents 0 0 32 59 27 0 1 119 2ND MATE All Certificate Holders 0 75 246 189 54 13 9 586 Australian Residents 0 41 44 44 25 9 9 172 Non-Residents 0 34 202 145 29 4 0 414 ENGINEER 1 All Certificate Holders 0 0 10 160 286 187 207 850 Australian Residents 0 0 8 141 258 176 202 785 Non- Residents 0 0 2 29 28 11 5 65 ENGINEER 2 All Certificate Holders 0 2 76 111 86 54 53 382 Australian Residents 0 1 48 73 70 54 52 298 Non-Residents 0 1 28 38 16 0 1 84
These tables graphically illustrate the looming decline in Australian maritime skills base as represented by active certificates of competency in that:
a significant proportion (42%) of Australian issued deck certificates of competency are now held by non-residents:
• Master 1 34%
• Chief Mate 42%
• Second Mate 71%
It is apparent that this situation is amplified in the junior grades of certificates, given that the majority of these junior officers will eventually progress to Master 1 level, but will likely use this certificate overseas on foreign ships and in foreign shore-based positions unless they become Australian residents;
this situation is in marked contrast to the situation that applies to Australian issued engineer certificates of competency where only 11% are now held by non-residents: Engineer 1 only 8% and Engineer 2 at 22%;
There expected to be a shortage of junior grades of certificates held by Australian residents that might at some future time be converted to either a Master 1 or Engineer 1 certificates to replace those Australian residents that are current holders of superior certificates who will progressively retire over time ie

Australian Maritime Safety Authority Maritime Skills Availability Study
Thompson Clarke Shipping Pty Ltd Page 73
• Master 1: 922 active, but only 447 active junior certificates (48%)
• Engineer 1: 785 active, but only 581 active junior certificates (74%)
the age profile of Australian resident holders of certificates :
• with 41% of Australian residents that hold Master 1 certificates aged over 50, and a further 35% aged over 40, there may be a shortfall of these skilled Australian resident certificate holders in less than 10 years;
• with 48% of Australian residents that hold Engineer 1 certificates aged over 50, and a further 33% aged over 40, there may be a shortfall of these skilled Australian resident certificate holders in less than 10 years;
• the shortage of Engineer 1 qualifications is expected to be exacerbated when it is considered that 59% of Australian residents that hold Engineer 2 qualifications are aged over 50, and therefore unlikely to progress to an Engineer 1 level.
However, the above figures refer to active or valid certificates where the holders are employed in positions where possession of a valid certificate is a pre-condition of employment such as at sea or as a pilot. There will be a significant number of individuals in Australia that may have obtained a certificate following the requisite sea service, then entered a shore based position where the maintenance of the validity is no longer required.
Table 30: No. of Seafarers with valid STCW78 certificates who did not upgrade to STCW95
Certificate Number Resident % Resident Master Class 1 270 157 58% Master Class 2 2 2 100% Master Class 3 22 22 100% Chief Mate Class 1 39 26 67% Second Mate Class 1 147 23 16% Second Mate Class 2 2 1 50% Engineer Class 1 (Motor) 68 53 78% Engineer Class 1 (Steam) 1 1 100% Engineer Class 1 (Steam and Motor) 46 45 98% Engineer Class 2 (Motor) 48 38 79% Engineer Class 2 (Steam) 1 1 100% Engineer Class 2 (Steam and Motor) 4 4 100% Engineer Class 3 (Motor) 12 12 100% Engineer Watchkeeper + 2E (Motor) 69 50 72% Engineer Watchkeeper + 2E (Steam) 1 1 100% Engineer Watchkeeper + 2E (Steam and Motor) 7 7 100% Engineer Watchkeeper (Motor) 3 3 100% Engineer Watchkeeper (Steam & Motor) 1 1 100% Totals 743 447 60%
Australian Maritime Safety Authority Maritime Skills Availability Study
Thompson Clarke Shipping Pty Ltd Page 74
Of those seafarers that did not revalidate to STCW95 by 31 January 2002, some of these:
may yet upgrade;
who are not resident may have converted to the qualifications of another Flag state;
may have transferred to shore based positions that do not require a valid certificate;
may have left the shipping industry altogether;
may have died.
It is to be noted the high number of non-resident holders of Master 1 and Second Mate 1 that elected not to revalidate their Australian issued certificates to STCW95, which would tend to indicate that many are now working overseas and have converted to the qualifications of another Flag state.
However, potentially there are some 256 expired superior certificates amongst Australian residents, in addition to the pool of active or valid certificates previously referred to, comprising:
Master 1 157
Engineer 1 99
However, if these numbers are discounted by 50% representing a reasonable estimate of:
younger holders aged less than 35 that are still to revalidate their certificates to STCW95, and
older holders aged greater than 55 who are unlikely to gain employment with AMSA
then the numbers of expired certificates available to AMSA becomes:
Master 1 78
Engineer 1 50
Total 128
Naturally, employment as a coastal pilot requires a valid Master 1 so the pool of expired certificates is immaterial.
In terms of defining the “pool” of maritime skills available in Australia, the gross number of certificates issued by AMSA should provide a reasonable indication of the developing skills base over time.
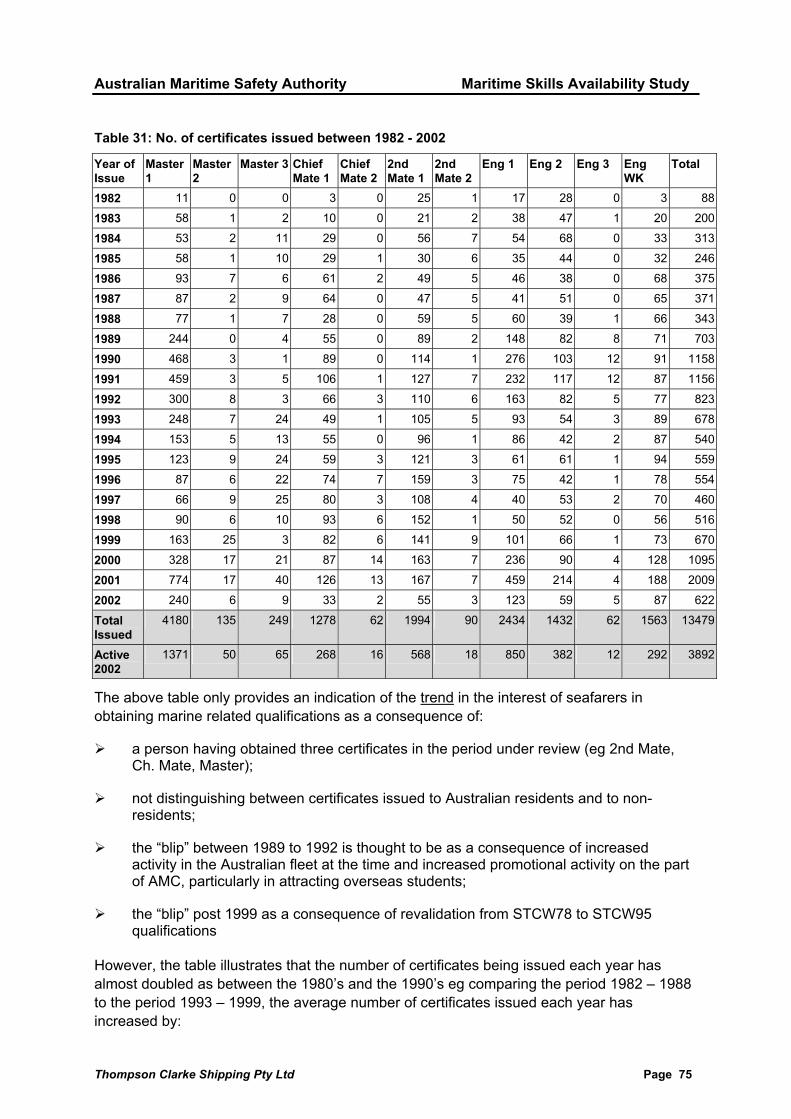
Australian Maritime Safety Authority Maritime Skills Availability Study
Thompson Clarke Shipping Pty Ltd Page 75
Table 31: No. of certificates issued between 1982 - 2002
Year of Issue
Master 1
Master 2
Master 3 Chief Mate 1
Chief Mate 2
2nd Mate 1
2nd Mate 2
Eng 1 Eng 2 Eng 3 Eng WK
Total
1982 11 0 0 3 0 25 1 17 28 0 3 88
1983 58 1 2 10 0 21 2 38 47 1 20 200
1984 53 2 11 29 0 56 7 54 68 0 33 313
1985 58 1 10 29 1 30 6 35 44 0 32 246
1986 93 7 6 61 2 49 5 46 38 0 68 375
1987 87 2 9 64 0 47 5 41 51 0 65 371
1988 77 1 7 28 0 59 5 60 39 1 66 343
1989 244 0 4 55 0 89 2 148 82 8 71 703
1990 468 3 1 89 0 114 1 276 103 12 91 1158
1991 459 3 5 106 1 127 7 232 117 12 87 1156
1992 300 8 3 66 3 110 6 163 82 5 77 823
1993 248 7 24 49 1 105 5 93 54 3 89 678
1994 153 5 13 55 0 96 1 86 42 2 87 540
1995 123 9 24 59 3 121 3 61 61 1 94 559
1996 87 6 22 74 7 159 3 75 42 1 78 554
1997 66 9 25 80 3 108 4 40 53 2 70 460
1998 90 6 10 93 6 152 1 50 52 0 56 516
1999 163 25 3 82 6 141 9 101 66 1 73 670
2000 328 17 21 87 14 163 7 236 90 4 128 1095
2001 774 17 40 126 13 167 7 459 214 4 188 2009
2002 240 6 9 33 2 55 3 123 59 5 87 622
Total Issued
4180 135 249 1278 62 1994 90 2434 1432 62 1563 13479
Active 2002
1371 50 65 268 16 568 18 850 382 12 292 3892
The above table only provides an indication of the trend in the interest of seafarers in obtaining marine related qualifications as a consequence of:
a person having obtained three certificates in the period under review (eg 2nd Mate, Ch. Mate, Master);
not distinguishing between certificates issued to Australian residents and to non-residents;
the “blip” between 1989 to 1992 is thought to be as a consequence of increased activity in the Australian fleet at the time and increased promotional activity on the part of AMC, particularly in attracting overseas students;
the “blip” post 1999 as a consequence of revalidation from STCW78 to STCW95 qualifications
However, the table illustrates that the number of certificates being issued each year has almost doubled as between the 1980’s and the 1990’s eg comparing the period 1982 – 1988 to the period 1993 – 1999, the average number of certificates issued each year has increased by:
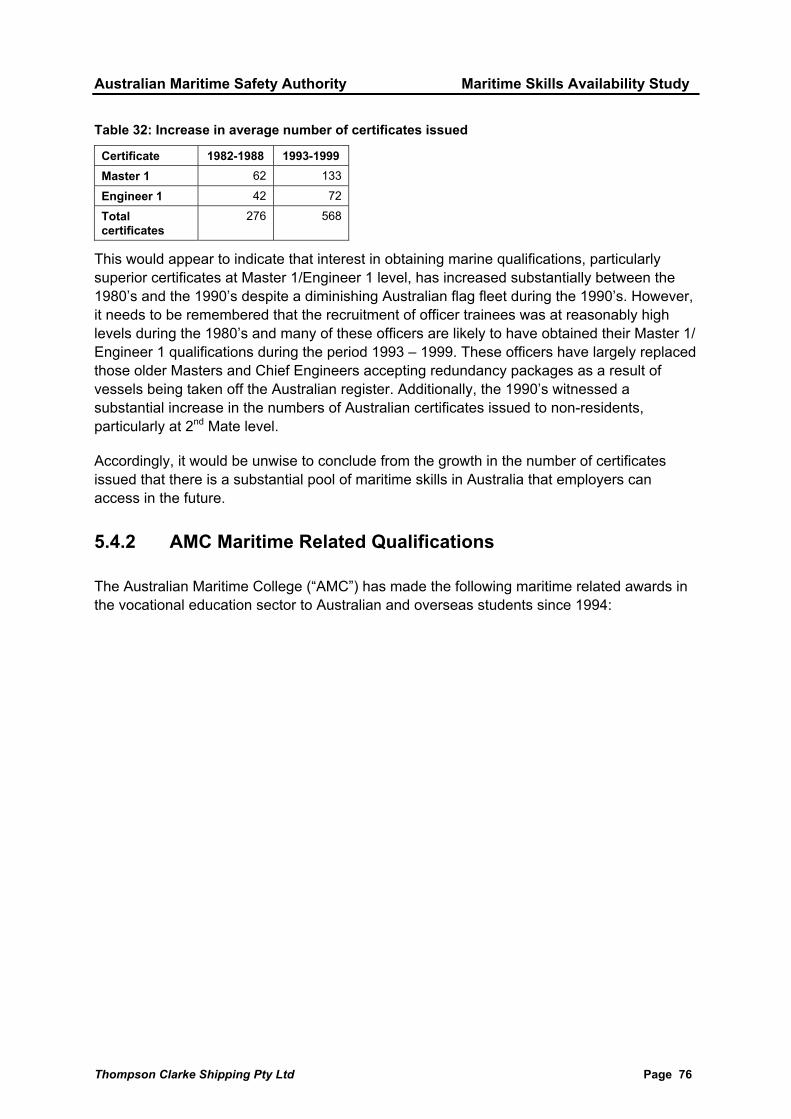
Australian Maritime Safety Authority Maritime Skills Availability Study
Thompson Clarke Shipping Pty Ltd Page 76
Table 32: Increase in average number of certificates issued
Certificate 1982-1988 1993-1999 Master 1 62 133
Engineer 1 42 72
Total certificates
276 568
This would appear to indicate that interest in obtaining marine qualifications, particularly superior certificates at Master 1/Engineer 1 level, has increased substantially between the 1980’s and the 1990’s despite a diminishing Australian flag fleet during the 1990’s. However, it needs to be remembered that the recruitment of officer trainees was at reasonably high levels during the 1980’s and many of these officers are likely to have obtained their Master 1/ Engineer 1 qualifications during the period 1993 – 1999. These officers have largely replaced those older Masters and Chief Engineers accepting redundancy packages as a result of vessels being taken off the Australian register. Additionally, the 1990’s witnessed a substantial increase in the numbers of Australian certificates issued to non-residents, particularly at 2nd Mate level.
Accordingly, it would be unwise to conclude from the growth in the number of certificates issued that there is a substantial pool of maritime skills in Australia that employers can access in the future.
5.4.2 AMC Maritime Related Qualifications
The Australian Maritime College (“AMC”) has made the following maritime related awards in the vocational education sector to Australian and overseas students since 1994:

Australian Maritime Safety Authority Maritime Skills Availability Study
Thompson Clarke Shipping Pty Ltd Page 77
Table 33: AMC maritime related qualifications 1994 - 2001
1994 1995 1996 1997 1998 1999 2000 2001 TOTAL CERTIFICATE Aust O/se
a Aust O/se
a Aust O/se
a Aust O/se
a Aust O/se
a Aust O/se
a Aust O/se
a Aust O/se
a Aust O/se
a Adv Dip Nautical Sci (Shipmaster) 19 42 17 15 18 23 13 24 67 104 Diploma of Applied Sci (Shipmaster) 11 38 10 39 9 26 3 16 33 119 Adv Dip App Sci (Nautical Sci) 10 1 14 1 11 0 35 2 Dip of App Sci (Nautical Sci) 23 0 33 1 34 0 28 1 34 0 4 2 0 0 1 0 157 4 Diploma of Applied Science (2nd Mate) 0 62 5 54 6 45 9 36 20 197 Adv Cert in Mar Ops 9 37 8 36 13 46 4 64 1 3 6 0 0 0 0 0 41 186 Adv Dip Mar Eng (Chief Engineer) 7 10 5 11 1 8 13 29 Dip of Mar Eng (2nd Engineer) 1 0 2 0 2 1 5 1 Dip of Mar Eng (Watchkeeper) 5 2 6 3 7 1 18 6 Adv Cert Tech (Mar Eng) 0 1 2 1 2 2 B Eng Maritime 3 0 5 0 4 0 3 0 3 1 3 0 1 0 22 1 B Tech (Mar Eng) 10 0 17 0 17 1 11 0 12 1 10 1 6 3 3 0 86 6 B Eng (Nav Arch) 2 0 7 1 13 3 22 0 10 2 14 0 11 3 9 1 88 10 Assoc Dip of Eng in Mar Elec 12 0 10 0 9 1 3 0 34 1 Cert 111 Pre Sea Trg (Deck) 18 4 31 10 35 1 29 2 113 17 Cert 111 Pre Sea Trg (Engine) 5 3 3 0 7 2 15 5 TOTAL 70 76 90 77 99 77 76 82 97 115 118 98 107 90 92 75 749 690

Australian Maritime Safety Authority Maritime Skills Availability Study
Thompson Clarke Shipping Pty Ltd Page 78
The previous table illustrates a number of salient issues that impact the maritime skills base in Australia:
AMC relies heavily on the intake of foreign students for its financial viability with 48% maritime vocational awards other than Certificates of Marine Operations (IR course) going to overseas students. This is partly due to AMC’s obligation as Australia’s Asia Pacific Maritime Centre to facilitate the sharing of maritime knowledge and expertise within the Asia Pacific region.
The imbalance between Australian and overseas students is particularly marked at the Master, 2nd Mate and Chief Engineer levels where the proportion of overseas students is as high as 69%, 86% and 69% respectively. Accordingly, many of these qualifications are essentially lost to Australian employers.
The decline in cadet graduates at the Adv Dip/Dip App Sc (Nautical Science) level mirrors the declining company sponsored trainee intake. However, these graduates have been displaced largely by self-sponsored pre-sea trainees.
Overseas students that attend AMC have the potential to form a secondary source of recruitment for seagoing and shore-based positions if it can be demonstrated that there are insufficient appropriately qualified residents.
5.4.3 Naval Architects
Naval architects comprise an important maritime skills resource for the shipping industry, particularly ship builders, classification societies, marine consultants and marine safety administrations such as AMSA.
The principal professional body for naval architects in Australia is the Royal Institute of Naval Architects (“RINA”). The distribution of RINA’s membership is as follows:
Table 34: Location of RINA membership
STATE No. NSW 145
TAS 94
WA 87
VIC 59
QLD 57
ACT 26
SA 15
NT 3
TOTAL 486
Membership in Tasmania is high because of the number of students attending AMC, whereas there are a large number of naval architects working with Defence in the ACT. Otherwise the distribution is proportionate to the amount of shipbuilding activity in each State.
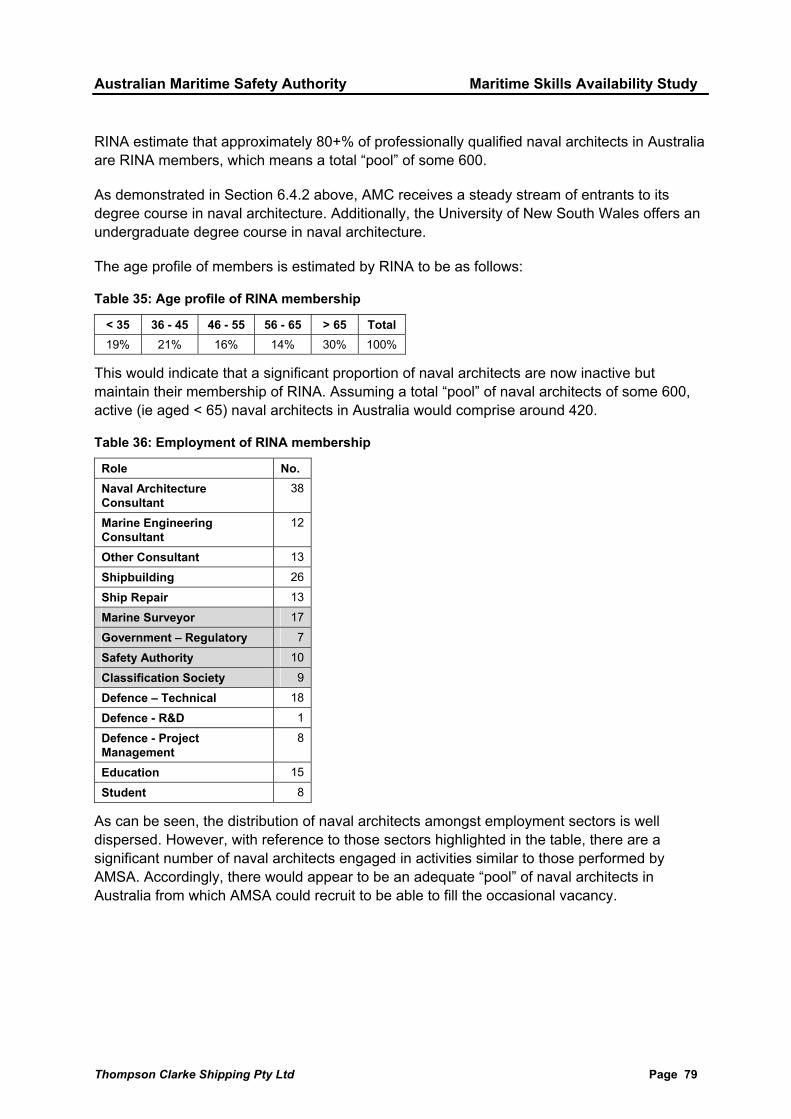
Australian Maritime Safety Authority Maritime Skills Availability Study
Thompson Clarke Shipping Pty Ltd Page 79
RINA estimate that approximately 80+% of professionally qualified naval architects in Australia are RINA members, which means a total “pool” of some 600.
As demonstrated in Section 6.4.2 above, AMC receives a steady stream of entrants to its degree course in naval architecture. Additionally, the University of New South Wales offers an undergraduate degree course in naval architecture.
The age profile of members is estimated by RINA to be as follows:
Table 35: Age profile of RINA membership
< 35 36 - 45 46 - 55 56 - 65 > 65 Total 19% 21% 16% 14% 30% 100%
This would indicate that a significant proportion of naval architects are now inactive but maintain their membership of RINA. Assuming a total “pool” of naval architects of some 600, active (ie aged < 65) naval architects in Australia would comprise around 420.
Table 36: Employment of RINA membership
Role No. Naval Architecture Consultant
38
Marine Engineering Consultant
12
Other Consultant 13
Shipbuilding 26
Ship Repair 13
Marine Surveyor 17
Government – Regulatory 7
Safety Authority 10
Classification Society 9
Defence – Technical 18
Defence - R&D 1
Defence - Project Management
8
Education 15
Student 8
As can be seen, the distribution of naval architects amongst employment sectors is well dispersed. However, with reference to those sectors highlighted in the table, there are a significant number of naval architects engaged in activities similar to those performed by AMSA. Accordingly, there would appear to be an adequate “pool” of naval architects in Australia from which AMSA could recruit to be able to fill the occasional vacancy.

Australian Maritime Safety Authority Maritime Skills Availability Study
Thompson Clarke Shipping Pty Ltd Page 80
5.5 Manpower Supply Issues
5.5.1 Training
Recruitment of sufficient trainees by Australian shipping companies is essential to the maintenance of the necessary skills base both at sea and ashore. Merchant navy service on Australian ships still appears to provide the most cost-effective form of training for shore-based jobs in the shipping industry in Australia. As observed previously in this Study, many consider that the use of non-seafarers or foreign nationals will almost inevitably lead to a drop in quality and expertise. Education and training programs no matter how well devised these might be cannot replicate practical experience gained at sea over an extended period.
A declining Australian merchant fleet has resulted in a corresponding decline in trainee numbers as employers display a certain caution in their recruitment policies in the face of uncertainty over the fleet's future.
Table 37: Officer recruitment & training in Australia
Trainee Type 1993 1994 1995 1996 1997 1998 1999 Deck & Engineer Cadets
55 40 39 41 20 11 27
Trainee Engineers 16 17 16 12 7 7 12
Rating to 2nd Mate 10 12 13 12 3 5 -
Total 81 69 68 65 30 23 39
TCS understands from industry sources that there was negligible trainee recruitment in 2000 and 2001, but trainee recruitment has resumed in 2002 on a limited basis. Average officer trainee recruitment has therefore averaged around 40 for the period 1993 – 2001.
As previously discussed, the AMC has been running a pre-sea training course since 1999 at an intake of around 40 pa with most entrants being self-sponsored although some Australian companies have recruited a number of these entrants.
Using the 2000 BIMCO/ISF Manpower Update rule of thumb ratio of 1.0 to 1.5 officer trainees per vessel, with 48 vessels in the Australian trading fleet there would require to be a trainee population in Australia of between 48 and 72 at any one time. This estimate ignores the recruitment requirements of the offshore industry and of shore-based sectors of the shipping industry that require superior certificates then this training requirement needs to be increased by a factor of 3. It will be apparent that this training impost will rapidly become unmanageable as the number of ships in Australia that are suitable for carrying trainees declines.
Likewise, if the proportion of officer trainees as a percentage of OECD officers of 12 % reported for 2000 is used to approximate the number of officer trainees required in Australia then a trainee population of 51 is required at any one time. Again, this number needs to be increased by a factor of 3 to supply the offshore industry and shore-based sectors of the industry.

Australian Maritime Safety Authority Maritime Skills Availability Study
Thompson Clarke Shipping Pty Ltd Page 81
Alternatively, based upon the UK Tonnage Tax (Training Requirements) 2000 of one newly recruited cadet for every 15 officers employed pa, with an estimated officer population in the Australian trading fleet in 2001 of 879, this will require an annual intake of 59 officer trainees needed to supply both the seagoing and shore-based sectors of the industry.
It will be readily apparent that trainee recruitment in Australia is lagging a long way behind the projected requirement for officers both at sea and ashore. Whilst Australia might not be experiencing a skilled labour shortage at the moment, this is likely to become evident as those with Master 1/Engineer 1 certificates in seagoing and shore based positions in the shipping industry in Australia reach retirement.
5.5.2 Age Profile
TCS has analysed the age profile of a substantial proportion of seagoing officers employed by Teekay and ASP Ship Management on Australian trading vessels:
Table 38: Age Profile of Australian seagoing officers RANK < 20 20-24 25-29 30-34 35-39 40-44 45-49 50-54 55-59 > 60 TOTAL
TEEKAY SHIPPING (TANKERS) Master 1 3 1 6 1 12 Chief Officer 1 2 2 2 4 11 2nd Officer 5 3 1 1 1 11 3rd Officer 1 2 4 3 3 1 2 1 1 18 Chief Engineer 3 8 1 12 1st Engineer 1 4 1 2 3 1 12 2nd Engineer 2 3 1 1 1 2 2 12 3rd Engineer 5 3 2 1 1 2 14 TOTAL 6 12 14 12 8 14 20 13 3 102 TEEKAY SHIPPING (BHP)
RANK < 20 20-24 25-29 30-34 35-39 40-44 45-49 50-54 55-59 > 60 TOTAL Master 1 6 9 2 6 7 31 Chief Officer 6 3 4 2 3 1 3 22 2nd Officer 7 6 2 1 2 4 1 2 25 3rd Officer 5 11 4 2 1 3 2 1 1 30 Chief Engineer 1 2 4 14 7 4 32 1st Engineer 3 5 7 9 6 30 2nd Engineer 10 6 2 2 1 7 2 30 3rd Engineer 6 15 1 1 2 2 2 29 TOTAL 11 43 26 16 24 23 43 26 17 229 ASP SHIP MANAGEMENT
RANK < 20 20-24 25-29 30-34 35-39 40-44 45-49 50-54 55-59 > 60 TOTAL Master 2 2 8 5 3 20 Chief Officer 1 4 5 2 4 2 1 19 2nd Officer 4 8 2 4 2 1 1 22 3rd Officer 7 13 8 3 4 5 2 2 1 45 Chief Engineer 2 2 5 5 3 17 1st Engineer 1 6 3 2 7 1 2 22 2nd Engineer 5 2 2 2 2 7 5 3 28 3rd Engineer 10 16 11 7 7 2 6 3 1 63 TOTAL 17 38 31 24 25 21 41 24 15 236 GRAND TOTAL 0 34 93 71 52 57 58 104 63 35 567 0% 6% 16% 13% 9% 10% 10% 19% 11% 6% 100%
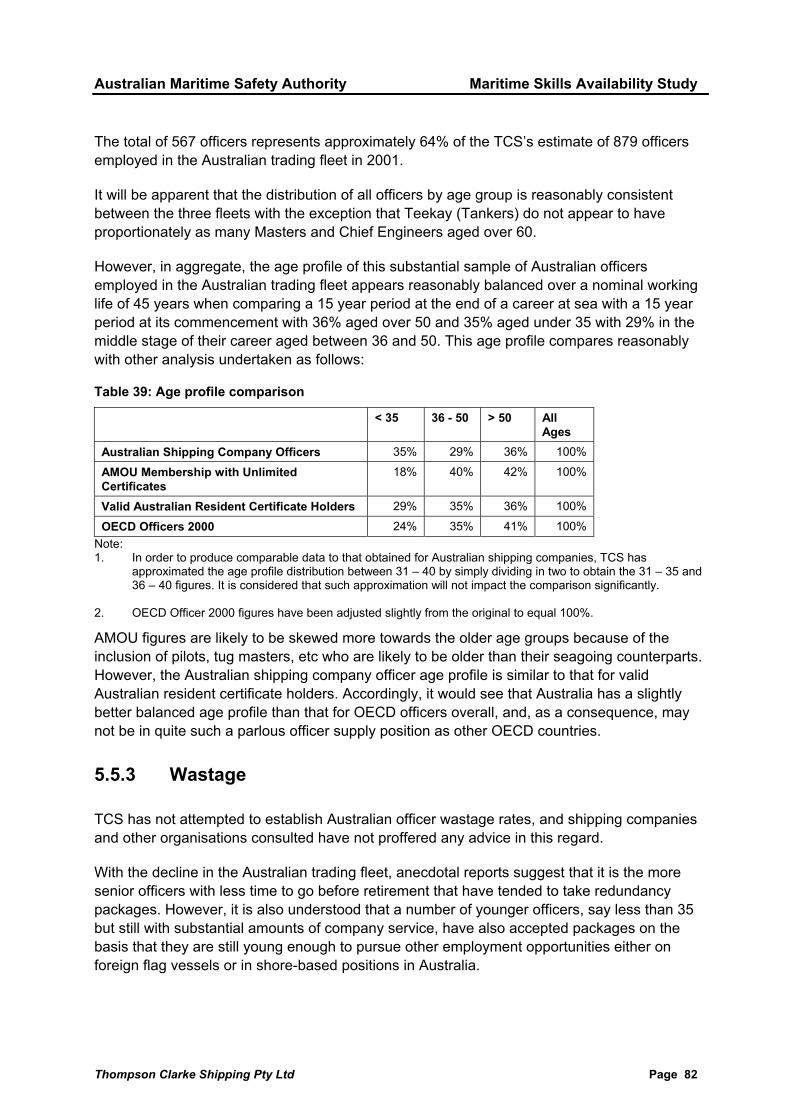
Australian Maritime Safety Authority Maritime Skills Availability Study
Thompson Clarke Shipping Pty Ltd Page 82
The total of 567 officers represents approximately 64% of the TCS’s estimate of 879 officers employed in the Australian trading fleet in 2001.
It will be apparent that the distribution of all officers by age group is reasonably consistent between the three fleets with the exception that Teekay (Tankers) do not appear to have proportionately as many Masters and Chief Engineers aged over 60.
However, in aggregate, the age profile of this substantial sample of Australian officers employed in the Australian trading fleet appears reasonably balanced over a nominal working life of 45 years when comparing a 15 year period at the end of a career at sea with a 15 year period at its commencement with 36% aged over 50 and 35% aged under 35 with 29% in the middle stage of their career aged between 36 and 50. This age profile compares reasonably with other analysis undertaken as follows:
Table 39: Age profile comparison
< 35 36 - 50 > 50 All Ages
Australian Shipping Company Officers 35% 29% 36% 100%
AMOU Membership with Unlimited Certificates
18% 40% 42% 100%
Valid Australian Resident Certificate Holders 29% 35% 36% 100%
OECD Officers 2000 24% 35% 41% 100% Note: 1. In order to produce comparable data to that obtained for Australian shipping companies, TCS has
approximated the age profile distribution between 31 – 40 by simply dividing in two to obtain the 31 – 35 and 36 – 40 figures. It is considered that such approximation will not impact the comparison significantly.
2. OECD Officer 2000 figures have been adjusted slightly from the original to equal 100%.
AMOU figures are likely to be skewed more towards the older age groups because of the inclusion of pilots, tug masters, etc who are likely to be older than their seagoing counterparts. However, the Australian shipping company officer age profile is similar to that for valid Australian resident certificate holders. Accordingly, it would see that Australia has a slightly better balanced age profile than that for OECD officers overall, and, as a consequence, may not be in quite such a parlous officer supply position as other OECD countries.
5.5.3 Wastage
TCS has not attempted to establish Australian officer wastage rates, and shipping companies and other organisations consulted have not proffered any advice in this regard.
With the decline in the Australian trading fleet, anecdotal reports suggest that it is the more senior officers with less time to go before retirement that have tended to take redundancy packages. However, it is also understood that a number of younger officers, say less than 35 but still with substantial amounts of company service, have also accepted packages on the basis that they are still young enough to pursue other employment opportunities either on foreign flag vessels or in shore-based positions in Australia.
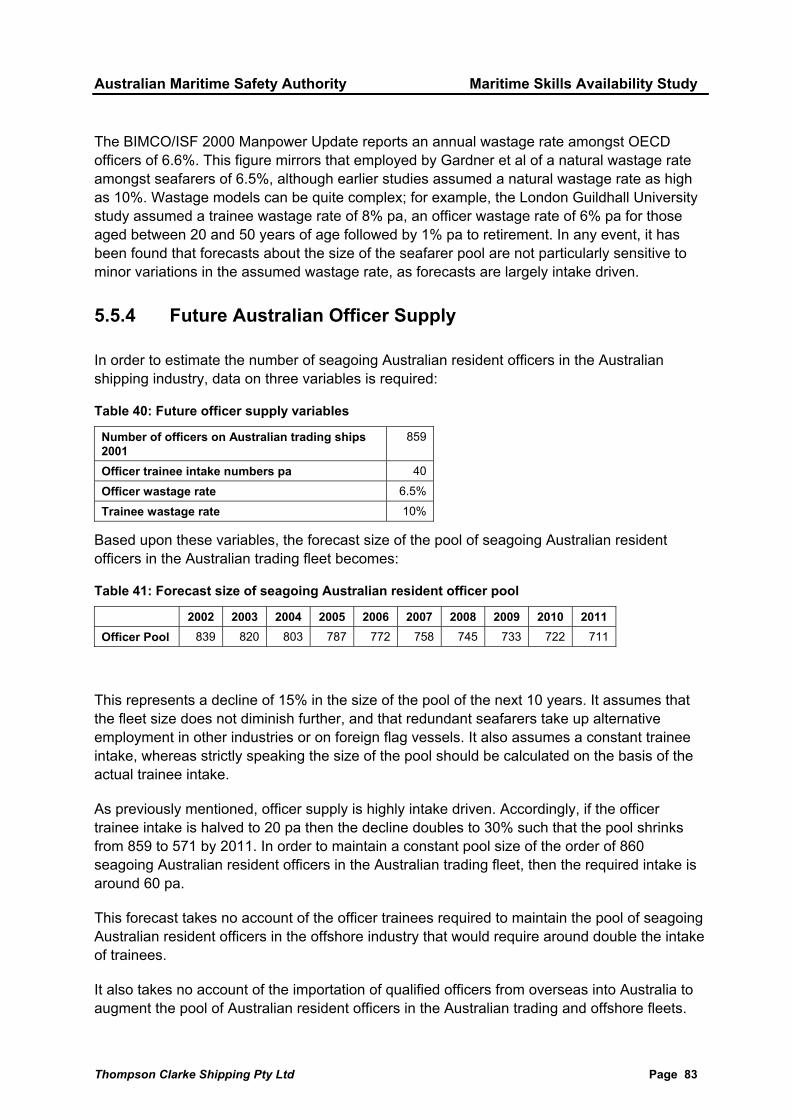
Australian Maritime Safety Authority Maritime Skills Availability Study
Thompson Clarke Shipping Pty Ltd Page 83
The BIMCO/ISF 2000 Manpower Update reports an annual wastage rate amongst OECD officers of 6.6%. This figure mirrors that employed by Gardner et al of a natural wastage rate amongst seafarers of 6.5%, although earlier studies assumed a natural wastage rate as high as 10%. Wastage models can be quite complex; for example, the London Guildhall University study assumed a trainee wastage rate of 8% pa, an officer wastage rate of 6% pa for those aged between 20 and 50 years of age followed by 1% pa to retirement. In any event, it has been found that forecasts about the size of the seafarer pool are not particularly sensitive to minor variations in the assumed wastage rate, as forecasts are largely intake driven.
5.5.4 Future Australian Officer Supply
In order to estimate the number of seagoing Australian resident officers in the Australian shipping industry, data on three variables is required:
Table 40: Future officer supply variables
Number of officers on Australian trading ships 2001
859
Officer trainee intake numbers pa 40
Officer wastage rate 6.5%
Trainee wastage rate 10%
Based upon these variables, the forecast size of the pool of seagoing Australian resident officers in the Australian trading fleet becomes:
Table 41: Forecast size of seagoing Australian resident officer pool
2002 2003 2004 2005 2006 2007 2008 2009 2010 2011 Officer Pool 839 820 803 787 772 758 745 733 722 711
This represents a decline of 15% in the size of the pool of the next 10 years. It assumes that the fleet size does not diminish further, and that redundant seafarers take up alternative employment in other industries or on foreign flag vessels. It also assumes a constant trainee intake, whereas strictly speaking the size of the pool should be calculated on the basis of the actual trainee intake.
As previously mentioned, officer supply is highly intake driven. Accordingly, if the officer trainee intake is halved to 20 pa then the decline doubles to 30% such that the pool shrinks from 859 to 571 by 2011. In order to maintain a constant pool size of the order of 860 seagoing Australian resident officers in the Australian trading fleet, then the required intake is around 60 pa.
This forecast takes no account of the officer trainees required to maintain the pool of seagoing Australian resident officers in the offshore industry that would require around double the intake of trainees.
It also takes no account of the importation of qualified officers from overseas into Australia to augment the pool of Australian resident officers in the Australian trading and offshore fleets.
Australian Maritime Safety Authority Maritime Skills Availability Study
Thompson Clarke Shipping Pty Ltd Page 84
Traditionally, shore-based vacancies have been filled by former seafarers; usually officers with Class 1 certificates seeking to leave seagoing employment. Provided that the number of seafarers seeking shore-based employment exceeded the employment opportunities on offer then recruitment was not a problem, and shore-based recruitment was satisfied by natural wastage from the seagoing sector. However, given the ageing of OECD officer stock and lack of recruitment, recent studies referred to previously in this Study are challenging this assumption that shore-based jobs can be filled by natural wastage from seagoing officers.
Assuming a wastage rate of 6.5% to the pool of seagoing Australian resident officers in the Australian trading fleet, then the pool of officers available each year to the shore-based sector is of the order of 50. However, this natural wastage figure applies to all ages and to all types of certificate holder, whereas officers recruited to fill shore-based job vacancies generally hold Class 1 certificates and are aged between 35 and 50. This candidate group accounts for almost 30% of the population. Accordingly, the pool of suitable Australian resident officers holding superior certificates available to the shore based sector each year could be as low as 15, and even less if Master 1 certificates are considered.
5.5.5 Future Demand for Maritime Skills in Shore-Based Positions in Australia
In 1999 TCS estimated the number of shore-based positions requiring maritime related qualifications to be ~2,460. Using the UK shore-based employment rule of thumb that in 70% of these positions the possession of a marine qualification is considered essential and that 87.5% of this number require a Class 1 certificate then there are ~1,500 positions in the Australian shipping industry occupied by holders of Class 1 certificates.
From recent UK studies17, annual demand for ex-seafarers ashore is estimated to be running at between 4% and 5%. If this rate of demand is applied to the ~1,500 positions requiring a Class 1 certificate, then annual demand for filling these positions is of the order of 60 to 75.
It will be evident that without either an increased trainee intake and/or the importation of maritime skills from overseas, Australia will be facing a serious skills shortage in the near future and increased competition amongst employers for such personnel.
5.5.6 Distribution
The distribution of maritime industry personnel around Australia would not appear to present any difficulties in that it is reasonably dispersed between the States; for example see Section 5.3.1 AMOU member distribution. There will always be difficulties in recruiting people to work in remote locations in Australia. Equally, there will be financial difficulties in attracting people from outside Sydney to relocate to that city.
17 Gardner and Pettit, op.cit
Australian Maritime Safety Authority Maritime Skills Availability Study
Thompson Clarke Shipping Pty Ltd Page 85
5.5.7 Implications of Australian Shipping Industry Manpower Position
The maritime skills availability implications for AMSA and coastal pilots arising from this analysis of Australia’s shipping industry manpower position will be clear:
the shipping industry workforce in Australia is in significant decline across all sectors whilst Australia’s shipping task has increased substantially;
whilst total employment in the broader shipping industry in Australia is ~41,000, only 10% have maritime related qualifications of which 60% ~2,500 are in shore based employment;
following on from overseas studies into the shore base employment, it would seem reasonable to conclude that most of the ~2,500 in shore based employment with maritime related qualifications are in those positions because the possession of these qualifications was either an essential or preferred requirement;
the more closely related the actual employment sector is to the actual operation and safety of the ship, the greater reliance there is on shore based personnel with maritime related qualifications;
anecdotal evidence suggests that many sectors of the shipping industry in Australia prefer to employ people in shore based positions who have Australian maritime related qualifications and sea-going experience because of the breadth of their local knowledge;
the importation of foreign nationals or the training of non-seafarers was felt to give rise to an unacceptable quality loss in the delivery of shipping services in Australia;
if the Australian trading and offshore fleets were to be disbanded, the shore based sector of the shipping industry in Australia would remain virtually intact apart from some reductions at the margins;
on the basis of TCS recalculating the current pool of Class 1 certificates in Australia that AMSA and coastal pilots might recruit from, these were estimated at 1,320 (725 Master 1 & 595 Engineer 1) and 925 (Master 1 only) for AMSA and coastal pilots respectively;
if the overall size of this pool” of maritime skills declines, then this must also diminish the standard and potential number of suitable applicants for employment with either AMSA or coastal pilots;
from a detailed analysis of the seagoing section of the membership of the AMOU it can be concluded that:
• there is a serious shortfall in the numbers entering the industry with less than half the numbers of junior grade certificates available to eventually replace current holders of Master 1. This situation deteriorates further to less than 25% if it is assumed that any holder of a junior grade certificate aged over 40 is unlikely to progress to Master 1;
Australian Maritime Safety Authority Maritime Skills Availability Study
Thompson Clarke Shipping Pty Ltd Page 86
• with 42% of the membership aged over 50, 30% aged between 40 & 50 and only 28% aged less than 40, there is expected to be a shortfall of personnel with seagoing experience in less than 10 years;
• with 51% of the membership that hold a Master 1 certificate aged over 50, there is expected to be a shortfall of Master 1 certificates in less than 10 years.
from a detailed analysis of the valid certificates of competency issued by AMSA it can be concluded that::
• there are currently 3,914 valid STCW95 certificates of competency comprising 2,377 deck and 1,537 engineer based;
• a significant proportion (42%) of Australian issued deck certificates of competency are now held by non-residents, particularly at junior grades, whereas only 11% of engineer STCW certificates of competency are held by non-residents;
• There is a shortage of junior grades of certificates held by Australian residents that might at some future time be converted to either a Master 1 or Engineer 1 certificates to replace those Australian residents that are current holders of superior certificates who will progressively retire over time ie Master 1: 922 active, but only 447 active junior certificates (48%), Engineer 1: 785 active, but only 581 active junior certificates (74%)
• with 41% of Australian residents that hold Master 1 certificates aged over 50, and a further 35% aged over 40, there may be a shortfall in these skilled Australian resident certificate holders in less than 10 years;
• with 48% of Australian residents that hold Engineer 1 certificates aged over 50, and a further 33% aged over 40, there may be a shortage in these skilled Australian resident certificate holders in less than 10 years;
• the shortage of Engineer 1 qualifications is exacerbated when it is considered that 59% of Australian residents that hold Engineer 2 qualifications are aged over 50, and therefore unlikely to progress to an Engineer 1 level;
• potentially there are some 256 expired superior certificates amongst Australian residents that are available to AMSA, although this figure needs to be discounted by 50% to allow for those either too young or too old for recruitment. Naturally, employment as a coastal pilot requires a valid Master 1 so the pool of expired certificates is immaterial;
• whilst the number of certificates issued has increased substantially during the 1990’s, it needs to be remembered that the recruitment of officer trainees was at reasonably high levels during the 1980’s and many of these officers are likely to have obtained their Master 1/ Engineer 1 qualifications during the 1990’s and have largely replaced those older Masters and Chief Engineers accepting redundancy packages as a result of vessels being taken off the Australian register. Additionally,
Australian Maritime Safety Authority Maritime Skills Availability Study
Thompson Clarke Shipping Pty Ltd Page 87
the 1990’s witnessed a substantial increase in the numbers of Australian certificates issued to non-residents, particularly at 2nd Mate level.
from a detailed analysis of maritime vocational awards made by AMC it can be concluded that:
• AMC relies heavily on the intake of foreign students for its financial viability with 48% of maritime vocational awards going to overseas students;
• the imbalance between Australian and overseas students is particularly marked at the Master, 2nd Mate and Chief Engineer levels where the proportion of overseas students is as high as 69%, 86% and 69% respectively. Accordingly, many of these qualifications are essentially lost to potential Australian employers;
• the decline in cadet graduates at the Adv Dip/Dip App Sc (Nautical Science) level that mirrors the declining company sponsored trainee intake. However, these graduates have largely been displaced by self-sponsored pre-sea trainees;
• overseas students that attend AMC have the potential to form an important secondary source of recruitment for seagoing and shore-based positions if it can be demonstrated that there are insufficient appropriately qualified residents.
with an active pool of some 420 professionally qualified naval architects in Australia there would appear to be an adequate “pool” of naval architects in Australia from which AMSA could recruit to fill the occasional vacancy requiring these qualifications;
a declining Australian trading fleet has resulted in a corresponding decline in officer trainee numbers falling from an annual intake of 81 in 1993 to virtually 0 in 2000, although TCS understands that trainee recruitment has resumed in 2002 on a limited basis. TCS estimates that based on one newly recruited cadet for every 15 officers employed pa this will require an annual intake of 59 officer trainees in order to supply both the seagoing and shore-based sectors of the industry;
the age profile of a substantial sample of Australian officers employed in the Australian trading fleet appears reasonably balanced over a nominal working life of 45 years with 36% aged over 50 and 35% aged under 35 with 29% in the middle stage of their career aged between 36 and 50, from which it would appear that Australia has a slightly better balanced age profile than that for OECD officers overall, and, as a consequence, may not experience the same shortfall in officer supply position as other OECD countries;
based upon an officer wastage rate of 6.5% and an officer trainee intake of 40 pa, TCS has forecast the size of the Australian resident officer pool in the trading fleet declining from 859 in 2001 to 711 by 2011, a decline of 15%.
as officer supply is highly intake driven, if the officer trainee intake is halved to 20 pa then the decline doubles to 30% such that the pool shrinks from 859 to 571 by 2011. In order to maintain a constant pool size of the order of 860 seagoing Australian resident officers in the Australian trading fleet, then the required intake is around 60 pa.
these forecasts take no account of either the officer trainees required to maintain the pool of seagoing Australian resident officers in the offshore industry that would require around double the intake of trainees, and makes no allowance for the importation of
Australian Maritime Safety Authority Maritime Skills Availability Study
Thompson Clarke Shipping Pty Ltd Page 88
qualified officers from overseas into Australia to augment the pool of Australian resident officers in the Australian trading and offshore fleets;
assuming a wastage rate of 6.5% to the pool of seagoing Australian resident officers in the Australian trading fleet, then the pool of officers available each year to the shore-based sector is of the order of 50. However, this natural wastage figure applies to all ages and to all types of certificate holder, whereas officers recruited to fill shore-based job vacancies generally hold Class 1 certificates and are aged between 35 and 50. This candidate group accounts for almost 30% of the population. Accordingly, the pool of suitable Australian resident officers holding superior certificates available to the shore based sector each year could be as low as 15;
from recent UK studies, annual demand for ex-seafarers ashore is estimated to be running at between 4% and 5%. If this rate of demand is applied to the ~1,500 positions in the Australian shipping industry requiring a Class 1 certificate, then annual demand for filling these positions is of the order of 60 to 75;
from this it will be evident that without either an increased trainee intake and/or the importation of maritime skills from overseas, Australia will be facing a serious skills shortage in the near future and increased competition amongst employers for such personnel;
the distribution of maritime industry personnel around Australia would not appear to present any difficulties in that it is reasonably dispersed between the States.
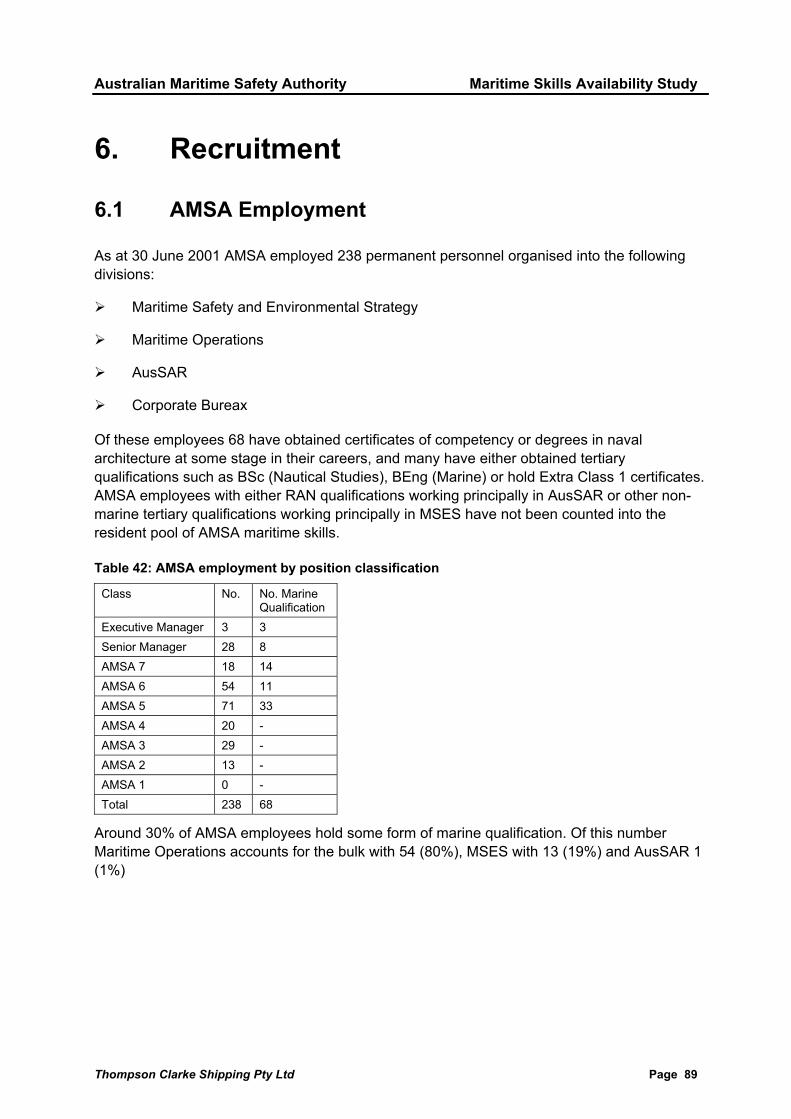
Australian Maritime Safety Authority Maritime Skills Availability Study
Thompson Clarke Shipping Pty Ltd Page 89
6. Recruitment
6.1 AMSA Employment
As at 30 June 2001 AMSA employed 238 permanent personnel organised into the following divisions:
Maritime Safety and Environmental Strategy
Maritime Operations
AusSAR
Corporate Bureax
Of these employees 68 have obtained certificates of competency or degrees in naval architecture at some stage in their careers, and many have either obtained tertiary qualifications such as BSc (Nautical Studies), BEng (Marine) or hold Extra Class 1 certificates. AMSA employees with either RAN qualifications working principally in AusSAR or other non-marine tertiary qualifications working principally in MSES have not been counted into the resident pool of AMSA maritime skills.
Table 42: AMSA employment by position classification
Class No. No. Marine Qualification
Executive Manager 3 3 Senior Manager 28 8 AMSA 7 18 14 AMSA 6 54 11 AMSA 5 71 33 AMSA 4 20 - AMSA 3 29 - AMSA 2 13 - AMSA 1 0 - Total 238 68
Around 30% of AMSA employees hold some form of marine qualification. Of this number Maritime Operations accounts for the bulk with 54 (80%), MSES with 13 (19%) and AusSAR 1 (1%)
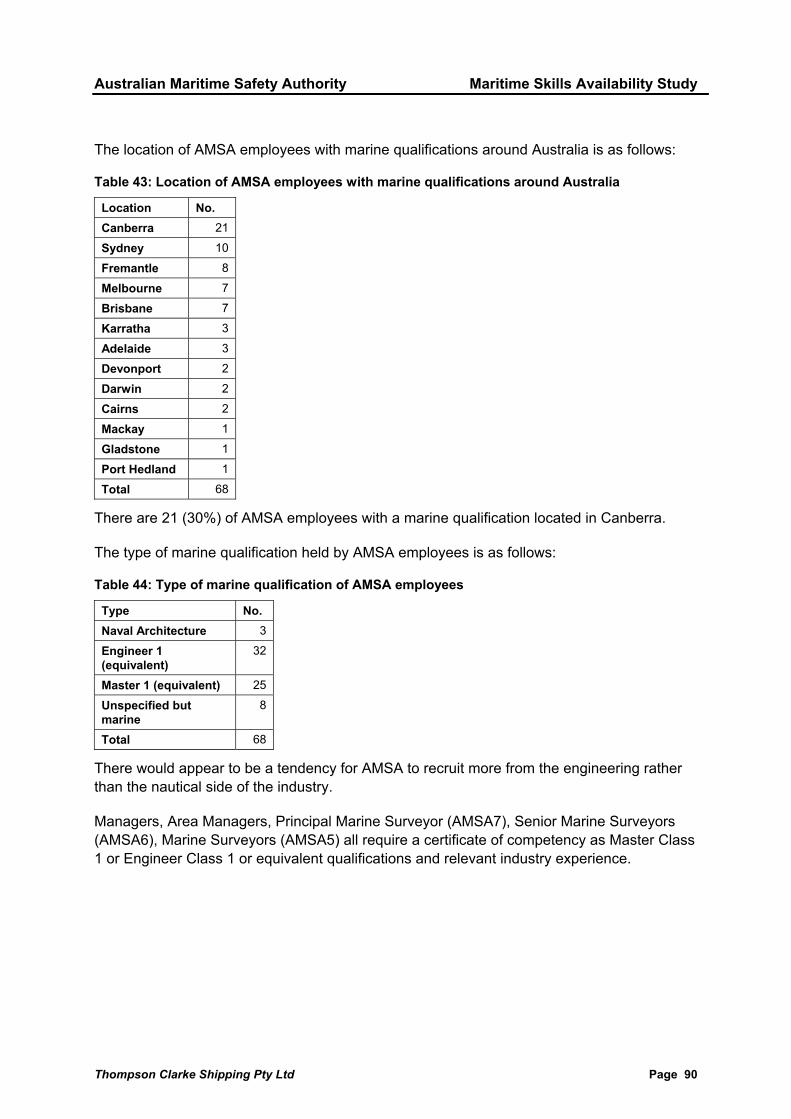
Australian Maritime Safety Authority Maritime Skills Availability Study
Thompson Clarke Shipping Pty Ltd Page 90
The location of AMSA employees with marine qualifications around Australia is as follows:
Table 43: Location of AMSA employees with marine qualifications around Australia
Location No. Canberra 21
Sydney 10
Fremantle 8
Melbourne 7
Brisbane 7
Karratha 3
Adelaide 3
Devonport 2
Darwin 2
Cairns 2
Mackay 1
Gladstone 1
Port Hedland 1
Total 68
There are 21 (30%) of AMSA employees with a marine qualification located in Canberra.
The type of marine qualification held by AMSA employees is as follows:
Table 44: Type of marine qualification of AMSA employees
Type No. Naval Architecture 3
Engineer 1 (equivalent)
32
Master 1 (equivalent) 25
Unspecified but marine
8
Total 68
There would appear to be a tendency for AMSA to recruit more from the engineering rather than the nautical side of the industry.
Managers, Area Managers, Principal Marine Surveyor (AMSA7), Senior Marine Surveyors (AMSA6), Marine Surveyors (AMSA5) all require a certificate of competency as Master Class 1 or Engineer Class 1 or equivalent qualifications and relevant industry experience.

Australian Maritime Safety Authority Maritime Skills Availability Study
Thompson Clarke Shipping Pty Ltd Page 91
The background of AMSA employees with marine related qualifications is approximately as follows:
Table 45: Background of AMSA employees with marine related qualifications
Sector recruited from No. % Seagoing/Shipping Co. 27 40%
Maritime safety/surveying
6 9%
Ports 4 6%
Shipbuilding & repair 2 3%
Defence 2 3%
Classification Society 1 1%
Maritime Education 1 1%
Other/Unspecified 25 37%
Total 68 100%
It will be evident from the above table that the seagoing sector is an important primary recruitment source for AMSA.
The age profile of AMSA employees with marine related qualifications is as follows:
Table 46: Age profile of AMSA employees with marine related qualifications
Age < 30 31-35 36-40 41-45 46-50 51-55 56-60 > 60 Total No. - - 11 7 13 14 15 8 68
% - - 16% 10% 19% 21% 22% 12% 100%
With 36% of these employees aged over 55 and a further 22% aged over 50 AMSA needs to consider its recruitment strategy carefully if it is to avoid a shortage of personnel with marine related qualifications as current employees approach retirement.
It is also apparent that there may well be insufficient surveyors aged under 50 of the appropriate calibre to succeed retiring senior surveyors and managers, such that external recruitment will be necessary in the future at these senior levels as well as at base grade surveyor level.
The length of service of AMSA employees with marine related qualifications is as follows:
Table 47: Length of service of AMSA employees with marine relate qualifications
Length of service
> 30 > 20 > 10 > 5 < 5 Total
No. 1 8 18 18 23 68
% 2% 12% 26% 26% 34% 100%
This indicates that despite the older age profile of AMSA employees with marine related qualifications AMSA has a relatively new workforce with 34% employed for 5 years or less and a further 26% employed for 10 years or less. This is as a consequence of not recruiting these employees until relatively late in their careers.
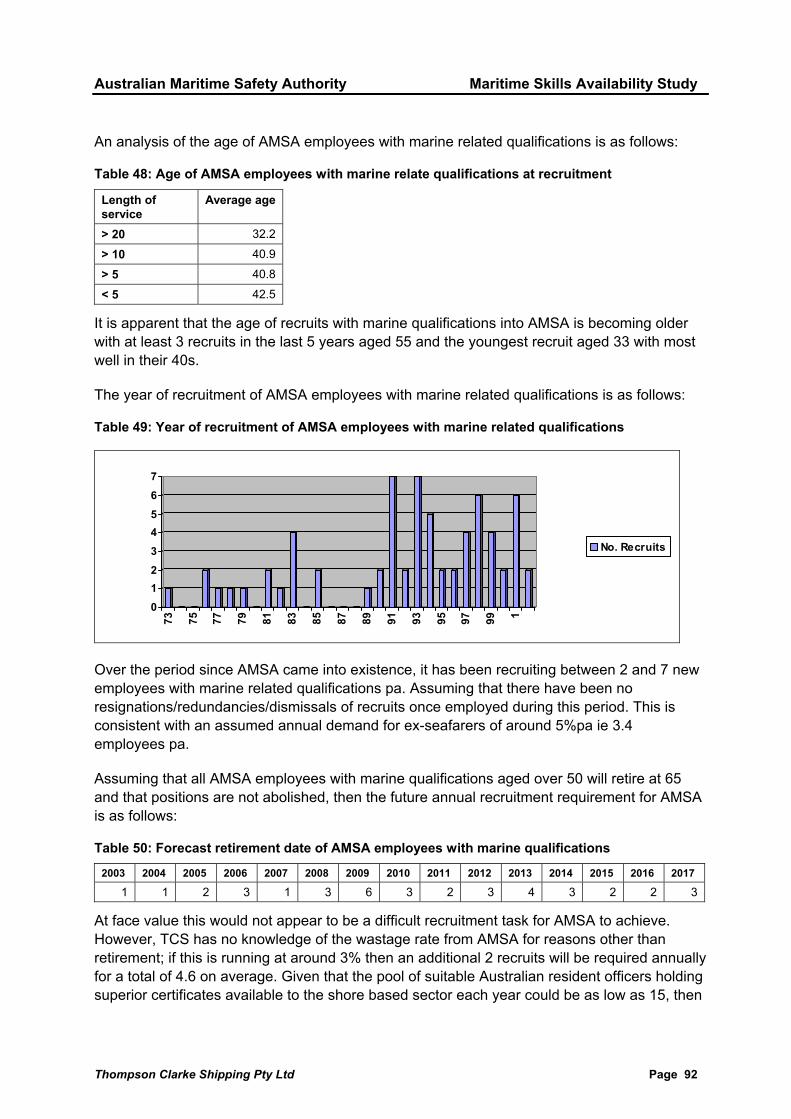
Australian Maritime Safety Authority Maritime Skills Availability Study
Thompson Clarke Shipping Pty Ltd Page 92
An analysis of the age of AMSA employees with marine related qualifications is as follows:
Table 48: Age of AMSA employees with marine relate qualifications at recruitment
Length of service
Average age
> 20 32.2
> 10 40.9
> 5 40.8
< 5 42.5
It is apparent that the age of recruits with marine qualifications into AMSA is becoming older with at least 3 recruits in the last 5 years aged 55 and the youngest recruit aged 33 with most well in their 40s.
The year of recruitment of AMSA employees with marine related qualifications is as follows:
Table 49: Year of recruitment of AMSA employees with marine related qualifications
01234567
73 75 77 79 81 83 85 87 89 91 93 95 97 99 1
No. Recruits
Over the period since AMSA came into existence, it has been recruiting between 2 and 7 new employees with marine related qualifications pa. Assuming that there have been no resignations/redundancies/dismissals of recruits once employed during this period. This is consistent with an assumed annual demand for ex-seafarers of around 5%pa ie 3.4 employees pa.
Assuming that all AMSA employees with marine qualifications aged over 50 will retire at 65 and that positions are not abolished, then the future annual recruitment requirement for AMSA is as follows:
Table 50: Forecast retirement date of AMSA employees with marine qualifications
2003 2004 2005 2006 2007 2008 2009 2010 2011 2012 2013 2014 2015 2016 2017
1 1 2 3 1 3 6 3 2 3 4 3 2 2 3
At face value this would not appear to be a difficult recruitment task for AMSA to achieve. However, TCS has no knowledge of the wastage rate from AMSA for reasons other than retirement; if this is running at around 3% then an additional 2 recruits will be required annually for a total of 4.6 on average. Given that the pool of suitable Australian resident officers holding superior certificates available to the shore based sector each year could be as low as 15, then
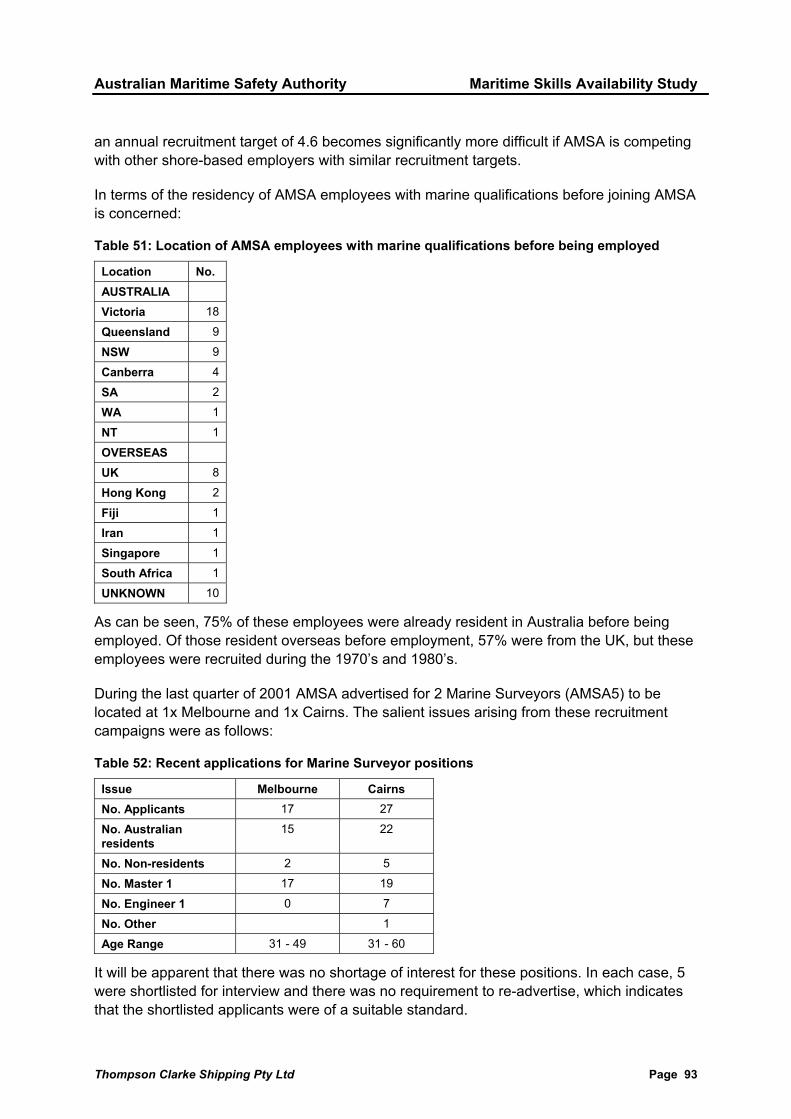
Australian Maritime Safety Authority Maritime Skills Availability Study
Thompson Clarke Shipping Pty Ltd Page 93
an annual recruitment target of 4.6 becomes significantly more difficult if AMSA is competing with other shore-based employers with similar recruitment targets.
In terms of the residency of AMSA employees with marine qualifications before joining AMSA is concerned:
Table 51: Location of AMSA employees with marine qualifications before being employed
Location No. AUSTRALIA
Victoria 18
Queensland 9
NSW 9
Canberra 4
SA 2
WA 1
NT 1
OVERSEAS
UK 8
Hong Kong 2
Fiji 1
Iran 1
Singapore 1
South Africa 1
UNKNOWN 10
As can be seen, 75% of these employees were already resident in Australia before being employed. Of those resident overseas before employment, 57% were from the UK, but these employees were recruited during the 1970’s and 1980’s.
During the last quarter of 2001 AMSA advertised for 2 Marine Surveyors (AMSA5) to be located at 1x Melbourne and 1x Cairns. The salient issues arising from these recruitment campaigns were as follows:
Table 52: Recent applications for Marine Surveyor positions
Issue Melbourne Cairns No. Applicants 17 27
No. Australian residents
15 22
No. Non-residents 2 5
No. Master 1 17 19
No. Engineer 1 0 7
No. Other 1
Age Range 31 - 49 31 - 60
It will be apparent that there was no shortage of interest for these positions. In each case, 5 were shortlisted for interview and there was no requirement to re-advertise, which indicates that the shortlisted applicants were of a suitable standard.

Australian Maritime Safety Authority Maritime Skills Availability Study
Thompson Clarke Shipping Pty Ltd Page 94
6.2 Coastal Pilots Employment
Three pilotage providers provide compulsory pilotage on vessels transiting the Great Barrier Reef:
Torres Pilots
Australian Reef Pilots
Hydro Pilots
These providers contract individual licensed pilots to provide pilotage services. In order to be eligible for a restricted licence coastal pilots must:
be entitled to permanent residence in Australia;
hold a valid certificate as Master Class 1
have completed not less than 36 months sea service, of which 18 months must have been completed during the previous 5 years, as Master, navigating officer in charge of a watch, or pilot, on ships 35 metres or over in length while holding a Master Class 1;
have satisfactorily completed an approved program of training
undertaken the required transits on vessels of increasing draft on specified routes within the GBR.
Numbers and age profile of coastal pilots is as follows:
Table 53: Numbers and age profile of coastal pilots
< 40 41-45 46-50 51-55 56-60 61-65 > 65 Total Av. Age
Torres Pilots 2 3 1 9 5 4 3 27 54
Australian Reef Pilots
- - 1 9 9 8 1 28 58
Hydro Pilots - - - 2 1 - - 3 53
Total 2 3 2 20 15 12 4 58
% 3% 5% 3% 34% 26% 20% 8% 100% Note: 2 x Torres Pilots >65 are on reduced duties
With 88% of coastal pilots aged over 50, pilotage providers are facing a major recruitment program over the next 15 years assuming a nominal retirement age of 65. Assuming that all coastal pilots will retire at 65 (including those aged > 65 now) and that positions are not abolished, then the future annual recruitment of coastal pilots is as follows:
Table 54: Forecast retirement date of AMSA employees with marine qualifications
2003 2004 2005 2006 2007 2008 2009 2010 2011 2012 2013 2014 2015 2016 2017
>64 63 62 61 60 59 58 57 56 55 54 53 52 51 50 5 4 1 6 3 5 3 1 3 3 4 4 7 2 -
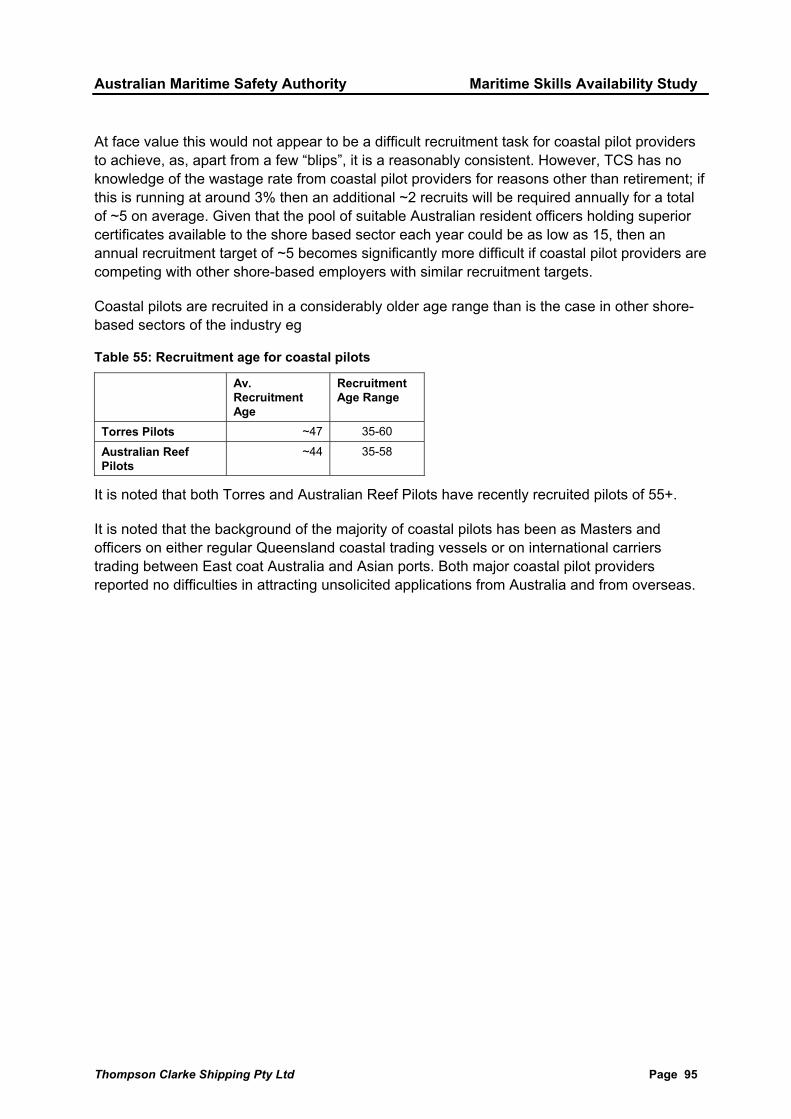
Australian Maritime Safety Authority Maritime Skills Availability Study
Thompson Clarke Shipping Pty Ltd Page 95
At face value this would not appear to be a difficult recruitment task for coastal pilot providers to achieve, as, apart from a few “blips”, it is a reasonably consistent. However, TCS has no knowledge of the wastage rate from coastal pilot providers for reasons other than retirement; if this is running at around 3% then an additional ~2 recruits will be required annually for a total of ~5 on average. Given that the pool of suitable Australian resident officers holding superior certificates available to the shore based sector each year could be as low as 15, then an annual recruitment target of ~5 becomes significantly more difficult if coastal pilot providers are competing with other shore-based employers with similar recruitment targets.
Coastal pilots are recruited in a considerably older age range than is the case in other shore-based sectors of the industry eg
Table 55: Recruitment age for coastal pilots
Av. Recruitment Age
Recruitment Age Range
Torres Pilots ~47 35-60
Australian Reef Pilots
~44 35-58
It is noted that both Torres and Australian Reef Pilots have recently recruited pilots of 55+.
It is noted that the background of the majority of coastal pilots has been as Masters and officers on either regular Queensland coastal trading vessels or on international carriers trading between East coat Australia and Asian ports. Both major coastal pilot providers reported no difficulties in attracting unsolicited applications from Australia and from overseas.