mark hart.presentation to the erc conference 30.11.2016
TRANSCRIPT
Professor Mark Hart
ERC

Dashboard – Focus on Geography of Growing Firms
• Video highlighted the wide range of variations in the well-known OECD High-Growth Firm (HGF)
• However, while useful it is restrictive – need to understand the various types of firms that are growing and where they are concentrated
• Greater granularity in growth metrics better informs the development of local and regional economic policy

Firm Survival and Growth
3
Start-ups achieving at least £1m T/O after 3 years
Established businesses growing from £1-2m to £3m+ T/O
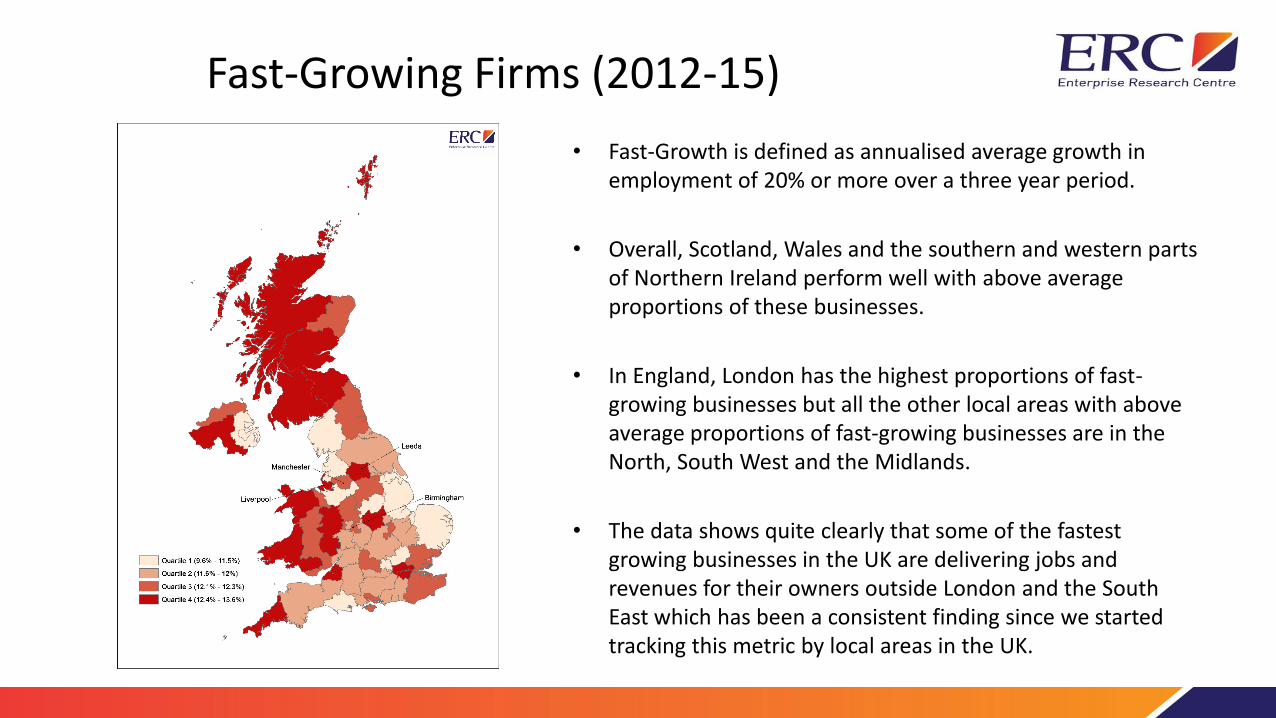
Fast-Growing Firms (2012-15)
• Fast-Growth is defined as annualised average growth in employment of 20% or more over a three year period.
• Overall, Scotland, Wales and the southern and western parts of Northern Ireland perform well with above average proportions of these businesses.
• In England, London has the highest proportions of fast-growing businesses but all the other local areas with above average proportions of fast-growing businesses are in the North, South West and the Midlands.
• The data shows quite clearly that some of the fastest growing businesses in the UK are delivering jobs and revenues for their owners outside London and the South East which has been a consistent finding since we started tracking this metric by local areas in the UK.

Driving Business Support Interventions
• Does confirm the value of locally differentiated policies reflecting the local realities of business dynamics
• Something long recognised in Scotland, Wales and Northern Ireland but constantly being re-worked in England!

A Simple Story of Productivity! – 2008-15Turnover Growth
Job Growth
Zero
Zero
‘Green Zone’
+
+
+
-
-
-
Only one ‘space’ where growth in T/O; Jobs and productivity are all +ve – the ‘green zone’
But sparsely populated with firms – approx. 10%
…and more than half of them where there is very little growth – the blue triangle
Rule of thumb – 3 out of 4 firms which grow turnover grow productivity; 1 in 5 firms which grow jobs grow productivity
Productivity and High-Growth Firms?
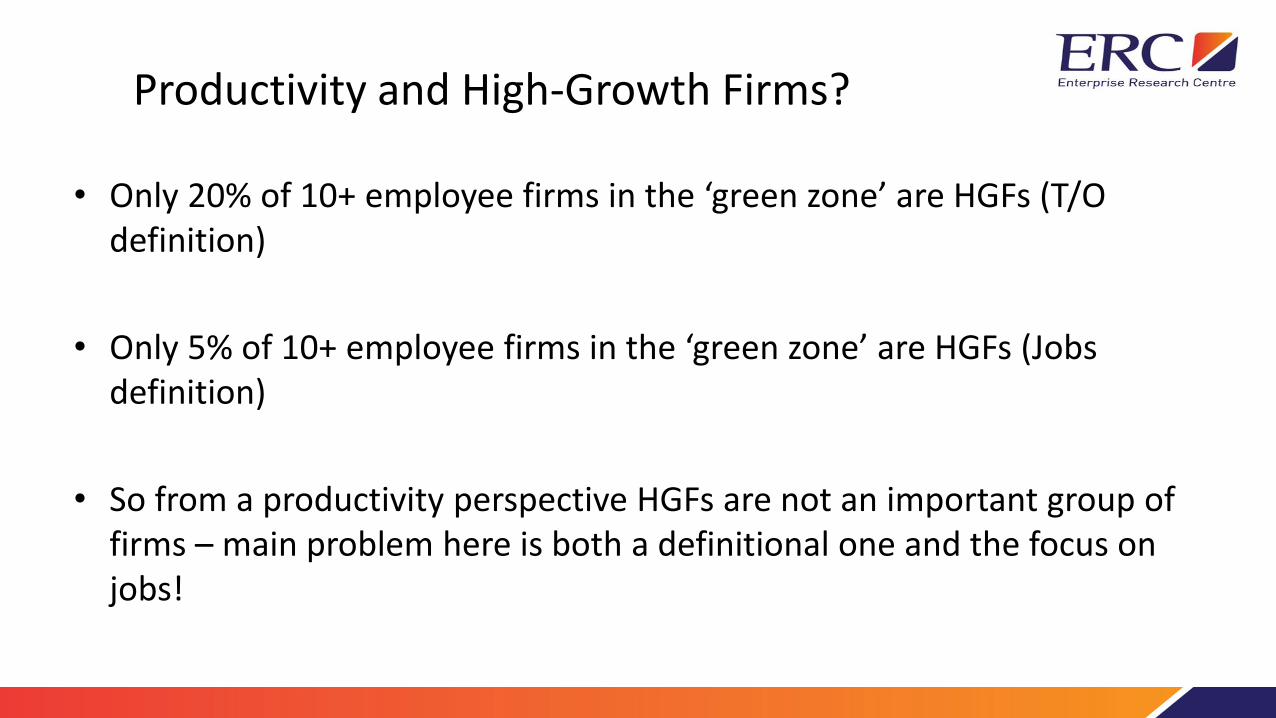
• Only 20% of 10+ employee firms in the ‘green zone’ are HGFs (T/O definition)
• Only 5% of 10+ employee firms in the ‘green zone’ are HGFs (Jobs definition)
• So from a productivity perspective HGFs are not an important group of firms – main problem here is both a definitional one and the focus on jobs!
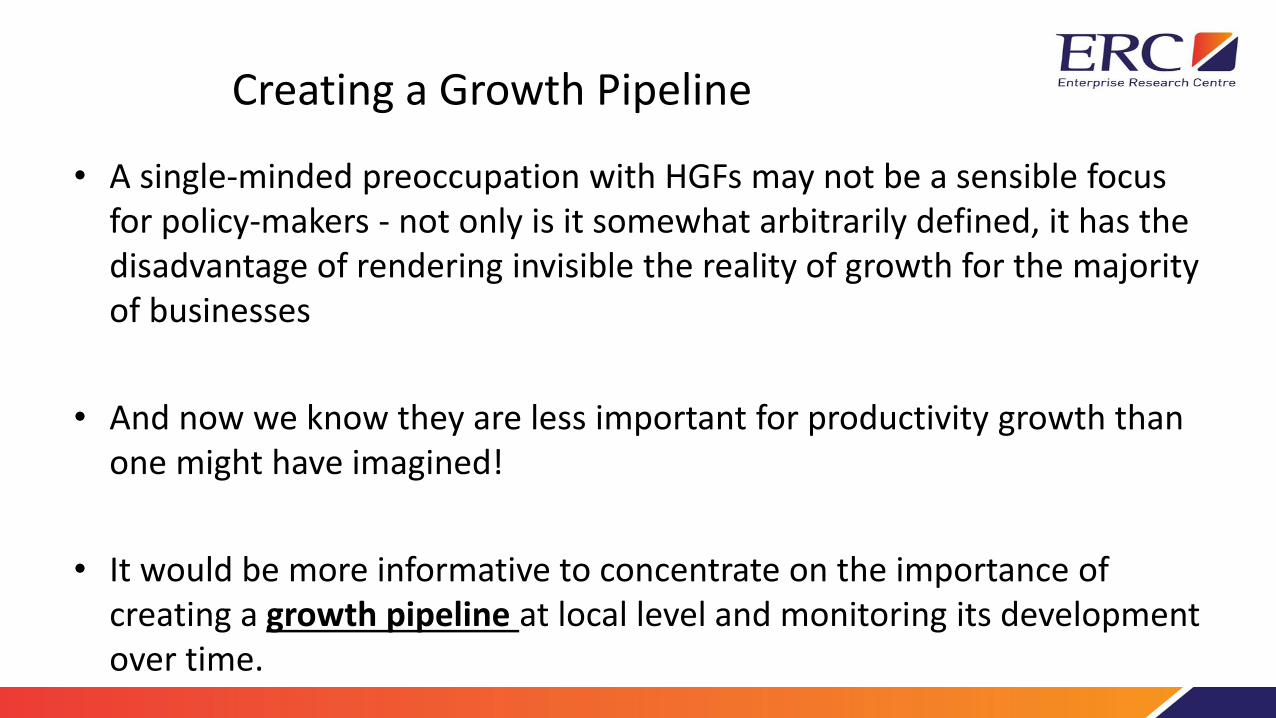
Creating a Growth Pipeline
• A single-minded preoccupation with HGFs may not be a sensible focus for policy-makers - not only is it somewhat arbitrarily defined, it has the disadvantage of rendering invisible the reality of growth for the majority of businesses
• And now we know they are less important for productivity growth than one might have imagined!
• It would be more informative to concentrate on the importance of creating a growth pipeline at local level and monitoring its development over time.

A Fresh Look at the SME Population
• Build a growth pipeline around the following:
– Potential and Nascent Entrepreneurs
– Lone Rangers and the unwilling self-employed
– Steady Eddies – limited entrepreneurial intensity and low risk tolerance
– Rising Stars – strong growth ambition but in need of leadership skills to implement innovation and internationalisation and engage in external networks
– Leading Lights – established firms with sustained growth ambition based on core management competencies

Thank you!
Questions and comments?
More information at http://enterpriseresearch.ac.uk/
Contact us about this research: Mark Hart [email protected]
This work reflects the joint effort by the research team of the ERC, including
Michael Anyadike-Danes, Karen Bonner and Mark Hart.
This work contains statistical data from ONS which is Crown Copyright. The use of these data does not imply the
endorsement of the data owner or the UK Data Service at the UK Data Archive in relation to the interpretation or
analysis of the data. This work uses research datasets which may not exactly reproduce National Statistics aggregates.
