market analysis - georgia
TRANSCRIPT

John Wall and Associates Market Analysis The Legacy at Durham Family Tax Credit (Sec. 42) Apartments Unincorporated Monroe County near Macon, Georgia Monroe County Prepared For: The Legacy at Durham, L.P. May 2018 PCN: 18-030
P o s t O f f i c e B o x 1 8 3 5 S e n e c a , S C 2 9 6 7 9 Te l e p h o n e ( 8 6 4 ) 2 6 1 - 3 1 4 7 j o h n @ j o h n w a l l a n d a s s o c i a t e s . c o m w w w . j o h n w a l l a n d a s s o c i a t e s . c o m

John Wall and Associates 2
The Legacy at Durham Macon, Georgia PCN: 18-030
Foreword Qualifications Statement John Wall and Associates specializes in market analysis, data mapping, and analysis of troubled properties. The firm began in 1983 concentrating on work in the Southeastern United States. In 1990, the office expanded its work to the entire United States.
John Wall and Associates has done over 2,600 market analyses, the majority of these being for apartment projects (both conventional and affordable). However, the firm is equipped for, and has done many other types of real estate market analyses, data mapping, troubled property analysis, shopping center master plans, industrial park master plans, housing and demographic studies, land planning projects, site analysis, location analysis and GIS projects. Clients include private developers, government officials, syndicators and lending institutions.
John Wall and Associates is a charter member of the National Council of Housing Market Analysts (NCHMA). All market analysts in our office have successfully passed the NCHMA peer review process and possess their HUD MAP certificates.
Bob Rogers has a BS in Business from Penn State University, and an MBA from the University of Tennessee. He has been a market analyst with John Wall and Associates since 1992. He has served as Vice Chair and Co-Chair of the NCHMA Standards Committee (from 2004 to 2010). As Co-Chair, he led the revision of the NCHMA market study model content and market study terms. He was lead author for NCHMA’s “Selecting Comparable Properties” best practices paper and also NCHMA’s “Field Work” white paper. In 2007, he wrote “Ten Things Developers Should Know About Market Studies” for Affordable Housing Finance Magazine. In 2014 Mr. Rogers authored the draft NCHMA paper “Senior Housing Options”.
Joe Burriss has a Bachelor of Science degree in Marketing from Clemson University, and has been a market analyst with John Wall and Associates since 1999. He has successfully completed the National Council of Housing Market Analysts (NCHMA) peer review process, and has served as a member of the council’s membership committee. In addition to performing market analysis, Mr. Burriss maintains many of the firm’s client relationships and is responsible for business development.
Release of Information This report shall not be released by John Wall and Associates to persons other than the client and his/her designates for a period of at least sixty (60) days. Other arrangements can be made upon the client’s request.
Truth and Accuracy It is hereby attested to that the information contained in this report is true and accurate. The report can be relied upon as a true assessment of the low income housing rental market. However, no assumption of liability is being made or implied.
Identity of Interest The market analyst will receive no fees contingent upon approval of the development by any agency or lending institution, before or after the fact, and the market analyst will have no interest in the housing development.
John Wall and Associates 3
The Legacy at Durham Macon, Georgia PCN: 18-030
Certifications
Certification of Physical Inspection I affirm that I, or an individual employed by my company, have made a physical inspection of the market area and that information has been used in the full assessment of the need and demand for new rental units.
Required Statement I affirm that I have made a physical inspection of the market area and the subject property and that information has been used in the full study of the need and demand for the proposed units. The report was written according to DCA’s market study requirements, the information included is accurate and the report can be relied upon by DCA as a true assessment of the low-income housing rental market.
To the best of my knowledge, the market can (cannot) support the development as shown in the study. I understand that any misrepresentation of this statement may result in the denial of further participation in DCA’s rental housing programs. I also affirm that I have no interest in the development or relationship with the ownership entity and my compensation is not contingent on this development being funded
DCA may rely on the representation made in the market study provided, and the document is assignable to other lenders that are parties to the DCA loan transaction.
NCHMA Member Certification This market study has been prepared by John Wall and Associates, a member in good standing of the National Council of Housing Market Analysts (NCHMA). This study has been prepared in conformance with the standards adopted by NCHMA for the market analysts’ industry. These standards include the Standard Definitions of Key Terms Used in Market Studies, and Model Content Standards for the Content of
Market Studies. These standards are designed to enhance the quality of market studies and to make them easier to prepare, understand, and use by market analysts and by the end users. These Standards are voluntary only, and no legal responsibility regarding their use is assumed by the National Council of Housing Market Analysts.
John Wall and Associates is duly qualified and experienced in providing market analysis for Affordable Housing. The company’s principals participate in the National Council of Housing Market Analysts (NCHMA) educational and information sharing programs to maintain the highest professional standards and state-of-the-art knowledge. John Wall and Associates is an independent market analyst. No principal or employee of John Wall and Associates has any financial interest whatsoever in the development for which this analysis has been undertaken.
(Note: Information on the National Council of Housing Market Analysts may be obtained by calling 202-939-1750, or by visiting www.housingonline.com).
Submitted and attested to by:
_____________________________
Joe Burriss, Principal
Date
5-11-18
_____________________________
Bob Rogers, Principal
Date
5-11-18

John Wall and Associates 4
The Legacy at Durham Macon, Georgia PCN: 18-030
Table of Contents A. Executive Summary ............................................................... 8A.1 Development Description ............................................................ 8A.2 Site Description/Evaluation ......................................................... 9A.3 Market Area Definition ................................................................ 9A.4 Community Demographic Data .................................................. 9A.5 Economic Data ............................................................................. 10A.6 Development Specific Affordability and Demand Analysis ... 11A.7 Competitive Rental Analysis ...................................................... 12A.8 Absorption/Stabilization Estimate ............................................ 12A.9 Overall Conclusion ...................................................................... 12A.10 DCA Summary Table .................................................................. 14A.11 Demand ........................................................................................ 15A.12 NCHMA Capture Rate ............................................................... 16B. Development Description ................................................... 17B.1 Development Location ................................................................ 17B.2 Construction Type ....................................................................... 17B.3 Occupancy .................................................................................... 17B.4 Target Income Group ................................................................. 17B.5 Special Population ....................................................................... 17B.6 Structure Type .............................................................................. 17B.7 Unit Sizes, Rents and Targeting ................................................. 17B.8 Development Amenities ............................................................. 17B.9 Unit Amenities ............................................................................. 17B.10 Rehab ............................................................................................ 17B.11 Utilities Included ......................................................................... 18B.12 Projected Certificate of Occupancy Date .................................. 18C. Site Evaluation ..................................................................... 19C.1 Date of Site Visit .......................................................................... 19C.2 Physical Features of Site and Adjacent Parcels ........................ 19C.3 Surrounding Roads, Transportation, Amenities, Employment,
Community Services ................................................................... 19C.4 Site and Neighborhood Photos .................................................. 21C.5 Site Location Map ........................................................................ 24C.6 Land Uses of the Immediate Area ............................................. 26C.7 Public Safety Issues ...................................................................... 27C.8 Multifamily Residential Developments ..................................... 28C.9 Road and infrastructure Improvements ................................... 29C.10 Ingress, Egress, and Visibility ..................................................... 29C.11 Observed Visible Environmental or Other Concerns ............. 29C.12 Conclusion ................................................................................... 29D. Market Area ......................................................................... 30D.1 Market Area Determination ....................................................... 31D.2 Driving Times and Place of Work ............................................. 31D.3 Market Area Definition .............................................................. 31E. Demographic Analysis ......................................................... 32E.1 Population .................................................................................... 32E.2 Households ................................................................................... 33F. Employment Trends ............................................................ 39F.1 Total Jobs ...................................................................................... 39F.2 Jobs by Industry and Occupation .............................................. 40F.3 Major Employers ......................................................................... 42F.4 Employment (Civilian Labor Force) ......................................... 42F.5 Employment Concentrations Map ............................................ 43F.6 Economic Summary .................................................................... 44G. Development-Specific Affordability & Demand Analysis .. 46G.1 Income Restrictions ..................................................................... 46G.2 Affordability ................................................................................. 48G.3 Demand ........................................................................................ 52G.4 Demand for New Units ............................................................... 55G.5 Capture Rate Analysis Chart ...................................................... 56H. Competitive Analysis (Existing Competitive Rental
Environment) ...................................................................... 57H.1 Survey of Apartments ................................................................. 57H.2 Additional information on competitive environment ............ 58H.3 Apartment Locations Map ......................................................... 59H.4 Amenity Analysis ......................................................................... 60
H.5 Selection of Comps ...................................................................... 60H.6 Long Term Occupancy ................................................................ 60H.7 New “Supply” ............................................................................... 60H.8 Average Market Rent and Rent Differential ............................. 61H.9 Information on Other DCA properties ..................................... 62H.10 Rental Trends in the Market Area ............................................. 62H.11 Impact of Foreclosed, Abandoned, etc. Properties .................. 64H.12 Primary Housing Voids .............................................................. 64H.13 Long Term Impact ....................................................................... 64H.14 Building Permits Issued .............................................................. 64I. Absorption & Stabilization Rates ........................................ 66J. Interviews ............................................................................ 67J.1 Apartment Managers .................................................................. 67J.2 Economic Development .............................................................. 67K. Conclusions and Recommendations ................................... 68L. Signed Statement Requirements ......................................... 69M. Market Study Representation .............................................. 70N. Crime Appendix .................................................................. 71O. NCHMA Market Study Index/Checklist ............................. 72P. Business References ............................................................. 73Q. Résumés ............................................................................... 74

John Wall and Associates 5
The Legacy at Durham Macon, Georgia PCN: 18-030
Table of Tables Table 1—Unit Mix .......................................................................................... 8Table 2—Percent of Renter Households in Appropriate Income
Ranges for the Market Area ........................................................... 10Table 3—Number of Renter Households in Appropriate Income
Ranges for the Market Area ........................................................... 11Table 4—Capture Rates by AMI Targeting ................................................ 11Table 4b—Capture Rate by Bedrooms and Targeting .............................. 12Table 5—DCA Summary Table ................................................................... 14Table 6—Demand ......................................................................................... 15Table 7—Market Bedroom Mix ................................................................... 15Table 8—NCHMA Capture Rate ................................................................ 16Table 9—Unit Sizes, Rents and Targeting .................................................. 17Table 10—Community Amenities .............................................................. 25Table 11—Crimes Reported to Police ......................................................... 27Table 12—Workers’ Travel Time to Work for the Market Area (Time
in Minutes) ...................................................................................... 31Table 13—Population Trends ...................................................................... 32Table 14—Persons by Age ............................................................................ 32Table 15—Race and Hispanic Origin .......................................................... 33Table 16—Household Trends ...................................................................... 34Table 17—Occupied Housing Units by Tenure ........................................ 34Table 18—Population ................................................................................... 34Table 19—Households .................................................................................. 35Table 20—Population and Household Projections ................................... 35Table 21—Housing Units by Persons in Unit ............................................ 37Table 22—Number of Households in Various Income Ranges ............... 38Table 23—Covered Employment ................................................................ 39Table 24—Occupation of Employed Persons Age 16 Years And Over .. 40Table 25—Industry of Employed Persons Age 16 Years And Over ........ 41Table 26—Major Employers ........................................................................ 42Table 27—Employment Trends .................................................................. 42Table 28—Median Wages by Industry ....................................................... 44Table 29—Maximum Income Limit (HUD FY 2017) .............................. 46Table 30—Minimum Incomes Required and Gross Rents ...................... 47Table 31—Qualifying Income Ranges by Bedrooms and Persons Per
Household ....................................................................................... 48Table 32—Qualifying and Proposed and Programmatic Rent
Summary .......................................................................................... 48
Table 33—Number of Specified Households in Various Income Ranges by Tenure ............................................................................ 49
Table 34—Percent of Renter Households in Appropriate Income Ranges for the Market Area ........................................................... 50
Table 35—New Renter Households in Each Income Range for the Market Area ..................................................................................... 52
Table 36—Percentage of Income Paid For Gross Rent (Renter Households in Specified Housing Units) ..................................... 53
Table 37—Rent Overburdened Households in Each Income Range for the Market Area ........................................................................ 53
Table 38—Substandard Occupied Units ..................................................... 54Table 39—Substandard Conditions in Each Income Range for the
Market Area ..................................................................................... 54Table 40—Demand for New Units .............................................................. 55Table 41—Capture Rate by Unit Size (Bedrooms) and Targeting ........... 56Table 42—List of Apartments Surveyed ..................................................... 57Table 43—Comparison of Comparables to Subject .................................. 57Table 44—Schedule of Rents, Number of Units, and Vacancies for
Apartment Units ............................................................................. 58Table 45—Apartment Units Built or Proposed Since the Base Year ....... 60Table 46—Market Rent Advantage ............................................................. 61Table 47—Tenure by Bedrooms .................................................................. 62Table 48—Building Permits Issued ............................................................. 64
Table of Maps Regional Locator Map ..................................................................................... 6Area Locator Map ............................................................................................ 7Site and Neighborhood Photos and Adjacent Land Uses Map ................ 20Site Location Map .......................................................................................... 24Neighborhood Map ....................................................................................... 26Apartment Locations Map ........................................................................... 28Market Area Map .......................................................................................... 30Tenure Map .................................................................................................... 36Employment Concentrations Map .............................................................. 43Median Household Income Map ................................................................. 51Apartment Locations Map ........................................................................... 59Median Home Value Map ............................................................................ 63Median Gross Rent Map ............................................................................... 65

John Wall and Associates 6
The Legacy at Durham Macon, Georgia PCN: 18-030
Introduction Purpose The purpose of this report is to analyze the apartment market for a specific site in Macon, Georgia.
Scope Considered in this report are market depth, bedroom mix, rental rates, unit size, and amenities. These items are investigated principally through a field survey conducted by John Wall and Associates. Unless otherwise noted, all charts and statistics are the result of this survey.
In general, only complexes of 30 units or more built since 1980 are considered in the field survey. Older or smaller developments are sometimes surveyed when it helps the analysis. Developments with rent subsidized units are included, if relevant, and noted.
Methodology Three separate approaches to the analysis are used in this report; each is a check on the other. By using three generally accepted approaches, reasonable conclusions can be drawn. The three approaches used are:
(1) Statistical (2) Like-Kind Comparison (3) Interviews
The Statistical approach uses Census data and local statistics; 2010 is used as a base year. The population that would qualify for the proposed units is obtained from these figures.
The Like-Kind Comparison approach collects data on developments similar in nature to that which is being proposed and analyzes how they are doing. This approach assesses their strong points, as well as weak points, and compares them with the subject.
The last section, Interviews, assesses key individuals’ special knowledge about the market area. While certainly subjective and limited in perspective, their collective knowledge, gathered and assessed, can offer valuable information.
Taken individually, these three approaches give a somewhat restricted view of the market. However, by examining them together, knowledge sufficient to draw reasonable conclusions can be achieved.
Limitations This market study was written according to the Client’s Market Study Guide. To the extent this guide differs from the NCHMA Standard Definitions of Key Terms or Model Content Standards, the client’s guide has prevailed.
Regional Locator Map

John Wall and Associates 7
The Legacy at Durham Macon, Georgia PCN: 18-030
Area Locator Map

John Wall and Associates 8
The Legacy at Durham Macon, Georgia PCN: 18-030
A. Executive Summary The projected completion date of the proposed development is on or before 12/31/2020. The market area consists of Census tracts 121.01, 121.02, 134.07, 134.08, 134.09, 134.10, and 134.11 in Bibb County as well as tracts 503.01 (30%) and 503.02 (72%) in Monroe County. The proposed development consists of 72 units of new construction. The proposed development is for family households with incomes at 50% and 60% of AMI. Rents range from $450 to $699.
A.1 Development Description • Address:
New Forsyth Road • Construction and occupancy types:
New construction Duplex Family
• Unit mix including bedrooms, bathrooms, square footage, income targeting, rents, and utility allowance: Table 1—Unit Mix
Number Square Net Utility Gross Target AMI Bedrooms Baths of Units Feet Rent Allow. Rent Population 50% 1 1 6 769 450 96 546 Tax Credit 50% 2 2 2 976 535 121 656 Tax Credit 50% 2 2.5 3 1,075 535 121 656 Tax Credit 50% 3 2 1 1,229 610 148 758 Tax Credit 50% 3 2.5 3 1,422 610 148 758 Tax Credit 60% 1 1 4 769 515 96 611 Tax Credit 60% 2 2.5 31 1,075 615 121 736 Tax Credit 60% 3 2.5 22 1,422 699 148 847 Tax Credit
Total Units 72 Tax Credit Units 72 PBRA Units 0 Mkt. Rate Units 0
• Any additional subsidies available including project based rental assistance: There are none.
• Brief description of proposed amenities and how they compare to existing properties: o Development Amenities:
Laundry room, clubhouse/community center, playground, and covered picnic pavilion. o Unit Amenities:
Refrigerator, range/oven, microwave, dishwasher, HVAC, and blinds. o Utilities Included:
Trash.
The subject’s amenities are typical of modern tax credit apartments. River Walk, the only tax credit apartment in the market area, has a pool.

John Wall and Associates 9
The Legacy at Durham Macon, Georgia PCN: 18-030
A.2 Site Description/Evaluation • A brief description of physical features of the site and adjacent parcels:
The site is somewhat sloped and wooded. There is a subdivision to the north and woods in the other directions.
• A brief overview of the neighborhood land composition (residential, commercial, industrial, agricultural:
The site is between a subdivision and the Bass Pro shopping center. None of the Bass Pro outparcels have been developed yet.
• A discussion of site access and visibility:
The site has great access and great visibility from New Forsyth Road. • Any significant positive or negative aspects of the subject site:
Positive: nice area with nearby shopping Negative: none
• A brief summary of the site’s proximity to neighborhood services including shopping, medical care, employment concentrations, public transportation, etc.
There are a wide variety of services within two miles of the site. Macon-Bibb transportation has a fixed-route stop in the nearby Bass Pro Shops parking lot. At this time there are is no public transportation provided by Monroe County.
• Public Safety Issues
See section C.7. The site does not appear to be in a problematic area. • An overall conclusion of the site’s appropriateness for the proposed development:
The site is well suited for the proposed development.
A.3 Market Area Definition • A brief definition of the primary market area including boundaries of the market area and their
approximate distance from the subject property:
The market area consists of Census tracts 121.01, 121.02, 134.07, 134.08, 134.09, 134.10, and 134.11 in Bibb County as well as tracts 503.01 (30%) and 503.02 (72%) in Monroe County. The market area boundaries are mainly Census tract boundaries. In Monroe County, the market area boundary is Pea Ridge Road in the north and straight lines in the other cases. The boundary varies from 2 miles to 10 miles.
A.4 Community Demographic Data • Current and projected household and population counts for the primary market area:
2010 population = 34,795; 2018 population = 37,381; 2020 population = 38,028 2010 households = 14,265; 2018 households = 15,735; 2020 households = 16,102
• Household tenure:
35.3% of the households in the market area rent.

John Wall and Associates 10
The Legacy at Durham Macon, Georgia PCN: 18-030
• Household income:
Table 2—Percent of Renter Households in Appropriate Income Ranges for the Market Area
AMI 50% 60% Tx. Cr. Lower Limit 18,720 20,950 18,720 Upper Limit 30,850 37,020 37,020
Mkt. Area Renter occupied: Households % # % # % # Less than $5,000 213 — 0 — 0 — 0 $5,000 to $9,999 225 — 0 — 0 — 0 $10,000 to $14,999 252 — 0 — 0 — 0 $15,000 to $19,999 289 0.26 74 — 0 0.26 74 $20,000 to $24,999 419 1.00 419 0.81 339 1.00 419 $25,000 to $34,999 863 0.59 505 1.00 863 1.00 863 $35,000 to $49,999 1,099 — 0 0.13 148 0.13 148 $50,000 to $74,999 994 — 0 — 0 — 0 $75,000 to $99,999 556 — 0 — 0 — 0 $100,000 to $149,999 138 — 0 — 0 — 0 $150,000 or more 145 — 0 — 0 — 0 Total 5,193 998 1,350 1,504 Percent in Range 19.2% 26.0% 29.0%
• Impact of foreclosed, abandoned and vacant, single and multifamily homes, and commercial properties in the PMA on the proposed development:
There are no signs of any abandonment or foreclosure that would impact the subject.
A.5 Economic Data • Trends in employment for the county and/or region:
Employment has been increasing over the past few years and has continued to do so over the past 12 months.
• Employment by sector:
The largest sector of employment is: Educational services, and health care and social assistance — 31.0%
• Unemployment trends:
Over the last 12 months, the unemployment rate has been between 3.9% and 4.9%. For 2017, the average rate was 4.5% while for 2016 the average rate was 5.2%.For the last five years unemployment has been trending down.
• Recent or planned major employment contractions or expansions:
In the past year, Macon Economic Development Commission has announced two companies that are opening and expanding in Macon-Bibb County, creating over 300 new jobs
Bo Gregory at the Development Authority of Monroe County said the plastics manufacturer, Encore, had an expansion, creating
. This includes Irving Consumer Products with 200 new jobs and Tyson Foods Distribution Center with more than 100 new jobs.
50 new jobs in Monroe County last year. He said there are more projects in the pipeline that should be decided in next few weeks. He noted that Monroe County is bisected by I-75, which allows residents to travel with great ease and short commute times. Mr. Gregory said Bibb and Peach Counties are seeing robust growth with Amazon and Sports Authority both building
John Wall and Associates 11
The Legacy at Durham Macon, Georgia PCN: 18-030
new and expanding
According to the 2017 and 2018 Georgia WARN lists, three companies in Macon-Bibb County have announced closures or layoffs in the last year, with
. He believes employees for these sites will probably represent a section of Monroe County residents that choose to commute from Monroe County, as their school system is ranked higher that many neighboring counties.
328 lost jobs
According to the 2017 and 2018 Georgia WARN lists,
. This includes J.C. Penney with 75 lost jobs, Bombardier Aircraft Services with 89 jobs lost, and HAECO with 164 jobs lost.
no companies in Monroe County
• Overall conclusion regarding the stability of the county’s overall economic environment:
have announced closures or layoffs in the last year.
The county has been growing steadily since 2009. The current economic environment will not negatively impact the demand for additional rental housing.
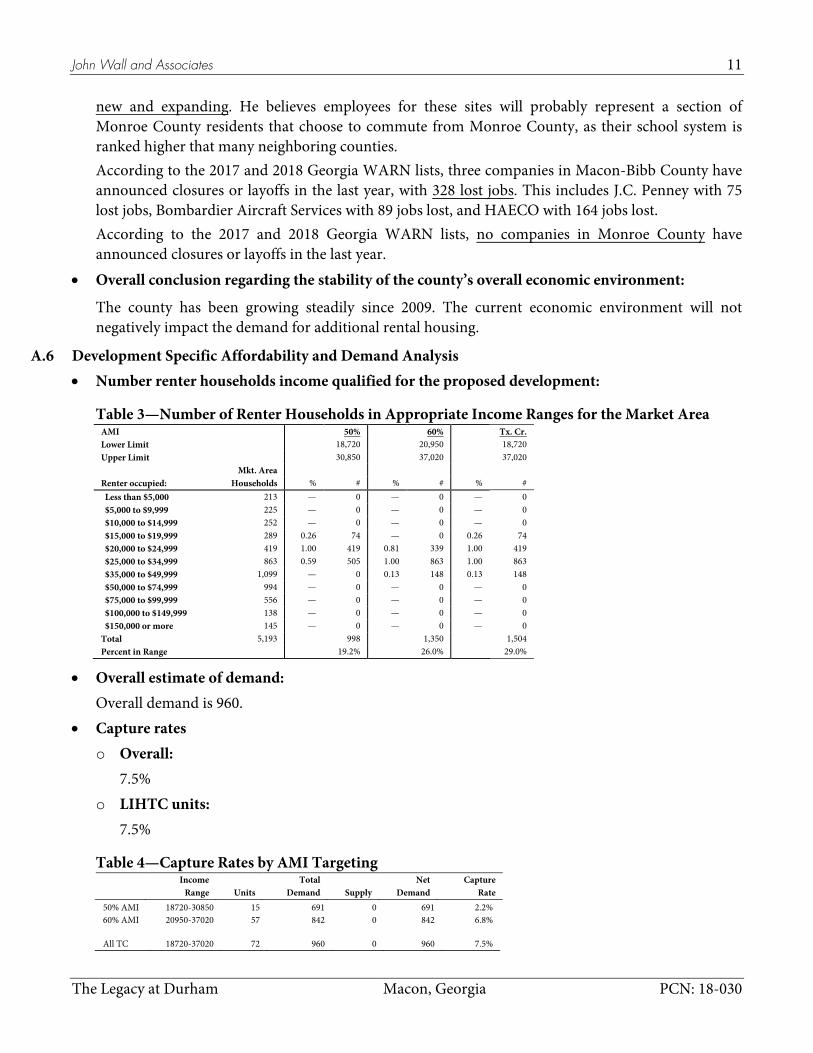
A.6 Development Specific Affordability and Demand Analysis • Number renter households income qualified for the proposed development:
Table 3—Number of Renter Households in Appropriate Income Ranges for the Market Area
AMI 50% 60% Tx. Cr. Lower Limit 18,720 20,950 18,720 Upper Limit 30,850 37,020 37,020
Mkt. Area Renter occupied: Households % # % # % # Less than $5,000 213 — 0 — 0 — 0 $5,000 to $9,999 225 — 0 — 0 — 0 $10,000 to $14,999 252 — 0 — 0 — 0 $15,000 to $19,999 289 0.26 74 — 0 0.26 74 $20,000 to $24,999 419 1.00 419 0.81 339 1.00 419 $25,000 to $34,999 863 0.59 505 1.00 863 1.00 863 $35,000 to $49,999 1,099 — 0 0.13 148 0.13 148 $50,000 to $74,999 994 — 0 — 0 — 0 $75,000 to $99,999 556 — 0 — 0 — 0 $100,000 to $149,999 138 — 0 — 0 — 0 $150,000 or more 145 — 0 — 0 — 0 Total 5,193 998 1,350 1,504 Percent in Range 19.2% 26.0% 29.0%
• Overall estimate of demand: Overall demand is 960.
• Capture rates o Overall:
7.5% o LIHTC units:
7.5%
Table 4—Capture Rates by AMI Targeting
Income Total Net Capture Range Units Demand Supply Demand Rate
50% AMI 18720-30850 15 691 0 691 2.2% 60% AMI 20950-37020 57 842 0 842 6.8%
All TC 18720-37020 72 960 0 960 7.5%
John Wall and Associates 12
The Legacy at Durham Macon, Georgia PCN: 18-030
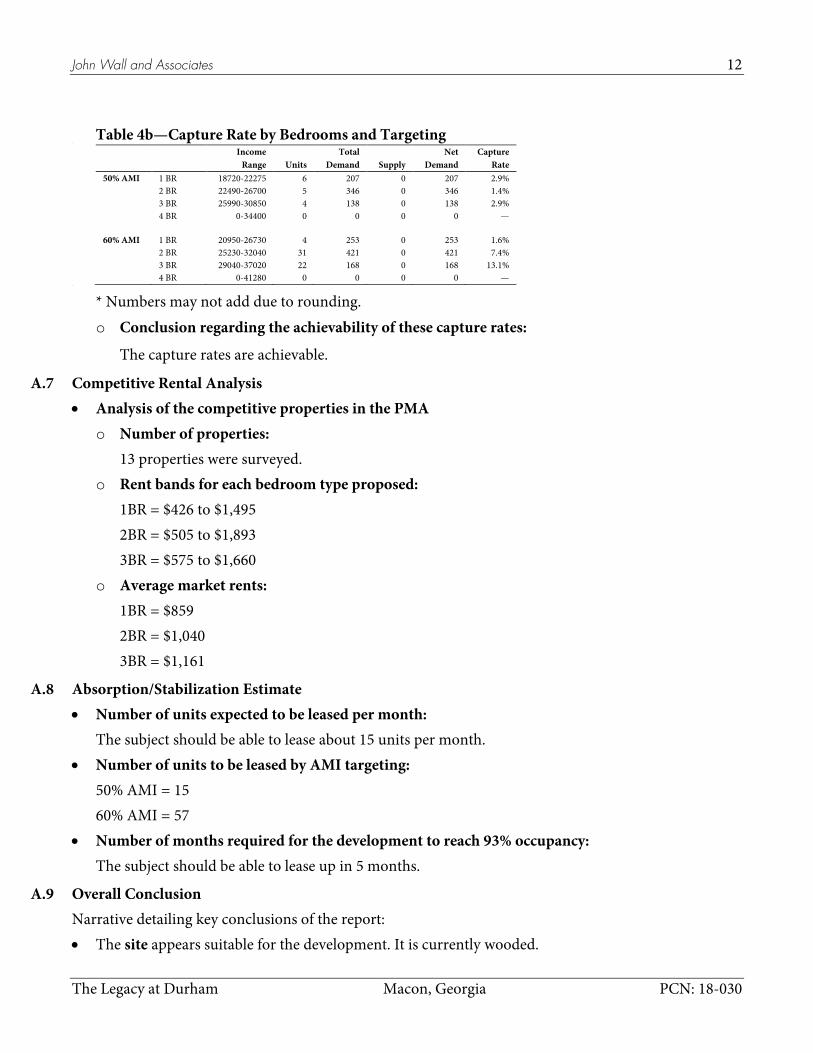
Table 4b—Capture Rate by Bedrooms and Targeting •
Income Total Net Capture Range Units Demand Supply Demand Rate
50% AMI 1 BR 18720-22275 6 207 0 207 2.9%
2 BR 22490-26700 5 346 0 346 1.4%
3 BR 25990-30850 4 138 0 138 2.9%
4 BR 0-34400 0 0 0 0 —
60% AMI 1 BR 20950-26730 4 253 0 253 1.6%
2 BR 25230-32040 31 421 0 421 7.4%
3 BR 29040-37020 22 168 0 168 13.1%
4 BR 0-41280 0 0 0 0 —
•
* Numbers may not add due to rounding. o Conclusion regarding the achievability of these capture rates:
The capture rates are achievable.
A.7 Competitive Rental Analysis • Analysis of the competitive properties in the PMA
o Number of properties: 13 properties were surveyed.
o Rent bands for each bedroom type proposed: 1BR = $426 to $1,495 2BR = $505 to $1,893 3BR = $575 to $1,660
o Average market rents: 1BR = $859 2BR = $1,040 3BR = $1,161
A.8 Absorption/Stabilization Estimate • Number of units expected to be leased per month:
The subject should be able to lease about 15 units per month. • Number of units to be leased by AMI targeting:
50% AMI = 15 60% AMI = 57
• Number of months required for the development to reach 93% occupancy: The subject should be able to lease up in 5 months.
A.9 Overall Conclusion Narrative detailing key conclusions of the report: • The site appears suitable for the development. It is currently wooded.

John Wall and Associates 13
The Legacy at Durham Macon, Georgia PCN: 18-030
• The neighborhood is compatible with the development. The immediate neighborhood is residential. • The location is well suited to the development. It is within two miles of a wide variety of goods and
services. • The population and household growth in the market area is significant. • The economy seems to be growing. • The demand for the development is strong. Overall demand is 1,001. • The capture rates for the development are reasonable. The overall tax credit capture rate is 7.5%. • The most comparable apartments are Ashley Woods, Forest Ridge, and River Walk. • Total vacancy rates of the most comparable developments are 0.0%, 3.2%, and 3.9%, respectively. • The average LIHTC vacancy rate is 3.9% (a single property, River Walk). • The overall vacancy rate among apartments surveyed is 1.9%. • There are no concessions among the apartments surveyed. • The rents, given prevailing rents, vacancy rates, and concessions in the market area, will be the
lowest in the market. • The proposed bedroom mix is reasonable for the market. • The unit sizes are reasonable for the proposal. • The subject’s amenities are typical of modern tax credit apartments. • The subject’s value should be perceived as very good. • The subject’s affordability is good from a programmatic gross rent standpoint. • Both of those interviewed felt the development would be better suited in another location. There
were definite tones of NIMBYism from those interviewed. • The proposal would have no long term impact on existing LIHTC developments.
A.9.1 Recommendations None
A.9.2 Notes There is only one tax credit apartment in the market area.
A.9.2.1 Strengths Lowest rents in the market New construction Good location
A.9.2.2 Weaknesses None
A.9.3 Conclusion The development, as proposed, should be successful.
John Wall and Associates 14
The Legacy at Durham Macon, Georgia PCN: 18-030
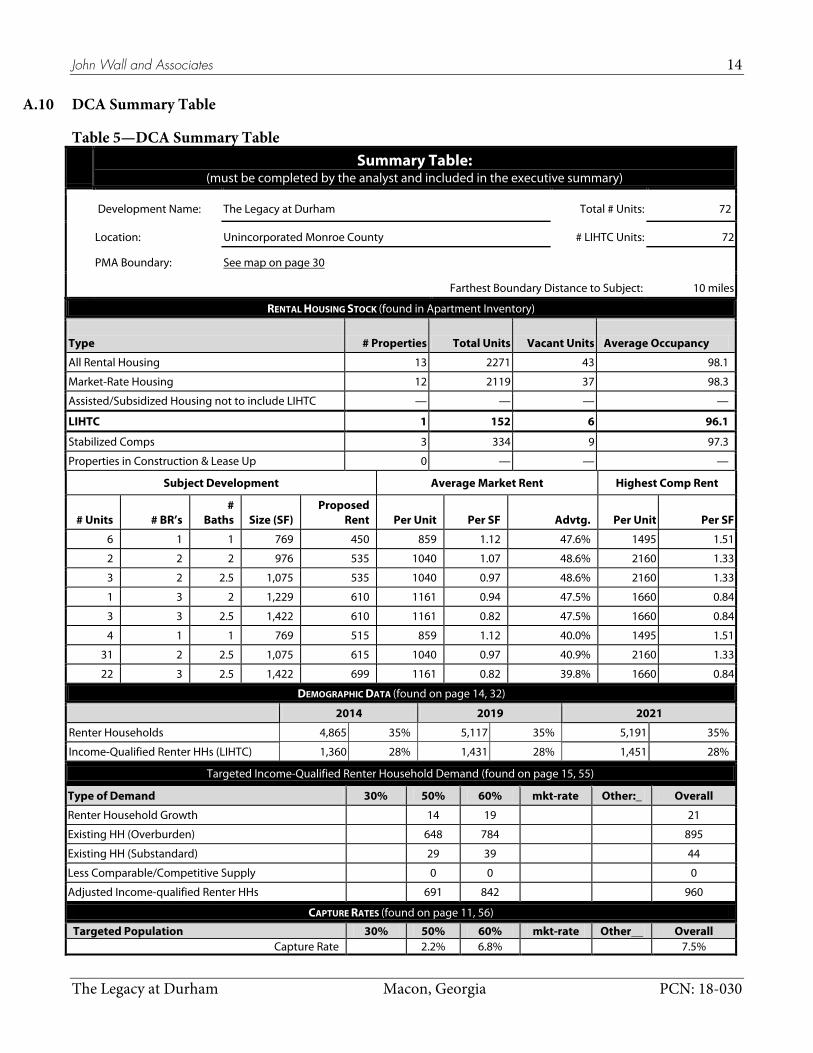
A.10 DCA Summary Table
Table 5—DCA Summary Table
Summary Table: (must be completed by the analyst and included in the executive summary)
Development Name: The Legacy at Durham Total # Units: 72
Location: Unincorporated Monroe County # LIHTC Units: 72
PMA Boundary: See map on page 30
Farthest Boundary Distance to Subject: 10 miles
RENTAL HOUSING STOCK (found in Apartment Inventory)
Type # Properties Total Units Vacant Units Average Occupancy
All Rental Housing 13 2271 43 98.1
Market-Rate Housing 12 2119 37 98.3
Assisted/Subsidized Housing not to include LIHTC — — — —
LIHTC 1 152 6 96.1
Stabilized Comps 3 334 9 97.3
Properties in Construction & Lease Up 0 — — —
Subject Development Average Market Rent Highest Comp Rent
# Units
# BR’s #
Baths Size (SF) Proposed
Rent
Per Unit
Per SF
Advtg.
Per Unit
Per SF
6 1 1 769 450 859 1.12 47.6% 1495 1.51
2 2 2 976 535 1040 1.07 48.6% 2160 1.33
3 2 2.5 1,075 535 1040 0.97 48.6% 2160 1.33
1 3 2 1,229 610 1161 0.94 47.5% 1660 0.84
3 3 2.5 1,422 610 1161 0.82 47.5% 1660 0.84
4 1 1 769 515 859 1.12 40.0% 1495 1.51
31 2 2.5 1,075 615 1040 0.97 40.9% 2160 1.33
22 3 2.5 1,422 699 1161 0.82 39.8% 1660 0.84
DEMOGRAPHIC DATA (found on page 14, 32)
2014 2019 2021
Renter Households 4,865 35% 5,117 35% 5,191 35%
Income-Qualified Renter HHs (LIHTC) 1,360 28% 1,431 28% 1,451 28%
Targeted Income-Qualified Renter Household Demand (found on page 15, 55)
Type of Demand 30% 50% 60% mkt-rate Other:_ Overall
Renter Household Growth 14 19 21
Existing HH (Overburden) 648 784 895
Existing HH (Substandard) 29 39 44
Less Comparable/Competitive Supply 0 0 0
Adjusted Income-qualified Renter HHs 691 842 960
CAPTURE RATES (found on page 11, 56)
Targeted Population 30% 50% 60% mkt-rate Other__ Overall Capture Rate 2.2% 6.8% 7.5%

John Wall and Associates 15
The Legacy at Durham Macon, Georgia PCN: 18-030
A.11 Demand
Table 6—Demand
50%
AM
I: $1
8,72
0 to
$30
,850
60%
AM
I: $2
0,95
0 to
$37
,020
Ove
rall
Tax
Cre
dit:
$18,
720
to $
37,0
20
New Housing Units Required 14 19 21
Rent Overburden Households 648 784 895
Substandard Units 29 39 44
Demand 691 842 960
Less New Supply 0 0 0
Net Demand 691 842 960
A.11.1 Market Bedroom Mix
The following bedroom mix will keep the market in balance over the long term. Diversity among projects is necessary for a healthy market.
Table 7—Market Bedroom Mix
Bedrooms Mix 1 30% 2 50% 3 20% 4 0% Total 100%
A.11.2 Absorption
Given reasonable marketing and management, the development should be able to rent up to 93% occupancy within 5 months — a few months longer if the development is completed in November, December, or January. The absorption rate determination considers such factors as the overall estimate of new household growth, the available supply of competitive units, observed trends in absorption of comparable units, and the availability of subsidies and rent specials. The absorption period is considered to start as soon as the first units are released for occupancy. With advance marketing and preleasing, the absorption period could be less.

John Wall and Associates 16
The Legacy at Durham Macon, Georgia PCN: 18-030
A.12 NCHMA Capture Rate NCHMA defines capture rate as: The percentage of age, size, and income qualified renter households in the primary market area that the property must capture to achieve the stabilized level of occupancy. Funding agencies may require restrictions to the qualified households used in the calculation including age, income, living in substandard housing, mover-ship and other comparable factors. The capture rate is calculated by dividing the total number of units at the property by the total number of age, size and income qualified renter households in the primary market area. See penetration rate for rate for entire market area. This definition varies from the capture rate used above.
Table 8—NCHMA Capture Rate
Income
Qualified
Renter
Capture Households Proposal Rate 50% AMI: $18,720 to $30,850 998 15 1.5% 60% AMI: $20,950 to $37,020 1,350 57 4.2% Overall Tax Credit: $18,720 to $37,020 1,504 72 4.8%
John Wall and Associates 17
The Legacy at Durham Macon, Georgia PCN: 18-030
B. Development Description The development description is provided by the developer.
B.1 Development Location The site is northwest of Macon, Georgia in Monroe County. It is located on New Forsyth Road, just across the county line.
B.2 Construction Type New construction
B.3 Occupancy The proposal is for occupancy by family households.
B.4 Target Income Group Low income
B.5 Special Population 5% of units designed for mobility impaired and 2% designed for sensory impaired.
B.6 Structure Type Duplex; the subject has one community and 36 residential buildings. The residential buildings have two floors. Floor plans and elevations were not available at the time the study was conducted.
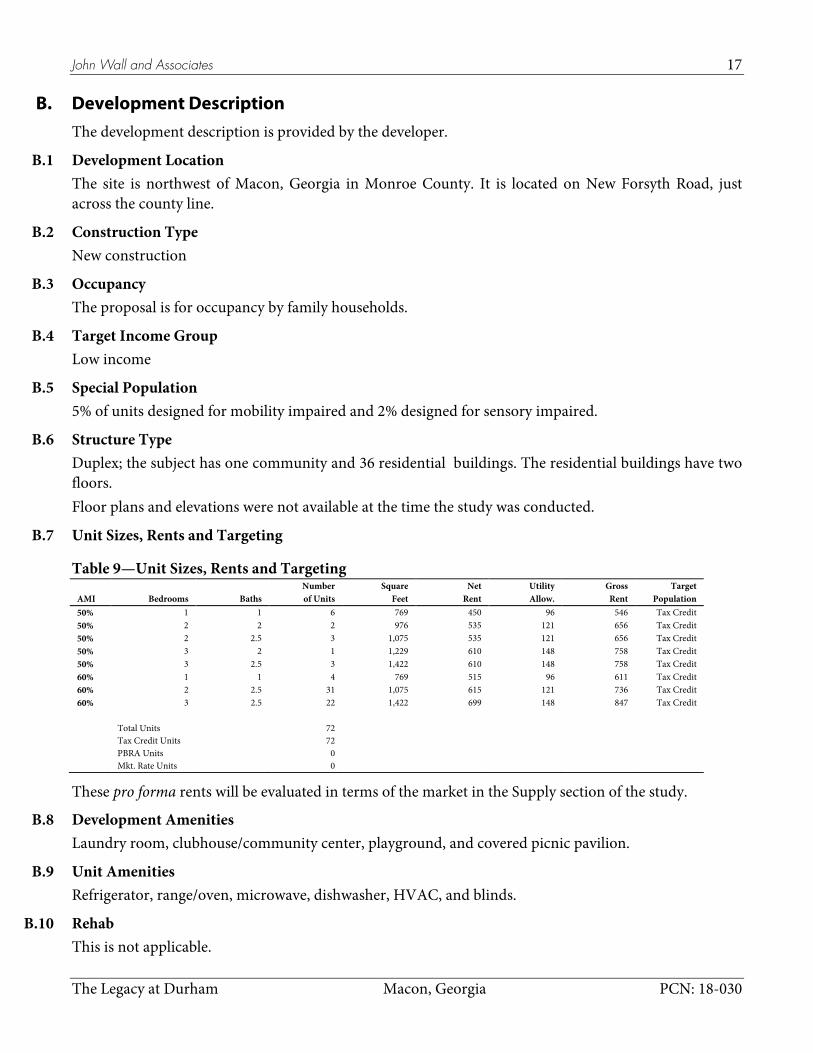
B.7 Unit Sizes, Rents and Targeting
Table 9—Unit Sizes, Rents and Targeting
Number Square Net Utility Gross Target AMI Bedrooms Baths of Units Feet Rent Allow. Rent Population 50% 1 1 6 769 450 96 546 Tax Credit 50% 2 2 2 976 535 121 656 Tax Credit 50% 2 2.5 3 1,075 535 121 656 Tax Credit 50% 3 2 1 1,229 610 148 758 Tax Credit 50% 3 2.5 3 1,422 610 148 758 Tax Credit 60% 1 1 4 769 515 96 611 Tax Credit 60% 2 2.5 31 1,075 615 121 736 Tax Credit 60% 3 2.5 22 1,422 699 148 847 Tax Credit
Total Units 72 Tax Credit Units 72 PBRA Units 0 Mkt. Rate Units 0
These pro forma rents will be evaluated in terms of the market in the Supply section of the study.
B.8 Development Amenities Laundry room, clubhouse/community center, playground, and covered picnic pavilion.
B.9 Unit Amenities Refrigerator, range/oven, microwave, dishwasher, HVAC, and blinds.
B.10 Rehab This is not applicable.
John Wall and Associates 18
The Legacy at Durham Macon, Georgia PCN: 18-030
B.11 Utilities Included Trash.
B.12 Projected Certificate of Occupancy Date It is anticipated that the subject will have its final certificates of occupancy on or before 12/31/2020.

John Wall and Associates 19
The Legacy at Durham Macon, Georgia PCN: 18-030
C. Site Evaluation C.1 Date of Site Visit
Bob Rogers visited the site on April 28th
C.2 Physical Features of Site and Adjacent Parcels
, 2018.
• Physical features:
The site is wooded and somewhat sloped. There are power lines running between the site and the road (see site photos).
• Adjacent parcels:
N: Well kept single family homes; according to Zillow, two homes on Cross Creek Circle have sold this year in the high $200s E: Woods S: New Forsyth Road, then woods W: Woods
• Condition of surrounding land uses:
All of the surrounding land uses are well maintained. • Positive and negative attributes:
Positive: Attractive neighborhood; proximity to goods, services, and amenities. Negative: None
C.3 Surrounding Roads, Transportation, Amenities, Employment, Community Services There are a wide variety of goods and services within two miles. Macon-Bibb County has some service that operates not far from the site. Route 13 (North Macon Industrial) stops at River Walk Apartments and travels along Bass Road. There is a stop at the Bass Pro Shops parking lot, a little less than half a mile from the site. It makes four morning (7:40—9:30) and four afternoon (3:44—5:38) stops at River Walk. Regular one-way fares are $1.25. On Saturday, there are two morning stops and three in the afternoon. Monroe County does not have public transportation.
N: Cross Creek Circle (no outlet) E: No roads; River Crossing Mall is about 1 ½ miles east; a medical doctor (internal medicine) is about ¼ mile east S: New Forsyth Road; Publix is about a mile south of the site, but it’s about a 2 mile drive; Bass Pro Shops is about ¼ mile south W: Cross Creek Circle (no outlet)

John Wall and Associates 20
The Legacy at Durham Macon, Georgia PCN: 18-030
Site and Neighborhood Photos and Adjacent Land Uses Map
John Wall and Associates 21
The Legacy at Durham Macon, Georgia PCN: 18-030
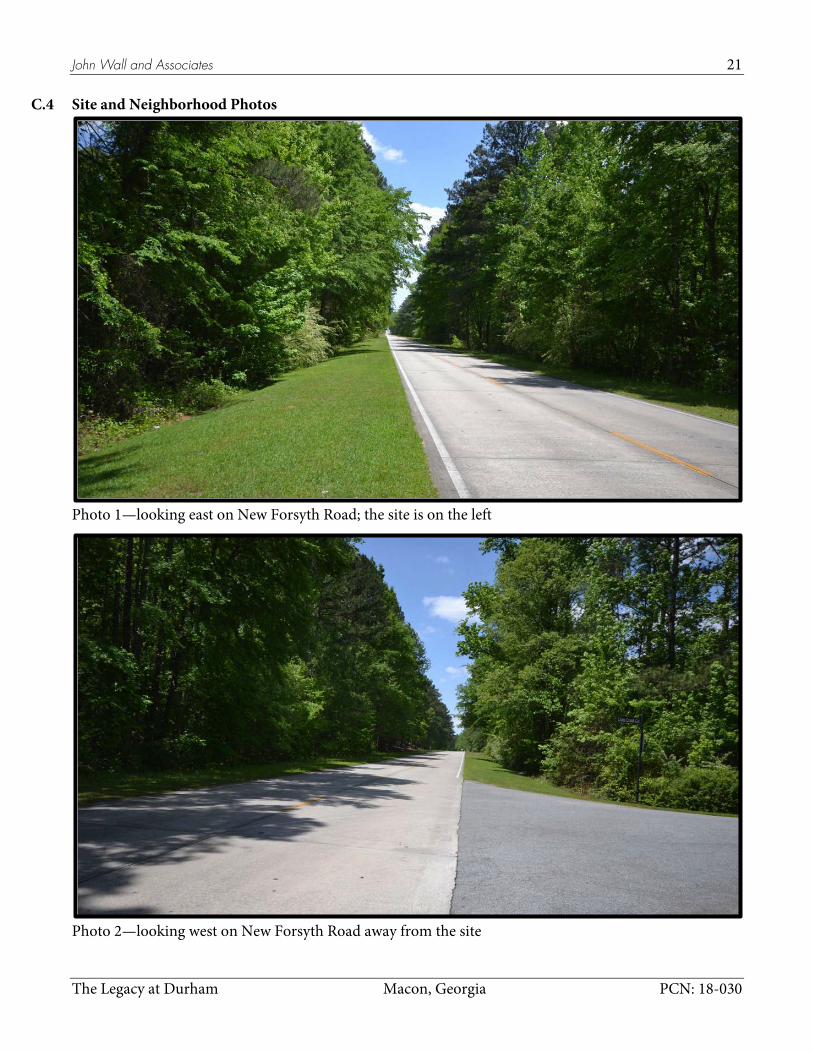
C.4 Site and Neighborhood Photos
Photo 1—looking east on New Forsyth Road; the site is on the left
Photo 2—looking west on New Forsyth Road away from the site

John Wall and Associates 22
The Legacy at Durham Macon, Georgia PCN: 18-030
Photo 3—New Forsyth Road is to the right of the trees; the site is on the left
Photo 4—house that is adjacent to the north boundary of the site

John Wall and Associates 23
The Legacy at Durham Macon, Georgia PCN: 18-030
Photo 5—Looking near the eastern boundary of the site
Photo 6—Looking east on New Forsyth Road away from the site past an entrance to the Bass Pro Shops center

John Wall and Associates 24
The Legacy at Durham Macon, Georgia PCN: 18-030
C.5 Site Location Map
Site Location Map
John Wall and Associates 25
The Legacy at Durham Macon, Georgia PCN: 18-030
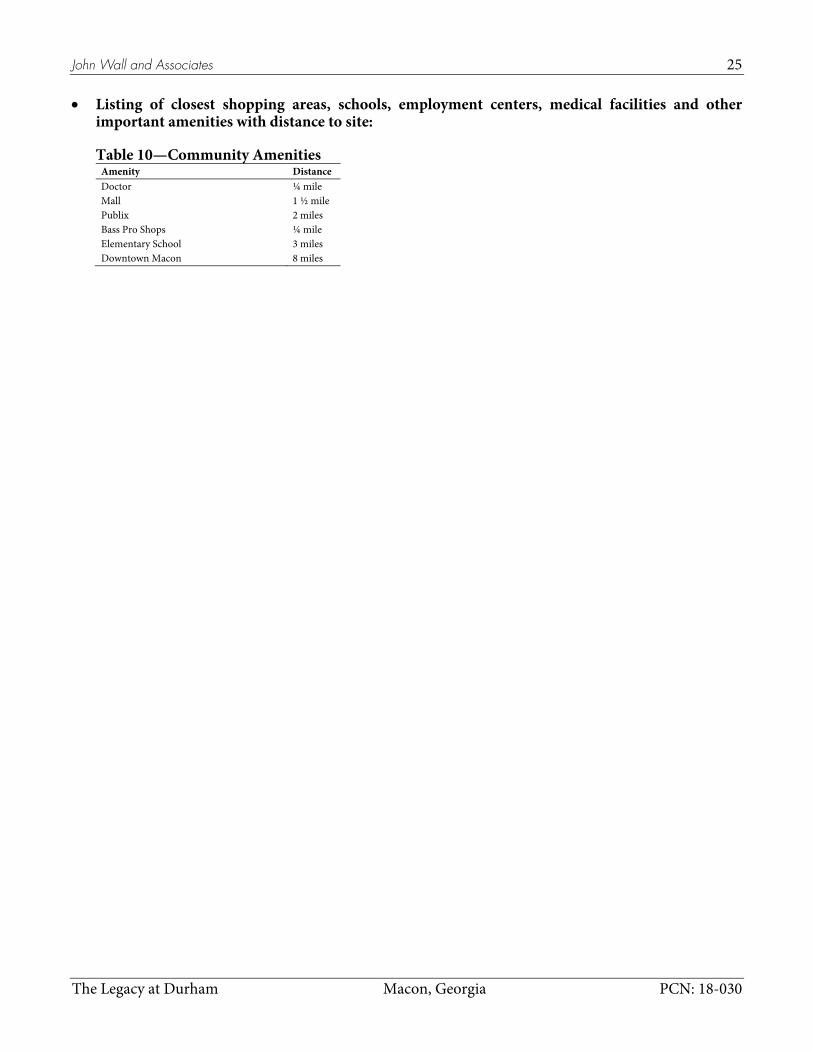
• Listing of closest shopping areas, schools, employment centers, medical facilities and other important amenities with distance to site:
Table 10—Community Amenities Amenity Distance Doctor ¼ mile Mall 1 ½ mile Publix 2 miles Bass Pro Shops ¼ mile Elementary School 3 miles Downtown Macon 8 miles

John Wall and Associates 26
The Legacy at Durham Macon, Georgia PCN: 18-030
C.6 Land Uses of the Immediate Area
Neighborhood Map

John Wall and Associates 27
The Legacy at Durham Macon, Georgia PCN: 18-030
C.7 Public Safety Issues According to the FBI, in 2016 the following crimes were reported to police:
Table 11—Crimes Reported to Police Macon-Bibb County Monroe County Population: — — Violent Crime 756 22 Murder 15 0 Rape 53 1 Robbery 261 0 Assault 427 21 Property Crime 7,934 355 Burglary 1,939 90 Larceny 5,395 236 Motor Vehicle Theft 600 29 Arson 67 1 Source: 2016 Crime in the U.S. https://ucr.fbi.gov/crime-in-the-u.s/2016/crime-in-the-u.s.-2016/tables/table-6/table-6.xls https://ucr.fbi.gov/crime-in-the-u.s/2016/crime-in-the-u.s.-2016/tables/table-8/table-8.xls
A crime map is in the appendix. The site does not appear to be in a problematic area.

John Wall and Associates 28
The Legacy at Durham Macon, Georgia PCN: 18-030
C.8 Multifamily Residential Developments
Apartment Locations Map

John Wall and Associates 29
The Legacy at Durham Macon, Georgia PCN: 18-030
C.9 Road and infrastructure Improvements No major road or infrastructure projects were noted in the immediate area that would have direct impact on the subject.
C.10 Ingress, Egress, and Visibility Access to the site is from New Forsyth Road. There are no problems with ingress and egress. The site has good visibility from New Forsyth Road.
C.11 Observed Visible Environmental or Other Concerns There were no other visible environmental or other concerns.
C.12 Conclusion The site is well-suited for the proposed development.

John Wall and Associates 30
The Legacy at Durham Macon, Georgia PCN: 18-030
D. Market Area
Market Area Map

John Wall and Associates 31
The Legacy at Durham Macon, Georgia PCN: 18-030
D.1 Market Area Determination The market area is the community where the development will be located and only those outlying rural areas that will be significantly impacted by the development, generally excluding other significant established communities. The market area is considered to be the area from which most of the prospective tenants will be drawn. Some people will move into the market area from nearby towns, while others will move away. These households are accounted for in the “Household Trends” section. The border of the market area is based on travel time, commuting patterns, the gravity model, physical boundaries, and the distribution of renters in the area. The analyst visits the area before the market area definition is finalized. Housing alternatives and local perspective will be presented in the Development Comparisons section of this report.
D.2 Driving Times and Place of Work Commuter time to work is shown below:
Table 12—Workers’ Travel Time to Work for the Market Area (Time in Minutes)
State % County % Market Area % City % Total: 4,130,939 10,302 16,425 57,210 Less than 5 minutes 98,521 2.4% 409 4.0% 427 2.6% 1,506 2.6% 5 to 9 minutes 336,571 8.1% 997 9.7% 1,497 9.1% 6,208 10.9% 10 to 14 minutes 538,763 13.0% 1,241 12.0% 3,247 19.8% 9,824 17.2% 15 to 19 minutes 643,206 15.6% 1,537 14.9% 3,829 23.3% 13,640 23.8% 20 to 24 minutes 609,415 14.8% 1,960 19.0% 3,215 19.6% 10,699 18.7% 25 to 29 minutes 246,685 6.0% 575 5.6% 594 3.6% 2,881 5.0% 30 to 34 minutes 589,816 14.3% 1,416 13.7% 1,557 9.5% 6,539 11.4% 35 to 39 minutes 129,602 3.1% 296 2.9% 306 1.9% 1,048 1.8% 40 to 44 minutes 159,145 3.9% 199 1.9% 324 2.0% 915 1.6% 45 to 59 minutes 389,636 9.4% 853 8.3% 668 4.1% 2,015 3.5% 60 to 89 minutes 279,473 6.8% 586 5.7% 510 3.1% 840 1.5% 90 or more minutes 110,106 2.7% 233 2.3% 252 1.5% 1,095 1.9%
Source: 2015-5yr ACS (Census)
D.3 Market Area Definition The market area for this report has been defined as Census tracts 121.01, 121.02, 134.07, 134.08, 134.09, 134.10, and 134.11 in Bibb County as well as tracts 503.01 (30%) and 503.02 (72%) in Monroe County (2010 Census). The market area is defined in terms of standard US Census geography so it will be possible to obtain accurate, verifiable information about it. The Market Area Map highlights this area.
D.3.1 Secondary Market Area
The secondary market area for this report has been defined as the primary market area plus Macon-Bibb County. Demand will neither be calculated for, nor derived from, the secondary market area.

John Wall and Associates 32
The Legacy at Durham Macon, Georgia PCN: 18-030
E. Demographic Analysis E.1 Population
E.1.1 Population Trends
The following table shows the population in the state, county, market area, and city for five years that the Census Bureau provides data.
Table 13—Population Trends
Year State County Market Area City 2008 9,468,815 25,864 34,516 92,284 2009 9,600,612 26,203 33,793 91,969 2010 9,714,569 26,376 35,269 91,604 2011 9,810,417 26,613 34,702 91,316 2012 9,907,756 26,788 35,083 155,023 2013 10,006,693 26,915 35,247 154,608
Sources: 2010, 2011, 2012, 2013, 2014, and 2015 5yr ACS (Census)
E.1.2 Age
Population is shown below for several age categories. The percent figures are presented in such a way as to easily compare the market area to the state, which is a “norm.” This will point out any peculiarities in the market area.
Table 14—Persons by Age
State % County % Market Area % City % Total 9,687,653 26,424 34,795 91,351 Under 20 2,781,629 28.7% 6,649 25.2% 8,929 25.7% 27,678 30.3% 20 to 34 2,015,640 20.8% 4,451 16.8% 6,677 19.2% 19,804 21.7% 35 to 54 2,788,792 28.8% 7,872 29.8% 9,490 27.3% 22,398 24.5% 55 to 61 783,421 8.1% 2,771 10.5% 3,354 9.6% 7,560 8.3% 62 to 64 286,136 3.0% 1,012 3.8% 1,192 3.4% 2,624 2.9% 65 plus 1,032,035 10.7% 3,669 13.9% 5,151 14.8% 11,287 12.4%
55 plus 2,101,592 21.7% 7,452 28.2% 9,697 27.9% 21,471 23.5% 62 plus 1,318,171 13.6% 4,681 17.7% 6,343 18.2% 13,911 15.2%
Source: 2010 Census

John Wall and Associates 33
The Legacy at Durham Macon, Georgia PCN: 18-030
E.1.3 Race and Hispanic Origin
The racial composition of the market area does not factor into the demand for units; the information below is provided for reference. Note that “Hispanic” is not a racial category. “White,” “Black,” and “Other” represent 100% of the population. Some people in each of those categories also consider themselves “Hispanic.” The percent figures allow for a comparison between the state (“norm”) and the market area.
Table 15—Race and Hispanic Origin
State % County % Market Area % City %
9,687,653 Total
26,424
34,795
91,351 8,833,964 Not Hispanic or Latino 91.2% 25,889 98.0% 33,934 97.5% 89,087 97.5%
White 5,413,920 55.9% 19,101 72.3% 24,826 71.3% 25,296 27.7% Black or African American 2,910,800 30.0% 6,249 23.6% 7,251 20.8% 61,768 67.6% American Indian 21,279 0.2% 64 0.2% 67 0.2% 146 0.2% Asian 311,692 3.2% 209 0.8% 1,237 3.6% 683 0.7% Native Hawaiian 5,152 0.1% 4 0.0% 15 0.0% 28 0.0% Some Other Race 19,141 0.2% 14 0.1% 76 0.2% 97 0.1%
Two or More Races 151,980 1.6% 248 0.9% 462 1.3% 1,069 1.2% 853,689 Hispanic or Latino 8.8% 535 2.0% 861 2.5% 2,264 2.5%
White 373,520 3.9% 264 1.0% 460 1.3% 791 0.9% Black or African American 39,635 0.4% 19 0.1% 42 0.1% 292 0.3% American Indian 10,872 0.1% 5 0.0% 7 0.0% 33 0.0% Asian 2,775 0.0% 5 0.0% 4 0.0% 18 0.0% Native Hawaiian 1,647 0.0% 0 0.0% 5 0.0% 20 0.0% Some Other Race 369,731 3.8% 214 0.8% 284 0.8% 880 1.0% Two or More Races 55,509 0.6% 28 0.1% 60 0.2% 230 0.3%
Source: 2010 Census
Note that the “Native Hawaiian” category above also includes “Other Pacific Islander” and the “American Indian” category also includes “Alaska Native.”
E.2 Households Renter Households by Age of Householder
Source: 2010 Census
John Wall and Associates 34
The Legacy at Durham Macon, Georgia PCN: 18-030
The graph above shows the relative distribution of households by age in the market area as compared to the state.
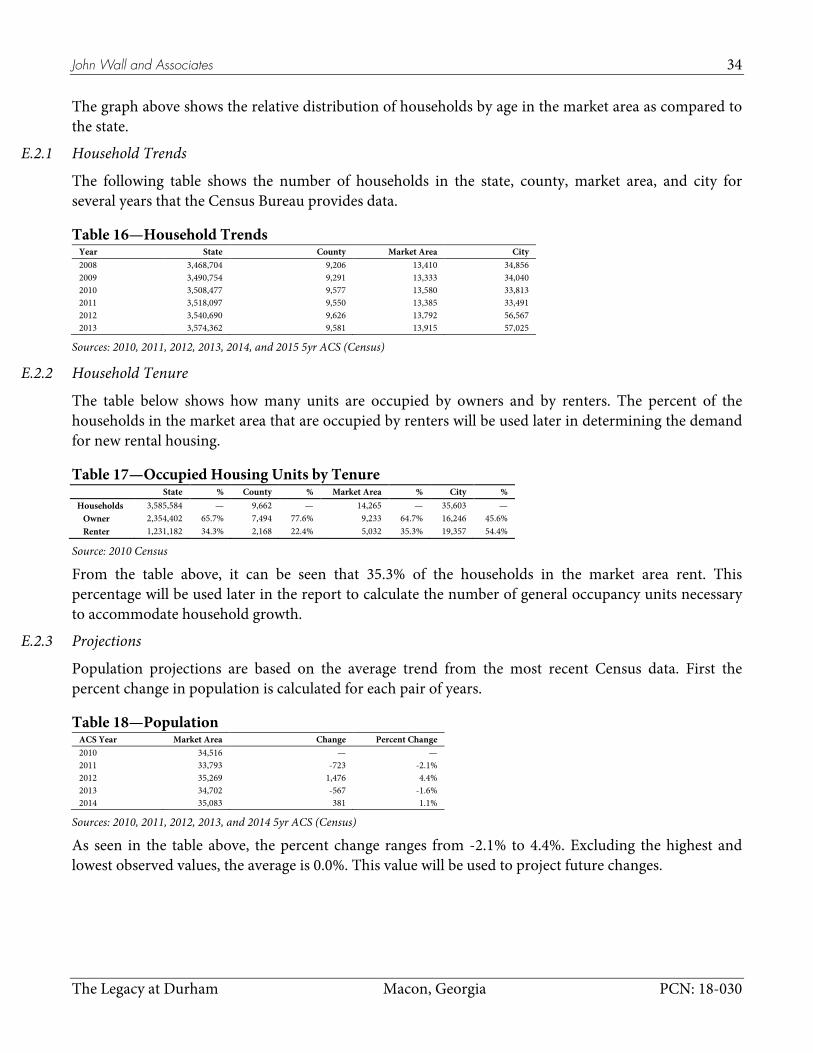
E.2.1 Household Trends
The following table shows the number of households in the state, county, market area, and city for several years that the Census Bureau provides data.
Table 16—Household Trends
Year State County Market Area City 2008 3,468,704 9,206 13,410 34,856 2009 3,490,754 9,291 13,333 34,040 2010 3,508,477 9,577 13,580 33,813 2011 3,518,097 9,550 13,385 33,491 2012 3,540,690 9,626 13,792 56,567 2013 3,574,362 9,581 13,915 57,025
Sources: 2010, 2011, 2012, 2013, 2014, and 2015 5yr ACS (Census)
E.2.2 Household Tenure
The table below shows how many units are occupied by owners and by renters. The percent of the households in the market area that are occupied by renters will be used later in determining the demand for new rental housing.
Table 17—Occupied Housing Units by Tenure
State % County % Market Area % City % Households 3,585,584 — 9,662 — 14,265 — 35,603 — Owner 2,354,402 65.7% 7,494 77.6% 9,233 64.7% 16,246 45.6% Renter 1,231,182 34.3% 2,168 22.4% 5,032 35.3% 19,357 54.4%
Source: 2010 Census
From the table above, it can be seen that 35.3% of the households in the market area rent. This percentage will be used later in the report to calculate the number of general occupancy units necessary to accommodate household growth.
E.2.3 Projections
Population projections are based on the average trend from the most recent Census data. First the percent change in population is calculated for each pair of years.
Table 18—Population
ACS Year Market Area Change Percent Change 2010 34,516 — — 2011 33,793 -723 -2.1% 2012 35,269 1,476 4.4% 2013 34,702 -567 -1.6% 2014 35,083 381 1.1%
Sources: 2010, 2011, 2012, 2013, and 2014 5yr ACS (Census)
As seen in the table above, the percent change ranges from -2.1% to 4.4%. Excluding the highest and lowest observed values, the average is 0.0%. This value will be used to project future changes.
John Wall and Associates 35
The Legacy at Durham Macon, Georgia PCN: 18-030
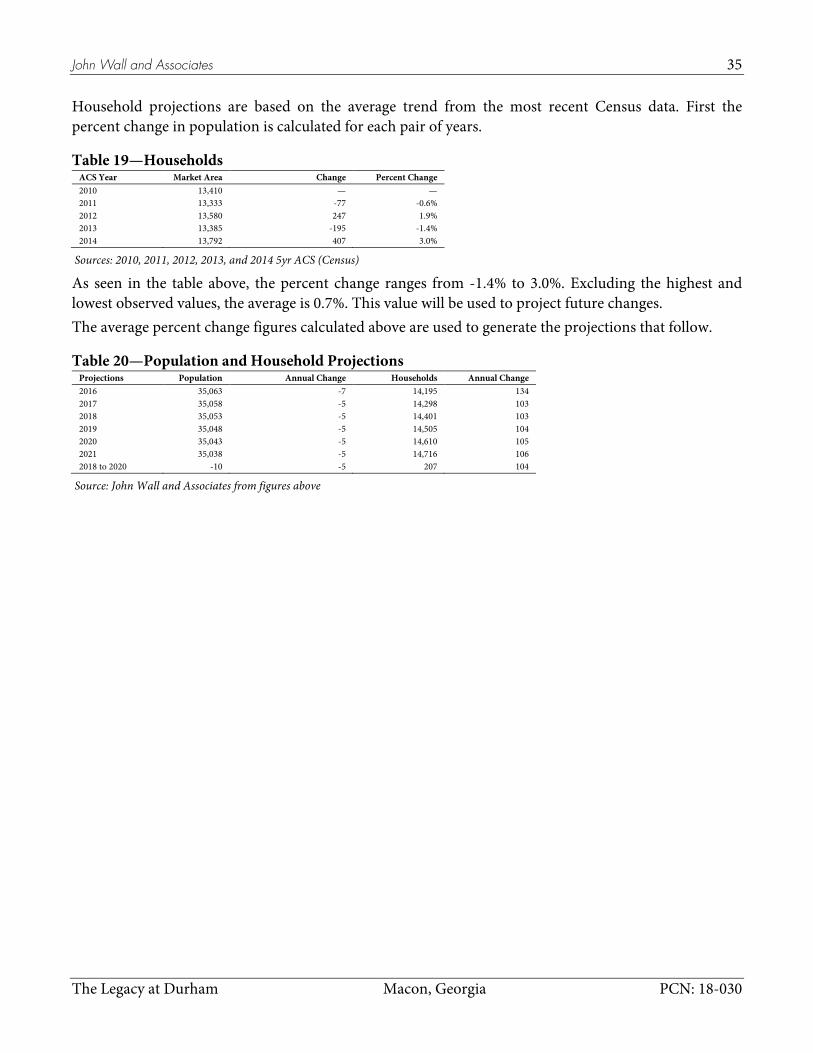
Household projections are based on the average trend from the most recent Census data. First the percent change in population is calculated for each pair of years.
Table 19—Households
ACS Year Market Area Change Percent Change 2010 13,410 — — 2011 13,333 -77 -0.6% 2012 13,580 247 1.9% 2013 13,385 -195 -1.4% 2014 13,792 407 3.0%
Sources: 2010, 2011, 2012, 2013, and 2014 5yr ACS (Census)
As seen in the table above, the percent change ranges from -1.4% to 3.0%. Excluding the highest and lowest observed values, the average is 0.7%. This value will be used to project future changes. The average percent change figures calculated above are used to generate the projections that follow.
Table 20—Population and Household Projections
Projections Population Annual Change Households Annual Change 2016 35,063 -7 14,195 134 2017 35,058 -5 14,298 103 2018 35,053 -5 14,401 103 2019 35,048 -5 14,505 104 2020 35,043 -5 14,610 105 2021 35,038 -5 14,716 106 2018 to 2020 -10 -5 207 104
Source: John Wall and Associates from figures above
John Wall and Associates 36
The Legacy at Durham Macon, Georgia PCN: 18-030
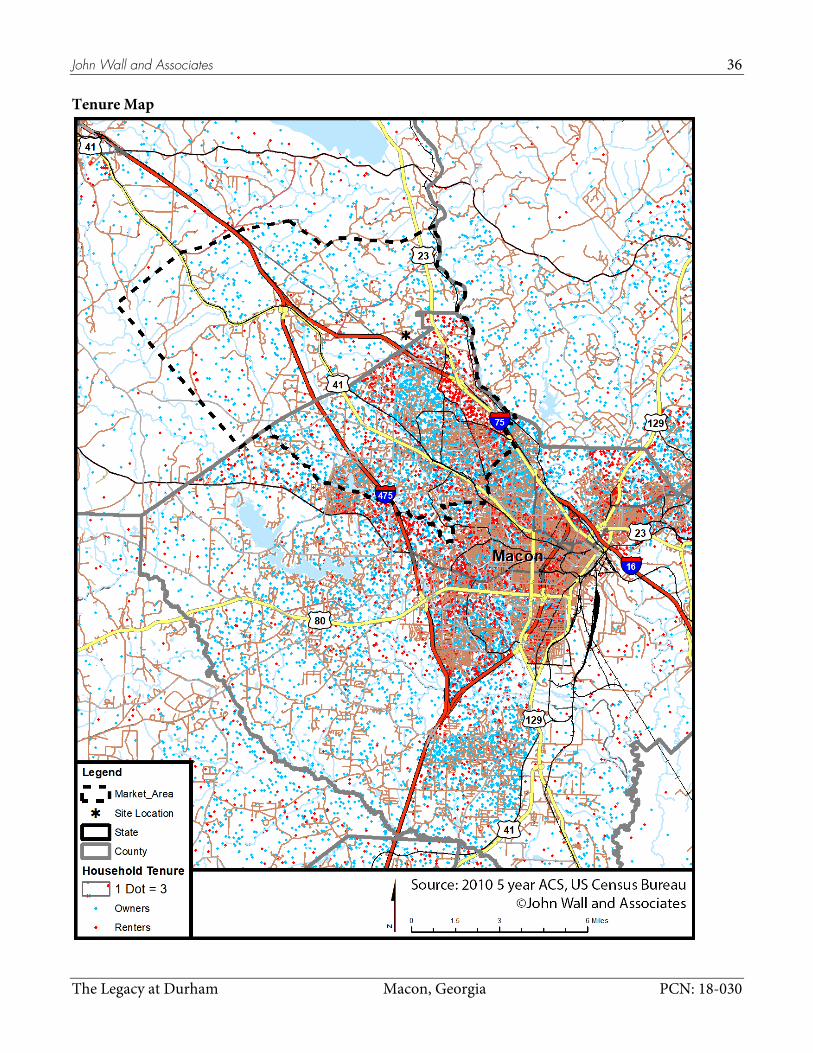
Tenure Map
John Wall and Associates 37
The Legacy at Durham Macon, Georgia PCN: 18-030
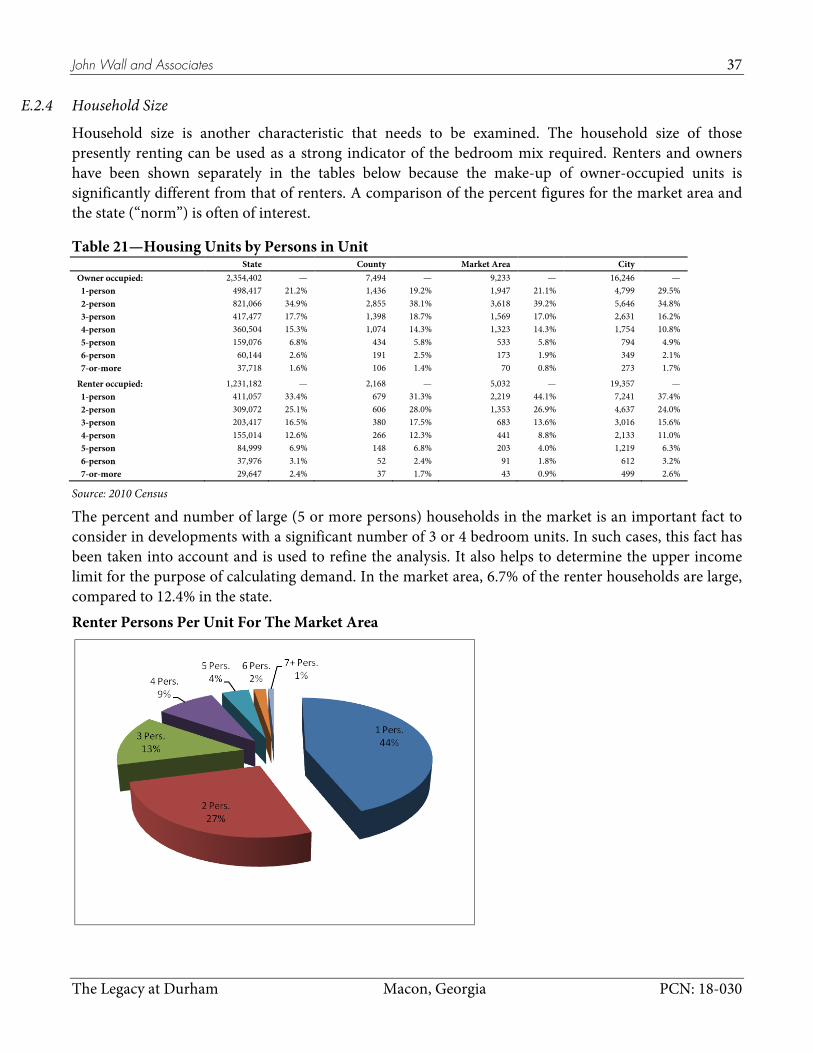
E.2.4 Household Size
Household size is another characteristic that needs to be examined. The household size of those presently renting can be used as a strong indicator of the bedroom mix required. Renters and owners have been shown separately in the tables below because the make-up of owner-occupied units is significantly different from that of renters. A comparison of the percent figures for the market area and the state (“norm”) is often of interest.
Table 21—Housing Units by Persons in Unit
State County Market Area City Owner occupied: 2,354,402 — 7,494 — 9,233 — 16,246 — 1-person 498,417 21.2% 1,436 19.2% 1,947 21.1% 4,799 29.5% 2-person 821,066 34.9% 2,855 38.1% 3,618 39.2% 5,646 34.8% 3-person 417,477 17.7% 1,398 18.7% 1,569 17.0% 2,631 16.2% 4-person 360,504 15.3% 1,074 14.3% 1,323 14.3% 1,754 10.8% 5-person 159,076 6.8% 434 5.8% 533 5.8% 794 4.9% 6-person 60,144 2.6% 191 2.5% 173 1.9% 349 2.1% 7-or-more 37,718 1.6% 106 1.4% 70 0.8% 273 1.7%
Renter occupied: 1,231,182 — 2,168 — 5,032 — 19,357 — 1-person 411,057 33.4% 679 31.3% 2,219 44.1% 7,241 37.4% 2-person 309,072 25.1% 606 28.0% 1,353 26.9% 4,637 24.0% 3-person 203,417 16.5% 380 17.5% 683 13.6% 3,016 15.6% 4-person 155,014 12.6% 266 12.3% 441 8.8% 2,133 11.0% 5-person 84,999 6.9% 148 6.8% 203 4.0% 1,219 6.3% 6-person 37,976 3.1% 52 2.4% 91 1.8% 612 3.2% 7-or-more 29,647 2.4% 37 1.7% 43 0.9% 499 2.6%
Source: 2010 Census
The percent and number of large (5 or more persons) households in the market is an important fact to consider in developments with a significant number of 3 or 4 bedroom units. In such cases, this fact has been taken into account and is used to refine the analysis. It also helps to determine the upper income limit for the purpose of calculating demand. In the market area, 6.7% of the renter households are large, compared to 12.4% in the state. Renter Persons Per Unit For The Market Area

John Wall and Associates 38
The Legacy at Durham Macon, Georgia PCN: 18-030
E.2.5 Household Incomes
The table below shows the number of households (both renter and owner) that fall within various income ranges for the market area.
Table 22—Number of Households in Various Income Ranges
State % County % Market Area % City % Total: 3,574,362 9,581 13,915 57,025 Less than $10,000 309,272 8.7% 876 9.1% 550 4.0% 8,462 14.8% $10,000 to $14,999 203,138 5.7% 427 4.5% 362 2.6% 4,761 8.3% $15,000 to $19,999 196,729 5.5% 440 4.6% 549 3.9% 3,923 6.9% $20,000 to $24,999 203,990 5.7% 783 8.2% 742 5.3% 3,612 6.3% $25,000 to $29,999 189,444 5.3% 603 6.3% 850 6.1% 3,990 7.0% $30,000 to $34,999 191,684 5.4% 526 5.5% 742 5.3% 2,710 4.8% $35,000 to $39,999 176,305 4.9% 425 4.4% 803 5.8% 2,983 5.2% $40,000 to $44,999 176,083 4.9% 363 3.8% 532 3.8% 2,310 4.1% $45,000 to $49,999 151,180 4.2% 454 4.7% 515 3.7% 2,019 3.5% $50,000 to $59,999 287,912 8.1% 959 10.0% 1,060 7.6% 3,924 6.9% $60,000 to $74,999 354,485 9.9% 795 8.3% 1,470 10.6% 5,249 9.2% $75,000 to $99,999 407,295 11.4% 1,031 10.8% 1,684 12.1% 5,242 9.2% $100,000 to $124,999 264,418 7.4% 725 7.6% 1,320 9.5% 3,017 5.3% $125,000 to $149,999 154,213 4.3% 628 6.6% 855 6.1% 1,526 2.7% $150,000 to $199,999 155,790 4.4% 287 3.0% 955 6.9% 1,611 2.8% $200,000 or more 152,424 4.3% 259 2.7% 925 6.6% 1,686 3.0%
Source: 2015-5yr ACS (Census)

John Wall and Associates 39
The Legacy at Durham Macon, Georgia PCN: 18-030
F. Employment Trends The economy of the market area will have an impact on the need for apartment units.
F.1 Total Jobs The following table shows how many people were employed in the county. These employed persons do not necessarily live in the county, so the trends are useful to determining the economic health of the area.
Table 23—Covered Employment Year Jan Feb Mar Apr May Jun Jul Aug Sep Oct Nov Dec Annual
2001 5,072 5,091 5,130 5,111 5,211 5,233 5,168 5,181 5,179 5,371 5,390 5,354 5,208
2002 4,804 4,771 4,775 4,831 4,885 4,920 4,921 4,943 4,965 4,875 4,936 4,922 4,879
2003 5,059 5,121 5,137 5,205 5,358 5,378 5,361 5,454 5,480 5,500 5,489 5,508 5,338
2004 5,289 5,299 5,384 5,405 5,294 5,257 5,142 5,264 5,118 5,472 5,453 5,411 5,316
2005 5,178 5,174 5,185 5,573 5,545 5,502 5,573 5,680 5,537 5,463 5,508 5,422 5,445
2006 5,443 5,478 5,605 5,683 5,768 5,656 5,676 5,750 5,718 5,734 5,745 5,722 5,665
2007 6,213 6,141 6,097 6,339 6,260 6,277 6,244 6,298 6,235 6,375 6,223 6,105 6,234
2008 6,249 6,234 6,473 6,456 6,480 6,546 6,290 6,251 6,189 6,471 6,442 6,270 6,363
2009 5,783 5,884 5,947 5,854 5,879 5,810 5,857 5,838 5,784 5,908 5,858 5,710 5,843
2010 5,670 5,810 5,868 5,819 5,852 5,834 5,904 5,925 5,906 6,562 6,531 6,273 5,996
2011 6,409 6,610 6,623 6,576 6,536 6,512 6,429 6,460 6,372 6,337 6,344 6,315 6,460
2012 6,404 6,401 6,417 6,560 6,558 6,546 6,398 6,440 6,419 6,539 6,492 6,444 6,468
2013 6,849 6,869 6,934 6,952 7,074 6,874 6,734 6,838 6,770 6,959 6,975 6,936 6,897
2014 7,042 7,043 7,092 7,238 7,303 7,266 7,353 7,504 7,554 7,350 7,392 7,437 7,298
2015 7,260 7,424 7,497 7,241 7,386 7,391 7,522 7,614 7,619 7,445 7,510 7,523 7,453
2016 7,513 7,588 7,615 7,541 7,552 7,640 7,549 7,598 7,623 7,611 7,627 7,593 7,588
2017 7,182 (P) 7,227 (P) 7,264 (P) 7,176 (P) 7,164 (P) 7,383 (P) 7,359 (P) 7,380 (P) 7,398 (P)
Source: http://data.bls.gov/pdq/querytool.jsp?survey=en
John Wall and Associates 40
The Legacy at Durham Macon, Georgia PCN: 18-030
F.2 Jobs by Industry and Occupation
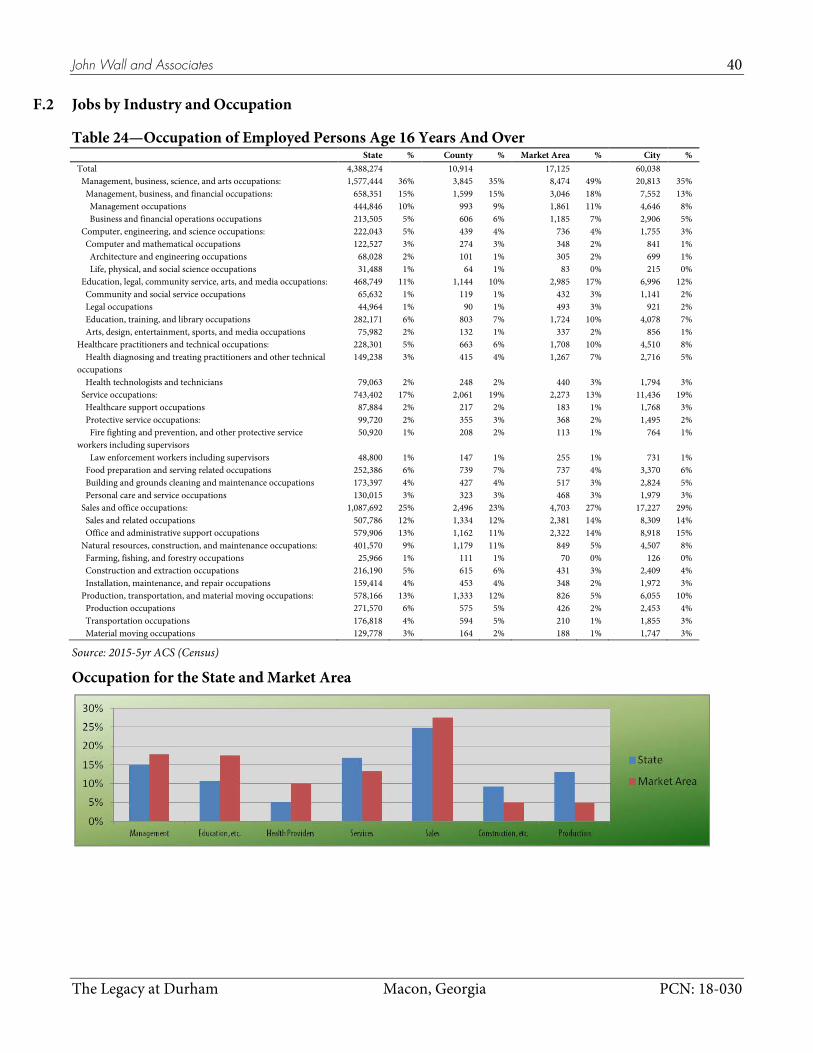
Table 24—Occupation of Employed Persons Age 16 Years And Over
State % County % Market Area % City % Total 4,388,274 10,914 17,125 60,038 Management, business, science, and arts occupations: 1,577,444 36% 3,845 35% 8,474 49% 20,813 35% Management, business, and financial occupations: 658,351 15% 1,599 15% 3,046 18% 7,552 13% Management occupations 444,846 10% 993 9% 1,861 11% 4,646 8% Business and financial operations occupations 213,505 5% 606 6% 1,185 7% 2,906 5% Computer, engineering, and science occupations: 222,043 5% 439 4% 736 4% 1,755 3% Computer and mathematical occupations 122,527 3% 274 3% 348 2% 841 1% Architecture and engineering occupations 68,028 2% 101 1% 305 2% 699 1% Life, physical, and social science occupations 31,488 1% 64 1% 83 0% 215 0% Education, legal, community service, arts, and media occupations: 468,749 11% 1,144 10% 2,985 17% 6,996 12% Community and social service occupations 65,632 1% 119 1% 432 3% 1,141 2% Legal occupations 44,964 1% 90 1% 493 3% 921 2% Education, training, and library occupations 282,171 6% 803 7% 1,724 10% 4,078 7% Arts, design, entertainment, sports, and media occupations 75,982 2% 132 1% 337 2% 856 1% Healthcare practitioners and technical occupations: 228,301 5% 663 6% 1,708 10% 4,510 8% Health diagnosing and treating practitioners and other technical occupations
149,238 3% 415 4% 1,267 7% 2,716 5%
Health technologists and technicians 79,063 2% 248 2% 440 3% 1,794 3% Service occupations: 743,402 17% 2,061 19% 2,273 13% 11,436 19% Healthcare support occupations 87,884 2% 217 2% 183 1% 1,768 3% Protective service occupations: 99,720 2% 355 3% 368 2% 1,495 2% Fire fighting and prevention, and other protective service workers including supervisors
50,920 1% 208 2% 113 1% 764 1%
Law enforcement workers including supervisors 48,800 1% 147 1% 255 1% 731 1% Food preparation and serving related occupations 252,386 6% 739 7% 737 4% 3,370 6% Building and grounds cleaning and maintenance occupations 173,397 4% 427 4% 517 3% 2,824 5% Personal care and service occupations 130,015 3% 323 3% 468 3% 1,979 3% Sales and office occupations: 1,087,692 25% 2,496 23% 4,703 27% 17,227 29% Sales and related occupations 507,786 12% 1,334 12% 2,381 14% 8,309 14% Office and administrative support occupations 579,906 13% 1,162 11% 2,322 14% 8,918 15% Natural resources, construction, and maintenance occupations: 401,570 9% 1,179 11% 849 5% 4,507 8% Farming, fishing, and forestry occupations 25,966 1% 111 1% 70 0% 126 0% Construction and extraction occupations 216,190 5% 615 6% 431 3% 2,409 4% Installation, maintenance, and repair occupations 159,414 4% 453 4% 348 2% 1,972 3% Production, transportation, and material moving occupations: 578,166 13% 1,333 12% 826 5% 6,055 10% Production occupations 271,570 6% 575 5% 426 2% 2,453 4% Transportation occupations 176,818 4% 594 5% 210 1% 1,855 3% Material moving occupations 129,778 3% 164 2% 188 1% 1,747 3%
Source: 2015-5yr ACS (Census)
Occupation for the State and Market Area

John Wall and Associates 41
The Legacy at Durham Macon, Georgia PCN: 18-030
Table 25—Industry of Employed Persons Age 16 Years And Over
State % County % Market Area % City % Total: 4,388,274 10,914 17,125 60,038 Agriculture, forestry, fishing and hunting, and mining: 51,966 1% 203 2% 103 1% 460 1% Agriculture, forestry, fishing and hunting 46,732 1% 185 2% 76 0% 346 1% Mining, quarrying, and oil and gas extraction 5,234 0% 18 0% 27 0% 114 0% Construction 278,360 6% 762 7% 621 4% 2,717 5% Manufacturing 468,172 11% 613 6% 873 5% 3,986 7% Wholesale trade 125,340 3% 294 3% 438 3% 1,285 2% Retail trade 524,336 12% 1,131 10% 2,011 12% 8,333 14% Transportation and warehousing, and utilities: 263,016 6% 726 7% 635 4% 2,973 5% Transportation and warehousing 222,614 5% 411 4% 446 3% 2,604 4% Utilities 40,402 1% 315 3% 188 1% 369 1% Information 110,166 3% 246 2% 436 3% 1,115 2% Finance and insurance, and real estate and rental and leasing:
276,796 6% 855 8% 1,900 11% 4,988 8%
Finance and insurance 192,934 4% 628 6% 1,533 9% 3,932 7% Real estate and rental and leasing 83,862 2% 227 2% 367 2% 1,056 2% Professional, scientific, and management, and administrative and waste management services:
508,301 12% 807 7% 1,681 10% 5,707 10%
Professional, scientific, and technical services 296,948 7% 360 3% 1,111 6% 2,921 5% Management of companies and enterprises 3,948 0% 0 0% 28 0% 28 0% Administrative and support and waste management services
207,405 5% 447 4% 541 3% 2,758 5%
Educational services, and health care and social assistance: 920,476 21% 2,736 25% 5,302 31% 16,299 27% Educational services 415,328 9% 1,270 12% 2,509 15% 6,627 11% Health care and social assistance 505,148 12% 1,466 13% 2,793 16% 9,672 16% Arts, entertainment, and recreation, and accommodation and food services:
409,392 9% 926 8% 1,001 6% 5,638 9%
Arts, entertainment, and recreation 67,741 2% 142 1% 171 1% 726 1% Accommodation and food services 341,651 8% 784 7% 831 5% 4,912 8% Other services, except public administration 220,306 5% 711 7% 1,040 6% 2,765 5% Public administration 231,647 5% 904 8% 1,084 6% 3,772 6%
Source: 2015-5yr ACS (Census)
Note: Bold numbers represent category totals and add to 100%
Industry for the State and Market Area
Source: 2015-5yr ACS (Census)

John Wall and Associates 42
The Legacy at Durham Macon, Georgia PCN: 18-030
F.3 Major Employers
Table 26—Major Employers The following is a list of major employers in Macon-Bibb County: Company Product Employees GEICO Insurance 5,500 Navicent Health Medical Center Hospital 4,800 Macon-Bibb County Board of Education Education 3,200 Coliseum Health Systems Hospital 1,805 Macon-Bibb County Public 1,760 Mercer University Education 1,000 Georgia Farm Bureau Federation Insurance 998 YKK (USA) Incorporated Zippers, Vinyl Windows 790 Wal-Mart Super Stores Retail 740 Middle Georgia State University Education 680 United States Postal Service Public 600 State Bank Banking 554 Central Georgia Technical College Education 514 Ricoh USA Office Machines 500 Graphic Packaging International Paper Products 431 Kumho Tire Tires 400 Haeco Airplanes 400 Tractor Supply Company Farm & Ranch Supplies 400 Armstrong World Industries Ceiling Tiles 393 OrthoGeorgia Medical 317
Source: Macon Economic Development Commission
F.3.1 New or Planned Changes in Workforce
If there are any, they will be discussed in the Interviews section of the report.
F.4 Employment (Civilian Labor Force) In order to determine how employment affects the market area and whether the local economy is expanding, declining, or stable, it is necessary to inspect employment statistics for several years. The table below shows the increase or decrease in employment and the percentage of unemployed at the county level. This table also shows the change in the size of the labor force, an indicator of change in housing requirements for the county.
Table 27—Employment Trends
Employment Annual Civilian Change Change Labor
Year Force Unemployment Rate (%) Employment Number Pct. Number Pct. 2000 11,328 404 3.7 10,924 — — — — 2015 12,626 692 5.8 11,934 1,010 9.2% 67 0.6% 2016 13,004 643 5.2 12,361 427 3.6% 427 3.6% 2017 13,206 569 4.5 12,637 276 2.2% 276 2.2% M-17 13,234 582 4.6 12,652 15 0.1% A-17 13,152 542 4.3 12,610 -42 -0.3% M-17 13,166 543 4.3 12,623 13 0.1% J-17 13,269 596 4.7 12,673 50 0.4% J-17 13,254 607 4.8 12,647 -26 -0.2% A-17 13,207 617 4.9 12,590 -57 -0.5% S-17 13,243 546 4.3 12,697 107 0.8% O-17 13,160 530 4.2 12,630 -67 -0.5% N-17 13,177 495 3.9 12,682 52 0.4% D-17 13,239 521 4.1 12,718 36 0.3% J-18 13,344 575 4.5 12,769 51 0.4% F-18 13,347 526 4.1 12,821 52 0.4%
Source: State Employment Security Commission

John Wall and Associates 43
The Legacy at Durham Macon, Georgia PCN: 18-030
County Employment Trends
Source: State Employment Security Commission
F.5 Employment Concentrations Map
Employment Concentrations Map
John Wall and Associates 44
The Legacy at Durham Macon, Georgia PCN: 18-030
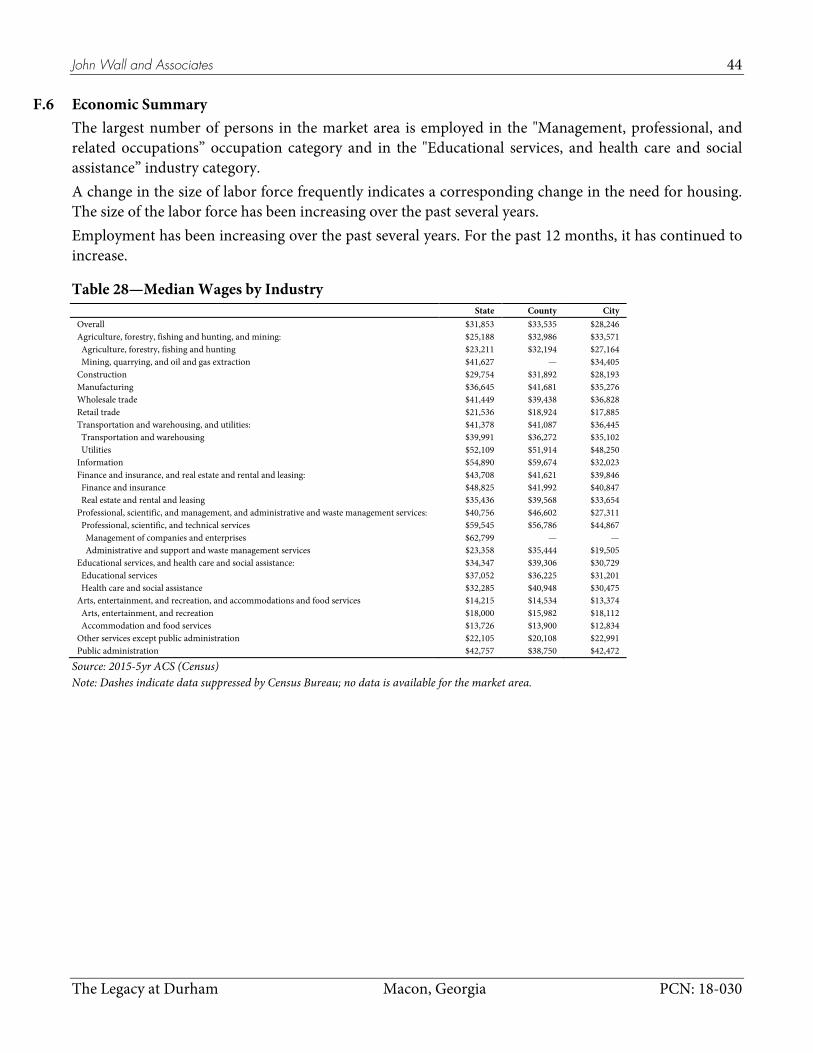
F.6 Economic Summary The largest number of persons in the market area is employed in the "Management, professional, and related occupations” occupation category and in the "Educational services, and health care and social assistance” industry category. A change in the size of labor force frequently indicates a corresponding change in the need for housing. The size of the labor force has been increasing over the past several years. Employment has been increasing over the past several years. For the past 12 months, it has continued to increase.
Table 28—Median Wages by Industry
State County City Overall $31,853 $33,535 $28,246 Agriculture, forestry, fishing and hunting, and mining: $25,188 $32,986 $33,571 Agriculture, forestry, fishing and hunting $23,211 $32,194 $27,164 Mining, quarrying, and oil and gas extraction $41,627 — $34,405 Construction $29,754 $31,892 $28,193 Manufacturing $36,645 $41,681 $35,276 Wholesale trade $41,449 $39,438 $36,828 Retail trade $21,536 $18,924 $17,885 Transportation and warehousing, and utilities: $41,378 $41,087 $36,445 Transportation and warehousing $39,991 $36,272 $35,102 Utilities $52,109 $51,914 $48,250 Information $54,890 $59,674 $32,023 Finance and insurance, and real estate and rental and leasing: $43,708 $41,621 $39,846 Finance and insurance $48,825 $41,992 $40,847 Real estate and rental and leasing $35,436 $39,568 $33,654 Professional, scientific, and management, and administrative and waste management services: $40,756 $46,602 $27,311 Professional, scientific, and technical services $59,545 $56,786 $44,867 Management of companies and enterprises $62,799 — — Administrative and support and waste management services $23,358 $35,444 $19,505 Educational services, and health care and social assistance: $34,347 $39,306 $30,729 Educational services $37,052 $36,225 $31,201 Health care and social assistance $32,285 $40,948 $30,475 Arts, entertainment, and recreation, and accommodations and food services $14,215 $14,534 $13,374 Arts, entertainment, and recreation $18,000 $15,982 $18,112 Accommodation and food services $13,726 $13,900 $12,834 Other services except public administration $22,105 $20,108 $22,991 Public administration $42,757 $38,750 $42,472
Source: 2015-5yr ACS (Census) Note: Dashes indicate data suppressed by Census Bureau; no data is available for the market area.

John Wall and Associates 45
The Legacy at Durham Macon, Georgia PCN: 18-030
Wages by Industry for the County
2010-5yr ACS (Census)
A downturn in the economy and thus a corresponding increase in unemployment will impact LIHTC properties without rental assistance. LIHTC properties without rental assistance require tenants who either earn enough money to afford the rent or have a rent subsidy voucher. When there is an increase in unemployment, there will be households where one or more employed persons become unemployed. Some households that could afford to live in the proposed units will no longer have enough income. By the same token, there will be other households that previously had incomes that were too high to live in the proposed units that will now be income qualified. Percent of Workers by Industry for the Market Area
Source: 2015-5yr ACS (Census)

John Wall and Associates 46
The Legacy at Durham Macon, Georgia PCN: 18-030
G. Development-Specific Affordability & Demand Analysis Several economic factors need to be examined in a housing market study. Most important is the number of households that would qualify for apartments on the basis of their incomes. A variety of circumstances regarding restrictions and affordability are outlined below. These minimum and maximum incomes are used to establish the income range for households entering the development. Only households whose incomes fall within the range are considered as a source of demand. Income data have been shown separately for owner and renter households. Only the renter household income data are used for determining demand for rental units. Gross rent includes utilities, but it excludes payments of rental assistance by federal, state, and local entities. In this study, gross rent is always monthly.
G.1 Income Restrictions
G.1.1 Establishing Tax Credit Qualifying Income Ranges
It is critical to establish the number of households that qualify for apartments under the tax credit program based on their incomes. The income ranges are established in two stages. First, the maximum incomes allowable are calculated by applying the tax credit guidelines. Then, minimum incomes required are calculated. According to United States Code, either 20% of the units must be occupied by households who earn under 50% of the area median gross income (AMI), OR 40% of the units must be occupied by households who earn under 60% of the AMI. Sometimes units are restricted for even lower income households. In many cases, the developer has chosen to restrict the rents for 100% of the units to be for low income households.
Table 29—Maximum Income Limit (HUD FY 2017)
Pers. VLIL 50% 60% 1 20,800 20,800 24,960 2 23,750 23,750 28,500 3 26,700 26,700 32,040 4 29,650 29,650 35,580 5 32,050 32,050 38,460 6 34,400 34,400 41,280 7 36,800 36,800 44,160 8 39,150 39,150 46,980
Source: Very Low Income (50%) Limit and 60% limit: HUD, Low and Very-Low Income Limits by Family Size
Others: John Wall and Associates, derived from HUD figures
The table above shows the maximum tax credit allowable incomes for households moving into the subject based on household size and the percent of area median gross income (AMI). After establishing the maximum income, the lower income limit will be determined. The lower limit is the income a household must have in order to be able to afford the rent and utilities. The realistic lower limit of the income range is determined by the following formula:
Gross rent ÷ 35% [or 30% or 40%, as described in the subsections above] x 12 months = annual income
This provides for up to 35% [or 30% or 40%] of adjusted annual income (AAI) to be used for rent plus utilities.

John Wall and Associates 47
The Legacy at Durham Macon, Georgia PCN: 18-030
The proposed gross rents, as supplied by the client, and the minimum incomes required to maintain 35% [or 30% or 40%] or less of income spent on gross rent are:
Table 30—Minimum Incomes Required and Gross Rents
Minimum Number Net Gross Income Target Bedrooms of Units Rent Rent Required Population
50% 1 6 450 546 $18,720 Tax Credit 50% 2 2 535 656 $22,491 Tax Credit 50% 2 3 535 656 $22,491 Tax Credit 50% 3 1 610 758 $25,989 Tax Credit 50% 3 3 610 758 $25,989 Tax Credit 60% 1 4 515 611 $20,949 Tax Credit 60% 2 31 615 736 $25,234 Tax Credit 60% 3 22 699 847 $29,040 Tax Credit
Source: John Wall and Associates from data provided by client
From the tables above, the practical lower income limits for units without rental assistance can be established. Units with rental assistance will use $0 as their lower income limit. When the minimum incomes required are combined with the maximum tax credit limits, the income ranges for households entering the development can be established. Only households whose incomes fall within the ranges can be considered as a source of demand. Note that both the income limits and the amount of spread in the ranges are important.
G.1.2 Households Not Receiving Rental Assistance
Most households do not receive rental assistance. With respect to estimating which households may consider the subject a possible housing choice, we will evaluate the gross rent as a percent of their income according to the following formula:
gross rent ÷ X% x 12 months = annual income X% in the formula will vary, depending on the circumstance, as outlined in the next two sections.
G.1.3 Households Qualifying for Tax Credit Units
Households who earn less than a defined percentage (usually 50% or 60%) of the county or MSA median income as adjusted by HUD (AMI) qualify for low income housing tax credit (LIHTC) units. Therefore, feasibility for developments expecting to receive tax credits will be based in part on the incomes required to support the tax credit rents. For those tax credit units occupied by low income households, the monthly gross rent should not realistically exceed 35% of the household income.

John Wall and Associates 48
The Legacy at Durham Macon, Georgia PCN: 18-030
G.2 Affordability The most important information from the tables above is summarized in the table below. Income requirements for any PBRA units will be calculated for the contract rent.
Table 31—Qualifying Income Ranges by Bedrooms and Persons Per Household
Income Based Spread Gross Lower Between Upper
AMI Bedrooms Persons Rent Limit Limits Limit 50% 1 1 546 18,720 2,080 20,800 50% 1 2 546 18,720 5,030 23,750 50% 2 2 656 22,490 1,260 23,750 50% 2 3 656 22,490 4,210 26,700 50% 2 4 656 22,490 7,160 29,650 50% 3 3 758 25,990 710 26,700 50% 3 4 758 25,990 3,660 29,650 50% 3 5 758 25,990 6,060 32,050 50% 3 6 758 25,990 8,410 34,400 60% 1 1 611 20,950 4,010 24,960 60% 1 2 611 20,950 7,550 28,500 60% 2 2 736 25,230 3,270 28,500 60% 2 3 736 25,230 6,810 32,040 60% 2 4 736 25,230 10,350 35,580 60% 3 3 847 29,040 3,000 32,040 60% 3 4 847 29,040 6,540 35,580 60% 3 5 847 29,040 9,420 38,460 60% 3 6 847 29,040 12,240 41,280
Sources: Gross rents: client; Limits: tables on prior pages; Spread: calculated from data in table
G.2.1 Upper Income Determination
DCA requires using 1.5 persons per bedroom, rounded up to the nearest whole person for the upper income limit determination.
G.2.2 Programmatic and Pro Forma Rent Analysis
The table below shows a comparison of programmatic rent and pro forma rent.
Table 32—Qualifying and Proposed and Programmatic Rent Summary
1-BR 2-BR 2-BR 3-BR 3-BR 50% Units
Number of Units 6 2 3 1 3 Max Allowable Gross Rent $556 $667 $667 $771 $771 Pro Forma Gross Rent $546 $656 $656 $758 $758 Difference ($) $10 $11 $11 $13 $13 Difference (%) 1.8% 1.6% 1.6% 1.7% 1.7%
60% Units
Number of Units 4 31 — 22 — Max Allowable Gross Rent $668 $801 $801 $925 $925 Pro Forma Gross Rent $611 $736 $0 $847 $0 Difference ($) $57 $65 $801 $78 $925 Difference (%) 8.5% 8.1% 100.0% 8.4% 100.0%

John Wall and Associates 49
The Legacy at Durham Macon, Georgia PCN: 18-030
Targeted Income Ranges
An income range of $18,720 to $30,850 is reasonable for the 50% AMI units. An income range of $20,950 to $37,020 is reasonable for the 60% AMI units. An income range of $18,720 to $37,020 is reasonable for the project overall.
G.2.3 Households with Qualified Incomes
The table below shows income levels for renters and owners separately. The number and percent of income qualified renter households is calculated from this table.
Table 33—Number of Specified Households in Various Income Ranges by Tenure
State % County % Market Area % City % Owner occupied: 2,263,697 7,257 8,722 30,261 Less than $5,000 52,329 2.3% 181 2.5% 75 0.9% 561 1.9% $5,000 to $9,999 49,760 2.2% 202 2.8% 37 0.4% 942 3.1% $10,000 to $14,999 83,758 3.7% 212 2.9% 110 1.3% 1,198 4.0% $15,000 to $19,999 89,364 3.9% 283 3.9% 260 3.0% 1,527 5.0% $20,000 to $24,999 96,883 4.3% 565 7.8% 323 3.7% 1,435 4.7% $25,000 to $34,999 199,285 8.8% 727 10.0% 729 8.4% 3,131 10.3% $35,000 to $49,999 297,953 13.2% 925 12.7% 751 8.6% 3,969 13.1% $50,000 to $74,999 441,689 19.5% 1,393 19.2% 1,536 17.6% 6,190 20.5% $75,000 to $99,999 314,994 13.9% 912 12.6% 1,128 12.9% 4,181 13.8% $100,000 to $149,999 356,801 15.8% 1,311 18.1% 2,037 23.4% 4,084 13.5% $150,000 or more 280,881 12.4% 546 7.5% 1,735 19.9% 3,043 10.1%
Renter occupied: 1,310,665 2,324 5,193 26,764 Less than $5,000 102,866 7.8% 268 11.5% 213 4.1% 2,992 11.2% $5,000 to $9,999 104,317 8.0% 225 9.7% 225 4.3% 3,967 14.8% $10,000 to $14,999 119,380 9.1% 215 9.3% 252 4.9% 3,563 13.3% $15,000 to $19,999 107,365 8.2% 157 6.8% 289 5.6% 2,396 9.0% $20,000 to $24,999 107,107 8.2% 218 9.4% 419 8.1% 2,177 8.1% $25,000 to $34,999 181,843 13.9% 402 17.3% 863 16.6% 3,569 13.3% $35,000 to $49,999 205,615 15.7% 317 13.6% 1,099 21.2% 3,343 12.5% $50,000 to $74,999 200,708 15.3% 361 15.5% 994 19.1% 2,983 11.1% $75,000 to $99,999 92,301 7.0% 119 5.1% 556 10.7% 1,061 4.0% $100,000 to $149,999 61,830 4.7% 42 1.8% 138 2.7% 459 1.7% $150,000 or more 27,333 2.1% 0 0.0% 145 2.8% 254 0.9%
Source: 2015-5yr ACS (Census)
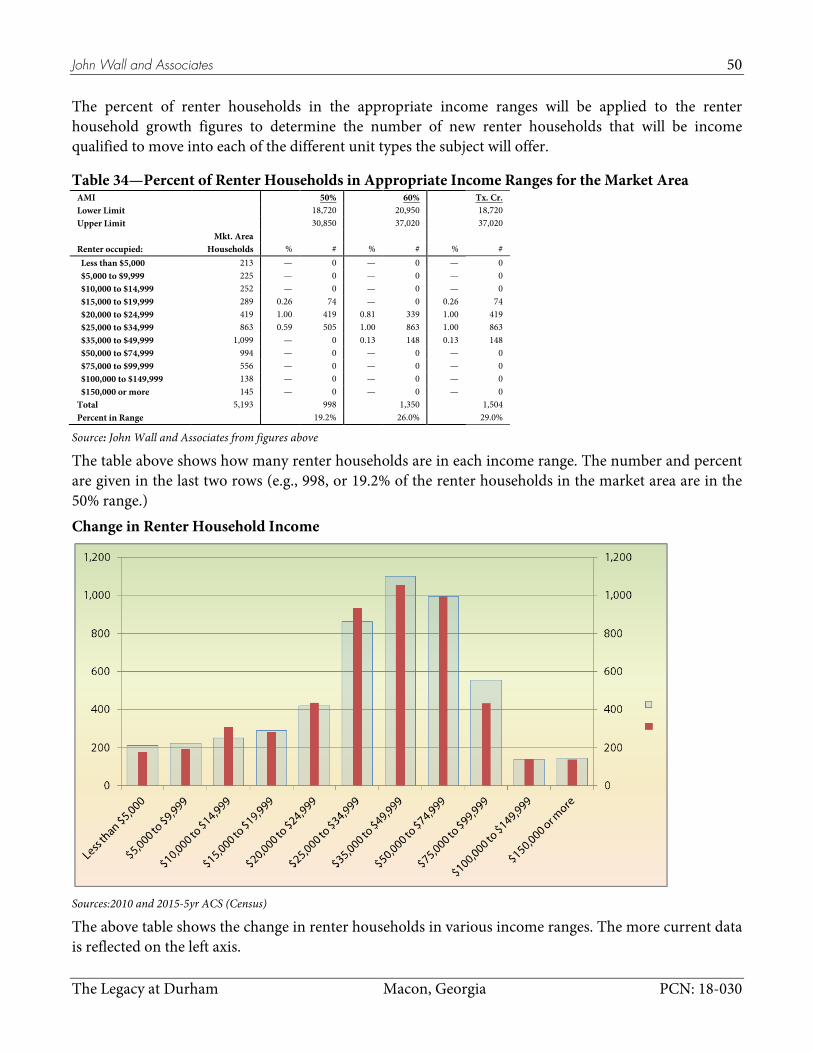
John Wall and Associates 50
The Legacy at Durham Macon, Georgia PCN: 18-030
The percent of renter households in the appropriate income ranges will be applied to the renter household growth figures to determine the number of new renter households that will be income qualified to move into each of the different unit types the subject will offer.
Table 34—Percent of Renter Households in Appropriate Income Ranges for the Market Area
AMI 50% 60% Tx. Cr. Lower Limit 18,720 20,950 18,720 Upper Limit 30,850 37,020 37,020
Mkt. Area Renter occupied: Households % # % # % # Less than $5,000 213 — 0 — 0 — 0 $5,000 to $9,999 225 — 0 — 0 — 0 $10,000 to $14,999 252 — 0 — 0 — 0 $15,000 to $19,999 289 0.26 74 — 0 0.26 74 $20,000 to $24,999 419 1.00 419 0.81 339 1.00 419 $25,000 to $34,999 863 0.59 505 1.00 863 1.00 863 $35,000 to $49,999 1,099 — 0 0.13 148 0.13 148 $50,000 to $74,999 994 — 0 — 0 — 0 $75,000 to $99,999 556 — 0 — 0 — 0 $100,000 to $149,999 138 — 0 — 0 — 0 $150,000 or more 145 — 0 — 0 — 0 Total 5,193 998 1,350 1,504 Percent in Range 19.2% 26.0% 29.0%
Source: John Wall and Associates from figures above
The table above shows how many renter households are in each income range. The number and percent are given in the last two rows (e.g., 998, or 19.2% of the renter households in the market area are in the 50% range.) Change in Renter Household Income
Sources:2010 and 2015-5yr ACS (Census)
The above table shows the change in renter households in various income ranges. The more current data is reflected on the left axis.
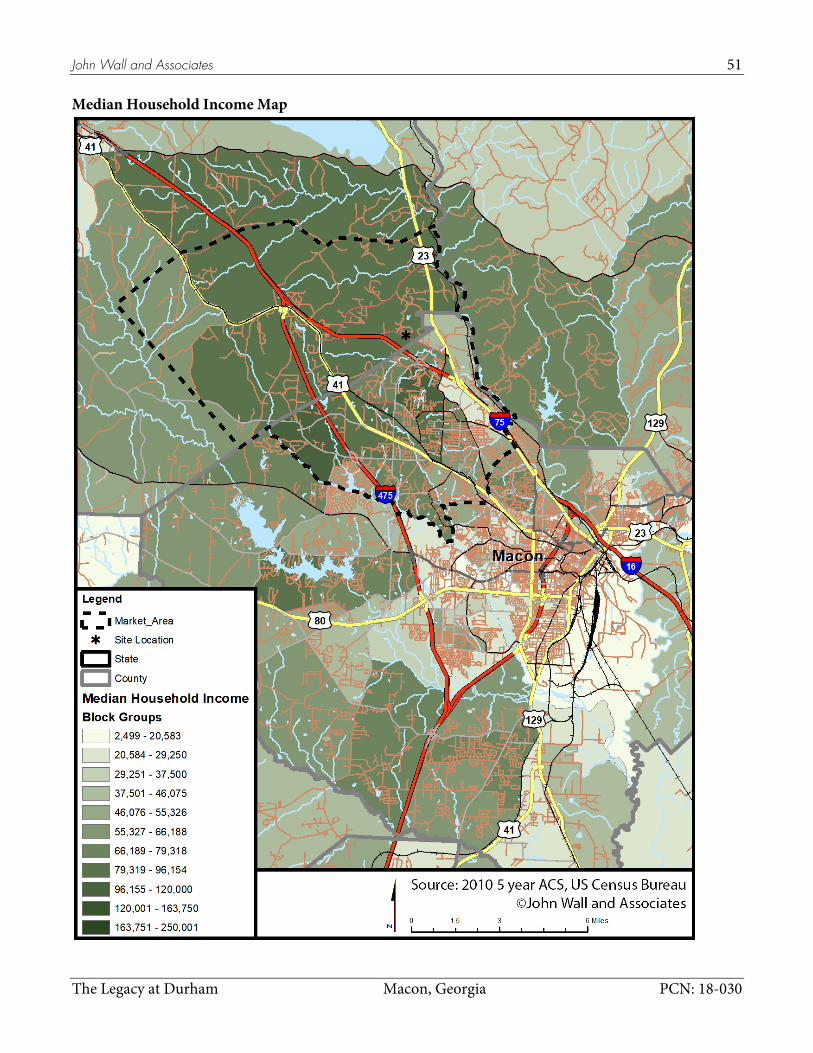
John Wall and Associates 51
The Legacy at Durham Macon, Georgia PCN: 18-030
Median Household Income Map
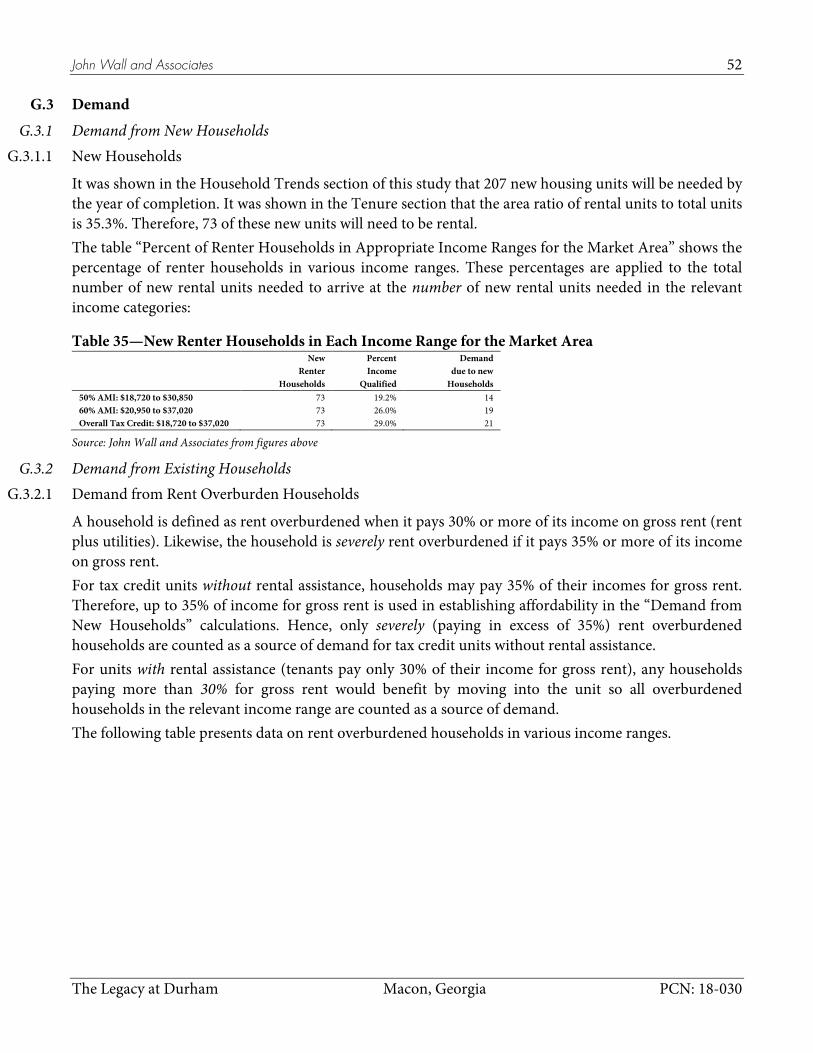
John Wall and Associates 52
The Legacy at Durham Macon, Georgia PCN: 18-030
G.3 Demand
G.3.1 Demand from New Households G.3.1.1 New Households
It was shown in the Household Trends section of this study that 207 new housing units will be needed by the year of completion. It was shown in the Tenure section that the area ratio of rental units to total units is 35.3%. Therefore, 73 of these new units will need to be rental. The table “Percent of Renter Households in Appropriate Income Ranges for the Market Area” shows the percentage of renter households in various income ranges. These percentages are applied to the total number of new rental units needed to arrive at the number of new rental units needed in the relevant income categories:
Table 35—New Renter Households in Each Income Range for the Market Area
New Percent Demand
Renter Income due to new
Households Qualified Households 50% AMI: $18,720 to $30,850 73 19.2% 14 60% AMI: $20,950 to $37,020 73 26.0% 19 Overall Tax Credit: $18,720 to $37,020 73 29.0% 21
Source: John Wall and Associates from figures above
G.3.2 Demand from Existing Households G.3.2.1 Demand from Rent Overburden Households
A household is defined as rent overburdened when it pays 30% or more of its income on gross rent (rent plus utilities). Likewise, the household is severely rent overburdened if it pays 35% or more of its income on gross rent. For tax credit units without rental assistance, households may pay 35% of their incomes for gross rent. Therefore, up to 35% of income for gross rent is used in establishing affordability in the “Demand from New Households” calculations. Hence, only severely (paying in excess of 35%) rent overburdened households are counted as a source of demand for tax credit units without rental assistance. For units with rental assistance (tenants pay only 30% of their income for gross rent), any households paying more than 30% for gross rent would benefit by moving into the unit so all overburdened households in the relevant income range are counted as a source of demand. The following table presents data on rent overburdened households in various income ranges.

John Wall and Associates 53
The Legacy at Durham Macon, Georgia PCN: 18-030
Table 36—Percentage of Income Paid For Gross Rent (Renter Households in Specified Housing Units)
State County Market Area City Less than $10,000: 207,183 493 438 6,959 30.0% to 34.9% 3,596 1.7% 12 2.4% 0 0.0% 193 2.8% 35.0% or more 131,602 63.5% 246 49.9% 344 78.5% 4,535 65.2%
$10,000 to $19,999: 226,745 372 541 5,959 30.0% to 34.9% 10,649 4.7% 5 1.3% 38 7.0% 299 5.0% 35.0% or more 176,081 77.7% 268 72.0% 465 86.0% 4,443 74.6%
$20,000 to $34,999: 288,950 620 1,281 5,746 30.0% to 34.9% 45,681 15.8% 0 0.0% 249 19.4% 968 16.8% 35.0% or more 160,588 55.6% 377 60.8% 813 63.5% 2,875 50.0%
$35,000 to $49,999: 205,615 317 1,099 3,343 30.0% to 34.9% 32,900 16.0% 40 12.6% 96 8.7% 384 11.5% 35.0% or more 37,853 18.4% 81 25.6% 170 15.5% 414 12.4%
$50,000 to $74,999: 200,708 361 994 2,983 30.0% to 34.9% 12,649 6.3% 13 3.6% 12 1.2% 95 3.2% 35.0% or more 8,245 4.1% 0 0.0% 64 6.4% 82 2.7%
$75,000 to $99,999: 92,301 119 556 1,061 30.0% to 34.9% 1,229 1.3% 0 0.0% 0 0.0% 0 0.0% 35.0% or more 1,378 1.5% 0 0.0% 29 5.2% 29 2.7%
$100,000 or more: 89,163 42 283 713 30.0% to 34.9% 365 0.4% 0 0.0% 0 0.0% 0 0.0% 35.0% or more 472 0.5% 0 0.0% 0 0.0% 0 0.0%
Source: 2015-5yr ACS (Census)
From the table above, the number of rent overburdened households in each appropriate income range can be estimated in the table below.
Table 37—Rent Overburdened Households in Each Income Range for the Market Area
35%+ Overburden AMI 50% 60% Tx. Cr. Lower Limit 18,720 20,950 18,720 Upper Limit Mkt. Area 30,850 37,020 37,020
% Households # % # % # Less than $10,000: 344 — 0 — 0 — 0 $10,000 to $19,999: 465 0.13 59 — 0 0.13 59 $20,000 to $34,999: 813 0.72 588 0.94 762 1.00 813 $35,000 to $49,999: 170 — 0 0.13 23 0.13 23 $50,000 to $74,999: 64 — 0 — 0 — 0 $75,000 to $99,999: 29 — 0 — 0 — 0 $100,000 or more: 0 — 0 — 0 — 0 Column Total 1,885 648 784 895
Source: John Wall and Associates from figures above

John Wall and Associates 54
The Legacy at Durham Macon, Georgia PCN: 18-030
G.3.2.2 Demand from Substandard Conditions
The Bureau of the Census defines substandard conditions as 1) lacking plumbing, or 2) 1.01 or more persons per room.
Table 38—Substandard Occupied Units
State % County % Market Area % City % Owner occupied: 2,263,697 7,257 8,722 30,261 Complete plumbing: 2,256,546 100% 7,220 99% 8,715 100% 30,208 100% 1.00 or less 2,229,407 98% 7,085 98% 8,619 99% 29,928 99% 1.01 to 1.50 21,692 1% 52 1% 41 0% 237 1% 1.51 or more 5,447 0% 83 1% 55 1% 43 0% Lacking plumbing: 7,151 0% 37 1% 7 0% 53 0% 1.00 or less 7,020 0% 37 1% 7 0% 53 0% 1.01 to 1.50 108 0% 0 0% 0 0% 0 0% 1.51 or more 23 0% 0 0% 0 0% 0 0%
Renter occupied: 1,310,665 2,324 5,193 26,764 Complete plumbing: 1,303,067 99% 2,278 98% 5,128 99% 26,529 99% 1.00 or less 1,246,100 95% 2,179 94% 5,042 97% 25,707 96% 1.01 to 1.50 41,711 3% 53 2% 62 1% 593 2% 1.51 or more 15,256 1% 46 2% 24 0% 229 1% Lacking plumbing: 7,598 1% 46 2% 65 1% 235 1% 1.00 or less 7,053 1% 46 2% 65 1% 235 1% 1.01 to 1.50 209 0% 0 0% 0 0% 0 0% 1.51 or more 336 0% 0 0% 0 0% 0 0%
Total Renter Substandard 151
Source: 2015-5yr ACS (Census)
From these tables, the need from substandard rental units can be drawn. There are 151 substandard rental units in the market area. From the figures above the number of substandard units in each appropriate income range can be estimated in the table below.
Table 39—Substandard Conditions in Each Income Range for the Market Area
Total Percent Demand
Substandard Income due to
Units Qualified Substandard 50% AMI: $18,720 to $30,850 151 19.2% 29 60% AMI: $20,950 to $37,020 151 26.0% 39 Overall Tax Credit: $18,720 to $37,020 151 29.0% 44
Source: John Wall and Associates from figures above

John Wall and Associates 55
The Legacy at Durham Macon, Georgia PCN: 18-030
G.4 Demand for New Units The demand components shown in the previous section are summarized below.
Table 40—Demand for New Units
50%
AM
I: $1
8,72
0 to
$30
,850
60%
AM
I: $2
0,95
0 to
$37
,020
Ove
rall
Tax
Cre
dit:
$18,
720
to $
37,0
20
New Housing Units Required 14 19 21
Rent Overburden Households 648 784 895
Substandard Units 29 39 44
Demand 691 842 960
Less New Supply 0 0 0
Net Demand 691 842 960
* Numbers may not add due to rounding.

John Wall and Associates 56
The Legacy at Durham Macon, Georgia PCN: 18-030
G.5 Capture Rate Analysis Chart
Table 41—Capture Rate by Unit Size (Bedrooms) and Targeting
Income Total Net Capture Average Mkt. Rent Prop. Range Units Demand Supply Demand Rate Absrptn. Mkt. Rent Range Rents
50% AMI 1 BR 18720-22275 6 207 0 207 2.9% 5 months 859 426 to 1495 450
2 BR 22490-26700 5 346 0 346 1.4% 5 months 1040 505 to 1893 535
3 BR 25990-30850 4 138 0 138 2.9% 5 months 1161 575 to 1660 610
4 BR 0-34400 0 0 0 0 — — — — —
60% AMI 1 BR 20950-26730 4 253 0 253 1.6% 5 months 859 426 to 1495 515
2 BR 25230-32040 31 421 0 421 7.4% 5 months 1040 505 to 1893 615
3 BR 29040-37020 22 168 0 168 13.1% 5 months 1161 575 to 1660 699
4 BR 0-41280 0 0 0 0 — — — — —
TOTAL 50% AMI 18720-30850 15 691 0 691 2.2% 5 months — — — for 60% AMI 20950-37020 57 842 0 842 6.8% 5 months — — — Project
All TC 18720-37020 72 960 0 960 7.5% 5 months — — —
* Numbers may not add due to rounding. The capture rate is not intended to be used in isolation. A low capture rate does not guarantee a successful development, nor does a high capture rate assure failure; the capture rate should be considered in the context of all the other indicators presented in the study. It is one of many factors considered in reaching a conclusion.

John Wall and Associates 57
The Legacy at Durham Macon, Georgia PCN: 18-030
H. Competitive Analysis (Existing Competitive Rental Environment) This section contains a review of statistical data on rental property in the market area and an analysis of the data collected in the field survey of apartments in the area.
H.1 Survey of Apartments John Wall and Associates conducted a survey of apartments in the area. All of the apartments of interest are surveyed. Some of them are included because they are close to the site, or because they help in understanding the context of the segment where the subject will compete. The full details of the survey are contained in the apartment photo sheets later in this report. A summary of the data focusing on rents is shown in the apartment inventory, also later in this report. A summary of vacancies sorted by rent is presented in the schedule of rents, units, and vacancies.
Table 42—List of Apartments Surveyed Name Units Vacancy Rate Type Comments Ashley Woods 88 0.0% Conventional Carriage Hills 160 0.0% Conventional Falls at Spring Creek 296 3.4% Conventional Forest Ridge 94 3.2% Conventional Legacy at River Crossing 200 6.0% Conventional Lofts at Bass I 54 0.0% Conventional Lofts at Bass II 27 11.1% Conventional Lullwater at Bass 316 0.9% Conventional Manchester at Wesleyan 328 1.5% Conventional River Walk 152 3.9% LIHTC (60%) Comparable RiverStone 220 0.5% Conventional Wembly at Overlook 238 0.0% Conventional Whispering Woods 108 0.0% Conventional
H.1.1 Comparables
The apartments in the market most comparable to the subject are listed below:
Table 43—Comparison of Comparables to Subject
Development Name Approximate Distance Reason for Comparability Degree of Comparability
Ashley Woods 2 ½ miles Closest rents to proposal Moderate—significantly higher rents Forest Ridge 2 miles Closest rents to proposal Moderate—significantly higher rents River Walk 1 ½ miles Closest rents to proposal & LIHTC Moderate—significantly higher rents
There are no tax credit apartments in the PMA aside from River Walk, an old property with only three bedroom units. All of the rents at the comparables are at least $100 higher than the subject.
H.1.2 Apartment Inventory
The apartment inventory follows this page. Summary information is shown for each apartment surveyed and detailed information is provided on individual property photo sheets.
H.1.3 Schedule of Present Rents, Units, and Vacancies
The present housing situation is examined in this section. The rents, number of units, and vacancies of the apartments listed in the apartment inventory (shown separately later) are summarized in the tables below. Rents, units, and vacancies are tabulated separately for the various bedroom sizes, a necessary step in making bedroom mix recommendations.
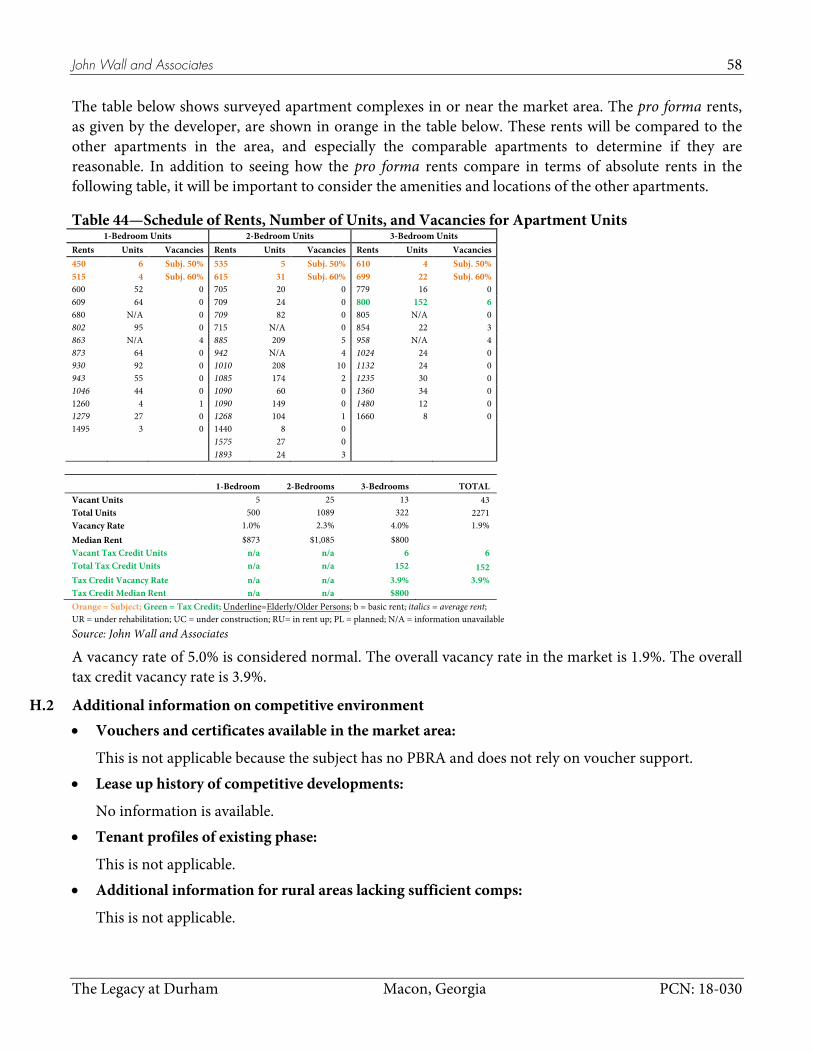
John Wall and Associates 58
The Legacy at Durham Macon, Georgia PCN: 18-030
The table below shows surveyed apartment complexes in or near the market area. The pro forma rents, as given by the developer, are shown in orange in the table below. These rents will be compared to the other apartments in the area, and especially the comparable apartments to determine if they are reasonable. In addition to seeing how the pro forma rents compare in terms of absolute rents in the following table, it will be important to consider the amenities and locations of the other apartments.
Table 44—Schedule of Rents, Number of Units, and Vacancies for Apartment Units 1-Bedroom Units 2-Bedroom Units 3-Bedroom Units
Rents Units Vacancies Rents Units Vacancies Rents Units Vacancies 450 6 Subj. 50% 535 5 Subj. 50% 610 4 Subj. 50% 515 4 Subj. 60% 615 31 Subj. 60% 699 22 Subj. 60% 600 52 0 705 20 0 779 16 0 609 64 0 709 24 0 800 152 6 680 N/A 0 709 82 0 805 N/A 0 802 95 0 715 N/A 0 854 22 3 863 N/A 4 885 209 5 958 N/A 4 873 64 0 942 N/A 4 1024 24 0 930 92 0 1010 208 10 1132 24 0 943 55 0 1085 174 2 1235 30 0 1046 44 0 1090 60 0 1360 34 0 1260 4 1 1090 149 0 1480 12 0 1279 27 0 1268 104 1 1660 8 0 1495 3 0 1440 8 0 1575 27 0 1893 24 3 1-Bedroom 2-Bedrooms 3-Bedrooms TOTAL
5 Vacant Units 25 13 43 500 Total Units 1089 322 2271
1.0% Vacancy Rate 2.3% 4.0% 1.9% $873 Median Rent $1,085 $800
n/a Vacant Tax Credit Units n/a 6 6 n/a Total Tax Credit Units n/a 152 152 n/a Tax Credit Vacancy Rate n/a 3.9% 3.9% n/a Tax Credit Median Rent n/a $800
Orange = Subject; Green = Tax Credit; Underline=Elderly/Older Persons
Source: John Wall and Associates
; b = basic rent; italics = average rent; UR = under rehabilitation; UC = under construction; RU= in rent up; PL = planned; N/A = information unavailable
A vacancy rate of 5.0% is considered normal. The overall vacancy rate in the market is 1.9%. The overall tax credit vacancy rate is 3.9%.
H.2 Additional information on competitive environment • Vouchers and certificates available in the market area:
This is not applicable because the subject has no PBRA and does not rely on voucher support. • Lease up history of competitive developments:
No information is available. • Tenant profiles of existing phase:
This is not applicable. • Additional information for rural areas lacking sufficient comps:
This is not applicable.

John Wall and Associates 59
The Legacy at Durham Macon, Georgia PCN: 18-030
H.3 Apartment Locations Map
Apartment Locations Map
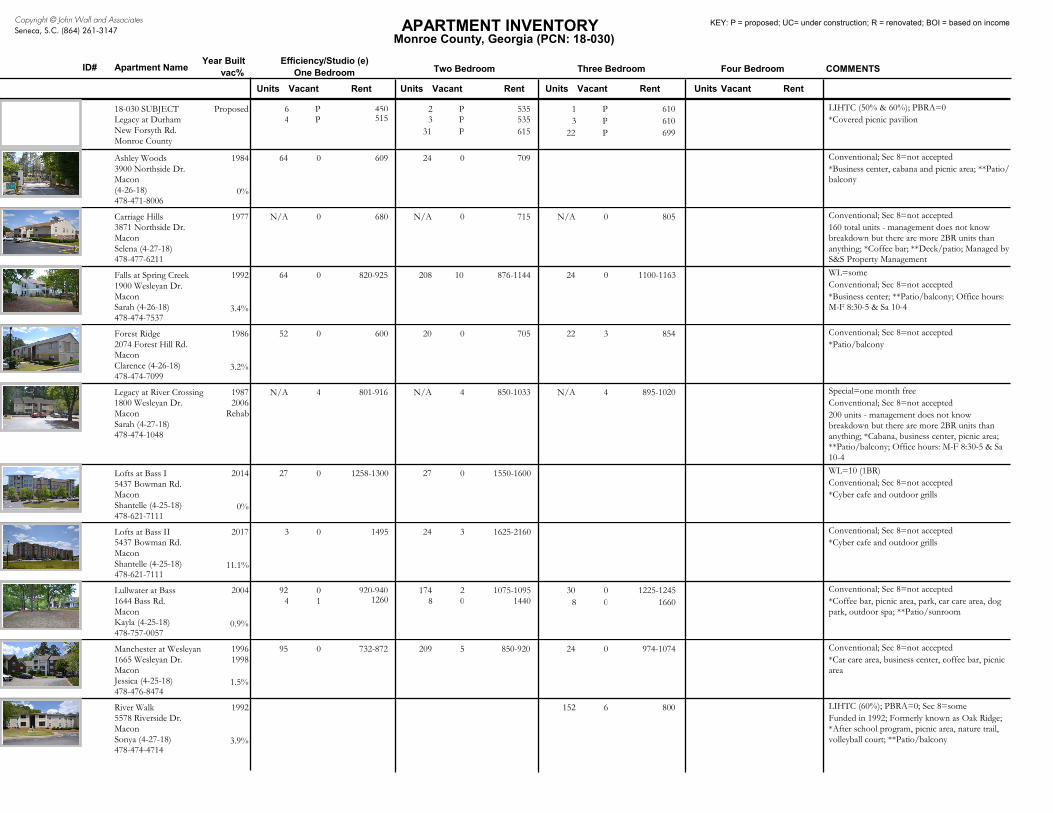
Monroe County, Georgia (PCN: 18-030)
One Bedroom Two Bedroom Three Bedroom Four Bedroom COMMENTS
APARTMENT INVENTORY
Units Vacant Rent
Efficiency/Studio (e)
Copyright © John Wall and AssociatesSeneca, S.C. (864) 261-3147
Apartment NameID#
Units Vacant Rent Units Vacant Rent Units Vacant Rent
Year Builtvac%
KEY: P = proposed; UC= under construction; R = renovated; BOI = based on income
18-030 SUBJECTLegacy at DurhamNew Forsyth Rd.Monroe County
6 2 1*Covered picnic pavilion4 P 3 3P
P 450 P
31 P
535 PP
610Proposed LIHTC (50% & 60%); PBRA=0515 535
615610
22 P 699
Ashley Woods3900 Northside Dr.Macon(4-26-18)478-471-8006
64 24*Business center, cabana and picnic area; **Patio/balcony
0 609 0 7091984
0%
Conventional; Sec 8=not accepted
Carriage Hills3871 Northside Dr.MaconSelena (4-27-18)478-477-6211
N/A N/A N/A160 total units - management does not knowbreakdown but there are more 2BR units thananything; *Coffee bar; **Deck/patio; Managed byS&S Property Management
0 680 0 715 0 8051977 Conventional; Sec 8=not accepted
Falls at Spring Creek1900 Wesleyan Dr.MaconSarah (4-26-18)478-474-7537
64 208 24
*Business center; **Patio/balcony; Office hours:M-F 8:30-5 & Sa 10-4
0 820-925 10 876-1144 0 1100-11631992
3.4%
WL=someConventional; Sec 8=not accepted
Forest Ridge2074 Forest Hill Rd.MaconClarence (4-26-18)478-474-7099
52 20 22*Patio/balcony
0 600 0 705 3 8541986
3.2%
Conventional; Sec 8=not accepted
Special=one month freeLegacy at River Crossing1800 Wesleyan Dr.MaconSarah (4-27-18)478-474-1048
N/A N/A N/A
200 units - management does not knowbreakdown but there are more 2BR units thananything; *Cabana, business center, picnic area;**Patio/balcony; Office hours: M-F 8:30-5 & Sa10-4
4 801-916 4 850-1033 4 895-102019872006
RehabConventional; Sec 8=not accepted
Lofts at Bass I5437 Bowman Rd.MaconShantelle (4-25-18)478-621-7111
27 27
*Cyber cafe and outdoor grills
0 1258-1300 0 1550-16002014
0%
WL=10 (1BR)Conventional; Sec 8=not accepted
Lofts at Bass II5437 Bowman Rd.MaconShantelle (4-25-18)478-621-7111
3 24*Cyber cafe and outdoor grills
0 1495 3 1625-21602017
11.1%
Conventional; Sec 8=not accepted
Lullwater at Bass1644 Bass Rd.MaconKayla (4-25-18)478-757-0057
92 174 30*Coffee bar, picnic area, park, car care area, dogpark, outdoor spa; **Patio/sunroom
4 1 8 800 920-940 2 1075-1095 0
01225-12452004
0.9%
Conventional; Sec 8=not accepted1260 1440 1660
Manchester at Wesleyan1665 Wesleyan Dr.MaconJessica (4-25-18)478-476-8474
95 209 24*Car care area, business center, coffee bar, picnicarea
0 732-872 5 850-920 0 974-107419961998
1.5%
Conventional; Sec 8=not accepted
River Walk5578 Riverside Dr.MaconSonya (4-27-18)478-474-4714
152Funded in 1992; Formerly known as Oak Ridge;*After school program, picnic area, nature trail,volleyball court; **Patio/balcony
6 8001992
3.9%
LIHTC (60%); PBRA=0; Sec 8=some

Monroe County, Georgia (PCN: 18-030)
One Bedroom Two Bedroom Three Bedroom Four Bedroom COMMENTS
APARTMENT INVENTORY
Units Vacant Rent
Efficiency/Studio (e)
Copyright © John Wall and AssociatesSeneca, S.C. (864) 261-3147
Apartment NameID#
Units Vacant Rent Units Vacant Rent Units Vacant Rent
Year Builtvac%
KEY: P = proposed; UC= under construction; R = renovated; BOI = based on income
RiverStone3990 Riverside Park Blvd.MaconShelly (4-25-18)478-257-6044
44 60 12*Picnic area, business center, pool table and carcare area; **Patio/balcony
104 10 958-1134 0 939-1241 0 1314-16462012
0.5%
Conventional; Sec 8=not accepted1164-1371
Wembly at Overlook1091 Overlook Pkwy.MaconCarmen (4-25-18)478-254-7580
55 149 34
*Media room, business center, picnic area andgazebo; **Patio/balcony
0 895-990 0 1055-1125 0 1295-14252012
0%
WL=2-3Conventional; Sec 8=not accepted
Whispering Woods4411 Northside Dr.MaconDenise (4-25-18)478-474-6318
82 16*Patio/balcony
0 699-719 0 77910 0 524e19842002
Rehab0%
Conventional; Sec 8=not accepted

Util
ities
Inclu
ded
MapNumber
Two-Bedroom
Size (s.f.)Laun
dry
Facil
ityTe
nnis
Cour
tSw
imm
ing
Pool
Club
Hou
se
Play
grou
nd
Amenities
Furn
ished
Air
Cond
ition
ing
Dra
pes/
Blin
ds
Appliances Unit Features
Refr
iger
ator
Rang
e/O
ven
Dish
was
her
Gar
bage
Disp
osal
W/D
Con
nect
ion
Gar
ages
Cabl
e Pr
e-W
ired
Oth
er
Oth
er
Oth
er
Monroe County, Georgia (PCN: 18-030)
RentYear Built: Acc
ess/
Secu
rity
Gat
e
Was
her,
Dry
er
Fire
plac
e
Mic
row
ave
Ove
n
Free
Cab
le
Project:
Complex:
Oth
er
Oth
er
Oth
er
18-030 SUBJECT Proposed 97610751075
x x x x x x x x t 535
LIHTC (50% & 60%); PBRA=0
x535615
*
Vacancy Rates: 1 BR 2 BR 3 BR 4 BR overall
Ashley Woods 1984 1100x x x x x x x x x
0.0%
709
Conventional; Sec 8=notaccepted
x x
0.0%
* *x
0.0%Vacancy Rates: 1 BR 2 BR 3 BR 4 BR overall
Carriage Hills 1977 1175x x x x x x x x x x x 715
Conventional; Sec 8=notaccepted
* **x
Vacancy Rates: 1 BR 2 BR 3 BR 4 BR overall
Falls at Spring Creek 1992 1116-1240x x x x x x x x x x $
3.4%
876-1144
Conventional; Sec 8=notaccepted
x
0.0%
* **x x
4.8% 0.0%Vacancy Rates: 1 BR 2 BR 3 BR 4 BR overall
Forest Ridge 1986 1200x x x x x x x x x ws
3.2%
705
Conventional; Sec 8=notaccepted0.0%
*
0.0% 13.6%Vacancy Rates: 1 BR 2 BR 3 BR 4 BR overall
Legacy at River Crossing 1987 978-1188x x x x x x x x x x x 850-1033
Special=one month free Conventional; Sec 8=notaccepted
* **x x
Vacancy Rates: 1 BR 2 BR 3 BR 4 BR overall
xLofts at Bass I 2014 1100-1626x x x x x x x x tp
0.0%
1550-1600
Conventional; Sec 8=notaccepted
x x
0.0%
* x
0.0%Vacancy Rates: 1 BR 2 BR 3 BR 4 BR overall
xLofts at Bass II 2017 1100-1626x x x x x x x x tp
11.1%
1625-2160
Conventional; Sec 8=notaccepted
x x
0.0%
* x
12.5%Vacancy Rates: 1 BR 2 BR 3 BR 4 BR overall
Copyright © John Wall and AssociatesSeneca, S. C. — (864) 261-3147KEY: P = proposed; UC = under construction; R = renovated; BOI = based on income; s = some; a = average; b = basic rent

Util
ities
Inclu
ded
MapNumber
Two-Bedroom
Size (s.f.)Laun
dry
Facil
ityTe
nnis
Cour
tSw
imm
ing
Pool
Club
Hou
se
Play
grou
nd
Amenities
Furn
ished
Air
Cond
ition
ing
Dra
pes/
Blin
ds
Appliances Unit Features
Refr
iger
ator
Rang
e/O
ven
Dish
was
her
Gar
bage
Disp
osal
W/D
Con
nect
ion
Gar
ages
Cabl
e Pr
e-W
ired
Oth
er
Oth
er
Oth
er
Monroe County, Georgia (PCN: 18-030)
RentYear Built: Acc
ess/
Secu
rity
Gat
e
Was
her,
Dry
er
Fire
plac
e
Mic
row
ave
Ove
n
Free
Cab
le
Project:
Complex:
Oth
er
Oth
er
Oth
er
Lullwater at Bass 2004 12861461
x x x s x x x x x x x x p
0.9%
1075-1095
Conventional; Sec 8=notaccepted
x s1440
1.0%
* **x x
1.1% 0.0%Vacancy Rates: 1 BR 2 BR 3 BR 4 BR overall
Manchester at Wesleyan 1996 1163-1432x x x x s x x x x x x x x ws
1.5%
850-920
Conventional; Sec 8=notaccepted
s ss
0.0%
*x x
2.4% 0.0%Vacancy Rates: 1 BR 2 BR 3 BR 4 BR overall
River Walk 1992 x x x x x x x x x x x ws
3.9%LIHTC (60%); PBRA=0; Sec8=some
s* **x x
3.9%Vacancy Rates: 1 BR 2 BR 3 BR 4 BR overall
RiverStone 2012 1185-13601240-1495
x x x x x x x x x x x
0.5%
939-1241
Conventional; Sec 8=notaccepted
x1164-1371
0.0%
* **x x
0.6% 0.0%Vacancy Rates: 1 BR 2 BR 3 BR 4 BR overall
Wembly at Overlook 2012 1139-1213x x x x x x x x x x tp
0.0%
1055-1125
Conventional; Sec 8=notaccepted
x
0.0%
* **x x
0.0% 0.0%Vacancy Rates: 1 BR 2 BR 3 BR 4 BR overall
Whispering Woods 1984 1100-1200x x x x x s x x x tp
0.0%
699-719
Conventional; Sec 8=notaccepted
*x x
0.0% 0.0%Vacancy Rates: 1 BR 2 BR 3 BR 4 BR overall
Copyright © John Wall and AssociatesSeneca, S. C. — (864) 261-3147KEY: P = proposed; UC = under construction; R = renovated; BOI = based on income; s = some; a = average; b = basic rent
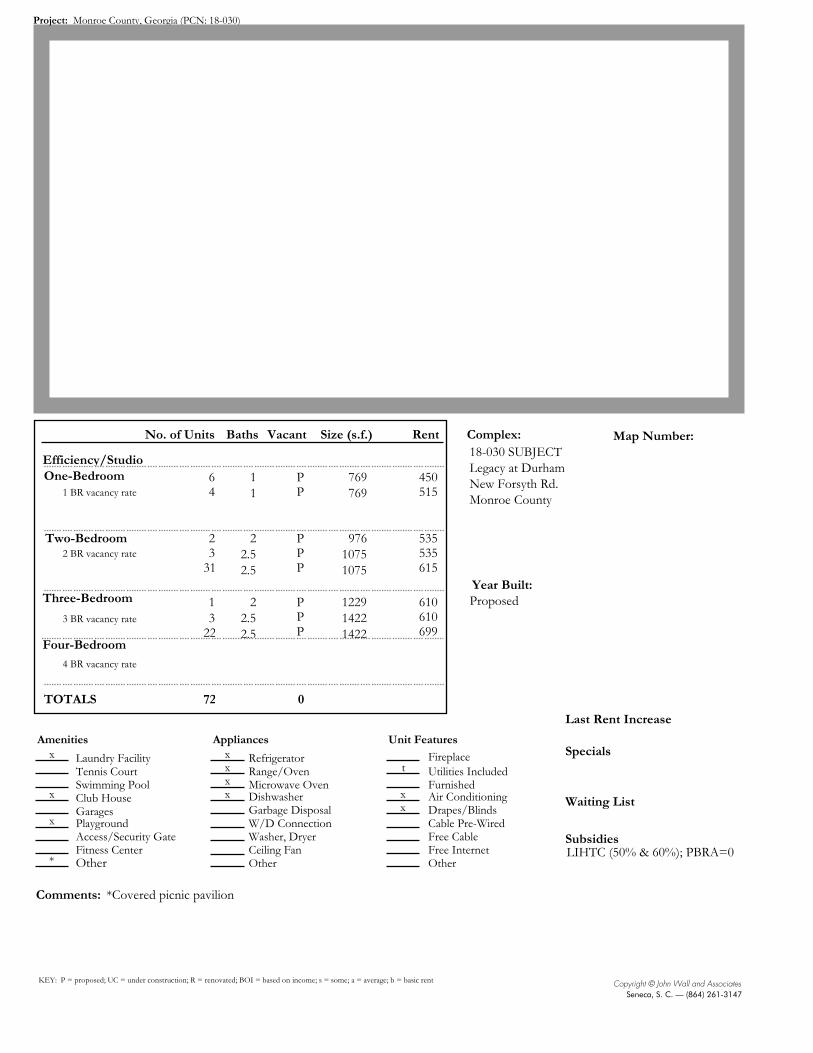
Utilities Included
18-030 SUBJECTLegacy at DurhamNew Forsyth Rd.Monroe County
Proposed
Map Number:
6 769769
11
Efficiency/StudioOne-Bedroom
Two-Bedroom
Three-Bedroom
Four-Bedroom
No. of Units Size (s.f.)Baths
2 97610751075
22.52.5
TOTALS 72
1
*Covered picnic pavilionComments:
122914221422
4
3
32
2.52.5
31
x Laundry FacilityTennis CourtSwimming Pool
x Club House
x Playground
Amenities
FurnishedAir ConditioningDrapes/Blinds
Appliances Unit Featuresxx
x xx
tRefrigeratorRange/Oven
DishwasherGarbage DisposalW/D Connection
GaragesCable Pre-Wired
Other Other Other
Monroe County, Georgia (PCN: 18-030)
Vacant Rent
P
P
P
P
P
P
0
450
535
610
Copyright © John Wall and AssociatesSeneca, S. C. — (864) 261-3147
PYear Built:
Specials
SubsidiesLIHTC (50% & 60%); PBRA=0
Waiting List
Access/Security Gate Washer, Dryer
Fireplace
x Microwave Oven
515
535615
610
Free Cable
Last Rent Increase
KEY: P = proposed; UC = under construction; R = renovated; BOI = based on income; s = some; a = average; b = basic rent
22 P 699
1 BR vacancy rate
Project:
Complex:
*Fitness Center Free InternetCeiling Fan
2 BR vacancy rate
3 BR vacancy rate
4 BR vacancy rate

Utilities Included
Ashley Woods3900 Northside Dr.Macon(4-26-18)478-471-8006
1984
Map Number:
64 8001Efficiency/StudioOne-Bedroom
Two-Bedroom
Three-Bedroom
Four-Bedroom
No. of Units Size (s.f.)Baths
24 11002
TOTALS 88
*Business center, cabana and picnic area; **Patio/balconyComments:
Laundry FacilityTennis Court
x Swimming PoolClub House
x Playground
Amenities
FurnishedAir ConditioningDrapes/Blinds
Appliances Unit Featuresxx
xx
xxx
RefrigeratorRange/Oven
DishwasherGarbage DisposalW/D Connection
GaragesCable Pre-Wired
Other Other Other
Monroe County, Georgia (PCN: 18-030)
Vacant Rent
0
0
00.0%
609
709
Copyright © John Wall and AssociatesSeneca, S. C. — (864) 261-3147
Year Built:
Specials
SubsidiesConventional; Sec 8=notaccepted
Waiting List
x Access/Security Gate Washer, Dryer
Fireplace
x Microwave Oven
Free Cable
Last Rent Increase
KEY: P = proposed; UC = under construction; R = renovated; BOI = based on income; s = some; a = average; b = basic rent
0.0%1 BR vacancy rate
Project:
Complex:
* *Fitness Center Free Internetx Ceiling Fan
0.0%2 BR vacancy rate
3 BR vacancy rate
4 BR vacancy rate
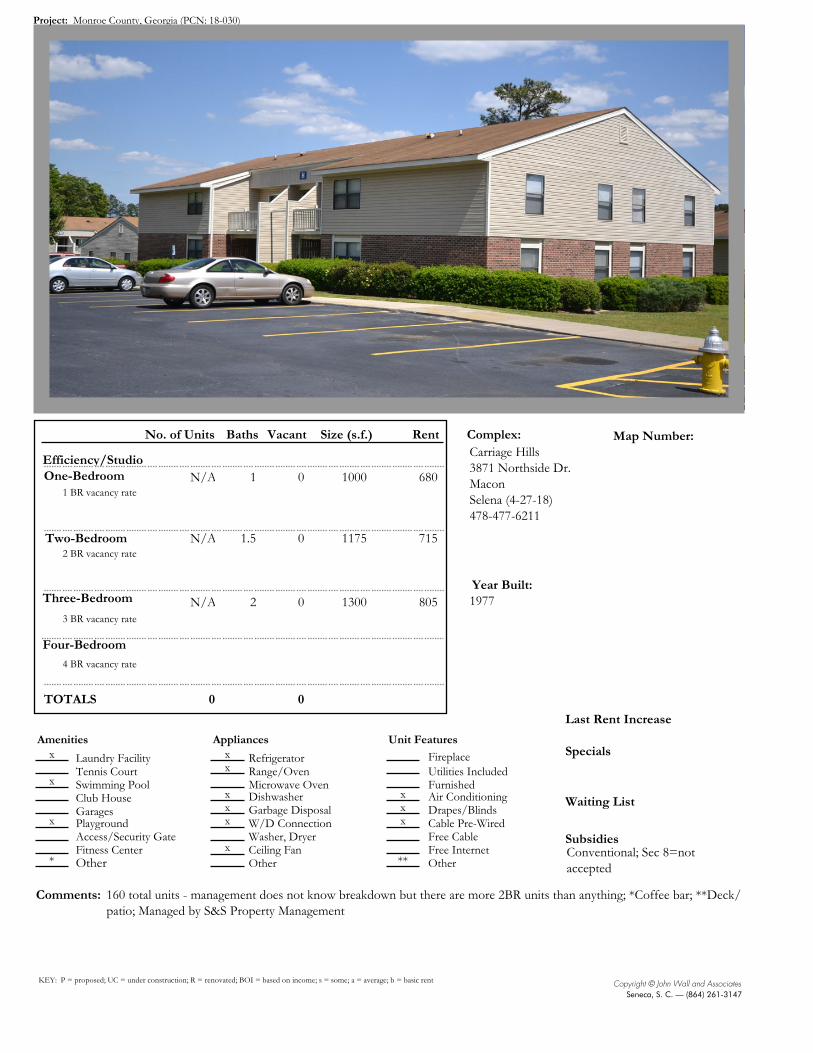
Utilities Included
Carriage Hills3871 Northside Dr.MaconSelena (4-27-18)478-477-6211
1977
Map Number:
N/A 10001Efficiency/StudioOne-Bedroom
Two-Bedroom
Three-Bedroom
Four-Bedroom
No. of Units Size (s.f.)Baths
N/A 11751.5
TOTALS 0
N/A
160 total units - management does not know breakdown but there are more 2BR units than anything; *Coffee bar; **Deck/patio; Managed by S&S Property Management
Comments:
13002
x Laundry FacilityTennis Court
x Swimming PoolClub House
x Playground
Amenities
FurnishedAir ConditioningDrapes/Blinds
Appliances Unit Featuresxx
xxx
xxx
RefrigeratorRange/Oven
DishwasherGarbage DisposalW/D Connection
GaragesCable Pre-Wired
Other Other Other
Monroe County, Georgia (PCN: 18-030)
Vacant Rent
0
0
0
680
715
805
Copyright © John Wall and AssociatesSeneca, S. C. — (864) 261-3147
0Year Built:
Specials
SubsidiesConventional; Sec 8=notaccepted
Waiting List
Access/Security Gate Washer, Dryer
Fireplace
Microwave Oven
Free Cable
Last Rent Increase
KEY: P = proposed; UC = under construction; R = renovated; BOI = based on income; s = some; a = average; b = basic rent
1 BR vacancy rate
Project:
Complex:
* **Fitness Center Free Internetx Ceiling Fan
2 BR vacancy rate
3 BR vacancy rate
4 BR vacancy rate

Utilities Included
Falls at Spring Creek1900 Wesleyan Dr.MaconSarah (4-26-18)478-474-7537
1992
Map Number:
64 800-9021Efficiency/StudioOne-Bedroom
Two-Bedroom
Three-Bedroom
Four-Bedroom
No. of Units Size (s.f.)Baths
208 1116-12401-2
TOTALS 296
24
*Business center; **Patio/balcony; Office hours: M-F 8:30-5 & Sa 10-4Comments:
13202
x Laundry FacilityTennis CourtSwimming PoolClub House
x Playground
Amenities
FurnishedAir ConditioningDrapes/Blinds
Appliances Unit Featuresxx
xxx
xxx
$RefrigeratorRange/Oven
DishwasherGarbage DisposalW/D Connection
GaragesCable Pre-Wired
Other Other Other
Monroe County, Georgia (PCN: 18-030)
Vacant Rent
0
10
103.4%
820-925
876-1144
1100-1163
Copyright © John Wall and AssociatesSeneca, S. C. — (864) 261-3147
0Year Built:
Specials
SubsidiesConventional; Sec 8=notaccepted
Waiting ListWL=some
x Access/Security Gate Washer, Dryer
Fireplace
Microwave Oven
Free Cable
Last Rent Increase
KEY: P = proposed; UC = under construction; R = renovated; BOI = based on income; s = some; a = average; b = basic rent
0.0%1 BR vacancy rate
Project:
Complex:
* **x Fitness Center Free Internetx Ceiling Fan
4.8%
0.0%
2 BR vacancy rate
3 BR vacancy rate
4 BR vacancy rate

Utilities Included
Forest Ridge2074 Forest Hill Rd.MaconClarence (4-26-18)478-474-7099
1986
Map Number:
52 8001Efficiency/StudioOne-Bedroom
Two-Bedroom
Three-Bedroom
Four-Bedroom
No. of Units Size (s.f.)Baths
20 12002
TOTALS 94
22
*Patio/balconyComments:
15002.5
x Laundry FacilityTennis CourtSwimming PoolClub House
Playground
Amenities
FurnishedAir ConditioningDrapes/Blinds
Appliances Unit Featuresxx
xxx
xxx
wstRefrigeratorRange/Oven
DishwasherGarbage DisposalW/D Connection
GaragesCable Pre-Wired
Other Other Other
Monroe County, Georgia (PCN: 18-030)
Vacant Rent
0
0
33.2%
600
705
854
Copyright © John Wall and AssociatesSeneca, S. C. — (864) 261-3147
3Year Built:
Specials
SubsidiesConventional; Sec 8=notaccepted
Waiting List
Access/Security Gate Washer, Dryer
Fireplace
Microwave Oven
Free Cable
Last Rent Increase
KEY: P = proposed; UC = under construction; R = renovated; BOI = based on income; s = some; a = average; b = basic rent
0.0%1 BR vacancy rate
Project:
Complex:
*Fitness Center Free InternetCeiling Fan
0.0%
13.6%
2 BR vacancy rate
3 BR vacancy rate
4 BR vacancy rate

Utilities Included
Legacy at River Crossing1800 Wesleyan Dr.MaconSarah (4-27-18)478-474-1048
19872006 Rehab
Map Number:
N/A 745-8051Efficiency/StudioOne-Bedroom
Two-Bedroom
Three-Bedroom
Four-Bedroom
No. of Units Size (s.f.)Baths
N/A 978-11881-2
TOTALS 0
N/A
200 units - management does not know breakdown but there are more 2BR units than anything; *Cabana, business center,picnic area; **Patio/balcony; Office hours: M-F 8:30-5 & Sa 10-4
Comments:
12502
x Laundry Facilityx Tennis Courtx Swimming Poolx Club House
Playground
Amenities
FurnishedAir ConditioningDrapes/Blinds
Appliances Unit Featuresxx
x
x
xxx
RefrigeratorRange/Oven
DishwasherGarbage DisposalW/D Connection
GaragesCable Pre-Wired
Other Other Other
Monroe County, Georgia (PCN: 18-030)
Vacant Rent
4
4
12
801-916
850-1033
895-1020
Copyright © John Wall and AssociatesSeneca, S. C. — (864) 261-3147
4Year Built:
Specials
Subsidies
Special=one month free
Conventional; Sec 8=notaccepted
Waiting List
Access/Security Gate Washer, Dryer
Fireplace
Microwave Oven
Free Cable
Last Rent Increase
KEY: P = proposed; UC = under construction; R = renovated; BOI = based on income; s = some; a = average; b = basic rent
1 BR vacancy rate
Project:
Complex:
* **x Fitness Center Free Internetx Ceiling Fan
2 BR vacancy rate
3 BR vacancy rate
4 BR vacancy rate

Utilities Included
x
Lofts at Bass I5437 Bowman Rd.MaconShantelle (4-25-18)478-621-7111
2014
Map Number:
27 826-9911Efficiency/StudioOne-Bedroom
Two-Bedroom
Three-Bedroom
Four-Bedroom
No. of Units Size (s.f.)Baths
27 1100-16262
TOTALS 54
*Cyber cafe and outdoor grillsComments:
Laundry FacilityTennis Court
x Swimming PoolClub House
Playground
Amenities
FurnishedAir ConditioningDrapes/Blinds
Appliances Unit Featuresxx
x
x
xxx
tpRefrigeratorRange/Oven
DishwasherGarbage DisposalW/D Connection
GaragesCable Pre-Wired
Other Other Other
Monroe County, Georgia (PCN: 18-030)
Vacant Rent
0
0
00.0%
1258-1300
1550-1600
Copyright © John Wall and AssociatesSeneca, S. C. — (864) 261-3147
Year Built:
Specials
SubsidiesConventional; Sec 8=notaccepted
Waiting ListWL=10 (1BR)
Access/Security Gate x Washer, Dryer
Fireplace
x Microwave Oven
Free Cable
Last Rent Increase
KEY: P = proposed; UC = under construction; R = renovated; BOI = based on income; s = some; a = average; b = basic rent
0.0%1 BR vacancy rate
Project:
Complex:
*Fitness Center x Free InternetCeiling Fan
0.0%2 BR vacancy rate
3 BR vacancy rate
4 BR vacancy rate

Utilities Included
x
Lofts at Bass II5437 Bowman Rd.MaconShantelle (4-25-18)478-621-7111
2017
Map Number:
3 826-9911Efficiency/StudioOne-Bedroom
Two-Bedroom
Three-Bedroom
Four-Bedroom
No. of Units Size (s.f.)Baths
24 1100-16262
TOTALS 27
*Cyber cafe and outdoor grillsComments:
Laundry FacilityTennis Court
x Swimming PoolClub House
Playground
Amenities
FurnishedAir ConditioningDrapes/Blinds
Appliances Unit Featuresxx
x
x
xxx
tpRefrigeratorRange/Oven
DishwasherGarbage DisposalW/D Connection
GaragesCable Pre-Wired
Other Other Other
Monroe County, Georgia (PCN: 18-030)
Vacant Rent
0
3
311.1%
1495
1625-2160
Copyright © John Wall and AssociatesSeneca, S. C. — (864) 261-3147
Year Built:
Specials
SubsidiesConventional; Sec 8=notaccepted
Waiting List
Access/Security Gate x Washer, Dryer
Fireplace
x Microwave Oven
Free Cable
Last Rent Increase
KEY: P = proposed; UC = under construction; R = renovated; BOI = based on income; s = some; a = average; b = basic rent
0.0%1 BR vacancy rate
Project:
Complex:
*Fitness Center x Free InternetCeiling Fan
12.5%2 BR vacancy rate
3 BR vacancy rate
4 BR vacancy rate
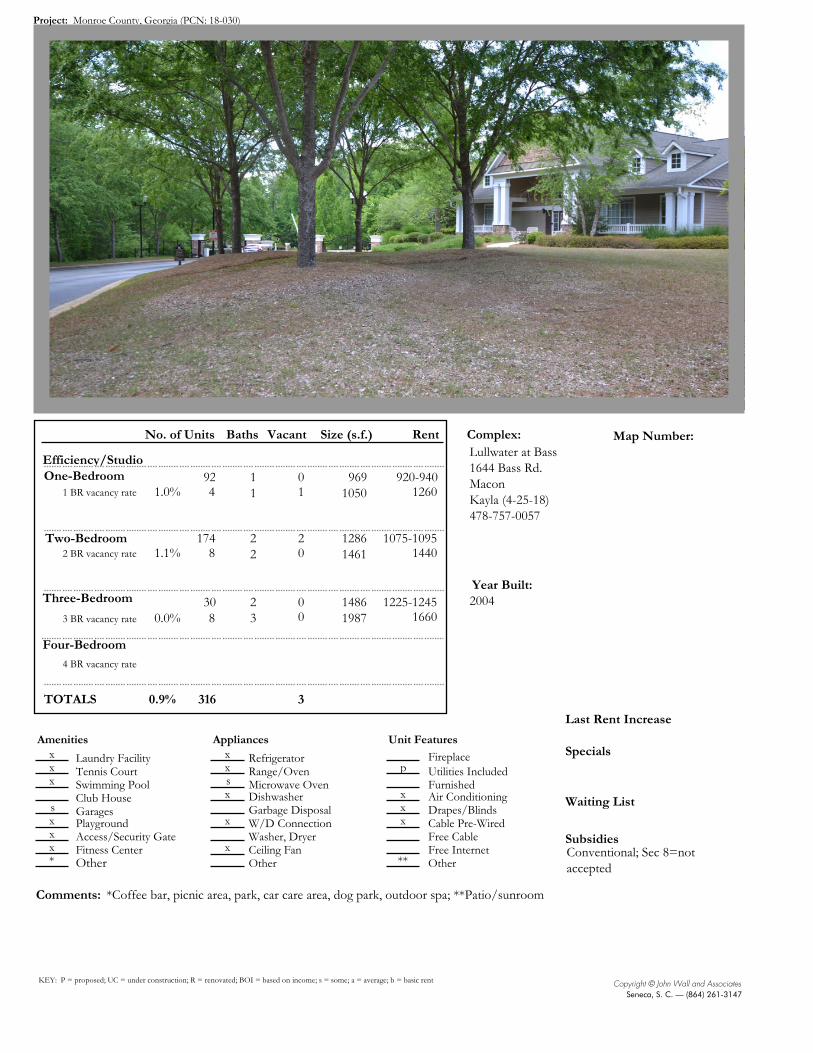
Utilities Included
Lullwater at Bass1644 Bass Rd.MaconKayla (4-25-18)478-757-0057
2004
Map Number:
92 9691050
11
Efficiency/StudioOne-Bedroom
Two-Bedroom
Three-Bedroom
Four-Bedroom
No. of Units Size (s.f.)Baths
174 12861461
22
TOTALS 316
30
*Coffee bar, picnic area, park, car care area, dog park, outdoor spa; **Patio/sunroomComments:
14861987
4
8
823
x Laundry Facilityx Tennis Courtx Swimming Pool
Club Housesx Playground
Amenities
FurnishedAir ConditioningDrapes/Blinds
Appliances Unit Featuresxx
x
x
xxx
pRefrigeratorRange/Oven
DishwasherGarbage DisposalW/D Connection
GaragesCable Pre-Wired
Other Other Other
Monroe County, Georgia (PCN: 18-030)
Vacant Rent
1
0
0
0
2
30.9%
920-940
1075-1095
1225-1245
Copyright © John Wall and AssociatesSeneca, S. C. — (864) 261-3147
0Year Built:
Specials
SubsidiesConventional; Sec 8=notaccepted
Waiting List
x Access/Security Gate Washer, Dryer
Fireplace
s Microwave Oven
1260
1440
1660
Free Cable
Last Rent Increase
KEY: P = proposed; UC = under construction; R = renovated; BOI = based on income; s = some; a = average; b = basic rent
1.0%1 BR vacancy rate
Project:
Complex:
* **x Fitness Center Free Internetx Ceiling Fan
1.1%
0.0%
2 BR vacancy rate
3 BR vacancy rate
4 BR vacancy rate
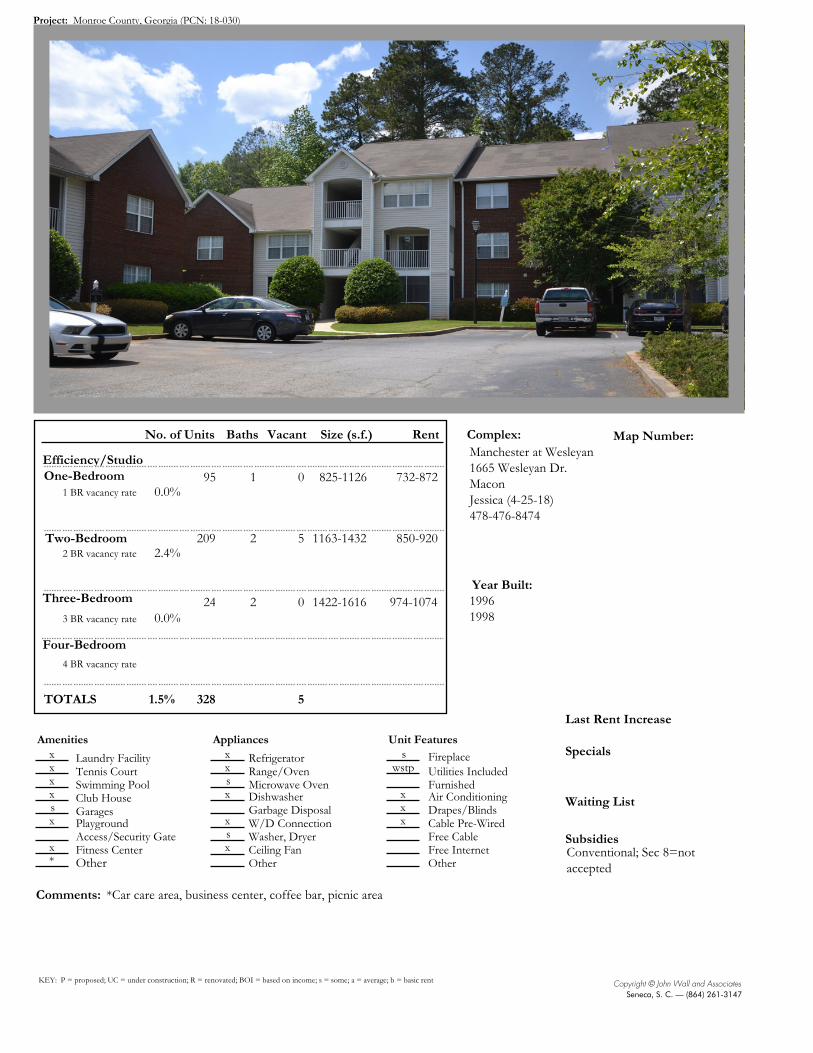
Utilities Included
Manchester at Wesleyan1665 Wesleyan Dr.MaconJessica (4-25-18)478-476-8474
19961998
Map Number:
95 825-11261Efficiency/StudioOne-Bedroom
Two-Bedroom
Three-Bedroom
Four-Bedroom
No. of Units Size (s.f.)Baths
209 1163-14322
TOTALS 328
24
*Car care area, business center, coffee bar, picnic areaComments:
1422-16162
x Laundry Facilityx Tennis Courtx Swimming Poolx Club Housesx Playground
Amenities
FurnishedAir ConditioningDrapes/Blinds
Appliances Unit Featuresxx
x
x
xxx
wstpRefrigeratorRange/Oven
DishwasherGarbage DisposalW/D Connection
GaragesCable Pre-Wired
Other Other Other
Monroe County, Georgia (PCN: 18-030)
Vacant Rent
0
5
51.5%
732-872
850-920
974-1074
Copyright © John Wall and AssociatesSeneca, S. C. — (864) 261-3147
0Year Built:
Specials
SubsidiesConventional; Sec 8=notaccepted
Waiting List
Access/Security Gate s
s
Washer, Dryer
Fireplace
s Microwave Oven
Free Cable
Last Rent Increase
KEY: P = proposed; UC = under construction; R = renovated; BOI = based on income; s = some; a = average; b = basic rent
0.0%1 BR vacancy rate
Project:
Complex:
*x Fitness Center Free Internetx Ceiling Fan
2.4%
0.0%
2 BR vacancy rate
3 BR vacancy rate
4 BR vacancy rate

Utilities Included
River Walk5578 Riverside Dr.MaconSonya (4-27-18)478-474-4714
1992
Map Number:
Efficiency/StudioOne-Bedroom
Two-Bedroom
Three-Bedroom
Four-Bedroom
No. of Units Size (s.f.)Baths
TOTALS 152
152
Funded in 1992; Formerly known as Oak Ridge; *After school program, picnic area, nature trail, volleyball court; **Patio/balcony
Comments:
13712
x Laundry FacilityTennis Court
x Swimming Poolx Club House
x Playground
Amenities
FurnishedAir ConditioningDrapes/Blinds
Appliances Unit Featuresxx
x
x
xxx
wstpRefrigeratorRange/Oven
DishwasherGarbage DisposalW/D Connection
GaragesCable Pre-Wired
Other Other Other
Monroe County, Georgia (PCN: 18-030)
Vacant Rent
63.9%
800
Copyright © John Wall and AssociatesSeneca, S. C. — (864) 261-3147
6Year Built:
Specials
SubsidiesLIHTC (60%); PBRA=0; Sec8=some
Waiting List
Access/Security Gate Washer, Dryer
Fireplace
s Microwave Oven
Free Cable
Last Rent Increase
KEY: P = proposed; UC = under construction; R = renovated; BOI = based on income; s = some; a = average; b = basic rent
1 BR vacancy rate
Project:
Complex:
* **x Fitness Center Free Internetx Ceiling Fan
3.9%
2 BR vacancy rate
3 BR vacancy rate
4 BR vacancy rate

Utilities Included
RiverStone3990 Riverside Park Blvd.MaconShelly (4-25-18)478-257-6044
2012
Map Number:
44 850-9901Efficiency/StudioOne-Bedroom
Two-Bedroom
Three-Bedroom
Four-Bedroom
No. of Units Size (s.f.)Baths
60 1185-13601240-1495
12
TOTALS 220
12
*Picnic area, business center, pool table and car care area; **Patio/balconyComments:
1440-1590
104
2
Laundry FacilityTennis Court
x Swimming Poolx Club House
x Playground
Amenities
FurnishedAir ConditioningDrapes/Blinds
Appliances Unit Featuresxx
xxx
xxx
RefrigeratorRange/Oven
DishwasherGarbage DisposalW/D Connection
GaragesCable Pre-Wired
Other Other Other
Monroe County, Georgia (PCN: 18-030)
Vacant Rent
1
0
0
10.5%
958-1134
939-1241
1314-1646
Copyright © John Wall and AssociatesSeneca, S. C. — (864) 261-3147
0Year Built:
Specials
SubsidiesConventional; Sec 8=notaccepted
Waiting List
Access/Security Gate x Washer, Dryer
Fireplace
Microwave Oven
1164-1371
Free Cable
Last Rent Increase
KEY: P = proposed; UC = under construction; R = renovated; BOI = based on income; s = some; a = average; b = basic rent
0.0%1 BR vacancy rate
Project:
Complex:
* **x Fitness Center Free Internetx Ceiling Fan
0.6%
0.0%
2 BR vacancy rate
3 BR vacancy rate
4 BR vacancy rate

Utilities Included
Wembly at Overlook1091 Overlook Pkwy.MaconCarmen (4-25-18)478-254-7580
2012
Map Number:
55 787-8871Efficiency/StudioOne-Bedroom
Two-Bedroom
Three-Bedroom
Four-Bedroom
No. of Units Size (s.f.)Baths
149 1139-12132
TOTALS 238
34
*Media room, business center, picnic area and gazebo; **Patio/balconyComments:
1304-13912
Laundry FacilityTennis Court
x Swimming Poolx Club House
x Playground
Amenities
FurnishedAir ConditioningDrapes/Blinds
Appliances Unit Featuresxx
x
x
xxx
tpRefrigeratorRange/Oven
DishwasherGarbage DisposalW/D Connection
GaragesCable Pre-Wired
Other Other Other
Monroe County, Georgia (PCN: 18-030)
Vacant Rent
0
0
00.0%
895-990
1055-1125
1295-1425
Copyright © John Wall and AssociatesSeneca, S. C. — (864) 261-3147
0Year Built:
Specials
SubsidiesConventional; Sec 8=notaccepted
Waiting ListWL=2-3
Access/Security Gate Washer, Dryer
Fireplace
x Microwave Oven
Free Cable
Last Rent Increase
KEY: P = proposed; UC = under construction; R = renovated; BOI = based on income; s = some; a = average; b = basic rent
0.0%1 BR vacancy rate
Project:
Complex:
* **x Fitness Center Free Internetx Ceiling Fan
0.0%
0.0%
2 BR vacancy rate
3 BR vacancy rate
4 BR vacancy rate
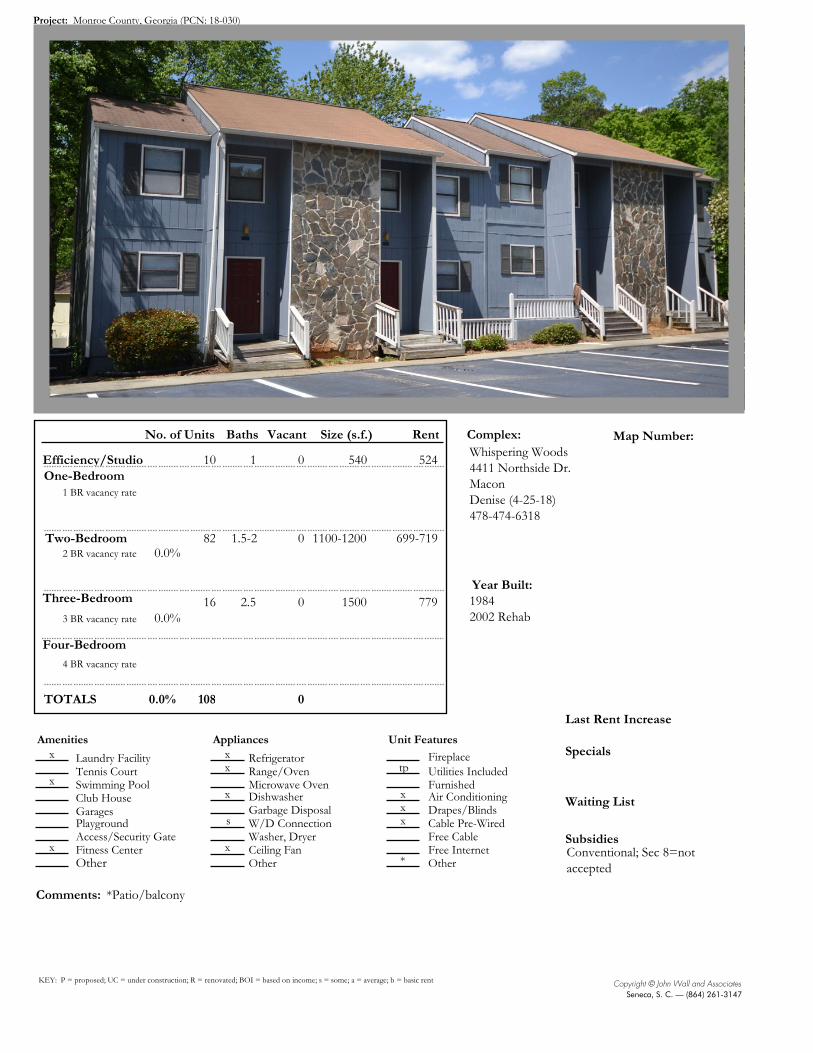
Utilities Included
Whispering Woods4411 Northside Dr.MaconDenise (4-25-18)478-474-6318
19842002 Rehab
Map Number:
10 5401Efficiency/StudioOne-Bedroom
Two-Bedroom
Three-Bedroom
Four-Bedroom
No. of Units Size (s.f.)Baths
82 1100-12001.5-2
TOTALS 108
16
*Patio/balconyComments:
15002.5
x Laundry FacilityTennis Court
x Swimming PoolClub House
Playground
Amenities
FurnishedAir ConditioningDrapes/Blinds
Appliances Unit Featuresxx
x
s
xxx
tpRefrigeratorRange/Oven
DishwasherGarbage DisposalW/D Connection
GaragesCable Pre-Wired
Other Other Other
Monroe County, Georgia (PCN: 18-030)
Vacant Rent
0
0
00.0%
524
699-719
779
Copyright © John Wall and AssociatesSeneca, S. C. — (864) 261-3147
0Year Built:
Specials
SubsidiesConventional; Sec 8=notaccepted
Waiting List
Access/Security Gate Washer, Dryer
Fireplace
Microwave Oven
Free Cable
Last Rent Increase
KEY: P = proposed; UC = under construction; R = renovated; BOI = based on income; s = some; a = average; b = basic rent
1 BR vacancy rate
Project:
Complex:
*x Fitness Center Free Internetx Ceiling Fan
0.0%
0.0%
2 BR vacancy rate
3 BR vacancy rate
4 BR vacancy rate

John Wall and Associates 60
The Legacy at Durham Macon, Georgia PCN: 18-030
H.4 Amenity Analysis Development Amenities: Laundry room, clubhouse/community center, playground, and covered picnic pavilion. Unit Amenities: Refrigerator, range/oven, microwave, dishwasher, HVAC, and blinds. Utilities Included: Trash. The subject’s amenities are typical of modern tax credit apartments. River Walk, the only tax credit apartments in the market area, has a pool.
H.5 Selection of Comps See H.1.1
H.6 Long Term Occupancy In light of vacancy and stabilization rates in the local market area, the subject should not have any difficulty maintaining 93% stabilized occupancy or better.
H.7 New “Supply” DCA requires comparable units built since the base year to be deducted from demand. Only comparable units within comparable complexes will be deducted from demand, as indicated by the asterisks.
Table 45—Apartment Units Built or Proposed Since the Base Year Development Name
Year Built
Units With Rental Assistance
30% AMI, No Rental Assistance
50% AMI, No Rental Assistance
60% AMI, No Rental Assistance
Above Moderate Income
TOTAL
NONE
* Units that will be deducted from demand; parenthetical numbers indicate partial comparability. I.e., 100(50*) indicates that there are 100 new units of which only half are comparable.
There is nothing to deduct as new supply.
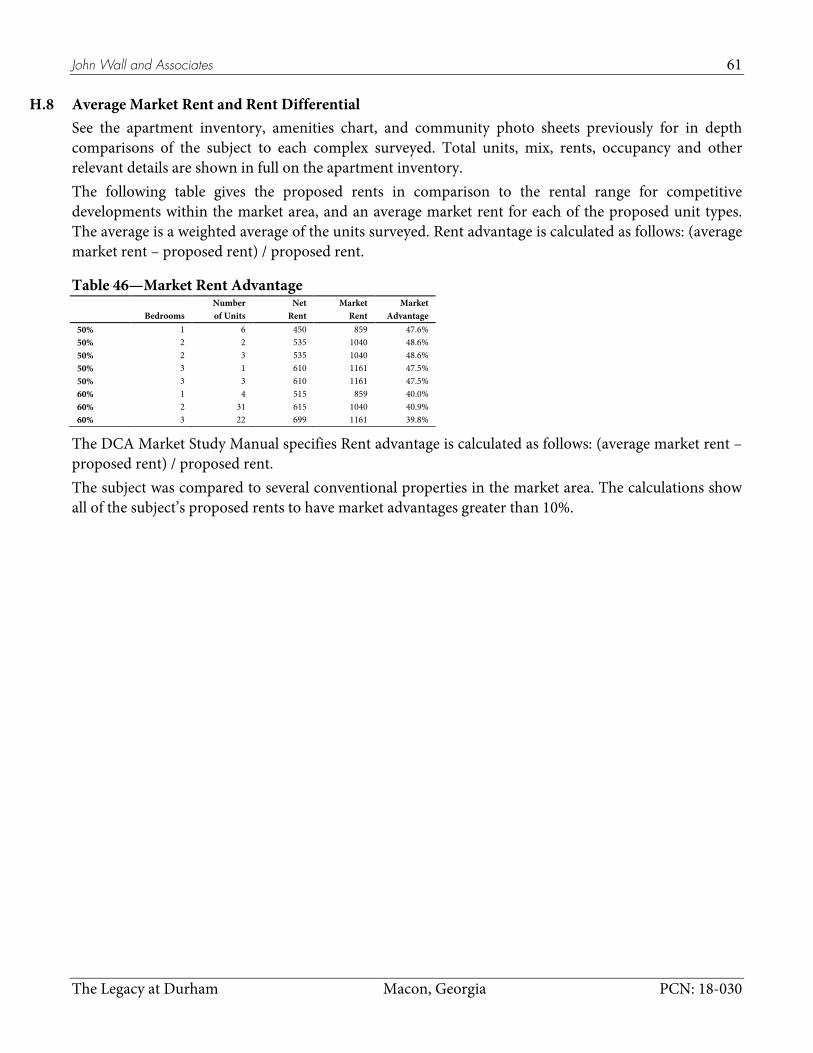
John Wall and Associates 61
The Legacy at Durham Macon, Georgia PCN: 18-030
H.8 Average Market Rent and Rent Differential See the apartment inventory, amenities chart, and community photo sheets previously for in depth comparisons of the subject to each complex surveyed. Total units, mix, rents, occupancy and other relevant details are shown in full on the apartment inventory. The following table gives the proposed rents in comparison to the rental range for competitive developments within the market area, and an average market rent for each of the proposed unit types. The average is a weighted average of the units surveyed. Rent advantage is calculated as follows: (average market rent – proposed rent) / proposed rent.
Table 46—Market Rent Advantage
Number Net Market Market Bedrooms of Units Rent Rent Advantage
50% 1 6 450 859 47.6% 50% 2 2 535 1040 48.6% 50% 2 3 535 1040 48.6% 50% 3 1 610 1161 47.5% 50% 3 3 610 1161 47.5% 60% 1 4 515 859 40.0% 60% 2 31 615 1040 40.9% 60% 3 22 699 1161 39.8%
The DCA Market Study Manual specifies Rent advantage is calculated as follows: (average market rent – proposed rent) / proposed rent. The subject was compared to several conventional properties in the market area. The calculations show all of the subject’s proposed rents to have market advantages greater than 10%.

John Wall and Associates 62
The Legacy at Durham Macon, Georgia PCN: 18-030
H.9 Information on Other DCA properties See the Schedule of Rents Units and Vacancies along with the Apartment Inventory and the Photo Sheets.
H.10 Rental Trends in the Market Area
H.10.1 Tenure
Table 47—Tenure by Bedrooms
State % County % Market Area % City % 2,263,697 Owner occupied: 7,257 8,722 30,261
No bedroom 6,123 0.3% 14 0.2% 24 0.3% 65 0.2% 1 bedroom 26,881 1.2% 81 1.1% 25 0.3% 233 0.8% 2 bedrooms 261,627 11.6% 806 11.1% 553 6.3% 3,936 13.0% 3 bedrooms 1,159,319 51.2% 4,371 60.2% 4,199 48.1% 17,664 58.4% 4 bedrooms 587,756 26.0% 1,397 19.3% 2,866 32.9% 6,804 22.5% 5 or more bedrooms 221,991 9.8% 588 8.1% 1,055 12.1% 1,559 5.2%
1,310,665 Renter occupied: 2,324 5,193 26,764 No bedroom 36,160 2.8% 64 2.8% 229 4.4% 585 2.2% 1 bedroom 221,703 16.9% 300 12.9% 1,142 22.0% 4,748 17.7% 2 bedrooms 499,353 38.1% 1,181 50.8% 2,760 53.1% 11,683 43.7% 3 bedrooms 424,848 32.4% 702 30.2% 877 16.9% 7,880 29.4% 4 bedrooms 104,845 8.0% 77 3.3% 141 2.7% 1,517 5.7% 5 or more bedrooms 23,756 1.8% 0 0.0% 45 0.9% 351 1.3%
Source: 2015-5yr ACS (Census)
Tenure by Bedrooms for the State and Market Area
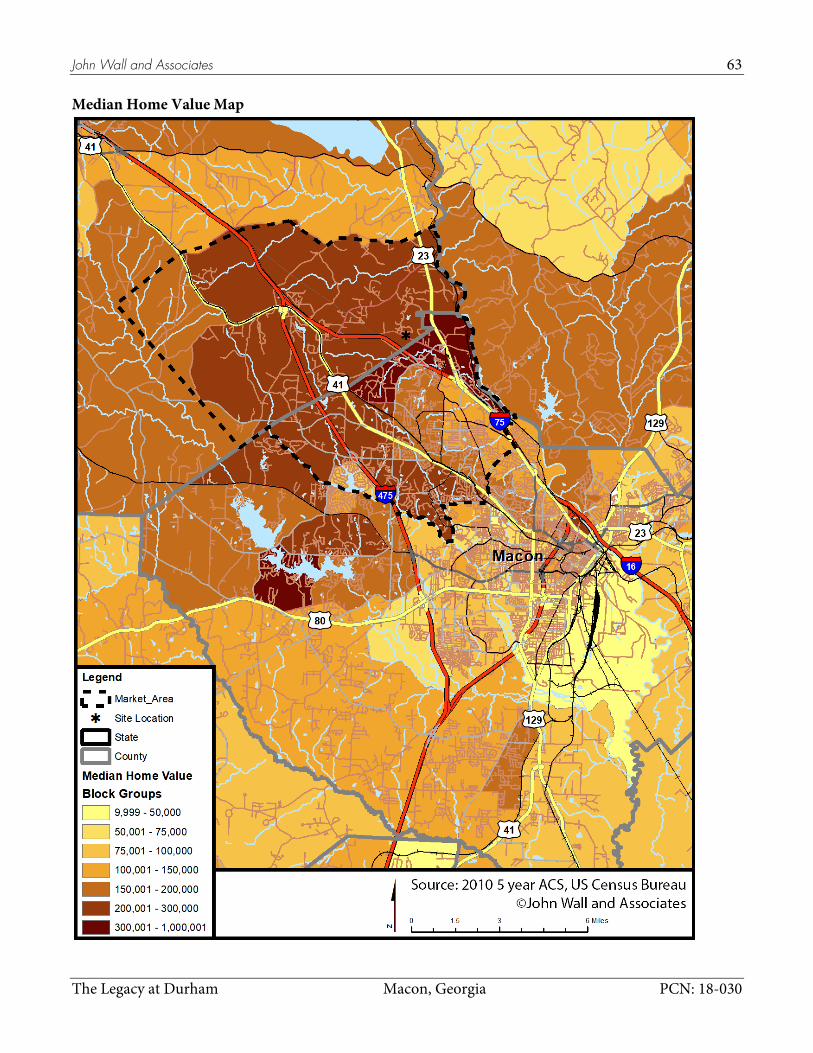
John Wall and Associates 63
The Legacy at Durham Macon, Georgia PCN: 18-030
Median Home Value Map

John Wall and Associates 64
The Legacy at Durham Macon, Georgia PCN: 18-030
H.11 Impact of Foreclosed, Abandoned, etc. Properties There is no evidence of any adverse impact due to foreclosure or abandonment.
H.12 Primary Housing Voids There are no modern tax credit apartments in the market area.
H.13 Long Term Impact The subject will have no long term impact on the occupancy of other assisted properties.
H.14 Building Permits Issued Building permits are an indicator of the economic strength and activity of a community. While permits are never issued for a market area, the multi-family permits issued for the county and town are an indicator of apartments recently added to the supply:
Table 48—Building Permits Issued Monroe County Macon-Bibb County
Year Total Single Family Multi-Family Total Single Family Multi-Family 2000 146 146 0 98 98 0 2001 143 143 0 81 81 0 2002 12 12 0 220 146 74 2003 226 226 0 346 149 197 2004 337 337 0 229 92 137 2005 263 255 8 93 93 0 2006 561 557 4 87 87 0 2007 503 499 4 135 74 61 2008 214 214 0 50 26 24 2009 112 112 0 9 9 0 2010 110 110 0 110 92 18 2011 47 47 0 20 20 0 2012 127 47 80 36 16 20 2013 88 64 24 8 8 0 2014 77 77 0 7 7 0 2015 82 82 0 113 113 0 2016 106 106 0 89 89 0
Source: C-40, U.S. Dept. of Commerce, Bureau of the Census, “Housing Units Authorized by Building Permits”

John Wall and Associates 65
The Legacy at Durham Macon, Georgia PCN: 18-030
Median Gross Rent Map

John Wall and Associates 66
The Legacy at Durham Macon, Georgia PCN: 18-030
I. Absorption & Stabilization Rates Given reasonable marketing and management, the development should be able to rent up to 93% occupancy within 5 months — a few months longer if the development is completed in November, December, or January. The absorption rate determination considers such factors as the overall estimate of new household growth, the available supply of competitive units, observed trends in absorption of comparable units, and the availability of subsidies and rent specials. The absorption period is considered to start as soon as the first units are released for occupancy.
John Wall and Associates 67
The Legacy at Durham Macon, Georgia PCN: 18-030
J. Interviews The following interviews were conducted regarding demand for the subject.
J.1 Apartment Managers Lisa, the apartment manager at Carriage Hills (Conventional), said the location of the subject’s site is not good because there are not enough people in the subject’s demographic in that part of town. She said the area is more suited for high end properties, and River Walk, the only LIHTC in the area, always has vacancies [ed: Part of the problem at Riverwalk is that all 152 units are three-bedroom]. Location aside, Lisa said the proposed rents are low, the proposed bedroom mix is good and all of the proposed amenities are nice. Overall, Lisa said the subject would not be successful in that locationKendall, a leasing agent at RiverStone (Conventional), said the
. location of the subject’s site is not good
because the subject’s demographic does not really live in that area. Location aside, she said the proposed rents, bedroom mix and amenities are all good. Overall, Kendall said the subject would be better suited for another location in townSonya, the apartment manager at River Walk (LIHTC), said her company will not allow her to comment on other LIHTC proposals in the market.
.
J.2 Economic Development In the past year, Macon Economic Development Commission has announced two companies that are opening and expanding in Macon-Bibb County, creating over 300 new jobs
Bo Gregory at the Development Authority of Monroe County said the plastics manufacturer, Encore, had an expansion, creating
. This includes Irving Consumer Products with 200 new jobs and Tyson Foods Distribution Center with more than 100 new jobs.
50 new jobs in Monroe County last year. He said there are more projects in the pipeline that should be decided in next few weeks. He noted that Monroe County is bisected by I-75, which allows residents to travel with great ease and short commute times. Mr. Gregory said Bibb and Peach Counties are seeing robust growth with Amazon and Sports Authority both building new and expanding
According to the 2017 and 2018 Georgia WARN lists, three companies in Macon-Bibb County have announced closures or layoffs in the last year, with
. He believes employees for these sites will probably represent a section of Monroe County residents that choose to commute from Monroe County, as their school system is ranked higher that many neighboring counties.
328 lost jobs
According to the 2017 and 2018 Georgia WARN lists,
. This includes J.C. Penney with 75 lost jobs, Bombardier Aircraft Services with 89 jobs lost, and HAECO with 164 jobs lost.
no companies in Monroe County have announced closures or layoffs in the last year.
John Wall and Associates 68
The Legacy at Durham Macon, Georgia PCN: 18-030
K. Conclusions and Recommendations The subject, as proposed, should be successful. See also Executive Summary.

John Wall and Associates 69
The Legacy at Durham Macon, Georgia PCN: 18-030
L. Signed Statement Requirements See signed statement in front matter.

John Wall and Associates 70
The Legacy at Durham Macon, Georgia PCN: 18-030
M. Market Study Representation DCA may rely on the representations made in the market study to be true and accurate to the best knowledge of John Wall and Associates. DCA may assign the market study to other lenders who are parties to the DCA loan transaction.

John Wall and Associates 71
The Legacy at Durham Macon, Georgia PCN: 18-030
N. Crime Appendix
Source: https://www.trulia.com/real_estate/Macon-Georgia/crime/#
John Wall and Associates 72
The Legacy at Durham Macon, Georgia PCN: 18-030
O. NCHMA Market Study Index/Checklist Members of the National Council of Housing Market Analysts provide the following checklist referencing various components necessary to conduct a comprehensive market study for rental housing. By completing the following checklist, the NCHMA Analyst certifies that he or she has performed all necessary work to support the conclusions included within the comprehensive market study. By completion of this checklist, the analyst asserts that he/she has completed all required items per section. Executive Summary 1. Executive Summary .......................................................... 8 Scope of Work 2. Scope of Work .................................................................... 6 Project Description 3. Unit mix including bedrooms, bathrooms, square
footage, rents, and income targeting ........................ 17 4. Utilities (and utility sources) included in rent ............ 18 5. Target market/population description ......................... 17 6. Project description including unit features and
community amenities................................................. 17 7. Date of construction/preliminary completion ............ 18 8. If rehabilitation, scope of work, existing rents, and
existing vacancies ..................................................... N/A Location 9. Concise description of the site and adjacent parcels .. 19 10. Site photos/maps ..................................................... 21, 24 11. Map of community services ......................................... 24 12. Site evaluation/neighborhood including visibility,
accessibility, and crime .............................................. 19 Market Area 13. PMA Description .......................................................... 31 14. PMA Map ....................................................................... 30 Employment and Economy 15. At-Place employment trends ....................................... 42 16. Employment by sector .................................................. 40 17. Unemployment rates .................................................... 42 18. Area major employers/employment centers and
proximity to site .......................................................... 42 19. Recent or planned employment
expansions/reductions ............................................... 67 Demographic Characteristics 20. Population and household estimates and
projections ....................................................... 32, 33, 34 21. Area building permits ................................................... 64 22. Population and household characteristics
including income, tenure, and size .............. 38, 34, 37 23. For senior or special needs projects, provide data
specific to target market .......................................... N/A
Competitive Environment 24. Comparable property profiles and photos ................. 57 25. Map of comparable properties ..................................... 59 26. Existing rental housing evaluation including
vacancy and rents ................................................. 57, 57 27. Comparison of subject property to comparable
properties ...................................................................... 57 28. Discussion of availability and cost of other
affordable housing options including homeownership, if applicable .................................... 57
29. Rental communities under construction, approved, or proposed .................................................................. 60
30. For senior or special needs populations, provide data specific to target market ................................. N/A
Affordability, Demand, and Penetration Rate Analysis
31. Estimate of demand ....................................................... 55 32. Affordability analysis with capture rate ............... 48, 56 33. Penetration rate analysis with capture rate ........ 16, 56 Analysis/Conclusions 34. Absorption rate and estimated stabilized
occupancy for subject ................................................. 66 35. Evaluation of proposed rent levels including
estimate of market/achievable rents. ................. 12, 61 36. Precise statement of key conclusions .......................... 13 37. Market strengths and weaknesses impacting
project ........................................................................... 13 38. Product recommendations and/or suggested
modifications to subject ............................................. 13 39. Discussion of subject property's impact on existing
housing .......................................................................... 64 40. Discussion of risks or other mitigating
circumstances impacting subject .............................. 13 41. Interviews with area housing stakeholders ................ 67 Other Requirements 42. Certifications ................................................................ 2, 3 43. Statement of qualifications ............................................. 2 44. Sources of data not otherwise identified ...................... 6

John Wall and Associates 73
The Legacy at Durham Macon, Georgia PCN: 18-030
P. Business References Ms. Laura Nicholson SC State Housing Finance & Development Authority Attn: Housing Development 300-C Outlet Pointe Boulevard Columbia, South Carolina 29210 803/896-9194 Mr. Jay Ronca Vantage Development 1544 S. Main Street Fyffe, Alabama 35971 256/417-4920 ext. 224 Mr. Scott Farmer North Carolina Housing Finance Agency 3508 Bush Street Raleigh, North Carolina 37609 919/877-5700

John Wall and Associates 74
The Legacy at Durham Macon, Georgia PCN: 18-030
Q. Résumés Bob Rogers Experience
Principal and Market Analyst John Wall and Associates, Seneca, South Carolina (2017 to Present) Responsibilities include: Business operations; development of housing demand methodology; development of computer systems and technologies; analysis of demographic trends; creation and production of analytic maps and graphics; and CRA compliance.
Senior Market Analyst John Wall and Associates, Anderson, South Carolina (1992 to 2017) Responsibilities included: Development of housing demand methodology; development of computer systems and technologies; analysis of demographic trends; creation and production of analytic maps and graphics; CRA compliance; courtroom presentation graphics.
Manager Institute for Electronic Data Analysis, Knoxville, Tennessee (1990 to 1992) Responsibilities included: Marketing, training new employees and users of US Bureau of the Census data products, and custom research.
Consultant Sea Ray Boats, Inc., Knoxville, Tennessee (1991) Project included: Using various statistical techniques to create customer profiles that the senior management team used to create a marketing strategy.
Consultant Central Transport, High Point, North Carolina (1990) Project included: Research and analysis in the area of driver retention and how to improve the company’s turnover ratio.
Professional Organization National Council of Housing Market Analysts (NCHMA) Executive Committee Member (2004-2010) Standards Committee Co-Chair (2006-2010) Standards Committee Vice Chair (2004-2006) Member delegate (2002-Present)
Publications Senior Housing Options, NCHMA White Paper (draft) Field Work for Market Studies, NCHMA White Paper, 2011 Ten Things Developers Should Know About Market Studies, Affordable Housing Finance Magazine, 2007 Selecting Comparable Properties (Best Practices), NCHMA publication 2006
Education Continuing Education, National Council of Housing Market Analysts (2002 to present) Multifamily Accelerated Processing (MAP) Certificate, HUD (May 2012) MBA Transportation and Logistics, The University of Tennessee, Knoxville, Tennessee (1991) BS Business Logistics, Penn State, University Park, Pennsylvania (1989)

John Wall and Associates 75
The Legacy at Durham Macon, Georgia PCN: 18-030
Joe Burriss Experience
Principal and Market Analyst John Wall & Associates, Seneca, South Carolina (2017 to present) Responsibilities include: Business operations; author of numerous apartment market studies; make, review and evaluate recommendations regarding student housing analysis; collect and analyze multifamily rental housing information (both field and census); conduct site and location analysis. Design marketing plans and strategies; client development.
Marketing Director John Wall & Associates, Anderson, South Carolina (2003 to 2017) Responsibilities included: Designing marketing plans and strategies; client development.
Senior Market Analyst and Researcher John Wall & Associates, Anderson, South Carolina (1999 to 2017) Responsibilities included: Author of numerous apartment market studies; making, reviewing and evaluating recommendations regarding student housing analysis; collecting and analyzing multifamily rental housing information (both field and census); conducting site and location analysis.
Professional Organization National Council of Housing Market Analysts (NCHMA) FHA Lender and Underwriting (MAP) Committee (2012-Present) Member Delegate (2002-Present)
Education Continuing Education, National Council of Housing Market Analysts (2002-Present) Multifamily Accelerated Processing (MAP) Certificate, HUD (May 2012) BS Marketing, Clemson University, Clemson, South Carolina (2002)