market analysis of opportunities for new zealand business ... · pdf filemarket analysis of...
TRANSCRIPT

July 2011
MARKET ANALYSIS OF OPPORTUNITIES FOR NEW ZEALAND BUSINESS IN PERU

2
Index 1. Macroeconomic Overview of the Peruvian Economy............................... 4
1.1 Gross Domestic Product ...................................................................... 4 1.2 Area and Population............................................................................. 5 1.3 Domestic Demand................................................................................ 7 1.4 Inflation ................................................................................................ 8 1.5 Fiscal Deficit......................................................................................... 8 1.6 Balance of Payments ........................................................................... 9 1.7 Exchange Rate .................................................................................... 9 1.8 Employment ....................................................................................... 10 1.9 Poverty............................................................................................... 11
2. Trade and Investment Overview in Peru................................................ 12 2.1 Exports............................................................................................... 12 2.2 Imports ............................................................................................... 13 2.3 Balance of Payments ......................................................................... 14 2.4 Free Trade Agreements ..................................................................... 15 2.5 Exports to New Zealand..................................................................... 16 2.6 Imports from New Zealand................................................................. 17 2.7 Trade Balance Peru – New Zealand .................................................. 18 2.8 Foreign Direct Investment by Country................................................ 19
3. Regulatory Environment Overview in Peru ............................................ 20 3.1 Key Regulatory Institutions ................................................................ 20 3.2 Labour Laws ...................................................................................... 21 3.3 Environment Laws.............................................................................. 22 3.4 Property rights.................................................................................... 22 3.5 Taxes ................................................................................................. 23 3.5.1 Direct Taxes.......................................................................................... 23 3.5.2 Excise Taxes ........................................................................................ 25 3.5.3 Municipal Taxes.................................................................................... 26 3.6 Tariffs and Duties ............................................................................... 26 3.6.1 Drawback Mechanism .......................................................................... 27 3.6.2 Free Trade Zones (Zofratacna and Zeedepuno)................................... 27 3.7 Import Barriers ........................................................................................ 29 3.7.1 Restricted Products .............................................................................. 29 3.7.2 Anti-Dumping Measures and Safeguards ............................................. 29 3.7.3 Sanitary and Phytosanitary Measures .................................................. 30 3.8 Custom Procedures (New Customs Law and VUCE) ............................. 30 3.8.1 Import Regulations................................................................................ 30 3.8.2 Export Regulation ................................................................................. 30 3.8.3 Custom Perfection ................................................................................ 31 3.8.4 Transit Regulations............................................................................... 31 3.8.5 General Customs Law .......................................................................... 32 3.8.6 VUCE.................................................................................................... 32 3.9 Government Procurement Procedures ................................................... 33
4. Doing Business in Peru ......................................................................... 35 4.1 How to Open a Business.................................................................... 35 4.2 Main Types of Companies Used by Foreign Investors....................... 35 4.3 Procedures to Set Up a Firm.............................................................. 37 4.4 Special Requirements and Permits by Type of Activity ...................... 38

3
4.5 Ease of Doing Business ..................................................................... 39 5. Key Sectors of the Peruvian Economy of Interest to New Zealand ....... 42
5.1 Agriculture.......................................................................................... 42 5.1.1 General Evolution ........................................................................... 42 5.1.2 Main Products and Exports ............................................................ 43 5.1.3 Regulatory Environment ................................................................. 46 5.1.4 Main Companies and Projects / Opportunities ............................... 46 5.1.5 Main Regulatory or Market Barriers................................................ 48 5.1.6 Prospects ....................................................................................... 49 5.2 Fisheries ............................................................................................ 49 5.2.1 General Evolution ........................................................................... 49 5.2.2 Main Products and Exports ............................................................ 51 5.2.3 Regulatory Environment ................................................................. 52 5.2.4 Perspectives, Advantages and Opportunities................................. 53 5.3 Tourism................................................................................................... 54 5.3.1 General Evolution and Current Situation .............................................. 54 5.3.2 Touristic Profile ..................................................................................... 57 5.3.3 Main Attractions and Opportunities....................................................... 60 5.4 Education and Training ........................................................................... 62 5.4.1 General Evolution ................................................................................. 62 5.4.2 Regulatory Environment and Incentives ............................................... 69 5.4.3 Main Companies and Projects/Opportunities........................................ 70 5.5 Mining ..................................................................................................... 71 5.5.1 General Evolution and Current Situation ........................................ 71 5.5.2 Main Products and exports............................................................. 72 5.5.4 Main companies and projects and opportunities ............................ 76 5.6 Energy................................................................................................ 79 5.6.1 General evolution ........................................................................... 80 5.6.2 Hydrocarbons ................................................................................. 81 5.6.3 Electricity ........................................................................................ 83
6. SWOT Analysis: New Zealand-Peru...................................................... 87 7. Index analysis of competitive and complementary industries ................ 89
7.1 Main indexes...................................................................................... 89 7.1.1 Revealed Comparative Advantages (RCA) .................................... 89 7.1.2 Relative Purchase Capacity (RPC)................................................. 89 7.1.3 Relative Importance of Exports (RIX) ............................................. 90 7.1.4 Relative Importance of Imports (RIM)............................................. 90 7.1.5 Trade Specific Coefficient (TSC) .................................................... 90 7.2 Analysis of RCA and RPC.................................................................. 91 7.3 Analysis of RIX and RIM .................................................................... 92 7.4 Analysis of TSC ................................................................................. 93 7.5 New Zealand Exports Supply to Peru ................................................ 94 7.6 New Zealand Imports from Peru ........................................................ 95
8. Conclusions: Investment Opportunities for New Zealand in Peru.......... 97 9. Bibliography........................................................................................... 99 10. Appendix.............................................................................................. 101

4
1. Macroeconomic Overview of the Peruvian Economy Peru is internationally recognized as a mega-diverse country due to its geographical characteristics, natural resources, weather conditions and cultural roots. Peru has abundant natural resources in the highlands (rich deposits of minerals such as copper, silver, gold, lead, zinc, among others), forest (abundant and unexploited forestry resources and hydrocarbons such as natural gas and petroleum) and seacoast (abundant fishery resources and hydrocarbons). Over the last years, Peru has experienced a remarkable economic and social performance. More importantly, beyond macroeconomic indicators, economic growth has improved the quality of life and opportunities for Peruvians. In recent years there has been a major transformation and growth of private consumption and domestic trade, not only in Lima but also in several cities around the country. A clear example is the construction of shopping centers in cities such as Piura, Trujillo, Chiclayo, Ica, Arequipa, Puno, Huancayo, Cajamarca, among others. The economy is growing at a fast pace, only comparable to other emerging economies such as China and India, but with one big difference from previous Peruvian economic booms: this growth is sustainable and based on solid macroeconomic fundamentals.
1.1 Gross Domestic Product Comparing 2010 with 2005 figures, the Gross Domestic Product (GDP) and the GDP per capita almost doubled, reaching US$ 154 billion and US$ 5,195, respectively (see Graph 1). GDP per capita grew at its fastest average annual rate since the fifties, with an increase of over 82% between 2005 and 2010.
Graph 1. Peruvian Real and Per Capita GDP(2000-2012, current prices)
53 54 57 6170
7992
107
127 127
154162
173
0
20
40
60
80
100
120
140
160
180
200
2000 2001 2002 2003 2004 2005 2006 2007 2008 2009 2010E 2011E 2012E0
1
2
3
4
5
6
Th
ou
shan
ds
of
US
$
GDP, in billions of US$
GDP per capita, in thousands of US$
Bil
lio
ns
of
US
$
Source: IMF.
During the period 2006-2010, GDP grew at an average annual rate of 7.2%, the highest since 1961-1965, despite the fact that the economy went through the worst international crisis since World War II (see Graph 2).

5
4.0%
5.0%
6.8%
7.7%
8.9%
9.8%
0.9%
8.8%
6.5%
0%
2%
4%
6%
8%
10%
12%
2003 2004 2005 2006 2007 2008 2009 2010E 2011E
Source: BCRP.
Graph 2. Peruvian Gross Domestic Product(YoY % change)
Average2003-2009: 6.2%
This growth was driven by improvements in productivity and a strong growth of private investment. The country’s impressive 9.8% growth rate obtained in 2008 elevates it among the fastest-growing economies in the world. The trend has been driven by rising international commodity prices for minerals and metals, investor-friendly market policies and aggressive trade liberalization strategies. Although the rate fell to 0.9% in 2009 due to global crisis, Peru’s economic growth returned to its trend in 2010. The Peruvian economy heavily relies on extractives industries such as mining, hydrocarbons and fishing. In spite of this, manufactures have been gaining more importance in the last years (see Table 1). In 2010, manufactures made up 15% of the total GDP, and have been growing steadily since the mid 90s. Local textile industry and clothing production stand out in this area, as well as the agricultural and fish processed products. These industries are gaining strength within the local production, mainly to be exported.
2005 2006 2007 2008 2009 2010
Agricultural 5.10% 5.53% 5.64% 6.05% 6.11% 4.50%Livestock 2.47% 2.67% 2.81% 2.98% 3.11% 2.30%Fishing 0.54% 0.55% 0.59% 0.63% 0.58% 0.34%Metalic mining 5.59% 5.65% 5.75% 6.16% 6.08% 4.09%Hydrocarbons 0.51% 0.54% 0.58% 0.64% 0.74% 0.68%Manufactures 15.40% 16.55% 18.39% 20.05% 18.62% 14.96%Construction 4.89% 5.62% 6.55% 7.63% 8.10% 6.73%Commerce 14.01% 15.64% 17.15% 19.38% 19.30% 14.98%Water and electricity 2.08% 2.23% 2.41% 2.60% 2.63% 2.00%Other services 38.37% 41.04% 56.16% 61.27% 63.17% 48.27%
Table 1. GDP by productive sector (% of participation)
Source: BCRP.
1.2 Area and Population Located on the west central coast of South America, Peru is the third largest country in the region, after Brazil and Argentina. It has a total land area of 1,285,215.60 km 2 of coast, highlands (“sierra”) and Amazon jungle (“selva”).

6
Source: University of Texas – Perry Castañeda Library Map Collection

7
Peru has 29.4 million habitants, with 75.9% of urban population and 24.1% of rural population. Almost 9.1 million people live in its capital city Lima (about 30% of total) and most of the population is between 15 and 64 years (see Table 2).
Years %
0 - 14 29.115 - 64 65.265 and over 5.7
Table 2. PeruvianAge Structure
Source: INEI. The birth rate is 20.3 and the mortality rate is 5.5 for every thousand people, whereas the life expectancy is 73.7 years and the infant mortality is estimated at 19.5 babies per thousand live births. In regard to the educational attendance, 94% of the total population between 6 and 11 years attend primary education, while 77.6% attend secondary school. Finally, the average amount of educational attainment for people aged 15 years and more is 9.7 years; 10.5 years for the urban population and 7 years for the rural population.
1.3 Domestic Demand In the last five years the expansion of domestic demand (8.8% on average) was higher than the expansion of GDP as a whole (7.2%). Due to the financial crisis, in 2009 it experienced a contraction (see Graph 3) but the recovery started quickly, in the third trimester that year. Because of strong growth in terms of trade, the dynamism of domestic demand and business confidence, private investment grew at an average rate of 15% during the period 2006-2010, the biggest increase since the five-year average 1991-1995. Thus it contributed to an increase in GDP growth from 0.6 percentage points on average (2001-2005) to 2.6 percentage points in the last five years. On the supply side, non-primary sectors such as construction, primary manufacturing and trade led growth.
Graph 3. Peruvian Domestic Demand and Private Investment
(Annual variation in %)
5.8
10.311.9 12.1 12.6
7.6
20.1
25.822.4
14.5
-2.9 -15.1
12.0
23.4
2005 2006 2007 2008 2009 2010E 2011E
Domestic demand Private Investment
Source: BCRP.

8
1.4 Inflation The annual inflation average between 2006 and 2010 was 2.8%, the lowest among Latin American countries. Up to November 2010 the inflation rate of the last 12 months was 2.2%, slightly above the inflation target (2.0%) established by the Central Bank. The inflation rate maintained an upward trend between October 2009 and September 2010, mainly associated with supply factors (increases in prices of some food and fuel). However, during the last months, it fell below the peak reached in September (2.4%), because of the reversal of the shocks in the food supply.
Graph 4. Peruvian Devaluation and Inflation(1999-2010*)
11.1
-6.5-7.0
3.7 3.7
-0.1
1.5
2.53.5
4.5
1.13.9
6.7
2.5
0.3
3.10.5
0.3
2.9
-4.4-3.4
-0.7-1.1-1.9
-8
-6
-4
-2
0
2
4
6
8
10
12
14
1999 2000 2001 2002 2003 2004 2005 2006 2007 2008 2009 2010*
Inflation Devaluation
* Estimate.Source: BCRP.
%
Projections indicate that inflation will stay within the target range, based on the balanced projection of the output gap, as well as inflationary expectations that remain anchored to the target range, a gradual reversal in monetary stimulus, an easing of fiscal stimulus and the reversal of supply shocks that affected the prices of imported products in 2010.
1.5 Fiscal Deficit Because of the dynamism in economic activity and the moderated growth of public expenditure, the fiscal deficit for 2010 was equivalent to 0.9% of GDP. It is expected that there will be a neutral fiscal result in 2011 and a surplus of 0.5% of GDP in 2012 (see Graph 5).

9
Graph 5. Peruvian Fiscal Balance(% of GDP)
-1.7
-1.0
-0.3
2.1
3.1
2.1
-0.9 -0.8
0.4
-2.3-2.5
2001
2002
2003
2004
2005
2006
2007
2008
2009
2010
E
2011
E
Source: BCRP.
Since 1970 there have been fiscal surpluses in only four years, three of which were obtained in the last 5 years. The Treasury went from a slight deficit in 2005 to record three straight years of fiscal surpluses (2006-2008), then it reported fiscal deficit in years 2009-2010 as a result of the implementation of the Economic Stimulus Plan (ESP) to mitigate the effects of the international crisis. Due to the savings generated between 2006 and 2008, the government was able to apply countercyclical fiscal policy and finance the ESP (equivalent to 3.4% of GDP) without compromising fiscal sustainability. In this way, the crisis has not permanently damaged the Peruvian economy: businesses remained strong, and there was no welfare loss in the population.
1.6 Balance of Payments With the increase in domestic demand and its effect on the volume of imports, projections indicate that the current account deficit will increase from 1.8% of GDP in 2010 to 3.1 and 3.2 percent of GDP in 2011 and 2012, respectively. Notably, the inflows of long-term foreign capital more than offset the current account deficit.
2009 2010* 2011* 2012*
Current Account Balance 247 -2,738 -5,314 -5,955Financial Account 1,694 13,188 6,814 6,955Balance of Payments Result 1,940 10,450 1,500 1,000
Table 3. Balance of Payments (Millions of US$)
* Projected.Source: BCRP.
1.7 Exchange Rate
The Peruvian Central Bank has taken preventive measures to safeguard financial stability and the transmission mechanisms of monetary policy. Thus, exchange intervention is used in order to reduce excessive volatility in the exchange rate and accumulate international reserves, which develops strengths in the face of negative events in an economy with a high percentage of financial dollarization.

10
2.6
2.8
3
3.2
3.4
3.6
3.8
2000 2001 2002 2003 2005 2006 2007 2008 2010
Graph 6. Peruvian Nominal Exchange Rate Evolution,2000-2010
(Millions of US$)
Source: BCRP.
1.8 Employment The economic growth of recent years resulted in the generation of employment not only in Lima, the capital of Peru, but also in other cities and rural areas.
Graph 7. Peruvian Urban Formal Employment Evolution, 2003-2010
(% var.)
1.70
2.75
4.49
7.25
8.27 8.30
1.30
3.70
0
2
4
6
8
10
2003 2004 2005 2006 2007 2008 2009 2010
Source: INEI.
At a national level, about 2 million new jobs were created during the last five years. Employment in companies with 10 or more workers increased 24.5% in the same period, for example, in Huancayo (+43.6%), Puno (+40.3%) and Piura (+38%). On the other hand, employment in Metropolitan Lima exceeded 50% of the total workforce for the first time. The average monthly income in Lima increased 18.1% between 2005 and 2009, while the national average income increased 36.7% in the same period.

11
1.9 Poverty The country’s dynamic expansion has helped to reduce the national poverty rate by almost 15% in the last years to about 34.8% of population in 2009. The poorest regions are Huancavelica, Apurimac and Huánuco, where the incidence of poverty in 2009 was 77.2%, 70.3% and 64.5%, respectively.
0
10
20
30
40
50
60
70
80
Mad
re d
e D
ios
Ica
Lim
a
Tac
na
Moq
uegu
a
Are
quip
a
Tum
bes
Uca
yali
Ánc
ash
Lam
baye
que
Jun
ín
Tot
al
La
Libe
rtad
Piu
ra
San
Mar
tín
Cus
co
Pas
co
Caj
amar
ca
Lor
eto
Am
azon
as
Pun
o
Aya
cuch
o
Huá
nuco
Apu
rím
ac
Hua
ncav
elic
a
Graph 8. Incidence of Poverty by Peruvian Region(%)
Source: INEI.

12
2. Trade and Investment Overview in Peru
2.1 Exports Peruvian exports have experienced a remarkable performance over the last 10 years. In 2010, exports nearly reached a record value of US$ 35 billion, twice what was achieved in 2005 and five times higher than at the beginning of the decade. Similarly, exports per capita reached US$ 1,182 in 2010, two times higher than in 2005.
Graph 9. Peruvian Exports, 2001-2010(Millions of US$)
-
5,000
10,000
15,000
20,000
25,000
30,000
35,000
40,000
2001 2002 2003 2004 2005 2006 2007 2008 2009 2010
Source: SUNAT.
During the last ten years, the increase in exports was driven by higher export prices, especially in mineral and agricultural commodities, and increases in export volumes in general (see Table 4). The higher volume of exports in every sector was the result of several years of private investment.
% change
2001 2005 2010 2010/2001TOTAL 6,956 17,301 34,775 400 BASIC 4,758 13,016 26,872 465 Mining 3,205 9,793 21,017 556 Fisheries 926 1,304 1,882 103 Oil and Fuels 422 1,593 3,012 613 Agriculture 204 326 961 371 NON TRADITIONAL 2,198 4,285 7,903 260 Agriculture 437 1,007 2,172 397 Textile 665 1,276 1,558 134 Fisheries 207 331 647 212 Chemical 246 532 1,497 508 Metal-mechanical 160 191 392 145 Iron and Steel 190 383 845 346 Non-metallic mining 58 118 250 332 Craftsmanship 2 1 1 (66) Wood and Paper 142 260 351 148 Skin and Leather 16 29 33 102 Other 75 155 158 111
Millions of US$
Source: Sunat.
Table 4. Peruvian Exports, by Sector (2001, 2005 and 2010)
It is important to emphasize the evolution of non-traditional or manufactured exports. They reached a value of US$ 7,212 million this 2010, 260% more than in 2001. This increase was based on the most dynamic non traditional agriculture sector (+397%), chemical (+508%), iron and steel (+346%), and fisheries (+212%).
13
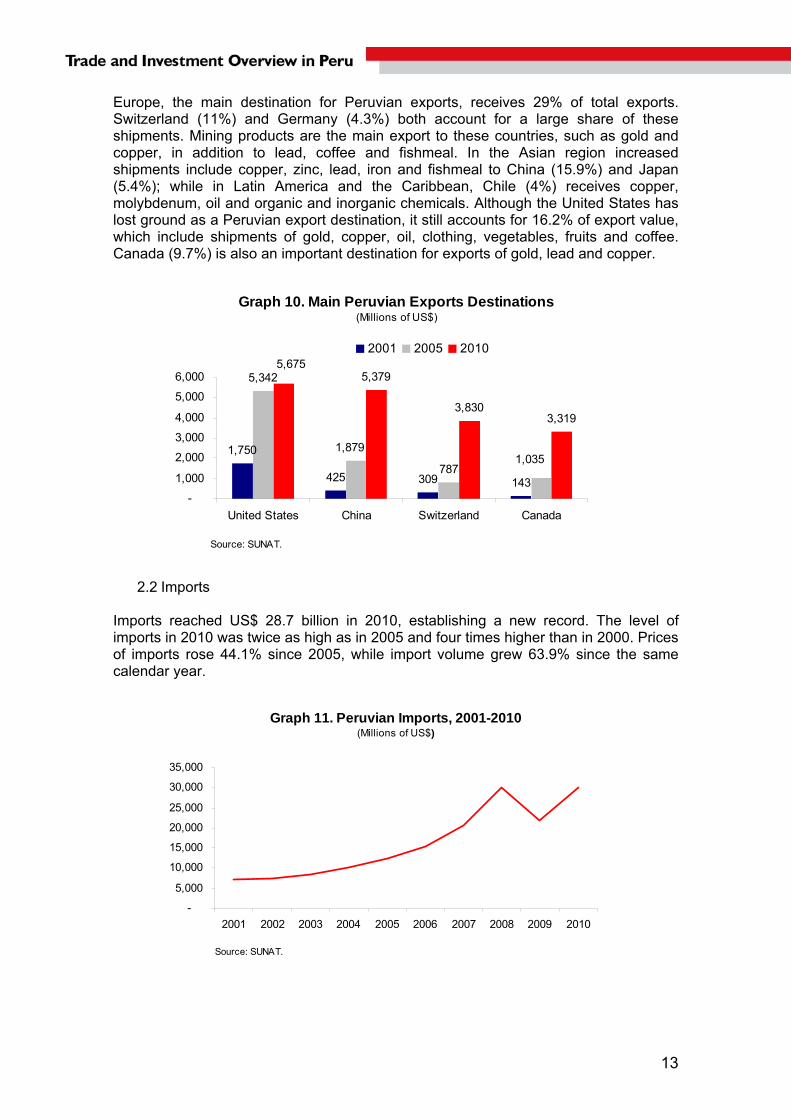
Europe, the main destination for Peruvian exports, receives 29% of total exports. Switzerland (11%) and Germany (4.3%) both account for a large share of these shipments. Mining products are the main export to these countries, such as gold and copper, in addition to lead, coffee and fishmeal. In the Asian region increased shipments include copper, zinc, lead, iron and fishmeal to China (15.9%) and Japan (5.4%); while in Latin America and the Caribbean, Chile (4%) receives copper, molybdenum, oil and organic and inorganic chemicals. Although the United States has lost ground as a Peruvian export destination, it still accounts for 16.2% of export value, which include shipments of gold, copper, oil, clothing, vegetables, fruits and coffee. Canada (9.7%) is also an important destination for exports of gold, lead and copper.
Graph 10. Main Peruvian Exports Destinations(Millions of US$)
1,750
425 309 143
5,342
787
5,379
3,8303,319
1,0351,879
5,675
-
1,000
2,000
3,000
4,000
5,000
6,000
United States China Switzerland Canada
2001 2005 2010
Source: SUNAT.
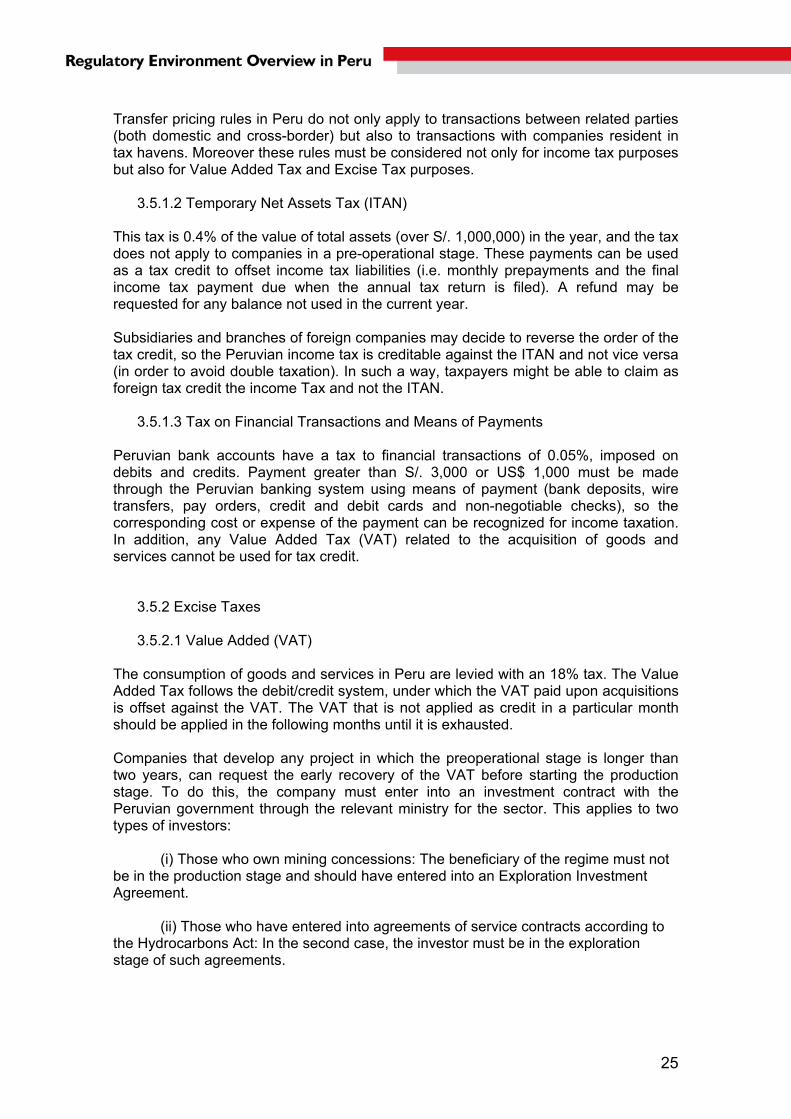
2.2 Imports
Imports reached US$ 28.7 billion in 2010, establishing a new record. The level of imports in 2010 was twice as high as in 2005 and four times higher than in 2000. Prices of imports rose 44.1% since 2005, while import volume grew 63.9% since the same calendar year.
Graph 11. Peruvian Imports, 2001-2010(Millions of US$)
-
5,000
10,000
15,000
20,000
25,000
30,000
35,000
2001 2002 2003 2004 2005 2006 2007 2008 2009 2010
Source: SUNAT.

14
% change
2001 2005 2010 2010/2001TOTAL 7,344 12,536 30,131 310 Consumption Goods 1,662 2,356 5,740 245 Durables 652 973 2,808 331 Non-Durables 1,010 1,383 2,932 190 Intermediate goods 3,634 6,904 14,376 296 Fuels and oils 977 2,461 4,217 331 Raw Material for Agriculture 261 443 950 264 Raw Material for Industry 2,395 4,000 9,208 284 Capital Goods 2,041 3,265 10,002 390 For Transport 401 668 2,543 535 Construction Material 196 347 1,238 531 For Agriculture 26 41 105 303 For Industry 1,418 2,209 6,116 331 Other 8 10 13 68
Source: SUNAT.
Millions of US$Table 5. Peruvian Imports by Type of Good (2001, 2005 and 2010)
In 2010, the countries Peru imported the most from were United States (17%) and China (12%), followed by Brazil (7%) and Ecuador (5%). The main products Peru imported included oil and derivates, vehicles, corn and cellular phones, amongst other mainly manufactured products.
2.3 Balance of Payments Between 2007 and 2010 there was a substantial improvement in the balance of payments. Progress in our external position can be seen in our improved deficit in the current account balance, which averaged 0.2% of GDP, the lowest deficit since records began. This favourable outcome is mainly explained by the large surplus in the trade balance and higher remittances from abroad.
Graph 12. Peruvian Current Account, 2001-2010(Millions of US$)
-6000
-4000
-2000
0
2000
4000
2001 2002 2003 2004 2005 2006 2007 2008 2009 2010
Source: BCRP
The financial account recorded net capital inflows for 4.1% of GDP during the last five years in average, mainly due to the surplus of the financial private sector which averaged 5.5% of GDP.

15
Graph 13. Peruvian Trade Balance, 2001-2010 (Millions of US$)
-2000
0
2000
4000
6000
8000
10000
2001 2002 2003 2004 2005 2006 2007 2008 2009 2010
Source: BCRP
Due to the net capital inflows, international reserves went from US$ 14.4 billions in July 2006 to US$ 44.1 billions, reinforcing the international liquidity position of the Peruvian economy.
Graph 14. Peruvian International Net Reserves, 2001-2010(Millions of US$)
0
10,000
20,000
30,000
40,000
50,000
60,000
2001 2002 2003 2004 2005 2006 2007 2008 2009 2010
Source: BCRP
2.4 Free Trade Agreements The greater opening and consolidation of export markets through trade agreements was an important factor contributing to the good performance of exports. Between 2006 and 2010 the following trade agreements have been signed: Trade Promotion Agreement with the United States of America, Free Trade Agreement with China, Canada and Singapore, and the Economic Complementation Agreement with Chile. The latter along with those who were already in force (Andean Community, MERCOSUR and ACE with Mexico) have allowed our exports to access these countries with preferential tariffs. It should be noted that the agreements with the European Free Trade Association (EFTA), Thailand, European Union, Japan and South Korea, although they have been already completed, are still being revised and / or are in legal implementation. These agreements will cover more than 90% of Peru’s international trade by July 28th 2011, and help to ensure that about 85% of Peru’s export access free of tariffs.

16
2.5 Exports to New Zealand Peruvian exports to New Zealand have increased dramatically during the last 10 years. They reported a 577% increase, to US$ 13 million. This value is more than two times higher than its value in 2005 and more than 5 times higher than its value in 2001.
Graph 15. Exports from Peru to New Zealand,2001-2010
(Millions of US$)
-
2
4
6
8
10
12
14
16
2001 2002 2003 2004 2005 2006 2007 2008 2009 2010
Source: SUNAT

17
The increase in exports was explained by the growth of non-traditional or manufactured exports, which increased by 790% over the last 10 years, reaching in 2010 a total value of around US$ 12 million. The most dynamic sector is non-metallic mining, with a 36,764% growth over the last 10 years, due to the exports of natural calcium phosphates and natural bromides. The agricultural sector showed great progress as well, with a 1,499% increase since 2001. The main products contributing to this increase are mangos, asparagus and fresh grapes.
% change
2001 2005 2010 2010/2001TOTAL 1,979,140 5,640,271 13,389,216 577
BASIC 675,573 930,984 1,784,616 164
Mining - - - -
Refined Copper - - - -
Minor Metals - - - -
Fisheries 675,573 930,984 1,306,440 93
Fish oil - - 898,495 -
Fish flour 675,573 930,984 407,945 (40)
Agriculture - - 478,175 -
Coffee - - 478,175 -
NON TRADICIONAL 1,303,567 4,709,287 11,604,601 790
Agriculture 145,203 678,380 2,322,414 1,499
Textile 162,881 208,783 530,139 225
Fisheries 206,005 75,711 708,982 244
Chemical 78,361 82,169 239,173 205
Metal-mechanical 19,709 17,500 4,573 (77)
Iron and Steel - 169,179 460,670 -
Non-metallic mining 6,456 407,295 2,379,945 36,764
Craftsmanship - 188,195 - -
Wood and Paper 35,264 747,951 303,574 761
Skin and Leather 644,854 2,121,151 4,598,519 613
Other 4,834 12,973 56,611 1,071
Source: SUNAT.
US$Table 6. Peruvian Exports to New Zealand (2001, 2005 and 2010)
On the basic exports side, fisheries stand out with a 33% increase since 2001, with a total value of US$ 1.3 million. As we can see in Table 6, our non traditional exports exceed the basic exports by far.
2.6 Imports from New Zealand Imports from New Zealand have evolved irregularly during the last 10 years, but increased significantly in 2010. Imports reported a 63% increase since 2001, for a total of US$ 56 million in 2010. However, imports increased 138% from 2009 to 2010, a greater rate of growth compared to the previous years in analysis. This growth was caused by a 149% increase of the imports of non-durable consumption goods. For example, imports of concentrated milk with sugar in powder increased in 171%, while concentrated milk without sugar in powder increased its import in 235%.

18
Graph 16. Imports from New Zealand to Peru,2001-2010
(Millions of US$)
-
10
20
30
40
50
60
2001 2002 2003 2004 2005 2006 2007 2008 2009 2010
Source: SUNAT.
Imports from New Zealand are mainly consumption goods, adding up US$ 50 million in 2010. However, the most dynamic type of products was the intermediate goods with a 396% increase since 2001. Raw materials for agriculture fuelled this growth, with an 808% increase. The main products brought into Peru are milk and its derivates, milk fat, and buttermilk.
% change
2001 2005 2010 2010/2001TOTAL 34,735,535 17,718,363 56,473,452 63 Consumption Goods 33,253,931 15,459,078 50,366,139 51 Durables 40,145 333,724 50,915 27 Non-Durables 33,213,787 15,125,354 50,315,224 51 Intermediate Goods 658,026 805,513 3,260,644 396 Fuels and oils - - - -Raw Material for Agriculture 160,806 299,769 1,459,543 808 Raw Material for Industry 497,220 505,744 1,801,101 262 Capital Goods 823,577 1,453,772 2,846,461 246 For Transport - 31,854 23,677 -Construction Material 49,995 76,516 53,061 6 For Agriculture 1,351 235,860 11,125 723 For Industry 772,230 1,109,542 2,758,598 257 Other - - 209 -
Source: SUNAT.
US$Table 7. Peruvian Imports from New Zealand (2001, 2005 and 2010)
2.7 Trade Balance Peru – New Zealand The trade balance has stayed negative for Peru throughout the last 10 years. There is no indication that this would change in the following years.

19
Graph 17. Trade Balance Peru - New Zealand, 2001-2010 (Millions of US$)
(50.00)
(45.00)
(40.00)
(35.00)
(30.00)
(25.00)
(20.00)
(15.00)
(10.00)
(5.00)
-
2001 2002 2003 2004 2005 2006 2007 2008 2009 2010
Source: SUNAT.
2.8 Foreign Direct Investment by Country This year it is expected that Peru will have greater direct foreign investment flows, around US$ 28.1 billion. This amount represents 4.7% of GDP, three times greater than what was invested during the last five years. Furthermore, it would be the largest increase in foreign direct investment since records began. Up to 2009, the country that has the biggest foreign direct investment stock in Peru was Spain, with US$ 4.44 billion, followed by the United States with US$ 2.48 billion. Other relevant investors are South Africa, Chile, Switzerland, United Kingdom, Mexico, Canada, among others. New Zealand invested US$ 6.85 million in Peru up to 2009, which is small relative to other main investors.
Graph 18. Stock of Foreign Direct Investment by Country in 2009(Billions of US$)
4.44022.2925
2.48181.8051
1.56640.93190.90630.8681
0.72640.68240.6807
0.44290.4366
0.3170.2617
SpainOther
USAS.Africa
ChileSwitz.
UKMexico
CanadaItaly
BrazilJapan
NorwayFrance
China
Source: ProInversion

20
3. Regulatory Environment Overview in Peru In 2009, the Peruvian legal and regulatory framework was the best among Latin American and Caribbean countries in terms of contributing to a good environment for the development of public-private partnerships, according to the five criteria identified by the The Economist Intelligence Unit.
3.1 Key Regulatory Institutions
Economic Operations Committee of the National Interconnected System (COES-SICN)
The technical entity composed of the directors of generation systems and electric transmission connected to the National System. Its objective is to operate at minimum cost, guaranteeing security and quality of supply. http://www.coes.org.pe
National Supervisory Commission of Companies and Securities (CONASEV)
Promotes securities market, protects management of companies participating in the financial market and regulates their accounts. http://www.conasev.gob.pe/
National Superintendence of Sanitation Services (SUNASS) It regulates the tariffs of the services of cleaning; it dictates norms applicable to interests, obligations or rights of the Lending Companies or their users. http://www.sunass.gob.pe
National Institute of Defense of the Competition and Protection of the Intellectual Property (INDECOPI)
It promotes a culture of fair competition, protects the market from monopolies and unfair competition practices and guards the quality of products. In addition, it protects intellectual property rights in all their manifestations. http://www.indecopi.gob.pe
Superintendence of Banks and Insurance (SBS) It controls and supervises the Pension Funds Administrators and the companies that make up the financial system. It defends the interests of the public, preventing the erosion of the economic and financial solidity. http://www.sbs.gob.pe/
Supervisor of Private Investment in Public Transportation Infrastructure (OSITRAN)
It regulates the markets of the infrastructure of public transportation. It supervises the fulfilment of concession contracts to private investment. http://www.ositran.gob.pe/
Supervisor of Private Investment in Communications (OSIPTEL) It regulates public services in telecommunications in order to increase competition. It promotes universal access to telecommunications. http://www.osiptel.gob.pe

21
Supervisor of the private investment in mining and energy (OSINERGMIN) It regulates to ensure that electricity and hydrocarbons providers offer their services in suitable conditions of quality, security, opportunity and price. It verifies the fulfilment of technical and legal obligations. http://www.osinerg.gob.pe
3.2 Labour Laws The labour contractor must take into account that the minimum living wage is around US$ 200 per month. There are other benefits, deductible for income tax purposes that the worker receives annually, such as the following:
30 days of vacation per year.
Two complete salaries (as rewards, one in July, because of the National Independence Day, and the other one in December for Christmas holidays).
One additional wage as a compensation for the length of his service or severance indemnity, which should be deposited in advance with a bank elected by the employee. Deposits are regarded as final payments of the accrued liability.
Family allowance equivalent to US$ 19 (approximately) per month.
Utilities between 5% and 10% of the net income, depending on the activities carried.
The working day is about 8 hours or 48 hours per week, for workers over 18 years. Overtime work is paid as a fee and its value must be agreed by the two parties. Contracts can be signed for an undetermined period of time or under fixed terms and conditions, which are expressly foreseen by law and are basically allowed for cases such as business expansion, production increments, temporary work, extraordinary circumstances and seasonal activities. The Peruvian Constitution establishes that employees are protected against arbitrary dismissal through a ‘job stability’ right, which consists in permanent employment for a person who has worked for the same employer for more than four hours per day, after a three month trial period. After that, employees can only be dismissed under certified circumstances concerned with their behaviour at work or ability to carry out their duties. If there is an unjustified dismissal, employees may demand a severance payment equivalent to one and a half months salary per year of service (under a non term working agreement); and, one months salary per pending month (under a fixed term working agreement). The maximum severance payment is twelve months salary. Alternatively, employees can demand reinstatement to their previous job. The law allows collective dismissals under certain circumstances such as acts of force majeure, financial or technical streamlining, dissolution, bankruptcy or operating downsizing without having to grant severance payments. Foreign workers in companies established in Peru can represent up to 20% of the total number of workers, and their remuneration may not exceed 30% of the total payroll of the company. Also foreign workers' contracts should be concluded in a specified period of time, for a maximum of 3 years and with the renewable option.

22
3.3 Environment Laws Environmental regulation in Peru is under the Ministry of Environment. According to Article Nº6 in the Act of Creation, Organization and Functions, Legislative Decree Nº1013, it ensures compliance with environmental standards, arranging and coordinating with the three levels government, business, academia and civil society. Given the context of increasing trade and trade liberalization, the Peruvian government decided to focus on a specific law for environmental protection: the General Environmental Law (see the comprehensive legislation on the following link). The government, through the Ministry of Environment, has established the promotion of eco-efficient businesses as a state policy, to generate new investment and jobs that are ecologically sustainable. Eco-efficiency is a business opportunity to promote investment, create jobs, open new market niches and assume corporate responsibility towards the environment and society. The Ministry of Environment is working in four lines of action in terms of eco-efficiency:
Eco-efficient Public Institutions. Eco-efficient Municipalities. Eco-efficient Enterprises. Eco-efficient Schools.
3.4 Property rights Peru recognizes that intellectual property is a very important element in development politics and in asset generation, for national and foreign enterprises. Thus, the government tries to generate proper legal conditions that defend intellectual property in order to promote investment. Peru has joined to most of the multilateral agreements which protect intellectual property rights, inside regulations of the World Trade Organization (WTO) and the World Intellectual Property Organization (WIPO), in order to establish a proper legal framework which generates stability and predictability for investors. This has allowed to standardized aspects and procedures about brands, patents, and copyright, among other. Peru, as a member of the Andean Community, also has legislation in this area. For further information, visti the Andean Community website: http://www.comunidadandina.org/ingles/intellectual_property.htm Peru has an autonomous legal framework, technically solid and efficient. The National Competition and Property Rights Defense Institution (INDECOPI) is the responsible entity for this issues, and counts with technical autonomy from the Government. This entity has been serious, modern, and professional since its foundation. It establishes two stages in order to solve cases. The first stage solves cases which imply infractions in the registry of intellectual property rights, and the observation of these rights. The second stage revises the decisions and resolutions given in the first stage. This provides plurality in the decisions taken. It is important to notice that INDECOPI’s authority has almost jurisdictional faculties in order to apply the regulation previously described, which gives speed and effectiveness to its decisions. Administrative authorities (INDECOPI, SUNAT) and jurisdictional authorities (Public Ministry, Judicial System) work in complete coordination, so they can optimize the use of resources by the State, and guarantee the effectiveness of the measures taken.

23
3.5 Taxes Taxes in Peru are divided according to their nature, as follows:
Direct taxes Excise taxes Municipal taxes
Income Tax Value Added Tax Real Estate Tax
Temporary Net Assets Tax
Selective Consumption Tax
Real Estate Transfer Tax
Tax on Financial Transactions
- Vehicle Property Tax
Source: SUNAT.
Table 8. Taxes According to Nature
3.5.1 Direct Taxes 3.5.1.1 Income Tax
Income Tax is an annual tribute applied to the income earned by taxpayers residing in the country regardless their nationality (as natural persons), the place of incorporation of companies or the location of its source. It is also levied on taxpayers not resident in the country, only from their income from Peruvian sources. After residing in Peru for a period longer than 183 days within any twelve-month period, foreign nationals will be considered residents and therefore taxed on a worldwide income basis. The residence status must be verified at the beginning of the tax year and subsequent changes will affect the residence status as from the following year. For tax purposes, different income types are classified in the following categories:
1. First: Income earned from leasing, subleasing and assignment of assets.
2. Second: Capital income (not included in other categories).
3. Third: Income from trade, industry and other activities explicitly considered by the law.
4. Fourth: Income from independent work.
5. Fifth: Income from dependent employment and from other independent activities expressly specified by law.
The income tax payable by natural persons (domiciled citizens) is determined by their net income on labour and foreign source income, which does not include dividends or other income earned under other forms of distribution of profits (see Table 9).

24
Scale Accumulated progressive rate
Up to 27 tax units (tax unit is currently equivalent to S/. 3,600)
15.00%
In excess of 27 and up to 54 tax units
21.00%
Any excess 30.00%
Source: SUNAT.
Table 9. Income Tax Rates for Individuals
No deductions are allowed in arriving at the taxable income for salaries, wages and other remuneration derived from independent and dependent personal services with the exception of a deduction equivalent to 7 tax units (currently S/. 25,200 to December 2010). Since the beginning of 2009, income obtained by domiciled individuals from the lease, sublease, assignment of goods (first Bracket income), and other capital income deriving from trading of securities (shares, bonds, etc.) and movable property (second bracket) are levied at a rate of 5% and 6.25% respectively. Corporations non-domiciled, branches and permanent establishments of foreign companies that are located in Peru are considered to be taxed according to Peruvian regulation and their income is subjected to withholding income tax (see Table 10). The corporate income tax rate is 30% and is applied over the net income (alter the deduction of expenses incurred in the generation on revenues or maintenance of the source).
Income Rate
Dividends and profit distribution to non-domiciled by domiciled companies and branches, permanent establishments and agencies of foreign companies.
4.1%
Interest paid to non-domiciled, if certain requirements are met 5.0%
Interest paid to related parties or affiliated foreign lenders 30.0%
Technical assistance services used financially in Peru 15.0%
Royalties 30.0%
Capital gains deriving from the sale of securities (shares, bonds and other securities issued by Peruvian entities) through the Lima Stock Exchange
5.0%
Capital gains deriving from the sale of securities (shares, bonds and other securities issued by Peruvian entities) outsider the Lima Stock Exchange (over the counter)
30.0%
Table 10. Withholding Tax Rate in Income of Non-domiciled
Source: SUNAT. The tax year ends on December 31, with no exceptions, and income tax returns for corporations, branches and individuals should be generally filed by March 31 of the following year. According to capitalization rules, interest paid by domiciled taxpayers to financially related or associated companies is not deductible in the portion that exceeds the result of applying a coefficient (debt/equity ratio) equivalent to three times the taxpayer’s net equity at the end of the preceding year.
25
Transfer pricing rules in Peru do not only apply to transactions between related parties (both domestic and cross-border) but also to transactions with companies resident in tax havens. Moreover these rules must be considered not only for income tax purposes but also for Value Added Tax and Excise Tax purposes.
3.5.1.2 Temporary Net Assets Tax (ITAN) This tax is 0.4% of the value of total assets (over S/. 1,000,000) in the year, and the tax does not apply to companies in a pre-operational stage. These payments can be used as a tax credit to offset income tax liabilities (i.e. monthly prepayments and the final income tax payment due when the annual tax return is filed). A refund may be requested for any balance not used in the current year. Subsidiaries and branches of foreign companies may decide to reverse the order of the tax credit, so the Peruvian income tax is creditable against the ITAN and not vice versa (in order to avoid double taxation). In such a way, taxpayers might be able to claim as foreign tax credit the income Tax and not the ITAN.
3.5.1.3 Tax on Financial Transactions and Means of Payments Peruvian bank accounts have a tax to financial transactions of 0.05%, imposed on debits and credits. Payment greater than S/. 3,000 or US$ 1,000 must be made through the Peruvian banking system using means of payment (bank deposits, wire transfers, pay orders, credit and debit cards and non-negotiable checks), so the corresponding cost or expense of the payment can be recognized for income taxation. In addition, any Value Added Tax (VAT) related to the acquisition of goods and services cannot be used for tax credit.
3.5.2 Excise Taxes 3.5.2.1 Value Added (VAT)
The consumption of goods and services in Peru are levied with an 18% tax. The Value Added Tax follows the debit/credit system, under which the VAT paid upon acquisitions is offset against the VAT. The VAT that is not applied as credit in a particular month should be applied in the following months until it is exhausted. Companies that develop any project in which the preoperational stage is longer than two years, can request the early recovery of the VAT before starting the production stage. To do this, the company must enter into an investment contract with the Peruvian government through the relevant ministry for the sector. This applies to two types of investors: (i) Those who own mining concessions: The beneficiary of the regime must not be in the production stage and should have entered into an Exploration Investment Agreement. (ii) Those who have entered into agreements of service contracts according to the Hydrocarbons Act: In the second case, the investor must be in the exploration stage of such agreements.

26
3.5.2.2 Selective Consumption Tax This tax applies to the consumption of specific goods, such as fuels, cigarettes, beers, liquors, soft drinks, among others. It is applied under 3 systems: (i) specific, which involves a fixed amount in local currency for each measurement unit; (ii) at the value, a percentage over the sale price; and (iii) sale price, a percentage over the suggested retail price.
3.5.3 Municipal Taxes Real Estate tax is a municipal annual tax that is levied over the value of real property. It considers the land, buildings, and fixed or permanent facilities. The tax rate is a cumulative scale varying between 0.2% and 1.0%, depending on the appraisal value of the property. There is also a Real Estate Transfer Tax, levied on the transfer of real property, including free transfers, in any form or manner, including sales in which the ownership rights are not transferred to the buyer until the total price is paid. The tax base is the agreed price, which cannot be lower than the value of the property for Real Estate Tax purposes. The tax rate is 3%. The Vehicle Property Tax is an annual tax, levied on the property of three year-old vehicles, cars, trucks and station wagons, manufactured within the country or imported. The 3 years are calculated from the first filing of the vehicle in the Real Estate Registry. The tax base is determined by the original acquisition value, import or property entry. The applicable tax rate is 1%.
3.6 Tariffs and Duties The import of goods is subject to customs duties, levied with the Value Added Tax, the Selective Consumption Tax, Antidumping Rights and Compensatory Rights, among others (see Table 11), depending on the type of goods imported (see Table 12). As you can see, they are calculated over the CIF value of imports.
Tax Rate Taxable Base
Custom Duties 3.4%* CIF value
Value Added Tax** 19.00%CIF + customs
duties
Table 11. Taxes and Custom Duties
Source: SUNAT.* This is the average rate, because they vary depending on the imported good. Refer to the following table for detail.** The Value Added Tax can be used as tax credit by the importer. Certain goods are also subject to the Consumption Selective Tax.
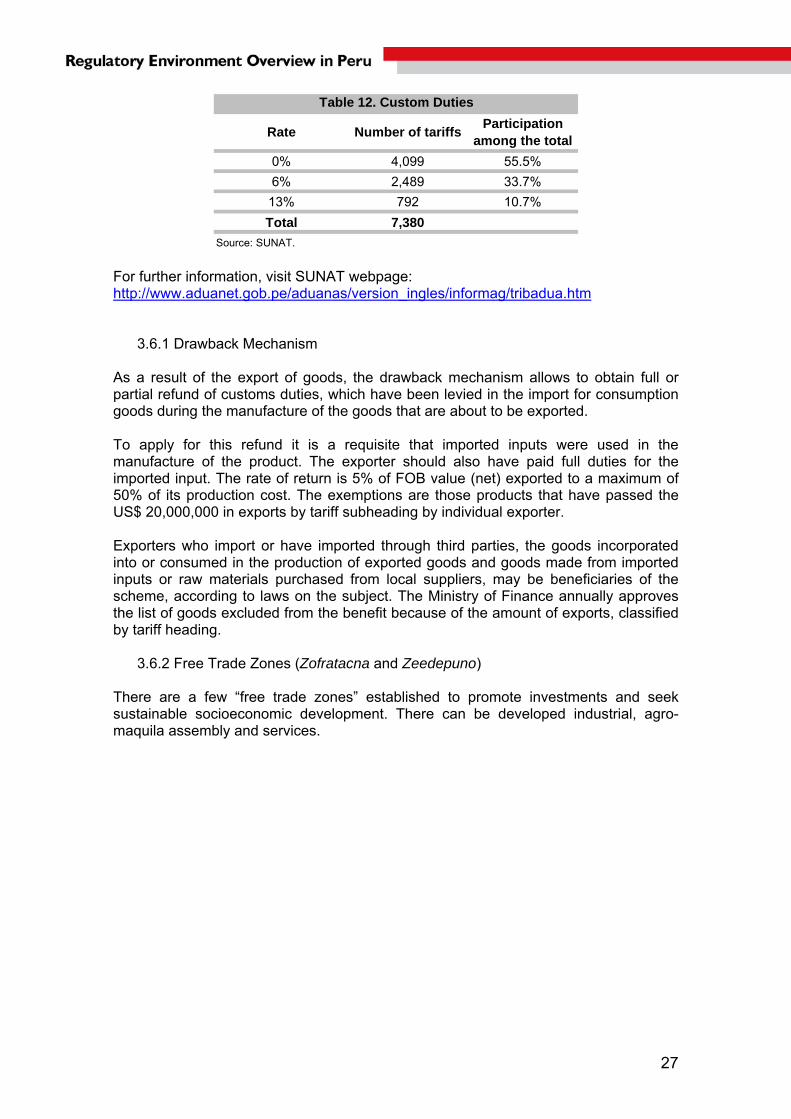
27
Rate Number of tariffsParticipation
among the total
0% 4,099 55.5%
6% 2,489 33.7%
13% 792 10.7%
Total 7,380
Table 12. Custom Duties
Source: SUNAT. For further information, visit SUNAT webpage: http://www.aduanet.gob.pe/aduanas/version_ingles/informag/tribadua.htm
3.6.1 Drawback Mechanism As a result of the export of goods, the drawback mechanism allows to obtain full or partial refund of customs duties, which have been levied in the import for consumption goods during the manufacture of the goods that are about to be exported. To apply for this refund it is a requisite that imported inputs were used in the manufacture of the product. The exporter should also have paid full duties for the imported input. The rate of return is 5% of FOB value (net) exported to a maximum of 50% of its production cost. The exemptions are those products that have passed the US$ 20,000,000 in exports by tariff subheading by individual exporter. Exporters who import or have imported through third parties, the goods incorporated into or consumed in the production of exported goods and goods made from imported inputs or raw materials purchased from local suppliers, may be beneficiaries of the scheme, according to laws on the subject. The Ministry of Finance annually approves the list of goods excluded from the benefit because of the amount of exports, classified by tariff heading.
3.6.2 Free Trade Zones (Zofratacna and Zeedepuno) There are a few “free trade zones” established to promote investments and seek sustainable socioeconomic development. There can be developed industrial, agro-maquila assembly and services.

28
Services include: warehousing, distribution, unpacking, packing, packaging, labelling, labelling, division, display, classification of goods, call centers and software development services as well as repair, refurbishment and/or maintenance machinery, engines and mining equipment, in accordance with Ministerial Resolution list approved by the Ministry of Production in coordination with the Ministry of Economy and Finance. These activities are subjected to a tax exemption regime that includes Income Tax, Value Added Tax, Selective Consumption Tax, Municipal Promotion Tax, among others.

29
3.7 Import Barriers 3.7.1 Restricted Products
Peru has different kinds of barriers applied to several imported products. All the restrictions are consistent with Peru’s multilateral obligations. For example, imports of several products are subject to authorization on health or environmental grounds or to protect the national identity (see Table 13).
NºProduct (number of ten-digit tariff
subheadings affected)Reason
1 'Yoyo loco' (type of rubber toy that is toxic) Health protection
2 Used tyres Public health, safety and environmental protection
3Foreign alcoholic beverages whose description includes the word "Pisco"
Protected appellation of origin
4Used clothing and footwear with a commercial purpose
Public health
5Used engines, components and spare parts for road vehicles
Safety
Source: OMC.
Table 13. Prohibited Imports in Peru
Only used vehicles not older than five years old (two years for some categories) may be imported. These vehicles must not have a mileage greater than that stipulated in the legislation and must not have overturned or been involved in a head-on, lateral or rear-end collision. Moreover, they must have had left-hand drive from the time of manufacture and the emissions may not exceed the maximum specified in the legislation. Used vehicles imported into special areas regimes like CETICOS and ZOFRATACNA (similar to industrial free trade zones) do not need to comply with the requirements relating to overturning or collision and emissions, and may have been manufactured with right-hand drive. The importation of passenger vehicles with more than nine seats and freight vehicles of more than 3,000 kg into CETICOS and ZOFRATACNA is prohibited.
3.7.2 Anti-Dumping Measures and Safeguards At the end of 2006 there were 34 definitive antidumping duties in force, eleven of which were related to products imported from China and five to products from Chile. The products to which these duties are being applied are diverse in nature and include steel, footwear, bodyboards, woven cotton fabric, tableware, and soft drinks. At the end of 2006, virtually all the final antidumping measures adopted before 2000 had been revoked. Only the measures imposed in 1995 against imports of various woven fabrics from China were being maintained, after a review of the antidumping duties in 2001. Antidumping measures imposed since 1999 on countries that are not WTO Members are also being maintained, but since 2010 they are under review. On the other hand, Peru has only applied provisional safeguard measures to China in consistence with its WTO commitments. The measure was applied for a period of 200 days, after which Peru decided not to apply definitive safeguard measures.

30
3.7.3 Sanitary and Phytosanitary Measures The import of certain products is subject to authorization or registration requirements, generally in the interests of national security, consumer health or environmental protection. In general, authorizations and registrations are not used to limit the quantity of imports. Applications for authorizations must be made to each of the entities responsible. The legislation specifies a period of five days for the completion of these formalities. The following are the competent Peruvian authorities for sanitary and phytosanitary (SPS) matters: for animal and plant health, the National Agrarian Health Service (SENASA) of the Ministry of Agriculture; for the safety of processed food products, the Directorate-General of Environmental Health (DIGESA), at the Ministry of Health; and for hydrobiological product health, the Fisheries Technology Institute (ITP) attached to the Ministry of Production, which is the competent authority of the National Fisheries Health Service (SANIPES).
3.8 Custom Procedures (New Customs Law and VUCE) The merchandise that enters or exits Peru undergoes the customs procedures set forth in the customs laws, except for the merchandise which enters subject to any specific agreement or treaty signed by Peru. The Peruvian Customs General Law includes the Import Regulations, Export Regulation and Perfection Regulations.
3.8.1 Import Regulations The Customs General Law classifies imports in the following classes:
Import for Consumption This customs procedure allows goods for consumption to the customs territory, after the payment or guarantee deposit, as applicable, as well as the payment of the customs duties, other applicable taxes, charges and fines, if any.
Re-import in the Same Condition This customs procedure allows a previously exported merchandise to be entered to the customs territory without payment of the customs duties and the other taxes, provided that the exported merchandise has undergone no transformation, improvement or repair abroad, otherwise it is no longer subject of the export benefits hereof.
Temporary Admission for Re-export in the Same Condition This custom procedure allows the merchandise to be entered to the customs territory, with relief from payment of the custom duties and other taxes and charges, if any, applicable to the import for consumption, provided that such merchandise can be identified and is intended to be re-exported to a certain place within a fixed term. No modification of these conditions is allowed.
3.8.2 Export Regulation The Customs General Law classifies exports in the following classes:
Definitive Export This custom procedure allows the national and nationalized merchandise to leave for its final use or consumption abroad. No tax is imposed on the definitive exportation.

31
Temporary Export for Re-import in the Same State
This custom procedure concerns the temporary exit of national or nationalized goods from the customs territory in order to be re-imported after a certain period of time without any modification, except of the usual wear and tear.
3.8.3 Custom Perfection The Customs General Law includes other classifications as the following:
Temporary Admission for active perfections This customs regulations allows entry of certain foreign goods to the customs territory granting relief from the payment of custom duties and other applicable taxes and charges, if any, to the importation for consumption which are intended to be exported as compensating products in a certain period of time, after having undergone a perfection operation. The operations of active perfection are those, which produce: 1. The merchandise transformations.
2. The merchandise production including its assembly and adaptation to other merchandise.
3. The merchandise repair including its restoration and conditioning.
Temporary Exportation for Passive Perfection This custom procedure concerns the temporary exit of national or nationalized goods from the customs territory in order to be transformed, produced or repaired and after certain period of time re-imported as compensating products.
Duty-Free Goods Replacement Procedure This custom procedure grants relief from the customs duties and other taxes applicable to the import for consumption in case of the importation for consumption of merchandise equivalent to nationalized one, which has been used to obtain the earlier definitively exported merchandise.
Customs Warehousing This customs procedure allows the merchandise, entered to the customs territory, to be stored in a customs warehouse for a determined period of time under customs control with no payment of the custom duties and other applicable taxes to the importation for consumption provided that no custom clearance procedure has been started or is ongoing.
3.8.4 Transit Regulations
Customs Transit This custom procedure allows the incoming merchandise from abroad, which is not intended for home use, to be transported, free from customs duties and other applicable import taxes, under customs control, from one customs point to another within the customs territory or abroad, after compliance with the statutory requirements and guarantee submission. The internal customs transit is performed by sea, air and land transport.
32
Transfer
This customs procedure allows the merchandise unloaded from the conveyance used to bring it into the customs territory, to upload into the conveyance used to exit the customs territory, under customs control.
Transshipment This customs procedure allows the merchandise, which is waiting at an arrival point the assignment of the customs clearance procedure, to be reshipped from the customs territory to abroad, provided that no abandon condition is declared thereon.
3.8.5 General Customs Law
Definitions The National Superintendence of Tax Administration - SUNAT is appointed, by Legislative Decree 1053, Customs General Law, enacted in whole on January 1, 2010, as Customs Administration and the competent authority to apply the customs legislation, collect the custom duties and other applicable taxes to importation for consumption, general customs laws and exercise the customs authority. The custom brokers, carriers and their representatives, international cargo agents, customs warehouses, post service companies, express delivery companies, duty-free warehouses, beneficiaries of aeronautic materials, owners, consignees and, in general, each participant or beneficiary, either individual or legal person, are regarded as foreign trade operators.
3.8.6 VUCE The Foreign Trade Single Window, VUCE (Ventana Única de Comercio Exterior in Spanish) is defined as a trade facilitation mechanism that allows parties involved in trade and transport to comply with all import, export and transit procedures. VUCE hosts standardized information and documents in a single entry point. The information can be submitted once. VUCE is conceptualized as an integrated system that allows parties involved in foreign trade and international transportation to manage, through electronic means, the procedures required by the competent bodies in accordance with existing regulations or requested by all parties for transit into or out of the country's goods. Restricted goods component will be implemented through the use of electronic means for obtaining permits, certificates, licenses and other authorizations which are required by state entities to carry out imports and exports as well as for reception, office accommodation and international transport ships. State entities, by law, must be involved in the physical inspection of goods when entering or leaving the country, and will carry out this measure when the National Superintendence of Tax Administration - SUNAT does its inspection in customs clearance, where appropriate. The first stage will allow the user to send through VUCE the online application and attach scanned documents, which are required as conditions of the process. This information is derived to the relevant competent authority, which can evaluate the application, resolve and send an electronic notification to the client.

33
In addition to the main process described, this first stage incorporates the following services: Authentication: By extending the SUNAT Identification code, it is possible for
users of the system to be fully identified and to electronically sign their applications.
Payment Gateway: In proceedings involving the payment of a fee. The system informs the person concerned the amount and a code that lets you pay in most private banks or via the electronic payment platform from SUNAT.
Technical: Allows administrators to query entities with specific doubts or questions about procedures for specific products.
Traceability: Allows the user to track the stages of the process.
The working group developing the VUCE includes public and private sector institutions:
AAAP: Customs Brokers Association of Peru. ADEX: Peru's Exporters Association. APACIT: Transportation and Logistics Association. APN: National Port Authority. CCL: Chamber of Commerce of Lima. COMEXPERU: Foreign Trade Society of Peru. DICAPI: General and Coastguards DICSCAMEC: General Security Services Control, Arms control, and
Ammunition and Explosives control for Civil Use. DIGEMID: General Directorate of Medicines, Supplies and Drugs. DIGEMIN: Department of Immigration and Naturalization DIGESA: Department of Environmental Health. DIRESA: Regional Health Authority - Regional Government of Callao DGFFS: General Directorate of Forestry and Wildlife. DP-WORLD Callao SRL ENAPU: Ports State Enterprise ITP: Fishing Technological Institute MEF: Ministry of Economy and Finance. MINCETUR: Ministry of Foreign Trade and Tourism. MTC: Ministry of Transports and Communications. PCM: Presidency of the Council of Ministers. PRODUCE: Ministry of Production. SENASA: National Service of Agrarian Health. SNI: National Society of Industries. SUNAT: National Superintendence of Tax Administration.
3.9 Government Procurement Procedures The Supervisor of the Governmental Procurement (OSCE) is the entity responsible for ensuring compliance with public procurement rules of the Peruvian State. It has jurisdiction over the national level, and oversees the process of procurement of goods, services and works undertaken by state entities. It is a specialized technical body under the Ministry of Economy and Finance, with legal personality under public law,

34
with technical, functional, administrative, economic and financial autonomy. OSCE staff is subject to the private activity labour laws. The Single Text of Administrative Procedures (TUPA in Spanish), is a management document that contains all the information about the requirements and administrative procedures for public users. 1
1 The Supervisor of State Contracting Agency (OSCE) offers related information in its website: http://www.osce.gob.pe/

35
4. Doing Business in Peru
In this chapter, the study will review different but important aspects of how to do business in Peru, its main characteristics and late improvements.
4.1 How to Open a Business The first step to open a business in Peru is choosing the appropriate kind of firm.
4.2 Main Types of Companies Used by Foreign Investors
Corporation (Sociedad Anónima – S.A.) This form of business requires at least two partners (individuals or juridical persons). The equity stock is represented by shares and the partners have shareholders status. This modality grants its stockholders limited liability, up to the value of their shares. Main characteristics: Name: any name followed by “Sociedad Anónima” or the acronym "S.A." Shareholders: they can be residents or non-residents. There is no maximum
number, unless the firm is a closed corporation (S.A.C.), in which case there is a limit of twenty shareholders.
Capital: incorporation requires that capital stock be fully underwritten, and each underwritten stock paid at least in 25%. There is no minimum capital amount and the initial contribution should be deposited in a local bank.
Contributions: these can be made in domestic and/or foreign currency, in physical or tangible goods. Intangible technological contributions (e.g., technical papers) are also allowed. Initial contributions in goods and real estate must be appraised and the appraisal must be approved by the board after the registration of the firm and before the shares may be issued. It is recommended that the initial contribution be made in cash.
Governance: the main bodies of the company are the general meeting of shareholders, board of directors and the management. There is no residence or nationality requirement to become a director.
Profits: dividends on shares can be paid only from gained profits or free availability reserves, provided that the patrimony is not under the past capital stock. Shareholders will receive dividends in proportion to the amount paid up on each share and the time of integration to the capital stock.
Transfer of shares: is free. However, there are exceptions in the case of closed corporations.
Term: unless otherwise specified in the articles of association, the corporation term is indefinite.
Closed Corporation (Sociedad Anónima Cerrada – S.A.C.) This type of firm follows the general rules of the corporation, with some differences: Name: any name followed by “Sociedad Anónima Cerrada” or the acronym "S.A.C." Shareholders: there is a limit of twenty shareholders. Shares cannot be registered
in the Public Registry of the Stock Market. Governance: the appointment of a board of directors is optional. Transfer of shares: the Law establishes a right of first refusal for the existing
stockholders; nevertheless, this right may be waived if agreed by the shareholders.
36
Open Corporation (Sociedad Anónima Abierta – S.A.A.) This kind of corporation is intended for companies with a large number of shareholders. The main differences with the general corporation are: Name: any name followed by “Sociedad Anónima Abierta” or the acronym "S.A.A." Shareholders: more than 750 shareholders. Supervision: shares have to be registered in the Public Registry of the Stock
Market; therefore, the firm is subject to the supervision of the Peruvian Securities and Exchange Commission (CONASEV).
Transfer of shares: is completely free. No restrictions or limitations are permitted. Limited Liability Company (Sociedad Comercial de Responsabilidad Limitada – S.R.L.) This form of business requires from two to 20 partners, who are not personally liable for the company’s obligations. Their liability is limited to the value of their participation. Main characteristics: Name: any name followed by “Sociedad Comercial de Responsabilidad Limitada”
or the acronym "S.R.L." Capital: is divided in equal parts, which are not stock, nor can they be included in
securities. It is made up by the partners’ contributions, which must be fully subscribed and paid in at least 25%. There is no minimum capital amount requirement to incorporate the firm.
Governance: the main bodies of the company are the general partners meeting and the management. A board of directors is not required.
Transfer of interest: the Law establishes a right of first refusal for the existing partners. The transfer of partners’ interest must be registered in the Public Registry (SUNARP).
Term: definite or indefinite. Branch (Sucursal) Foreign companies may set up branches in Peru. A branch is not considered to be a separate legal entity. It has permanent legal representation and is managed by autonomous representatives designated by the parent company. The legal representative appointed in Peru shall have enough powers to solve any matter related to the company’s activities; to involve the company in transactions it carries out; to appear in court; and to answer to a claim. The registered deed shall include at least: Certificate in force of the parent company in its country of origin along with the
proof that neither its partnership agreement nor its articles of association impede it to establish branches abroad.
Copy of the partnership agreement and articles of association or equivalent
documents in the country of origin. Agreement for the establishment of a branch in Peru, taken by the competent social
body of the partnership indicating: capital assigned for its activities in the country, statement that those activities are included in its business line, domicile of the branch, appointment of at least one permanent legal representative in the country,
37
powers conferred and submission to Peruvian laws to assume obligations of the branch in Peru.
Associative Contracts There are three kinds of associative contracts: contract of partnership, consortium and joint venture. They do not generate a corporate body; they shall be written and are not subject to registration. Resources destined by foreign investors to these contracts grant them participation in the installed capacity, not involving necessarily capital contribution. Foreign investors may provide goods or services to the recipient firm in exchange of participation in the volume of the physical production, in the sales value or in the net profits of that company.
4.3 Procedures to Set Up a Firm Procedures may be carried out directly through a representative, who needs the following credentials:
Power of attorney granted by the corporation abroad, appointing him or her as
representative. The document shall be authenticated before the Ministry of Foreign Affairs of Peru and translated into Spanish.
In case the representative is a foreign citizen, a business visa and/or foreigner card is required.
There is an online one-stop-shop2 for corporations, closed corporations and limited liability companies, currently available for the city of Lima and the region of Lambayeque (in Spanish). This site allows business constitution in 72 hours. The procedures to open a business are the following: Check the uniqueness of the company name and reserve it (online registration and
payment with SUNARP). The name may be reserved for 30 days. File the draft deed of incorporation with a notary online: the entrepreneur selects a
notary3 and sends him/her the necessary information for incorporation (company name; its objective and duration; its domicile; the initial capital contribution; the shares nominal value and the total number of shares; the name, nationality, marital status, occupation, and residence of any individual shareholder; the names of the initial directors, managers, and agents; the date of start-up operations; etc).
Sign and register the deed; obtain the taxpayer identification number (Registro
Único del Contribuyente - RUC): the notary creates the public deed and, after signature by the shareholders, files it with SUNARP4. This entity is also interconnected with the National Superintendency of Tax Administration (SUNAT) to register the firm as a taxpayer. If the notary follows the model of deed of the system, the tax registration certificate and the RUC are delivered in 72 hours.
2 http://www.empresas.gob.pe/ 3 Notaries are commonly employed in Peru to certify documents. 4 Notary fees are up to 1% of capital, depending on the company size, the length of the public deed, and the initial capital contribution. The partners also pay the registration fees to the notary.

38
Deposit at least 25% of capital in a bank and obtain proof thereof: payments made in cash should be deposited in a bank account in the name of the company, and obtaining proof. Since July 2010, micro and small enterprises5 do not need to comply with this requirement.
The notary stamps the accounting book and the minute book: corporate and
accounting books require authentication with a public notary. This procedure requires a copy of the RUC form, the books to authenticate, and a fee payment.
Obtain municipal license from the City Council: this license is required to operate
commercially and it is obtained from the municipality of the jurisdiction where the company is located. Some district councils require a provisional license while the permanent license is being processed. In most cases, the district council requires a copy of the incorporation documents, the public deed, the distribution plan, property title documents (if applicable), a simple verification that the new firm meets zoning regulations, and the certificate of INDECI (which requires a safety technical inspection). Properties up to 500 m2 do not need to submit this certificate, but the compliance with health and security requirements is now verified by municipal inspections after applying for the license. Fees vary depending on the district council where the firm is located.
Foreign Direct Investment Registry: foreign investment must be registered6 with the
Private Investment Promotion Agency of Peru (ProInversión). This procedure is free of charge.
4.4 Special Requirements and Permits by Type of Activity
In some cases, the Peruvian Law requires special permits or procedures for some activities. ProInversión lists the following activities:
Industry Manufacturing of weapons, ammunition or explosives; military or police garments;
and of chemical inputs and products is supervised by special rules. Before tax registration, these activities require verification and express authorization
from the Ministry of Production (PRODUCE7), after pertaining formalities before the Ministry of Homeland Security8 and the Ministry of Defense9, as the case may be.
Commercial and Service Activities Commercialization of chemicals and chemical inputs also requires authorization
from the entities aforementioned. Before tax registration, the commercialization of pesticides, pharmaceutical and
biological products for veterinary use, and of animal food, requires express authorization from the National Service of Agricultural Health (SENASA10).
5 Microenterprise: a firm with 1 to 10 workers and annual sales up to 150 tax units (UIT). In 2011, the UIT is equivalent to S/. 3,600 (approximately USD 1,286), therefore the maximum sales amount is about USD 192,857. Small enterprise: a firm with 1 to 100 workers and annual sales up to 1,700 UIT (approximately USD 2’185,714). 6 Information regarding this procedure can be found at this link: http://www.proinversion.gob.pe/0/0/modulos/JER/PlantillaSectorHijo.aspx?ARE=1&PFL=0&JER=3001 7 http://www.produce.gob.pe/portal/ 8 http://www.mininter.gob.pe/ 9 http://www.mindef.gob.pe/

39
Commercialization of flora and fauna is supervised by special mechanisms and the Convention on International Trade in Endangered Species of Wild Fauna and Flora (CITES). Before starting operations, these activities need authorization from the Ministry of Agriculture (MINAG11).
Before tax registration, surveillance and security services require authorization from the Ministry of Homeland Security.
Before tax registration, farming fumigation services need authorization from SENASA.
Tourism To operate as an “authorized travel and tourism agency”, these agencies shall
request an application form from the Ministry of Foreign Trade and Tourism (MINCETUR12) or the competent regional entity. The firm should provide its general information, copy of the RUC and copy of the municipal license.
Lodging houses requiring classification and categorization, and lodging services, shall apply for a similar process before MINCETUR.
Casinos and slot machines shall comply with specific regulations13. Restaurants requiring categorization (1-5 forks) and/or touristic status shall also
request a form from MINCETUR. National and International Transportation Services Regular passengers and freight transportation services require a route concession,
operation permit or enrolment certificate, as corresponds, from the Ministry of Transportation and Communications14.
Agribusiness The employment of wild flora and fauna requires authorization from MINAG, before
tax registration. Slaughtering and selling of cattle and poultry require sanitary authorization from
SENASA, before tax registration. Production of pesticides of vegetal origin also requires the aforementioned sanitary
authorization.
4.5 Ease of Doing Business Over the last years, Peru has made significant progress in the ease of doing business. During the international crisis and in 2010, the Peruvian Government committed itself to a competitiveness plan. As a result, between 2009 and 2010 Peru improved business regulation the most in the APEC region and Latin America, and ranked 36th among 183 economies in the World Bank’s Doing Business 2011 report. According to the report, Peru improved the ease of business start-up more than any other economy in the world, establishing the abovementioned online one-stop-shop for business registration and simplifying post-registration municipal formalities. This reduced the average time to start a business from 41 to 27 days. It is worth mentioning that in 2004/2005 it took 102 days to open a firm. Further progress is expected in this topic since in 2010 the Ministry of Economy implemented a municipality modernization program, which transfers resources to councils that accelerate procedures.
10 http://www.senasa.gob.pe/ 11 http://www.minag.gob.pe/ 12 http://www.mincetur.gob.pe/newweb/Default.aspx?tabid=1050#prestador 13 http://www.mincetur.gob.pe/turismo/DGJCMT/index.htm 14 http://www.mtc.gob.pe/portal/inicio.html
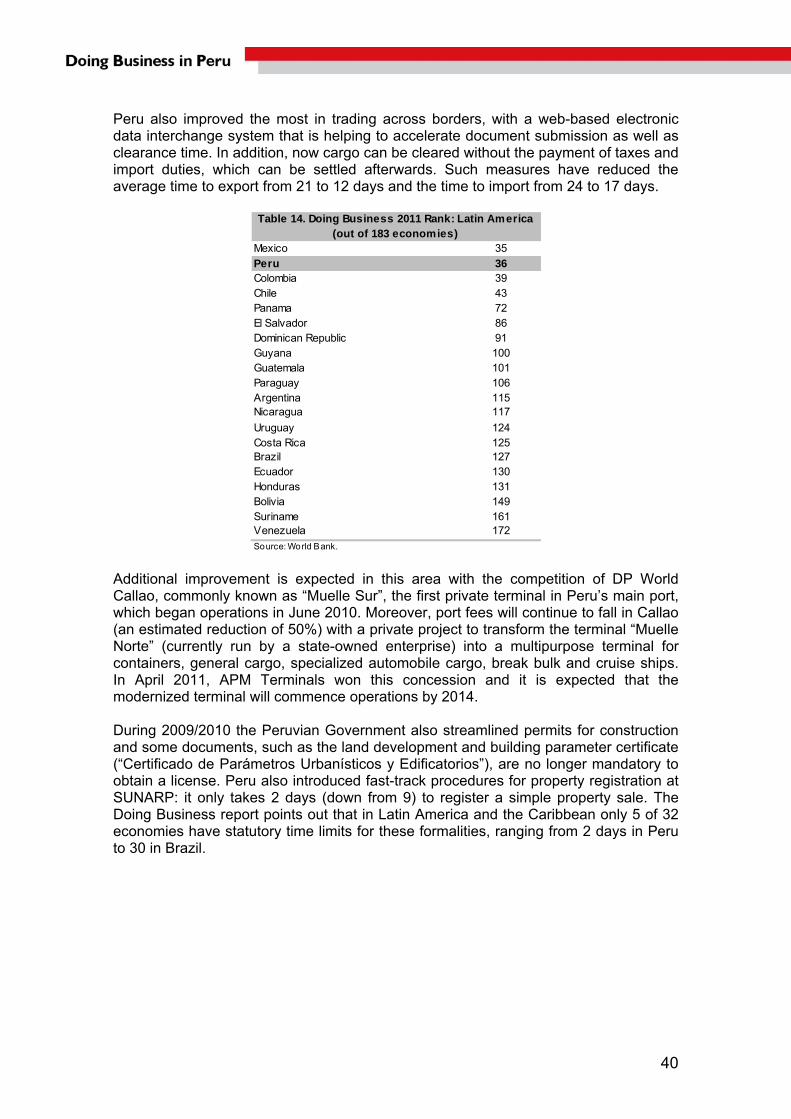
40
Peru also improved the most in trading across borders, with a web-based electronic data interchange system that is helping to accelerate document submission as well as clearance time. In addition, now cargo can be cleared without the payment of taxes and import duties, which can be settled afterwards. Such measures have reduced the average time to export from 21 to 12 days and the time to import from 24 to 17 days.
Mexico 35
Peru 36Colombia 39Chile 43Panama 72El Salvador 86Dominican Republic 91Guyana 100Guatemala 101Paraguay 106Argentina 115Nicaragua 117
Uruguay 124Costa Rica 125Brazil 127Ecuador 130Honduras 131Bolivia 149Suriname 161Venezuela 172Source: World Bank.
Table 14. Doing Business 2011 Rank: Latin America(out of 183 economies)
Additional improvement is expected in this area with the competition of DP World Callao, commonly known as “Muelle Sur”, the first private terminal in Peru’s main port, which began operations in June 2010. Moreover, port fees will continue to fall in Callao (an estimated reduction of 50%) with a private project to transform the terminal “Muelle Norte” (currently run by a state-owned enterprise) into a multipurpose terminal for containers, general cargo, specialized automobile cargo, break bulk and cruise ships. In April 2011, APM Terminals won this concession and it is expected that the modernized terminal will commence operations by 2014. During 2009/2010 the Peruvian Government also streamlined permits for construction and some documents, such as the land development and building parameter certificate (“Certificado de Parámetros Urbanísticos y Edificatorios”), are no longer mandatory to obtain a license. Peru also introduced fast-track procedures for property registration at SUNARP: it only takes 2 days (down from 9) to register a simple property sale. The Doing Business report points out that in Latin America and the Caribbean only 5 of 32 economies have statutory time limits for these formalities, ranging from 2 days in Peru to 30 in Brazil.
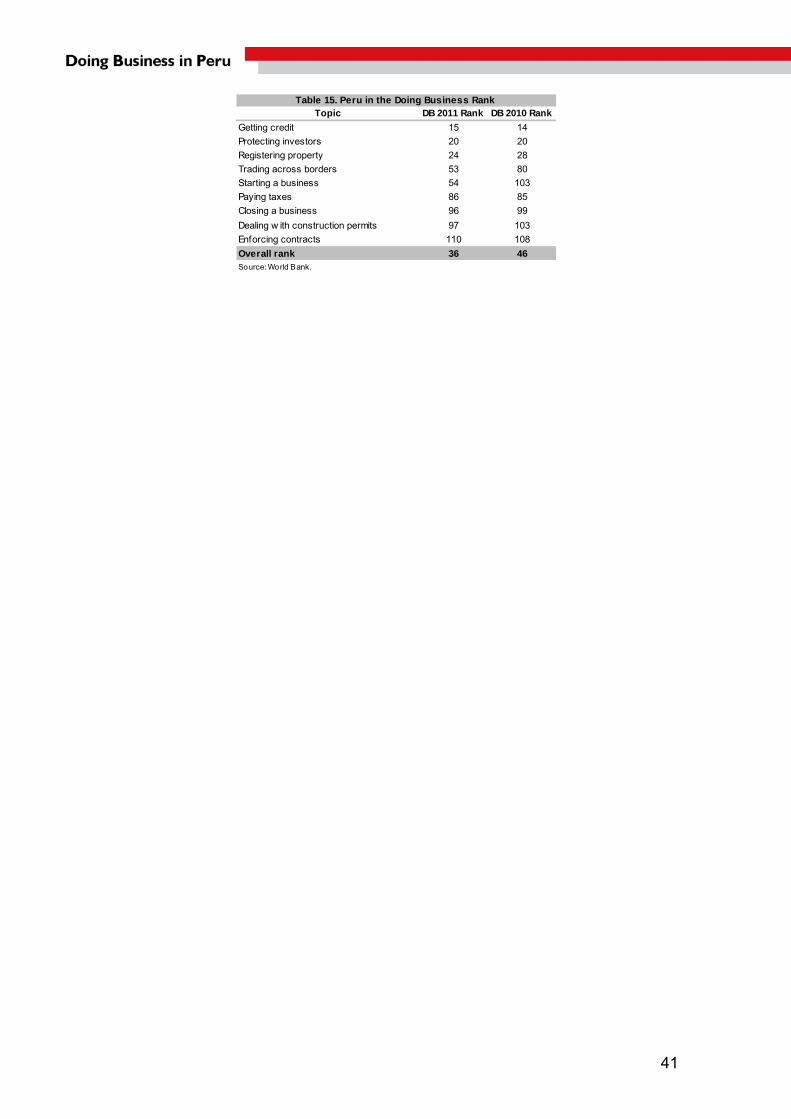
41
Topic DB 2011 Rank DB 2010 Rank
Getting credit 15 14
Protecting investors 20 20
Registering property 24 28
Trading across borders 53 80
Starting a business 54 103
Paying taxes 86 85
Closing a business 96 99
Dealing w ith construction permits 97 103
Enforcing contracts 110 108
Overall rank 36 46Source: World Bank.
Table 15. Peru in the Doing Business Rank

42
5. Key Sectors of the Peruvian Economy of Interest to New Zealand
Peru offers attractive investment opportunities in many different sectors. Confidence from investors and the level of foreign direct investment has increased due to the economic stability and sound economic policies. In this sense, Moody’s investor, Standard & Poor's and Fitch Ratings (April 2, 2008) had awarded Peruvian sovereign debt with “investment grade”. Peru is the 4th country in Latin America to obtain the investment grade by these three most important risk rating agencies.
S&P BBB-Fitch BBB-
Moody's Baa3Updated to February 15, 2011.Source: Bloomberg.
Table 16. Peruvian Risk Rating
5.1 Agriculture Agriculture plays a fundamental role in generating employment and added value to Peruvian production. Various business structures are related to this activity, such as cooperatives, rural communities and small and medium producers, since farming is developed along the mixture of all natural regions and populations. In Peruvian, for foreign trade purposes, the agricultural statistics consider the following crops as “traditional” or “primary”: cotton, sugar, coffee, and wool. Otherwise, the other types of crops such as vegetables and fruits mainly for agro industry and export are considered “non traditional”, “processed” or “manufactured”.
5.1.1 General Evolution The agriculture sector has grown at an average rate of 3.4% during the period 2000-2010 (see Graph 19). Although growth in the sector experienced a fall in 2009, it did not decrease and it recovered in 2010.
0
2
4
6
8
10
12
2000 2001 2002 2003 2004 2005 2006 2007 2008 2009 2010
-4
-2
0
2
4
6
8
10Real GDP
Agriculture
Graph 19. Peruvian Real GDP and Agricultural Production, 2000-2010
(% variation)
Source: BCRP.
AgricultureReal GDP

43
Agricultural export activities have been growing at an average rate of 20% since 2005 (see Graph 20). Among these sales, processed products15 are the ones that stand out; in 2010 they amounted US$ 2.1 billion, and since 2005 they grew 18% a year in average.
35.0
9.4
31.3
-4.0
28.6
0.0
0.5
1.0
1.5
2.0
2.5
2005 2006 2007 2008 2009 2010
-10
-5
0
5
10
15
20
25
30
35
40
Primary sector
Manufactures
% variation
Graph 20. Agricultural Exports(2005-2010)
Mil
lio
ns
of
US
$
Source: SUNAT.
According to FAO, Peru is the third largest country in South America, with 7.6 million hectares with direct agricultural potential, but only less than 3.6 million are properly used. The sector today represents about 4.5% of total GDP.
5.1.2 Main Products and Exports Traditional exports are basically three: coffee, sugar and cotton. These exports have grown at an average rate of 115%, -2% and 68% since 2005, respectively. On the other hand, agricultural manufactures sold to international markets have been significantly diversified over the years, thanks to taking advantage of the high productivity in different kinds of crops in the national territory as you can see in Table 17.
15 Modern Peruvian agricultural exports are conceived as ‘manufactures’ or ‘processed products’, because they are not listed as commodities, and this is the main reason why they are differenced from them.

44
NationalProductivity*
WorldProductivity*
% var.
Artichokes 16 11 86%Asparagus 18 5.1 13%Dry paprika 7.6 1.6 10%Piquillo pepper 22 21.7 18%Mango 16 7.3 20%Grapes 17 8.4 41%Avocados 25 8.3 32%Mandarin 15 13.2 26%Subtle lemon 16 11.2 40%Banana 22 18 25%Quinoa 1 0.7 103%Amaranth 2 n.a. 2%
Source: Ministry of Agriculture
* Metric tone / Hectare** Average growth in the total exported amount 2005-2010.
Table 17. High Productivity per Hectare
Exports from this sector peaked in 2008, when they reached US$ 1.9 billion and Peru is now positioned as a reliable supplier of vegetables and fruits that in 2010 were sold principally to United States (30% of total agricultural exports), Netherlands (12%) and Spain (10%).
UNITED STATES
52%
COLOMBIA23%
GUATEMALA14%
BRAZIL8%
BOLIVIA3%
Graph 21. Traditional Agricultural Exports by Destination in 2010
(% share)
Source: SUNAT.

45
ARGENTINA31%
UNITED STATES
27%CANADA
11%
PARAGUAY11%
CHILE11%
BOLIVIA9%
Graph 22. Manufactured Agricultural Exports by Destination in 2010
(% share)
Source: SUNAT.
2005 2006 2007 2008 2009 2010
Total Primary Agricultural Products
326.36 569.20 455.26 681.97 633.69 969.03
Coffe 306.66 514.85 426.95 645.03 584.72 888.69Cotton 3.22 5.81 3.24 2.31 2.69 1.16
Sugar cane 12.72 42.98 18.77 24.72 37.05 64.75Wool 3.08 3.68 5.36 8.89 6.73 10.87
Total Processed Agricultural Products
946.61 1,148.80 1,425.24 1,788.93 1,735.41 2,078.86
Artichokes 44.07 66.02 64.80 83.25 74.60 96.94Asparagus 242.42 292.02 391.84 413.04 365.01 396.70
Grapes 33.93 51.01 60.56 83.36 135.68 186.63Mangos 38.28 59.05 62.85 63.42 69.68 89.72
Total 1,272.97 1,718.00 1,880.50 2,470.90 2,369.10 3,047.89
Source: SUNAT.
Table 18. Peru: Agricultural Exports (millions of US$, 2005 - 2010)
2005 2006 2007 2008 2009 2010
Total Primary Agricultural Products
142.33 158.84 181.01 176.94 132.89 271.13
Coffe 1.82 0.39 0.45 0.71 0.67 0.84Cotton 47.87 47.98 88.84 96.28 69.41 139.87Sugar 74.35 106.75 91.14 79.60 62.67 130.29Wool 1.12 0.58 0.58 0.32 0.10 0.10
Total Processed Agricultural Products
1,346.56 1,472.69 2,067.05 2,931.17 18,745.24 2,894.79
Corn 166.97 213.23 233.14 395.12 307.06 434.01Wheat 209.48 226.74 326.79 111.68 59.89 77.40
Soybean oil 125.44 152.74 211.91 324.11 211.93 314.55Rice 46.91 15.91 34.96 101.12 55.42 61.85
Total 1,488.89 1,631.53 2,248.06 3,108.11 18,878.13 3,165.92
Source: SUNAT.
Table 19. Peru: Agricultural Imports (millions of US$, 2005 - 2010)

46
5.1.3 Regulatory Environment The regulatory environment for agriculture sector has been eased in the last years. The income tax was reduced to 15% (compared to the overall rate of 30%) and there is the early recovery of Value Added Tax in the pre-operational stage (according to the Law Nº 26911). On the other hand, businesses may depreciate their investments in water infrastructure and irrigation at a rate of 20% annually. In addition, businesses that are established higher than 2,500 meters from sea level are excluded from taxation (Law Nº29482). All the previous tax benefits apply until 31 December 2021. In addition, the Agricultural Bank, which is a national financial institution dedicated to provide credit to agriculture, livestock, aquaculture and the processing and marketing of products of agriculture and aquaculture, was relaunched and strengthened. About labour conditions and social security regime, it has been established a working time of 4 hours a day, 15 days holiday break schedule and compensation equivalent to 15 daily wages for each completed year of service (maximum of 180 wages). The monthly contribution that the employer has to pay to cover for health insurance for workers in farming is 4% of their monthly payment.
5.1.4 Main Companies and Projects / Opportunities The location of Peru near the Equator is fundamental to achieving the higher productivity mentioned. In addition, Peruvian agricultural production can supply the European and American markets, because the seasons are opposite and harvest periods -as well as some crops- are especially programmed to take advantage of higher international prices. Countries in Europe and major American cities will continue as the lead buyers of Peruvian agricultural products, which are beginning to be identifiable on their shelves (especially mangos and asparagus with the ‘Peru’ label). In the 900 thousand hectares of the 50 valleys in the coastal, all with temperate climate and availability of regulated water, the productivity in crop yields multiplies constantly and harvest is achieved even two times a year. The development of appropriate technology for the country's geography and the automation of 20,000 hectares per year on average allow the country to further improve the productivity rates. Trade is expected to increase considerably with the populous countries of Asia (such as China, Korea, Japan and India), due to the change in their middle class consumption patterns and tariff preferences that are well suited to the variety of products that Peru has to offer. According to estimates by the Ministry of Agriculture, Peruvian agricultural exports will grow at double digit rates over the coming years and the goal consists in doubling sector’s exports every 5 years.
5.1.4.1 Livestock The evolution of exports and imports corresponding to the total livestock production, which includes live animals and their processed meat16 are showed in Tables 20, 21, 22 and 23.
16 Includes poultry, camelids, goats, guinea pigs, sheep, pigs, dairy cattle and horses, among others.

47
2005 2006 2007 2008 2009 2010
Primary 3.08 3.68 5.36 8.89 6.73 10.83Processed 60.63 71.11 86.65 123.69 92.28 121.63
Total 63.71 74.79 92.01 132.58 99.01 132.46
Source: SUNAT.
Table 20. Peru: Livestock Exports (millions of US$, 2005 - 2010)
2005 2006 2007 2008 2009 2010
Primary 2,198.70 2,706.84 3,242.92 4,261.42 4,982.80 6,159.12Processed 45,030.31 56,942.10 59,342.54 73,545.08 61,591.70 78,706.15
Total 47,229.00 59,648.93 62,585.46 77,806.50 66,574.51 84,865.27
Source: SUNAT.
Table 21. Peru: Livestock Exports (MT, 2005 - 2010)
2005 2006 2007 2008 2009 2010
Primary 1.12 0.58 0.58 0.32 0.10 0.10Processed 112.80 121.02 161.81 210.54 150.84 252.20
Total 113.92 121.61 162.39 210.86 150.94 252.30
Source: SUNAT.
Table 22. Peru: Livestock Imports (millions of US$, 2005 - 2010)
2005 2006 2007 2008 2009 2010
Primary 233.94 247.17 124.51 55.08 36.81 14.18Processed 68,403.52 70,609.92 74,284.99 80,459.21 80,638.18 108,258.82
Total 68,637.45 70,857.10 74,409.50 80,514.30 80,674.99 108,273.00
Source: SUNAT.
Table 23. Peru: Livestock Imports (MT, 2005 - 2010)
Peru is one of the countries in South America with the lowest consumption and production of milk (the per capita levels are lower than those recommended by the FAO). The main Peruvian regions where fresh milk is produced are Lima, Arequipa, Cajamarca and La Libertad, having produced among them 65.8% of total production in January, 2009. Because of the political and economic situation in the past years, sheep raising is developed mainly by small producers in the highlands. The production of wool and meat is very low and the prospects are not encouraging. Also overgrazing is a common problem in this activity. However, a group of rural enterprises achieved an acceptable level of technology and larger herds: SAIS Pachacutec and SAIS Tupac Amaru. In the case of beef, per capita consumption of meat increased from 48.8 Kg per person in 2001 to 60.75 Kg per person in 2006 (+24.5%). Nevertheless, the latest figures are still below the average consumption per year in Andean countries. It should be noted that more than the 90% of beef production in Peru is informal.
2004 2005 2006 2007 2008 2009
Milk production 1,165.00 1,235.80 1,347.00 1,455.80 1,565.50 1,660.70
Source: MINAG
Table 24. Peru: milk production (thousands of TN)
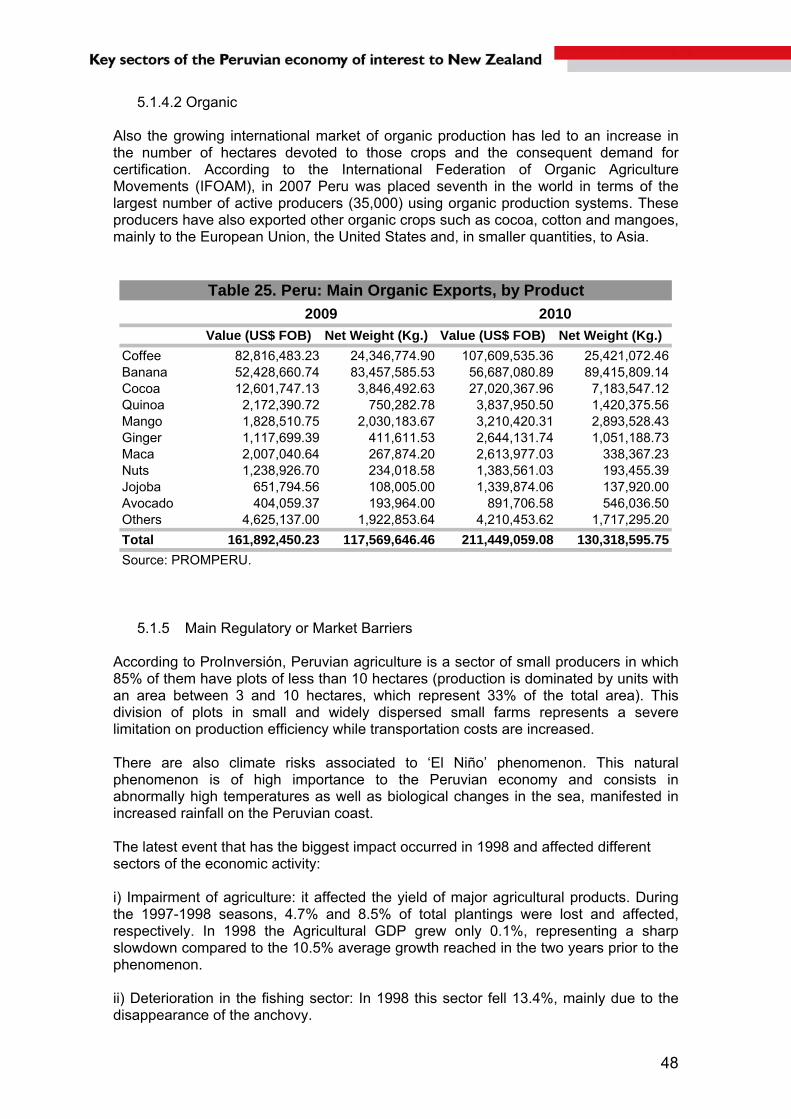
48
5.1.4.2 Organic Also the growing international market of organic production has led to an increase in the number of hectares devoted to those crops and the consequent demand for certification. According to the International Federation of Organic Agriculture Movements (IFOAM), in 2007 Peru was placed seventh in the world in terms of the largest number of active producers (35,000) using organic production systems. These producers have also exported other organic crops such as cocoa, cotton and mangoes, mainly to the European Union, the United States and, in smaller quantities, to Asia.
5.1.5 Main Regulatory or Market Barriers According to ProInversión, Peruvian agriculture is a sector of small producers in which 85% of them have plots of less than 10 hectares (production is dominated by units with an area between 3 and 10 hectares, which represent 33% of the total area). This division of plots in small and widely dispersed small farms represents a severe limitation on production efficiency while transportation costs are increased. There are also climate risks associated to ‘El Niño’ phenomenon. This natural phenomenon is of high importance to the Peruvian economy and consists in abnormally high temperatures as well as biological changes in the sea, manifested in increased rainfall on the Peruvian coast. The latest event that has the biggest impact occurred in 1998 and affected different sectors of the economic activity: i) Impairment of agriculture: it affected the yield of major agricultural products. During the 1997-1998 seasons, 4.7% and 8.5% of total plantings were lost and affected, respectively. In 1998 the Agricultural GDP grew only 0.1%, representing a sharp slowdown compared to the 10.5% average growth reached in the two years prior to the phenomenon. ii) Deterioration in the fishing sector: In 1998 this sector fell 13.4%, mainly due to the disappearance of the anchovy.
Value (US$ FOB) Net Weight (Kg.) Value (US$ FOB) Net Weight (Kg.)
Coffee 82,816,483.23 24,346,774.90 107,609,535.36 25,421,072.46Banana 52,428,660.74 83,457,585.53 56,687,080.89 89,415,809.14Cocoa 12,601,747.13 3,846,492.63 27,020,367.96 7,183,547.12Quinoa 2,172,390.72 750,282.78 3,837,950.50 1,420,375.56Mango 1,828,510.75 2,030,183.67 3,210,420.31 2,893,528.43Ginger 1,117,699.39 411,611.53 2,644,131.74 1,051,188.73Maca 2,007,040.64 267,874.20 2,613,977.03 338,367.23Nuts 1,238,926.70 234,018.58 1,383,561.03 193,455.39Jojoba 651,794.56 108,005.00 1,339,874.06 137,920.00Avocado 404,059.37 193,964.00 891,706.58 546,036.50Others 4,625,137.00 1,922,853.64 4,210,453.62 1,717,295.20
Total 161,892,450.23 117,569,646.46 211,449,059.08 130,318,595.75
Source: PROMPERU.
2009 2010
Table 25. Peru: Main Organic Exports, by Product

49
5.1.6 Prospects Great Peruvian biodiversity enables the development of new agricultural exportable products, generating exciting investment opportunities. Peru has many products not fully exploited, that are attractive because of their high protein content, as well as their differentiated nutritional qualities and high quality. This is the case of the Andean cereals such as the amaranth, quinoa, or cañihua tarwi. Furthermore, it has great market potential in beans, corn and potato varieties little known outside the country, among other crops. Another activity with great potential to develop is the segment of herbs and natural products with medicinal uses or high nutritional content, mostly from the heights of the Andes or the Amazon jungle. From the jungle there are also exotic fruits such as the soursop and the camu-camu, fruits of growing consumption in Asian countries, so there is potential to expand these markets. Among the promising products outside the category of food, we can find the flowers, currently exported only 1,600 of the 19,000 species that exist in Peru.
5.2 Fisheries Peru is one of the leading fishing countries in the world, being second in terms of fish landings and main exporter of fishmeal. This is because of the high yield and the nutrient rich waters of the Peruvian sea, the existing diversity of species and the leadership of national and international enterprises with operations in the country.
5.2.1 General Evolution Peru is the leading exporter of fishmeal and fish oil worldwide, thanks primarily to important landings of anchovies, a species of relatively fast recovery. This has been the case in 2010 as well, in spite of the lower anchovy fishing limit imposed by the government.
Fish production and extraction were volatile in the last 10 years, due to environmental factors and sustainable fishing regulation enacted by the government. Peru´s fishing sector is mainly focused on indirect human consumption. More than 86% of Peruvian aquatic production is directed to this subsector, which is mainly fishmeal production. Crude oil, also for indirect human consumption, is also important, with 13% of the total aquatic production. On the other hand, human direct consumption extraction accounts
2001 2002 2003 2004 2005 2006 2007 2008 2009 2010
Total 2,129.9 2,171.0 1,644.7 2,534.2 2,444.3 1,979.0 2,082.1 2,145.9 1,998.0 1,255.5
Direct Human Consumption 191.6 142.8 214.1 213.0 223.2 356.8 373.2 438.2 361.9 296.4
Canned 81.6 35.3 91.6 45.4 55.5 107.4 84.1 105.2 89.2 69.7
Frozen 1/ 83.6 86.0 99.8 144.1 145.6 228.4 269.9 313.3 255.6 211.0
Salted 1/ 26.4 21.5 22.7 23.5 22.1 21.0 19.2 19.7 17.1 15.7Indirect Human Consumption 1,938.3 2,028.2 1,430.6 2,321.2 2,221.1 1,622.2 1,708.9 1,707.7 1,636.1 959.1
Fishmeal 1,635.4 1,839.2 1,224.5 1,971.4 1,930.7 1,342.4 1,399.1 1,414.7 1,348.5 785.6
Crude oil 302.9 188.9 206.1 349.8 290.4 279.8 309.8 293.0 287.6 173.5
Table 26. Peru: Production of Aquatic Resources, 2001 - 2010 (Thousands of TMB)
1/ Includes continental fishing dataSource : DIREPRO.

50
for 14% of the total production. Frozen fish (9% of total) is the most important subsector, followed by canned (4%) and salted (1%) fish.
0
500
1,000
1,500
2,000
2,500
3,000
2001 2002 2003 2004 2005 2006 2007 2008 2009 2010
Graph 23. Peru: Production of Aquatic Resources, 2001- 2010(Thousands of TMB)
Total
Direct Human Consumption
Indirect Human Consumption
Source: DIREPRO.
The fishing production showed a 37% fall in the year 2010, due to lower temperatures in the Peruvian coasts, and tighter fishing quotas imposed by the government. These exogenous conditions had a stronger impact on the indirect human consumption fish production (-41%). The production of fishmeal (-42%) and crude oil (-39%) fell substantially, while direct human consumption (-18%) was also hit, but at a lower scale.
The internal sale of fisheries in Peru accounted for 29% of its whole production during the last 10 years. The consumption pattern in Peru was opposite to its production. Aquatic resources for direct human consumption represent 81% of the total sales between 2001 and 2010. This subsector was led by fresh fisheries (62% of total production), followed by canned (9%), frozen (8%) and salted (3%) fisheries.
2001 2002 2003 2004 2005 2006 2007 2008 2009 2010
Total 697.6 509.5 582.9 592.2 565.6 571.0 592.0 569.1 609.9 607.9
Direct Human Consumption 474.0 417.6 458.4 460.4 438.6 487.4 505.4 506.5 526.4 514.5
Canned 41.0 25.9 55.5 37.7 46.0 61.5 55.5 74.4 65.3 69.9
Frozen 23.5 33.1 27.3 33.4 54.7 29.9 43.6 41.9 61.9 96.9
Salted 21.7 17.3 15.4 14.6 14.5 14.6 12.6 13.6 14.1 16.0
Fresh 387.8 341.3 360.2 374.7 323.4 381.4 393.7 376.6 385.0 331.7Indirect Human Consumption 223.6 91.9 124.5 131.8 127.0 83.6 86.6 62.6 83.5 93.4
Fishmeal 91.8 46.7 43.7 53.6 66.4 25.4 20.7 20.8 36.7 25.3
Crude oil 131.8 45.2 80.8 78.2 60.6 58.2 65.9 41.8 46.8 68.1
Table 27. Peru: Internal Sale of Aquatic Products, 2001-2010 (Thousands of TMB)
1/ Includes continental fishing data
Source : INEI.

51
0100200300400500600700800
2001 2002 2003 2004 2005 2006 2007 2008 2009 2010
Graph 24. Peru: Internal Sale of Aquatic Products, 2001-2010
(Thousands of TMB)Total
Direct Human Consumption
Indirect Human Consumption
Source: INEI.
5.2.2 Main Products and Exports Peru is the foremost global exporter of fishmeal and fish oil, which is exported to more than 100 countries but mainly to China, Germany and Japan. However, Peru also exports other processed fish products such as cuttlefish, puffer fish and squid.
Peruvian fisheries’ exports averaged US$ 1.7164 million in the last 10 years. Fishmeal, the main export product, accounts for 66% of this amount, standing out as the main fishing export. Non-traditional exports account for 23% of exports in this sector during the last 10 years, averaging US$ 0.3953 million. This shows Peru’s fishing potential in the primary and in the non-traditional sectors, where further investment could not only be profitable, but create an impact on the fisheries sector. This is especially applicable to the non-traditional sector, where products with added value can be not only exported, but sold to the local market as well.
2001 2002 2003 2004 2005 2006 2007 2008 2009 2010
Total 1,133.6 1,066.6 1,031.5 1,388.9 1,634.4 1,775.5 1,965.9 2,423.8 2,209.7 2,534.2
Primary 926.2 892.6 821.3 1,104.2 1,303.6 1,335.4 1,461.6 1,797.4 1,684.8 1,884.3
Fishmeal 835.1 823.4 742.2 954.9 1,148.0 1,139.3 1,212.4 1,412.6 1,427.1 1,610.0
Crude oil 91.1 69.2 79.1 149.2 155.6 196.1 249.2 384.8 257.7 274.2
Non-traditional 207.4 174.0 210.2 284.7 330.9 440.1 504.3 626.4 524.9 649.9
Table 28. Peru: Export of Aquatic Products, 2001-2010 (millions of US$)
Source: SUNAT.

52
0
500
1000
1500
2000
2500
3000
2001 2002 2003 2004 2005 2006 2007 2008 2009 2010
Graph 25. Peru: Export of Aquatic Products, 2001-2010(millions of US$)
Total
Primary
Non-traditional
Source: SUNAT.
As the Graph 25 shows, Peruvian exports in this sector show an upward trend since 2003. The 2009 fall was due to two key reasons: the international financial crisis and non-favourable colder waters in the Peruvian shores. Investments in this sector indicate that this trend will continue to rise in the next years, subject to environmental conditions. In the last 10 years and in 2010 as well, the main primary fisheries exported were fishmeal and oil. Over the years, however, different products have been exported on the non-traditional side. In average, the most exported non- traditional goods exported in this sector were cuttlefish, puffer fish and squid (US$ 915 million), other molluscs and aquatic invertebrates, prepared or preserved (US$ 414 million), venere, frozen, dried, salted or in brine (US$ 247 million), shrimp tails (US$ 159 million) and other frozen fish fillets (US$ 137 million). However, in 2010, products like prepared and preserved anchovy, whole or in pieces, except chopped (US$ 21 million) have also been strongly exported.
5.2.3 Regulatory Environment Fishing regulation and environmental management follows international regulations, ensuring the use of fishing resources in harmony with the environment, as well as the sustainability of the marine species Peru offers. Sanitary Control The Fisheries Technological Institute (ITP for its name in Spanish) is one of the public institutions working with the Ministry of Production (PRODUCE), and runs the National Service of Fishing Sanity (SANIPES). This entity intends to achieve an efficient administration of fishing resources, and to establish procedures which promote and certify the quality of the fishing products in order to protect public health. For further information, visit the following webpage: http://www.itp.gob.pe/desarrollo-sanipes-procedimientos.php Anchovy Fishing Limits by Ship Anchovy is the main input for fish based goods for indirect human consumption (fishmeal for example). Establishing fishing limits seeks to improve conditions for the modernization and efficiency of the fishing activity. Furthermore, these limits aim to promote the sustainable development of this area as a source of food, jobs and

53
income, and assure a responsible management of the aquatic resources, preserving the environment and our biodiversity. PRODUCE will determine the Total Capture Limit at the beginning and end of the “Fishing Seasons” depending on the reports presented by the Peruvian Sea Institute (IMARPE). Every year, two fishing seasons will be determined by PRODUCE, institution which later will assign fishing quotas to each licensed fishing ship. In the case of artisanal fishing, or fishing in a lower scale, PRODUCE has set specific areas in which this kind of fishing can take place without being disrupted by industrial fishing. Tax Benefits For these companies (or any investor), there is a legal framework that promotes aquaculture development that includes income tax reductions (15% against usual 30%), advanced sales tax return for the production stage and suspension of payment for aquaculture rights. Furthermore, direct human consumption product exporters, which includes non-traditional fishing activities, benefit from a 5% FOB value tax drawback as compensation for customs tariffs on the import of some raw materials used in the production of the exported goods.
5.2.4 Perspectives, Advantages and Opportunities Peru has favourable geographical and weather conditions for the fishing industry, considering sea, rivers and lakes. This natural setting creates several opportunities to develop solid aquaculture projects. With 3,080 kilometres of seashore, 322 kilometres of sea boundary and zones with very ample continental platforms, Peru is a country with a wide range of territory to exploit and diverse marine species to develop:
Nº Species Number
1 Fish 7502 Molluscs 8723 Crustaceans 4124 Echinodermata 455 Seaweed 240
Total 2319
Table 29. Peru: Hidro-biological Resources
Source: PROINVERSION. Several other natural factors make the Peruvian seas privileged. One of them is an abundance of phytoplankton and zooplankton which allows fast growth or recovery of marine species. This allows industries to fish during most part of the year, and to ensure the future of their activities over the years. Also, two marine currents converge in the Pacific Ocean, just in the waters facing Peru. These are the cold water Humboldt Current, which runs southwest to northwest, and the warm water El Niño current, which flows north to south. These waters are part of the anti-cyclonic movement of the eastern part of the Southern Pacific Ocean and are characterized by slow-moving surface currents. This creates a system of water flows with seasonal variations. In addition, there 8 are abnormal irregular variations, principally the unusually hot periods referred to as ‘El Niño’, which diversifies marine wildlife along the Peruvian coasts.

54
Our continental waters are also excellent environments for investment because of their unique wildlife and flow. Continental environments, such as Lake Titicaca, the largest in South America, and the Amazon River, the largest and most important fresh water reserve, are just some examples of the several rivers and lakes which provide investment opportunities. The private sector plays an important role in the fishing industry. Companies in this sector are making important investments in the frozen and canned industry, focusing on fishmeal. The majority of processing plants have quality assurance HACCP certification and several of them have been awarded ISO certification. The private sector, including small fishermen, is provided with financial support. The National Fishing Development Fund (Fondepes) provides opportunities for credit and adequate infrastructure to artisan fishermen, so that they may perform their work in improved environmental and hygienic conditions. The artisanal or small-scale fisheries sector is also important. It is made up of small
vessels with a hold capacity of up to 32.6 m 3 . These small ships fish along the coast all year round and their catches are mainly for direct human consumption. There are around 200 fishing settlements involved in this activity along the Peruvian coast, which achieved to catch 721,000 tons of fish in 2008. Another clear opportunity is shown in the price of fishmeal over the last years. This price has had an upward tendency over the last 10 years, and it is expected to keep rising as other commodity prices. Fishmeal price reached US$ 1612.82 per metric tons in February 2011, a very beneficial advantage for producers.
0.0
0.5
1.0
1.5
2.0
2.5
mar
-01
Jan
2002
nov-
02
sep
-03
jul-0
4
ma y
-05
mar
-06
Jan
2007
nov-
07
sep
-08
jul-0
9
ma y
-10
Th
ou
san
ds
of U
S$
Graph 26. Fishmeal Price, March 2001 - February 2011
(US$ per metric tonne)
Source: INDEXMUNDI.
Feb. 2011: 1612.82
5.3 Tourism 5.3.1 General Evolution and Current Situation
2010 was a great year for Tourism in Peru. The country received almost 2.3 million tourists from all over the world, 7.4% more than in 2009 according to MINCETUR. This represents an important growth because before 2001 Peru was only able to attract less than a million tourists.
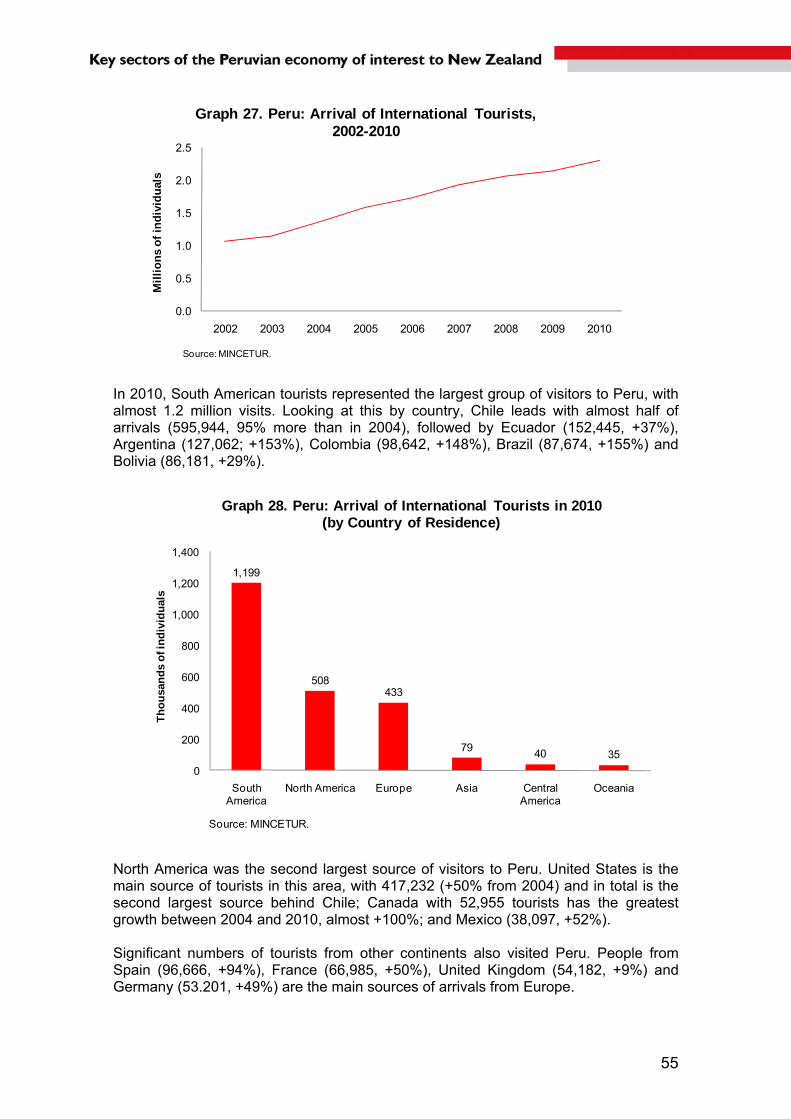
55
0.0
0.5
1.0
1.5
2.0
2.5
2002 2003 2004 2005 2006 2007 2008 2009 2010
Mil
lio
ns
of
ind
ivid
ual
s
Graph 27. Peru: Arrival of International Tourists, 2002-2010
Source: MINCETUR.
In 2010, South American tourists represented the largest group of visitors to Peru, with almost 1.2 million visits. Looking at this by country, Chile leads with almost half of arrivals (595,944, 95% more than in 2004), followed by Ecuador (152,445, +37%), Argentina (127,062; +153%), Colombia (98,642, +148%), Brazil (87,674, +155%) and Bolivia (86,181, +29%).
1,199
508433
7940 35
0
200
400
600
800
1,000
1,200
1,400
South America
North America Europe Asia Central America
Oceania
Th
ou
san
ds
of i
nd
ivid
ual
s
Graph 28. Peru: Arrival of International Tourists in 2010(by Country of Residence)
Source: MINCETUR.
North America was the second largest source of visitors to Peru. United States is the main source of tourists in this area, with 417,232 (+50% from 2004) and in total is the second largest source behind Chile; Canada with 52,955 tourists has the greatest growth between 2004 and 2010, almost +100%; and Mexico (38,097, +52%). Significant numbers of tourists from other continents also visited Peru. People from Spain (96,666, +94%), France (66,985, +50%), United Kingdom (54,182, +9%) and Germany (53.201, +49%) are the main sources of arrivals from Europe.

56
In the case of Asia, Japan (30,604, +3%), South Korea (10,157, +76%) and China (9,484, +90%) are leading. It is also worth highlighting the dynamism of India (from 989 to 3,526 arrivals in the period 2004-2010). New Zealand had a minor amount of arrivals in 2010, with 5,363 visits. This meant a 2% increase from 2009, and 84% increase from 2004. Monthly data on arrivals shows clear signs of seasonality. The first peak of visits occurs in the months of December and January. In December 2009, there were 193,674 arrivals and the next month recorded 205,578. This period coincides with the start of summer in southern hemisphere countries, and the holiday season of Christmas and New Year. The second peak occurs in July and August, coinciding with the summer holidays for students in the northern hemisphere. Thus, in July 2010 there were 227,724 tourists (the yearly peak), while in August were 202,606.
Graph 29. Peru: monthly arrival of international tourists
2007-2010
0
50,000
100,000
150,000
200,000
250,000
jan-
07
May
-07
Sep
-07
jan-
08
May
-08
Sep
-08
jan-
09
May
-09
Sep
-09
jan-
10
May
-10
Sep
-10
Source: MINCETUR.
Jul. 2007:
188,929
Jul. 2008:
207,437
Jan. 2010:
205,578
Jul. 2010:
227,724
This dynamism is the result of long term planning from the Peruvian State and the private sector. Both are working together to promote tourism in Peru, and these efforts are paying off. PROMPERU, the agency in charge of international promotion of exports, investments and tourism in Peru, has the objective to portrait Peru as a fashionable country, through the participation in major tourism fairs, exhibiting the strengths of the country (gastronomy for example), the publication of reports, among other efforts. In this sense, it is considered that new “Country Trademark” (MarcaPais) will boost the countries’ efforts in attracting tourists to Peru even further. PROMPERU has a Development Fund for the Promotion of National Tourist that was created to fund tourism promotion. In 2009 the fund exceeded S/. 102.6 million. PROMPERU has also launched the public school CENFOTUR, which supports the training of professionals in tourism. Also, there are currently more than 30 private schools which ensure the investor an adequate supply of trained personnel. Private investment has also played a key role, especially the establishment of hotel chains and the improvement of air transport connectivity. Excluding the city of Lima to emphasize the importance of the tourism sector to spread growth in other urban and rural areas, Peru now has over 3,000 rooms in 4 and 5 star hotels in the provinces,

57
while at the beginning of the decade we only had no more than 500. International and well-respected brands such as Orient Express, Westin, Hilton and Marriott have invested in the country, showing its great potential for tourism. In regard to air connectivity, Lima is the only Latin American city that is hub of two major airlines in the region: LAN and Avianca/Taca. Domestically, connectivity has also increased significantly: between Cusco and Lima today there are more than 20 flights per day. Peru excels as an excellent touristic destination, as it attracts numerous investors of this sector thanks to its millenary archaeological sites, its unique biodiversity and internationally famous gastronomy.
5.3.2 Touristic Profile PROMPERU has made a series of studies that point out important information about tourists visiting our country and internal regions. These studies have relevant results for possible investment in this sector.
5.3.2.1 Internal Tourism The most important reason that motivated Peruvian residents to travel for recreation in 2009 was to seek rest and relaxation. Another important reason was the desire to spend time with family and see new places. This motivation is greater than the search for fun, once valued by domestic visitors, especially in the younger segments. It should be noted that older tourists seek rest and relaxation, while the younger seek to discover new places.
Peru Lima Arequipa Trujillo Chiclayo Huancayo
Relaxation 46 47 43 42 45 38Travel with family 20 20 20 21 18 28Discovering new places 14 14 18 14 18 14Fun 7 7 4 6 7 6Touristic atractions 6 6 7 8 5 5Break the routine 5 5 4 7 6 7Discover new cultures 1 1 1 2 1 2Other 1 1 1 1 0 0
Table 30. Peru: Internal Travel Motivation in 2009, by City (%)
Source: PROMPERU. The average spending per trip by internal tourists is estimated at S/. 326 and the average length of these trips are six nights. The main funding source for these travels is savings. The accommodation most commonly used is hosting friends and family, whose use has increased from 45% in 2008 to 50% in 2009. The use of paid accommodation is also widely taken by vacationers, where it is appreciated that the use of hotels and hostels has been showing an increasing trend (2007: 35% vs. 2008: 40% vs. 2009: 45%), especially in medium and high socioeconomic levels. Lima is one of the regions that more demand has on national holidays (33%) especially by Lima residents themselves (36%) and Huancayo residents (37%), followed by residents form Ica (10%) and Arequipa (8%). Among the favourite activities for national holidays are shopping and nature tourism, a favourite for Lima residents themselves.

58
Naturally, each region has its own attractions, as in the case of Trujillo and Chiclayo in addition to shopping they are attracted to cultural tourism. For Arequipa, the sun and beach tourism and shopping are the most required, while for the Huancayo, nature tourism gets more preference. The demographic profile of domestic tourists is composed mostly of young people aged 18 to 34 years (66%), by people with higher education (73%). Also, 33% work in the private sector and 25% independently. More than half have children and almost all economically dependent.
5.3.2.2 International Tourists Coming to Peru for leisure and recreation is still the main reason for visits (61%) and more from the long distance markets, where markets like United Kingdom (87%), France (86%) and Japan (81%) were characterized by a greater participation in this activity.
Reason of visit %
Vacations 61
Business 15
Visiting family or friends 13
Conferences or congress 4
Health 3
Religious reasons 3
Education 1
Table 31. Peru: International Tourists Reasons for Visit in 2009 (%)
Source: PROMPERU.
Machu Picchu, as an attraction, remains the linchpin of the visits to Peru (62%), however, the Latin American market would be also beginning to become interested in visiting the city of Lima, in greater magnitude from Chile (34%) and Colombia (29%). The high-cost accommodations (4 and 5 star hotels) are more in demand by markets that emit greater flow of business travellers, as are the markets particularly Chile and Mexico in Latin America. In the long-distance markets, the Japanese remain the most inclined towards high-cost accommodation (61%). However, we should keep in mind that in the French market, the demand for this service is increasing, due to the use of "travel agents”.
Accomodation type %
4 or 5 star hotel 22
3 star hotel 38
1 or 2 star hotel 41
Family / friends house 16
Camping 8
Lodge 5
Family lodge 4
Rented appartment 1
Table 32. Peru: Accomodation Type Used by International Tourists in 2009 (%)
Source: PROMPERU.

59
The United Kingdom, Germany and France remain Europe's most lucrative markets in terms of spending levels in Peru, reporting expenditures over US$ 2,000 per person. In Latin America, Mexico and Brazil stand out as the markets which spend the most in Peru, despite having experienced some contraction in spending during 2009.
Average expenditure %
Less than US$ 500 36
US$ 500 to 999 22
US$ 1,000 to 1,499 17
US$ 1,500 to 1,999 11
US$ 2,000 to 2,499 6
US$ 2,500 or more 8
Average expenditure per tourist (US$) 1040
Table 33. Peru: International Tourists Expenditure in 2009 (%)
Source: PROMPERU. On the other hand, Lima is still the most visited city in Peru as the main point of entry and exit in the country, followed by the regions of the southern area (Cusco, Puno and Arequipa), which recorded a greater share of visits from the long distance markets. Meanwhile, region visits on the north (Trujillo, Chiclayo, Piura, Tumbes) have increased their share by 7% (in 2008 was 5%), placing Germany as the most interested market in the tourist offer of our country (15%). Madre de Dios is a region that keeps the interest in the markets in the United Kingdom and Canada, and it’s beginning to become even more attractive in the markets of Germany and France.
77.5
43.2
27.1
23.4
18.5
15.6
3.7
3.6
3.2
2.8
2.5
1.8
1.6
1.3
0 20 40 60 80 100
Lima
Cusco
Tacna
Puno
Arequipa
Ica
Madre de Dios
La Libertad
Ancash
Piura
Loreto
Lambayeque
Tumbes
Junín
Graph 30. Peru: Regions Visited by International Tourists in 2009 (%)
Source: PROMPERU.
Cusco City : 42%Machu Picchu : 42%Valle Sagrado : 31%
Islas de los Uros : 19%Taquile : 14%Amantani : 7%
Arequipa City : 18%Cañón del Colca : 13%Chivay : 11%
Nazca : 13%Paracas : 9%

60
The most requested activity in Peru by foreign tourists is still around Pre-Colombian culture (archaeological sites and visits to native communities, for example) and contemporary and colonial sights (churches, museums historic buildings) the latter becoming more relevant in Latin American markets presumably by the involvement of business travellers. Complementary activities could include experiencing and appreciating natural areas and the diversity of our flora and fauna. Markets such as Canada, UK, Germany and France, have carved an interest in trekking. Finally the experience in Peru generated a high level of satisfaction (97%) which implies an interesting level of recommendation to others to visit Peru (89%).
Activities %
Cultural 83
Nature 48
Adventure 19
Beach 10
Source: PROMPERU.
Table 34. Peru: Touristic Activities Registered in 2009 (%)
Satisfaction %
Totally satisfied 57
Satisfied 40
Not satisfied nor insatisfied 2
Insatisfied 1
Totally insatisfied -
Table 35. Peru: Satisfaction in International Tourists in 2009 (%)
Source: PROMPERU.
5.3.3 Main Attractions and Opportunities Peru as a tourist destination has been recognized by the most prestigious competitions and international media. Nine Peruvian attractions are classified by UNESCO as a cultural and natural heritage of mankind. The citadel of Machu Picchu was named one of "The Seven Modern Wonders of the World" in the contest via Internet organized by the New Open World Corporation. Country Brand Index has pointed out Peru as the world's third destination in inbound tourism and the consultancy agency INMARK of Spain indicates that Peru is the most authentic destination in Latin America. The Economist has recognized the Peruvian cuisine as one of the ten best in the world. Also, The Latin American Travel Association (LATA), in the World Travel Market (WTM) in London, recognized PROMPERU as the Best Tourist Office in Latin America, the Reserva Amazónica Inkaterra (Inkaterra Amazonic Reserve) (Cusco) as the best Forest Lodge, Aqua Expeditions (Amazon River - Loreto) as the Best Luxury Cruise and the Orient Express chain (for its hotels in Lima, Cusco and Arequipa) as Best Hotel Chain.
5.3.3.1 Cultural Attractions Having been the centre of the Inca Empire and then the Viceroyalty of Spain in South America, the rich history and significant archaeological monuments do not cease to amaze visitors and even the researchers. The following are the most famous ones:

61
The Citadel of Caral, the oldest of America (over 5,000 years old), located to the north of Lima.
Archeological pre-Inca cultures such as the Nazca Lines, the complex Chavin de Huantar, the Huaca del Sol and Luna, the mud citadel of Chan Chan, the Royal Tombs of the Lord of Sipan and the walled city of Kuelap.
Among the Inca archaeological sites, the citadel of Machu Picchu and the fortress of Sacsayhuaman, both in the city of Cusco, capital of the Inca Empire.
The Spanish heritage can be identified in the colonial architecture of the main squares, mansions, balconies, churches and convents, many of which have been named the nation's patrimony.
5.3.3.2 Natural Attractions
Peru is considered a mega-diverse country which makes it a unique destination for nature tourism or ecotourism. The Peruvian territory is home to 1,730 species of birds and more than 3,000 varieties of orchids. There are also 330 species of amphibians, 462 species of mammals and 25,000 species of plants. A diversity of scenery ranging from beaches on the Pacific Coast to the Amazon Rain Forest, through the Andes with peaks over 6,000 meters. Also, Peru has 8 million hectares of protected natural areas including National Parks, as the Manu, Huascaran and Rio Abiseo and National Reserves as Pampas Galeras, Titicaca and PacayaSamiria.
5.3.3.3 Lima as an Attraction Lima, Peru's capital city has the highest quality services, ready to receive people from all over the world. This transformation has happened due to its geographical position, its population of nearly 9 million people, its cultural heritage and economic activity (with over 50% of GDP). Its strategic location in the heart of the South American Pacific makes it an important regional hub. It has a modern international airport, voted the best in South America, from where you can reach in less than 90 minutes any place in the country and in few hours the main cities in South America.
5.3.3.4 Peruvian Cuisine
There is an important appreciation for Peruvian cuisine by foreign tourists who visit us, highlighting its good flavor. It also stands quality and variety of dishes .The Ceviche is the flagship in representing our cuisine, in the view of tourists. They are also very attractive fish dishes and seafood. On the other hand, the potential demand in Europe (Spain and UK) is interested by cuisine of the countries they visit. And there is some interest in travelling to Peru to learn cuisine among its attractions.
For cultural tourists who visit Peru, gastronomy gives identity to a country, is of their culture and customs of the population. However, it is important to note that the infrastructure of the restaurants should be improved as well as certain services such as restrooms and speed of service. Some tourists say it is not the same quality in all of Peru. 93% of international tourists pointed out that Peruvian cuisine covered their expectations.
Good flavor is the most appreciated element for Peruvian cuisine (64%), and secondly, the variety of dishes (29%). From the point of view of foreign tourists, the Ceviche is the most representative dish of Peru (55%), followed, even though the percentages very distant, by dishes such as Lomo Saltado (13%) and Cuy Chactado (11%). As

62
mentioned above, 92% of foreign tourists are willing to recommend to family and friends to visit Peru and sample the local gastronomy.
5.4 Education and Training
5.4.1 General Evolution Between 1996 and 2010, the number of universities has grown from 57 to 100 in total (see Graph 31). While the number of public institutions grew by 25%, the private universities increased 124%.
28 29
35
65
0
10
20
30
40
50
60
70
Public Private
Graph 31. Number of Universities by Type(1996 and 2010)
1996 2010
Source: INEI.
Also the number of undergraduate students more than doubled and the annual increase was 6.24%. The total of post-graduate students increased more than 5 fold in these 14 years, with an average annual increase of 12.51%.
336
783
10.81856.358
0
100
200
300
400
500
600
700
800
1996 2010
Th
ou
san
ds
of
stu
den
ts
Graph 32. Number of Undergraduate Students by Census Year (1996 and 2010)
Undergraduate
Post-graduate
Source: INEI.

63
5.4.1.1 Non-university Higher Education In 2010 about 12.6% of the economically active population (EAP) was instructed in non-university higher education17. According to Law N° 29394, institutes and colleges are permitted institutions for the training of technical professionals and technicians in all fields of knowledge, art, culture, science and technology. The supply is large, but the quality of education in most cases is very poor, so these technical training and superior non-university instruction face several problems. Many of the technological colleges (IST) do not have trained teachers with pedagogical titles in their specialties, and students develop their practices with equipment in poor conditions. According to the type of education they provide, the following are some of the well regarded institutes in Peru:
Business • ESAN http://www.esan.edu.pe/ • IPAE http://www.ipae.edu.pe/
Music • Lima Conservatory http://www.conservatoriodelima.edu.pe/index00.html
Cuisine • Le Cordon Bleu http://www.cordonbleuperu.edu.pe/
Fashion Design • CEAM http://www.ceam.edu.pe/ • Chio Lecca http://www.chio-lecca.edu.pe/p_chio/ Tourism • CENFOTUR http://www.cenfotur.edu.pe/ Various • SENATI http://www.senati.edu.pe/Inicio.htm • TECSUP http://www.tecsup.edu.pe/webuds/web/principal • CIBERTEC http://www.cibertec.edu.pe/ • SENCICO http://www.sencico.gob.pe/index.html The Ministry of Education noted that productive activities in agriculture, construction, energy, industry, mining, fishery and services have an unmet demand for technicians, and there are not sufficient institutes and training centres that offer these specialties.
17 Source: INEI National Household Survey of Living Conditions and Poverty, 2009.

64
Educational level Total Public Private Urban RuralTotal 1,120 487 633 1,092 28
Pedagogical 320 120 200 313 7Technology 759 333 426 738 21
Artistic 41 34 7 41 0
Table 36. Number of Educative Institutions of Non-University Higher Education in 2010*
Type Area
* This is preliminary information. ** Includes adult education. *** Includes ocupational education.Source: Ministry of Education. About 38.9% of the economically active population (EAP) has only completed high school18, so in the most of the cases this labor force looks for low cost training. The Ministry of Labor states that 19.11% of job vacancies demand technical work, which implies running processes and work procedures with limited autonomy, so they require a Professional Degree as a certification of their capacities. On the other hand, about 36.47% of job vacancies demand operational work, which consists in performing tasks that involve simple default and basic knowledge of process operations. For this purpose, it is not necessary to have a Professional Degree, a certification ensuring labor and business recognition19 is needed. Graph 33 shows the labor demand of the main economic sectors, which should be considered in the direction that the training of the labor supply should.
0.6%
1.0%
1.2%
1.3%
1.4%
1.8%
2.0%
2.3%
3.0%
5.5%
5.6%
6.2%
8.0%
8.5%
14.9%
41.8%
0.0% 5.0% 10.0% 15.0% 20.0% 25.0% 30.0% 35.0% 40.0% 45.0%
Retail
Electricity, gas and water
Agriculture
Household
Mining
Construction
Capital goods industry
Restaurants and hotels
Livestock
Transport, storage and communications
Textile and clothing
Wholesale
Financial intermediation
Intermediate goods industry
Consumption goods industry
Community, social and recreation services
Graph 33. Peruvian Labor Demand, by Economic Sector (%)
Source: Data Base of the National Employment Service, 2010.
18 Source: INEI National Household Survey of Living Conditions and Poverty, 2009. 19 This information is processed and analyzed in the following website: www.empleosperu.gob.pe. The National Employment Service is responsible of linking job seekers with companies that require personnel, and all this information is contained in the mentioned webpage.

65
5.4.1.3 Undergraduate Studies In 2010, there were 782,970 undergraduate students in Peru, of which 309,175 attended public universities (39.5% of the total) and 473,795 attended private ones (60.5% of the total), as showed in Graph 34. Only Lima showed a concentration of students (312,409 or 39.9% of the total). About 62.8% of undergraduate students come from public educational institutions, whereas 36.4% come from private ones (see Graph 36).
Public39.5%
Private60.5%
Graph 34. % of Students by Type of University in 2010
Source: INEI.
Ancash4.0% Arequipa
6.9%Cusco4.0%
Huanuco2.5%
Ica2.9%
Junin4.4%
La Libertad5.8%
Lambayeque4.2%
Lima and Callao41.7%
Piura4.4%
Puno5.3%
Others14.0%
Graph 35. % of Students by Peruvian Region in 2010
Source: INEI.
Public62.8%
Private36.4%
Others0.8%
Graph 36. % of Undergraduate Students by Type of Educative Institution Where High School Was
Ended in 2010
Source: INEI.
About 54% of students in private universities come from public educational institutions and 44.9% come from private ones (see Table 36).
Total Men Women Total Men Women Total Men Women Total Men Women
TOTAL 782970 491689 249082 242607 284729 147286 137443 6059 3496 2563 487 276 211100.0 62.8 50.7 49.3 36.4 51.7 48.3 0.8 57.7 42.3 0.1 56.7 43.3
PUBLIC 309175 235629 131260 104369 71781 41669 30112 1587 1057 530 178 107 71100.0 76.2 55.7 44.3 23.2 58.1 41.9 0.5 66.6 33.4 0.1 60.1 39.9
PRIVATE 473795 256060 117822 138238 212948 105617 107331 4472 2439 2033 309 169 140100.0 54.0 46.0 54.0 44.9 49.6 50.4 0.9 54.5 45.5 0.1 54.7 45.3
SOURCE: INEI.
None Schooling OthersTable 37. Type of Educative Institution Where High School Was Ended and Sex in 2010
Type of University
TotalState Private
In 1996, 76% of undergraduate students lived with their parents. In 2010, only 72.2% did. A clear majority of college students (more than 90%) have in their homes the basic sanitary services, like water, electricity and drainage.
The most noticeable disparities in living conditions at home of undergraduate students remain in some specific services, e.g. in the access to landline telephone (49.6% of

66
students in private universities and 29.8% in public ones have this service) and internet (65.5% of students in private universities and 47.2% in public universities). According to the Educational Census of 201020, about 48.5% of undergraduate students in Peruvian private universities in general state that they speak English, while in Lima this percentage is 61.2%. They learn the language with their own resources. The Peruvian Government does not have any policy that promotes English language yet.
In the same way, computing knowledge has increased significantly among these students. In 2010, 86.6% of the total reported this capacity, while in 1996 only 50.6% did.
Only 2.8% of the total students in the country receive remittances from abroad, and they use 86.2% of them to pay for their education. Also 30.1% in public universities work, while in private ones 34.4% do. In terms of the most popular study programmes, in 2010 Business Administration ranks first (see Table 37), due to recent economic development that has led the emergence of micro and small business.
Careers Number of students Carreers Number of students
Education 44,818Business
Administration71,681
Law 29,476 Law 70,861Accounting 27,059 Accounting 68,241
Administration 20,814 Systems Engineering 46,816
Economics 14,268Primary and
secondary education40,434
Systems Engineering
14,134 Civil Engineering 37,962
Nursing 12,321 Medicine 37,958Human
Medicine12,321 Nursing 31,755
Civil Engineering
10,709 Industrial Engineering 31,442
Industrial Engineering
10,139 Agronomy 29,790
Total 196,057 Total 466,940
Table 38. Groups of Most Demanded Careers in Undergraduate Students (1996 and 2010)
Source: INEI.
20101996
On the other hand, the most important factor considered when choosing a university is the prestige (see Graph 37), because of the greater job opportunities provided by a more prestigious university.
20 The complete results would be provided soon in the following website: http://www.inei.gob.pe/ (refer to the “Resultados II Censo Nacional Universitario 2010” link on the left side).

67
54
14.4
10.5
16.9
4.1
54.3
14.313.2 15
3.2
53.8
14.5
8.8
18.1
4.8
0
10
20
30
40
50
60
70
80
University prestige Only University with the specialty
wanted
Proximity to the residence
Better economic prospects
Others
Graph 37. % of Undergraduate Students, According the Main Aspect Influencing the College Choice
(1996 and 2010)
Total
Public
Private
Source: INEI.
5.4.1.4 Exchange Programs There are student exchange programs already in implementation in Peru; however, there are a lot of opportunities to be exploited yet because of the increasing interest of Peruvian students. Private universities have introduced agreements with similar institutions elsewhere in the world, building networks for students to choose the destination country where they want to go through during a semester. Some of these networks are: - Network of macro universities in Latin America and the Caribbean http://www.redmacro.unam.mx/
- Laureate International Universities http://www.laureate.net/ Students can decide the destination of their exchange program; there are many options according to their preferences and economic possibilities (because there is an expenditure associated with the maintenance during the exchange period). For obvious reasons, an exchange program with Europe as a destination is more expensive that the ones that are within America. There are also other continents and countries included, depending on the university and its networks. In 2010, only 3.1% of students in public universities and 5.3% in private ones went to other foreign cities. Study scholarships in Peru, are not very common, considering that in private universities only 2.2% of the students reported to have received one. Moreover, about 30.8% of this total was given to the students by private companies and 6.6% by international institutions.

68
5.4.1.5 Post-graduate Studies In 2010, there were 56,358 post-graduate students in Peru, 24,591 attending public universities and 31,767 private ones. About half of them were 35 years old or older. The participation of graduate students who work at the same time has increased by almost 9 percentage points between 1996 and 2010, going from 79.2% to 88.1%. Of total graduate students, the highest percentage (about 37.6% of the total) is interested in directing their thesis projects in the education area. About 86.9% of graduate students finance their studies with their own resources; only 3.2% of the students in private post-graduate faculties are financed by the company they work in while, in the case of students in public schools, only 2.1% received this type of financing. Also, according to the census, approximately a third of undergraduate students in both private and public universities are considering the alternative to migrate abroad when they finish their studies, mainly because they want to continue postgraduate studies (see Table 38). A comprehensive study21 has not been developed which provides figures on where this students go or their personal reasons for their choice of destination, but one can think that both criteria vary depending on the type of study they are looking for.
Type of University and place when classes are received Total
Thinking of Emigrating
For Other Postgraduate
StudiesBetter Job
Opportunities
Better Economic Prospects
There is No Work in
PeruPersonal Reasons Others
Not thinking of
Emigrating
TOTAL 100.0 60.8 64.9 47.8 38.4 3.4 15.4 0.2 39.2
PUBLIC 100.0 61.8 64.4 47.5 38.4 3.9 14.0 0.2 38.2
PRIVATE 100.0 60.2 65.3 48.0 38.4 3.0 16.3 0.3 39.8
SOURCE: INEI.
Reason to migrate abroad
Table 39. % of Undergraduate Students by Reason to Migrate Abroad in 2010
The same happens with about the third part of postgraduate students: they are thinking in migrating to another country, mainly because they want to continue their post-graduate studies and because of better job opportunities (see Table 39).
Type of University and place when classes are received Total
Thinking of Emigrating
For Other Postgraduate
StudiesBetter Job
Opportunities
Better Economic Prospects
There is No Work in
PeruPersonal Reasons Others
Not thinking of
Emigrating
TOTAL 100.0 33,4 66.7 36.9 28.9 3.3 11.7 0.4 66.6
METROPOLITAN LIMA 100.0 37.1 68.7 36.9 29.4 3.7 10.7 0.3 62.9
REST OF THE COUNTRY 100.0 30.6 64.8 36.9 28.4 2.9 12.7 0.5 69.4
SOURCE: INEI.
Reason to migrate abroad
Table 40. % of Postgraduate Students by Reason to Migrate Abroad in 2010
The postgraduate studies inside Peru supply is limited, especially with regard to sciences and medicine, study areas that need constant updating and being at the forefront of knowledge and technology. That is the main reason why undergraduate students consider that the academic level and the preparation for the working life that the Peruvian alternatives for postgraduate studies provide are lower than foreign ones. In addition, higher positions in important companies tend to demand this kind of higher education.
21 It has been discussed the idea of collecting this information but there is not still a particular study.

69
Considering that Peru is still a developing country, there are scholarships that provide Peruvian professionals the opportunity to study abroad. Some international institutions in this area are:
- Peruvian Institute of Educational Development www.ipfe.org.pe
- AusAID http://www.ausaid.gov.au/
- Technological Institute of Superior Studies of Monterrey (ITESM) www.educoas.org
- Fulbright http://becas.fulbrightperu.info/ - New Zealand Aid Programme http://www.aid.govt.nz/scholarships/
Also, there are other kinds of scholarships.The Ministry of Education of Peru provides the contact and the main information of how to obtain scholarships through the Office of Scholarships and Student Loans22. Today there are almost fifty possibilities of courses lasting a few months, offered by studying institutions such as the following ones:
- Egyptian Centre for International Agriculture This institution provides courses mainly about soil and water management, pisciculture, rural development. - International Cooperation Agency of the Government of Japan (JICA23) It offers studies in Rural Development by Agricultural Promotion, Strengthening the Export Competitiveness of Small and Medium Sized Coffee Producers and Tourism Promotion and Marketing.
- Center for Earth Resources Observation and Science (EROS) They teach New Technologies in the Development of Space Geoservices for Better Development Planning of Mesoamerica and the Caribbean.
- International Cooperation Agency of Thailand (TICA) The course content that is actually offered is Crop Simulation Modelling and Impacts of Climate Change on Agricultural Production Systems.
- Center for Financial Studies in Spain (CEF) There are different types of programs, including MBA and different masters.
5.4.2 Regulatory Environment and Incentives
The National Assembly of Rectors (ANR in Spanish, http://www.anr.edu.pe/portal/index.php) is an independent public body set up by the Rectors of public and private universities that manages the coordination and guidance
22 OBEC website: http://www.minedu.gob.pe/obec/. 23 JICA website: http://www.jica.go.jp/english/.

70
of all university activities in the country. It is an independent body, according to Law Nº23733 and other applicable laws. The National Council for Authorization to Operate Universities (in Spanish, CONAFU, http://www.anr.edu.pe/conafu/) is an autonomous organ of the National Assembly of Rectors, created by Law Nº26439, that has the authority to evaluate the projects and operating license applications for new public and private universities, whatever their legal regime is nationwide. This institution issues resolutions authorizing or denying interim operation upon verification of effective compliance with the requirements and conditions. In regard to matters with foreign countries, the General Directorate of International Relations and Cooperation17 programs, implements, supervises and evaluates the activities to be held with national and international agencies. Universities’ quality in Peru is certificated by CONEAU (www.coneau.gob.pe), according to Law Nº28740. In addition, the Law on Private Educational Institutions (Nº 26549) specifies that to obtain the operation permit, the concerned has to submit an application, as an affidavit, stating: 1. Name and address, and identification of the owner; 2. Information on levels and types of educational services the school will cover; 3. Summary of the principles and teaching methodology; 4. Number of students likely to work and sections; 5. Name of Director and Board members, if applicable; 6. Project Organization and Rules of Procedure, and 7. Inventory of equipment and goods that will have the school to commence business. The report also requires certification of an architect or civil engineer on the adequacy of the facilities in which would the institution will operate. These are all the legal and administrative requirements and the competent authority will issue the resolution that approves or denies the registration in no more than 60 calendar days. About the plans and programs offered by the institutions, they could be independently developed. It is important to mention that the authorization of operation does not exempt the educational institutions from obtaining the respective municipal licenses, related, inter alia, to support appropriate use and hygiene, health and safety conditions. Peruvian government aims to modernize the education system and expand the range and coverage. This is the reason of the existence of Legislative Decree Nº 882, which establishes the Law for Promoting Investment in Education. This law allows any natural or legal person to offer private education, including the right to establish, promote, conduct and manage private educational institutions, with or without financial gain. In regard to tax provisions, private educational institutions shall be governed by the rules of the General Income Tax.
5.4.3 Main Companies and Projects/Opportunities There are 35 public universities and 65 private ones in Peru, which make a total of 628 faculties that offer 1,595 professional careers. In terms of the opportunities to studying abroad, there are companies specialized in advising people in addition to the meetings and conferences at the same universities. These organizations explain the candidates about the universities or institutes, careers, the application process and even the immigration procedure to follow. They also offer

71
financing options by contacting them with credit institutions. The major companies providing this service are described below. Australia - Bridge Blue. http://www.enaustralia.com/ - Latino Australia Education. http://www.latinoaustralia.com/ - Study in Australia. http://studyinaustralia.gov.au/sia/es/home.htm - Estudiar Australia. http://www.estudiaraustralia.com/ - AMES. http://studyoz.com/education/index.php?lang=es Canada, United States and other - Information Planet. http://estudiarencanada.pe/ - Consulate Peru Montreal. http://www.consuladoperumontreal.com/ - Intered. http://www.intered.com.pe/ - Education First. http://www.ef.com.pe/ The operations of these companies consist of providing comprehensive advice to those people interested in living and/or studying abroad. The countries have to show clearly their attractiveness as a potential destination for living and studying. Companies offer a list of universities and institutions to carry out studies, as well as all the help needed to apply. This involves migration agents’ advice, as well as the contact with financial institutions that can provide achievable alternatives. The diffusion of these advantages is done through their webpages, conferences and visiting schools directly.
5.5 Mining
According to the U.S. Geological Survey (USGS), Peru is the third country with the largest reserves of gold, silver, copper and zinc in the world, therefore an attractive destination for mining exploration.
5.5.1 General Evolution and Current Situation Mining represents 5% of GDP and 61% of Peruvian exports. It is also a source of employment for 629,880 people and contributes 27% of the Peruvian tax income. Given the international high prices, the Ministry of Energy and Mines (MINEM) estimates the investment portfolio for the next years in US$ 42,451 million. Another important characteristic of Peruvian mining is that it is polymetallic. Peru has important reserves and produces gold, silver, copper, zinc, among others.
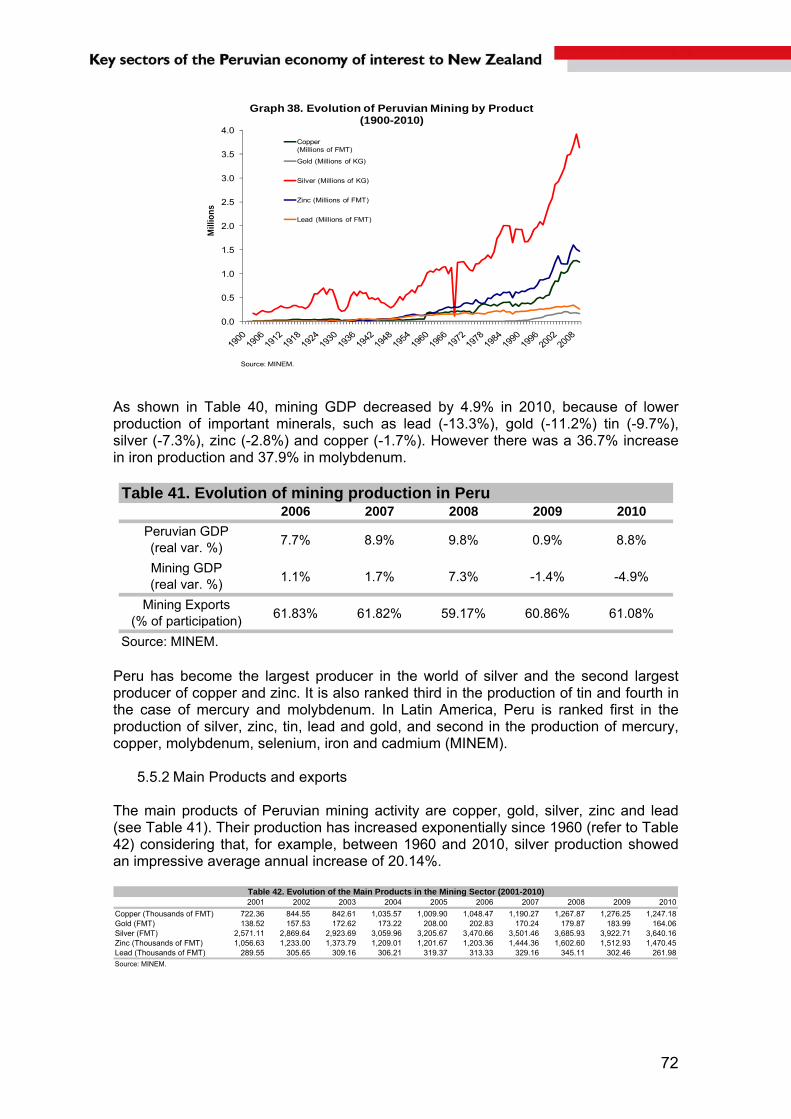
72
0.0
0.5
1.0
1.5
2.0
2.5
3.0
3.5
4.0
Mill
ion
s
Graph 38. Evolution of Peruvian Mining by Product (1900-2010)
Copper (Millions of FMT)
Gold (Millions of KG)
Silver (Millions of KG)
Zinc (Millions of FMT)
Lead (Millions of FMT)
Source: MINEM.
As shown in Table 40, mining GDP decreased by 4.9% in 2010, because of lower production of important minerals, such as lead (-13.3%), gold (-11.2%) tin (-9.7%), silver (-7.3%), zinc (-2.8%) and copper (-1.7%). However there was a 36.7% increase in iron production and 37.9% in molybdenum.
2006 2007 2008 2009 2010
Peruvian GDP(real var. %)
7.7% 8.9% 9.8% 0.9% 8.8%
Mining GDP(real var. %)
1.1% 1.7% 7.3% -1.4% -4.9%
Mining Exports(% of participation)
61.83% 61.82% 59.17% 60.86% 61.08%
Table 41. Evolution of mining production in Peru
Source: MINEM. Peru has become the largest producer in the world of silver and the second largest producer of copper and zinc. It is also ranked third in the production of tin and fourth in the case of mercury and molybdenum. In Latin America, Peru is ranked first in the production of silver, zinc, tin, lead and gold, and second in the production of mercury, copper, molybdenum, selenium, iron and cadmium (MINEM).
5.5.2 Main Products and exports The main products of Peruvian mining activity are copper, gold, silver, zinc and lead (see Table 41). Their production has increased exponentially since 1960 (refer to Table 42) considering that, for example, between 1960 and 2010, silver production showed an impressive average annual increase of 20.14%.
2001 2002 2003 2004 2005 2006 2007 2008 2009 2010
Copper (Thousands of FMT) 722.36 844.55 842.61 1,035.57 1,009.90 1,048.47 1,190.27 1,267.87 1,276.25 1,247.18Gold (FMT) 138.52 157.53 172.62 173.22 208.00 202.83 170.24 179.87 183.99 164.06Silver (FMT) 2,571.11 2,869.64 2,923.69 3,059.96 3,205.67 3,470.66 3,501.46 3,685.93 3,922.71 3,640.16Zinc (Thousands of FMT) 1,056.63 1,233.00 1,373.79 1,209.01 1,201.67 1,203.36 1,444.36 1,602.60 1,512.93 1,470.45Lead (Thousands of FMT) 289.55 305.65 309.16 306.21 319.37 313.33 329.16 345.11 302.46 261.98
Table 42. Evolution of the Main Products in the Mining Sector (2001-2010)
Source: MINEM.
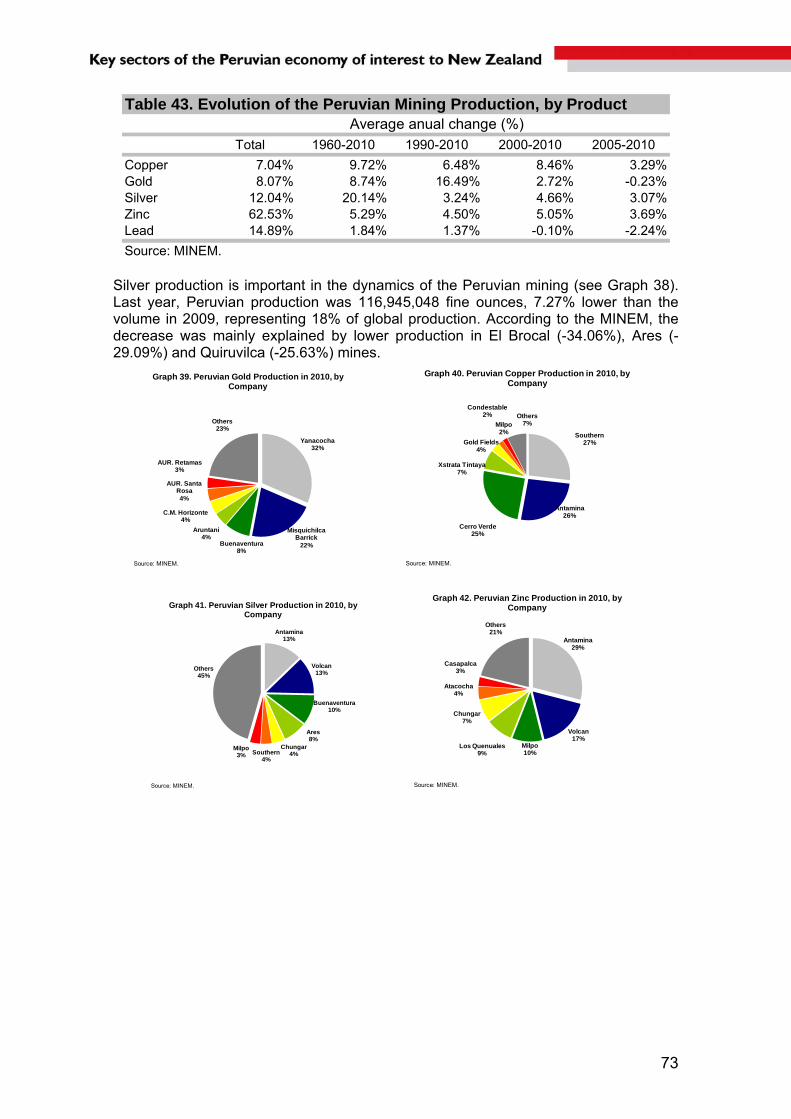
73
Total 1960-2010 1990-2010 2000-2010 2005-2010
Copper 7.04% 9.72% 6.48% 8.46% 3.29%Gold 8.07% 8.74% 16.49% 2.72% -0.23%Silver 12.04% 20.14% 3.24% 4.66% 3.07%Zinc 62.53% 5.29% 4.50% 5.05% 3.69%Lead 14.89% 1.84% 1.37% -0.10% -2.24%
Average anual change (%)Table 43. Evolution of the Peruvian Mining Production, by Product
Source: MINEM. Silver production is important in the dynamics of the Peruvian mining (see Graph 38). Last year, Peruvian production was 116,945,048 fine ounces, 7.27% lower than the volume in 2009, representing 18% of global production. According to the MINEM, the decrease was mainly explained by lower production in El Brocal (-34.06%), Ares (-29.09%) and Quiruvilca (-25.63%) mines.
Yanacocha32%
Misquichilca Barrick
22%Buenaventura8%
Aruntani4%
C.M. Horizonte4%
AUR. Santa Rosa4%
AUR. Retamas3%
Others23%
Graph 39. Peruvian Gold Production in 2010, by Company
Source: MINEM.
Southern27%
Antamina26%
Cerro Verde25%
Xstrata Tintaya7%
Gold Fields4%
Condestable2%
Milpo2%
Others7%
Graph 40. Peruvian Copper Production in 2010, by Company
Source: MINEM.
Antamina13%
Volcan13%
Buenaventura10%
Ares8%
Chungar4%Southern
4%
Milpo3%
Others45%
Graph 41. Peruvian Silver Production in 2010, by Company
Source: MINEM.
Antamina29%
Volcan17%
Milpo10%
Los Quenuales9%
Chungar7%
Atacocha4%
Casapalca3%
Others21%
Graph 42. Peruvian Zinc Production in 2010, by Company
Source: MINEM.

74
Volcan19%
Chungar9%
Corona8%
Los Quenuales7%
Milpo7%Raura
5%
El Brocal5%
Others40%
Graph 43. Peruvian Lead Production in 2010, by Company
Source: MINEM.
Since 2006, mining has represented an average of 62% of Peruvian total exports, reaching a record high of more than US$ 21 billion in 2010 (see Graph 44). In this, copper and gold were the products that registered the highest exported values, with 35% and 29% of the total, respectively.
Graph 44. Exports of Peruvian Mining Industry(2000-2010, Millions of US$)
3,220 3,205 3,8094,690
7,124
9,790
14,735
17,23818,657
16,361
21,723
0
5,000
10,000
15,000
20,000
25,000
2000 2001 2002 2003 2004 2005 2006 2007 2008 2009 2010
Source: MINEM.
Gold36%
Copper Ores and Concentrates
28%
Cathodes and Sections of
Refined Copper Cathodes
12%
Zinc Ores and Concentrates
7%
Lead ores and concentrates
6%
Others11%
Graph 45. Main Products Exported of the Mining Sector in 2010
Source: SUNAT.
China19%
Switzerland18%
Canada13%United States
11%
Japan7%
Others32%
Graph 46. Main Destinations of Mining Exports in 2010
Source: SUNAT.
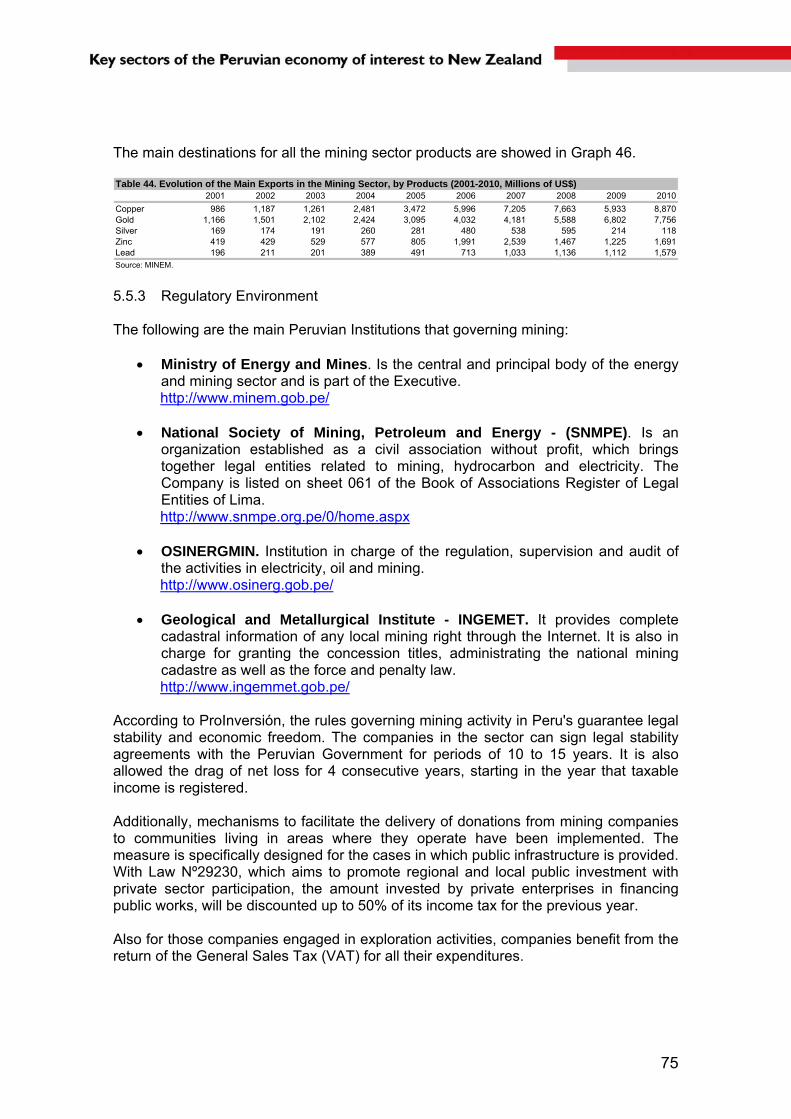
75
The main destinations for all the mining sector products are showed in Graph 46.
2001 2002 2003 2004 2005 2006 2007 2008 2009 2010
Copper 986 1,187 1,261 2,481 3,472 5,996 7,205 7,663 5,933 8,870Gold 1,166 1,501 2,102 2,424 3,095 4,032 4,181 5,588 6,802 7,756Silver 169 174 191 260 281 480 538 595 214 118Zinc 419 429 529 577 805 1,991 2,539 1,467 1,225 1,691Lead 196 211 201 389 491 713 1,033 1,136 1,112 1,579
Table 44. Evolution of the Main Exports in the Mining Sector, by Products (2001-2010, Millions of US$)
Source: MINEM. 5.5.3 Regulatory Environment The following are the main Peruvian Institutions that governing mining:
Ministry of Energy and Mines. Is the central and principal body of the energy and mining sector and is part of the Executive. http://www.minem.gob.pe/
National Society of Mining, Petroleum and Energy - (SNMPE). Is an
organization established as a civil association without profit, which brings together legal entities related to mining, hydrocarbon and electricity. The Company is listed on sheet 061 of the Book of Associations Register of Legal Entities of Lima. http://www.snmpe.org.pe/0/home.aspx
OSINERGMIN. Institution in charge of the regulation, supervision and audit of
the activities in electricity, oil and mining. http://www.osinerg.gob.pe/
Geological and Metallurgical Institute - INGEMET. It provides complete cadastral information of any local mining right through the Internet. It is also in charge for granting the concession titles, administrating the national mining cadastre as well as the force and penalty law. http://www.ingemmet.gob.pe/
According to ProInversión, the rules governing mining activity in Peru's guarantee legal stability and economic freedom. The companies in the sector can sign legal stability agreements with the Peruvian Government for periods of 10 to 15 years. It is also allowed the drag of net loss for 4 consecutive years, starting in the year that taxable income is registered. Additionally, mechanisms to facilitate the delivery of donations from mining companies to communities living in areas where they operate have been implemented. The measure is specifically designed for the cases in which public infrastructure is provided. With Law Nº29230, which aims to promote regional and local public investment with private sector participation, the amount invested by private enterprises in financing public works, will be discounted up to 50% of its income tax for the previous year. Also for those companies engaged in exploration activities, companies benefit from the return of the General Sales Tax (VAT) for all their expenditures.
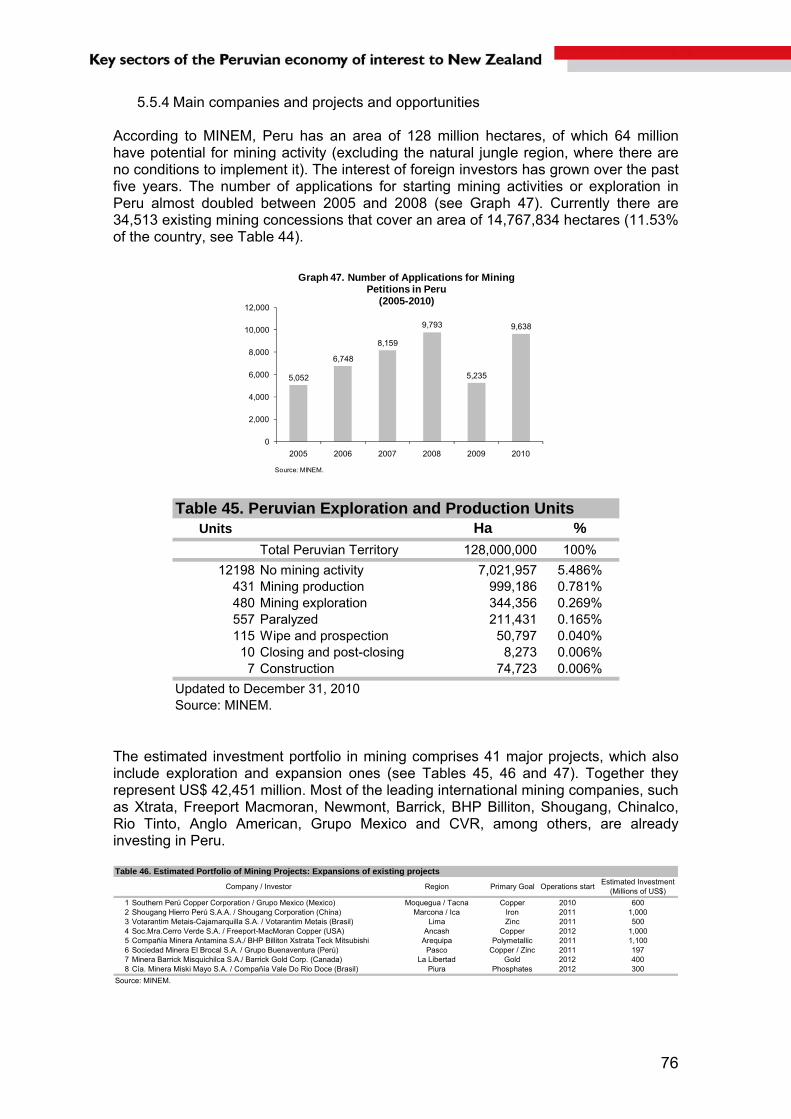
76
5.5.4 Main companies and projects and opportunities According to MINEM, Peru has an area of 128 million hectares, of which 64 million have potential for mining activity (excluding the natural jungle region, where there are no conditions to implement it). The interest of foreign investors has grown over the past five years. The number of applications for starting mining activities or exploration in Peru almost doubled between 2005 and 2008 (see Graph 47). Currently there are 34,513 existing mining concessions that cover an area of 14,767,834 hectares (11.53% of the country, see Table 44).
5,052
6,748
8,159
9,793
5,235
9,638
0
2,000
4,000
6,000
8,000
10,000
12,000
2005 2006 2007 2008 2009 2010
Graph 47. Number of Applications for Mining Petitions in Peru
(2005-2010)
Source: MINEM.
Units Ha %
Total Peruvian Territory 128,000,000 100%
12198 No mining activity 7,021,957 5.486%431 Mining production 999,186 0.781%480 Mining exploration 344,356 0.269%557 Paralyzed 211,431 0.165%115 Wipe and prospection 50,797 0.040%10 Closing and post-closing 8,273 0.006%7 Construction 74,723 0.006%
Table 45. Peruvian Exploration and Production Units
Updated to December 31, 2010Source: MINEM.
The estimated investment portfolio in mining comprises 41 major projects, which also include exploration and expansion ones (see Tables 45, 46 and 47). Together they represent US$ 42,451 million. Most of the leading international mining companies, such as Xtrata, Freeport Macmoran, Newmont, Barrick, BHP Billiton, Shougang, Chinalco, Rio Tinto, Anglo American, Grupo Mexico and CVR, among others, are already investing in Peru.
Company / Investor Region Primary Goal Operations startEstimated Investment
(Millions of US$)
1 Southern Perú Copper Corporation / Grupo Mexico (Mexico) Moquegua / Tacna Copper 2010 6002 Shougang Hierro Perú S.A.A. / Shougang Corporation (China) Marcona / Ica Iron 2011 1,0003 Votarantim Metais-Cajamarquilla S.A. / Votarantim Metais (Brasil) Lima Zinc 2011 5004 Soc.Mra.Cerro Verde S.A. / Freeport-MacMoran Copper (USA) Ancash Copper 2012 1,0005 Compañía Minera Antamina S.A./ BHP Billiton Xstrata Teck Mitsubishi Arequipa Polymetallic 2011 1,1006 Sociedad Minera El Brocal S.A. / Grupo Buenaventura (Perú) Pasco Copper / Zinc 2011 1977 Minera Barrick Misquichilca S.A./ Barrick Gold Corp. (Canada) La Libertad Gold 2012 4008 Cía. Minera Miski Mayo S.A. / Compañía Vale Do Rio Doce (Brasil) Piura Phosphates 2012 300
Table 46. Estimated Portfolio of Mining Projects: Expansions of existing projects
Source: MINEM.

77
Company / Investor Region Primary Goal Operations startEstimated Investment
(Millions of US$)
9 Anglo American Quellaveco S.A. / Anglo American (UK) Quellaveco / Moquegua Copper 2014 3,00010 Cía. Minera Coimolache S.A. / Newmont, Buenaventura (USA, Perú) Tantahuatay / Cajamarca Gold 2012 5611 Xstrata Tintaya S.A. / Xstrata Copper (Suiza) Antapaccay / Cusco Copper 2011 1,50012 Minsur S.A. / Grupo Brecia (Perú) Pucamarca / Tacna Gold 2011 9013 Invicta Mining Corp. S.A.C. / Andean American Mining Corp (Canada) Invicta / Lima Polymetallic TBD 9314 La Arena S.A. / Rio Alto Mining Limited (Canada) La Arena / La Libertad Gold / Copper 2012 36015 Marcobre S.A.C. / Chariot Resources (Canada) Marcobre (Mina Justa) / Ica Copper 2012 74416 Minera Yanacocha S.R.L. / Newmont, Buenaventura (Peru) Minas Conga / Cajamarca Gold / Copper 2015 3,50017 Norsemont Perú S.A.C. / Norsemont Mining (Canada) Constancia / Cuzco Copper 2013 84618 Minera Chinalco Perù S.A. / Chinalco-Aluminium Corp.of China (China) Toromocho / Junin Copper 2013 2,20019 Xstrata Perú S.A. / Xstrata Copper (Suiza) Las Bambas / Apurimac Copper 2014 4,200
Table 47. Estimated Portfolio of Mining Projects: In Construction
Source: MINEM.
Company / Investor Region Primary Goal Operations startEstimated Investment
(Millions of US$)
21 Rio Blanco Copper S.A. / Zijin Mining Group (China) Río Blanco / Piura Copper 2015 1,44022 Lumina Copper S.A.C. / Minmetals /Jiangxi Copper (China) Galeno / Cajamarca Copper 2014 2,50023 Rio Tinto Minera Perú Ltd S.A.C. / Rio Tinto Plc (Uk-Australia) La Granja / Cajamarca Copper 2014 1,00024 Anglo American Michiquillay S.A. / Anglo American (UK) Michiquillay / Cajamarca Copper 2016 70025 Minera Yanacocha S.R.L. / Newmont, Buenaventura (USA, Perú) Chaquicocha / Cajamarca Gold TBD 40026 Cía. Mra. Quechua S.A. / Pan Pacific Copper Corp.; Nippon Mining Holding Quechua / Cusco Copper 2013 49027 Compañía Minera Milpo S.A. / Grupo Milpo (Perú) Pukaqaqa / Huancavelica Copper TBD 30028 Compañía Minera Milpo S.A. / Grupo Milpo (Perú) Hilarión / Ancash Zinc 2013 30029 Minera Cuervo S.A.C. / Cuervo Resources Inc (Canada) Cerro Ccopane / Cusco Iron TBD TBD30 Nanjinzhao Group Co. Ltd., Zibo (China) Pampa de Pongo/ Arequipa Iron 2012 3,28031 Bear Creek Mining Company, Suc.Perú / Bear Creek Mining (USA) Corani/ Puno Silver 2014 42832 Proinversion. / Proinversion Magistral / Ancash Copper 2012 40233 Minera Oro Candente S.A, / Candente Resources ( Canada) Cañariaco / Lambayeque Copper TBD 1,56534 Apurimac Ferrum S.A. / Strike Resources (Australia) Hierro Apurimac / Apurimac Iron TBD 2,30035 Southern Perú Copper Corporation / Grupo Mexico (Mexico) Los Chancas / Apurimac Copper 2013 1,20036 Minera Antares Peru S.A.C./ Antares Minerals Inc (Canada) Haquira / Apurimac Cu / Mo / Au 2013 30137 Minera Sulliden Shahuindo S.A.C./ Sulliden Gold Corp. Ltd.(Canada) Shahuindo / Cajamarca Gold 2012 9038 Canteras del Hallazgo (Perú) Chucapaca / Moquegua Gold 2015 70039 Minera CN S.A.C. / Metminco Limited (Australia) Los Calatos / Moquegua Cu, Mo TBD 2,20040 Hochschild Mining Plc / International Minerals Corp.(IMZ) (USA) Inmaculada / Ayacucho Gold / Silver 2013 168
Table 48. Estimated Portfolio of Mining Projects: Exploration
Source: MINEM.

78
The most noteworthy projects currently are extensions in the Antamina’s copper projects and Cerro Verde’s iron project at Marcona. Also the most important projects in exploration is the one being developed by Xtrata in its search for copper in Las Bambas, as well as Strike Resources, who is exploring for iron in the Apurimac region (see the following map).

79
According to ProInversión, only 10% of the territory with mining potential has been explored and 6% is currently being exploited. This situation represents the main opportunity for investors interested in this sector. Peru has the potential to increase its share in world production of minerals, considering that this country is still an emerging economy (see Table 48). One of the main characteristics of starting this kind of business in Peru is that large-scale operations are among the least-cost production units of international mining activity.
% share of World production
Silver 18%Zinc 13%
Copper 8%Gold 8%Lead 8%
Table 49. Peruvian Mining in 2009
Source: Proinversion. Latin America has been the most popular continent for exploration investment since 1994. In 2010, Peru was the fifth largest destination in the world for exploration investment in the mining sector (Metal Economic Group). As it is showed in Graph 48, Peru receives approximately 5.37% of global budget for this activity.
Canada19.00%
Australia12.00%
United States8.00%
Mexico5.91%Peru
5.37%Chile5.11%
China4.00%
Rusia4.00%
Brasil3.49%
Argentina2.69%
Others30.43%
Graph 48. Exploration Budget in the World (% participation)
Source: MINEM.
There is also an important opportunity in offering related services to the mining activity. Extraction companies install in desert areas, so they are forced to bring with them all the resources they need to operate. These include catering for employees, transport services (i.e. helicopters, equipment trailers, etc.) and industrial power generators to illuminate large areas, among others. Professional knowledge in engineering is also needed to support the establishment of all these logistics. 5.6 Energy Peru’s energy resources make it an ideal place to invest in this field. In only 15 years, Peru has increased its hydrocarbon reserve level four-fold and its electricity generation capacity has risen by more than 70%, according to The National Mining, Oil and Energy Association of Peru. In spite of this progress, there is still much to be done to turn Peru into a real energy powerhouse, and private investments will play a key role.

80
Peru could potentially be self-sufficient in energy but faces a planning challenge. Today Peru requires 6,000 MW of electric generating capacity, most of it hydroelectric. In 8 years the requirement will be 12,000 MW, and in 16 years 24,000 MW. These are huge increases to meet without prompt and efficient planning, and offer potentially excellent investment opportunities. Following work by The National Mining, Oil and Energy Association of Peru, there is data and analysis available to show opportunities in this sector.
5.6.1 General evolution
The large availability of water resources and natural gas underpins Peru’s great electricity potential, which allows Peru to cover the local power demand growth (7% annually) and also allows Peru to export power to countries in the region. Peru has 58,937 Mega Watts (MW) of hydroelectric generation potential and domestic demand is around 4,000 MW. The electricity sector reported US$ 1.7 billion in investments this 2010, according to The National Mining, Oil and Energy Association of Peru, divided in generation, distribution, transmission and rural electrification projects. These investments will make it possible to build 1,500 km of electricity lines, and to improve existing ones. If this growth maintains, the electricity sector will be able to provide this service with the highest standards in Latin America. Peru is recognized as a country with an enormous potential in the hydrocarbons sector by enterprises that operate all around the world and have shown interest to invest in this country, due to its 15.92 Trillion Cubic Feet (TCF) of proved and provable natural gas reserves. This sector has received US$ 1.5 billion in investments during the year 2010, which have been destined to exploration and exploitation of hydrocarbons. International companies are already investing in Peru, such as Abengoa, ISA, Duke Energy, Pluspetrol, Hunt Oil, Repsol, SK Energy, and SN Power.
0
5
10
15
20
25
30
35
2001 2002 2003 2004 2005 2006 2007 2008 2009
Graph 49. Peru - Electricity Production(millions of gigawatts per hour)
Source: Perupetro
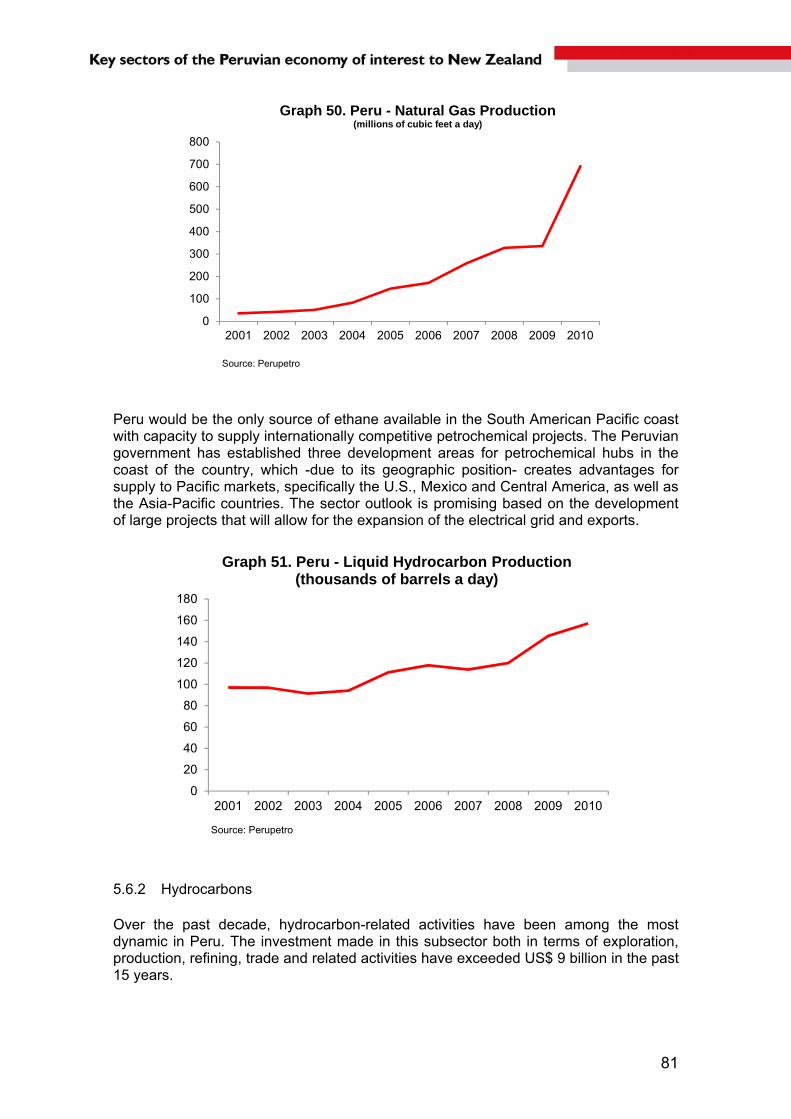
81
0
100
200
300
400
500
600
700
800
2001 2002 2003 2004 2005 2006 2007 2008 2009 2010
Graph 50. Peru - Natural Gas Production(millions of cubic feet a day)
Source: Perupetro
Peru would be the only source of ethane available in the South American Pacific coast with capacity to supply internationally competitive petrochemical projects. The Peruvian government has established three development areas for petrochemical hubs in the coast of the country, which -due to its geographic position- creates advantages for supply to Pacific markets, specifically the U.S., Mexico and Central America, as well as the Asia-Pacific countries. The sector outlook is promising based on the development of large projects that will allow for the expansion of the electrical grid and exports.
0
20
40
60
80
100
120
140
160
180
2001 2002 2003 2004 2005 2006 2007 2008 2009 2010
Graph 51. Peru - Liquid Hydrocarbon Production(thousands of barrels a day)
Source: Perupetro
5.6.2 Hydrocarbons
Over the past decade, hydrocarbon-related activities have been among the most dynamic in Peru. The investment made in this subsector both in terms of exploration, production, refining, trade and related activities have exceeded US$ 9 billion in the past 15 years.
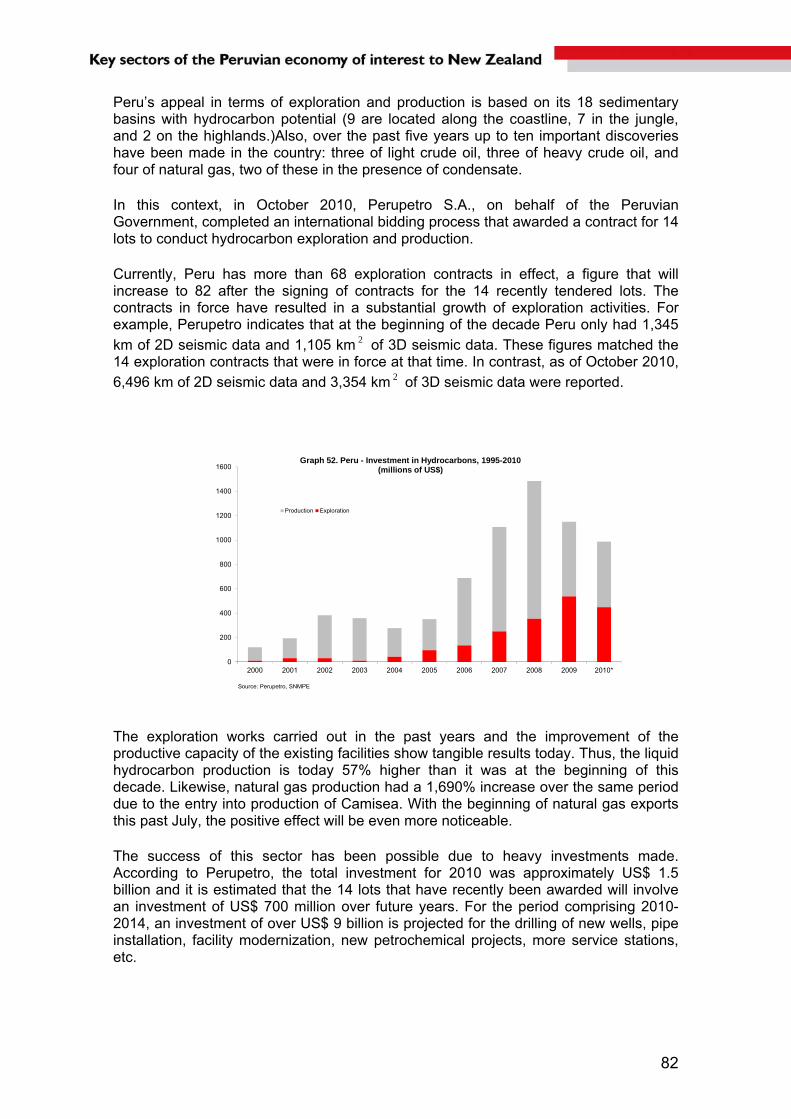
82
Peru’s appeal in terms of exploration and production is based on its 18 sedimentary basins with hydrocarbon potential (9 are located along the coastline, 7 in the jungle, and 2 on the highlands.)Also, over the past five years up to ten important discoveries have been made in the country: three of light crude oil, three of heavy crude oil, and four of natural gas, two of these in the presence of condensate.
In this context, in October 2010, Perupetro S.A., on behalf of the Peruvian Government, completed an international bidding process that awarded a contract for 14 lots to conduct hydrocarbon exploration and production.
Currently, Peru has more than 68 exploration contracts in effect, a figure that will increase to 82 after the signing of contracts for the 14 recently tendered lots. The contracts in force have resulted in a substantial growth of exploration activities. For example, Perupetro indicates that at the beginning of the decade Peru only had 1,345
km of 2D seismic data and 1,105 km 2 of 3D seismic data. These figures matched the 14 exploration contracts that were in force at that time. In contrast, as of October 2010, 6,496 km of 2D seismic data and 3,354 km 2 of 3D seismic data were reported.
The exploration works carried out in the past years and the improvement of the productive capacity of the existing facilities show tangible results today. Thus, the liquid hydrocarbon production is today 57% higher than it was at the beginning of this decade. Likewise, natural gas production had a 1,690% increase over the same period due to the entry into production of Camisea. With the beginning of natural gas exports this past July, the positive effect will be even more noticeable.
The success of this sector has been possible due to heavy investments made. According to Perupetro, the total investment for 2010 was approximately US$ 1.5 billion and it is estimated that the 14 lots that have recently been awarded will involve an investment of US$ 700 million over future years. For the period comprising 2010-2014, an investment of over US$ 9 billion is projected for the drilling of new wells, pipe installation, facility modernization, new petrochemical projects, more service stations, etc.
0
200
400
600
800
1000
1200
1400
1600
2000 2001 2002 2003 2004 2005 2006 2007 2008 2009 2010*
Graph 52. Peru - Investment in Hydrocarbons, 1995-2010(millions of US$)
Production Exploration
Source: Perupetro, SNMPE
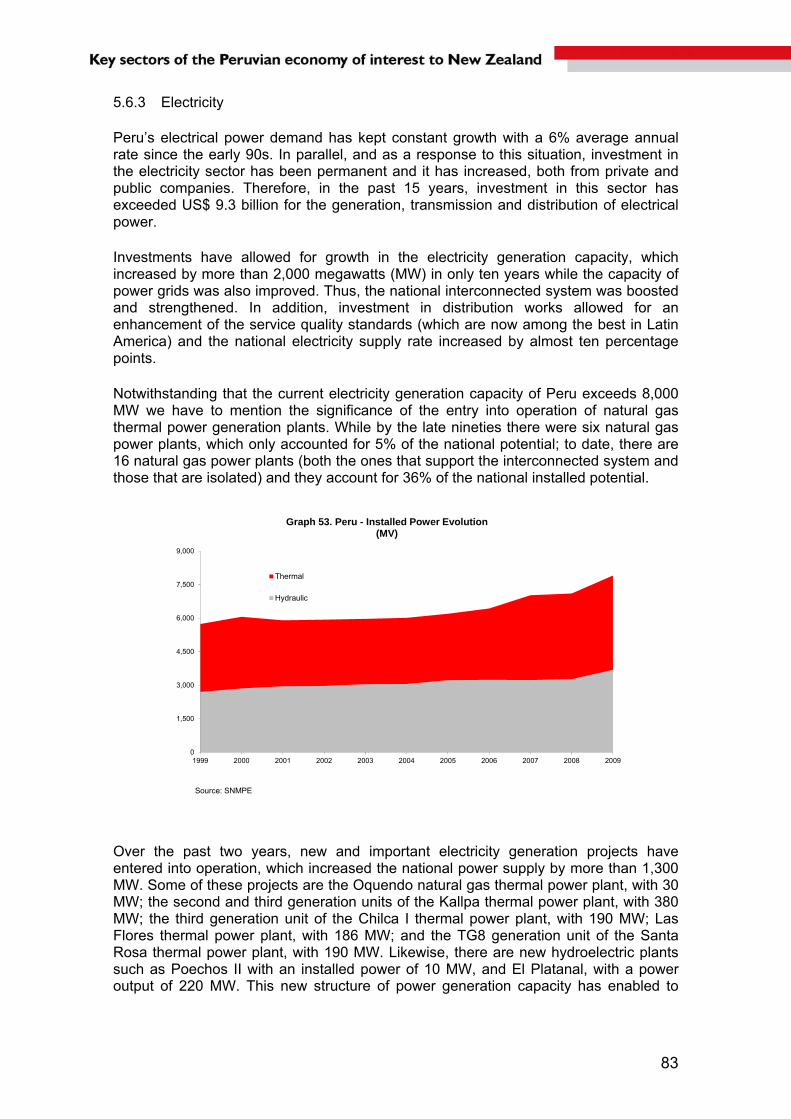
83
5.6.3 Electricity
Peru’s electrical power demand has kept constant growth with a 6% average annual rate since the early 90s. In parallel, and as a response to this situation, investment in the electricity sector has been permanent and it has increased, both from private and public companies. Therefore, in the past 15 years, investment in this sector has exceeded US$ 9.3 billion for the generation, transmission and distribution of electrical power.
Investments have allowed for growth in the electricity generation capacity, which increased by more than 2,000 megawatts (MW) in only ten years while the capacity of power grids was also improved. Thus, the national interconnected system was boosted and strengthened. In addition, investment in distribution works allowed for an enhancement of the service quality standards (which are now among the best in Latin America) and the national electricity supply rate increased by almost ten percentage points.
Notwithstanding that the current electricity generation capacity of Peru exceeds 8,000 MW we have to mention the significance of the entry into operation of natural gas thermal power generation plants. While by the late nineties there were six natural gas power plants, which only accounted for 5% of the national potential; to date, there are 16 natural gas power plants (both the ones that support the interconnected system and those that are isolated) and they account for 36% of the national installed potential.
0
1,500
3,000
4,500
6,000
7,500
9,000
1999 2000 2001 2002 2003 2004 2005 2006 2007 2008 2009
Graph 53. Peru - Installed Power Evolution(MV)
Thermal
Hydraulic
Source: SNMPE
Over the past two years, new and important electricity generation projects have entered into operation, which increased the national power supply by more than 1,300 MW. Some of these projects are the Oquendo natural gas thermal power plant, with 30 MW; the second and third generation units of the Kallpa thermal power plant, with 380 MW; the third generation unit of the Chilca I thermal power plant, with 190 MW; Las Flores thermal power plant, with 186 MW; and the TG8 generation unit of the Santa Rosa thermal power plant, with 190 MW. Likewise, there are new hydroelectric plants such as Poechos II with an installed power of 10 MW, and El Platanal, with a power output of 220 MW. This new structure of power generation capacity has enabled to

84
decrease power generation costs by replacing diesel during years when the oil barrel price went from an average of US$ 30 to over US$ 100. In spite of all the investment made, there is space for new projects and further development. Peruvian regulations are based on the principle of efficiency and they promote that the first power plants entering into operation be the most economical and efficient. This encourages constant investment in expansions and in the modernization of existing operations, in addition to accommodating new projects. Peru’s diversity of power resources (hydroelectric, natural gas, etc.) allows it to choose different electricity generation alternatives that, in addition to being environmentally friendly, have efficient and competitive costs. For example, the national hydroelectric power generation potential that, according to the Ministry of Energy and Mines, would reach 58,937 MW, from which only about 6% is used now. Altogether, these projects would exceed 9,000 MW. The Peruvian Government has an active role in the expansion of the energy sector in Peru, by carrying out significant tenders to award new transmission lines, which will allow for the expansions and improvements required to support the growing energy demand, especially inland, where the highest increases are reported. The transmission works in execution involves more than 1,800 km of transmission lines, among which the following are to be emphasized: the Carhuamayo-Cajamarca-Carhuaquero transmission line, with 700 km; the Chilca-La Planicie-Zapallal transmission line, with 94 km, which will enable the strengthening of the transmission line that links the electricity generation hub that has been created in the area of Chilca with the rest of the System; the Independencia-Ica transmission line, of 220 KW, a project that will allow for a 100% increase in the transmission capacity of the current line; and the strengthening of the Mantaro-Socabaya line, which will allow for this line (which connects the central area of the country to the south) to increase its current capacity by more than 60%.
An example of the importance that investments have gained in electricity transmission is the 2009 and 2010 upturn, which exceeded US$ 250 million and US$ 200 million respectively in this sector. These figures are significantly higher than the average investment in the previous three years, which amounted to US$ 40 million.
Additionally, the investment made in electricity distribution and rural electrification has enabled to reach an electrification rate of 80%, which represents a ten-point-growth in the ten-year-period. Undoubtedly, rural electrification investments gain relevance if we consider that most of the population, who do not have access to this service, lives in these areas. Peru has an estimated potential to generate 3,000 Mw of electricity through geothermal energy, using hot springs. Several studies are taking place in Tacna, southern region of Peru, in order to start the generation of electricity in Borateras and Calientes geothermal camps. These geothermal energy projects will help to develop an ecotouristc project of hot springs in the area. Furthermore, they will boost agricultural areas with clean water. This energy source is cheaper than Diesel 2 or Residual central stations, and never runs out. According to the Energy Viceminister of Peru, the return rate of these projects is estimated at 14%.

85
0
100
200
300
400
500
600
700
2006 2007 2008 2009 2010(*)
Graph 54. Peru: Investments in the Electrical Power Sector, 2006-2010
(millions of US$)
Public power generation companies Private power generation companies
Public power distribution companies Private power distribution companies
Power transmission companies Government (rural)
Source: DGE-MEM, SNMPE
In this sector, Peru has developed an ambitious Rural Electrification Plan, the execution of which started in 2009 and would end in 2018 with an investment of approximately US$ 2.2 billion. This plan establishes that more than 8 million Peruvians, who do not currently have power supply, would benefit from it during this period of time, increasing the rural electrification rate up to 84%.
Without a doubt, for the electricity sector it has been an important and difficult challenge to keep pace with the high and sustained growth of the electrical demand of recent years. The country is working so that investment in the electricity sector will keep its growing and sustained trend in order to have an integrated, reliable and economical system, capable to meet the energy demand of a country that is growing strongly such as Peru.
Generation61%Transmission
12%
Distribution17%
Rural (*)10%
Graph 55. Peru: Distribution of 2010 Investments
(*) It refers to investment allocated to rural electrification. Source: DGE-MEM, SNMPE

86
According to preliminary data from the Ministry of Energy and Mines, 2010 would end with more than US$ 1.6 billion in projects that have been executed, from which 60% would involve electricity generation projects; 12%, transmission; 17%, distribution; and about 10%, electrification in rural and remote areas. Likewise, for the period comprising 2011-2014, the investment projected in the power sector would exceed US$ 3.4 billion.

87
6. SWOT Analysis: New Zealand-Peru Strengths (of New Zealand)
- Knowledge and experience in industries that are very important in Peru’s economy, which have grown significantly in the last years and with excellent perspectives. These are, for example, Agriculture, Forestry, Tourism, Energy, and others, especially in the provision of services related to them.
- Experience in similar markets such as the Chilean. - Good international branding, no reason for rejection in Peru. - Access to well-trained and qualified professionals. - Knowledge of English reduces the language barrier compared with other
countries in the Asia Pacific region. - Access to a more advanced technology. - Access to a relatively more developed financial market (cheaper credit).
Weaknesses (of New Zealand)
- Distance to Peru: High transportation costs. - Low connectivity in terms of airline and maritime transportation - Time difference. - Cultural and language barriers. - Very limited knowledge about the Peruvian market and business culture. - New Zealand is relatively unknown to Peruvians, both in an economic and
cultural sense. - No embassy or official representation settled in Peru. - Limited capital for big investments. - Small-scale international operations.
Opportunities (for New Zealand)
- Peru is one of the fastest growing and with the lowest inflation economies in the world.
- 30 million people market with increasing income. - Excellent geographical location: In the middle of South America’s western coast
and in front of Asia through the Pacific Ocean. - Peru has an extensive network of Free Trade Agreements (FTAs) that provide
preferential and tariff free access to the most important markets in the world and to most countries in the American continent.
- Growing demand for specialized services and know-how in sectors in which New Zealand has broad expertise: Agriculture, Forestry, Tourism, and others.
- Recent changes in the Peruvian energy sources with emphasis in natural gas and high oil prices, represent an opportunity for investing in environmentally friendly and renewable sources such as hydro, geothermal, and wind energy.
- Increasing demand for education services at all levels: In general, Peruvians give high value to education.
- Equal treatment for domestic and foreign investment in all economic sectors. - Estimated infrastructure gap of US$ 38 billion opens many possibilities for
investment. Threats (for New Zealand businesses in Peru)
- Competition from other countries. - Higher energy costs and, therefore, higher transportation costs. - Peruvian political and social instability. - Underdeveloped or lack of infrastructure. - Relatively high crime rates and drug trafficking. - Bureaucracy and corruption. - Lack of an efficient Judicial System.

88
- Relatively high rate of informal economy, which is around 60% according to the World Bank (Doing Business Report 2008).
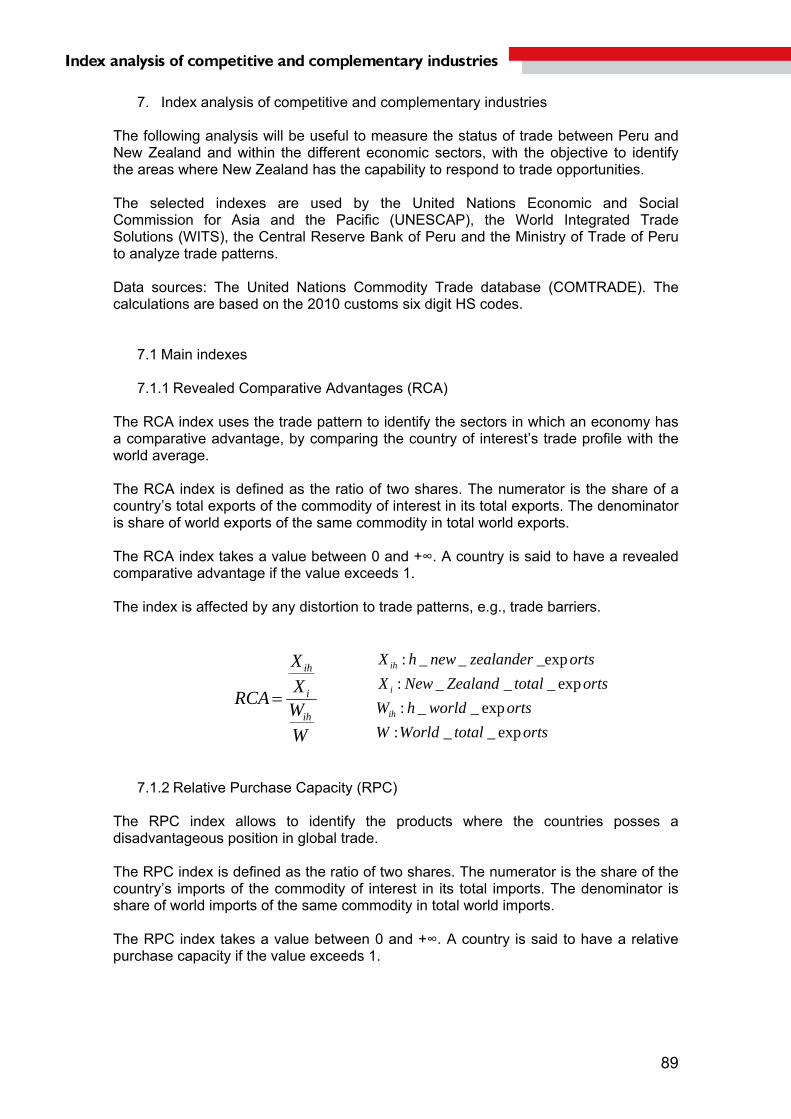
89
7. Index analysis of competitive and complementary industries The following analysis will be useful to measure the status of trade between Peru and New Zealand and within the different economic sectors, with the objective to identify the areas where New Zealand has the capability to respond to trade opportunities.
The selected indexes are used by the United Nations Economic and Social Commission for Asia and the Pacific (UNESCAP), the World Integrated Trade Solutions (WITS), the Central Reserve Bank of Peru and the Ministry of Trade of Peru to analyze trade patterns.
Data sources: The United Nations Commodity Trade database (COMTRADE). The calculations are based on the 2010 customs six digit HS codes.
7.1 Main indexes
7.1.1 Revealed Comparative Advantages (RCA)
The RCA index uses the trade pattern to identify the sectors in which an economy has a comparative advantage, by comparing the country of interest’s trade profile with the world average.
The RCA index is defined as the ratio of two shares. The numerator is the share of a country’s total exports of the commodity of interest in its total exports. The denominator is share of world exports of the same commodity in total world exports.
The RCA index takes a value between 0 and +∞. A country is said to have a revealed comparative advantage if the value exceeds 1.
The index is affected by any distortion to trade patterns, e.g., trade barriers.
7.1.2 Relative Purchase Capacity (RPC)
The RPC index allows to identify the products where the countries posses a disadvantageous position in global trade.
The RPC index is defined as the ratio of two shares. The numerator is the share of the country’s imports of the commodity of interest in its total imports. The denominator is share of world imports of the same commodity in total world imports.
The RPC index takes a value between 0 and +∞. A country is said to have a relative purchase capacity if the value exceeds 1.
W
WX
X
RCAih
i
ih
ortstotalWorldW
ortsworldhW
ortstotalZealandNewX
ortszealandernewhX
ih
i
ih
exp__:exp__:
exp___:exp___:

90
7.1.3 Relative Importance of Exports (RIX)
The RIX index compares the importance of a specific product in the country’s exports to other country.
7.1.4 Relative Importance of Imports (RIM) The RIM index compares the importance of a specific product in the country’s imports from other country.
7.1.5 Trade Specific Coefficient (TSC) The TSC index describes if the first country is a net exporter or net importer in a specific product.
importstotalWorldW
importsworldhW
importstotalZealandNewM
importszealandernewhM
ih
i
ih
__:__:
___:___:
W
W
M
M
RPC ih
i
ih
ortsZealandNewX
PerutoortsZealandNewX
ortszealanderwewhX
PerutoortszealandernewhX
i
ij
ih
ijh
exp__:__exp__:_exp___:
__exp___:
X i
X
X
X
RIX ij
ih
ijh
ihih
ihih
MX
MXTSC
importszealandernewhM
ortszealandernewhX
ih
ih
___:exp___:
importsZealandNewM
PerufromimportsZealandNewM
importszealandernewhM
PerufromimportszealandernewhM
i
ij
ih
ijh
__:____:
____:
_____:
M i
M
M
M
RIM ij
ih
ijh

91
7.2 Analysis of RCA and RPC
Analysis of RCA results According to the databases, New Zealand exported around 3,930 products at six digit HS level. Among these products, there are 548 with RCA index above 1, meaning that they are competitive in the international market. These 548 products are distributed in many sectors: agriculture (160 products), metal mechanical (94), chemical (56) and fishery (46). Among New Zealand exports which registered a value above US$ 100 million, 44 products have a RCA index above 1. This group includes 25 agricultural products such as dairy products, beef, kiwifruit, cheeses, among others, 4 chemical products such as casein glues and other caseins, 4 fishery products such as lobsters and frozen fish, and 2 metal mechanical products. (See Appendix 1) For example, among the agricultural products are: Milk and cream powder unsweetened exceeding 1.5% fat (040221), Bovine cuts boneless, frozen (020230), Butter (040510), Kiwifruit, fresh (081050), Grape wines nes, included fort & grape must (220421), Cheese, grated or powdered, of all kinds (040620), Waters included mineral & aerated, contain sugar o sweeten matter o flavored (220210). Among the chemical products are: Casein glues; caseinates and other casein derivatives (350190), Milk albumin, included concentrates of several proteins (470500), Articles of plastics or of other materials of Nº 39.01 to 39.14 nes (392690), Surface-active prep, washing & cleaning prep put up for retail sale (340220), Beauty or make-up preparations nes; sunscreen or sun tan preparations (330499). Half of the fishery products were Rock lobster & other sea crawfish not frozen, in shell/not, included boiled in shell (030621), Fish nes, frozen, excluding heading No 03.04, livers and roes (030379), Mussels, shelled or not, frozen, dried, salted or in brine (030739), Frozen Pacific salmon "Oncorhynchus gorbuscha, Oncorhynchus keta” (030319), Oysters, shelled or not, live, fresh, chilled, frozen, dried, salted or in brine (030710). Metal mechanical products: Sailboats, with or without auxiliary motor (890391), Articles, iron or steel, nes (732690), Refrigerating or freezing display counters, cabinets, show-cases, etc (841850), Agri/hortic/forestry bee-keeping mach nes inc germination plant (843680).
Analysis of RPC results
New Zealand imported around 4,626 products at six digit HS level. Among these products, there are 1,872 with RPC index above 1, meaning that they have disadvantages in the international market and represent a potential demand for exports. These 1,872 products are distributed in many sectors: metal mechanical (472 products), chemical (365), textile and clothing (317) and various and jewelry (171). Among New Zealand imported products which registered a value above US$ 100 million, 27 have a RPC index above 1. This group includes 13 mechanical metal products such automobiles, portable digital computers and 5 chemical products such aluminum oxide, pneumatic tires. (See Appendix 2)
92
For example, among the mechanical metal products are: Taps, cocks, valves and similar appliances, nes (848180), Ovens; cookers, cooking plates, boiling rings, grillers & roasters, electric, nes (851660), Furniture, metal, nes (940320). Among the agricultural products are: Food preparations nes (210690), Sugar confectionery nes (including white chocolate), not containing cocoa (170490), Bananas including plantains, fresh or dried (080300), Chocolate and other food preparations containing cocoa nes (180690), Chocolate & food prep cocoa in blocks, slabs/bars, not filled, not over 2 kg (180632), Grapes, fresh (080610), Soups and broths and preparations thereof (210410), Peaches nes, o/w prep o preserved whether o not sugared, sweetened o spirited (200870). Half of the chemical products were Beauty or make-up preparations nes; sunscreen or sun tan preparations (330499), Furniture, plastic, nes (940370), Aluminum oxide nes (281820), Articles of plastics or of other materials of Nº 39.01 to 39.14 nes (392690). Textile products: T-shirts, singlet’s and other vests, of cotton, knitted (610910), women’s/girls trousers and shorts, of cotton, not knitted (620462), Pullovers, cardigans and similar articles of man-made fibres, knitted (611030), T-shirts, singlet’s and other vests, of other textile materials, knitted (610990), Garments nes, of man-made fibres, knitted (611430), Babies garments and clothing accessories of cotton, knitted (611120), Jerseys, pullovers, cardigans, waistcoats and similar articles, of wool (611011). Products with higher RPC index value are distributed in many sectors: chemical (25 products), agricultural (22), mechanical metal (15) and textile (14). (See Appendix 3)
7.3 Analysis of RIX and RIM
Analysis of RIX results New Zealand’s exports are mainly agricultural, mechanical and chemical. The results of RIX index indicate that those sectors have the highest RIX index, which means that they have a relative importance for New Zealand exports. (See Appendix 4) For example, among the mechanical products are: personal weighing machines, including baby scales; household scales (842310), Weighing machinery (842389), Moulds, injection or compression types, for rubber or plastics (848071), Crushing/ grind machines for earth/ stone/ores o other minerals (847420). Among the chemical products are: carboxylic acids with aldehyde or ketone (291830), the others inorganic bases; metal oxides, hydroxides and peroxides (282590), the others medicaments, formulated, in bulk (300390), estrogens and progestogens (293723). Half of the agricultural products were buttermilk, curdled milk & cream, kephir & ferm or acid milk & cream (40390), Peas dried, shelled, whether or not skinned or split (71310), Lactose and lactose syrup, >99% lactose on dry matter (170211), Milk powder not exceeding 1.5% fat (40210).

93
Analysis of RIM results New Zealand’s imports from Peru are mainly textiles, agricultural, metal mechanical and chemical products. The results of RIM index indicate that textiles, agricultural and chemical sector have the highest RIM index, which means that they have a relative importance for New Zealand imports. (See Appendix 5) For example, among the textile products there are combed wool in fragments (510521), yarn of combed fine animal hair, not put up for retail sale (510820), fine animal hair, carded or combed (510539), the others bed linen, of other textile materials (630239), shawls, scarves, veils & the like of wool or fine animal hair, not knitted (621420). Among the agricultural products: the others cereals unmilled (100890), Cocoa paste wholly or partly defatted (180320), Asparagus prepared or preserved, o/t by vinegar or acetic acid, not frozen (200560), Brazil nuts, without shell, fresh or dried (80122), guavas, mangoes and mangosteens, fresh or dried (80450), vegetables products (140490). Chemical products: chloride oxides and chloride hydroxides of copper (282741), oxides of boron; boric acids (281000), fertilizers, in packages not exceeding 10 kg (310590), extracts of vegetal origin, tannins & the salts (320190), Colorug matter of vegetable or animal origin & preparations based there on (320300).
7.4 Analysis of TSC New Zealand had 4,749 products with trade flows in 2010, 816 products with a positive TSC index and 3,933 products with a negative TSC index.
The majority of products with a TSC index value of 1 (meaning that New Zealand is net exporter) are some agricultural, fishery and chemical products, among others. On the other hand, the products with a TSC index value of -1 (meaning that New Zealand is net importer) include metal mechanical, chemical, textiles and agricultural products.
Products with a TSC index value of 1
This group includes 156 agricultural products such as dairy products, beef, nuts, kiwifruit, among others: bovine carcasses and half carcasses, frozen (20312), lamb carcasses and half carcasses, fresh or chilled (20410), bovine tongues, edible offal, frozen (20621), fowls (gallus domestics), cuts & offal, frozen (20725), milk and cream powder unsweetened exceeding 1.5% fat (40221), Kiwifruit, fresh (81050), fats and oils derived from milk (40590), sheep cuts, boneless, fresh or chilled (20423). (See Appendix 6)
There are 56 fishery products: Rock lobster & other sea crawfish not frozen (30621), frozen pacific salmon "Oncorhynchus gorbuscha, Oncorhynchus keta, (30319), flours, meals & pellets of meat o meat offal unfit for human cons; greaves (230110), flatfish, fresh or chilled excluding heading No 03.04,livers & roes (30229), molluscs, shelled/not, and aquatic invertebrates ,live ,frozen/chilled (30791), fish, fresh or chilled excl heading No 03.04, livers and roes (30269). (See Appendix 7)
There are 49 chemical products: Alkaloids derived from, not contain antibiotics/hormones, in bulk (300340), Chemical wood pulp, soda or sulphate, coniferous, semi-bleached or bleached (470321), Chemical wood pulp, soda or

94
sulphate, coniferous, unbleached (470311), casein (350110), mechanical wood pulp (470100), among others. (See Appendix 8)
Products with a TSC index value of -1
This group includes 832 chemical products: Beauty or make-up preparations; sunscreen or sun tan preparations (330499), Opacifyg prep, x-ray; diagnostic reagents, designed for admin to patients (300630), carboys, bottles, flasks and similar articles of plastics (392330), paints & varnish based on polymers dissolve in a non aqueous solve (320890), tubes, pipes and hoses, plastic, not reinforced etc, without fittings (391732), Enzymes; prepared enzymes (350790), chemical/allied industry preparations/prods (382490). (See Appendix 9)
There are 819 metal mechanical products: automobiles (870323, 870324), portable digital computers (847130), Computer data storage units (844399), Bicycles and other cycles (including delivery tricycles), not motorized (871200), Instruments and apparatus for physical or chemical analysis (902780), among others. (See Appendix 10)
There are 603 textiles products: t-shirts, singlet’s and other vests, of cotton, knitted (610910), women/girls trousers and shorts, of cotton, not knitted (620462), Pullovers, cardigans and similar articles of man-made fibres, knitted (611030), brassieres and parts thereof, of textile materials (621210), women/girls dresses, of synthetic fibres, not knitted (620443), among others. (See Appendix 11)
There are 335 agricultural products: Palm nut/kernel oil-cake & other solid residues, whether/not ground/pellet (230660), Animal feed preparations (20329), bananas including plantains, fresh or dried (80300), grapes fresh (80610), oranges, fresh or dried (80510), olive oil and its fractions refined but not chemically modified (150990), vegetables and mixtures of vegetables, prepared or preserved otherwise (200599), mandarins (tangelos), clementines citrus hybrids, fresh/dried (80520). (See Appendix 12)
7.5 New Zealand Exports Supply to Peru According to New Zealand Ministry of Foreign Affairs and Trade, trade has previously been a key element in the Peru – New Zealand relationship. Peru has been a significant market for New Zealand dairy products, although a recent decline in dairy exports has seen overall trade figures fall sharply as milk production has risen in Peru.
Peru is New Zealand’s 47th largest trading partner and 3rd largest export market in Latin America on 2010. New Zealand exports to Peru were US$ 55.3 million that represent the 0.2% of New Zealand exports.

95
Graph 56. New Zealand exports to Peru (Millions of US$)
24.52
33.88
26.52
55.33
0
10
20
30
40
50
60
2007 2008 2009 2010
Source: WITS
According to the databases on 2010 New Zealand exported around 19 agricultural products at six digit HS level to Peru. It represents a value of US$ 50.4 million (86.1% of total New Zealand exports to Peru), 73 metal mechanical products that represent a value of US$ 2.9 million (5%), 4 fisheries products that represents a value of US$ 2.4 million (4.1%) and 72 textiles product that represent a value of US$ 669 thousands (1%).
Among the agricultural exports are: milk and cream powder unsweetened exceeding 1.5% fat (US$ 14.8 million), milk powder not exceeding 1.5% fat (US$ 13.7 million), fats and oils derived from milk (US$ 7.6 million), malt extract & food prep of Ch 19 <50% cocoa & hd 0401 to 0404 < 10% cocoa (US$ 6.3 million), Buttermilk, curdled milk & cream, kephir & ferm or acid milk & cream (US$ 5.2 million), lactose and lactose syrup, >99% lactose on dry matter (US$ 540,000), butter (US$ 366,000).
Metal mechanical exports: Oxygen therapy, artificial respiration/other therapeutic respiration app (US$ 850,000), electrical app for switch/protect electric circuits, exceeded 1,000 volts (US$ 277,000), cont-action elevators/conveyors for goods/mat, belt type (US$ 250,000), taps, cocks, valves and similar appliances (US$ 157,000), hydraulic power engines & motors (US$ 107,000).
Fisheries exports: Fish, frozen, excluding heading No 03.04, livers and roes (US$ 1.6 million), mackerel, frozen, excluding heading No 03.04, livers and roes (US$ 727,000), frozen fish fillets, excl. swordfish and tooth fish (US$ 23,000).
Textiles exports: bed linen, of other textile materials (US$ ,000), shawls, scarves, veils & the like, of wool or fine animal hair, not knitted (US$ 63,000), yarn of combed fine animal hair, not put up for retail sale (US$ 51,000), jerseys, pullovers, cardigans, waistcoats and similar articles, of wool (US$ 46,000), t-shirts, singlet’s and other vests, of cotton, knitted (US$ 45,000), men’s/boys shirts, of cotton, knitted (US$ 45,000).
7.6 New Zealand Imports from Peru
New Zealand imports from Peru were US$ 18.6 million in 2010. Peru is the 51st source of New Zealand imports and represents 0.1% of New Zealand imports.

96
Graph 57. New Zealand imports from Peru (Millions of US$)
13.64
16.81 16.90
18.63
0
5
10
15
20
25
2007 2008 2009 2010
Source: WITS
According to the databases on 2010 New Zealand imported around 36 agricultural products at six digit HS level to Peru. It represents a value of US$ 3.9 million (20.8% of total New Zealand imports from Peru), 14 non metallic mining products that represent a value of US$ 2.6 million (14.2%), 16 chemical products that represents a value of US$ 2.3 million (12.5%), 71 textiles product that represent a value of US$ 667,000 (3.6%) and 5 fur and leather that represent a value of US$ 5.2 million (27.8%).
Among the agricultural imports have: Guavas, mangoes and mangosteens, fresh or dried (US$ 714,000), Brazil nuts, without shell, fresh or dried (US$ 545,000), cereals unmilled (US$ 378,000), oil seeds and oleaginous fruits, whether or not broken (US$ 241,000), Fruits & other edible pts of plants, prep/preserved, sugar, sweet not (US$ 102,000), Strawberries, uncooked o steamed o boiled in water, sweetened o not, frozen (US$ 67,000).
Among the non metallic mining imports, there are Natural calcium phosphates, aluminum calcium phosphates etc, ungrounded (US$ 2.1 million), natural sodium borates (US$ 373,000), the other natural sodium borates (US$ 147,000), Statuettes and other ornamental articles of ceramics (US$ 4,000).
Chemical imports: oxides of boron; boric acids (US$ 1.1 million), fertilizers, in packages not exceeding 10kg (US$ 941,000), chloride oxides and chloride hydroxides of copper (US$ 54,000), articles for the conveyance or packing of goods, of plastics (US$ 51,000), Color matter of vegetable or animal origin &preparations based there on (US$ 48,000).
Textiles imports have: bed linen, of other textile materials (US$ 192,000), shawls, scarves, veils & the like, of wool or fine animal hair, not knitted (US$ 63,000), yarn of combed fine animal hair, not put up for retail sale (US$ 51,000), fine animal hair, carded or combed, excl. wool and hair of Kashmir (US$ 49,000), jerseys, pullovers, cardigans, waistcoats and similar articles, of wool (US$ 46,000), t-shirts, singlet’s and other vests, of cotton, knitted (US$ 45,000), Men’s/boys shirts, of cotton, knitted (US$ 44,000).
Fur and leather imports have: articles of fur skin (US$ 4.8 million) and articles of apparel of leather or of composition leather (US$ 2,000).

97
8. Conclusions: Investment Opportunities for New Zealand in Peru
Investment opportunities for New Zealand in Peru are found particularly in the provision of specialized services related to industries that are key to Peru’s economy and where New Zealand has a broad expertise such as Agriculture, Forestry, Energy, among others. Nonetheless, it is worth noting that, given the high rate of growth of the Peruvian economy and the growing needs of a population of almost 30 million people with increasing income, investments of all scales, in practically every sector, can present attractive returns. Additionally, Peru’s location, strong network of FTAs, relatively cheap access to labor, abundance of natural resources, and friendly investment environment makes it an ideal operation center either for business or production. Moreover, if production is destined for exports, there are government incentives such as Drawback and Free Trade Zones that can be appealing. Besides direct investment, there are some opportunities for commerce as shown by the trade indexes calculated in Chapter 7. Among the goods that New Zealand could export to Peru, machinery and seeds for agriculture, livestock related products such as hormones and vaccines, and capital goods in general are the most attractive. In this analysis, we paid especial attention to high value-added products because the long geographic distance and the low connectivity between New Zealand and Peru make transportation costs relatively expensive and, therefore, a limiting factor to compete in the Peruvian market. The following list summarizes some opportunities per sector for New Zealand in Peru: Agriculture To export high-tech machinery and seeds. To provide consultancy services and training to agribusiness in Peru. To export livestock related products and know-how. To invest in harvest land in Peru. To provide consultancy services and training for a sustainable forestry in Peru.
Fisheries To invest in factories that produce and export high value-added products, which are
the most profitable but less developed in Peru. To invest in aquiculture, profitable activity that requires a relatively low investment
and offers many opportunities in Peru. To provide consultancy services and training to fisheries in Peru.
Mining To provide engineering consultancy services in areas such as environmental and
geological. To invest in exploration (junior mining). To export high-tech machinery. To invest in connected services to the mining, from catering to logistics in small
Peruvian towns where mines are established. To provide consultancy services and training to miners.
Energy To provide engineering consultancy services in areas such as environmental and
geological. To invest in exploration for natural gas and oil fields.

98
To export high-tech machinery. To invest in the development of geothermic, eolic and hydraulic energy. Other
sources of renewable energy such as biodiesel and ethanol, are also attractive investments.
Education To promote undergraduate and graduate programs in New Zealand. To promote exchange programs at an undergraduate and graduate level. To promote technical courses in New Zealand. To offer technical courses in Peru. To offer training programs in New Zealand and in Peru to Peruvian businesses.

99
9. Bibliography
1. Bloomberg database. 2. Database of the National Employment Service, INEI (2010)
3. Directorate General of Environmental Health (DIGESA)
http://www.digesa.minsa.gob.pe/ 4. Directorate of the Regional Production (DIREPRO)
5. Doing Business 2011 Rank, World Bank (2011)
6. Economic Operations Committee of the National Interconnected System (COES
SICN)
7. European Free Trade Association http://www.efta.int/ 8. FAO (Food and Agriculture Organization) http://www.fao.org/ 9. Fisheries Technological Institute (ITP) http://www.itp.gob.pe/ 10. Geological and Metallurgical Institute INGEMET http://www.ingemmet.gob.pe/ 11. INDEXMUNDI http://www.indexmundi.com/ 12. INEI National Household Survey of Living Conditions and Poverty, 2009
13. International Federation of Organic Agriculture Movements (IFOAM)
14. Japan International Cooperation Agency (JICA) http://www.jica.go.jp/english/.
15. Ministry of Foreign Trade and Tourism (MINCETUR)
http://www.mincetur.gob.pe 16. Ministry of Agriculture http://www.minag.gob.pe/ 17. National Agrarian Health Service (SENASA) - Ministry of Agriculture
http://www.senasa.gob.pe/ 18. National Enviroment Fund (FONAMPERÚ)
19. National Institute of Defense of the Competition and Protection of the
Intellectual Property (INDECOPI)
20. National Society of Mining, Petroleum and Energy (SNMPE)
21. National Institute of Statistics and Informatics (INEI) – Economic Information http://iinei.inei.gob.pe/iinei/siemweb/publico/
22. National Institute of Statistics and Informatics (INEI) – “Resultados II Censo
Nacional Universitario 2010”
23. National Superintendence of Sanitation Services (SUNASS)
100
24. National Supervisory Commission of Companies and Securities (CONASEV)
25. National Tax Administration Superintendency (SUNAT) http://www.sunat.gob.pe/
26. OBEC (Office of Scholarships and Student Loans)
http://www.minedu.gob.pe/obec 27. PERUPETRO www.perupetro.com.pe 28. PROMPERU (Commission for the Promotion of Peru Export and Tourism)
http://www.promperu.gob.pe/ 29. Regulations of World Trade Organization (WTO) & World Intellectual Property
Organization (WIPO)
30. Reserve Bank of Perú (BCRP) - www.bcrp.gob.pe/ 31. Superintendence of Banks and Insurance (SBS) www.sbs.gob.pe 32. Supervisor of Private Investment in Communications (OSIPTEL)
www.osiptel.gob.pe 33. Supervisor of Private Investment in Public Transportation Infrastructure
(OSITRAN) www.ositran.gob.pe 34. Supervisor of the private investment in mining and energy (OSINERGMIN)
35. The National Assembly of Rectors http://www.anr.edu.pe/portal/index.php 36. The Supervisor of State Contracting Agency (OSCE) http://www.osce.gob.pe/ 37. The Single Text of Administrative Procedures (TUPA in Spanish)
http://www.osce.gob.pe/ 38. The United Nations Commodity Trade database (COMPTRADE)
39. United Nations Economic and Social Commission for Asia and the Pacific
(UNESCAP)
40. University of Texas – Perry Castañeda Library Map Collection
41. World Integrated Trade Solutions (WITS)
42. World Trade Organization http://www.wto.org/

101
10. Appendix
HS Code Description US$ Millions RCA
40221 Milk and cream powder unsweetened exceeding 1.5% fat 3,064 180.72 270900 Petroleum oils and oils obtained from bituminous minerals, crude 1,378 1.06 20230 Bovine cuts boneless, frozen 1,105 40.38
999999 Commodities not elsewhere specified 1,057 0.97 40210 Milk powder not exceeding 1.5% fat 1,023 70.83
440320 Logs, poles, coniferous nes 947 56.73 20442 Sheep cuts, bone in, frozen 929 202.90 40510 Butter 902 80.35 81050 Kiwifruit, fresh 687 151.72
220421 Grape wines nes,incl fort&grape must,unfermntd by add alc in ctnr</=2l 682 14.67 40690 Cheese nes 676 19.31
760110 Aluminium unwrought, not alloyed 655 12.45 40590 Fats and oils derived from milk nes 634 165.81
440710 Lumber, coniferous (softwood) 6 mm and thicker 598 11.18 20422 Sheep cuts, bone in, fresh or chilled 419 165.38 40490 Products consisting of natural milk constituents sweetened or not nes 393 167.83
710812 Gold in unwrought forms non-monetary 360 1.73 20443 Sheep cuts, boneless, frozen 328 160.23
190190 Malt extract&food prep of Ch 19 <50% cocoa&hd 0401 to 0404 < 10% cocoa 297 26.84 510121 Degreased shorn wool, not carded, combed or carbonised 264 190.68 210690 Food preparations nes 261 5.07 350110 Casein 242 96.09 80810 Apples, fresh 235 18.95
350190 Casein glues; caseinates and other casein derivatives 234 127.30 470321 Chemical wood pulp,soda or sulphate,coniferous,semi-bl or bleached,nes 216 6.03 901920 Oxygen therapy,artificial respiration/oth therapeutic respiration app 201 17.59 20130 Bovine cuts boneless, fresh or chilled 193 7.55 20423 Sheep cuts, boneless, fresh or chilled 185 149.30
190110 Prep of cereals,flour,starch/milk f infant use,put up f retail sale 179 21.41 510111 Greasy shorn wool, not carded or combed 166 24.06 30621 Rock lobster&oth sea crawfish not fz,in shell/not,incl boild in shell 159 106.44 30379 Fish nes, frozen, excluding heading No 03.04, livers and roes 157 15.17 20890 Meat and edible meat offal, nes fresh, chilled or frozen 149 99.92
710691 Silver in unwrought forms 137 5.10 40610 Cheese, fresh (including whey cheese) unfermented, and curd 132 12.11 30429 Frozen fish fillets (excl. swordfish and toothfish) 132 6.38 50400 Guts, bladders and stomachs of animals except fish whole or in pieces 131 16.02
350220 Milk albumin, incl concentrates of several proteins 130 116.29 890391 Sailboats, with or without auxiliary motor 129 29.16 40620 Cheese, grated or powdered, of all kinds 126 45.17 30739 Mussels, shelled or not, frozen, dried, salted or in brine 118 253.45 40390 Buttermilk,curdled milk & cream,kephir & ferm or acid milk & cream nes 116 29.06
410411 Full grains, unsplit and grain splits, in the wet state "incl. wet-blu 109 19.85 150200 Bovine,sheep&goat fats,raw/renderd whether/not pressd/solv-extractd 106 24.53 10190 Live horses, asses, mules and hinnies (excl. pure-bred for breeding) 103 42.05
Appendix 1. RCA Indexs of Main Exported Products
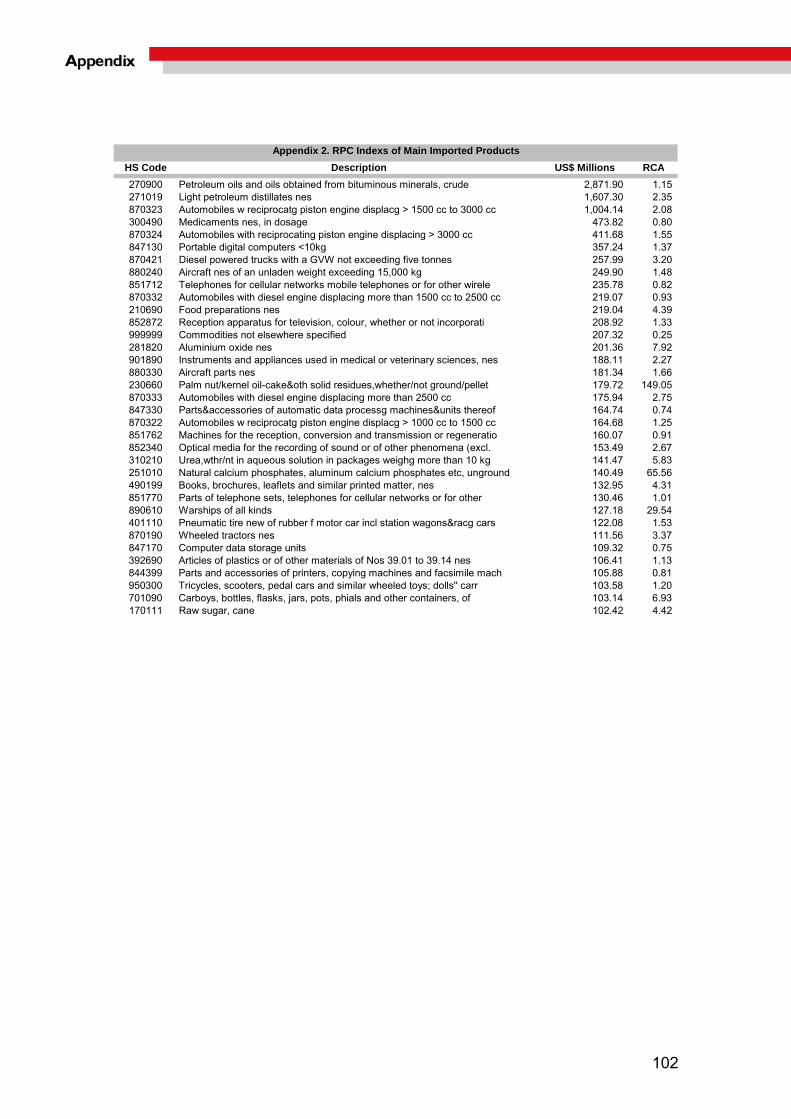
102
HS Code Description US$ Millions RCA
270900 Petroleum oils and oils obtained from bituminous minerals, crude 2,871.90 1.15 271019 Light petroleum distillates nes 1,607.30 2.35 870323 Automobiles w reciprocatg piston engine displacg > 1500 cc to 3000 cc 1,004.14 2.08 300490 Medicaments nes, in dosage 473.82 0.80 870324 Automobiles with reciprocating piston engine displacing > 3000 cc 411.68 1.55 847130 Portable digital computers <10kg 357.24 1.37 870421 Diesel powered trucks with a GVW not exceeding five tonnes 257.99 3.20 880240 Aircraft nes of an unladen weight exceeding 15,000 kg 249.90 1.48 851712 Telephones for cellular networks mobile telephones or for other wirele 235.78 0.82 870332 Automobiles with diesel engine displacing more than 1500 cc to 2500 cc 219.07 0.93 210690 Food preparations nes 219.04 4.39 852872 Reception apparatus for television, colour, whether or not incorporati 208.92 1.33 999999 Commodities not elsewhere specified 207.32 0.25 281820 Aluminium oxide nes 201.36 7.92 901890 Instruments and appliances used in medical or veterinary sciences, nes 188.11 2.27 880330 Aircraft parts nes 181.34 1.66 230660 Palm nut/kernel oil-cake&oth solid residues,whether/not ground/pellet 179.72 149.05 870333 Automobiles with diesel engine displacing more than 2500 cc 175.94 2.75 847330 Parts&accessories of automatic data processg machines&units thereof 164.74 0.74 870322 Automobiles w reciprocatg piston engine displacg > 1000 cc to 1500 cc 164.68 1.25 851762 Machines for the reception, conversion and transmission or regeneratio 160.07 0.91 852340 Optical media for the recording of sound or of other phenomena (excl. 153.49 2.67 310210 Urea,wthr/nt in aqueous solution in packages weighg more than 10 kg 141.47 5.83 251010 Natural calcium phosphates, aluminum calcium phosphates etc, unground 140.49 65.56 490199 Books, brochures, leaflets and similar printed matter, nes 132.95 4.31 851770 Parts of telephone sets, telephones for cellular networks or for other 130.46 1.01 890610 Warships of all kinds 127.18 29.54 401110 Pneumatic tire new of rubber f motor car incl station wagons&racg cars 122.08 1.53 870190 Wheeled tractors nes 111.56 3.37 847170 Computer data storage units 109.32 0.75 392690 Articles of plastics or of other materials of Nos 39.01 to 39.14 nes 106.41 1.13 844399 Parts and accessories of printers, copying machines and facsimile mach 105.88 0.81 950300 Tricycles, scooters, pedal cars and similar wheeled toys; dolls'' carr 103.58 1.20 701090 Carboys, bottles, flasks, jars, pots, phials and other containers, of 103.14 6.93 170111 Raw sugar, cane 102.42 4.42
Appendix 2. RPC Indexs of Main Imported Products

103
HS Code Description US$ Millions RPC
291636 Binapacryl ISO 0.31 273.15 230660 Palm nut/kernel oil-cake&oth solid residues,whether/not ground/pellet 179.72 149.05 550140 Synthetic filament tow as specified in Note 1 to chapter 55, of polypr 0.89 86.30 251010 Natural calcium phosphates, aluminum calcium phosphates etc, unground 140.49 65.56 540500 Artificial mono,67 dtex,cross-sect >1mm;strip of arti tex mat w </=5mm 2.11 56.60 370251 Film for colour photo sens,unexp,in rolls,w</=16mm & le</=14 m,nes 0.05 45.64 800700 Tin articles nes 33.14 41.12 531090 Woven fabrics of jute or of other textile bast fibres, o/t unbleached 1.28 37.38 151610 Animal fats&oils&fract hydrogenatd,inter/re-esterifid,etc,ref'd/not 7.54 32.61 190300 Tapioca subst prep from starch in flake,grain,pearl,siftg or sim forms 3.47 30.86 282490 Lead oxides nes 5.49 30.33 51000 Ambergris,castoreum,etc,bile drid/not&animal gland&prod for pharm prep 7.36 30.03 890610 Warships of all kinds 127.18 29.54 540730 Fabrics specif in Note 9 Section XI (layers of parallel syn tex yarn) 2.17 24.72 251910 Natural magnesium carbonate (magnesite) 3.54 24.08 10190 Live horses, asses, mules and hinnies (excl. pure-bred for breeding) 50.21 23.72 740710 Bars, rods and profiles of refined copper 95.01 23.71 970500 Coll&coll pce zoo,bot,mineral,hist,anatom,archaeo,palaeont,ethno/num 25.17 20.42 841280 Engines and motors nes 38.55 20.24 380590 Terpenic oils nes;crude dipentene;sulphite turpentine&crude paracymene 2.34 18.55 151499 High erucic acid rape or colza oil "fixed oil which has an erucic acid 10.93 18.27 430390 Articles of furskin nes 7.06 17.88 121130 Coca leaf, fresh or dried, whether or not cut, crushed or powdered 0.03 17.25 930190 Military weapons, incl. sub-machine guns (excl. artillery weapons, roc 6.99 15.42 170211 Lactose and lactose syrup, >99% lactose on dry matter 19.06 15.39 842111 Cream separators 2.55 14.72 470691 Mechanical pulps of other fibrous material (o/t cotton linters) 0.71 14.52 610899 Women/girls bathrobes,dressg gowns,etc,of oth textile materials,knittd 1.41 14.36 540412 Polypropylene monofilament of >= 67 decitex and with a cross sectional 1.95 14.34 900630 Cameras designed for special use, underwater, aerial survey, etc 4.63 14.28 120890 Flours and meals of oil seeds or oleaginous fruits,except mustard,nes 2.30 14.18 283990 Silicates of metals nes; commercial alkali metal silicates 5.95 14.00 281910 Chromium trioxide 6.34 13.55 690410 Building bricks 10.85 13.44 210230 Baking powders, prepared 2.38 13.27 732591 Balls, grinding and similar articles of iron or steel, cast for mills 7.93 13.18 292231 Amfepramone "INN", methadone "INN" and normethadone "INN", and salts t 0.22 13.08 380850 Goods containing one or more of aldrin ISO, binapacryl ISO, camphechlo 18.74 12.89 900719 Cinematographic cameras, nes 1.61 12.68 252010 Gypsum; anhydrite 10.72 12.10 310530 Diammonium phosphate, in packages weighing more than 10 kg 92.78 11.72 190230 Pasta nes 39.77 11.66 880529 Ground flying trainers and parts thereof, n.e.s. (excl. air combat sim 18.47 11.45 531010 Woven fabrics of jute or of other textile bast fibres, unbleached 3.19 11.38 630229 Bed linen, of other textile materials, printed, not knitted 1.15 11.28 170410 Chewing gum containing sugar, except medicinal 14.42 11.13 441600 Casks, barrels etc (cooper's prods) & parts of wood, incl staves 13.65 11.08 610839 Womens/girls nightdresses & pyjamas,of other textile materials,knitted 1.69 10.89 71490 Arrowroot,salep etc fr o drid whether o not slicd o pelletd&sago pith 8.74 10.77 230650 Coconut/copra oil-cake&oth solid residues,whether/not ground/pellet 1.51 10.65
Appendix 3. Products with higher RPC indexes

104
370291 Photo film in rolls, sens, unexp,width</=16 mm & length </=14 m, nes 0.11 10.63 293331 Pyridine and its salts 3.79 10.38 282731 Magnesium chloride 3.03 10.36 370256 Photo film in rolls,for colour photo sens,unexp,width > 35 mm,nes 0.12 9.96 401590 Articles of apparel & clothing accessories nes,of vulcanised rubber 3.95 9.95 480451 Paper,kraft,rolls or sheets,>/=225g/m2, unbleached, uncoated, nes 6.26 9.90 630110 Electric blankets, of textile materials 4.44 9.44 284020 Borates of metals nes 1.78 9.14 401192 Pneumatic tyres, of rubber, new, of a kind used on agricultural or for 14.24 9.13 880100 Balloons and dirigibles; gliders, hang gliders and other non-powered a 0.92 9.10 283010 Sodium sulphides 3.07 9.07 230610 Cotton sed oil-cake&oth solid residues,whether or not ground or pellet 1.26 9.01 930690 Munitions of war&pts thereof&other ammunitions&projectiles&pts thereof 41.06 8.96 843050 Construction equipment, self-propelled nes 15.10 8.83 470421 Chemical wood pulp,sulphite,coniferous semi-bleached or bleached,nes 13.61 8.63 200811 Ground-nuts nes o/w prep or presvd,sugared,sweetened,spirited or not 16.69 8.51 847529 Machines for manufacturing glassware, articles, nes 9.30 8.47 251320 Emery, natural corundum, garnet, natural abrasives nes 2.14 8.35 551443 Woven fab of polyester staple fibres <85%,mixd w/cot,>170g/m2,ptd,nes 0.40 8.31 480592 Paper and paperboard, uncoated, in rolls of a width > 36 cm or in squa 7.19 8.31 847021 Electronic calculating machines, incorporating a printing device, nes 2.35 8.28 680990 Articles of plaster or compositions based on plaster nes 2.46 8.17 611490 Garments nes, of other textile materials, knitted 5.32 8.15 630232 Bed linen, of man-made fibres, nes 17.10 8.12 902830 Electricity supply, production and calibrating meters 29.48 8.11 880220 Aircraft nes of an unladen weight not exceeding 2,000 kg 15.34 8.05 340219 Organic surface-active agents, nes 10.82 7.96 281820 Aluminium oxide nes 201.36 7.92 271312 Petroleum coke, calcined 48.38 7.92 40299 Milk and cream nes sweetened 8.52 7.87
401290 Solid o cushiond tires,interchangeable tire treads&tire flaps of rbr 17.21 7.66 90230 Black tea (fermented)&partly fermentd tea in packages not exceedg 3 kg 20.04 7.58
854590 Articles of carbon/graphite,of a kind usd for electrical purposes,nes 7.27 7.47 540261 Yarn of nylon or other polyamides fi, multiple, nes, not put up 4.14 7.41 283210 Sodium sulphites 3.30 7.37 900659 Photographic, other than cinematographic cameras nes 2.31 7.32 210420 Homogenised composite food preparations put up for retail sale 6.79 7.32 282550 Copper oxides and hydroxides 6.37 7.30 252810 Natural sodium borates 0.41 7.30 20850 Fresh, chilled or frozen meat and edible offal of reptiles "e.g. snake 0.02 7.23
370790 Chemical preps f photographic uses,put up in measurd portions,nes 73.17 7.16 190420 Prepared foods of unroasted cereal flakes, mixtures 8.67 7.16 110412 Oats, rolled or flaked grains 3.34 7.16 900791 Parts and accessories for cinematographic cameras 3.80 7.15 570320 Carpets of nylon or other polyamides, tufted 39.20 7.12 721924 Flat rolld prod,stainless steel,hr,nic,>600mm wide,less than 3mm thick 1.89 7.10 880211 Helicopters of an unladen weight not exceeding 2,000 kg 18.72 7.09 81310 Apricots, dried 7.22 7.02

105
HS Code Description RIX
845390 Pts of mach f prep etc hides skin leather/mak/rep foot o/t sewg mch 536.90 30374 Mackerel, frozen, excluding heading No 03.04, livers and roes 46.08
901850 Ophthalmic instruments and appliances, nes 37.38 291830 Carboxylic acids w aldehyde o ketone function only&their derivatives 31.61 261790 Ores and concentrates nes 26.52 842310 Personal weighing machines, including baby scales; household scales 26.11 40390 Buttermilk,curdled milk & cream,kephir & ferm or acid milk & cream nes 24.06
847321 Parts & accessories of electronic calculatg mach of headg No 84.70 nes 20.11 71310 Peas dried, shelled, whether or not skinned or split 17.70
842389 Weighing machinery, nes 15.06 842833 Cont-action elevators/conveyors for goods/mat, belt type nes 11.40 190190 Malt extract&food prep of Ch 19 <50% cocoa&hd 0401 to 0404 < 10% cocoa 11.31 170211 Lactose and lactose syrup, >99% lactose on dry matter 8.79 960990 Pastels,drawing charcoals,writing or drawing chalks & tailor's chalks 8.61 848071 Moulds, injection or compression types, for rubber or plastics 8.41 120922 Seeds, clover, for sowing 7.49 847420 Crushing/grindg machines for earth/ stone/ores o oth minerals subs etc 7.42 410441 Full grains leather, unsplit and grain splits leather, in the dry stat 7.30 40210 Milk powder not exceeding 1.5% fat 7.19
250100 Salt (includg table salt&denaturd salt) pure sodium chloride&sea water 7.02 40590 Fats and oils derived from milk nes 6.48
848130 Valves, check 6.47 120925 Seeds, rye grass, for sowing 5.63 30379 Fish nes, frozen, excluding heading No 03.04, livers and roes 5.60 40640 Cheese, blue-veined 5.39
901820 Ultra-violet or infra-red ray apparatus 4.69 852380 Gramophone records and other media for the recording of sound or of ot 4.15 902480 Machines&appliances f testg the mechanical properties of oth materials 3.61 630533 Sacks, bags, packing, of strip plastic material 3.28 847490 Pts of sortg/screeng/mixg/crushg/grinding/washing/agglomeratg mach etc 3.03 840820 Engines, diesel, for the vehicles of Chapter 87 2.79 282590 Inorganic bases nes; metal oxides, hydroxides and peroxides nes 2.78 903300 Parts & access nes for machines, appliances, inst or app of Chapter 90 2.71 40221 Milk and cream powder unsweetened exceeding 1.5% fat 2.59
300390 Medicaments nes, formulated, in bulk 2.54 850730 Nickel-cadmium electric accumulators 2.32 420292 Containers,with outer surface of sheeting of plas or tex materials,nes 2.22 848180 Taps, cocks, valves and similar appliances, nes 1.88 392620 Apparel and clothing accessories (incl gloves) of plastic 1.81 293723 Oestrogens and progestogens 1.63 853590 Electrical app for switchg/protec elec circuits,exced 1,000 volts,nes 1.59 902610 Instruments&apparatus for measurg o checkg the flow o level of liquids 1.40 903033 Instruments and apparatus for measuring or checking voltage, current, 1.34 846693 Parts & accessories nes for use on machines of headg No 84.56 to 84.61 1.25 960820 Felt tipped and other porous-tipped pens and markers 1.24 902780 Instruments and apparatus for physical or chemical analysis, nes 1.14 901920 Oxygen therapy,artificial respiration/oth therapeutic respiration app 1.14
Appendix 4. Products with higher RIX

106
HS Code Description RIM
510521 Combed wool in fragments 1,619.08 252810 Natural sodium borates 1,455.32 100890 Cereals unmilled nes 1,454.36 282741 Chloride oxides and chloride hydroxides of copper 1,436.44 510820 Yarn of combed fine animal hair, not put up for retail sale 1,355.74 440610 Ties, railway/tramway, wood not impregnated 1,266.81 430390 Articles of furskin nes 1,098.55 252890 Natural borates etc nes 1,007.59 230120 Flour,meal&pellet of fish,crust,mol/oth aqua invert,unfit human cons 963.13 510539 Fine animal hair, carded or combed (excl. wool and hair of Kashmir "ca 960.62 180320 Cocoa paste wholly or partly defatted 809.82 281000 Oxides of boron; boric acids 725.77 731300 Wire,barbd,twistd hoop,single flat o twistd double of i o s,for fencg 716.84 200560 Asparagus prepard or preservd,o/t by vinegar or acetic acid,not frozen 470.08 310590 Fertilizers nes, in packages not exceeding 10 kg 340.88 430219 Tanned or dressed furskins nes, whole, not assembled 326.27 80122 Brazil nuts, without shell, fresh or dried 310.08 110620 Flour&meal of sago&of roots or tubers with hi starch or inulin content 304.22 630239 Bed linen, of other textile materials, nes 285.66 151610 Animal fats&oils&fract hydrogenatd,inter/re-esterifid,etc,ref'd/not 274.78 80450 Guavas, mangoes and mangosteens, fresh or dried 250.41 320190 Tanng extracts of veg orig,nes;tannins&thr salts,ethers,esters&derivs 175.88 731442 Grill, netting, fencing, iron or steel, plastic coated 158.89 510219 Fine animal hair, neither carded nor combed (excl. wool and hair of Ka 158.18 120799 Oil seeds and oleaginous fruits, nes, whether or not broken 154.34 30729 Scallops,incl queen scallops,shelld o not,frozen,drid,saltd o in brine 143.32 140490 Vegetable products nes 124.51 440799 Lumber, non-coniferous nes 118.98 150420 Fish fats&oils&their fractions exc liver,refind/not,not chemically mod 117.65 621420 Shawls,scarves,veils&the like,of wool or fine animal hair,not knitted 115.94 790120 Zinc alloys unwrought 100.40 110429 Cereals, hulled, pearled, sliced or kibbled nes 90.20 71339 Beans dried, shelled, whether or not skinned or split, nes 78.26 510810 Yarn of carded fine animal hair, not put up for retail sale 78.08 200591 Bamboo shoots, prepared or preserved otherwise than by vinegar or acet 77.50 51191 Fish,shellfish&aqua invert prod nes&dead anim of Ch 3 nt for hum cons 56.42 81110 Strawberries,uncookd o steamd o boild in water,sweetend o not,frozen 56.15 740829 Wire, copper alloy, nes 52.92 520829 Woven fabrics of cotton,>/=85%, nt more than 200 g/m2, bleached, nes 45.73 440929 Wood, incl. strips and friezes for parquet flooring, not assembled, co 45.66 620191 Mens/boys anoraks&similar articles,of wool/fine animal hair,not knittd 43.87 320300 Colourg matter of vegetable or animal origin&preparations basd thereon 43.74 90111 Coffee, not roasted, not decaffeinated 29.86 30499 Frozen fish meat whether or not minced (excl. swordfish, toothfish and 29.40 30379 Fish nes, frozen, excluding heading No 03.04, livers and roes 28.21 360300 Safety/detonatg fuses;percussn/detonatg caps;igniters;elec detonatrs 27.81 110630 Flour,meal&powder of edible fruits&nuts&peel of citrus fruit or melons 27.29 251010 Natural calcium phosphates, aluminum calcium phosphates etc, unground 24.20 510910 Yarn of wool/of fine animal hair,>/=85% by wght of such fibres,put up 15.31 681320 Friction material and articles thereof, e.g. sheets, rolls, strips, se 14.82 200899 Fruits&oth edible pts of plants nes,prep/presvd,sug,sweet/spir/not 14.76 200599 Vegetables and mixtures of vegetables, prepared or preserved otherwise 14.48 200190 Veg,fruit,nut&edible prts of plants nes,prep/presvd by vin/acetic acid 14.18 121190 Plants &pts of plants(incl sed&fruit) usd in pharm,perf,insect etc nes 13.75 630499 Furnishg articles nes,of oth textile materials,not knittd o crochetd 12.50 721720 Wire of iron or non-alloy steel, zinc plated/coated 10.88 630120 Blankets (o/t electric) & travelling rugs,of wool or fine animal hair 10.57
Appendix 5. Products with higher RIM

107
HS Code Description US$ MillionsX + M
40221 Milk and cream powder unsweetened exceeding 1.5% fat 3,071.85 20230 Bovine cuts boneless, frozen 1,110.86 40210 Milk powder not exceeding 1.5% fat 1,033.36 20442 Sheep cuts, bone in, frozen 932.35 40510 Butter 904.72 220421 Grape wines nes,incl fort&grape must,unfermntd by add alc in ctnr</=2l 751.19 40690 Cheese nes 691.45 81050 Kiwifruit, fresh 688.76 40590 Fats and oils derived from milk nes 634.51 20422 Sheep cuts, bone in, fresh or chilled 418.81 40490 Products consisting of natural milk constituents sweetened or not nes 401.64 20443 Sheep cuts, boneless, frozen 331.52 190190 Malt extract&food prep of Ch 19 <50% cocoa&hd 0401 to 0404 < 10% cocoa 308.39 80810 Apples, fresh 236.94 20130 Bovine cuts boneless, fresh or chilled 204.18 190110 Prep of cereals,flour,starch/milk f infant use,put up f retail sale 193.01 20423 Sheep cuts, boneless, fresh or chilled 185.02 20890 Meat and edible meat offal, nes fresh, chilled or frozen 148.97 40610 Cheese, fresh (including whey cheese) unfermented, and curd 136.42 50400 Guts, bladders and stomachs of animals except fish whole or in pieces 133.58 40620 Cheese, grated or powdered, of all kinds 129.23 40390 Buttermilk,curdled milk & cream,kephir & ferm or acid milk & cream nes 116.88 150200 Bovine,sheep&goat fats,raw/renderd whether/not pressd/solv-extractd 107.21 160250 Bovine meat and meat offal nes,excluding livers, prepared or preserved 99.24 220429 Grape wines nes,incl fort&grape must,unfermntd by add alc,in ctnr > 2l 95.14 40630 Cheese processed, not grated or powdered 89.98 70310 Onions and shallots, fresh or chilled 83.58 40120 Milk not concentrated & unsweetened exceeding 1% not exceeding 6% fat 79.64 40900 Honey, natural 70.05 20220 Bovine cuts bone in, frozen 69.33 210410 Soups and broths and preparations thereof 64.78 51199 Animal prods nes&dead animals of Chapter I unfit for human consumption 55.80 120991 Seeds, vegetable, nes for sowing 55.28 20629 Bovine edible offal, frozen nes 51.19 40130 Milk and cream not concentrated and unsweetened exceeding 6% fat 49.10 20690 Sheep, goats, asses, mules or hinnies edible offal, frozen 45.07 70990 Vegetables, fresh or chilled nes 42.04 200799 Jams,fruit jellies,fruit/nut purée&paste,ckd prep,sugard,sweetend/not 41.09 80440 Avocados, fresh or dried 38.36 20441 Sheep carcasses and half carcasses, frozen 36.56 40410 Whey whether or not concentrated or sweetened 32.49 71021 Peas, frozen 32.37 20430 Lamb carcasses and half carcasses, frozen 30.83 70960 Peppers of the genus Capsicum or of the genus Pimenta,fresh or chilled 30.54 200551 Beans,shelld prepard/preservd,o/t by vinegar/acetic acid,not frozen 28.55 120925 Seeds, rye grass, for sowing 27.92 60110 Bulbs, tubers, tuberous roots, corms, crowns and rhizomes, dormant 25.98 71310 Peas dried, shelled, whether or not skinned or split 24.30 71090 Mixtures of vegetables, frozen 23.40 20621 Bovine tongues, edible offal, frozen 23.19 10290 Bovine, live except pure-bred breeding 23.16 50790 Whalebone,horns,etc unworkd or simply prepard,unshapd,and powder&waste 20.71 80920 Cherries, fresh 18.65 200979 Apple juice, unfermented, Brix value > 20 at 20°C, whether or not cont 17.17 71040 Sweet corn, frozen 17.08 60313 Fresh cut orchids and buds, of a kind suitable for bouquets or for orn 16.18 20714 Fowls (gallus domesticus), cuts & offal, frozen 15.36
Appendix 6. Agricultural Products with TSC valued at 1

108
81040 Cranberries, bilberries and other fruits of the genus Vaccinium, fresh 13.19 81120 Raspberries,mulberries,etc uncook,steam/boil in water sweetend/nt,froz 13.14 120922 Seeds, clover, for sowing 12.39 70190 Potatoes, fresh or chilled nes 11.94 220600 Fermented beverages nes (for example, cider, perry, mead, etc) 11.52 10110 Pure-bred breeding horses and asses 11.48 10210 Bovine, live pure-bred breeding 11.21 50690 Bones&horn-cores degelatinisd,unwk,defattd o simply prepr,powder&waste 10.11 60319 Fresh cut flowers and buds, of a kind suitable for bouquets or for orn 9.79 40520 Dairy spreads 9.67 120999 Seeds, fruit and spores for sowing, nes 8.50 20622 Bovine livers, edible offal, frozen 8.39 81090 Fruits, fresh nes 8.01 20410 Lamb carcasses and half carcasses, fresh or chilled 7.43 40700 Eggs, bird, in shell, fresh, preserved or cooked 7.17 40229 Milk and cream powder sweetened exceeding 1.5% fat 6.79 160290 Meat, meat offal or blood, prepared or preserved, nes 5.90 20120 Bovine cuts bone in, fresh or chilled 5.88 80910 Apricots, fresh 5.43 220110 Mineral&aerated waters not cntg sugar or sweeteng matter nor flavoured 5.09 70610 Carrots and turnips, fresh or chilled 4.69 20450 Goat meat, fresh, chilled or frozen 4.39 200791 Citrus fruit (marmalades,purée,etc) ckd prep wther/nt sugard/sweetend 4.30 220190 Ice&snow&potable waters nes not cntg sugar or sweeteners nor flavoured 4.23 130213 Hop extract 3.56 10511 Fowls, live domestic weighing not more than 185 g 3.36 121490 Swedes,mangold,fodder root,hay,clover,sainfoin,forag kale,etc 3.25 10690 Live animals (excl. mammals, reptiles, birds, fish, crustaceans, mollu 3.23 40110 Milk not concentrated and unsweetened not exceeding 1% fat 3.18 120590 High erucic rape or colza seeds "yielding a fixed oil which has an eru 3.12 140490 Vegetable products nes 3.12 20610 Bovine edible offal, fresh or chilled 3.09 70920 Asparagus, fresh or chilled 2.55 20210 Bovine carcasses and half carcasses, frozen 2.22 20680 Sheep, goats, asses, mules or hinnies edible offal, fresh or chilled 2.17 230210 Maize (corn) bran, sharps and other residues, pelleted or not 2.06 110313 Maize (corn) groats and meal 1.70 120923 Seeds, fescue, for sowing 1.56 120750 Mustard seeds, whether or not broken 1.53 50590 Feathers&down nes clnd,disinfectd presvd,featherd pts&skins pdr&waste 1.46 70951 Mushrooms, fresh or chilled 1.44 20712 Fowls (gallus domesticus), whole, frozen 1.29 20421 Sheep carcasses and half carcasses, fresh or chilled 1.22 110429 Cereals, hulled, pearled, sliced or kibbled nes 1.21 20500 Horse, ass, mule or hinny meat, fresh, chilled or frozen 1.15 70490 Cabbages,kohlrabi,kale and sim edible brassicas nes,fresh or chilled 0.91 21099 Meat and edible offal, salted, in brine, dried or smoked, and edible f 0.86 152190 Beeswax,oth insect waxes&spermaceti whether or not refined or coloured 0.86 70390 Leeks and other alliaceous vegetables, fresh or chilled 0.85 70410 Cauliflowers and headed broccoli, fresh or chilled 0.57 40819 Egg yolks nes 0.57 20713 Fowls (gallus domesticus), cuts & offal, fresh/chilled 0.50 151511 Linseed oil, crude 0.45 200560 Asparagus prepard or preservd,o/t by vinegar or acetic acid,not frozen 0.44 70521 Witloof chicory, fresh or chilled 0.38 70690 Salad beetroot,salsif,celeriac,radish&sim edibl roots,fresh/chilld nes 0.37 10639 Live birds (excl. birds of prey and psittaciformes "incl. parrots, par 0.37 21020 Bovine meat cured 0.37 70940 Celery, other than celeriac, fresh or chilled 0.32 70110 Potatoes seed, fresh or chilled 0.29 200710 Homo prep (jams,fruit jellies etc) ckd prep whether/nt sugard/sweetend 0.28

109
10632 Live psittaciformes "incl. parrots, parrakeets, macaws and cockatoos" 0.28 71350 Broad beans&horse beans dried,shelled,whether or not skinned or split 0.24 90210 Green tea (not fermented) in packages not exceeding 3 kg 0.23 150600 Animal fats&oils&their fractions nes refind/not,but not chemically mod 0.16 20711 Fowls (gallus domesticus), whole, fresh or chilled 0.15 90240 Black tea (fermented) & partly fermented tea in packages exceedg 3 kg 0.13 20733 Ducks/geese/guinea fowl, whole, frozen 0.13 60314 Fresh cut chrysanthemums and buds, of a kind suitable for bouquets or 0.13 70511 Cabbage lettuce (head lettuce) fresh or chilled 0.11 121010 Hop cones, not ground, powdered or pelleted 0.10 150300 Lard stearin&oil,oleostearin&oil&tallow oil,not emulsifd,mxd/o/w prepr 0.08 20725 Turkey, whole, frozen 0.08 70420 Brussels sprouts, fresh or chilled 0.07 10420 Goats, live 0.06 100400 Oats 0.05 60312 Fresh cut carnations and buds, of a kind suitable for bouquets or for 0.05 70970 Spinach,N-Z spinach & orache spinach (garden spinach),fresh or chilled 0.05 20110 Bovine carcasses and half carcasses, fresh or chilled 0.05 120510 Low erucic acid rape or colza seeds "yielding a fixed oil which has an 0.05 81020 Raspberries, blackberries, mulberries and loganberries, fresh 0.03 20727 Turkey, cuts & offal, frozen 0.03 170219 Lactose and lactose syrup, <99% lactose on dry matter 0.03 20312 Hams, shoulders and cuts thereof, of swine bone in, fresh or chilled 0.02 60240 Roses, grafted or not 0.02 20641 Swine livers, edible offal, frozen 0.02 20736 Ducks/geese/guinea fowl, cuts/offal, frozen 0.02 20732 Ducks/geese/guinea fowl, whole, fresh or chilled 0.01 10391 Swine, live except pure-bred breeding weighing less than 50 kg 0.01 80231 Walnuts in shell, fresh or dried 0.01 70529 Chicory, fresh or chilled, nes 0.01 230620 Linseed oil-cake&other solid residues,whether or not ground or pellet 0.00 20724 Turkey, whole. fresh or chilled 0.00 60230 Rhododendrons and azaleas,grafted or not 0.00 20735 Ducks/geese/guinea fowl, cuts/offal nes, fresh/chilled 0.00 20311 Swine carcasses and half carcasses, fresh or chilled 0.00 20734 Ducks/geese/guinea fowl, fatty livers, fresh/chilled 0.00 80131 Cashew nuts, in shell, fresh or dried 0.00 20630 Swine edible offal, fresh or chilled 0.00

110
HS Code Description US$ MillionsX + M
30621 Rock lobster&oth sea crawfish not fz,in shell/not,incl boild in shell 159.48 30379 Fish nes, frozen, excluding heading No 03.04, livers and roes 157.52 30429 Frozen fish fillets (excl. swordfish and toothfish) 138.13 30739 Mussels, shelled or not, frozen, dried, salted or in brine 118.09 230110 Flours,meals&pellets of meat o meat offal unfit for human cons;greaves 80.17 30749 Cuttle fish and squid,shelled or not,frozen,dried,salted or in brine 69.20 30499 Frozen fish meat whether or not minced (excl. swordfish, toothfish and 59.69 160590 Molluscs and other aquatic invertebrates prepared or preserved 49.27 30269 Fish nes, fresh or chilled excl heading No 03.04, livers and roes 48.29 160420 Fish prepared or preserved, except whole or in pieces 39.43 30212 Salmon Pacific,Atlantic&Danube,fr or chd excl hd No 03.04,livers&roes 27.70 30362 Frozen toothfish Dissostichus spp. 20.49 30319 Frozen Pacific salmon "Oncorhynchus gorbuscha, Oncorhynchus keta, Onco 18.41 30710 Oysters,shelld or not,live,fresh,chilld,frozen,drid,saltd or in brine 12.88 30419 Fresh or chilled fillets and other fish meat whether or not minced (ex 12.73 30378 Hake, frozen, excluding heading No 03.04, livers and roes 11.83 160300 Extracts&juices of meat,fish,or crust,molluscs/oth aquatic invertebr 11.45 30343 Skipjack or stripe-bellid bonito,frozen ex headg No 03.04,livers&roes 10.90 30374 Mackerel, frozen, excluding heading No 03.04, livers and roes 8.80 30799 Molluscs nes,shelld o not&aquatic invert nes,fz,drid,saltd o in brine 7.30 30375 Dogfish and other sharks,frozen,excl heading No 03.04,livers and roes 5.93 30380 Livers and roes, frozen 5.80 30339 Flatfish nes, frozen, excluding heading No 03.04, livers and roes 5.11 30346 Frozen Southern bluefin tunas "Thunnus maccoyii" 4.81 30341 Tunas,albacore or longfinned,frozen,excl headg No 03.04,livers & roes 4.74 30541 Salmon, Pacific, Atlantic and Danube, smoked including fillets 4.24 30791 Molluscs nes,shelld/not,and aquatic invertebrates nes,live,fr/chilld 4.20 30265 Dogfish & other sharks,fresh or chd,excl headg No 03.04,livers & roes 4.08 30611 Rock lobster&oth sea crawfish,frozen in shell/not,incl boild in shell 3.68 30229 Flatfish nes,fresh or chilled excluding heading No 03.04,livers & roes 2.56 30236 Fresh or chilled Southern bluefin tunas "Thunnus maccoyii" 2.40 30376 Eels, frozen, excluding heading No 03.04, livers and roes 2.37 30192 Eels, live 1.98 50800 Coral&sim mat,shellfsh shell,cuttl bone,echinoderm unwk unshp pdr&wast 1.96 30267 Fresh or chilled swordfish Xiphias gladius 1.75 30234 Fresh or chilled bigeye tunas "Thunnus obesus" 1.67 30235 Fresh or chilled bluefin tunas "Thunnus thynnus" 1.12 30239 Tunas nes,fresh or chilled,excluding heading No 03.04,livers and roes 1.11 30311 Frozen sockeye salmon [red salmon] "Oncorhynchus nerka" 0.99 30731 Mussels, shelled or not, live, fresh or chilled 0.92 30492 Frozen meat whether or not minced of toothfish Dissostichus spp. (excl 0.35 30250 Cod, fresh or chilled, excluding heading No 03.04, livers and roes 0.32 30510 Fish meal fit for human consumption 0.29 30333 Sole, frozen, excluding heading No 03.04, livers and roes 0.20 30352 Cod Gadus morhua, Gadus ogac, Gadus macrocephalus 0.19 30619 Crustaceans nes, frozen, in shell or not including boiled in shell 0.09 30721 Scallops,including queen scallops,shelled or not,live,fresh or chilled 0.07 30624 Crabs, not frozen, in shell or not, including boiled in shell 0.06 30266 Eels, fresh or chilled, excluding heading No 03.04, livers and roes 0.05 30751 Octopus, live, fresh or chilled 0.03 160540 Crustaceans nes, prepared or preserved 0.01 30270 Livers and roes, fresh or chilled 0.01 30223 Sole, fresh or chilled, excluding heading No 03.04, livers and roes 0.01 30361 Frozen swordfish Xiphias gladius 0.01 30562 Cod, salted and in brine, but not dried or smoked 0.00 30377 Sea bass, frozen, excluding heading No 03.04, livers and roes 0.00
Appendix 7. Fishery Products with TSC valued at 1

111
HS Code Description US$ MillionsX + M
350110 Casein 242.51 350190 Casein glues; caseinates and other casein derivatives 234.33 470321 Chemical wood pulp,soda or sulphate,coniferous,semi-bl or bleached,nes 216.15 350220 Milk albumin, incl concentrates of several proteins 130.14 470500 Semi-chemical wood pulp 84.39 392390 Articles for the conveyance or packing of goods nes, of plastics 77.32 470311 Chemical wood pulp, soda or sulphate, coniferous, unbleached 71.00 470100 Mechanical wood pulp 66.10 350400 Peptones & derivs;protein substances and derivs, nes; hide powder 30.36 271500 Bituminous mixtures based on natural asphalt etc 25.71 291819 Carboxylic acids with alcohol function only and their derivatives, nes 18.62 310310 Superphosphates, in packages weighing more than 10 kg 16.29 293723 Oestrogens and progestogens 13.41 380630 Ester gums 9.02 470329 Chemical wood pulp,soda/sulphate,non-coniferous,semi-bl/bleachd,nes 7.98 320300 Colourg matter of vegetable or animal origin&preparations basd thereon 7.56 391510 Polyethylene waste and scrap 5.74 300340 Alkaloids/their derivs,formltd,not cntg antibiotics/hormones,in bulk 5.11 290129 Unsaturated acyclic hydrocarbons nes 4.89 390750 Alkyd resins 3.21 283526 Calcium phosphates nes 3.14 350710 Rennet and concentrates thereof 2.11 401700 Hard rubber in all forms, incl waste & scrap; articles of hard rubber 1.67 380690 Resin acids&derivs nes;rosin deriv nes;rosin spirit&rosin oils;run gum 1.33 391520 Polystyrene waste and scrap 1.22 350290 Albumins nes; albuminates and other albumin derivatives 1.07 300310 Penicillins or streptomycins and their derivatives,formulated,in bulk 1.06 292630 Fenproporex "INN" and its salts; methadone "INN"-intermediate "4-cyano 1.04 380620 Rosin salts or resin acid salts 0.88 291830 Carboxylic acids w aldehyde o ketone function only&their derivatives 0.70 380700 Tar,tar oils,creosote&naphta,of wood;veg pitch;brewer's pitch&sim prep 0.69 281530 Peroxides of sodium or potassium 0.55 282630 Sodium hexafluoroaluminate (synthetic cryolite) 0.50 350520 Glues based on starches, on dextrins or other modified starches, nes 0.20 381511 Supportd catalysts,with nickel/nickel compounds as the active subst 0.14 382569 Wastes from chemical or allied industries (excl. wastes of metal pickl 0.06 382549 Waste organic solvents, non-halogenated 0.05 293361 Melamine 0.03 281390 Sulphides of non-metals nes; commercial phosphorus trisulphide 0.03 382530 Clinical waste 0.02 281512 Sodium hydroxide (caustic soda) in aqueous solution 0.02 280800 Nitric acid; sulphonitric acids 0.02 293212 2-furaldehyde (furfuraldehyde) 0.01 271121 Natural gas in gaseous state 0.01 400260 Isoprene rubber (IR) 0.01 401211 Retreaded pneumatic tyres, of rubber, of a kind used on motor cars "in 0.01 360100 Propellent powders 0.00 270730 Xylole 0.00 300692 Waste pharmaceuticals 0.00
Appendix 8. Chemical Products with TSC valued at 1

112
HS Code Description US$ MillionsX + M
271019 Light petroleum distillates nes 1,655.54 300490 Medicaments nes, in dosage 554.03 281820 Aluminium oxide nes 201.48 310210 Urea,wthr/nt in aqueous solution in packages weighg more than 10 kg 141.66 401110 Pneumatic tire new of rubber f motor car incl station wagons&racg cars 122.39 330499 Beauty or make-up preparations nes; sunscreen or sun tan preparations 113.14 310530 Diammonium phosphate, in packages weighing more than 10 kg 95.28 390110 Polyethylene having a specific gravity of less than 0.94 93.89 390120 Polyethylene having a specific gravity of 0.94 or more 74.73 370790 Chemical preps f photographic uses,put up in measurd portions,nes 73.85 310420 Potassium chloride, in packages weighing more than 10 kg 66.33 382200 Composite diagnostic or laboratory reagents, nes 65.11 382490 Chemical/allied industry preparations/prods nes 56.78 401120 Pneumatic tires new of rubber for buses or lorries 53.79 330590 Hair preparations, nes 51.11 321519 Printing ink, nes 48.30 392190 Film and sheet etc, nes of plastics 48.12 300220 Vaccines, human use 47.36 391732 Tubes,pipes and hoses nes,plastic,not reinforced etc,without fittings 41.18 392020 Film and sheet etc, non-cellular etc, of polymers of propylene 38.68 330300 Perfumes and toilet waters 35.64 392410 Tableware and kitchenware of plastics 33.77 330210 Mixtures of odoriferous substances for the food or drink industries 32.41 300390 Medicaments nes, formulated, in bulk 32.36 320890 Paints & varni based on polymers dissolv in a non aqueous solv nes 31.98 300439 Hormones nes, not containing antibiotics, in dosage,o/t contraceptive 31.76 390690 Acrylic polymers nes, in primary forms 30.64 380892 Fungicides 28.19 340213 Non-ionic surface active agents 28.06 391990 Self-adhesive plates, sheets, film etc, of plastic nes 27.57 390210 Polypropylene 27.44 390410 Polyvinyl chloride, not mixed with any other substances 27.15 321410 Mastics; painters' fillings 26.14 401693 Gaskets, washers and other seals of vulcanised rubber 25.75 330510 Hair shampoos 22.91 390760 Polyethylene terephthalate 22.31 391810 Floor, wall and ceiling coverings etc, of polymers of vinyl chloride 21.99 340111 Toilet soap&prep,shaped;papers&nonwovens impreg with soap toilet use 21.93 321511 Printing ink, black 21.05 350691 Adhesives based on rubber or plastics, nes 20.53 300432 Adrenal cortex hormones, in dosage 20.18 392049 Plates, sheets, film, foil and strip, of non-cellular polymers of viny 19.75 392490 Household and toilet articles nes, of plastics 19.55 320820 Paint&varnishe basd on acrylic/vinyl poly,dspr in a non-aqueous medium 18.98 391910 Self-adhesive plates,sheets,film etc,of plastic in rolls <20 cm wide 17.82 390230 Propylene copolymers 17.75 401290 Solid o cushiond tires,interchangeable tire treads&tire flaps of rbr 17.39 310520 Fertilizers cntg nitrogen,phosphorus&potassium in packs weighg </=10kg 16.85 330610 Dentifrices 16.49 390720 Polyethers nes 15.99 300590 Dressings&similar articles,impreg or coatd or packagd for md use,nes 15.82 381519 Supported catalysts, nes 15.78 320611 Titanium pigments and preps, >80% titanium oxide 15.77 390319 Polystyrene nes 15.58 330720 Personal deodorants & antiperspirants 14.99
Appendix 9. Chemical Products with TSC valued at -1

113
283531 Sodium triphosphate (sodium tripolyphosphate) 6.59 400811 Plates, sheets and strip of cellular rubber (vulcanised) 6.49 340319 Lubricating & simil prep containing >/=70% petroleum oils, nes 6.45 282550 Copper oxides and hydroxides 6.42 360300 Safety/detonatg fuses;percussn/detonatg caps;igniters;elec detonatrs 6.39 292690 Nitrile-function compounds, nes 6.34 281910 Chromium trioxide 6.34 271290 Mineral waxes nes and similar products obtained by synthesis etc 6.32 392061 Film and sheet etc, non-cellular etc, of polycarbonates 6.23 392640 Statuettes and other ornamental articles, of plastics 5.97 293627 Vitamin C and its derivatives, unmixed 5.95 283990 Silicates of metals nes; commercial alkali metal silicates 5.95 320990 Paints&varnishes based on polymers,dispersed in an aqueous medium,nes 5.83 401140 Pneumatic tires new of rubber for motorcycles 5.74 390799 Polyesters nes, in primary forms 5.74 310590 Fertilizers nes, in packages not exceeding 10 kg 5.71 293040 Methionine 5.68 292249 Amino-acids nes, and their esters; salts thereof 5.65 330690 Oral or dental hygiene preparations, nes 5.64 382000 Anti-freezing preparations and prepared de-icing fluids 5.62 293090 Organo-sulphur compounds, nes 5.51 282490 Lead oxides nes 5.49 292320 Lecithins and other phosphoaminolipids 5.44 401220 Pneumatic tires used 5.43 283699 Carbonates of metals nes; peroxocarbonates (percarbonates) of metals 5.39 280469 Silicon nes 5.37 293399 Heterocyclic compounds with nitrogen hetero-atom[s] only (excl. those 5.31 390290 Polymers of propylene nes or of olefins nes, in primary forms 5.28 400299 Synthetic rubber and factice derived from oils, etc, nes 5.21 292250 Amino-alcohol-phenol,amino-acid-phenol&oth amino-compds w oxygen func 5.18 310240 Ammonium nitrate mixd w cal carb o non-frt subts in pack weighg >10 kg 5.12 330491 Powders, skin care, whether or not compressed 5.01 330430 Manicure or pedicure preparations 4.99 290532 Propylene glycol (propane-1,2-diol) 4.98 290711 Phenol (hdroxybenzene) and its salts 4.87 381600 Refractory cements,mortars,concretes and similar compositions, nes 4.86 392043 Plates, sheets, film, foil and strip, of non-cellular polymers of viny 4.83 283325 Copper sulphates 4.83 283620 Disodium carbonate 4.80 294000 Sugars, chemically pure, their ethers, esters and their salts 4.69 330730 Perfumed bath salts and other bath preparations 4.69 400821 Plates,sheets&strip of non cellular rubber,oth than hard rubber (vulc) 4.63 401199 Pneumatic tires new of rubber nes 4.61 293629 Vitamins nes, and their derivatives, unmixed 4.58 340600 Candles, tapers and the like 4.55 300440 Alkaloids or their derivs, not cntg antibiotics or hormones, in dosage 4.54 330290 Mixtures of odoriferous subst f use as raw materials in industry,nes 4.51 400931 Tubes, pipes and hoses, of vulcanised rubber (excl. hard rubber), rein 4.48 381900 Hydraulic brake&transmis fluids not cntg o cntg <70% of petroleum oils 4.39 321290 Pigment dspr in a n-aqueous media f mfg of paint;dyes packd f retail 4.38 400921 Tubes, pipes and hoses, of vulcanised rubber (excl. hard rubber), rein 4.35 382440 Prepared additives for ceramics, mortars, concretes 4.33 300691 Appliances identifiable for ostomy use 4.21 392030 Film and sheet etc, non-cellular etc, of polymers of styrene 4.13 220710 Undenaturd ethyl alcohol of an alcohol strgth by vol of 80% vol/higher 4.09 300630 Opacifyg prep,x-ray;diagnostic reagents,designed for admin to patients 4.03 401590 Articles of apparel & clothing accessories nes,of vulcanised rubber 4.01 340490 Artificial and prepared waxes, nes 3.98 380899 Rodenticides and other plant protection products put up for retail sal 3.97 390920 Melamine resins 3.97
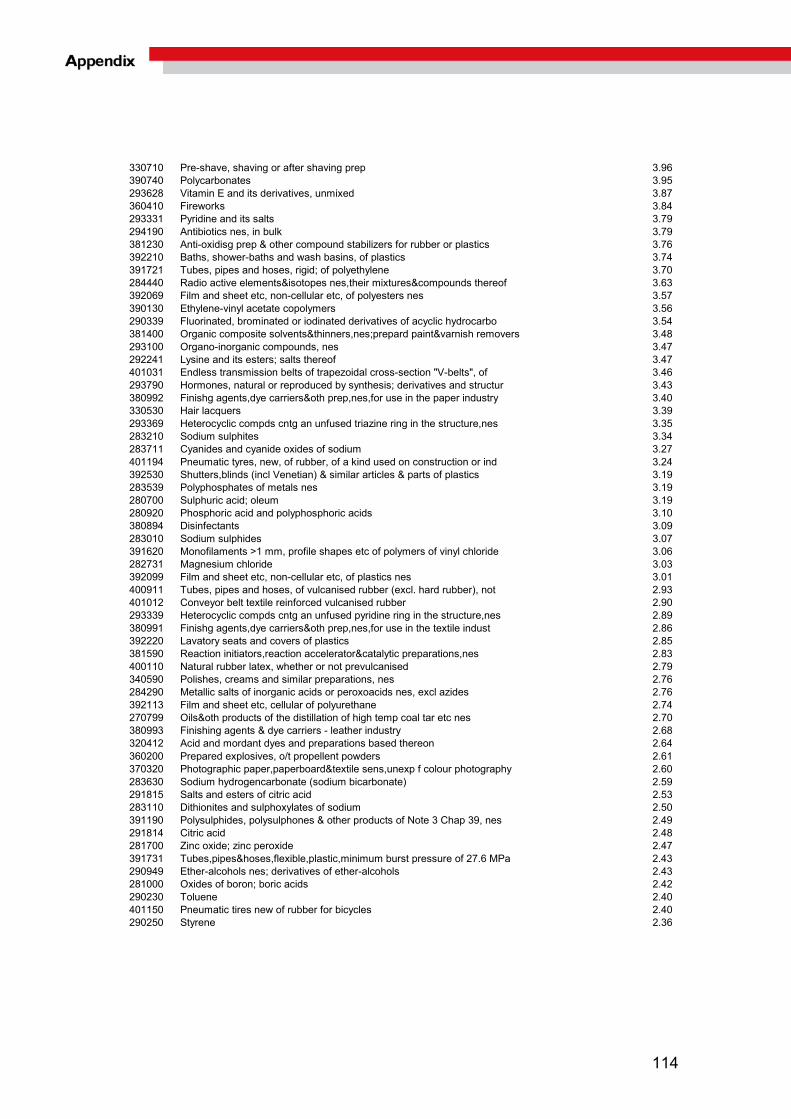
114
330710 Pre-shave, shaving or after shaving prep 3.96 390740 Polycarbonates 3.95 293628 Vitamin E and its derivatives, unmixed 3.87 360410 Fireworks 3.84 293331 Pyridine and its salts 3.79 294190 Antibiotics nes, in bulk 3.79 381230 Anti-oxidisg prep & other compound stabilizers for rubber or plastics 3.76 392210 Baths, shower-baths and wash basins, of plastics 3.74 391721 Tubes, pipes and hoses, rigid; of polyethylene 3.70 284440 Radio active elements&isotopes nes,their mixtures&compounds thereof 3.63 392069 Film and sheet etc, non-cellular etc, of polyesters nes 3.57 390130 Ethylene-vinyl acetate copolymers 3.56 290339 Fluorinated, brominated or iodinated derivatives of acyclic hydrocarbo 3.54 381400 Organic composite solvents&thinners,nes;prepard paint&varnish removers 3.48 293100 Organo-inorganic compounds, nes 3.47 292241 Lysine and its esters; salts thereof 3.47 401031 Endless transmission belts of trapezoidal cross-section "V-belts", of 3.46 293790 Hormones, natural or reproduced by synthesis; derivatives and structur 3.43 380992 Finishg agents,dye carriers&oth prep,nes,for use in the paper industry 3.40 330530 Hair lacquers 3.39 293369 Heterocyclic compds cntg an unfused triazine ring in the structure,nes 3.35 283210 Sodium sulphites 3.34 283711 Cyanides and cyanide oxides of sodium 3.27 401194 Pneumatic tyres, new, of rubber, of a kind used on construction or ind 3.24 392530 Shutters,blinds (incl Venetian) & similar articles & parts of plastics 3.19 283539 Polyphosphates of metals nes 3.19 280700 Sulphuric acid; oleum 3.19 280920 Phosphoric acid and polyphosphoric acids 3.10 380894 Disinfectants 3.09 283010 Sodium sulphides 3.07 391620 Monofilaments >1 mm, profile shapes etc of polymers of vinyl chloride 3.06 282731 Magnesium chloride 3.03 392099 Film and sheet etc, non-cellular etc, of plastics nes 3.01 400911 Tubes, pipes and hoses, of vulcanised rubber (excl. hard rubber), not 2.93 401012 Conveyor belt textile reinforced vulcanised rubber 2.90 293339 Heterocyclic compds cntg an unfused pyridine ring in the structure,nes 2.89 380991 Finishg agents,dye carriers&oth prep,nes,for use in the textile indust 2.86 392220 Lavatory seats and covers of plastics 2.85 381590 Reaction initiators,reaction accelerator&catalytic preparations,nes 2.83 400110 Natural rubber latex, whether or not prevulcanised 2.79 340590 Polishes, creams and similar preparations, nes 2.76 284290 Metallic salts of inorganic acids or peroxoacids nes, excl azides 2.76 392113 Film and sheet etc, cellular of polyurethane 2.74 270799 Oils&oth products of the distillation of high temp coal tar etc nes 2.70 380993 Finishing agents & dye carriers - leather industry 2.68 320412 Acid and mordant dyes and preparations based thereon 2.64 360200 Prepared explosives, o/t propellent powders 2.61 370320 Photographic paper,paperboard&textile sens,unexp f colour photography 2.60 283630 Sodium hydrogencarbonate (sodium bicarbonate) 2.59 291815 Salts and esters of citric acid 2.53 283110 Dithionites and sulphoxylates of sodium 2.50 391190 Polysulphides, polysulphones & other products of Note 3 Chap 39, nes 2.49 291814 Citric acid 2.48 281700 Zinc oxide; zinc peroxide 2.47 391731 Tubes,pipes&hoses,flexible,plastic,minimum burst pressure of 27.6 MPa 2.43 290949 Ether-alcohols nes; derivatives of ether-alcohols 2.43 281000 Oxides of boron; boric acids 2.42 290230 Toluene 2.40 401150 Pneumatic tires new of rubber for bicycles 2.40 290250 Styrene 2.36

115
293729 Adrenal cortical hormon nes,in blk;deriv of adren cor horm,nes,in bulk 2.35 320420 Synthetic organic products used as fluorescent brightening agents 2.35 380590 Terpenic oils nes;crude dipentene;sulphite turpentine&crude paracymene 2.34 281830 Aluminium hydroxide 2.34 940592 Lamps and lighting fittings parts of plastics 2.33 291529 Acetic acid salts nes 2.30 321390 Artists'students'painters'&amusement colours in tubes/similar pack,nes 2.29 392071 Film and sheet etc, non-cellular etc, of regenerated cellulose 2.27 382450 Non-refractory mortars and concretes 2.22 293621 Vitamins A and their derivatives, unmixed 2.22 290944 Monoalkylethers of ethylene glycol or of diethylene glycol, nes 2.21 400129 Natural rubber in other forms nes 2.21 381220 Compound plasticizers for rubber or plastics, nes 2.20 280421 Argon 2.19 290545 Glycerol 2.17 292419 Acyclic amides, incl. acyclic carbamates, and their derivatives, and s 2.17 330190 Conc&aqueous distls of essentl oils;terpenic by-prods of essentl oils 2.16 290531 Ethylene glycol (ethanediol) 2.14 380210 Activated carbon 2.14 292119 Acyclic monoamines nes, and their derivatives; salts thereof 2.13 290512 Propan-1-ol(propyl alcohol)and propan-2ol(isopropyl alcohol) 2.11 271220 Paraffin wax containing by weight less than 0.75% of oil 2.05 321210 Stamping foils 2.04 391390 Natural polymers, modified natural polymers nes, in primary forms 2.01 370110 Photographic plates & film in the flat,sensitised,unexposed,for X-ray 1.96 321590 Ink, nes 1.94 282110 Iron oxides and hydroxides 1.91 282739 Chlorides of metals nes 1.89 283919 Silicates of sodium nes 1.89 290960 Alcohol peroxides,ether peroxides,ketone peroxides & their derivatives 1.88 400942 Tubes, pipes and hoses, of vulcanised rubber (excl. hard rubber), rein 1.86 400922 Tubes, pipes and hoses, of vulcanised rubber (excl. hard rubber), rein 1.85 380130 Carbonaceous pastes for electrodes&similar pastes for furnace linings 1.83 382590 Residual products of the chemical or allied industries, n.e.s. (excl. 1.83 400219 Styren-butadien rubber(SBR)/carboxyltd styren-butadien rubbr(XSBR) nes 1.82 284990 Carbides nes 1.82 292429 Cyclic amides and their derivatives, nes; salts thereof 1.81 391110 Petroleum resins,coumarone,indene/coumarone-indene resins&polyterpenes 1.79 284020 Borates of metals nes 1.78 390422 Polyvinyl chloride nes, plasticised 1.76 283650 Calcium carbonate 1.75 391610 Monofilaments >1 mm, profile shapes etc of polymers of ethylene 1.74 360490 Signallg flares,rain rockets,fog signals & other pyrotechnic articles 1.73 280120 Iodine 1.71 291570 Palmitic acid, stearic acid, their salts and esters 1.70 370199 Photographic plates and film in the flat, sensitised, unexposed, nes 1.68 390530 Polyvinyl alcohol (incl. w. unhydrolysed acetate g) 1.68 283529 Phosphates of metals nes 1.66 390610 Polymethyl methacrylate 1.64 310290 Mineral or chem fertilizers nitrogenous,nes,in pack weighing > 10 kg 1.63 281129 Inorganic oxygen compounds of non-metals nes 1.62 281122 Silicon dioxide 1.61 400941 Tubes, pipes and hoses, of vulcanised rubber (excl. hard rubber), rein 1.60 320413 Basic dyes and preparations based thereon 1.60 291811 Lactic acid, its salts and esters 1.59 292159 Aromatic polyamines nes, and their derivatives; salts thereof 1.58 292242 Glutamic acid and its salts 1.58 392112 Film and sheet etc, cellular of polymers of vinyl chloride 1.57 391400 Ion-exchangers basd on polymers of Nos 39.01 to 39.13 in primary forms 1.55 391290 Cellulose derivatives nes, in primary forms 1.55

116
320210 Synthetic organic tanning substances 1.54 283429 Nitrates of metals nes 1.52 340212 Cationic surface-active agents 1.51 283319 Sodium sulphates nes 1.50 291590 Saturated acyclic monocarboxylic acids and their derivatives, nes 1.49 285300 Inorganic and organic compounds, incl. distilled or conductivity water 1.45 291739 Aromatic polycarboxylic acids and their derivatives, nes 1.45 360690 Pyrophoric alloy;solid/semi-solid fuel,put-up;firelighter&re torches 1.44 310510 Fertilizers in tablets o similar forms o in packages not exceedg 10 kg 1.44 293299 Heterocyclic compounds with oxygen hetero-atoms nes 1.43 281511 Sodium hydroxide (caustic soda) solid 1.42 300120 Extracts of glands/oth organs/of their secretions,for therapeutic uses 1.42 283421 Potassium nitrate 1.41 401410 Hygienic o pharmaceutical articles of rubber etc sheath contraceptives 1.40 283321 Magnesium sulphate 1.39 280429 Rare gases nes 1.38 392630 Fittings for furniture, coachwork or the like, of plastics 1.38 281520 Potassium hydroxide (caustic potash) 1.38 391239 Cellulose ethers nes, in primary forms 1.37 280300 Carbon (carbon blacks and other forms of carbon, nes) 1.34 390710 Polyacetals 1.34 293626 Vitamin B12 and its derivatives, unmixed 1.32 283525 Calcium hydrogenorthophosphate (dicalcium phosphate) 1.32 391722 Tubes, pipes and hoses, rigid; of polypropylene 1.29 391890 Floor, wall and ceiling coverings etc, of plastics nes 1.29 340530 Polishes & similar preparations for coachwork, o/t metal polishes 1.28 293500 Sulphonamides in bulk 1.28 392114 Film and sheet etc, cellular of regenerated cellulose 1.27 401390 Inner tubes of rubber nes 1.25 291411 Acetone 1.25 292620 1-cyanoguanidine (dicyandiamide) 1.24 961511 Combs, hair-slides and the like of hard rubber or plastics 1.24 401130 Pneumatic tires new of rubber for aircraft 1.22 340119 Soap&orgn surf prep,shapd,nes;papers&nonwovens impreg w soap/prep,nes 1.21 400300 Reclaimed rubber in primary forms or in plates, sheets or strip 1.20 282810 Commercial calcium hypochlorite and other calcium hypochlorites 1.19 854720 Insulatg fittings of plastics for elec machines,appliances o equipment 1.19 170250 Fructose, chemically pure 1.19 400690 Rubber unvulcanised forms nes,rods,tubes,profile shapes,discs & ring 1.18 291735 Phthalic anhydride 1.18 320619 Titanium pigments and preps, <80% titanium oxide 1.17 281990 Chromium oxides nes; chromium hydroxides 1.17 291619 Unsaturated acyclic monocarboxylic acids and their derivatives, nes 1.17 270750 Aromatic hydrocarbon mixtures etc nes 1.16 391231 Carboxymethylcellulose and its salts 1.14 290244 Mixed xylene isomers 1.11 292219 Amino-alcohols nes, their ethers and esters; salts thereof 1.11 284700 Hydrogen peroxide 1.11 382410 Prepared binders for foundry moulds or cores 1.11 400231 Isobutene-isoprene (butyl) rubber (IIR) 1.10 292529 Imines and their derivatives; salts thereof (excl. chlordimeform [ISO] 1.09 390599 Polymers of vinyl acetate, vinyl esters, nes 1.08 283522 Monoor disodium phosphates 1.08 292211 Monoethanolmine and its salts 1.07 293229 Lactones, nes 1.07 293890 Glycosides&their salts,ethers,esters&other derivatives,nes,in bulk 1.06 382478 Mixtures containing perfluorocarbons PFCs or hydrofluorocarbons HFCs, 1.06 340391 Lub/oth prep,not cntg pet oils for treat textiles,leather,furskins etc 1.05 381090 Fluxes&oth prep for soldering;core/coatg prep for weld electds/rods 1.05 400610 Camel-back strips for retreading rubber tires 1.04

117
HS Code Description US$ MillionsX + M
870323 Automobiles w reciprocatg piston engine displacg > 1500 cc to 3000 cc 1,004.92 870324 Automobiles with reciprocating piston engine displacing > 3000 cc 416.43 847130 Portable digital computers <10kg 359.99 851712 Telephones for cellular networks mobile telephones or for other wirele 265.25 870421 Diesel powered trucks with a GVW not exceeding five tonnes 258.11 880240 Aircraft nes of an unladen weight exceeding 15,000 kg 249.90 901890 Instruments and appliances used in medical or veterinary sciences, nes 233.83 870332 Automobiles with diesel engine displacing more than 1500 cc to 2500 cc 219.14 852872 Reception apparatus for television, colour, whether or not incorporati 209.12 847330 Parts&accessories of automatic data processg machines&units thereof 193.77 880330 Aircraft parts nes 187.51 851762 Machines for the reception, conversion and transmission or regeneratio 183.81 870333 Automobiles with diesel engine displacing more than 2500 cc 176.12 870322 Automobiles w reciprocatg piston engine displacg > 1000 cc to 1500 cc 164.70 851770 Parts of telephone sets, telephones for cellular networks or for other 140.92 890610 Warships of all kinds 127.18 870190 Wheeled tractors nes 112.81 847170 Computer data storage units 110.08 844399 Parts and accessories of printers, copying machines and facsimile mach 106.89 848180 Taps, cocks, valves and similar appliances, nes 105.86 847150 Digital processing units not sold as complete systems 95.19 870423 Diesel powered trucks with a GVW exceeding twenty tonnes 87.88 852580 Television cameras, digital cameras and video camera recorders 87.67 847149 Digital data processing systems, nes 80.73 844332 Machines which only perform one of the functions of printing, copying 76.22 870899 Motor vehicle parts nes 74.87 842952 Shovels and excavators with a 360 revolving superstructure 66.54 847141 Non-portable digital edp machines w processor & i/o 65.86 940320 Furniture, metal, nes 62.16 851660 Ovens;cookers,cookg plates,boilg rings,grillers & roasters,elec,nes 61.54 870410 Dump trucks designed for off-highway use 50.91 843149 Parts of cranes,work-trucks,shovels,and other construction machinery 48.97 842890 Lifting, handling, loading or unloading machinery nes 47.07 852851 Monitors of a kind solely or principally used in an automatic data-pro 46.08 903180 Measuring or checking instruments, appliances and machines, nes 44.80 847180 Units of automatic data processing equipment nes 44.76 844331 Machines which perform two or more of the functions of printing, copyi 44.18 841112 Turbo-jets of a thrust exceeding 25 KN 40.10 890110 Cruise ships,excursion boats etc principally designd f transp persons 40.01 842951 Front end shovel loaders 39.17 871200 Bicycles and other cycles (including delivery tricycles),not motorised 38.96 841280 Engines and motors nes 38.90 902780 Instruments and apparatus for physical or chemical analysis, nes 38.78 870321 Automobiles w reciprocatg piston engine displacg not more than 1000 cc 38.53 852990 Parts suitable f use solely/princ w the app of headings 85.25 to 85.28 38.27 841191 Parts of turbo-jets or turbo-propellers 37.20 854442 Electric conductors for a voltage <= 1.000 V, insulated, fitted with c 36.77 852691 Radio navigational aid apparatus 36.59 842230 Mach f fil/clos/seal/etc.btle/can/box/ bag/ctnr nes,mach f aeratg bev 36.52 852859 Monitors, not incorporating television reception apparatus (excl. with 34.01 841199 Parts of gas turbines nes 33.97 841510 Air conditioning machines window or wall types, self-contained 33.71 853690 Electrical app for switchg/protec elec circuits,not exced 1,000 V,nes 33.57 850300 Parts of electric motors,generators,generatg sets & rotary converters 33.27 845011 Automatic washing machines,of a dry linen capacity not exceeding 10 kg 33.13 902830 Electricity supply, production and calibrating meters 32.93
Appendix 10. Mechanical Metals Products with TSC valued at -1

118
903289 Automatic regulating or controlling instruments and apparatus, nes 32.10 880230 Aircraft nes of an unladen weight > 2,000 kg but not exceedg 15,000 kg 31.99 854231 Electronic integrated circuits as processors and controllers, whether 31.84 840999 Parts for diesel and semi-diesel engines 31.64 871150 Motorcycles with reciprocatg piston engine displacg more than 800 cc 31.37 847160 Computer input/outputs, with/without storage 30.53 870830 Brakes and servo-brakes and their parts, for tractors, motor vehicles 30.36 853669 Electrical plugs and sockets, for a voltage not exceeding 1,000 volts 29.98 842490 Pts of mech app (hand-op or not) for proj/disp or spray liq or powders 29.63 847190 Automatic data processing equipment nes 29.48 842720 Self-propelled works trucks nes 29.35 842211 Dish washing machines of the HH type 28.62 848340 Gears&gearing,ball screws,gear boxes,speed changers/torque converters 28.56 841459 Fans nes 28.01 850423 Liq dielectric transf havg a power handlg capacity exceedg 10,000 KVA 27.78 843311 Mowers, powered, lawn, with horizontal cutting device 27.47 840991 Parts for spark-ignition type engines nes 26.98 870431 Gas powered trucks with a GVW not exceeding five tonnes 26.50 841370 Centrifugal pumps nes 26.44 850720 Lead-acid electric accumulators nes 26.14 842959 Self-propelled excavating machinery nes 25.90 841381 Pumps nes 25.03 840721 Outboard motors, spark-ignition reciprocating or rotary type 24.25 842481 Mech appl for proj/disp o sprayg liquids o powders for agr o horticut 24.02 870422 Diesel powerd trucks w a GVW exc five tonnes but not exc twenty tonnes 23.93 853400 Printed circuits 23.75 841989 Machinery,plant/laboratory equip f treat of mat by change of temp nes 23.61 870880 Shock absorbers for motor vehicles 22.67 871690 Trailer and other vehicle parts nes 21.86 848190 Parts of taps, cocks, valves or similar appliances 20.80 732111 Cookg appliances&plate warmers for gas fuel or both gas&o/fuels,i or s 20.52 854239 Electronic integrated circuits (excl. such as processors, controllers, 20.21 880212 Helicopters of an unladen weight exceeding 2,000 kg 20.15 851830 Headphones, earphones and combined microphone/speaker sets 19.83 842199 Parts for filterg or purifyg mchy & apparatus for liquids or gases,nes 19.83 841430 Compressors of a kind used in refrigerating equipment 19.73 871120 Motorcycles with reciprocatg piston engine displacg > 50 cc to 250 cc 19.72 841111 Turbo-jets of a thrust not exceeding 25 KN 19.46 847290 Office machines, nes 19.15 901849 Instruments and appliances, used in dental sciences, nes 19.02 880529 Ground flying trainers and parts thereof, n.e.s. (excl. air combat sim 18.83 880211 Helicopters of an unladen weight not exceeding 2,000 kg 18.72 842123 Oil or petrol-filters for internal combustion engines 18.56 890690 Vessels, incl. lifeboats (excl. warships, rowing boats and other vesse 18.43 842489 Mech appl (whether/not hand-op) for proj/disp/sprayg liq/powders nes 17.99 846729 Electro-mechanical tools for working in the hand, with self-contained 17.90 732393 Table,kitchen or other household art&parts thereof,stainless steel,nes 17.70 890190 Cargo vessels nes&oth vessels for the transport of both persons&goods 17.56 842129 Filtering or purifying machinery and apparatus for liquids nes 17.51 851679 Electro-thermic appliances, domestic, nes 17.46 842710 Self-propelled works trucks powered by an electric motor 17.43 850819 Vacuum cleaners, incl. dry cleaners and wet vacuum cleaners, with self 17.37 901819 Electro-diagnostic apparatus, nes 17.31 850780 Electric accumulators, nes 17.25 830242 Mountings,fittings & similar articles of base metal for furniture,nes 17.13 820559 Tools for masons, watchmakers, miners and hand tools nes 16.71 843050 Construction equipment, self-propelled nes 16.19 870210 Diesel powered buses with a seating capacity of > nine persons 16.03 842121 Filtering or purifying machinery and apparatus for water 15.88 851629 Electric space heating apparatus & electric soil heating apparatus,nes 15.65 854140 Photosensitive semiconduct device,photovoltaic cells&light emit diodes 15.49

119
851769 Apparatus for the transmission or reception of voice, images or other 15.41 846721 Drills of all kinds for working in the hand, with self-contained elect 15.22 841869 Refrigerating or freezing equipment nes 15.21 852910 Aerials&aerial reflectors of all kinds;parts suitable f use therewith 15.01 853620 Automatic circuit breakers for a voltage not exceeding 1,000 volts 14.90 880390 Parts of balloons, dirigibles, and spacecraft nes 14.85 830990 Stoppers,caps,lids,seals & other packing accessories of base metal,nes 14.85 870870 Wheels including parts and accessories for motor vehicles 14.83 830140 Locks of base metal, nes 14.02 732399 Table,kitchen or oth household art&parts thereof,of iron or steel,nes 13.40 870600 Chassis fittd w engines for the vehicles of headg Nos 87.01 to 87.05 13.33 851711 Line telephone sets with cordless handsets 13.28 843359 Harvesting machinery nes 13.01 850490 Parts of electrical transformers, static converters and inductors 12.75 850610 Manganese dioxide primary cells and batteries 12.67 842139 Filtering or purifying machinery and apparatus for gases nes 12.57 901910 Mechano-therapy appl;massage app;psychologicl aptitude-testg apparatus 12.27 841330 Fuel, lubricating or cooling medium pumps for int comb piston engines 12.06 841182 Gas turbines nes of a power exceeding 5000 KW 12.06 940179 Seats with metal frames, nes, other than those of heading No 94.02 11.88 903040 Instruments & apparatus,specially designed for telecommunications nes 11.86 902110 Orthopaedic or fracture appliances 11.79 870840 Tansmissions for motor vehicles 11.70 850980 Electro-mechanical domestic appliances,w self-containd electric motor 11.64 847590 Parts of glass working machines 11.57 843340 Straw or fodder balers, including pick-up balers 11.57 902214 X-rays apparatus, medical/surgical/veterinary use nes 11.54 851650 Microwave ovens 11.33 848390 Parts of power transmission equipment/oth goods usd to transmit power 11.24 853649 Electrical relays for a voltage exced 60 V but not exceedg 1,000 volts 11.21 731210 Stranded wire,ropes&cables of iron or steel,not electrically insulated 11.19 870893 Clutches and parts for motor vehicles 11.14 871419 Motorcycle parts nes 11.11 871680 Wheelbarrows, hand-carts, rickshaws and other hand propelled vehicles 11.02 850231 Wind-powered generating equipment 11.02 852791 Radio-broadcast receivers, for mains operation only, combined with sou 10.99 850213 Generatg sets,diesel/semi-diesel engines,of an output exceedg 375 KVA 10.83 851718 Telephone sets (excl. line telephone sets with cordless handsets and t 10.79 848210 Bearings, ball 10.79 847050 Cash registers 10.77 842810 Lifts and skip hoists 10.76 830210 Hinges of base metal 10.70 846692 Parts and accessories nes for use on machines of heading No 84.65 10.54 821210 Razors including safety razors and open blade type 10.47 880310 Aircraft propellers and rotors and parts thereof 10.44 846591 Sawing machines for working wood/cork/ bone/hard rubber/plastics etc 10.41 841911 Instantaneous gas water heaters 10.35 853931 Fluorescent lamps, hot cathode 10.28 846789 Tools for workg in the hand with selfcontaind non-electric motor nes 10.22 843131 Parts of lifts, skip hoist or escalators 10.15 840810 Marine propulsion engines, diesel 10.13 841121 Turbo-propellers of a power not exceeding 1100 KW 10.09 854420 Co-axial cable and other co-axial electric conductors 9.99 848310 Transmission shafts and cranks, including cam shafts and crank shafts 9.89 851822 Multiple loudspeakers, mounted in the same enclosure 9.82 902290 Parts&accessories for app based on the use of X-rays or oth radiations 9.69 870590 Special purpose motor vehicles nes 9.65 840290 Parts of steam or vapour generating boilers nes 9.65 843351 Combine harvester-threshers 9.55 860210 Rail locomotives, diesel-electric 9.52 844391 Parts and accessories of printing machinery used for printing by means 9.50

120
840890 Engines, diesel nes 9.42 847529 Machines for manufacturing glassware, articles, nes 9.34 853120 Indicator panels incorporatg liquid crystal device/light emittg diode 9.32 850940 Domestic food grinders and mixers; fruit or vegetable juice extractors 9.24 841350 Reciprocating positive displacement pumps nes 9.11 852869 Projectors, not incorporating television reception apparatus (excl. of 8.96 848280 Bearings, ball or roller, nes, including combined ball/roller bearings 8.91 852721 Radio rece nt capabl of op w/o ext source of power f motor veh,combind 8.90 851840 Audio-frequency electric amplifiers 8.86 830249 Mountings, fittings and similar articles of base metal, nes 8.76 902680 Instruments&apparatus for measurg o check variables of liq o gases,nes 8.75 842911 Bulldozers and angledozers, crawler type 8.75 847982 Mach f mixing/kneading/crushing/grindg etc nes havg individ function 8.73 851632 Electro-thermic hair-dressing apparatus, nes 8.69 843120 Parts of fork-lift & other works trucks fitted with lifting equipment 8.60 871130 Motorcycles with reciprocatg piston engine displacg > 250 cc to 500 cc 8.55 901812 Ultrasonic scanning apparatus 8.52 846781 Chain saws 8.32 841950 Heat exchange units, non-domestic, non-electric 8.26 870810 Bumpers and parts for motor vehicles 8.26 761519 Table, kitchen, household goods nes, of aluminium 8.19 852550 Transmission apparatus for radio-broadcasting or television, not incor 8.13 842131 Intake air filters for internal combustion engines 8.04 851310 Portable electric lamp designd to function by thr own source of energy 7.94 732591 Balls, grinding and similar articles of iron or steel, cast for mills 7.93 843810 Bakery mach and machy for the mfg of macaroni, spaghetti or sim prods 7.92 842649 Derricks,cranes or work trucks fitted with a crane,self-propelled nes 7.84 821220 Safety razor blades, including razor blade blanks in strips 7.82 842641 Derricks/cranes o works trucks fittd w a crane,self-propelld on tires 7.76 871140 Motorcycles with reciprocatg piston engine displacg > 500 cc to 800 cc 7.75 851829 Loudspeakers, nes 7.74 845121 Dryg machines (o/t hdg No 84.50) each of a dry linen cap nt > 10kg 7.71 820790 Screwdriver bits, lapping tools and other interchangeable tools 7.71 902620 Instruments and apparatus for measuring or checking pressure 7.70 850140 AC motors, single-phase, nes 7.67 843041 Boring or sinking machinery nes, selfpropelled 7.55 850811 Vacuum cleaners, incl. dry cleaners and wet vacuum cleaners, with self 7.51 844319 Offset printing machinery nes 7.49 854430 Ignition wirg sets&oth wirg sets usd in vehicles,aircraft etc 7.49 841939 Non-domestic, non-electric dryers nes 7.38 850152 AC motors,multi-phase,of an output exceedg 750 W but not exceedg 75 KW 7.30 851110 Spark plugs 7.29 854590 Articles of carbon/graphite,of a kind usd for electrical purposes,nes 7.27 841460 Hoods having a maximum horizontal side not exceeding 120 cm 7.24 902730 Spectrometers,spectrophotometers&spectrographs usg optical radiations 7.22 851590 Pts of elec/laser/ultrasonic mach etc f weld/cut nes/hot spray of met 7.20 843820 Machinery for the manufacture of confectionary, cocoa or chocolate 7.18 930190 Military weapons, incl. sub-machine guns (excl. artillery weapons, roc 6.99 732410 Sinks and wash basins, stainless steel 6.87 732620 Articles of wire, iron or steel, nes 6.85 940520 Electric table, desk, bedside or floorstanding lamps 6.77 901813 Magnetic resonance imaging apparatus 6.65 847710 Injection-moulding machines for working rubber or plastics nes 6.63 850410 Ballasts for discharge lamps or tubes 6.61 841181 Gas turbines nes of a power not exceeding 5000 KW 6.57 870891 Radiators for motor vehicles 6.53 848790 Parts of machinery of chapter 84, not intended for a specific purpose, 6.52 852610 Radar aparatus 6.42 843229 Scarifiers, cultivators, weeders and hoes 6.39 902750 Instruments and apparatus using optical radiations (UV,visible,IR),nes 6.36 844311 Reel fed offset printing machinery 6.31
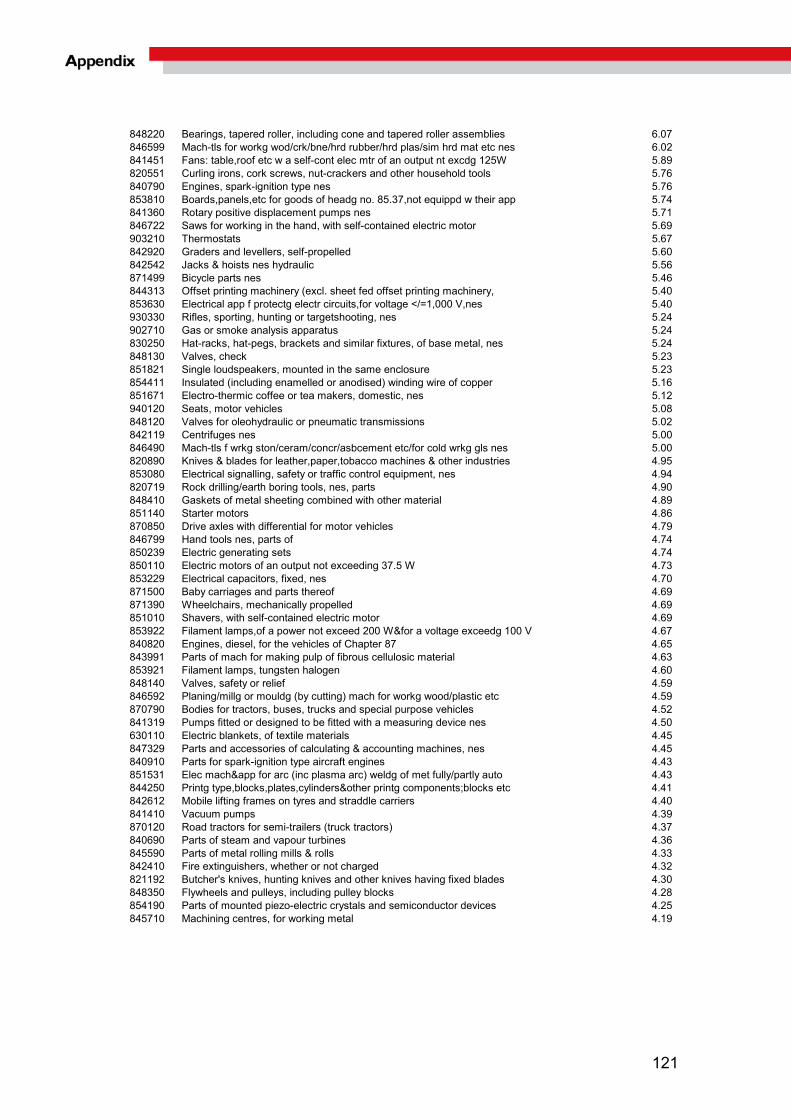
121
848220 Bearings, tapered roller, including cone and tapered roller assemblies 6.07 846599 Mach-tls for workg wod/crk/bne/hrd rubber/hrd plas/sim hrd mat etc nes 6.02 841451 Fans: table,roof etc w a self-cont elec mtr of an output nt excdg 125W 5.89 820551 Curling irons, cork screws, nut-crackers and other household tools 5.76 840790 Engines, spark-ignition type nes 5.76 853810 Boards,panels,etc for goods of headg no. 85.37,not equippd w their app 5.74 841360 Rotary positive displacement pumps nes 5.71 846722 Saws for working in the hand, with self-contained electric motor 5.69 903210 Thermostats 5.67 842920 Graders and levellers, self-propelled 5.60 842542 Jacks & hoists nes hydraulic 5.56 871499 Bicycle parts nes 5.46 844313 Offset printing machinery (excl. sheet fed offset printing machinery, 5.40 853630 Electrical app f protectg electr circuits,for voltage </=1,000 V,nes 5.40 930330 Rifles, sporting, hunting or targetshooting, nes 5.24 902710 Gas or smoke analysis apparatus 5.24 830250 Hat-racks, hat-pegs, brackets and similar fixtures, of base metal, nes 5.24 848130 Valves, check 5.23 851821 Single loudspeakers, mounted in the same enclosure 5.23 854411 Insulated (including enamelled or anodised) winding wire of copper 5.16 851671 Electro-thermic coffee or tea makers, domestic, nes 5.12 940120 Seats, motor vehicles 5.08 848120 Valves for oleohydraulic or pneumatic transmissions 5.02 842119 Centrifuges nes 5.00 846490 Mach-tls f wrkg ston/ceram/concr/asbcement etc/for cold wrkg gls nes 5.00 820890 Knives & blades for leather,paper,tobacco machines & other industries 4.95 853080 Electrical signalling, safety or traffic control equipment, nes 4.94 820719 Rock drilling/earth boring tools, nes, parts 4.90 848410 Gaskets of metal sheeting combined with other material 4.89 851140 Starter motors 4.86 870850 Drive axles with differential for motor vehicles 4.79 846799 Hand tools nes, parts of 4.74 850239 Electric generating sets 4.74 850110 Electric motors of an output not exceeding 37.5 W 4.73 853229 Electrical capacitors, fixed, nes 4.70 871500 Baby carriages and parts thereof 4.69 871390 Wheelchairs, mechanically propelled 4.69 851010 Shavers, with self-contained electric motor 4.69 853922 Filament lamps,of a power not exceed 200 W&for a voltage exceedg 100 V 4.67 840820 Engines, diesel, for the vehicles of Chapter 87 4.65 843991 Parts of mach for making pulp of fibrous cellulosic material 4.63 853921 Filament lamps, tungsten halogen 4.60 848140 Valves, safety or relief 4.59 846592 Planing/millg or mouldg (by cutting) mach for workg wood/plastic etc 4.59 870790 Bodies for tractors, buses, trucks and special purpose vehicles 4.52 841319 Pumps fitted or designed to be fitted with a measuring device nes 4.50 630110 Electric blankets, of textile materials 4.45 847329 Parts and accessories of calculating & accounting machines, nes 4.45 840910 Parts for spark-ignition type aircraft engines 4.43 851531 Elec mach&app for arc (inc plasma arc) weldg of met fully/partly auto 4.43 844250 Printg type,blocks,plates,cylinders&other printg components;blocks etc 4.41 842612 Mobile lifting frames on tyres and straddle carriers 4.40 841410 Vacuum pumps 4.39 870120 Road tractors for semi-trailers (truck tractors) 4.37 840690 Parts of steam and vapour turbines 4.36 845590 Parts of metal rolling mills & rolls 4.33 842410 Fire extinguishers, whether or not charged 4.32 821192 Butcher's knives, hunting knives and other knives having fixed blades 4.30 848350 Flywheels and pulleys, including pulley blocks 4.28 854190 Parts of mounted piezo-electric crystals and semiconductor devices 4.25 845710 Machining centres, for working metal 4.19

122
HS Code Description US$ MillionsX + M
610910 T-shirts, singlets and other vests, of cotton, knitted 64.04 570320 Carpets of nylon or other polyamides, tufted 47.63 620462 Womens/girls trousers and shorts, of cotton, not knitted 46.56 611030 Pullovers, cardigans and similar articles of man-made fibres, knitted 41.65 620342 Mens/boys trousers and shorts, of cotton, not knitted 40.01 621210 Brassieres and parts thereof, of textile materials 36.74 630790 Made up articles, of textile materials, nes, including dress patterns 33.64 610990 T-shirts,singlets and other vests,of other textile materials,knitted 29.16 611020 Pullovers, cardigans and similar articles of cotton, knitted 27.91 611430 Garments nes, of man-made fibres, knitted 26.92 611120 Babies garments and clothing accessories of cotton, knitted 23.75 620520 Mens/boys shirts, of cotton, not knitted 22.56 620443 Womens/girls dresses, of synthetic fibres, not knitted 21.07 620343 Mens/boys trousers and shorts, of synthetic fibres, not knitted 19.60 611011 Jerseys, pullovers, cardigans, waistcoats and similar articles, of woo 19.25 550320 Staple fibres of polyesters, not carded or combed 17.68 630232 Bed linen, of man-made fibres, nes 17.13 630260 Toilet&kitchen linen,of terry towellg or similar terry fab,of cotton 16.52 630231 Bed linen, of cotton, nes 16.44 510710 Yarn of combed wool,>/=85% by wght of wool,not put up for retail sale 15.95 611420 Garments nes, of cotton, knitted 15.86 620463 Womens/girls trousers and shorts, of synthetic fibres, not knitted 15.41 621143 Womens/girls garments nes, of man-made fibres, not knitted 14.06 610462 Womens/girls trousers and shorts, of cotton, knitted 13.14 610822 Womens/girls briefs and panties, of man-made fibres, knitted 12.54 620630 Womens/girls blouses and shirts, of cotton, not knitted 12.34 620442 Womens/girls dresses, of cotton, not knitted 11.88 551219 Woven fabrics,containg>/=85% of polyester staple fibres,o/t unbl or bl 11.52 610510 Mens/boys shirts, of cotton, knitted 11.30 570330 Carpets of other man-made textile materials, tufted 11.28 610443 Womens/girls dresses, of synthetic fibres, knitted 11.00 620193 Mens/boys anoraks and similar articles,of man-made fibres,not knitted 10.17 620433 Womens/girls jackets, of synthetic fibres, not knitted 10.02 620293 Womens/girls anoraks & similar article of man-made fibres,not knitted 10.00 630622 Tents, of synthetic fibres 9.97 611595 Full-length or knee-length stockings, socks and other hosiery, incl. f 9.83 630221 Bed linen, of cotton, printed, not knitted 9.08 620640 Womens/girls blouses and shirts, of man-made fibres, not knitted 9.05 610520 Mens/boys shirts, of man-made fibres, knitted 8.87 620920 Babies garments and clothing accessories of cotton, not knitted 8.65 540720 Woven fab obtaind from strip/the like of synthetic textile materials 8.64 621142 Womens/girls garments nes, of cotton, not knitted 8.61 610463 Womens/girls trousers and shorts, of synthetic fibres, knitted 8.58 610821 Womens/girls briefs and panties, of cotton, knitted 8.52 610711 Mens/boys underpants and briefs, of cotton, knitted 8.31 630533 Sacks, bags, packing, of strip plastic material 7.96 630291 Toilet and kitchen linen, of cotton, nes 7.58 610610 Womens/girls blouses and shirts, of cotton, knitted 7.28 611490 Garments nes, of other textile materials, knitted 6.99 630392 Curtains/drapes/interior blinds curtain/bd valances,of syn fib,nt knit 6.97 591132 Textile fabrics usd in paper-makg or similar mach,weighg >/=650 g/m2 6.90 620530 Mens/boys shirts, of man-made fibres, not knitted 6.63 610620 Womens/girls blouses and shirts, of man-made fibres, knitted 6.63 560313 Nonwovens, man-made filaments weighing 70-150g/m2 6.51 620453 Womens/girls skirts, of synthetic fibres, not knitted 6.46 630532 Flexible intermediate bulk containers, man-made mater 6.25
Appendix 11. Textiles Products with TSC valued at -1

123
610343 Mens/boys trousers and shorts, of synthetic fibres, knitted 6.24 611241 Womens/girls swimwear, of synthetic fibres, knitted 6.24 610442 Womens/girls dresses, of cotton, knitted 6.01 620452 Womens/girls skirts, of cotton, not knitted 5.86 630140 Blankets (o/t electric) and travelling rugs, of synthetic fibres 5.53 620432 Womens/girls jackets, of cotton, not knitted 5.34 600531 Unbleached or bleached warp knit fabrics of synthetic fibres "incl. th 5.33 620331 Mens/boys jackets and blazers,of wool or fine animal hair,not knitted 5.29 591190 Textile products and articles for technical uses, nes 5.12 540232 Texturd yarn nes,of nylon/oth polyamides fi,>50 tex/s.y.,not put up 5.10 611090 Pullovers,cardigans&similar articles of oth textile materials,knittd 5.06 621010 Garments made up of textile felts and of nonwoven textile fabrics 4.96 611596 Full-length or knee-length stockings, socks and other hosiery, incl. f 4.83 611130 Babies garments and clothing accessories of synthetic fibres, knitted 4.74 620333 Mens/boys jackets and blazers, of synthetic fibres, not knitted 4.63 590310 Textile fab impregnatd,ctd,cov,or laminatd w polyvinyl chloride,nes 4.54 630710 Floor-cloths,dish-cloths,dusters & similar cleaning cloths,of tex mat 4.51 560312 Nonwovens, man-made filaments weighing 25-70g/m2 4.47 620821 Womens/girls nightdresses and pyjamas, of cotton, not knitted 4.33 580632 Narrow woven fabrics of man-made fibres, nes 4.20 611610 Gloves impregnated, coated or covered with plastics or rubber, knitted 4.18 540261 Yarn of nylon or other polyamides fi, multiple, nes, not put up 4.14 621133 Mens/boys garments nes, of man-made fibres, not knitted 4.11 630222 Bed linen, of man-made fibres, printed, not knitted 4.09 610230 Womens/girls overcoats, anoraks etc, of man-made fibres, knitted 4.08 540761 Woven fabric >85% non-textured polyester filaments 4.07 570242 Carpets of man-made textile mat,of woven pile construction,made up,nes 4.02 620469 Womens/girls trousers & shorts,of other textile materials,not knitted 3.92 620213 Womens/girls overcoats&sim articles of man-made fibres,not knittd 3.77 610130 Mens/boys overcoats, anoraks etc, of man-made fibres, knitted 3.55 611522 Pantyhose and tights of synthetic fibres, knitted or crocheted, measur 3.53 610444 Womens/girls dresses, of artificial fibres, knitted 3.33 610892 Womens/girls bathrobes,dressing gowns,etc,of man-made fibres,knitted 3.28 620341 Mens/boys trousers and shorts,of wool or fine animal hair,not knitted 3.22 531010 Woven fabrics of jute or of other textile bast fibres, unbleached 3.20 520852 Plain weave cotton fabric,>/=85%, >100 g/m2 to 200 g/m2, printed 3.17 620332 Mens/boys jackets and blazers, of cotton, not knitted 3.16 610433 Womens/girls jackets, of synthetic fibres, knitted 3.12 610690 Womens/girls blouses and shirts, of other materials, knitted 3.01 620113 Mens/boys overcoats & similar articles of man-made fibres,not knitted 3.00 560314 Nonwovens, man-made filaments weighing >150g/m2 2.98 611521 Pantyhose and tights of synthetic fibres, knitted or crocheted, measur 2.98 611710 Shawls, scarves, veils and the like, of textile materials, knitted 2.89 550319 Staple fibres of nylon or other polyamides, not carded, combed or othe 2.88 590320 Textile fabrics impregnated,ctd,cov,or laminated with polyurethane,nes 2.84 621600 Gloves, mittens and mitts, of textile materials, not knitted 2.73 610832 Womens/girls nightdresses and pyjamas, of man-made fibres, knitted 2.71 510910 Yarn of wool/of fine animal hair,>/=85% by wght of such fibres,put up 2.71 551299 Woven fabrics,containg>/=85% of other synthetic staple fib,o/t unbl/bl 2.70 611510 Graduated compression hosiery [e.g., stockings for varicose veins], of 2.68 560311 Nonwovens, man-made filaments weighing <25g/m2 2.66 610831 Womens/girls nightdresses and pyjamas, of cotton, knitted 2.65 630612 Tarpaulins, awnings and sunblinds, of synthetic fibres 2.65 621430 Shawls, scarves, veils and the like, of synthetic fibres, not knitted 2.64 540752 Woven fabrics,>/=85% of textured polyester filaments, dyed, nes 2.58 500720 Woven fabrics of silk/silk waste,o/t noil silk,85%/more of such fibres 2.57 540710 Woven fab of high tenacity fi yarns of nylon oth polyamides/polyesters 2.56 620444 Womens/girls dresses, of artificial fibres, not knitted 2.47 630720 Life jackets and life belts, of textile materials 2.40 550340 Staple fibres of polypropylene, not carded or combed 2.38

124
560121 Wadding of cotton and articles thereof, o/t sanitary articles 2.30 551229 Woven fabrics,containing>/=85% of acrylic staple fibres,o/t unbl or bl 2.30 600122 Looped pile knitted or crocheted fabrics, of man-made fibres 2.28 630493 Furnishing articles nes, of synthetic fibres, not knitted or crocheted 2.22 560819 Knottd nettg of twine/cordage/rope,and oth made up nets of m-m tex mat 2.19 570110 Carpets of wool or fine animal hair, knotted 2.18 540730 Fabrics specif in Note 9 Section XI (layers of parallel syn tex yarn) 2.17 620211 Womens/girls overcoats&sim articles of wool/fine animal hair nt knit 2.16 620439 Womens/girls jackets, of other textile materials, not knitted 2.11 630391 Curtains/drapes/interior blinds&curtain/bd valances,of cotton,not knit 2.07 620891 Womens/girls panties, bathrobes, etc, of cotton, not knitted 2.04 630130 Blankets (o/t electric) and travelling rugs, of cotton 2.02 620892 Womens/girls panties, bathrobes, etc, of man-made fibres, not knitted 2.01 611693 Gloves, mittens and mitts, nes, of synthetic fibres, knitted 1.99 621710 Clothing accessories nes, of textile materials, not knitted 1.98 610342 Mens/boys trousers and shorts, of cotton, knitted 1.98 621040 Mens/boys garments nes,made up of impreg,ctd,cov,etc,textile woven fab 1.97 540412 Polypropylene monofilament of >= 67 decitex and with a cross sectional 1.95 621149 Womens/girls garments nes, of other textile materials, not knitted 1.89 610220 Womens/girls overcoats, anoraks etc, of cotton, knitted 1.88 610453 Womens/girls skirts, of synthetic fibres, knitted 1.86 590190 Tracg cloth;prepared paintg canvas;stiffened textile fab;for hats etc 1.85 620610 Womens/girls blouses and shirts, of silk or silk waste, not knitted 1.83 560900 Articles of yarn, strip, twine, cordage, rope and cables, nes 1.81 520832 Plain weave cotton fabric,>/=85%,>100g/m= to 200g/m=, dyed 1.78 630491 Furnishing articles nes, of textile materials, knitted or crocheted 1.78 530919 Woven fabrics,containing 85% or more by weight of flax,o/t unbl or bl 1.74 540110 Sewing thread of synthetic filaments 1.72 610839 Womens/girls nightdresses & pyjamas,of other textile materials,knitted 1.72 560811 Made up fishing nets, of man-made textile materials 1.69 551511 Woven fab of polyester staple fib mixd w viscose rayon staple fib,nes 1.68 610469 Womens/girls trousers and shorts, of other textile materials, knitted 1.67 621112 Womens/girls swimwear, of textile materials, not knitted 1.67 540793 Woven fabrics of synthetic filaments, yarn dyed, nes 1.65 610432 Womens/girls jackets, of cotton, knitted 1.62 620721 Mens/boys nightshirts and pyjamas, of cotton, not knitted 1.56 620431 Womens/girls jackets, of wool or fine animal hair, not knitted 1.55 630251 Table linen, of cotton, not knitted 1.55 540769 Woven fabric >85% polyester filaments, nes 1.54 591000 Transmission or conveyor belts or belting of textile material 1.54 620212 Womens/girls overcoats and similar articles of cotton, not knitted 1.49 610899 Women/girls bathrobes,dressg gowns,etc,of oth textile materials,knittd 1.49 610891 Womens/girls bathrobes, dressing gowns, etc, of cotton, knitted 1.49 620423 Womens/girls ensembles, of synthetic fibres, not knitted 1.46 551110 Yarn,>/=85% of synthetic staple fibres, o/t sewing thread, put up 1.45 610449 Womens/girls dresses, of other textile materials, knitted 1.45 520939 Woven fabrics of cotton,>/=85%, more than 200 g/m2, dyed, nes 1.44 610590 Mens/boys shirts, of other textile materials, knitted 1.44 630492 Furnishing articles nes, of cotton, not knitted or crocheted 1.42 630499 Furnishg articles nes,of oth textile materials,not knittd o crochetd 1.41 580135 Woven warp pile fabrics of man-made fib,cut,o/t terry & narrow fabrics 1.40 560393 Nonwovens nes weighing 70-150g/m2 1.40 520839 Woven fabrics of cotton,>/=85%, not more than 200 g/m2, dyed, nes 1.39 610441 Womens/girls dresses, of wool or fine animal hair, knitted 1.38 510529 Wool tops and other combed wool, other than combed wool in fragments 1.37 621050 Womens/girls garments nes,of impregnatd,ctd,cov,etc,textile woven fab 1.36 620459 Womens/girls skirts, of other textile materials, not knitted 1.34 620930 Babies garments & clothing accessories of synthetic fibres,not knitted 1.34 600532 Dyed warp knit fabrics of synthetic fibres "incl. those made on galloo 1.31 610333 Mens/boys jackets and blazers, of synthetic fibres, knitted 1.30

125
531090 Woven fabrics of jute or of other textile bast fibres, o/t unbleached 1.29 621490 Shawls,scarves,veils & the like,of other textile materials,not knitted 1.28 530500 Coconut, abaca Manila hemp or Musa textilis Nee, ramie, agave and othe 1.28 630239 Bed linen, of other textile materials, nes 1.27 580136 Chenille fabrics of man-made fibres, o/t narrow fabrics 1.27 620111 Mens/boys overcoats&similar articles of wool/fine animal hair,not knit 1.25 520859 Woven fabrics of cotton,>/=85%, not more than 200 g/m2,printed, nes 1.23 611190 Babies garments&clothg accessories of other textile materials,knitted 1.20 530929 Woven fabrics of flax,containing <85% by weight of flax,o/t unbl or bl 1.20 570490 Carpets of felt of textile materials, nes 1.18 570249 Carpets of oth textile materials,of wovn pile construction,made up,nes 1.17 610120 Mens/boys overcoats, anoraks etc, of cotton, knitted 1.16 630229 Bed linen, of other textile materials, printed, not knitted 1.15 610721 Mens/boys nightshirts and pyjamas, of cotton, knitted 1.14 611780 Clothing accessories nes, of textile materials, knitted 1.13 610712 Mens/boys underpants and briefs, of man-made fibres, knitted 1.13 581092 Embroidery of man-made fibres,in the piece,in strips or in motifs,nes 1.13 551519 Woven fabrics of polyester staple fibres, nes 1.13 621290 Corsets,braces & similar articles & parts thereof,of textile materials 1.11 620339 Mens/boys jackets and blazers, of other textile materials, not knitted 1.11 610799 Mens/boys bathrobes,dressg gowns,etc of oth textile materials,knitted 1.10 620822 Womens/girls nightdresses and pyjamas, of man-made fibres, not knitted 1.10 540419 Synthetic monofilament of >= 67 decitex and with a cross sectional dim 1.10 620711 Mens/boys underpants and briefs, of cotton, not knitted 1.09 620719 Mens/boys underpants and briefs,of other textile materials,not knitted 1.08 540792 Woven fabrics of synthetic filaments, dyed, nes 1.07 621420 Shawls,scarves,veils&the like,of wool or fine animal hair,not knitted 1.07 610452 Womens/girls skirts, of cotton, knitted 1.07 540231 Texturd yarn nes,of nylon/oth polyamides fi,</=50tex/s.y.,not put up 1.06 551513 Woven fab of polyester staple fibres mixd w/wool/fine animal hair,nes 1.06 620192 Mens/boys anoraks and similar articles, of cotton, not knitted 1.06 551421 Plain weave polyester staple fibre fab,<85%,mixd w/cotton,>170g/m2,dyd 1.06 621132 Mens/boys garments nes, of cotton, not knitted 1.05 620292 Womens/girls anoraks and similar article of cotton, not knitted 1.03 330620 Dental floss, yarn used to clean between teeth 0.98 590699 Rubberised textile fabrics, nes 0.95 540234 Textured synthetic filament yarn of polypropylene (excl. sewing thread 0.95 540773 Woven fabrics,>/=85% of synthetic filaments, yarn dyed, nes 0.95 611530 Women''s full-length or knee-length hosiery, knitted or crocheted, mea 0.95 551512 Woven fabrics of polyester staple fibres mixd w man-made filaments,nes 0.93 540754 Woven fabrics,>/=85% of textured polyester filaments, printed, nes 0.90 521149 Woven fabrics of cotton,<85% mixd with m-m fib,>200 g/m2,yarn dyed,nes 0.90 550140 Synthetic filament tow as specified in Note 1 to chapter 55, of polypr 0.89 520932 Twill weave cotton fabrics,>/=85%, more than 200 g/m2, dyed 0.88 560790 Twine, cordage, ropes and cables, of other materials 0.87 631010 Used or new rags of textile materials, sorted 0.87 520951 Plain weave cotton fabrics,>/=85%, more than 200 g/m2, printed 0.85 621410 Shawls,scarves,veils and the like,of silk or silk waste,not knitted 0.83 551623 Woven fabrics of artificial staple fib,<85%,mixd with m-m fi,yarn dyd 0.81 610332 Mens/boys jackets and blazers, of cotton, knitted 0.80 590410 Lineoleum, whether or not cut to shape 0.80 551349 Woven fab of oth syn staple fib,<85%,mixed w/cot,</=170g/m2,printed 0.79 551423 Woven fabrics of polyester staple fib,<85%,mixed w/cot,>170 g/m2,dyed 0.79 610190 Mens/boys overcoats, anoraks etc, of other textile materials, knitted 0.77 500790 Woven fabrics of silk, nes 0.77 540783 Woven fabrics of synthetic filaments,<85% mixd w cotton,yarn dyd,nes 0.77 521031 Plain weave cotton fab,<85% mixd w m-m fib,not more than 200 g/m2,dyd 0.76 520931 Plain weave cotton fabrics,>/=85%, more than 200 g/m2, dyed 0.75 520959 Woven fabrics of cotton,>/=85%, more than 200 g/m2, printed, nes 0.75 520851 Plain weave cotton fabrics,>/=85%, not more than 100 g/m2, printed 0.74
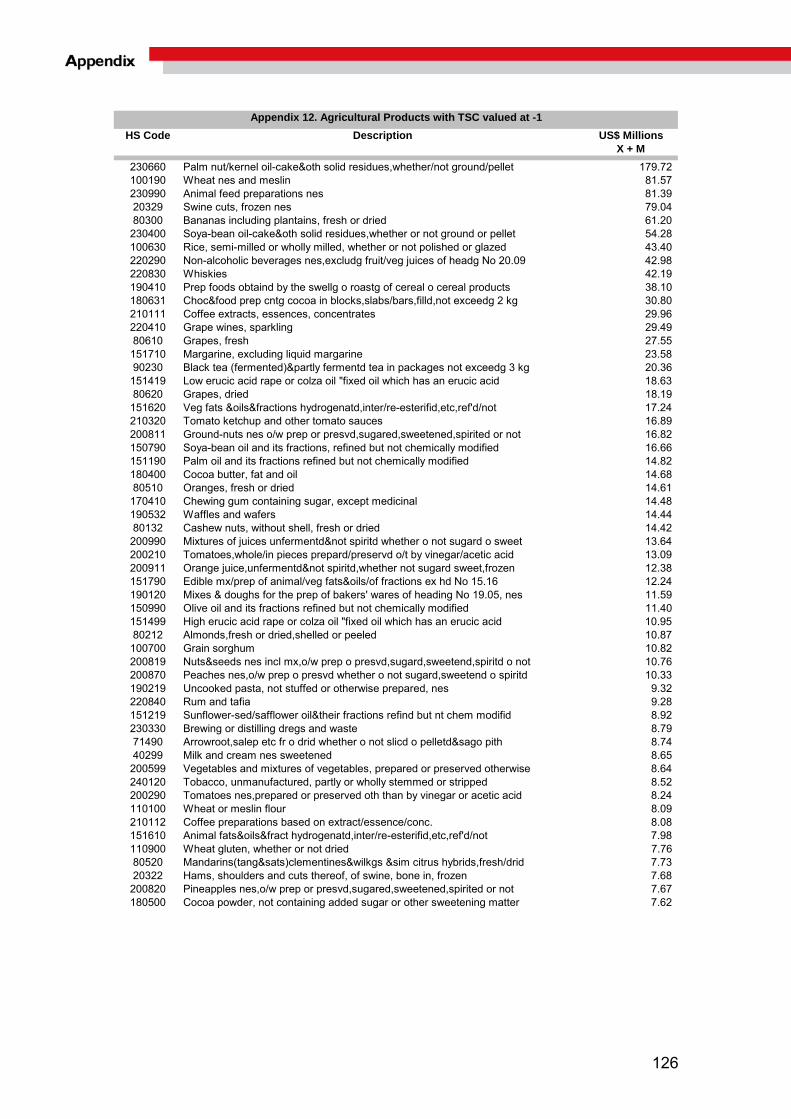
126
HS Code Description US$ MillionsX + M
230660 Palm nut/kernel oil-cake&oth solid residues,whether/not ground/pellet 179.72 100190 Wheat nes and meslin 81.57 230990 Animal feed preparations nes 81.39 20329 Swine cuts, frozen nes 79.04 80300 Bananas including plantains, fresh or dried 61.20 230400 Soya-bean oil-cake&oth solid residues,whether or not ground or pellet 54.28 100630 Rice, semi-milled or wholly milled, whether or not polished or glazed 43.40 220290 Non-alcoholic beverages nes,excludg fruit/veg juices of headg No 20.09 42.98 220830 Whiskies 42.19 190410 Prep foods obtaind by the swellg o roastg of cereal o cereal products 38.10 180631 Choc&food prep cntg cocoa in blocks,slabs/bars,filld,not exceedg 2 kg 30.80 210111 Coffee extracts, essences, concentrates 29.96 220410 Grape wines, sparkling 29.49 80610 Grapes, fresh 27.55 151710 Margarine, excluding liquid margarine 23.58 90230 Black tea (fermented)&partly fermentd tea in packages not exceedg 3 kg 20.36 151419 Low erucic acid rape or colza oil "fixed oil which has an erucic acid 18.63 80620 Grapes, dried 18.19 151620 Veg fats &oils&fractions hydrogenatd,inter/re-esterifid,etc,ref'd/not 17.24 210320 Tomato ketchup and other tomato sauces 16.89 200811 Ground-nuts nes o/w prep or presvd,sugared,sweetened,spirited or not 16.82 150790 Soya-bean oil and its fractions, refined but not chemically modified 16.66 151190 Palm oil and its fractions refined but not chemically modified 14.82 180400 Cocoa butter, fat and oil 14.68 80510 Oranges, fresh or dried 14.61 170410 Chewing gum containing sugar, except medicinal 14.48 190532 Waffles and wafers 14.44 80132 Cashew nuts, without shell, fresh or dried 14.42 200990 Mixtures of juices unfermentd¬ spiritd whether o not sugard o sweet 13.64 200210 Tomatoes,whole/in pieces prepard/preservd o/t by vinegar/acetic acid 13.09 200911 Orange juice,unfermentd¬ spiritd,whether not sugard sweet,frozen 12.38 151790 Edible mx/prep of animal/veg fats&oils/of fractions ex hd No 15.16 12.24 190120 Mixes & doughs for the prep of bakers' wares of heading No 19.05, nes 11.59 150990 Olive oil and its fractions refined but not chemically modified 11.40 151499 High erucic acid rape or colza oil "fixed oil which has an erucic acid 10.95 80212 Almonds,fresh or dried,shelled or peeled 10.87 100700 Grain sorghum 10.82 200819 Nuts&seeds nes incl mx,o/w prep o presvd,sugard,sweetend,spiritd o not 10.76 200870 Peaches nes,o/w prep o presvd whether o not sugard,sweetend o spiritd 10.33 190219 Uncooked pasta, not stuffed or otherwise prepared, nes 9.32 220840 Rum and tafia 9.28 151219 Sunflower-sed/safflower oil&their fractions refind but nt chem modifid 8.92 230330 Brewing or distilling dregs and waste 8.79 71490 Arrowroot,salep etc fr o drid whether o not slicd o pelletd&sago pith 8.74 40299 Milk and cream nes sweetened 8.65 200599 Vegetables and mixtures of vegetables, prepared or preserved otherwise 8.64 240120 Tobacco, unmanufactured, partly or wholly stemmed or stripped 8.52 200290 Tomatoes nes,prepared or preserved oth than by vinegar or acetic acid 8.24 110100 Wheat or meslin flour 8.09 210112 Coffee preparations based on extract/essence/conc. 8.08 151610 Animal fats&oils&fract hydrogenatd,inter/re-esterifid,etc,ref'd/not 7.98 110900 Wheat gluten, whether or not dried 7.76 80520 Mandarins(tang&sats)clementines&wilkgs &sim citrus hybrids,fresh/drid 7.73 20322 Hams, shoulders and cuts thereof, of swine, bone in, frozen 7.68 200820 Pineapples nes,o/w prep or presvd,sugared,sweetened,spirited or not 7.67 180500 Cocoa powder, not containing added sugar or other sweetening matter 7.62
Appendix 12. Agricultural Products with TSC valued at -1

127
71333 Kidney beans&white pea beans drid shelld,whether o not skinnd o split 7.61 81310 Apricots, dried 7.23 80430 Pineapples, fresh or dried 6.63 130219 Vegetable saps and extracts nes 6.59 180310 Cocoa paste not defatted 6.21 70320 Garlic, fresh or chilled 5.73 220850 Gin and geneva 5.67 150910 Olive oil, virgin 5.51 151411 Low erucic acid rape or colza oil "fixed oil which has an erucic acid 5.40 200570 Olives prepard o preservd,oth than by vinegar o acetic acid,not frozen 5.05 121220 Seaweeds and other algae, fresh or dried whether or not ground 5.02 180100 Cocoa beans, whole or broken, raw or roasted 5.01 200190 Veg,fruit,nut&edible prts of plants nes,prep/presvd by vin/acetic acid 4.89 200912 Orange juice, unfermented, Brix value <= 20 at 20°C, whether or not co 4.81 80450 Guavas, mangoes and mangosteens, fresh or dried 4.62 210210 Yeasts, active 4.54 70820 Beans, shelled or unshelled, fresh or chilled 4.45 80719 Melons, fresh, other than watermelons 4.36 210310 Soya sauce 4.32 80232 Walnuts, fresh or dried, shelled or peeled 4.31 121190 Plants &pts of plants(incl sed&fruit) usd in pharm,perf,insect etc nes 4.31 120810 Soya bean flour and meals 4.15 81320 Prunes, dried 4.14 210220 Yeasts, inactive and other dead singlecell micro-organisms 4.14 80290 Nuts edible, fresh or dried, whether or not shelled or peeled, nes 4.14 100300 Barley 3.67 80930 Peaches, including nectarines, fresh 3.56 190300 Tapioca subst prep from starch in flake,grain,pearl,siftg or sim forms 3.48 160249 Swine meat&meat offal nes/exc livers/ incl mixtures,prepard o preservd 3.37 110412 Oats, rolled or flaked grains 3.37 220820 Spirits obtained by distilling grape wine or grape marc 3.36 130239 Mucilages&thickeners nes,modifid or not,derivd from vegetable products 3.25 210330 Mustard flour and meal and prepared mustard 3.15 151800 Animal/veg fats&oils&fract boild oxid,etc,& ind mix/prep nes ex 15.16 3.11 220900 Vinegar and substitutes for vinegar obtained from acetic acid 3.08 151319 Coconut (copra) oil&its fractions refined but not chemically modified 3.06 120220 Ground-nuts shelld,whether or not broken,not roastd or otherwise cookd 3.00 120799 Oil seeds and oleaginous fruits, nes, whether or not broken 2.90 170230 Glucose&glucose syrup nt cntg fruct/cntg in dry state <20% by wt fruct 2.86 80122 Brazil nuts, without shell, fresh or dried 2.85 80410 Dates, fresh or dried 2.83 230800 Acorns, horse-chestnuts, marc and other vegetable materials and vegeta 2.74 80711 Watermelons, fresh 2.58 200850 Apricots nes,o/w prep o presvd whether o not sugard,sweetend o spiritd 2.58 100640 Rice, broken 2.52 180610 Cocoa powder, containing added sugar or other sweetening matter 2.52 81340 Fruits, dried nes 2.51 71220 Onions dried but not further prepared 2.48 210230 Baking powders, prepared 2.47 110814 Manioc (cassava) starch 2.41 80111 Coconuts, dessicated 2.39 240210 Cigars, cheroots and cigarillos, containing tobacco 2.39 120890 Flours and meals of oil seeds or oleaginous fruits,except mustard,nes 2.30 80260 Macadamia nuts, fresh or dried, whether or not shelled or peeled 2.27 110290 Cereal flour nes 2.22 20321 Swine carcasses and half carcasses, frozen 2.18 91010 Ginger 2.13 190510 Crispbread 2.13 91099 Spices nes 2.02 100620 Rice, husked (brown) 2.00

128
81110 Strawberries,uncookd o steamd o boild in water,sweetend o not,frozen 2.00 200110 Cucumbers and gherkins,prepared or preserved by vinegar or acetic acid 1.94 130220 Pectic substances, pectinates & pectates 1.91 21019 Swine meat cured, nes 1.88 200969 Grape juice, incl. grape must, unfermented, Brix value > 30 at 20°C, w 1.88 200840 Pears nes,o/w prep or presvd whether or not sugared,sweetened,spirited 1.86 80222 Hazelnuts or filberts, fresh or dried, shelled or peeled 1.80 110710 Malt, not roasted 1.78 120600 Sunflower seeds, whether or not broken 1.77 110520 Potato flakes 1.73 120740 Sesamum seeds, whether or not broken 1.73 230230 Wheat bran, sharps and other residues, pelleted or not 1.72 80720 Papaws (papayas), fresh 1.55 230650 Coconut/copra oil-cake&oth solid residues,whether/not ground/pellet 1.51 151211 Sunflower-seed or safflower oil, crude 1.51 200949 Pineapple juice, unfermented, Brix value > 20 at 20°C, whether or not 1.42 80940 Plums and sloes, fresh 1.42 200600 Fruit,nut,fruit-peel&pts of plant presvd by sugar (draind,glacé/cryst) 1.40 110820 Inulin 1.35 80250 Pistachios, fresh or dried, whether or not shelled or peeled 1.35 130232 Mucilages & thickeners derived from locust beans & seeds or guar seeds 1.34 190540 Rusks, toasted bread and similar toasted products 1.34 150710 Soya-bean oil crude, whether or not degummed 1.34 90412 Pepper of the genus Piper, except cubeb pepper, crushed or ground 1.33 200971 Apple juice, unfermented, Brix value <= 20 at 20°C, whether or not con 1.31 90420 Fruits of the genus Capsicum or Pimenta, dried, crushed or ground 1.29 110630 Flour,meal&powder of edible fruits&nuts&peel of citrus fruit or melons 1.28 200931 Single citrus fruit juice, unfermented, Brix value <= 20 at 20°C, whet 1.27 151329 Palm kernel/babassu oil their fract,refind but not chemically modifid 1.27 230610 Cotton sed oil-cake&oth solid residues,whether or not ground or pellet 1.26 71010 Potatoes, frozen 1.25 151550 Sesame oil&its fractions whether/not refind,but not chemically modifid 1.21 71320 Chickpeas, dried, shelled, whether or not skinned or split 1.19 210120 Tea or maté extracts,essences & concentrates & preparations thereof 1.18 120100 Soya beans 1.17 230641 Oil-cake and other solid residues, whether or not ground or in the for 1.14 90411 Pepper of the genus Piper,ex cubeb pepper,neither crushd nor ground 1.08 170220 Maple sugar and maple syrup 1.07 151311 Coconut (copra) oil crude 0.99 71340 Lentils dried, shelled, whether or not skinned or split 0.98 71410 Manioc (cassava), fresh or dried, whether or not sliced or pelleted 0.93 200961 Grape juice, incl. grape must, unfermented, Brix value <= 30 at 20°C, 0.93 20649 Swine edible offal, frozen nes 0.88 220510 Vermouth&oth grape wines flav w plants o arom subst in ctnr </= 2 l 0.88 70930 Aubergines(egg-plants), fresh or chilled 0.87 200939 Single citrus fruit juice, unfermented, Brix value > 20 at 20°C, wheth 0.86 71331 Urd,mung,black/green gram beans drid shelld,whether/not skinnd/split 0.86 150500 Wool grease and fatty substances derived therefrom, incl. lanolin 0.83 190240 Couscous 0.81 150890 Ground-nut oil and its fractions refined but not chemically modified 0.80 80420 Figs, fresh or dried 0.77 150100 Lard;pig fat nes&poultry fat,renderd,whether/not pressd/solv-extractd 0.75 100820 Millet 0.74 230690 Veg oil-cake&oth solid residues nes,whether or not ground or pelleted 0.73 200941 Pineapple juice, unfermented, Brix value <= 20 at 20°C, whether or not 0.73 170240 Glucose inc syrup cntg in dry state min 20% but <50% by wt of fructose 0.73 110422 Oats, hulled,pearled,sliced or kibbled 0.72 151229 Cotton-seed and its fractions refined but not chemically modified 0.72 71339 Beans dried, shelled, whether or not skinned or split, nes 0.71 71231 Dried mushrooms of the genus "Agaricus", whole, cut, sliced, broken or 0.71

129
70810 Peas, shelled or unshelled, fresh or chilled 0.70 60311 Fresh cut roses and buds, of a kind suitable for bouquets or for ornam 0.69 230649 Oil-cake and other solid residues, whether or not ground or in the for 0.69 170260 Fructose&fructose syrup nes,cntg in dry state >50% by wght of fructose 0.68 110811 Wheat, starch 0.66 230320 Beet-pulp, bagasse and other waste of sugar manufacture 0.63 110311 Wheat groats and meal 0.62 200591 Bamboo shoots, prepared or preserved otherwise than by vinegar or acet 0.61 90220 Green tea (not fermented) in packages exceeding 3 kg 0.61 80119 Coconuts, excluding dessicated 0.59 90930 Cumin seeds 0.58 91091 Mixtures of two/more of the prods of different headgs to this chapter 0.58 200860 Cherries nes,o/w prep o presvd whether o not sugard,sweetend o spiritd 0.57 120921 Seeds, lucerne (alfalfa), for sowing 0.57 200310 Mushrooms prepared or preserved other than by vinegar or acetic acid 0.56 81290 Fruits&nuts provis preservd but unfit f immediate consumption nes 0.56 160239 Dom fowl,duck,goose&guinea fowl meat&meat offal prep/presvd exc livers 0.53 71332 Beans,small red (Adzuki) dried,shelled,whether or not skinned or split 0.53 40291 Milk and cream unsweetened, nes 0.51 100890 Cereals unmilled nes 0.49 240130 Tobacco refuse 0.47 110419 Cereals, rolled or flaked grains nes 0.46 160241 Hams and cuts thereof of swine prepared or preserved 0.45 80540 Grapefruit, fresh or dried 0.45 71140 Cucumbers&gherkins provisionally presvd,but nt f immediate consumption 0.41 91030 Turmeric (curcuma) 0.40 90810 Nutmeg 0.39 40891 Eggs, bird, not in shell, dried 0.39 90830 Cardamoms 0.36 40811 Egg yolks dried 0.35 151000 Oils&thr fract nes obt from olives,ref'd/not,not chem mod,incl blends 0.35 200830 Citrus fruits nes,o/w prep or presvd,sugared,sweetened,spirited or not 0.34 110423 Maize (corn), hulled, pearled, sliced or kibbled 0.33 71239 Dried mushrooms and truffles, whole, cut, sliced, broken or in powder, 0.29 21011 Hams, shoulders and cuts thereof, of swine bone in, cured 0.29 130212 Liquorice extract 0.29 140110 Bamboos used primarily for plaiting 0.27 230240 Cereal bran, sharps and other residues nes, pelleted or not 0.27 100830 Canary seed 0.26 91020 Saffron 0.25 120791 Poppy seeds, whether or not broken 0.22 71390 Leguminous vegetables dried,shelled,whether or not skinnd or split,nes 0.22 110610 Flour and meal of the dried leguminous vegetables of heading No 07.13 0.22 200921 Grapefruit juice, unfermented, Brix value <= 20 at 20°C, whether or no 0.22 20900 Pig fat lean meat free&poultry fat unrenderd,frsh,chilld,frozn or curd 0.22 90620 Cinnamon and cinnamon-tree flowers crushed or ground 0.21 81210 Cherries provisionally preservd but unsuitable f immediate consumption 0.21 121020 Hop cones, ground, powdered or pelleted and lupulin 0.20 151529 Maize (corn) oil and its fractions,refined but not chemically modified 0.20 200390 Mushrooms, prepared or preserved otherwise than by vinegar or acetic a 0.19 190520 Gingerbread and the like 0.19 151530 Castor oil&its fractions,whether/not refind,but not chemically modifid 0.19 90700 Cloves (whole fruit, cloves and stems) 0.18 210130 Chicory&other coffee substitutes roasted&extracts,ess&conc thereof 0.18 50510 Feathers used for stuffg&down cleaned,disinfected or treated for presv 0.17 50210 Bristles, hair and waste of pigs, hogs or boars 0.16 152110 Vegetable waxes excludg triglycerides,whether or not refind or colourd 0.15 130120 Gum arabic 0.14 121300 Cereal straw&husks,unprepd,whether or not choppd,ground,pressd,pelletd 0.14 90910 Anise or badian seeds 0.14