market analysis of selected agroforestry products in the
TRANSCRIPT

Market Analysis of Selected Agroforestry Products in theVision for Change Project Intervention Zone, Côte d’Ivoire
Kaitlyn Smoot, Amos Gyau, Christophe Kouame, Lucien Diby

!!
Market Analysis of Selected Agroforestry Products in the Vision for Change Project Intervention Zone, Côte d’Ivoire
!
Kaitlyn Smoot
Amos Gyau
Christophe Kouame
Lucien Diby

!!
LIMITED CIRCULATION
! Correct citation: Smoot K, Gyau A, Kouame C, Diby L. 2013. Market analysis of selected agroforestry products in the Vision for Change Project intervention zone, Côte d’Ivoire. Working paper 174. Nairobi, Kenya, DOI http://dx.doi.org/10.5716/WP13249.PDF
! Titles in the Working Paper Series aim to disseminate interim results on agroforestry research and practices and stimulate feedback from the scientific community. Other publication series from the World Agroforestry Centre include: Trees for Change, Technical Manuals and Occasional Papers. Published by the World Agroforestry Centre United Nations Avenue PO Box 30677, GPO 00100 Nairobi, Kenya Tel: +254(0)20 7224000, via USA +1 650 833 6645 Fax: +254(0)20 7224001, via USA +1 650 833 6646 Email: [email protected] Internet: www.worldagroforestry.org © World Agroforestry Centre 2013 ICRAF Working Paper nr 174
The views expressed in this publication are those of the author(s) and not necessarily those of the World Agroforestry Centre.
Articles appearing in this publication may be quoted or reproduced without charge, provided the source is acknowledged.
All images remain the sole property of their source and may not be used for any purpose without written permission of the source.
!

!!About the authors
Kaitlyn Smoot is a Borlaug Fellow based at the ICRAF office in Soubré. Her areas of interest include intercropping cocoa with fruit trees, extension and cooperative capacity building. Dr Amos Gyau is a marketing specialist (scientist) based at ICRAF HQ. He holds a PhD in Agricultural and Food Marketing from the University of Goettingen in Germany. His research interests include value chain analysis and quality assurance systems. Dr Christophe Kouame is a senior scientist and manager of the Vision for Change (V4C) project which aims to build sustainable cocoa communities in Côte d'Ivoire. He has over 20 years experience in agricultural research for development. His research interests include variety development and the promotion of sustainable production systems. Dr Lucien Diby is a soil scientist based at ICRAF in Côte d'Ivoire. The main focus of his work is to design and implement a land health surveillance system for cocoa as part of the Vision for Change project. He has worked for more than 10 years on soil fertility and food security related issues.

!!
i!!
TABLE OF CONTENTS LIST OF FIGURES ................................................................................................................................. iii LIST OF TABLES ................................................................................................................................... iii LIST OF ABBREVIATIONS ..................................................................................................................... v !1: INTRODUCTION ................................................................................................................................... 1
1.1 Rationale and background ......................................................................................................... 1 1.2 Objectives ...................................................................................................................................... 2
2: METHODOLOGY .................................................................................................................................. 4 2.1 Quantitative producer survey- sample selection and data collection methods .............................. 4 2.2 Qualitative interviews - sample selection and data collection methods ........................................ 5 2.3 Description of study region ........................................................................................................... 6
2.3.1 Population estimates ............................................................................................................... 7 2.3.2 Other demographic information ............................................................................................. 7 2.3.3 Climate .................................................................................................................................... 8
3: INITIAL TREE SELECTION .................................................................................................................. 9 3.1 Potential alternative crops of interest ............................................................................................ 9 3.2 Selection criteria .......................................................................................................................... 11 3.3 Summary of rankings and conclusions ........................................................................................ 11
4: QUANTITATIVE SURVEY RESULTS- SOCIOECONOMICS, TREES PRESENT .................................... 13 4.1 Socioeconomic characteristics of surveyed villages and producers ............................................ 13 4.2 Presence and densities of the selected trees ................................................................................ 14 4.3 Agroforestry attitudes and practices ............................................................................................ 17 4.4 Sources of germplasm for existing trees ..................................................................................... 19
5: MARKETING OF AGROFORESTRY PRODUCTS- VALUE CHAIN DESCRIPTIONS ............................. 21 5.1 Akpi value chain .......................................................................................................................... 21 5.2 Palm value chain .......................................................................................................................... 24 5.3 Timber and fuelwood value chain ............................................................................................... 28 5.4 Citrus value chain ........................................................................................................................ 33 5.5 Seasonality and storage issues ..................................................................................................... 37
6: SUPPLY AND DEMAND ESTIMATION OF SELECTED PRODUCTS .................................................... 41 6.1 Production, consumption and sales summary for selected products ........................................... 41 6.2 Supply and demand estimation .................................................................................................... 45
7: PRICES AND GROSS MARGIN ANALYSIS ........................................................................................ 49 7.1 Prices ........................................................................................................................................... 49 7.2 Approximate arbitrage profits ..................................................................................................... 51
8: COMPARISON OF MARKETING ADVANTAGES AND CONSTRAINTS ............................................... 61 8.1 Marketing opportunities and difficulties ..................................................................................... 61 8.2 Porter’s Five Forces and SWOT Analysis ................................................................................... 64
8.2.1 Akpi market .......................................................................................................................... 64
!

!!
ii!!
8.2.2 Oil palm market .................................................................................................................... 65 8.2.3 Timber and fuelwood market ............................................................................................... 68 8.2.4 Citrus market ........................................................................................................................ 70
9: CONCLUSIONS AND RECOMMENDATIONS ...................................................................................... 72 9.1 Recommendations for akpi .......................................................................................................... 72 9.2 Recommendations for palm products .......................................................................................... 73 9.3 Recommendations for timber and fuelwood ............................................................................... 73 9.4 Recommendations for citrus ........................................................................................................ 75
REFERENCES ...................................................................................................................................... 76 APPENDIX ........................................................................................................................................... 78
! !
!

!!
iii!!
LIST OF FIGURES !Figure 2.1: Map of villages surveyed in V4C intervention zone ............................................................. 4 Figure 5.1: Akpi value chain map ......................................................................................................... 23 Figure 5.2: Oil palm value chain map ................................................................................................... 27 Figure 5.3: Timber and fuelwood value chain map ............................................................................... 31 Figure 5.4: Citrus value chain map ........................................................................................................ 35 Figure 6.1: Proportions of households which consume selected products ............................................ 44 Figure 6.2: Average weekly consumption of selected products ............................................................ 44 Figure 6.3: Comparison of supply and demand for selected products .................................................. 48
LIST OF TABLES
Table 2.1: Number of actors interviewed by category and tree crop type ............................................... 6 Table 3.1: Full list - potential alternative crops of interest ...................................................................... 9 Table 3.2: Proportion of focus groups ranking tree among the top 5, by zone ....................................... 9 Table 3.3: Crops of highest profitability rankings by zone ................................................................... 10 Table 3.4: Proportion of farmer focus groups ranking tree among top 5, by gender ............................ 10 Table 3.5: Crops of highest profitability rankings by gender ................................................................ 10 Table 3.6: Selection criteria for ranking of crops .................................................................................. 11 Table 3.7: Total rankings of selected alternative tree species based on selection criteria .................... 11 Table 3.8: Rankings of alternative tree species on marketing criteria only .......................................... 12 Table 4.1: Socioeconomic characteristics of villages ............................................................................ 13 Table 4.2: Demographic characteristics of producers ........................................................................... 14 Table 4.3: Presence and densities of selected tree species, by zone ...................................................... 15 Table 4.4: Significant Regression Results, Tree Presence and Density ................................................ 16 Table 4.5: Why farmers do not have given tree species ........................................................................ 18 Table 4.6: Identified benefits of selected tree species ........................................................................... 18 Table 4.7: Reported agroforestry practices, by zone ............................................................................. 19 Table 4.8: Reasons for intention to plant or not plant trees in cocoa plots in the future ....................... 19 Table 4.9: Sources of germplasm for selected trees .............................................................................. 20 Table 5.1: Organizational actors in the value chain of akpi .................................................................. 21 Table 5.2: Organizational actors in the value chain of oil palm ............................................................ 26 Table 5.3: Farmers with trees already cut, compensation, knowledge of forestry code ....................... 30 Table 5.4: Organizational actors in the value chain of timber and fuelwood ........................................ 32 Table 5.5: Organizational actors in the value chain of citrus ................................................................ 34 Table 5.6: Calendar of production periods for selected products .......................................................... 38 Table 6.1: Calculated annual production per household of selected products, by zone ........................ 42 Table 6.3: Village consumption of akpi, by zone .................................................................................. 43 Table 6.4: Regional town consumption of selected products ................................................................ 43 Table 6.5: Village sales of selected products in 2012 ........................................................................... 45 Table 6.6: Calculated annual supply and demand comparison for the region, Method 2 ..................... 47 Table 7.1: Minimum and maximum prices for selected prices in different markets ............................. 49 Table 7.2: Transport costs, approximate profit for sale from village to town ....................................... 51 Table 7.3: Transport costs, approximate profits from town to city or village to factory ...................... 52

!!
iv!!
Table 7.4: Gross profit margins for producers of selected products ..................................................... 56 Table 7.5: Gross profit margins for processors of selected products .................................................... 57 Table 7.6: Gross Profit Margins for Merchants of Selected Products ................................................... 58 Table 8.1: How are selected products sold? .......................................................................................... 61 Table 8.2: How is the buyer or market chosen, and who pays transport to point of sale? .................... 62 Table 8.3: Reasons for not selling the selected products ....................................................................... 63 Table 8.4: Marketing difficulties identified by sellers of selected products ......................................... 63 Table 8.5: Porter’s Five Force Analysis, Akpi ...................................................................................... 65 Table 8.6: SWOT Analysis, Akpi .......................................................................................................... 65 Table 8.7: Porter’s Five Forces Analysis, Oil Palm Products ............................................................... 66 Table 8.8: SWOT analysis for oil palm products .................................................................................. 67 Table 8.9: Porter’s Five Forces analysis – timber and fuelwood .......................................................... 68 Table 8.10: SWOT Analysis for timber and fuelwood .......................................................................... 69 Table 8.11: Porter’s Five Forces Analysis for Citrus ............................................................................ 70 Table 8.12: SWOT analysis for citrus ................................................................................................... 71
!

!!
v!!!
LIST OF ABBREVIATIONS! AIPH Association interprofessionnelle de la filière palmier à huile ANADER L'Agence Nationale d'Appui au Développement Rural APROSAPCI Association of Professionals of Oil-Palm Agricultural Society of Côte
d'Ivoire CDC Cocoa Development Centre CER Centre of Ecological Research CI Côte d'Ivoire CNRA Centre National de Recherche Agronomique CSSV Cacao swollen-shoot virus EU European Union FENACOPAH La Fédération Nationale des Coopératives et Unions des Coopératives des
Planteurs de Palmier à Huile FENACOVICI Federation Nationale Des Coopératives de Vivriers de Cote D’Ivoire FIRCA Le Fonds Interprofessionnel pour la Recherche et le Conseil Agricoles GITHP Le Groupement Ivoirien des Transformateurs de l'Huile de Palme HH Household ICRAF World Agroforestry Centre INS Institut National de la Statistique SIPEF Société Internationale de Plantations et de Finance SODEFOR Société d'Etat, chargée du développement des forêts SODEPALM Société pour le Développement du Palmier à Huile STCP Sustainable Tree Crops Program SWOT Strength, Weakness, Opportunity, Strength UCOFEACI Union des Cooperatives des Femmes Exploitantes Agricoles de Cote
d’Ivoire US United States V4C Vision for Change

!!
1!!
1: INTRODUCTION
1.1 Rationale and background Cocoa yield per hectare in Côte d`Ivoire is among the lowest in the world, ranging from 0.2 to 0.5 tons/ha per year. This figure continues to decline each season due to decreased soil fertility, increased disease pressure, the aging of cocoa orchards, and low use of inputs (Assiri et al. 2012, FLA 2012). Yields could be increased if farmers were able to apply fertilizer in recommended quantities, replant old orchards (especially with improved cocoa varieties), and control diseases with fungicides and other methods. However, for various reasons such as lack of financial means, low levels of technical training and reduced incentives to invest in cocoa because of low prices, the majority of Ivorian cocoa farmers are not implementing these soil and crop improvement management methods (Nkamleau et al. 2007, FLA 2012).
In view of this, Mars Incorporated, in collaboration with the Ivorian Government, embarked on the Vision for Change (V4C) project as a means of addressing the problem of low productivity of cocoa. This project is being implemented by the World Agroforestry Centre (ICRAF). The initiative is currently setting up a network of Cocoa Development Centres (CDCs) throughout the region of Soubré, the most productive cocoa region in Côte d`Ivoire, and conducting on-farm research into different cocoa cultivars, rehabilitation of old orchards by grafting, and the effect of fertilizer application and other management practices (ICRAF 2012). In future the project will enter the extension stage, and the best methods of increasing cocoa yields, plus affordable inputs to accomplish them, will be made accessible to farmers throughout the region. This initiative is designed on the same model as a successful project initiated in Indonesia by Mars in 2003, which increased cocoa yields from 0.5 to 2.5 tons/ha per year, on average (Pye-Smith 2011). Initial studies of the effects of rehabilitation methods in field trials in Côte d’Ivoire are encouraging, showing an 83% average increase in yields and an average profitability rate of 377% (Assiri et al. 2012).
However, the plan to increase cocoa yields is only one small part of the Vision for Change project. The overall goal is to build sustainable cocoa farming communities. It has been found that the full-sun, mono-cropped cocoa systems promoted by the Ivorian extension services in the past, while increasing yields in the short-term, lead to severe long-term nutrient degradation of the soils. Cocoa grown in this way requires rotation to new land after a period of 20-30 years (Ruf 2001). This system of farming, in combination with high levels of migration to cocoa growing areas and competition for land, has promoted rapid deforestation. The resulting shortage of land and the disappearance of virgin forest in Côte d`Ivoire mean that this type of farming is no longer possible (Ruf 2001, Asare 2005).
Thus, a new model for cocoa farming is needed; one which incorporates other trees and plants. It has been shown with recent research that cocoa systems which incorporate other tree species for shade, moisture retention, and fertility are more sustainable in the long-term and only experience a small decrease in yields under ideal conditions (Asare 2005, Clough et al. 2009). Cocoa grown in Nigeria, most regions of Ghana (excluding the Western region),

!!
2!!
and particularly Cameroon is grown under much higher shade levels than cocoa in Côte d`Ivoire. These partial-shade systems have not experienced the same long-term yield declines (Gockowski and Dury 1998). Another study found that unshaded cocoa in Côte d`Ivoire lasted about 10 years before yields started to decline, while shaded cocoa lasted 25 years on average, and all orchards still in production after 50-60 years were heavily shaded (Ruf and Zadi 1998). Studies comparing shaded and un-shaded cocoa also have found that shaded systems speed the breakdown of leaf litter and result in higher natural nitrogen and phosphorous levels in the soil (Ofori-Frimpong et al. 2007).
Short-term cocoa yields and production are lower in these shaded systems traditionally, but it is likely that the decline can be made up for by the yield increases expected with new varieties and a wider use of fertilizer (Ofori-Frimpong et al. 2007). Manuals on good agricultural practices now state that young cocoa needs 70% shade and that cocoa older than four years needs 30-40% shade, which is equivalent to 69 timber trees per hectare initially, later thinned to 18 trees per hectare (Asare and David 2011). Recommended initial densities of nitrogen-fixing tree species, such as Gliricidia sp., are even higher, at 277 trees per hectare.
Another element of sustainability is economic diversification. Currently the majority of cocoa farmers in Soubré depend solely on cocoa farming revenues, meaning that crop failure, increased input prices, or adverse purchasing conditions can be disastrous for them. If farmers had a more diversified income base, growing several different commercial crops and selling to different networks of buyers, then they would face less risk from price fluctuations and crop failure, and would have higher overall incomes (Gibson 2007). Part of their increased income could be used to make higher investments in cocoa to ensure higher, more reliable production.
The goal of this report is to explore the market potential of different tree crops which could either be incorporated into cocoa fields or grown on separate land in cocoa farming communities to increase the environmental and economic sustainability of the cocoa system. While other reports focus on the scientific feasibility and social acceptance aspects of alternative tree crops, this report seeks understand the market potentials of the different species, by mapping the existing market chains and estimating current and potential supply and demand.
1.2 Objectives The overall objective of this study is to explore the market potential for alternative and complementary tree crops for cocoa farming communities in Soubré. The specific objectives are:
1. To generate a list of the most promising alternative tree species which could be incorporated into cocoa agroforestry systems.
2. To study the market chains for products of the selected species to understand existing supply, farmer attitudes, potential marketing opportunities, constraints, and general economic viability.
!!
3!!
3. To prioritize the products based on their economic potential and overall suitability.
4. To identify strategies to integrate these products into local farming systems which optimize the benefits to producers.

!!
4!!
2: METHODOLOGY!
The data collected for this report comes from several different sources. Detailed information was collected on production, consumption and sale of the selected products in villages in the intervention zone via a targeted quantitative survey. In order to create value chain maps, estimate demand, and determine overall advantages and constraints for development of each product, methods used included targeted interviews with key informants, market observations, interviews of selected actors in the value chains of the different products, and farmer focus group meetings. The use of multiple methods allows data to be triangulated and cross-checked for consistency (Young 1994).
2.1 Quantitative producer survey- sample selection and data collection methods A quantitative survey of 400 producers was conducted in January and February 2013. For the purposes of survey implementation the V4C area of intervention, shown in Figure 2.1 below, was divided into five approximately equal zones and a different surveyor was assigned to cover each zone. Within each zone 10 villages were selected, and eight producer households interviewed from each village. Villages were selected to ensure variety within the sample along several different variables: geographic location, level of isolation (distance from major roads in the region), dominant ethnic group, and exposure to V4C programmes.
Figure 2.1: Map of villages surveyed in V4C intervention zone

!!
5!!
Upon arriving in each village, surveyors first collected some basic data on the village itself, including the location of the market, the total population (including surrounding camps, to get an estimate of the market size), the presence of producer associations, and the distance from the village to the nearest paved road. Where available, surveyors were given lists of all the households within the village (supplied by ENSEA) and selected the eight households randomly from that list. Where such lists were not available surveyors selected the households themselves, with instructions to get an approximately representative group based on ethnicity, household location within the village, and membership in producer organizations. In each case the surveyor spoke both with the head of the household (male in the vast majority of cases) and with the head female within the household, since women tend to be the ones who do the shopping, cooking, and marketing of non-cash crops.
This quantitative questionnaire was focused on five tree species (akpi, palm, iroko, frake and framire) and seven products (akpi seeds, industrial palm, palm fruits, palm oil, palm soap, firewood and charcoal) derived from these trees. The choice of these trees and products is explained in section 3 below. The questionnaire used for this survey included questions on the number of trees of each type present in farmers’ parcels, the reasons for their presence or absence, germplasm sources, and overall profit ranking of each tree. Additionally, questions were asked on weekly consumption of targeted products, the amount of each product that was produced at home versus acquired outside the household, minimum and maximum prices and how they were determined, and details on the quantity and method of sales of each product. There were also questions about the intention to plant trees in cocoa orchards in the future as well as experiences and attitudes regarding timber law and timber companies.
2.2 Qualitative interviews - sample selection and data collection methods The first stage of the qualitative analysis involved producer focus group meetings in 13 villages scattered around the intervention zone. In each village three separate focus group meetings were conducted in the course of one day—one with women, one with men aged 18-40, and another with men aged over 40 years — with 10-15 participants in each meeting. In these focus groups, questions were asked about current and desired consumption of tree products, prices available for these products, intercropping of trees with cocoa, and the farmers’ opinions about what alternative tree species would be most profitable to develop further. Additional discussion topics included existing marketing structures for the most important current agricultural products, challenges faced, and the farmers’ proposed solutions to these challenges. The data from these meetings were used, in addition to secondary data from the literature and preliminary market observations and interviews, to select the trees of interest and classify them according to expected profitability. These rankings, which are provided and explained in section 3, then helped with the determination of the products on which the in-depth quantitative analysis would focus.
!!
6!!
Additional methods were used to get a picture of the larger value chain. This included market observations in Soubre, Meagui, San Pedro and Abidjan and 15 key informant interviews with representatives of research and extension services, government officials, and producer groups. The goal of these interviews was to determine the most abundant agroforestry products currently in markets, the advantages and constraints for the development of these and additional tree products, and the current institutional structures which affect the markets.
A set of 80 market-level interviews was also conducted with actors in the value chain of the different targeted products: 21 consumers in major towns in the regions (both households and food vendors), 39 local merchants and market vendors, 23 processors (individuals and large companies), 17 suppliers of germplasm and other inputs, and 12 specially targeted (rather than randomly selected) producers who produced and sold large quantities of certain products. These interviews took place primarily in Soubre, Buyo, Meagui and nearby villages but were supplemented with interviews in San Pedro, Abidjan, Gagnoa, Oume and Lakota. Where interviews took place outside the zone of intervention this was due to the fact that the cities in question are major markets where products from the zone can be sold (San Pedro and Abidjan) or had high production/marketing of a product of interest that is currently less developed in the zone of intervention (Gagnoa, Oume, Lakota).
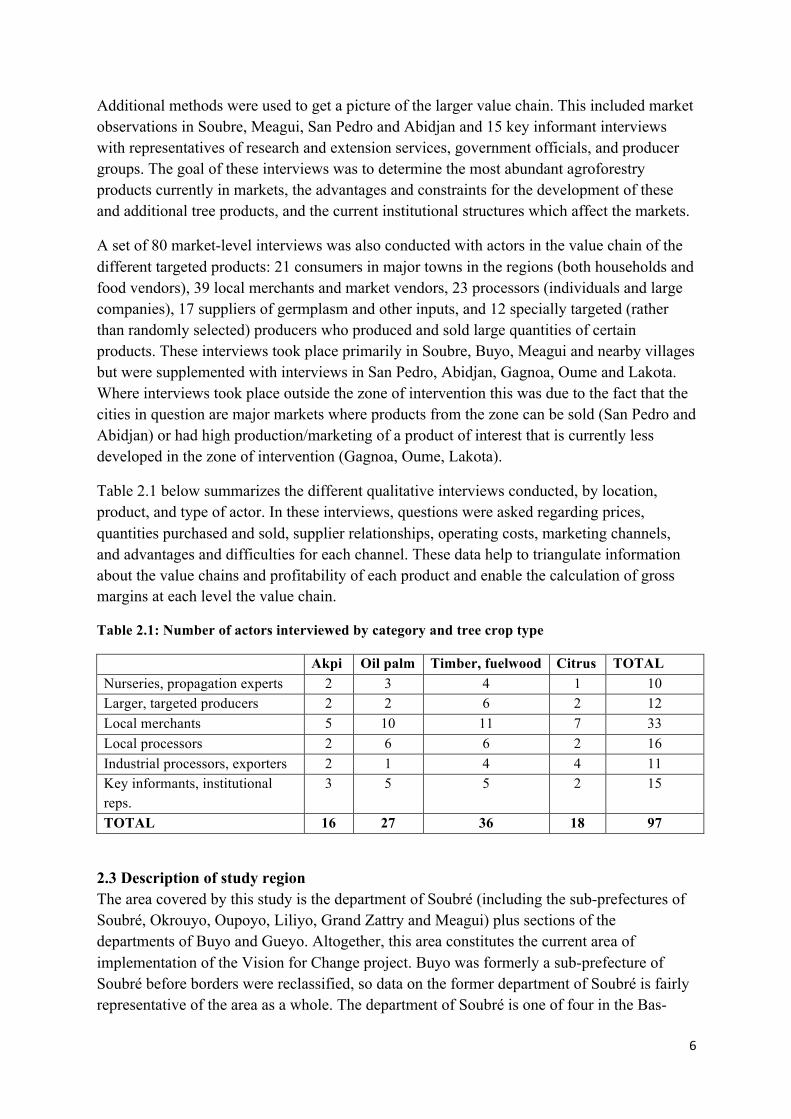
Table 2.1 below summarizes the different qualitative interviews conducted, by location, product, and type of actor. In these interviews, questions were asked regarding prices, quantities purchased and sold, supplier relationships, operating costs, marketing channels, and advantages and difficulties for each channel. These data help to triangulate information about the value chains and profitability of each product and enable the calculation of gross margins at each level the value chain.
Table 2.1: Number of actors interviewed by category and tree crop type
Akpi Oil palm Timber, fuelwood Citrus TOTAL Nurseries, propagation experts 2 3 4 1 10 Larger, targeted producers 2 2 6 2 12 Local merchants 5 10 11 7 33 Local processors 2 6 6 2 16 Industrial processors, exporters 2 1 4 4 11 Key informants, institutional reps.
3 5 5 2 15
TOTAL 16 27 36 18 97
2.3 Description of study region The area covered by this study is the department of Soubré (including the sub-prefectures of Soubré, Okrouyo, Oupoyo, Liliyo, Grand Zattry and Meagui) plus sections of the departments of Buyo and Gueyo. Altogether, this area constitutes the current area of implementation of the Vision for Change project. Buyo was formerly a sub-prefecture of Soubré before borders were reclassified, so data on the former department of Soubré is fairly representative of the area as a whole. The department of Soubré is one of four in the Bas-

!!
7!!
Sassandra region in southwestern Côte d’Ivoire, the capital of which is the port city of San Pedro. The total land area is 8,306 km2 and the department accounted for 20% of national cocoa production, or 250,000 tons per year, in 2010 (ICRAF 2011). The capital of the department is the city of Soubré, located 135 km from San Pedro and 380 km from Abidjan.
2.3.1 Population estimates There has been no official population census in Côte d`Ivoire since 1998, so all current estimates of the population of Soubre are extrapolations based on the 1998 census and population growth estimates. The total population of the former Department of Soubre in 1998 was 628,592 inhabitants and population growth was 6.8% (INS 1998), though both total population and growth in rural areas was higher than in urban areas within Soubre. Projections made by the INS suggested that by 2009 the total population of Soubre should be 875,195 inhabitants, with 751,026 in rural areas (85.8%) and 124,169 in urban areas (14.2%). If these same trends are extrapolated to 2012, this suggests that the total population of Soubre should be 942,362 people with a rural population of 808,662 and an urban population of 133,700. In this study the average population size in the rural areas, among producer households, was 12.3 while in the regional town centres it was 8. This suggests that in 2012 there should have been approximately 65,745 rural, producer households and 16,713 urban, non-producer households in the region.
However, considering that the number of households recorded in the 1998 census was 95,107 in total for Soubre, these figures seem to underestimate the number of households (which is expected to have grown at least somewhat). The average rural household size in 1998 was 7 people while for urban areas it was 5.3 people. This suggests that there may an inconsistency in the way that those surveyed understood the term household. Average figures were used to determine number of people per household. This stood at 9.65 people per household in rural areas and 6.65 in urban areas. Using these figures, there should have been 83,800 rural producer households and 20,105 urban non-producer households in Soubre in 2012.
These numbers are more consistent with estimates from other sources (ICRAF 2011). Thus, these are the figures which will be used in the estimation of supply and demand in section 6.2. Population projection data compiled by ICRAF staff using 1998 census data suggested the following breakdown of the Department of Soubre by sub-prefecture: 23.3% in the sub-prefecture of Soubre (roughly Zone 3); 11.2% in Okrouyo (roughly Zone 5); 10.8% in Grand Zattry (roughly Zone 2); 33.7% in Meagui (roughly Zone 4); and 21% in Buyo (Zone 1) (ICRAF 2011). These percentages will also be used in the estimation of supply and demand, since production and consumption patterns differ by zone.
2.3.2 Other demographic information The population density of Soubre, at 76 people per m2, is much higher than the national average of 48 people per m2. The high population density is due to the attractions of the cocoa economy, which led to a great deal of migration into the area from other parts of Côte d’Ivoire and from other countries. There are three ethnic groups native to the department, most notably the Beté. There are also smaller groups of native Bakoué (around Meagui) and Kouzie (in the Buyo area). However, these native groups constitute only about 30.5% of the

!!
8!!
total population. Migrants from other parts of Côte d’Ivoire (Baoulé, Agni, Abron, Wan, Sénoufo, Malinké) account for 44.8% and foreign populations (primarily from Burkina Faso and Mali) account for 23.4% (Assiri et al. 2009).
Kouadjo et al. (2002) estimated that 67% of heads of households in Soubré did not have any formal education, and that the average household size was eight people. The same study found that 93% of households cultivate cocoa to some extent. Among the agricultural population, cocoa was found to account for 66.8% of income on average, coffee for 14.7%, food crops for 7.6%, non-agricultural income for 4.3%, rubber for 1.9%, livestock for 1.4%, palm oil for about 1% and other perennial crops for about 1%. Palm production is primarily concentrated in the Okrouyo sub-prefecture, where the SIPEF-CI palm oil processing factory is located. Rubber production has developed significantly since 2002, and coffee production has fallen, so it is likely that the current income breakdown is very different from the results of Kouado et al. at that time.
In 2010 there were 38,289 total cocoa producers and a total of 173,609 hectares under cocoa production (ANADER 2010). According to Assiri (2010) the average yield for cocoa in Soubré was 560 kg per ha per year, which is higher than the national average but still far lower than potential yields. The average land size farmers by each individual producer was 6.4 ha and 84% of fields are treated with at least some level of pesticides, though only 49% of the population uses fertilizer.
2.3.3 Climate Soubré has a typical equatorial climate, with two rainy seasons and two dry seasons per year. The average total annual rainfall across the 1999-2008 period was 1362.8 mm. There are essentially three types of soil found in the department: brown tropical soils, highly unsatured iron soils, and water-logged soils near rivers and marshes that are ideal for flooded cultivation of crops like rice. It would be ideal to look at soil, climatic, and population data divided by the five different zones of study, to better explain the differences that are seen in production and markets across the region. Unfortunately, data does not yet exist at such a level of detail in Côte d’Ivoire. ICRAF has recently begun a comprehensive soil survey of the zone of intervention, new climate data collection stations are being constructed, and a new population census should be undertaken within the next few years. As such data become available in the future they can be used to augment the analysis in this report.

!!
9!!
3: INITIAL TREE SELECTION!
An initial report was drafted in January 2013 which began with a long list of potentially profitable tree crops generated from key informant interviews and farmer focus groups. Nine selection criteria were used to rank the products From these rankings, four tree crops were selected for the more in-depth quantitative analysis: akpi, oil palm, timber/fuelwood and citrus. This section summarizes the methodology and results of the initial report.
3.1 Potential alternative crops of interest Table 3.1 below lists all the potential crops of interest encountered in the initial primary and secondary research. For the purposes of discussion and rankings, timber and fuelwood species are treated as a single group (Table 3.1 merely lists some of the most promising species), citrus fruits are grouped as one, and all the other crops listed are addressed separately. This leaves 11 categories which were explored in detail and ranked.
Table 3.1: Full list - potential alternative crops of interest
Indigenous Trees (harvested for seeds)
Cash Crops Timber, Fuelwood Exotic Fruit Trees
Akpi, Bush Mango Oil Palm, Rubber, Kola,
Iroko, frake, framire, Teak, Samba, Gmelina, Acacia spp., Albizia spp., etc.
Oranges, Lemons, Mandarins, Other Citrus Fruits, Mango, Avocado, Coconut, Papaya
Preferences for different crops varied across the study zone and gender. Tables 3.2-3.5 provide more details about the preferred species summarized in Table 3.1, broken down according to these different factors. Note that the results for rubber are biased downwards, because farmers were asked about alternative crops of interest, and most groups had ranked rubber among the top standard cash crops in their village so they did not consider it an option for this category. The same case occurred in some regions (particularly Zone 5) with oil palm. Despite this, rubber and oil palm were still mentioned often enough during that portion of the focus group meetings to make it into the top rankings.
Table 3.2: Proportion of focus groups ranking tree among the top 5, by zone
Kola Palm Rubber Citrus Avocado Mango Coconut Akpi Wood Bush Mango Papaya
Zone 1 100.0% 33.3% 33.3% 16.7% 66.7% 16.7% 0.0% 33.3% 0.0% 0.0% 0.0%
Zone 2 42.9% 71.4% 57.1% 42.9% 14.3% 0.0% 0.0% 14.3% 28.6% 14.3% 0.0%
Zone 3 33.3% 33.3% 66.7% 66.7% 66.7% 33.3% 0.0% 0.0% 0.0% 0.0% 0.0%
Zone 4 76.9% 30.8% 0.0% 38.5% 38.5% 7.7% 30.8% 23.1% 23.1% 7.7% 7.7%
Zone 5 66.7% 33.3% 33.3% 66.7% 0.0% 0.0% 0.0% 0.0% 100.0% 0.0% 0.0%

!!
10!!
The rankings in Tables 3.3 and 3.5 are provided to give an idea of the differences in farmer preferences for a wider range of trees across geographic zones. However, these were not the only determinants in the overall rankings used to narrow down the list of crops for analysis. They are incorporated into the overall analysis via criteria 4 and 7 (see Table 3.6). But other selection criteria were also added in order to make the final overall rankings, as detailed in section 3.2.
Table 3.3: Crops of highest profitability rankings by zone
Average Crop Ranking Among Farmer Focus
Groups 1 2 3 4 5
Zone 1 Kola Rubber Avocado Palm Akpi Zone 2 Palm Rubber Kola Citrus Wood Zone 3 Rubber Citrus Avocado Palm Kola Zone 4 Kola Citrus Avocado Rubber Coconut Zone 5 Palm Wood Kola Citrus Rubber
As can be seen in Tables 3.2 and 3.3 above, the crops of highest interest across all geographic zones included kola palm, and rubber. Citrus was also cited among the top crops in all except Buyo. Wood was cited as highly profitable only in two zones, Grand Zattry/Liliyo and Okrouyo. Avocado was mentioned in three zones, but not in Grand Zattry/Liliyo or Okrouyo. Akpi made it onto the list only for Buyo, while coconut was only ranked highly in Meagui.
As shown in Tables 3.4 and 3.5, there was also a clear split in the rankings based on gender. Women failed to mention rubber (because it is largely a male-cultivated crop and thus not of interest to them), though men placed it at number two. Women ranked akpi in the top three profitable trees while it did not make the top five for men. Kola ranked highly for both groups. Citrus and avocado were generally ranked the same by women and men, ranging between the 3rd and 5th most profitable tree crops. Women ranked palm as the most profitable crop, while men placed it as 5th. This is likely because in the local market for palm fruit and processed palm products women dominate production and sale (as is the case with akpi).
Table 3.4: Proportion of farmer focus groups ranking tree among top 5, by gender
Kola Palm Rubber Citrus Avocado Mango Coconut Akpi Wood Bush Mango Papaya
Men 72.7% 36.4% 40.9% 40.9% 40.9% 9.1% 13.6% 9.1% 22.7% 0.0% 0.0%
Women 45.5% 45.5% 0.0% 36.4% 36.4% 9.1% 9.1% 36.4% 27.3% 18.2% 9.1%
Table 3.5: Crops of highest profitability rankings by gender
1 2 3 4 5 Men Kola Rubber Citrus Avocado Palm
Women Palm Kola Akpi Citrus Avocado

!!
11!!
3.2 Selection criteria Several different criteria were examined in order to determine the potential profitability of the crops under consideration, as summarized in Table 3.6. A score from 0-4 (0=none, 1 = very low, though 4 = very high) was assigned to each crop for each criterion. Note that for some of these criteria, especially CSSV protection and inter-cropping potential, having timber species in a single category is problematic (for example, Fromager is a CSSV host but other species are not and provide significant benefits when intercropped with cocoa). In this case the ranking for overall category assumes that the most suited timber species will be chosen later.
Table 3.6: Selection criteria for ranking of crops
Criterion Explanation 1 Agro-ecological suitability Does it grow well in Soubré? 2 Robustness, low cost of
cultivation Duration to maturity, inputs needed, labour required
3 Enabling environment Established extension, germplasm supply, marketing channels 4 Current local abundance Common in villages of Soubré? 5 Potential to intercrop with
cocoa Research results, farmer willingness to plant
6 Multiple uses Number of products yielded; processing potential 7 Local demand Local price; how widely is it consumed, local market risks 8 Regional and international
demand Price in larger towns, limits/risks to regional marketing, export potential
9 CSSV protection Is it a good barrier crop to CSSV, or a host?
3.3 Summary of rankings and conclusions Table 3.7 below shows the rankings for each of 11 crop categories analyzed according to the eight selection criteria (for details see January 2013 report). Oil palm is ranked as the most promising. Akpi is just behind, followed by timber species and citrus, which are tied at number three. Rubber takes the fifth position, followed by avocado and mango.
Table 3.7: Total rankings of selected alternative tree species based on selection criteria
Crop 1 2 3 4 5 6 7 8 9 SCORE RANK Oil palm 3 2 3 2 2 3 4 4 4 27 1 Akpi 4 4 1 1 4 2 4 3 3 26 2 Timber species 3 2 1 2 3 4 4 4 2 25 3 Oranges + other citrus 4 4 2 2 2 2 3 2 4 25 3 Rubber 3 2 4 3 2 2 2 4 2 24 5 Avocado 3 4 1 2 3 2 3 2 3 23 6 Mango 4 2 2 2 2 3 3 2 3 23 6 Bush mango 4 3 0 1 3 3 3 2 2 21 7 Coconut 3 2 1 1 2 4 2 3 2 20 9 Kola 4 3 3 1 0 2 2 3 1 19 10
Papaya 3 2 1 1 1 2 2 3 1 16 11
!!
12!!
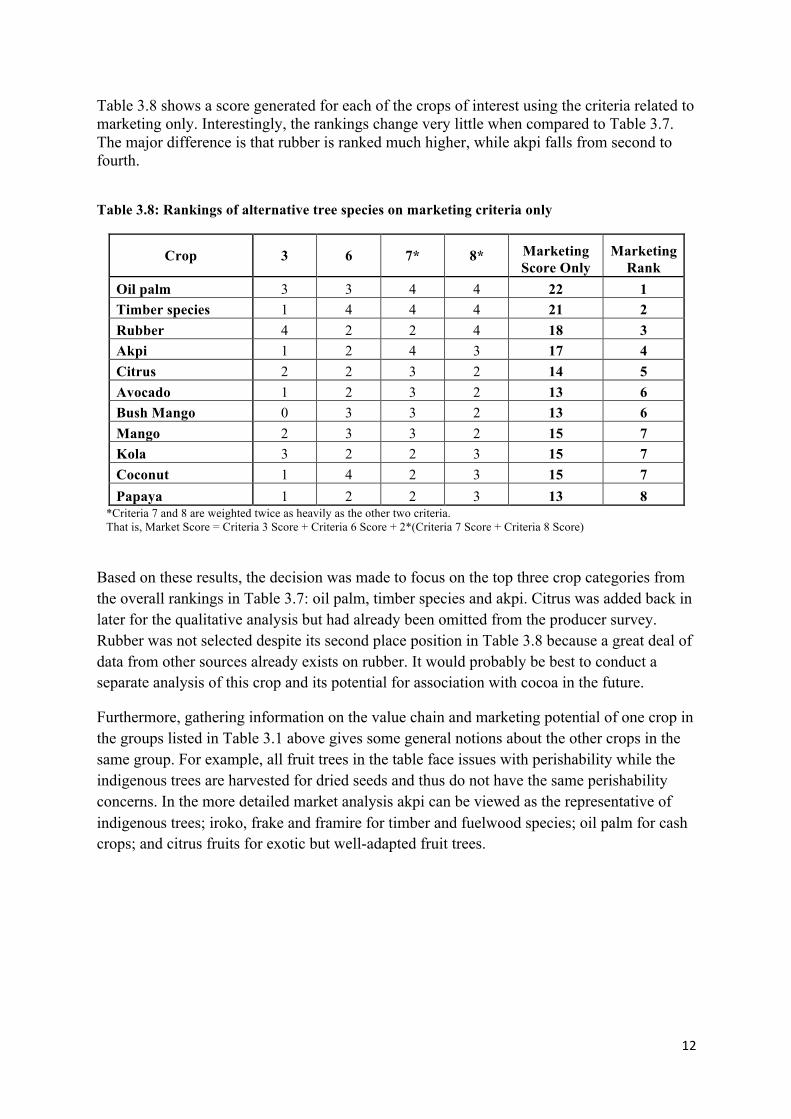
Table 3.8 shows a score generated for each of the crops of interest using the criteria related to marketing only. Interestingly, the rankings change very little when compared to Table 3.7. The major difference is that rubber is ranked much higher, while akpi falls from second to fourth.
Table 3.8: Rankings of alternative tree species on marketing criteria only
Crop 3 6 7* 8* Marketing Score Only
Marketing Rank
Oil palm 3 3 4 4 22 1 Timber species 1 4 4 4 21 2 Rubber 4 2 2 4 18 3 Akpi 1 2 4 3 17 4 Citrus 2 2 3 2 14 5 Avocado 1 2 3 2 13 6 Bush Mango 0 3 3 2 13 6 Mango 2 3 3 2 15 7 Kola 3 2 2 3 15 7 Coconut 1 4 2 3 15 7 Papaya 1 2 2 3 13 8
*Criteria 7 and 8 are weighted twice as heavily as the other two criteria. That is, Market Score = Criteria 3 Score + Criteria 6 Score + 2*(Criteria 7 Score + Criteria 8 Score)
Based on these results, the decision was made to focus on the top three crop categories from the overall rankings in Table 3.7: oil palm, timber species and akpi. Citrus was added back in later for the qualitative analysis but had already been omitted from the producer survey. Rubber was not selected despite its second place position in Table 3.8 because a great deal of data from other sources already exists on rubber. It would probably be best to conduct a separate analysis of this crop and its potential for association with cocoa in the future.
Furthermore, gathering information on the value chain and marketing potential of one crop in the groups listed in Table 3.1 above gives some general notions about the other crops in the same group. For example, all fruit trees in the table face issues with perishability while the indigenous trees are harvested for dried seeds and thus do not have the same perishability concerns. In the more detailed market analysis akpi can be viewed as the representative of indigenous trees; iroko, frake and framire for timber and fuelwood species; oil palm for cash crops; and citrus fruits for exotic but well-adapted fruit trees.

!!
13!!
4: QUANTITATIVE SURVEY RESULTS- SOCIOECONOMICS, TREES PRESENT
This section presents some of the results of the quantitative producer survey. Section 4.1 provides the socioeconomic characteristics of the 400 producers surveyed, divided by zone. Section 4.2 presents data collected on the presence of the five tree species of interest (akpi, oil palm, iroko, frake and framire) as well as the reasons for their absence and the benefits that producers are aware of for each tree. The presence of different tree species is compared across the different zones studied. Unfortunately, citrus was omitted from the survey so there are no comparable results presented for citrus in this section. Section 4.3 shows some results on agroforestry attitudes and practices among the producers surveyed and also discusses how these differ by zone. Finally, section 4.4 presents the sources of germplasm for the selected trees which are present; most grow wild, with a few notable exceptions which are discussed.
4.1 Socioeconomic characteristics of surveyed villages and producers Table 4.1 shows a few summary statistics of village characteristics in the sample. The average distance of the village to the nearest paved road is 24.7 km, and the average road quality was ranked as 2.9 (on a scale of 1-5, with 1 = very bad and 5 = very good). Only 42% of the villages sampled had an established local market, though 62% had access to Farmer Field Schools or other extension programmes. The average population of a village and its surrounding camps was 3,948 people.
Table 4.1: Socioeconomic characteristics of villages
Zone 1 Zone 2 Zone 3 Zone 4 Zone 5 Pooled Distance to road 64.2 km 11.7 km 23.9 km 11.8 km 12 km 24.7 km Quality of road 2.4 2.9 3.2 2.9 3 2.9 No. of cocoa buyers based in village
4.9 4.3 5.7 1.9 3.6 4.1
% with market 60% 50% 30% 11.3% 58.8% 42% % with extension 60% 51.3% 70% 98% 30% 62% Population 5790 4600 4750 2009 2721 3948
Table 4.2 below shows the average figures for several of the demographic variables for the pooled sample of 400 producers, broken down by zone. The average age of those surveyed was 49 years and 61.4% had received no education. Average total land farmed was 9.4 ha, with 1.9 ha in crops other than cocoa. Cocoa yields averaged 353 kg/ha during the 2012 season. The highest proportion of the sample (51%) was allochtone (with 41.5% Baoulé). Only 16.5% were autochtone, while the remaining 32.5% were allogene (24% Burkinabé). Reported land ownership among those sampled is high, with 65.7% owning their fields outright and an additional 31.3% working land owned by their extended family.

!!
14!!
There are a few notable differences in the socioeconomic and village characteristics of the five different zones. Cocoa yields were significantly lower in zones 2 and 3. Land size per household was highest in zone 2 (at 12 ha) and lowest in zone 1 (at 6.8 ha). A much higher proportion of autochtones was surveyed in zone 2 than in the other zones, with the lowest percentages of autochtones in zones 3 and 4. Zone 5 had a lower level of allochtones than the other areas and the highest percentage of allogenes (43.7%). The presence of CSSV was much higher in zone 1 and 2 than in other areas, and reportedly very low (only 5.1%) in zone 5. Only 2.5% of farmers in zone 1 reported replacing cocoa with another crop, while 10% in zone 4 had done so. Over 60% of those sampled in zone 4 reported membership in a cooperative, while less than 30% were members in zones 1 and 5.
Villages in zone 1 were much more remote (with longer distances to paved roads, and lower road quality) than villages in other zones, though they were larger and had more developed local markets (perhaps as a result of being so remote). Among zone 4 villages 98% had access to extension services while only 30% of the villages in zone 5 had access. Such differences might be correlated with different preferences or suitability rankings for agroforestry systems in general and specific tree species, as well as different marketing arrangements for the selected products of interest, indicating that subsequent results should be examined by separate zone as far as possible. This will be done both via tables split by zone and some regression analysis
Table 4.2: Demographic characteristics of producers
Zone 1 Zone 2 Zone 3 Zone 4 Zone 5 Pooled Age 48.8 50.3 47.9 48 50 49 Total ha 6.8 ha 12.0 ha 9.9 ha 10.6 ha 7.9 ha 9.4 ha Non-cocoa ha 0.8 ha 3.0 ha 2.0 ha 1.5 ha 2.3 ha 1.9 ha Household size 12.6 11.6 13.8 12.7 10.8 12.3 Cocoa yield 2012 419 kg/ha 277 kg/ha 249 kg/ha 402 kg/ha 425 kg/ha 353 kg/ha % with non-farming income
6.3% 20% 22.5% 8.8% 18.8% 15.3%
% with bank accounts
13.8% 25% 28.8% 33.8% 17.5% 23.8%
% land owners 69% 64% 61% 61% 73% 65.7% % no education 52.5% 42.5% 67% 73.8% 71.3% 61.4% % autochtone 13.8% 32.5% 7.5% 6.3% 22.5% 16.5% % allochtone 57.5% 52.5% 56.5% 55% 33.8% 51% % coop members 28.8% 40% 52.5% 63.8% 28.8% 42.8% % participating in extension
27.5% 42.5% 51.3% 73.8% 18.8% 42.8%
% replaced some cocoa w/other crop
2.5% 5% 7.5% 10% 3.8% 5.8%
% with CSSV 58.8% 63.8% 18.8% 13.8% 5.1% 32%
4.2 Presence and densities of the selected trees Table 4.3 shows the percentages of households surveyed which reported the presence of the selected trees on their land (either in cocoa fields or elsewhere; though this was not specified

!!
15!!
in the survey, evidence suggests that most trees are in cocoa fields, except where the producer had a separate palm plantation). For palm, the number of households with specific palm plantations is also displayed. More households in zone 5 have such plantations, as would be expected because of the proximity to the SIPEF-CI factory.
Table 4.3 also shows the average numbers of each tree per hectare of cocoa owned. For both variables there is not dramatic variation across regions in most cases. However, there is a significant difference in the percentage of households with iroko in zone 1 and 2 (29% versus 55%), but much higher densities of iroko and other trees in zone 1 compared to the other zones. Note that in the table two different palm densities are displayed. The first includes only palm trees that are not planted in designated plantations, while the second includes planted palm parcels. Interestingly, the density of palm on cocoa (and other) land is lowest for zone 5 (at only 1.9/ha), but when palm plantations are included that zone has the highest number of palms (at 49.4/ha). Zone 1 also has a relatively high number of palms per hectare of cocoa (6.5/ha not including plantations and 39.1 including plantations).
Table 4.3: Presence and densities of selected tree species, by zone
Zone 1 Zone 2 Zone 3 Zone 4 Zone 5 Pooled
HHs w/Akpi 40% 45% 52% 63% 49% 50% HHs w/Palm (anywhere) 98.7% 97.5% 98.7% 96.2% 100% 92.2% HHs w/Palm plantation 5% 6.3% 0% 10% 33.8% 11% HHs w/Iroko 29% 55% 36% 54% 36% 42% HHs w/Frake 28% 31% 31% 44% 25% 32% HHs w/Framire 11% 29% 24% 17% 14% 19% Akpi/ha cocoa 0.53 0.37 0.49 0.38 0.4 0.51 Palm/ha cocoa 6.5 4.7 5.6 3.9 1.9 4.6 Palm/ha cocoa w/ plantations
39.1 16.5 5 13.7 49.4 31
Iroko/ha cocoa 1.6 0.5 0.66 0.43 0.67 0.69 Frake/ha cocoa 2.6 0.73 0.60 0.63 0.65 0.99 Framire/ha cocoa 1.5 0.26 0.54 0.55 0.64 0.58 Note: The mean numbers and densities of each tree species are calculated for those households which have the tree; that is, all zero values are omitted in the calculation of these means.
Logit regressions were performed to determine which factors had a significant correlation with the presence and densities of the selected trees. Independent variables included in the regressions are zone, origin (autochtone, allochtone or allogene), total land area, receipt of extension, education level, being a cooperative member, having a bank account, age of the household head, household size, distance to nearest paved road, presence of a village market, village population, and use of good agricultural practices (fertilizer and pesticide dummies and weeding frequency). The coefficients and level of significance of each of the significant factors is shown in Table 4.4.
The presence and density of akpi in fields was found to be significantly positively correlated with distance from the nearest paved road and receipt of extension. Surprisingly, cooperative members were found to be significantly less likely to have akpi and to have lower densities. Origin and geographic location were also significant factors. Allogenes were less likely to

!!
16!!
have akpi and had lower densities. Also, for both density and presence of akpi zones 3, 4 and 5 were significantly higher than zone 1, controlling for the other factors in the regression. This is interesting because without controlling for other factors, like ethnic origin, zone 1 appears to have the highest akpi density.
Table 4.4: Significant regression results, tree presence and density
Logit regressions on the likelihood of presence of selected trees Akpi
presence Palm presence Iroko
presence Frake
presence Framire presence
Zone 2 1.26** Zone 3 1.39*** 0.81* Zone 4 2.55*** 1.44** Zone 5 1.56** Allochtone 1.35*** 1.33** Allogene -1.37** Extension 1.1*** 0.56* 1.02*** Ln (dist to road) 0.69*** -0.38* -0.54** Coop member -0.69** Ln (total ha) 0.44** 0.43** Middle school 1.13** High school -1.2* Ln (age) -0.92* Market in village 0.88* Ln (weeding/year)
-0.87*
OLS regressions on density of selected trees Akpi density Palm density Iroko density Frake density Framire
density Zone 2 1.66* Zone 3 2.12*** Zone 4 3.79*** 1.99** Zone 5 2.42*** Allochtone 2.87*** 2.06*** 1.94*** Allogene -1.87** 2.11*** Extension 1.52*** 0.81* 1.01*** Middle school 1.75** High school -1.95* Ln (dist to road) 1.05*** 0.48* -0.58* -0.50* Coop member -0.85* Ln (age) 1.49** Ln (total ha) -0.44* -0.76***
Significance levels: * = 90%, ** = 95%, *** = 99%.
Since nearly all households had some palm, there were no variables significantly correlated with the presence of palm trees. Both allochtones and allogenes have higher densities of palm trees when compared to autochtones. Older farmers and those living in more remote villages also had higher densities of palm trees, while density decreased with total land area.
Households in zones 2, 3 and 4 were found to have a significantly higher likelihood of having iroko trees compared to zone 1, though only zones 3 and 4 had significantly higher densities.
!!
17!!
Allochtone populations were more likely to have iroko and at higher densities when compared with autochtones. Having a middle school education correlated with a higher likelihood of having iroko and at higher densities, though having a high school education correlated with a lower likelihood and lower densities. However, few farmers in the sample had these levels of education, so this result could be due to outliers. Older farmers and those who weeded their cocoa fields more were less likely to have iroko in their fields, and greater land area correlated with higher likelihood of having iroko.
Allochtone populations were also found more likely to have frake and in higher densities. Access to extension services was also significantly correlated with higher likelihood and density for frake, though distance from the nearest paved road had a negative correlation with both variables. Higher total land area correlated with a higher likelihood of having frake but had no significant correlation with frake density.
Finally, the likelihood of having framire as well as the density of framire were both significantly positively correlated with extension but negatively correlated with the distance of the village to the nearest paved road. Presence of a market in the village was positively correlated with framire presence but had no correlation with density. Total land area was negatively correlated with framire density.
Overall, these results suggest that the high tree densities observed for zone 1 when just looking at comparative statics are influenced by other factors. With other factors accounted for zone 3 and 4 seem to have the highest numbers of the selected trees. The most important factors which seem to positively affect the presence and density of intercropped trees in the sample are extension services, being allochtone, and remoteness of the village (which has a positive effect for more commonly marketed crops like akpi and palm but a negative effect for timber species).
4.3 Agroforestry attitudes and practices In addition to regression analysis on various factors to understand why certain tree species are present or not, we can also look at the farmers’ stated reasons for not having a particular tree on their land. The results are presented in Table 4.5 below, aggregated for the full sample. The primary reason for all of the selected species except for palm was “it just doesn’t grow there naturally,” indicating that most farmers don’t think about planting trees on their land as an active decision. The primary reason for not having palm was that farmers made the decision to cut it down when planting cocoa. A sizeable number also said that palm was not good for cocoa, which is why they omitted it.
This implies two different important facts: that palm is more naturally abundant than the other trees studied, and that farmers generally see it as more of a competitor with their cocoa than the other species of interest (though despite this fact it still has the highest density of all the trees examined). Other points of interest in Table 4.5 include the fact that from 3-6% of farmers specifically mentioned unfavourable timber exploitation structures in their decision not to have iroko, frake or framire on their land. Also, more than any other tree, akpi was cited as not planted because of natural death or lack of awareness of advantages, indicating

!!
18!!
that training on the advantages or akpi and methods of domestication may have a significant impact on farmer willingness to plant this species.
Table 4.5: Why farmers do not have given tree species
It doesn’t grow there naturally
I cut it when I planted my
cocoa
I am not aware of any advantages
Not good for cocoa
To avoid cutting by companies
Existed previously but died
Akpi 60% 22.8% 7.9% 3.3% -- 4.7% Palm 5.7% 65.7% -- 25.7% -- 2.9% Iroko 53.2% 27% 3.6% 4.0% 6.0% 2.8% Frake 58% 26.1% 5.3% 2.1% 3.9% 1.8% Framire 63.5% 20.1% 5.7% 2.7% 3.3% 1.8%
The question of why a given tree was not planted was asked only of the farmers who did not have the tree on their land. But all farmers in the sample were also asked to identify the benefits of the tree species of which they were aware. The results, aggregated for the entire sample, are shown in Table 4.6 below. This shows that there was the lowest awareness of advantages for frake and framire, though even for these trees over 70% of farmers were able to cite advantages. The table also shows that akpi is appreciated by most farmers for its seeds, but almost 30% of people also appreciated it for the benefits it brings to the environment. Results also suggest that farmers currently believe that iroko and frake provide more benefits to the cocoa growing environment when compared to framire, and that palm provides no benefits to cocoa whatsoever (actually many respondents noted that palm is bad for cocoa, stating that it decreases yields when it grows too close to the cocoa trees).
Table 4.6: Identified benefits of selected tree species
Shade for cocoa
Soil fertility
Soil humidity
Good for timber
Good for fuelwood
Supplies other products
No advantages
Akpi 10.9% 12.3% 5.4% -- -- 58.3% 11.7% Palm -- -- -- -- -- 91% 5.4% Iroko 11.4% 7.6% 7% 48.1% 2.8% 6% 15% Frake 11.3% 5.9% 3.8% 46.6% 6.8% 4.1% 21.2% Framire 9.7% 5% 3.6% 43.6% 6.4% 3.8% 27.3%
In the survey a few general questions were asked about agroforestry practices, including whether each parcel cultivated had associated tree or food crops, and whether the farmer planned to plant associated trees in their cocoa fields in the future, and why or why not. Table 4.7 and 4.8 show the responses to these questions. Note that essentially all the parcels with associated food or tree crops listed in Table 4.7 were cocoa parcels. There was one coffee parcel with other associated tree crops and one palm oil field with associated food crops in the sample, but otherwise every other crop besides cocoa was grown in monoculture.
Table 4.7 is divided by zone, and shows that for the most part associations between cocoa and some trees and food crops is high and uniform across regions, with the exception of zone

!!
19!!
5, where associations are much lower. This is partly due to the fact that a higher number of the parcels in zone 5 were palm plantations, where traditionally no intercropping of any kind is done. Zone 3 respondents also reported lower current and planned agroforestry methods.
Table 4.7: Reported agroforestry practices, by zone
Zone 1 Zone 2 Zone 3 Zone 4 Zone 5 Pooled
Parcels associated with tree crops 78% 58.5% 58.6% 76.7% 37% 62% Parcels associated with food crops
77.1% 48% 46.6% 72.3% 26% 54%
Intention to plant trees in future 70% 61.3% 30% 60% 35.4% 51.4%
As shown in Table 4.8 below, the main motivation for planting additional trees in the future is to benefit cocoa, indicating that those farmers received some type of training or information that associated trees can help cocoa (a reversal of what the old extension services told farmers, so the information is likely more recent). A high proportion also intended to plant trees in order to supplement their incomes via sale of tree products. This suggests that there is significant farmer interest in the objectives of this report.
The primary reasons for the intention not to plant trees in cocoa fields in the future all relate to lack of awareness of how intercropping can be accomplished, meaning that training could have a major impact on attitudes and plans. The highest number of farmers said they were not aware of any advantages of intercropping, but an almost equally large part said they didn’t have space to plant new trees (so training on how to carry out selective thinning and plant trees in empty spaces might have an effect) and a large number said that intercropping decreases cocoa yields (which is not true if done right, as could be shown with training).
Table 4.8: Reasons for intention to plant or not plant trees in cocoa plots in the future
Benefits to cocoa
To supplement income
For household consumption
Certification requirement
Tried before, good results
Why plant trees?
41% 36.6% 11% 8.7% 2%
Not aware of advantages
Inadequate space
Decreases cocoa yield
Lack of means
Tried before, bad results
Why not plant trees?
30.3% 25.1% 20.8% 17.7% 2.2%
4.4 Sources of germplasm for existing trees Table 4.9 shows that the vast majority of all trees, including palm, were simply found growing wild in the field. Palm, however, did have the highest proportion of planted trees, at 27.1%. Those producers who did plant palm (or, in rare cases, other tree species) were asked about the sources from which they acquired seeds and seedlings and whether they planted an improved variety or not. Most of those farmers who did plant palm acquired germplasm by saving seeds from their own or neighbouring fields, though almost 5% purchased seedlings

!!
20!!
from their buyer or another nursery. Also, 3% of farmers reported receiving frake seedlings from ANADER, suggesting that they were part of an agroforestry initiative. In terms of varieties: for akpi 0.5% said they had an improved variety (this could be an error, or might just indicate that the farmer saved the best akpi seeds from her harvest to plant), for frake the proportion was 3% (all from ANADER), and for palm it was 11% (from different sources).
Table 4.9: Sources of germplasm for selected trees
Grows wild Saved seed, own field
Saved seed, other field
Private nursery
Buyer ANADER
Akpi 96.5% 2% 1% -- -- Palm 82.9% 8.7% 2.5% 3.5% 1.4% Iroko 98.9% 0.6% 0.6% -- -- Frake 95.6% -- 1.5% -- -- 3% Framire 97.6% 1.2% 1.2% -- -- --
!

!!
21!!
5: MARKETING OF AGROFORESTRY PRODUCTS- VALUE CHAIN
DESCRIPTIONS
This section will use qualitative information to describe the value chains of the products of interest. This will include a map of the various channels for input supply, production, transport, bulk sale at the village and town level, processing, and final retail or export. At each level the information known about the different actors and how they interact with one another will be described. Additionally, the institutional environment surrounding each value chain will be described, including the supportive governmental institutions and business services which exist and those which are lacking and which hinder the value chain. Although it was omitted from section 4 because it was left out of the producer survey, citrus will be included in this section. Section 5.1 discusses the akpi value chain, section 5.2 covers that of oil palm, section 5.3 covers timber and fuelwood, and section 5.4 covers citrus.
5.1 Akpi value chain Of all the products studied, the value chain for akpi has the lowest amount of institutional support and business services. However, there is a fairly well developed, though informal, network of actors who harvest, process, transport and sell akpi. A description of the important institutional actors in the value chain is provided in Table 5.1, and a visual representation of the chain is shown in Figure 5.1.
Table 5.1: Organizational actors in the value chain of akpi
Actor Details
CNRA Working on better methods to propagate and produce akpi
Centre of Ecological Research Conducting research on propagation and processing
Small-scale exporters of akpi and other products
Examples: RAMA Cereal, Contavi, Ngro Service. Export on order to Europe.
Centrale des Commerçants CI Union of 52 merchant cooperatives, some of whom sell akpi
FENACOVICI Union of 1,800 coops of female producers of food crops, some of whom produce akpi
UCOFEACI Union of 178 food crop producer coops, some of whom produce akpi
The first crucial feature of the akpi chain is that all of the akpi harvested in Côte d`Ivoire is wild. Domestication efforts are still in their infancy in the country. CNRA and the CER have conducted some research into germination and propagation methods, and operate small nurseries and akpi plots for research purposes, but thus far no extension efforts have been

!!
22!!
initiated to spread domestication of akpi to the population. There are also no inputs available at all for the maintenance of akpi, though it is possible that even if akpi is domesticated and cultivated, other inputs will not be needed, because research indicates that the tree can succeed without chemical treatment (Gnahoua 2013).
Though this may change in the future if efforts are made to promote seed saving and planting of akpi, or if improved varieties or grafted seedlings are produced by CNRA (as they are currently done in Cameroon, which reduces time to maturity from 7-10 to 3-4 years), currently all akpi which enters the value chain is gathered from wild trees. The trees are scattered around cocoa fields or in fallows. Villagers tend to have the right to gather akpi seeds on any land, not just that which they own, without paying a land-use fee. The work of gathering the seeds, once they fall off the tree, tends to be relegated to young people (boys and girls) or women. For home consumption the women in the household will process the akpi themselves in small batches. Some entrepreneurs (almost exclusively women) process akpi in large batches for bulk sale on the market. In this case they tend to hire labourers to help them gather akpi, paying 1000-1500 F per day.
Traditional processing of akpi requires several steps and is very time and labour intensive. First, the fruits are gathered into piles and covered with leaves so that the outer shells will decompose, which can take several weeks depending on the level of humidity. Then the pits are extracted by hand, washed, sorted and boiled until they break open (which takes about an hour). The seeds then must be extracted from the cracked pits, which can be done by hand with the aid of a flattened nail (this is most common) or with a machine. The seeds are then sorted, washed, and dried in the sun (which can take up to a month). The work tends to be done in groups, by women, even for household consumption. Some larger operations hire workers to help with the processing and after processing they sell in large quantities to merchants in larger towns or cities. The more common method is for village-level processors with smaller batches to process akpi for their own consumption and their neighbours and to sell in small quantities at the local market or with itinerant merchants who come to the village. These merchants must buy small quantities of akpi seeds from many different processors in order to obtain a large quantity worth transporting to the regional town centres. All of the merchants interviewed and observed in the markets were women, and all sold other products (plantains, vegetable crops, rice, imported dried goods, other spices) in addition to akpi.
For the most part, the final stage of the value chain is consumers in villages, towns or cities (like Abidjan). However, there is also a small existing export market for akpi. Several companies were interviewed which process and package dried food products (attieke, rice, millet, corn meal, dried okra powder) for sale on the local market and for export to shops in Europe and the US catering to expatriate Africans. Though akpi is not a major product for these companies, they do occasionally (once every year or two) get a special order for akpi from one of their buyers. This is still fairly underdeveloped, partly due to low demand (only certain ethnic groups consume akpi, whereas a large number of African expats want millet or attieke), and also limited capacities.

!!
23!!
Figure 5.1: Akpi value chain map
Along the akpi value chain there are several different potential avenues for development. First, as previously mentioned, CNRA and ANADER could work together to develop methods of propagating akpi and spreading these methods to producers, perhaps even supplying grafted seedlings. Second, akpi cooperatives could be developed to pool the supplies of small-scale producer-processors, obtaining economies of scale via collective transport and marketing. Third, the small-scale export companies are in the process of organizing themselves into consortia (with assistance from an EU-funded project) which will enable them to satisfy larger orders and attract bigger customers abroad. If this happens, and is combined with an investment in advertising for akpi, then perhaps akpi exports can expand in the future. Furthermore, there is a demand for akpi in other countries of West Africa, including Cameroon, Nigeria, and Burkina Faso, and bulk merchants might be able to export directly to these markets. Currently the limited amount of akpi exports that occur tend to go through Abidjan and the companies source their supplies only on the local Abidjan market, because they do not purchase in large quantities. However, if akpi exports were to expand then large processor-merchants based in villages and/or producer cooperatives could sell akpi in bulk directly to exporters.
Figure 5.1 shows the map of the existing akpi value chain, with broken lines indicating channels that are not currently developed but which could be developed in the future. The figure also displays the existing and needed institutional supports and business services available to akpi producers and marketers. The only institutional support which does exist for akpi currently is the existence of research on domestication and propagation of akpi elsewhere (mostly in Cameroon), informal transport networks that exist for moving akpi from villages to town or city markets in bulk, and a few cooperatives (FENACOVICI, UCOFEACI, Central des Commercants) which provide some support to food crop producers,

!!
24!!
including collective transport and some inputs on credit. These cooperatives tend to put more emphasis on staple crops like rice and cassava or vegetable crops, but their networks could also be used to support akpi production and marketing.
As seen in Figure 5.1, there are far more needs than assets in the institutional environment surrounding the akpi value chain. Applied research and extension on akpi domestication in Côte d`Ivoire itself needs to be conducted, laws need to be written to organize and regulate the industry, supplies of seedlings and other inputs need to be developed, as well as technical training, financing structures, and support to promote exports. In fact, given the lack of such business services for akpi currently, it is impressive that the chain remains so vibrant. Likely this is because in many cases merchants and other actors in the chain use services obtained from selling other products in order to support their marketing of akpi.
5.2 Palm value chain In contrast to the akpi value chain described above, the value chain for palm oil in Côte d`Ivoire is highly organized and well developed. This is related to the presence of a number of important industrial actors in the value chain, enabled by strong government support of industrial oil palm development in the mid-1960s (when a parastatal, SODEPALM, operated all palm production and processing, the assets of which were privatized in the 1990s), and a strong professional organization (AIPH, the Association Interprofessionnelle de la filière Palmier à huile) which currently regulates and oversees the industry.
There are well-developed channels for seedling and other input supply for oil palm. CNRA has an entire centre devoted to the production and sale of certified, improved palm seed and seedlings, at Iro Lame (near Abidjan). Several of the large chemical companies with headquarters in Abidjan and distribution networks through the country have fertilizers, herbicides and other products targeted specifically at palm. There are local palm nurseries organized by palm producer cooperatives, industrial plantation operators, and individual producers. These input networks are stronger in areas near primary processing factories, like at the Ottawa SIPEF-CI factory within our zone of intervention. But even in villages far away from factories some individual producers reported saving seed or purchasing seeds from CNRA to create nurseries and then plant palm trees.
There are essentially three different methods of producing palm in Côte d`Ivoire. First, there are a number of industrial plantations, managed by companies like SIPEF-CI on land surrounding their factories. Second, there are also village plantations of smallholders who produce mainly for bulk sale to a nearby factory. The SIPEF-CI Ottawa factory currently obtains about 50% of its raw material from its own industrial plantations and 50% from village plantations, with about 90% of the latter flowing through cooperatives that provide transport and other services (Simon 2012). For the country as a whole, about 40% of industrially processed palm comes from industrial plantations and 60% from village plantations (AIPH 2013). There are a total of about 250,000 ha of palm in Côte d`Ivoire currently, 70% of which are operated by smallholders, though only 58% of production comes from these plantations. Industrial plantations have higher yields (10-12 tons/ha compared to 6-8 tons/ha for village plantations) because of more intensive management practices.

!!
25!!
The third type of oil palm production is from mostly wild, but sometimes planted, palm trees scattered throughout cocoa plantations, primarily in areas far away from industrial factories. Palm fruit from these trees is the primary source for products on the local market, though there is also a substantial amount of fruit diverted (in many cases in violation of a contract with a processing company or cooperative) away from village plantations near factories to the local market. Palm fruit from this channel tends to be of a completely different quality and variety than that grown on plantations destined for industrial sale. The wild “African” type fruits are more highly appreciated for home consumption to make sauces (and thus fetch a higher price on the local market) than “SODEPALM” fruits which have been selected for high oil content and are thus preferred for industrial production.
Palm producer cooperatives have played a large role in the oil palm industry since 2003, when the government encouraged the formation of such cooperatives and pushed for the transfer of provision of services like transport, road repair, input supply, and training from the processing companies to these cooperatives. Currently there are about 30 palm cooperatives in the country, though only two operate in our zone of intervention (COOPALM and COOPAGRIS). In total the cooperatives in Côte d`Ivoire have 36,500 members and produce 800,000 tons of palm bunches annually on 167,500 ha. They are organized into a national federation called FENACOPAH-CI, which is one member of AIPH along with the federations for primary and secondary palm oil processors.
AIPH, with support from FIRCA, has set and enforces producer and factory prices for industrial palm and earmarks a certain amount of money from each kg of palm bunches purchased to pay for transport, training, and other services. The cooperatives also receive from financing from member fees and other sources, but the vast majority come from this money earmarked from the sale of industrial palm, managed by FIRCA. Thus, cooperatives have a major incentive (in addition to being under contract) to see that all members sell their production to the industrial factories and not on the local market.
With regard to the industrial channel in the value chain, palm bunches are harvested and sold by the kilogram to a network of primary processing factories operated by about 45 different companies (15 large, 30 small). The largest of these by far is PALMCI, but SIPEF-CI and Palm Afrique are other major players. All these factories are located in production zones because of the high perishability and transport costs of palm fruit. These companies process a total of 170,000 tons of bunches per year, producing 360,000 tons of raw palm oil and 60,000 tons of palm kernel oil (a secondary, lower valued product) per year (AIPH 2013). These companies are organized into an association called APROSAPCI.
!
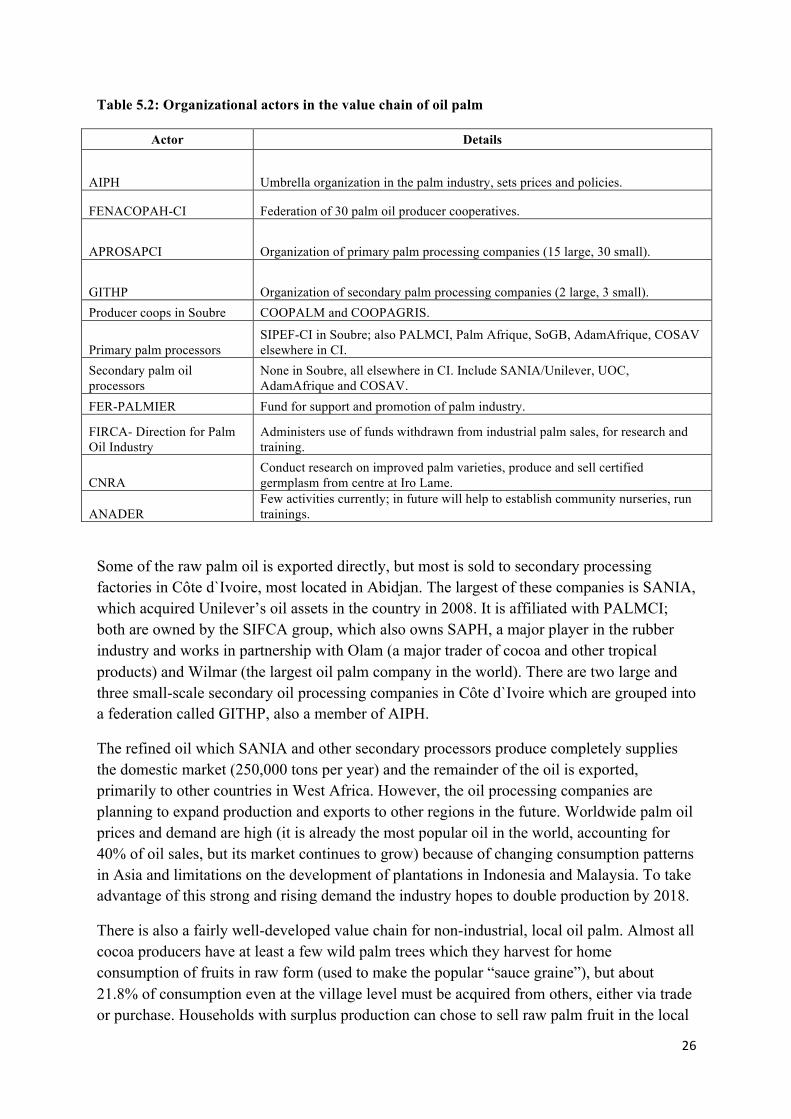
!!
26!!
Table 5.2: Organizational actors in the value chain of oil palm
Actor Details
AIPH Umbrella organization in the palm industry, sets prices and policies.
FENACOPAH-CI Federation of 30 palm oil producer cooperatives.
APROSAPCI Organization of primary palm processing companies (15 large, 30 small).
GITHP Organization of secondary palm processing companies (2 large, 3 small). Producer coops in Soubre COOPALM and COOPAGRIS.
Primary palm processors SIPEF-CI in Soubre; also PALMCI, Palm Afrique, SoGB, AdamAfrique, COSAV elsewhere in CI.
Secondary palm oil processors
None in Soubre, all elsewhere in CI. Include SANIA/Unilever, UOC, AdamAfrique and COSAV.
FER-PALMIER Fund for support and promotion of palm industry.
FIRCA- Direction for Palm Oil Industry
Administers use of funds withdrawn from industrial palm sales, for research and training.
CNRA Conduct research on improved palm varieties, produce and sell certified germplasm from centre at Iro Lame.
ANADER Few activities currently; in future will help to establish community nurseries, run trainings.
Some of the raw palm oil is exported directly, but most is sold to secondary processing factories in Côte d`Ivoire, most located in Abidjan. The largest of these companies is SANIA, which acquired Unilever’s oil assets in the country in 2008. It is affiliated with PALMCI; both are owned by the SIFCA group, which also owns SAPH, a major player in the rubber industry and works in partnership with Olam (a major trader of cocoa and other tropical products) and Wilmar (the largest oil palm company in the world). There are two large and three small-scale secondary oil processing companies in Côte d`Ivoire which are grouped into a federation called GITHP, also a member of AIPH.
The refined oil which SANIA and other secondary processors produce completely supplies the domestic market (250,000 tons per year) and the remainder of the oil is exported, primarily to other countries in West Africa. However, the oil processing companies are planning to expand production and exports to other regions in the future. Worldwide palm oil prices and demand are high (it is already the most popular oil in the world, accounting for 40% of oil sales, but its market continues to grow) because of changing consumption patterns in Asia and limitations on the development of plantations in Indonesia and Malaysia. To take advantage of this strong and rising demand the industry hopes to double production by 2018.
There is also a fairly well-developed value chain for non-industrial, local oil palm. Almost all cocoa producers have at least a few wild palm trees which they harvest for home consumption of fruits in raw form (used to make the popular “sauce graine”), but about 21.8% of consumption even at the village level must be acquired from others, either via trade or purchase. Households with surplus production can chose to sell raw palm fruit in the local

!!
27!!
village market (52%), with itinerant merchants who come to the village (and cover transport costs) (20%), or directly in towns themselves to bulk merchants (in which case the producer covers transport costs) (18%).
Figure 5.2: Oil palm value chain map
In some cases the bulk merchants sell raw palm fruit to consumers in town and city markets, because sauce graine is popular even among urban households. In other cases the bulk buyers are themselves large oil and/or soap processors. Also, some producers process the palm themselves, at the village level, into higher value products. About 21% of those who sell palm fruit also sell palm oil which they process themselves and 13% of those who sell palm oil also sell palm soap. Whether large processing operations which buy raw materials from others, or smaller operations that process their own production, there are a few different market channels for processed palm oil. Oil or soap can be sold directly to consumers in villages, with bulk merchants who trade and transport the products to regional towns or Abidjan, or in the town markets (once or twice a week, for those from elsewhere) directly to consumers.
Among producer-processors, about 43% of oil is sold in village markets, 52% to itinerant merchants who come to the village, and about 6% transport the oil to towns themselves and sell to bulk merchants (including soap makers) there. For those who process and sell soap, 78% of sales occur directly with consumers in villages, and only 6% of sales are to itinerant merchants, 6% to bulk merchants in towns, and 6% directly to consumers in towns. In the

!!
28!!
case of raw palm fruit only 7% of producers pay transport costs themselves, while this is 9% for palm oil and 47% for palm soap. This seems to indicate that there are more developed transport networks (a higher number of bulk merchants willing to go search for products and pay costs) for the first two products than for palm soap.
All levels of the local palm market from collection to processing, transport and marketing, and household consumption, are dominated by women. Men are involved only at the level of planting and maintenance of palm trees (if this is done) and harvesting of bunches. Most sales are individual, though there were a few groups of women who worked together to produce and sell palm oil and soap in the Ottawa area (zone 5), and one significant soap cooperative in Kragui, in Meagui (zone 4) which has been formed with support from the Mars Impact project.
There is a solid enabling environment and many business services available in the oil palm value chain. AIPH sets prices. CNRA and other institutions have conducted solid research on improved varieties and best management practices. Training is provided to farmers through cooperatives and industrial actors. There is huge demand for both refined industrial oil and local artisanal oil and soap. Big industrial companies have access to bank loans and other investment, and industry-wide initiatives are financed through the management and support of organizations like FIRCA and FER-PALMIER. Even small-scale palm farmers have some access to finance, because SIPEF-CI and other factories pay producers via bank accounts with microfinance institutions like COOPEC, which enables them to gain access to banks.
The major problems are that, despite some industry support for road repair, road quality in production areas is still very poor and transport is thus very expensive (this includes maintenance for trucks and bribes that must be paid at the myriad checkpoints). Also, all of the support structures for the industry only apply to those participating in the industrial channel of the value chain. There are no relatively few supportive structures for producers who live far from the oil factories. There are also next to no support structures for artisanal oil or soap processing. Development of training, financial support and other services for these parts of the chain could have a major impact on smaller producers. The local palm oil industry already is a profitable source of alternative income to cocoa farming families, but it could be even more so with additional support.
5.3 Timber and fuelwood value chain The timber and fuelwood value chain is similar to the oil palm value chain in that there is both an industrial component and a local component, with very different actors involved in each chain and with far less institutional support for the latter. However, this value chain is unique because of the unique legal structures governing the industry.
The Forestry Code of 1965, revised in 1994, says that all wild trees growing in Côte d`Ivoire are the property of the government, even if they are located on land owned by a private producer. Only a limited number of licensed companies are legally allowed to cut down wood, whether wild and owned by the state or planted by an individual producer (and thus

!!
29!!
owned by that producer). Companies are allocated “concessions” of land throughout the country, on which they pay several different taxes.
The government has designated 386 concessions throughout the country, ranging from 3,000 to 10,000 ha in size for a total of 4.1 million ha. There were 225 such licensed harvesters in 2012, though only 125 were active. There are four different types of licensed harvesters: groupings of at least seven harvesters which are organized under the cooperative law (there are 44 such groupings); sawmills (of which there are 153); community societies in partnership, which are generally a pairing of a licensed sawmill and a timber society that did not have its own license for harvesting (of which there are 27); and one forestry school which uses its concessions for research and education purposes.
The companies have the right to cut down any wild trees within their concession, even those which are inside privately-owned cocoa fields, though nominally they are supposed to negotiate with the planter before harvesting such trees and offer either individual-level or community-level compensation, and to pay for any damage done to cocoa trees during the harvesting process. However, compensation is often not paid or the level of compensation is very low, and thus there is major tension between timber societies and cocoa farmers in many areas. In some cases farmers reported killing trees on their land which they knew would be desirable to timber companies before they could grow too large and attract the attention of harvesters.
Even where farmers plant trees on their own, making them the legal owner of the trees, they are not legally allowed to cut these trees down. They are technically supposed to contract with licensed harvesters who will then conduct the harvest under the supervision of the Ministry of Water and Forests or SODEFOR. This can be time consuming and the transactions costs may outweigh the benefits. Under this legal structure many farmers do not find it advantageous to plant timber species on their land, because they do not have the opportunity to earn significant profits on the wood through legal channels. Illegal channels—clandestine harvest of wood for firewood or charcoal or for local board processing—are currently very profitable, but operating illegally always entails the risk of fines or other sanctions if one is caught.
Table 5.3 below shows some results from the quantitative producer survey on the level of knowledge of the Forestry Code among producers, plus past experiences with the licensed timber harvesting societies. Results show that knowledge of the code is very low (average 9%) and that dissatisfaction with the code among those who understand it is high (average 66%). About 37% of farmers reported having trees cut down by a timber company in the past (though there was significant variation by geographic area, ranging from 19% in zone 2 to 53% in zone 4). Only 56% of those with trees cut reported receiving any kind of compensation (at an individual or community level), and the average level of compensation for those receiving it was only 12,400 F per tree. Compared to an approximate average of 72 million F in gross revenues earned by timber companies for sale of one frake tree and of 113 million F for one iroko tree, this is only a tiny fraction.

!!
30!!
Table 5.3: Farmers with trees already cut, compensation, knowledge of forestry code
Zone 1 Zone 2 Zone 3 Zone 4 Zone 5 Pooled % farmers w/ trees cut by timber firms
34% 19% 33% 53% 46% 37%
Avg. number of trees cut
8.3 3.2 4.9 7.2 3.0 5.5
% receiving compensation
54% 57% 69% 67% 32% 56%
Avg. total compensation
46,300 F 46,250 F 58,000 F 33,020 F 38,300 F 44,763 F
Avg. per tree compensation
6,402 F 15,823 F 17,405 F 8,516 F 8,167 F 12,387 F
% understand Forestry Code
11.4% 7.8% 7.5% 11.3% 5% 8.7%
% unhappy w/ Forestry Code
55.5% 100% 50% 44.4% 100% 65.6%
% would plant trees if Forestry Code changed
88.9% 83.3% 100% 100% 80% 92.5%
There are currently discussions underway about reviewing the Forestry Code, though it is not exactly clear what the nature of the reforms would be or when they would be enacted. One possibility under consideration is to make all trees, even if wild, the property of the land owner where the trees are located. The producers could then negotiate with industrial harvesters for sale of their timber when mature, and under such a system they might attain higher prices than they do currently. Another reform might be to ease the restrictions on who can legally harvest trees somewhat, or at least to make it easier for small-scale village associations to become licensed harvesters. When asked if such reforms would increase their likelihood of planting trees on their land, 93% of those sampled answered in the affirmative.
In the current timber and fuelwood value chain, there are only a very small number of input suppliers. A number of the industrial timber companies operate their own nurseries, primarily used for legally-mandated reforestation. SODEFOR also operates nurseries, which it uses to plant its own timber plantations (in classified forest zones) for commercial exploitation, but which they also sell to industrial or other interested groups. SODEFOR tends to acquire seeds for their nurseries by gathering from existing forests, but it also has research programs involved in the development of improved varieties of some of the more popular timber species, including iroko.

!!
31!!
Figure 5.3: Timber and fuelwood value chain map
Currently there are almost no community nurseries for smallholders or village timber plantations, but SODEFOR agents stated that they would be happy to supply free seedlings and other support to producer groups wishing to establish such nurseries. The Sustainable Tree Crops (STCP) program which operated for a period in West Africa but is now defunct had a program where they helped producer cooperatives to establish nurseries of frake using gathered seeds. Planting trees from these nurseries was very popular in the project areas, so reviving such a project and implementing it on a wider scale in the future could have a major impact. Also, certification bodies like UTZ and Rainforest, which have standards requiring a minimum of 18 shade trees per hectare of cocoa, have already begun initiating programs to help farmers plant trees, but this could be further expanded.
There are several different legal channels for harvest and marketing of wood currently. A licensed processor can harvest the wood within its own concessions for processing into boards, plywood, veneer and other finished products. These products can then be exported or sold on the local market. Raw wood cannot be legally exported, except for Teak and Gmelina because they are fast-growing. Also, processed wood sold on the local market legally must come from a licensed industrial sawmill and cannot be processed by a small-scale local board maker, regardless of who harvests the wood. As for charcoal and firewood, there are no industrial channels for their production, but there is still a legal and an illegal way to produce and sell these products. Dead wood and fallen branches which are gathered for home consumption or sale is considered legal. Technically wood cut for the purpose of selling as firewood or charcoal is only legal if harvested by a licensed timber harvester. Those transporting and selling either type of fuelwood must also pay for a permit with the Ministry

!!
32!!
of Water and Forests, and are subject to additional fees (and bribes) and checkpoints which are numerous on the roads throughout the country.
Table 5.4: Organizational actors in the value chain of timber and fuelwood
Actor Details Ministry of Water, Forests and the Environment
Sets Forestry Code, manages timber production outside of classified forests.
SODEFOR Manages timber production in classified forests.
Industrial sawmills 153 total. Examples include TranchIvoire, CIB, Inprobrois.
Groupings of small-scale timber harvesters 44 total. Examples: IFOR, RegionFor.
Timber community societies 27 total. Examples: AgriFOR, MBM (partner of Inprobrois).
RainForest Alliance, UTZ Have rules on min trees in cocoa parcels for certification
ANADER Assists cocoa farmers with intercropping for certification
Sustainable Tree Crops Program Promoted frake among planters in the past, now defunct.
However, there are a very large number of illegal wood harvesters, local board makers, and people who transport and sell fuelwood purchased from an illegal harvester or without paying for the required permit. The ability to make a profit, or not, while operating illegally clearly depends on the degree to which the law is enforced. In most cases producers in our quantitative survey did not report legal barriers as their main reason for not selling firewood or charcoal (instead it was the lack of adequate wood supply, lack of local demand for firewood, or the difficulty of processing that stopped them), though in a few notable cases allogene producers reported that in their village the autochtone population had made it illegal for the allogenes to harvest and sell fuelwood. However, this was not the case everywhere, and illegally-operating woodcutters, board makers, charcoal processors, and fuelwood merchants were found of all different ethnicities. The value chain tends to be dominated by men except for merchants of firewood and charcoal. The transport and sale in towns of these products is dominated by women (though not as strongly as for food crops).
Figure 5.3 shows a map of the different stages of the value chain, most of which have been outlined already. One last point to note is the potential for changes in the value chain in the future (which are indicated by dotted lines in the diagram). Community nurseries and village plantations could be developed to feed the local demand for charcoal and firewood, because demand is high but supplies are shrinking rapidly and currently no one is planting trees specifically for this purpose. These village plantations could either contract with licensed harvesters or could harvest themselves for fuelwood or timber processing. The former would likely only be favourable to them if there was a clear system of regulation, with contract enforcement and perhaps set prices, enforced by an industry body or the government; since this does not exist it would need to be developed. The latter would only be possible if the

!!
33!!
Forestry Code was first changed. Thus, without any changes to institutional structures, village timber plantations are unlikely to develop.
There are some positive aspects of the institutional environment for the timber and fuelwood market, but they tend to be outweighed by the disadvantages. On the positive side the Ministry of Water and Forests, SODEFOR, and several universities do conduct research and monitoring of timber in Côte d`Ivoire, which means information is available to guide better management practices in the future. There is also a high demand, both at the local and the international level, for the species of trees grown in the country, and demand is very diversified, since some markets favour harder, expensive wood products (like iroko boards) and other markets favour softer, faster-growing, cheaper wood and wood products (like veneer or plywood made from Fromager). Because there are large companies currently operating in the industry this means that the factory infrastructure, transport networks, and industrial finance already exist, and these are resources that could possibly be tapped into for future development of the industry.
However, there are far more disadvantages in the timber and fuelwood chain, chief among them the current Forestry Code which fuels conflict between timber companies and cocoa farmers, and which provides no incentives for landowners to plant trees. The total supply of wood in the country is shrinking dramatically and as a result many timber companies have already gone out of business. These problems are exacerbated by the lack of communication (and hence knowledge) about the Forestry Code among producers, high legal fees and bribes at checkpoints which must be paid by anyone wishing to be involved in the industry, and poor quality roads that make transporting wood products difficult and expensive. The most crucial thing to do to revitalize the timber and fuelwood industry is to reform the Forestry Code so that there is an incentive to plant trees. If that is done, additional helpful measures would include providing technical support to producer groups wishing to establish nurseries and plantations, as well as training on the best methods to manufacture charcoal and support or financing to obtain the materials to start charcoal processing businesses.
5.4 Citrus value chain The value chain for citrus is similar to that of akpi in many ways, in that there is little to no institutional support and most of the marketing is local. However, there are a few crucial differences. First, almost all the citrus trees that exist in the zone of intervention (or the country as a whole) are planted. Though citrus is well adapted to the climate in the forests of Côte d`Ivoire, it is exotic, like avocado and mango. Methods for propagation and planting are well-known, and there is even a CNRA station which develops improved varieties of many types of citrus and supplies germplasm, though the vast majority of producers save seeds from their own or neighbouring fields rather than acquiring them from CNRA.
Another difference is that, unlike akpi, citrus is sold almost entirely in raw form rather than processed beforehand. This means less work for those wishing to sell the fruits, but it also means that they face huge problems with waste due to spoilage. Another major difference is that industrial citrus processing, for essential oil, was a vibrant activity in the past in Côte d`Ivoire but most of the companies that used to be involved in this industry have gone out of

!!
34!!
business. There is also a new, rising industrial juice processing sector in the country, but thus far it is small and restricted only to Abidjan.
Nominally, ANADER, the Ministry of Agriculture and FIRCA all have divisions which are supposed to help oversee, support and run projects related to the citrus industry. However, none of them are currently operating any activities. FIRCA is constrained because its model is to manage funds generated by industrial sales, and there are currently almost no industrial citrus sales. They can tap into some common “solidarity” funds paid for with money from other fruit industries like pineapples and desert bananas, but currently they are not implementing any projects with these funds. Representatives of all three of these organizations said that they hope in 2013 to revamp programs for the citrus industry, starting with a census/stock-taking of the productive capacity in the country.
The three major food producer and marketing cooperatives in the country, UCOFEACI, FENACOVICI, and the Centrale des Commercants currently do not have major projects relating to citrus, but support structures already in place for other crops (rice, cassava, vegetables) such as transport networks and inputs offered on credit could be extended to cover citrus as well. FENACOVICI has recently applied for financing to purchase a large fleet of trucks (160 trucks of various sizes, to service seven warehouses throughout Côte d`Ivoire), which would substantial improve their transport capacity in the future and this could prove to be a major boon to citrus marketing. FENACOVICI representatives also expressed a very strong interest in developing juice processing factories in the interior of the country in the near future, though they have not yet formally applied for funding for such a project.
Table 5.5: Organizational actors in the value chain of citrus
Actor Details
ANADER Has citrus industry branch, but no activities currently
Ministry of Agriculture Has citrus industry branch, but no activities currently
FIRCA Citrus industry branch with some "solidarity funding" from other fruit industries, but few current activities.
CNRA Produces improved seedlings for all types of citrus and other fruits at station in Azaguié
Essential oil companies PlantIvoire, SAID (still functions); SAIM, COCI, Agriland, CoopAgrume (out of business)
Juice companies IvoireOR, Fiesta (located in Abidjan)
Centrale des Commerçants CI Union of 52 merchant cooperatives, some of whom sell citrus
FENACOVICI Union of 1,800 coops of female producers of food crops, some of whom produce citrus
UCOFEACI Union of 178 food crop producer coops, some of whom produce citrus

!!
35!!
Figure 5.4 shows that in the citrus value chain there are seedling inputs from CNRA which are mostly used to supply industrial plantations (this was much more important in the past, though a few still exist) while village plantations and scattered citrus trees in cocoa orchards are planted from saved seed. There are currently very few citrus chemical products available on the local market. One large chemical company, Callivoire, used to supply a fertilizer specially designed for citrus which was supplied by a company known as Yara Convention, which however, went out of business.
As recently as 2010 there was a profitable citrus oil industry in Côte d`Ivoire which controlled 13% of the international market, but a combination of the 2011 political crisis and competition from other producing countries (especially Indonesia) caused most of the companies to go out of business. In 2013 only one of these companies was confirmed to still be operating, PlantIvoire, and according to unconfirmed reports, that a second, SAID was also still in operation. In 2010 there were 5,429 ha of lemons, bergamot and bitter orange plantations serving these factories. Though much of this area is likely still under citrus, they are currently not being harvested because the factories have gone out of business. There is a local market for lemon that can absorb that production, but there is no local market for bergamot or bitter oranges. These plantations will have to be converted into other crops (perhaps citrus for the local market, including oranges, mandarins and grapefruit) unless efforts are made to revive the citrus oil industry.
Figure 5.4: Citrus value chain map
!!
36!!
It is impossible to estimate the production of oranges and other citrus for the local market because most are grown scattered throughout cocoa orchards. Most of these fruits are currently harvested for household consumption, some are sold locally at village markets (though during peak season supplies are so high that prices drop very low and many producers do not think it is worth the time to harvest and sell their citrus), but the only very profitable sales occur when there is a mechanism for transporting the fruit quickly, in bulk, to a regional town market or to San Pedro and Abidjan. Producers in Krohon and Gbletia, villages located immediately on the paved road between Soubre and San Pedro, reported profitably selling large quantities of oranges to merchants travelling to San Pedro. However, this is not option in many of the more remote villages. The best way to develop the profitability of the local market would be to develop transport cooperatives for citrus fruits which would gather the fruits and deliver them in large quantities to towns like Soubre and Meagui or cities like San Pedro and Abidjan.
Currently there are merchants, primarily women, who buy citrus in large quantities in the villages for sale in the cities and towns. However, they tend to transport the citrus by foot, bicycle, or public transport, and these methods both limits the quantity that can be transported at one time and increases per unit transport costs, when compared to cooperatives which could rent or purchase their own trucks. One other interesting transport structure is the use of the public mini-buses (Massa) to transport fruit and other products on order from one city to another. Some fruit vendors in Meagui and Soubre sell imported apples, export-quality bananas, and off-season, imported oranges sourced from Abidjan in the town markets. These are acquired by getting a contact in Abidjan to purchase boxes of imported fruit in the market there and to drop off the order at the Massa station. The vendor in Meagui tells a designated Massa driver ahead of time that she will be having an order delivered and pays the driver a loading and transport fee. A similar method can be used to transport goods from towns to Abidjan or San Pedro.
One other promising sector of the value chain which would be worth developing further in the future is local juice processing. There are several small-scale industrial juice processing companies located in Abidjan currently which report very high profits. Although these companies sell a range of different fruit juices, orange is their most popular flavour. Representatives of these companies report very high demand for fruit juice, especially during the off-season when fresh oranges and other fruits are not readily available. Bottled juice can last up to six months without refrigeration and thus can be used to extend the season of consumption. Currently, locally processed juice is sold only in the Abidjan market and several other large cities and factories are only located in Abidjan. In the future these companies might be able to expand into the export market.
Of greater interest and potential profitability is the possibility of setting up juice factories closer to the production zones, since this would reduce transport costs of the fresh fruit and reduce the risk of spoilage before processing. There are untapped markets in the interior of the country as well. Eating fresh fruit and drinking sweet, fruit-flavoured sodas (and one artificial orange juice called Tampico) are both very popular throughout Côte d`Ivoire, and thus it is not inconceivable that if supply of locally-produced juice was made available there

!!
37!!
would be a sizeable demand for it even in towns like Soubre and Meagui. The major limitations would be cost of machinery, machine maintenance, electricity, and packaging materials in areas further from Abidjan. There is a well-established infrastructure for collecting used glass bottles in Abidjan, and thus it is easy to acquire these for low prices, but it might take time to bring the same type of infrastructure to a town in the interior. Overall, this idea is a very promising one that should be further assessed with detailed business plan assessments.
As shown in Figure 5.4, there are currently few institutional supports in place for the citrus industry. The bottling infrastructure that exists in Abidjan is one advantage, as is the informal transport network of female bulk merchants who purchase many different products in villages for sale in towns and the system of transport via Massa. However, the value chain lacks distribution networks for improved citrus seedlings, other inputs for promoting higher citrus production, training on best practices to increase production, methods for good post-harvest handling and preservation, and credit support for actors at all stages of the chain to finance investments. There is currently almost no research or monitoring being conducted on citrus in Côte d`Ivoire, there is no industry regulation to better organize transport and standardize pricing, and low road quality makes transportation of citrus from many remote villages before spoilage next to impossible. Setting up cooperatives and local juice factories would be a good way to start developing the citrus industry, but this would need to be supplemented with better research, input supply, and technical training support.
5.5 Seasonality and storage issues In considering the relative profitability of different products it is important to take into account the season during which harvest takes place and the length of time which the product will last before spoilage. Products which have a long shelf-life do not face the same fluctuations in quantity and price on the market as products which spoil quickly, because they can be stored and sold throughout the year.
Table 5.6 below shows the approximate months of highest production, medium production, low production, and very low or no production of the selected crops. Akpi trees produce a few fruits throughout the year, but the major harvest period is centred around the month of August. The fact that the peak harvest is in August also means that labour used for collecting and processing akpi does not compete with labour for cocoa harvest, since the main cocoa harvest is from October through to mid-January and the minor harvest is from around April to June. Because preparation of the seeds can take up to two months this means that akpi seeds are especially numerous on the market between September and November. However, akpi seeds can last up to two years without going bad, if periodically (twice a month) left in the sun to dry. This means that akpi is present on the market all year and that prices fluctuate less dramatically than perishable products. There is still a seasonal fluctuation in quantity and price on the market, however, because many merchants do not have the financial means to buy akpi in large quantities during the peak season for sale off-season. Those merchants who are able to do so can earn very high profits.

!!
38!!
Oil palm also produces some fruit all year round, but the peak harvest centres around the middle of the year, from April to June. This corresponds with the minor cocoa harvest, which means that there might be problems regarding competition for available vehicles for transport and labour for harvest. However, if well-coordinated this could actually be an opportunity. The same hired labour could harvest cocoa and palm trees in the cocoa orchard, and the two products could be transported together to larger towns. This would not be possible during the major cocoa season because volumes are very high at that time, but during the minor cocoa season it might be feasible. In the areas of highest palm production, like around the Ottawa SIPEF-CI factory, separate labour and transport networks support cocoa versus palm (the latter mostly is served by the two palm cooperatives), so this is less of an issue, but it is something to consider if cocoa-palm intercropping is further developed in the future.
Table 5.6: Calendar of production periods for selected products
Jan Feb March April May June July Aug Sept Oct Nov Dec Akpi Palm Oranges Lemons Timber Cocoa Dark blue refers to the periods of highest production, medium blue to medium production, and light blue to lower levels of production. Blank spaces signify no significant production during that time period.
Raw palm fruit needs to be processed or consumed as soon as possible, ideally within 2-4 days of harvest, but a week at maximum. Thus, transport to market or household processing must occur as soon as possible or there will be high post-harvest losses. This is the reason why primary oil processing factories are located near the areas of production. It also implies that would-be village sellers of palm fruit cannot store the seeds and wait for a merchant offering the best price, but must sell immediately to the first available buyer. In such an environment an operation with its own transport network which could travel to villages quickly, buy palm fruit and transport them to market could acquire the fruit at a relatively low price from producers with few market alternatives. A few such operations were observed and were found to be highly profitable. However, there are not enough of these merchants to serve the market, so most palm fruit is consumed at home or, if grown in large quantities, processed at the village level into oil.
Palm oil has a shelf life of about 18 months, though even after it goes bad it can still be used for soap making. If processed into soap the product is preserved indefinitely. Thus, processing palm fruit into oil helps to lengthen the time in the year during which palm products can be sold. If an entrepreneur has the capacity to buy and process large quantities of palm into oil during the peak season for storage and sale throughout the year then they can earn sizeable profits. However, this takes time and financial means, so there are only a limited number of women who do this. Microfinance programs that can provide liquidity to oil processors during the peak season to enable such storage could significantly stimulate these small businesses. The same applies to soap processors.

!!
39!!
Citrus products are generally most numerous during the short wet season at the end of the year. The peak harvest for oranges is October through December, while the operator of the PlantIvoire lemon, bergamot and bitter orange plantations said that their peak season was during August and September. There is also a brief harvest season for oranges around July and August, just after the main wet season, and for lemon and other plantation fruits the season is from March-May. The fact that the peak orange harvest coincides with the major cocoa harvest is a major constraint to the further development of the industry, because of high competition for vehicles and labour at that time. Investments would need to be made in trucks allocated for citrus collection so that producer groups did not have to pay astronomical prices to rent trucks during the cocoa season.
Additionally, the fact that there is such a distinct on- and off- season for citrus fruit creates problems for merchants and vendors in the value chain. It is impossible to survive all year as a citrus dealer; only merchants who also trade in other products (staple or vegetable crops, and/or other fruits) with other periods of seasonality can sustain their business, and this requires a substantial amount of resources. Also, citrus has a very short shelf-life and will last only one week at room temperature before spoiling. This means that bulk citrus traders must have the capacity to collect and transport the fruit quickly. Some vendors in Soubre reported that they dealt with this problem by going to a nearby village every single day to purchase citrus fruit (and other products) just for the next day’s sales. This takes a great deal of time (about 5-6 hours a day) and money (500 F per day) which most vendors cannot afford. Methods that can be used to extend the life of citrus fruits or to extend the season could have a major impact on the value chain. Efforts could be focused on production, to develop varieties and methods which spread to lengthen the harvest period. More promising would be methods to process citrus fruit, either into citrus oil (reviving the once-vibrant industry) or juice.
Essential oil factories like PlantIvoire deal with seasonality by operating their factory at high capacity throughout the harvest season and selling all their processed oil on contract with their buyer at that time. The buyer stores the products before use, which entails low costs because essential oil can be stored indefinitely at room temperature. The fact that citrus fruit spoils quickly at room temperature is the reason why essential oil factories are generally located adjacent to their own plantations. A representative of PlantIvoire, which has a factory in Agboville, said that they were asked by a large lemon producer in Sassandra, 320 km away, if they would purchase and process their lemons. PlantIvoire declined the offer because of the cost and difficulty of transporting the lemons that distance without high spoilage losses.
Wood and wood products clearly do not have the same seasonality and storage issues as the other crops discussed here, but there are few points that are still worth discussing. First, data provided by the Ministry of Water and Forests show that though timber is harvested all year round, there is a notable dip in harvested quantity from October through to December. This is a conscious decision by timber harvesters to avoid conflict and competition with the major cocoa harvest. Because most of the timber that is harvested comes from cocoa fields, it is more difficult to coordinate harvests while there are many workers in the fields harvesting
!!
40!!
cocoa. Also, by harvesting less timber at that time the timber companies can rent out some of their excess vehicle capacity to cocoa pisteurs in order to earn some extra money.
With regard to storage, processed boards can actually rot if left out in the rain or not treated with products to prevent rot and insect attack. Interviews with small-scale board sellers suggested that this is sometimes a problem and can result in financial losses. Board vendors deal with these problems by constructing protective shelters to store their wood or even warehouses, if possible, and by paying for products to treat the wood. However, these measures require finances which are out of reach for some small-scale entrepreneurs. Development of networks for small loans and grants for these small-scale businesses could help to expand the capacity to deal with this problem, as well as to grow the scale of the businesses in general.
!!
41!!
6: SUPPLY AND DEMAND ESTIMATION OF SELECTED PRODUCTS
This section uses data to estimate and compare the supply and demand of the selected products (akpi, palm fruit, palm oil, palm soap, firewood, and charcoal). Some basic supply and demand numbers are provided for industrial palm as well, though these were calculated through different methods since industrial palm is not a consumer product (rather demand is purely at the level of the Ottawa SIPEF-CI factory) and it was essentially only produced in zone 5.
Section 6.1 presents results on production, consumption and sales per household in the quantitative survey, as well as consumption data in regional town centres based on qualitative interview data. In section 6.2 the data, in combination with population data for the region, is used to estimate supply, demand within the villages (among agricultural households) and demand within regional town centres (non-agricultural households).
Unfortunately, citrus and boards were not included in the quantitative survey, so supply and demand cannot be estimated for these products. Information on household consumption of citrus in regional towns was collected and is provided here, but without information on production and village consumption the important comparisons cannot be made. Estimating supply and demand for these products could be a useful avenue for further research.
6.1 Production, consumption and sales summary for selected products Table 6.1 below presents the average annual household production of the listed products for those households which produced them. Table 6.2 shows the percentage of households in each zone which produced the given product. These numbers can be later multiplied together and by the number of total producer households to give an approximate estimate of total supply of each product.
Production data was not explicitly collected in the survey (because farmers cannot recall their total production), so this variable was constructed using data on consumption and sales. It was calculated by taking the annual weekly household consumption during the peak season multiplied by the number of weeks that the product is in season multiplied by the percentage of the product which household members produced themselves, plus the annual amount of reported sales of the product by the household. Survey respondents reported their sales and consumption in several different units, so before these numbers were calculated the quantities were all standardized to the unit which appeared most frequently for the given product. Since this data required a large amount of calculation it is possible that errors may have been introduced, though the results should still give a reliable approximation of production.
Table 6.1 shows some significant variation in production of the selected products by geographic zone. For example, production of akpi in zone 4 was 49 cups on average while in zone 2 it was only 29 cups. Interestingly, zones with high raw palm fruit production tended to have lower palm oil production and vice versa. This is most notable for zone 3, with production at 336 cans of palm fruit and 77 litres of oil, versus zone 5, with 131 cans of palm fruit versus 137 litres of raw oil. Palm soap production was found to be highest, by far, in
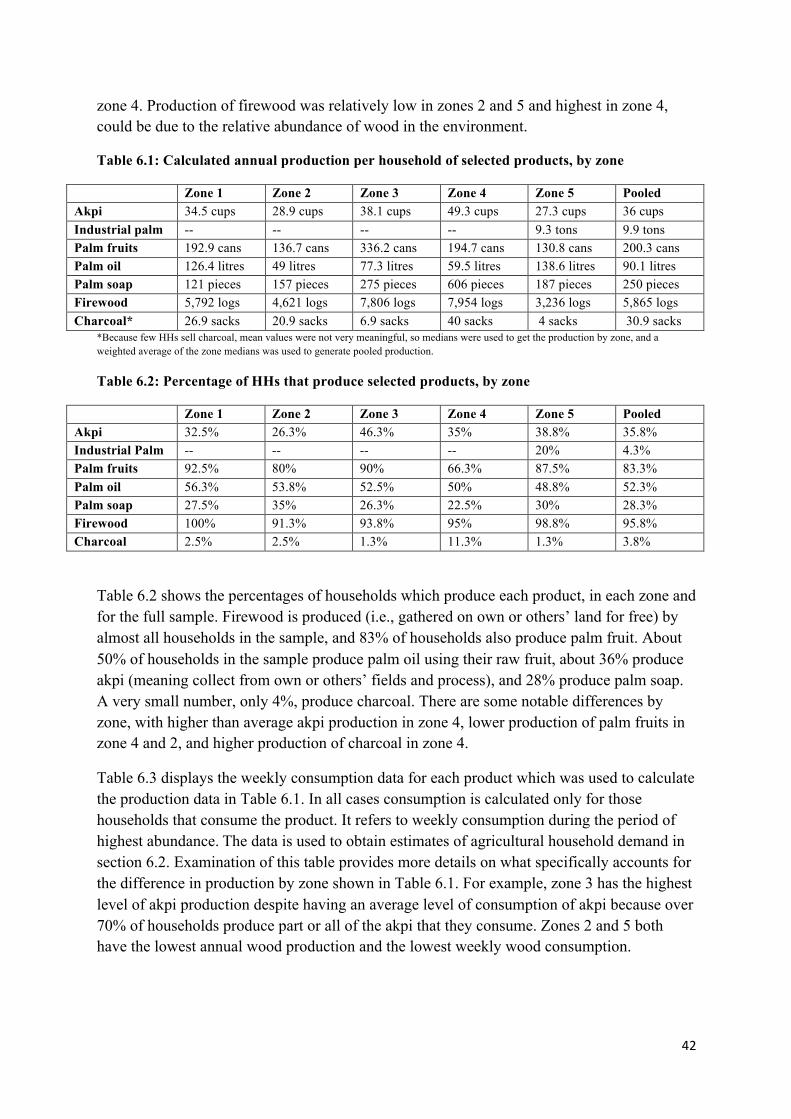
!!
42!!
zone 4. Production of firewood was relatively low in zones 2 and 5 and highest in zone 4, could be due to the relative abundance of wood in the environment.
Table 6.1: Calculated annual production per household of selected products, by zone
Zone 1 Zone 2 Zone 3 Zone 4 Zone 5 Pooled Akpi 34.5 cups 28.9 cups 38.1 cups 49.3 cups 27.3 cups 36 cups Industrial palm -- -- -- -- 9.3 tons 9.9 tons Palm fruits 192.9 cans 136.7 cans 336.2 cans 194.7 cans 130.8 cans 200.3 cans Palm oil 126.4 litres 49 litres 77.3 litres 59.5 litres 138.6 litres 90.1 litres Palm soap 121 pieces 157 pieces 275 pieces 606 pieces 187 pieces 250 pieces Firewood 5,792 logs 4,621 logs 7,806 logs 7,954 logs 3,236 logs 5,865 logs Charcoal* 26.9 sacks 20.9 sacks 6.9 sacks 40 sacks 4 sacks 30.9 sacks
*Because few HHs sell charcoal, mean values were not very meaningful, so medians were used to get the production by zone, and a weighted average of the zone medians was used to generate pooled production.
Table 6.2: Percentage of HHs that produce selected products, by zone
Zone 1 Zone 2 Zone 3 Zone 4 Zone 5 Pooled Akpi 32.5% 26.3% 46.3% 35% 38.8% 35.8% Industrial Palm -- -- -- -- 20% 4.3% Palm fruits 92.5% 80% 90% 66.3% 87.5% 83.3% Palm oil 56.3% 53.8% 52.5% 50% 48.8% 52.3% Palm soap 27.5% 35% 26.3% 22.5% 30% 28.3% Firewood 100% 91.3% 93.8% 95% 98.8% 95.8% Charcoal 2.5% 2.5% 1.3% 11.3% 1.3% 3.8%
Table 6.2 shows the percentages of households which produce each product, in each zone and for the full sample. Firewood is produced (i.e., gathered on own or others’ land for free) by almost all households in the sample, and 83% of households also produce palm fruit. About 50% of households in the sample produce palm oil using their raw fruit, about 36% produce akpi (meaning collect from own or others’ fields and process), and 28% produce palm soap. A very small number, only 4%, produce charcoal. There are some notable differences by zone, with higher than average akpi production in zone 4, lower production of palm fruits in zone 4 and 2, and higher production of charcoal in zone 4.
Table 6.3 displays the weekly consumption data for each product which was used to calculate the production data in Table 6.1. In all cases consumption is calculated only for those households that consume the product. It refers to weekly consumption during the period of highest abundance. The data is used to obtain estimates of agricultural household demand in section 6.2. Examination of this table provides more details on what specifically accounts for the difference in production by zone shown in Table 6.1. For example, zone 3 has the highest level of akpi production despite having an average level of consumption of akpi because over 70% of households produce part or all of the akpi that they consume. Zones 2 and 5 both have the lowest annual wood production and the lowest weekly wood consumption.
!

!!
43!!
Table 6.3: Village consumption of akpi, by zone
Zone 1 Zone 2 Zone 3 Zone 4 Zone 5 Pooled Akpi
Consuming HHs 58.8% 78.8% 68.8% 62.5% 71.3% 68% Weekly consumption 1 cup 0.9 cups 1.2 cups 1.4 cups 1 cup 1.1 cups % produced 52.1% 38.2% 70.4% 66% 52.6% 55%
Palm Fruit Consuming HHs 100% 100% 100% 98.8% 97.5% 99.2% Weekly consumption 5.7 cans 4.2 cans 5.9 cans 6.3 cans 4.1 cans 5.2 cans % produced 84.3% 62.9% 84.8% 71.8% 87.5% 78.2%
Palm Oil Consuming HHs 81.3% 86.3% 70% 72.5% 60% 74% Weekly consumption 2.5 litres 1.2 litres 2.0 litres 1.5 litres 1.2 litres 1.5 litres % produced 65.2% 57.2% 72.3% 63.8% 71.2% 65.4%
Palm Soap Consuming HHs 98.8% 98.8% 98.8% 100% 96.5% 98.5% Weekly consumption 3.4 pieces 5.1 pieces 5 pieces 4.2 pieces 4.2 pieces 4.4 pieces % produced 18.9% 32% 20.3% 12.4% 24.6% 21.6%
Firewood Consuming HHs 100% 98.8% 100% 100% 98.8% 99.5% Weekly consumption 120 logs 93.7 logs 155 logs 162 logs 65.5 logs 118.9 logs % produced 93.4% 95.6% 93% 93% 94% 93.9%
Charcoal Consuming HHs 12.5% 2.5% 3.8% 12.5% 3.8% 7% Weekly consumption 2.3 cans 1 can 4 cans 3.5 cans 2.5 cans 2.8 cans % produced 20% 20% 33.3% 72.7% 0% 37.5%
Table 6.4 shows consumption data for the regional town centres in our zone of intervention, derived from 21 interviews of households in Soubre and Meagui. The proportion of households that consume the selected products as well as the average weekly consumption for those households which consume the product are shown. These numbers are compared to their analogs for the pooled village sample in Figure 6.1 and 6.2.
Table 6.4: Regional town consumption of selected products
Akpi Palm fruits Palm oil Palm soap Firewood Charcoal % HHs that consume
77.8% 100% 72.2% 77.8% 50% 66.7%
Avg. weekly consumption
0.5 cups 2.7 tomato cans
0.6 litres 2 pieces 27 logs 7.5 tomato cans
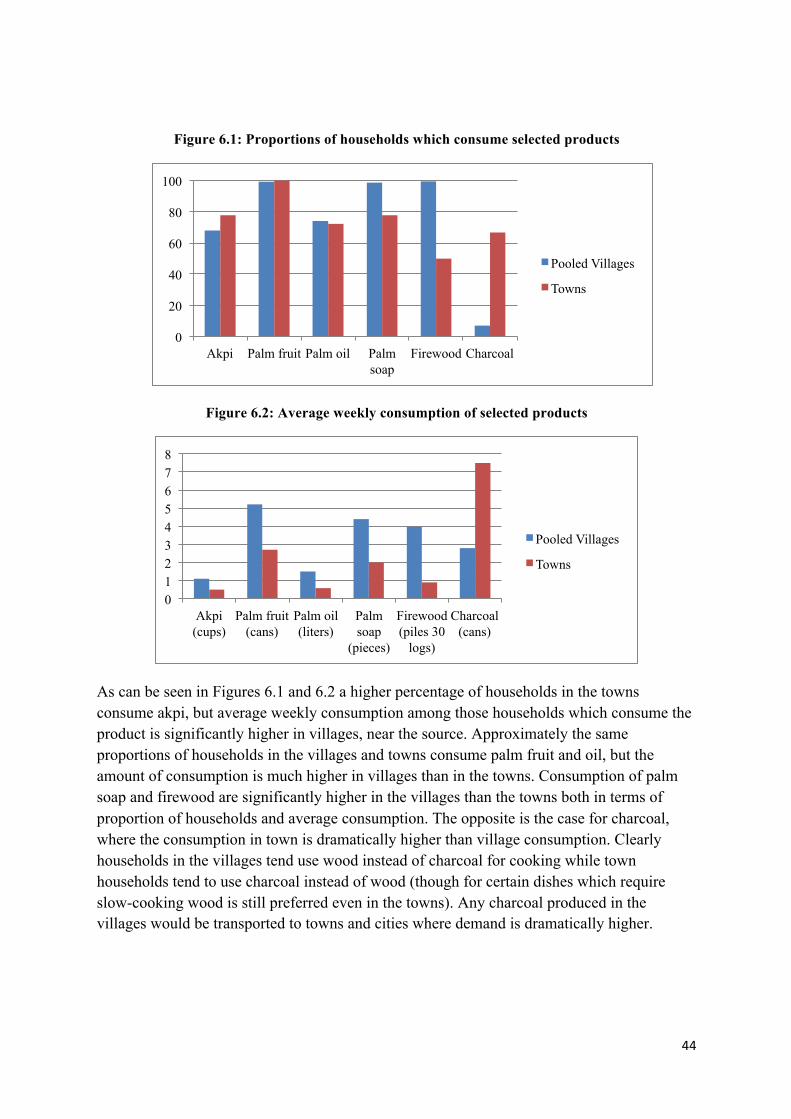
!!
44!!
0
20
40
60
80
100
Akpi Palm fruit Palm oil Palm soap
Firewood Charcoal
Pooled Villages
Towns
Figure 6.1: Proportions of households which consume selected products
Figure 6.2: Average weekly consumption of selected products
As can be seen in Figures 6.1 and 6.2 a higher percentage of households in the towns consume akpi, but average weekly consumption among those households which consume the product is significantly higher in villages, near the source. Approximately the same proportions of households in the villages and towns consume palm fruit and oil, but the amount of consumption is much higher in villages than in the towns. Consumption of palm soap and firewood are significantly higher in the villages than the towns both in terms of proportion of households and average consumption. The opposite is the case for charcoal, where the consumption in town is dramatically higher than village consumption. Clearly households in the villages tend use wood instead of charcoal for cooking while town households tend to use charcoal instead of wood (though for certain dishes which require slow-cooking wood is still preferred even in the towns). Any charcoal produced in the villages would be transported to towns and cities where demand is dramatically higher.
!
0 1 2 3 4 5 6 7 8
Akpi (cups)
Palm fruit (cans)
Palm oil (liters)
Palm soap
(pieces)
Firewood (piles 30
logs)
Charcoal (cans)
Pooled Villages
Towns

!!
45!!
Table 6.5: Village sales of selected products in 2012
Zone 1 Zone 2 Zone 3 Zone 4 Zone 5 Pooled Akpi
% HHs selling 13.8% 8.8% 10% 20% 7.5% 12% Avg. quantity sold
8 cups 12 cups 14.8 cups 35.4 cups 7.2 cups 19 cups
Industrial Palm % HHs selling 0% 0% 0% 1.3% 20% 4.3% Avg. quantity sold
-- -- -- 0.67 tons 9.3 tons 9.9 tons
Palm fruits % HHs selling 37.5% 35% 28.8% 22.5% 27.5% 30.3% Avg. quantity sold
10.9 tubs 57 tubs 17.9 tubs 24.6 tubs 8.3 tubs 24.4 tubs
Palm oil % HHs selling 10% 11.3% 2.5% 6.3% 30% 12% Avg. quantity sold
41.4 litres 32.5 litres 90 litres 76 litres 247 litres 144 litres
Palm soap % HHs selling 3.8% 2.5% 5% 5% 5% 4.3% Avg. quantity sold
123 pieces 250 pieces 715 pieces 4600 pieces
50 pieces 1248 pieces
Firewood % HHs selling 5% 1.3% 3.8% 0% 0% 2% Avg. quantity sold
1185 logs 200 logs 900 logs -- -- 988 logs
Charcoal % HHs selling 0% 1.3% 0% 3.8% 1.3% 1.3% Avg.quantity sold
-- 40 sacks -- 95 sacks 4 sacks 65.8 sacks
Table 6.5 above shows the percentage of households who reported selling the specified products in 2012 as well as the average quantity sold across the year among those who marketed the product. The data was also used in the generation of the total production numbers in Table 6.1. These results show that the proportion of households selling any of the given products was fairly low. The most commonly sold product, palm fruit, was still only marketed by 30% of households in the sample. Firewood and charcoal were the least commonly sold, with only 2% and 1.3% of households selling, respectively. There is some significant variation in sales by region. Notably, akpi sales are highest in zone 4, palm oil sales are much higher in zone 5 than all other regions, and palm soap sales are highest in zone 4. Because so few people in the sample reported selling charcoal or firewood the averages are not very meaningful, but it is interesting that firewood sales are highest in zone 1, and in general it seems that zones with firewood sales do not have charcoal sales and vice-versa.
6.2 Supply and demand estimation There has been no population census in Côte d’Ivoire since 1998, so reliable population figures are not available for an accurate estimation of demand and supply. If such data were available (as will be the case in the future) then demand and supply could be calculated by

!!
46!!
multiplying the household production by zone or ethnic group by the numbers of households in each of these categories. In the absence of such data, only approximate numbers can be given for the intervention zone as a whole, based on the population figures projected for 2012 as outlined in section 2.
In order to estimate supply and demand we use the overall number of agricultural producer households (83,800) and non-producer households (20,105) estimated in the former department of Soubre in 2012, as explained in section 2. For the 83,800 agricultural households the proportion of the total population found in each of the five zones is used to estimate the number of households in the zone. Population projection data compiled by ICRAF staff using 1998 census data suggested the following breakdown of the Department of Soubre by sub-prefecture: 23.3% in the sub-prefecture of Soubre (roughly Zone 3); 11.2% in Okrouyo (roughly Zone 5); 10.8% in Grand Zattry (roughly Zone 2); 33.7% in Meagui (roughly Zone 4); and 21% in Buyo (Zone 1). The breakdown of each zone into urban and rural population was not provided, so using these percentages as a representation of the percentage of the total rural population by zone is not entirely accurate, but it provides a decent approximate estimate.
By zone, the percentage of households producing each product is multiplied by the average annual production of the product by household (data found in Table 6.1 and 6.2) and by the relevant proportion of 83,800 for the zone. These are added together to get aggregate supply numbers for the entire region.
Demand for producer households is determined by each separate zone using the average weekly consumption multiplied by the percentage of households consuming the given product (found in Table 6.3), by the relevant proportion of 83,800, and also by the number of weeks of consumption. Two different numbers are used for this latter variable: in the first, it is assumed that demand is constant all year and so the 52 weeks are assumed for all products. In the second, it is assumed that households wish to consume less (25%) of the more perishable/seasonal products (akpi, palm fruit, palm oil) in the off-season, so the full consumption is only 20 weeks for akpi and 32 for palm fruit and oil, while the consumption is multiplied by 0.25 for the other weeks of the year. These calculations can be represented by the following formulas:
Village Demand 1: 83,800*pv*52*Cv
Village Demand 2: 83,800*pv*(wCv + 0.25(52-w)Cv)
Where pv is the percentage of village households that consume the product, Cv is the weekly consumption of the product, and w is the number of weeks that the product is in season during the year.
For the demand of non-producer households, the same calculation is done using the percentage of town households consuming the product and the average weekly consumption (from Table 6.4), multiplied by the 20,105 non-agricultural households and using the two different calculations for weeks as described above. This can be presented as:

!!
47!!
Town Demand 1: 20,105*pt*52*Ct
Town Demand 2: 20,105*pt *(wCt + 0.25(52-w)Ct)
Table 6.6: Calculated annual supply and demand comparison for the region, Method 2
Akpi Palm fruits Palm oil Palm soap Firewood Charcoal Industrial Palm**
Supply (Total production by Ag. HHs)
1,197,248 cups
14,757,453 cans
3,758,276 litres
6,872,205 pieces
526,478,321 logs
146,450 sacks
37,169 tons
Demand by Ag. HHs
3,343,017 cups
24,274,633 cans
5,717,159 litres 18,606,858
pieces 580,236,807
logs 178,387
sacks 49,500
tons Demand by Ag. HHs*
1,800,086 cups
17,272,335 cans
4,067,979 litres
Demand by Non-Ag. HHs
406,684 cups
2,822,742 cans
452,893 litres 1,626,736
pieces 14,113,710
logs 174,331
sacks 74,500
tons Demand by Non-Ag. HHs*
218,984 cups
2,008,489 cans
322,251 litres
Amount by which D>S in Region
2,552,453 cups
12,339,922 cans
2,411,776 litres 13,361,389
pieces 67,872,196
logs 206,268
sacks
12,331 tons
Amount by which D>S in Region*
821,822 cups
4,523,371 cans
631,954 litres
37,331 tons
Percentage by which D>S in Region
213% 83% 64%
194%
13%
141%
33%
Percentage by which* D>S in Region
69% 31% 17% 100%
* These categories with * assume that desired consumption in the off-season is ¼ that of the peak season. **Industrial palm demand and supply are calculated via different methods than the other products; see below.
Note that industrial palm demand and supply are calculated using a different method. Supply from small producers is doubled, since 50% of supplies come from the industrial plantation. The first demand estimate is the annual processing capacity of the SIPEF-CI Ottawa factory if supplied for the peak season from 15 January to 30 June (5 days a week, 10 hours a day, 45 tons/hr processing capacity). The second is the same demand augmented by 25,000 tons because SIPEF-CI hopes to increase processing at the Ottawa factory by this amount by 2014. Table 6.6 displays the results of these demand and supply calculations by product.
!

!!
48!!
Figure 6.3: Comparison of supply and demand for selected products
**Demand 2 is that estimated with desired consumption in the off-season ¼ that in the peak season.
The supply and demand comparison suggests for all the products analyzed here that demand significantly exceeds supply, both in the case where peak season consumption is assumed to represent desired consumption throughout the year and when it is assumed that off-season demand is ¼ that of the peak season. The gap between supply and demand is smallest for palm oil. In conclusion, because of unmet market demand, it would be profitable to increase production of any of the trees of interest (akpi, palm, of various species for fuelwood) but in the case of palm it would be most promising to assist with developing capacities to process palm soap and charcoal rather than sell only raw palm fruit and oil or firewood.
0
5
10
15
20
25
30
35
40
Akpi (cups)
Palm fruit (cans)
Palm oil (liters)
Palm soap (pieces)
Firewood (piles 30
logs)
Charcoal (cans)
Industrial palm (0.5
tons)
Uni
t in
Mill
ions
Supply
Total Demand 1
Total Demand 2**

!!
49!!
7: PRICES AND GROSS MARGIN ANALYSIS
This section explores prices in different areas throughout the region of intervention (and other relevant markets) and potential profits that can be earned by selling the selected products through the various market channels outlined in the value chain maps in section 5. In section 7.1 the different minimum (usually peak-season) and maximum (off-season) prices are presented for the selected products for the different zones in the producer survey, two regional towns, and two major cities. Section 7.2 calculates the approximate profits that could be earned via arbitrage from the villages in the intervention area to the town centres, calculated by taking the difference between the prices less transport costs (data collected during initial interviews). Section 7.3 goes even further and looks at all the production and marketing costs per unit for different actors (producers, processors and merchants) in the value chain of each product to calculate the gross margins earned at each stage of the different value chains.
7.1 Prices An examination of prices divided by zone (not shown here) found that, overall, prices in the different villages are approximately the same, though with a few exceptions. Raw palm fruit and palm oil are significantly cheaper in zone 5 because of the high quantity of these products available on the market there. Akpi prices are higher in zones 1 and 4 where consumption (and thus demand) is higher. Because there were few other significant differences in prices by zone those details are omitted here.
Table 7.1: Minimum and maximum prices for selected prices in different markets
Akpi F/cup
Palm fruit F/can
Palm oil F/litre
Palm soap F/piece
Firewood F/pile
Charcoal F/sack
Oranges F/ fruit
Pooled villages Min. price 304.7 230.4 584.5 142.3 389.3 3122 5.4 Max. Price 392.6 366.4 765 252.6 542.9 4129 -- Differential 28.8% 59% 30.9% 77.5% 39.5% 32.3% Pooled towns Min. price 322 155 1039 187 1841 6545 17.3 Max. Price 520 425 1217 199 1841 7454 30.9 Differential 61.5% 174.2% 17.1% 6.4% 0% 13.9% 78.6% Abidjan Min. price 357 600 700 83 1600 9000 33.3 Max. Price 600 800 1000 100 2667 11000 66.7 Differential 68.1% 33.3% 42.9% 20.5% 66.7% 22.2% 100.3% San Pedro Min. price 450 300 1200 150 1537 6000 20 Max. Price 600 500 1500 200 1537 6000 35 Differential 22.2% 66.7% 25% 33% 0% 0% 75%

!!
50!!
Table 7.1 shows the minimum and maximum prices, along with the calculated percentage price differential between the minimum and maximum prices, for the aggregated village data, for aggregated major towns in the study area, and for the markets of Abidjan and Soubre. As would be expected, for most products the minimum prices in Abidjan are higher than the minimum prices in the regional town centres, which are in turn higher than the minimum prices in the villages. The same is the case when you compare maximum prices across these areas.
There are several exceptions. First, palm soap is cheaper in both of the larger cities, especially Abidjan. This is because the city markets have a much larger number of competing industrial soap products, and in Abidjan in particular there are large numbers of manufacturers of artisanal palm soap, including a group of about 100 young men in the neighbourhood of Attécoubé in the north of Abidjan. Secondly, palm oil is cheaper in Abidjan than in the regional town centres, probably because this popular product is shipped from many different zones of the country into Abidjan and thus supply is consistently higher there. Finally, prices are lower for firewood and charcoal in San Pedro than in the regional towns. This is because of the concentration of sawmills in San Pedro which release excess wood onto the local market. As a result of this price differential a number of consumers in Meagui reported traveling to San Pedro to purchase firewood in bulk.
The differences between San Pedro and Abidjan prices are also interesting. In the case of akpi the minimum price and for palm oil both the minimum and maximum prices are higher in the San Pedro market, though for all other products the Abidjan prices are higher, as would be expected since Abidjan is further from production areas and serves a generally wealthier population. The higher price for palm oil in San Pedro suggests that it supplied in lower quantities to the San Pedro market than that of Abidjan. The same is the case for akpi during the peak season, though not during the off-season, during which time the product seems to be more scare in Abidjan. This is explained by the fact that Abidjan is the commercial capital, therefore a great deal of goods are directed towards it from many regions of the country, including areas with much higher akpi and palm production than the Soubre and San Pedro regions. Because of the higher prices in San Pedro, a merchant or producer group in our intervention zone should clearly choose to ship palm oil at all times and akpi during the peak season to San Pedro instead of Abidjan. However, the choice is not as clear-cut for the other products.
Table 7.1 also shows that, as would be expected, the perishable products—oranges and palm fruit—have the highest differential between minimum and maximum price (which for these products are equivalent to on- and off-season prices). In the vast majority of villages oranges cannot even be purchased off-season, which is why no maximum price is listed. There is also a sizeable seasonal price differential for akpi, especially in Abidjan and the regional towns. The differential is not as high in the villages because agricultural households most likely stock akpi for themselves for consumption in the off-season and/or they are simply unwilling to pay for akpi in the off-season. The differential is lower in San Pedro because the minimum akpi price is still fairly high, indicating a relatively low supply of akpi to that market compared to Soubre, Meagui and Abidjan. Again, this suggests that increasing akpi sales to

!!
51!!
San Pedro during the peak season could be lucrative. The seasonal price differentials for palm oil, soap, wood and charcoal are relatively lower because these products do not have dramatic seasonal variations in supply. The 67% differential indicated for firewood in Abidjan actually refers to the difference in price between high-quality hardwood and cheaper, more plentiful rubber wood that is gathered from old rubber plantations and shipped to markets.
7.2 Approximate arbitrage profits The price differentials observed between different markets in Table 7.1 begin to suggest the relative profitability of transporting goods from one area to another for sale, but the simple differential is not very informative without at least accounting for transport costs. Data from interviews of various market actors was used to determine approximate per-unit transport costs, between relevant villages and Soubre, and then from Soubre to markets in San Pedro or Abidjan. In every case a number of different conversions needed to be done in order to put transport cost and prices in terms of the same units, and this might be a source of error. A more rigorous study should be performed in the future to get a more accurate idea of transport costs and arbitrage profits, but this analysis provides an informative first glance.
In Table 7.2 it can be seen that selling akpi from villages in zone 5 to Soubre is profitable, even after accounting for transport costs, in both the peak and off season period, but is more profitable during the peak season. By contrast, it is actually not profitable to ship raw palm fruit to Soubre during the peak season (likely because of the high demand in the local market by oil palm processors), but it is highly profitable during the off-season.
Table 7.2: Transport costs, approximate profit for sale from village to town
Details on sale
Transport cost
Profit at min. price
% profit min. price
Profit at max. price
% profit max. price
Akpi Village of Bricolo (Z5) to Soubre
4.2 F/cup 67.1 F/cup 31% 25 F/cup 5.3%
Palm fruit Small Z5 village to Soubre
16.7 F/can -87.2F/can -41% 155 F/can 57%
Palm oil Okrouyo (Z5) to Soubre
28.25 F/litre
618 F/litre 159% 524 F/litre 75%
Palm soap Okrouyo (Z5) to Soubre
8.75 F/piece
67.2 F/piece 49.5% -12.1 F/piece
-5.9%
Firewood Villages in Z3 to Soubre
450 F/pile 974 F/pile 220% 775 F/pile 121%
Charcoal Villages in Z3 to Soubre
1000 F/sack
2159 F/sack 69.8% 2197 F/sack 53.2%
Oranges
Villages in Z3 to Soubre
1100 F/sack
4390 F/sack 174% Not available off season

!!
52!!
In the case of all the remaining products— palm oil, soap, firewood, charcoal and citrus— transport from villages to Soubre is more profitable during the peak season (or at minimum prices, which in the case of firewood and charcoal is not seasonal, but might correspond with periods of high supply of these products on the market for other reasons). In the case of palm soap it is actually not profitable to sell in towns during the off-season, because prices in the villages are higher. The most profitable arbitrage opportunity is for firewood, which is logical because there isn’t much demand in the villages, since producers tend to gather their own wood, but in towns there is a demand and prices are relatively high. Palm oil during the peak season has the second highest potential arbitrage profits between villages and towns.
Table 7.3 below shows the same type of calculations as those in Table 7.2 but deals with trade of goods from towns in our region of intervention to Abidjan, or to San Pedro in the cases where that market has higher prices than Abidjan. The table also includes an estimate of the relative profit margin earned when a palm producer in zone 5 sells their product to the SIPEF-CI factory instead of on the local market.
Table 7.3: Transport costs, approximate profits from town to city or village to factory
Details on sale Transport cost
Profit at min. price
% profit min. price
Profit at max. price
% profit max. price
Industrial Palm
Ottawa (Z5) to SIPEF-CI, compared to local sale in Z5
10,000 F to rent a 2.5 ton Kia; so 4 F per kg
8 F/kg 23% 27 F/kg 77%
Oranges Meagui to Abidjan, via Massa
1000 F/box, so about 10 F/kg or 1.7 F/orange
14.3 F/orange 83% 34.1
F/orange 110%
Akpi Soubre to Abidjan, truck rented by FENACOVICI
550,000 F for 25 ton truck, or 22 F per kg of product
258 F/kg 10% 618 F/kg 14.9%
Palm fruit 158 F/kg 29.3% 428 F/kg 84%
Wood Min price lower in Abidjan -30,220/load -55%
Charcoal 1905 F/sack 29% 2996 F/sack 40.2%
Palm oil Soubre to San Pedro, via Massa
2000 F/trip, or ~ 100 F/litre
61 F/litre 5.9% 183 F/litre 15%
Akpi Soubre to San Pedro, via Massa
2000 F/trip, or 67 F/kg 957 F/kg 37% 173 F/kg 4.2%
Palm soap Prices higher in towns than Abidjan and San Pedro
Information on transport costs used for these calculations was somewhat spotty, and they are most likely underestimated. For example, the FENACOVICI cooperative said that they paid 55,000 F to rent a 25-ton truck to transport various products from Soubre to Abidjan, and this

!!
53!!
was used to generate the 22 F per kg cost used in several calculations. However, this does not take into account fines on the road, maintenance costs, or gas. Also, converting product prices into kilograms for comparison was not always easy. In reality, to get good transport costs estimates to better calculate profit margins, a study focused on rigorous collection of transport cost data is needed in the future.
Given these caveats on the limits of the data, the results in Table 7.3 may still be generally informative if not completely accurate. Results show that in most cases, selling from the town to the city market is profitable, even when transportation costs are not taken into consideration. The two exceptions are palm soap, for which the prices are higher in the towns of Soubre than in the city markets, and firewood. Though maximum firewood prices in Abidjan are higher than in Soubre and Meagui, the cost of transport exceeds the price differential.
The most profitable products to transport from towns in the Soubre region to Abidjan are citrus fruit, especially in the off-season (if they can be acquired, which is difficult) and palm fruit, particularly during the off-season. For all products except for akpi sold to San Pedro selling from the towns to the cities is more profitable at the maximum or off-season price. Thus, any producer group or merchant who is just getting into the business of trading products from the towns of Soubre to larger cities would be better off starting during the off-season. However, in the case of akpi, traders should preference sell to San Pedro during the peak season instead of the off-season.
7.3 Gross margins for different actors in the value chain This section uses data collected during the qualitative interviews of various actors in the market chain to calculate gross profit margins at each level of the value chain of each product. Table 7.4 displays the results for producers of the products of interest, Table 7.5 shows the results for processors (small-scale, artisanal level and industrial operations in some cases), and Table 7.6 shows the results for merchants who trade in products produced or processed by others. Each column of data generally comes from an interview with a single actor (for internal consistency and because data was not collected rigorously enough to obtain clear averages), but was cross-checked and supplemented with information from 1-5 other actors of the same type.
These gross margin calculations were conducted to be as comparable as possible, but unfortunately this was very difficult and there are likely some underestimated and overestimated results. In all cases where own or unpaid labour was used the person-days required are noted in the chart (though only if they were explicitly stated; time spent in the market selling goods was not requested and is thus not included), but an attempt was not made to quantify the opportunity cost of this labour for inclusion in the gross margin calculation. Overall, since this was done for all products, this should not affect the comparison of margins across products and stages of the value chain.
However, in some cases, like that of the akpi producer and processor, the woman interviewed used paid labour for a large number of activities, including harvesting and processing, and

!!
54!!
since she provided the wage which she paid her hired labour this was included in the production costs. As a result, stated costs are higher and the gross margin lower for akpi in the table compared with other products, but this may not be accurate since labour costs are not accounted for in the case of those other products. Also, in the case of akpi merchants, total monthly costs for transport, rent of a place in the market, etc. were divided by akpi quantity sold to get per unit production costs. However, all akpi merchants also sold other products, like cassava, plantains, okra, tomatoes, etc. It was not feasible to collect data on all these products in order to determine what percentage of costs were accounted for by akpi. As a result, costs for akpi merchants are certainly overstated and gross margins are thus underestimated. Although these errors and inconsistencies are known to exist, it is difficult to correct them due to lack of easily comparable data. The choice was made to calculate gross margins separately for each product based on the data that was provided, but to remain aware of the limitations in comparability across products.
The results of this gross margin analysis suggest that within the akpi value chain the highest profits are made by bulk merchants who purchase akpi during the peak season, store the seeds, and sell them during the off-season. This results in profits of 137% (not shown in the chart, though easily calculated from the data in the chart). However, this requires capital so that bulk purchases can be made in the peak season. For merchants who cannot buy large quantities and store them, profits are much lower: only 18.4% during the peak season and 8.4% during the off-season. This explains why relatively few merchants sell in the off-season despite the high potential profits.
The value chain also yields sizeable profits for integrated producer-processors who sell with bulk merchants (45%), though when these processors must sell with individuals they earn much lower profits, only 5.5%. Fixed costs for the tools to process akpi are also relatively low (only 10,000 F) and currently no costs are paid for production of akpi trees since they are harvested wild. The major costs are labour for collection and processing, and transport to market.
With regard to raw palm fruit, the highest profits to be made in the chain seem to accrue to the producers themselves, whether they sell to the SIPEF-CI factory (733%) or the local market (499%). This suggests that most producers near the factory would prefer to sell to SIPEF-CI, but this is not always the case because payments are made one to two months later with factory sales, but in the local market cash is paid immediately. These profits are clearly much higher than those calculated for akpi, though this may be somewhat inaccurate, because unpaid labour costs are not all taken into account in this case. Also, a palm plantation requires an initial investment of about 201,500 F/ha, much more expensive than the fixed costs of akpi.
Merchants trading in raw palm kernels also make sizeable profits, but far lower than those estimated for producers. Gross margins are estimated at 57.9% during the peak season and 89.1% during the off-season. If it were possible to purchase during the peak season for sale during the off-season then profits would be 268%, but this is not possible because palm fruit spoil very quickly.

!!
55!!
With regard to palm oil, the highest profits by far are those made by integrated producer-processors. The estimates shown in the chart are 942% profits if the oil is sold in-season and 1503% if the oil is sold off-season. These very high profits may be overestimated because production costs do not account for unpaid labour (and oil palm processing can be highly labour-intensive, especially if one does not have a press and must crush the palm fruit with a mortar and pestle) and may also omit other costs. Also, owning a palm plantation requires an investment (previously stated at 201,500 F/ha) and an investment of between 50,000 and 65,000 F is also needed for processing equipment. However, despite these caveats this is clearly a highly profitable activity.
After the integrated producer-processors, the highest profits are to be made by processors who acquire raw fruit during the peak season, store the oil, and sell during the off-season period; they can earn gross margins of 77.5% (not shown in chart). Similarly, bulk merchants who can buy oil during the peak season for sale in the off-season can earn gross margins of 52.4% (also not shown in chart). By contrast, processers and merchants without the capacity to stock oil from the peak-season for sale off-season earn much lower profits: for processors, 29.6% in-season and 20.5% off-season, and for merchants 22% in-season and 11.6% off-season.
With regard to palm soap, processors earn significantly higher profits than bulk merchants. Soap processors can earn gross margins of 327% when they purchase palm oil supplies at peak season and sell with bulk merchants who come to their village, while they earn 255% if they purchase off-season and sell with individuals in the same village. Though not shown in the chart, it is also possible for processors to purchase oil palm in-season and sell soap with individuals, in which case they would earn profits of 412%. It is just more difficult for a processor to find a large number of individual buyers with whom to sell, and they tend to sell through bulk merchants to facilitate marketing. The bulk merchants themselves who buy large quantities of palm soap in the villages for transport and sale in Soubre or other towns earn gross margins of about 79% year-round. Many people still prefer to trade in palm soap without processing it, however, because processing requires an initial investment of about 250,000 F in tools and it is very labour-intensive and dangerous (because of risks of burning by the caustic soda ash which is the second most important material after palm oil).
The estimated gross margins for various species and products of wood suggest that the highest profits are to be earned by charcoal processors, followed by (illegally operating) small-scale timber harvesters who make boards. Charcoal processors reported gross margins of 327% when they sold with bulk merchants and 255% when they sold with individuals in their villages. However, charcoal processing requires an investment of about 150,000 F a furnace and in some cases 300,000 F for a chainsaw. Some charcoal processors do not cut their own wood, however, instead acquiring it from private (illegal) woodcutters or sawmills (who provide them with scraps) and paying them in-kind by giving them a share of the produced charcoal.

!!
56!!
Table 7.4: Gross profit margins for producers of selected products
Akpi Producer, Processor (CFA/kg)
Palm Producer, Sells in Raw Form (CFA/kg bunches)
Palm Producer, Sells in Oil Form (CFA/litre)
Village Frake, Framire Plantation
Orange Producer (CFA/orange)
Fixed Cost/Initial Investment
10,000 F processing tools; 12 ha cocoa owned
by husband
210,500 F/ha to establish plantation, from own nursery
64,000 F processing tools; 3.5 ha of palm
37,500 F/ha planting costs, 500 trees/ha, 18,750 nursery
costs
Free, gather seeds from neighbours and plant.
Hours own or unpaid labour (not included in costs) 10 person-days 5 person-days 15 person-days Time to gather seeds (5-10
person-days?)
15-20 person-days (also 10 person-days weeding
is paid)
Total Production 500 kg processed seeds/season 90 tons bunches/year; 8 ha palm 90 barrels (of 200 litres
oil each) per year 500 trees after 25 years 10 trees on 4.5 ha cocoa plantation, produce 800
kg/yr
Preferred Marketing Channel
Regular bulk town buyer with whom have
relationship
SIPEF-CI factory; alternative = local female merchants, oil
processors
Large soap maker in Soubre. 1 = in season, 2 =
off season
Legally-certified timber company. Alternative:
small-scale, illegal woodcutters
In village. Alternative: In Buyo, bring by
bicycle.
Production Costs 210 4.1 7.4 47,500/ha/year 3.13
Processing, Marketing Costs 169 3.1* 23.8 none (woodcutter pays
transport, harvest costs) none, except transport
time
Total Variable Costs 379 7.2 31.2 2488 F/tree/full 25 years 3.13 Selling Price- Preferred Channel 550 60.0 325 12,000 F/tree 16.7 (off season)
Selling Price- Alternative Channel 400 40.0 500 3500 F/tree 4.2 (in season)
Gross margin- Preferred Channel 171 52.8 293.8 9,518 F/tree 13.6 (off season)
Gross margin- Alternative Channel 21 35.9 468.8 2012 F/tree 1.1 (in season)
GM 1 as % of costs 45% 733% 942% 383% 435% GM 2 as % of costs 5.5% 499% 1503% 81.4% 35% *Marketing costs for the second producer entail transport to the SIPEF-CI factory, so they are only paid when selling to the preferred channel and not the alternative channel.

!!
57!!
Table 7.5: Gross profit margins for processors of selected products
Artisanal Palm Oil Processor (CFA/litre)
Palm Soap Processor (CFA/medium piece)
Charcoal Processor
(CFA/sack)
Industrial Sawmill (CFA/board*)
Local (Illegal) Board Maker (CFA/board*)
Industrial Juice Processor (CFA/litre)
Fixed Cost/Initial Investment
50,500 F processing tools
250,000 F processing tools
150,000 F furnace
construction
5 billion F initial investment; 300,000 ha of
concessions
300,000 F chainsaw; 15,000 F if chain
breaks
50 million F minimum investment (FIRCA)
Hours own or unpaid labour (not included in costs)
120 person-days per year (6 person-days per
batch)
Selling done by 7 family members, but no regular
hours Not stated n/a 5 person-days per week Not stated
Marketing Channel(s)
Individuals in village markets.
1= in season, 2 = off season
Purchase: On and off season. Sales: 1= bulk
merchants 2= individual consumers
Charcoal merchants. 1=Framire, 2=Frake or
Iroko
90% are exports to large companies in Europe,
Middle East
Individuals come to village to purchase boards directly, and they pay transport
Purchase: On and off season. Sales: 1= Direct
retailers; 2 = Depots
Cost raw material, market 1 400 21.2 196 Frake: 56.3; Iroko or Framire: 68.34
Frake or Framire: 111 15.4
Cost raw material, market 2 600 38.5 784 Iroko: 455 30.8 Processing, Marketing Costs 22.5 17.9 731 Frake: 5164; Framire:
7389; Iroko: 10,371 436 46.3
Total Variable Costs, market 1 422.5 39.1 927 Frake: 5220; Framire:
7457; Iroko: 10,439
Frake or Framire: 547 61.7
Total Variable Costs, market 2 622.5 56.4 1515 Iroko: 891 77.1
Selling Price, market 1 625 167 4000 Frake: 5507; Framire: 7867; Iroko: 11,013
Frake or Framire: 1500 250
Selling Price, market 2 750 200 6000 Iroko: 3000 208
Gross margin, market 1 125 127.9 3073 Frake: 287; Framire: 410; Iroko: 574
Frake or Framire: 953 188
Gross margin, market 2 127.5 143.6 4485 Iroko: 2109 131 GM 1 as % of costs 29.6% 327.1% 331.5%
All boards: 5.5% Frake/Framire: 174.5% 304.7%
GM 2 as % of costs 20.5% 254.6% 296% Iroko: 236.7% 169.9% *Here board is defined as a 4 m X 30 cm X 2 cm piece of wood, or 0.024 cubic metres
!

!!
58!!
Table 7.6: Gross Profit Margins for Merchants of Selected Products
Akpi (CFA/can)
Palm Oil (CFA/litre)
Palm Soap (CFA/med.
piece)
Palm Fruit (CFA/can)
Charcoal (CFA/sack)
Firewood (CFA/log)
Boards (CFA/board)
Oranges (CFA/fruit)
Fixed Cost/Initial Investment 100,000 F to construct store none none none none 125,000 F to
construct store 166,000 F to
construct store none
Market channel(s) Bulk merchants in Lakota
Individual consumers in
Soubre
Individual consumers in Soubre
Individual consumers in Soubre
Individual consumers in
Soubre
Individual consumers in
Soubre
Market 1= individuals; 2 =
enterprises
Individual consumers in
Soubre Cost Raw material, in season 1500 500 83.3 75 3500
67 Frake: 1680;
Framire: 1800; Iroko: 3840
7
Cost Raw material, off season 4000 800 same 165 4000 25
Other Marketing Costs, in season* 612 320 9.95 20 1108 70.8 688
3.3 Other Marketing Costs, off season* 612 320 same 20 1108 3.3 Total Variable Costs, in season 2112 820 93.3 95 4608
137.8 Frake: 2368;
Framire: 2488; Iroko: 4528
10.3
Total Variable Costs, off season 4612 1120 same 185 5108 28.3
Selling Price, in season/market 1 2500 1000 166.7 150 6000
250
Frake: 4500; Framire: 2000;
Iroko: 7000 14
Selling Price, off season/market 2 5000 1250 same 350 6500 Frake: 3500;
Framire: 1800; Iroko: 6800
50
Gross margin, in season/market 1 388 180 73.4 55 1392
112.2
Frake: 2132; Framire: -488;
Iroko: 2472 3.7
Gross margin, off season/ market 2 388 130 same 165 1392 Frake: 1132;
Framire: -688; Iroko: 2272
36
GM 1 as % of costs 18.4% 22% 78.7% 57.9% 30.2%
296.8%
Frake: 90%, Framire: -19.6%
Iroko: 54.6% 35.9%
GM 2 as % of costs 8.4% 11.6% same 89.1% 27.3% Frake: 47.8%,
Framire:-27.7%, Iroko: 50.2%
127.2%
*To determine these costs, total transport, taxes, rent, etc. are divided by the units of the selected product sold. However, where the merchant sells other products as well (true for all but charcoal, firewood, and board sellers) this overestimates the per-unit costs for the selected products and underestimates the gross margin.

!
!
59!
!
Small-scale, illegal board processors had estimated gross margins of 174.5% for frake and framire and 237% for iroko, though they face high fixed costs, high labour requirements, and the risk of fines. In contrast, industrial timber processing factories reported net profit of only 5.5-6% on board sales (mostly exports). However, this is not directly comparable to the other gross margins because it completely accounts for all costs incurred. But it is nonetheless true that small-scale, illegal processing operations are more profitable than industrial sawmills, because they do not face the same regulator constraints and high overhead costs. This is part of the reason why many sawmills have gone out of business, and representatives of those companies with which I spoke said that their profits are dropping and the future of their businesses are unclear.
In contrast to individual charcoal and board processors, merchants in the timber and fuelwood markets who do not do any processing earn much lower (though still substantial) profits, but their fixed costs are lower. Firewood merchants also earn high gross margins, at about 297%. This is higher than that earned by charcoal merchants, with gross margins of 58% when supplies are high and 89% when supplies are low. Gross margins for board sellers in Soubre were calculated at 90% for frake, -19.6% for framire, and 54.6% for iroko if sold to individuals, and somewhat lower if sold in bulk to large enterprises. One charcoal processor also reported that frake and iroko charcoal can be sold for 6000 F/sack while framire charcoal can only be sold for 4000 F/sack. This suggests that of the three targeted timber species, framire is certainly the least profitable, while the relative profitability of iroko and frake is less clear. Iroko earns a higher price on the market and is more profitable for an illegal board maker but less profitable for a legal board merchant because it is costly and difficult to acquire via legal means. This, in combination with the fact that frake only takes 25 years to develop to maturity, versus 50 years for iroko, suggests that frake is probably a more profitable, less risky specifies to promote among farmers in the near future.
It was difficult to find small-scale timber plantations or cocoa farmers who exploited a substantial number of the timber species scattered throughout their land. In the end, in order to estimate gross margins for producers, data from a village frake and framire plantation which has not yet made any sales (reportedly because they cannot find a buyer) was combined with the stated purchase price of an illegal woodcutter and the average compensation per tree offered by legal timber companies as estimated in the quantitative survey. Using these data, gross margins were determined to be 81% if sold to the illegal, individual woodcutter and 383% if sold to a legal timber company.
Despite this large difference, a producer might still choose to deal with the individual woodcutter because transaction costs (not estimated here) are much lower; in the case of the legal timber societies one cannot easily call up the harvester to come collect their trees, they must wait until the society chooses to harvest in their area, and then compensation is not guaranteed. These estimates also fail to properly account for the fact that costs will be incurred over a 25-year time horizon only at the end of which the farmer will receive the pay-off. To!account for this the price paid for maintenance per year and the future expected price per tree should be discounted, but this was not done due to time constraints.
Finally, looking at the gross margin estimates for oranges shows that producers can earn 35% during the peak season and 435% during the off-season, though producing for sale in the off-season is next to impossible, unless major investments are made in improved varieties and irrigation. Bulk orange merchants earn 36% during the peak season and 127% in the off-season. This latter option is

!
!
60!
!
also very difficult but not impossible; it would require high investment in transport to collect small quantities of oranges from many different areas and perhaps even imported oranges shipped through Abidjan.
The highest profits in the citrus industry by far are to be made by industrial juice processors, who can earn 305% through sales to retail shops in Abidjan and 170% to beverage depots. Note that both of these numbers entail purchase of the raw fruit in the off-season, and so the margins would be even higher during the peak season. It is currently impossible to speculate on how the gross margins would change if the juice factory were located in Soubre or another town in the intervention zone. Costs of machine maintenance and packing might increase, but raw material costs would decrease and it would likely be possible to sell the final product for a higher price, so the net effect on profits is unclear. In the future it would be very interesting and useful to conduct a formal assessment of the business prospects for such an enterprise. Another issue to consider is that the estimated minimum investment needed to set up a juice factory is 50 million F. Smaller, artisanal juice processing is also possible, but advanced machinery is required to achieve the 6-month shelf-life which makes this product highly profitable.
Overall, this gross margin analysis shows that in all cases except that of firewood, raw material costs are far outweighed by transport and other marketing costs. Also, those products which have high fixed costs tend to have higher variable gross margins. Finally, if one were to rank the products based on these calculated gross margins, the most profitable seem to be: palm oil, raw palm fruit, charcoal, firewood, palm soap, and illegally processed boards.

!
!
61!
!
8: COMPARISON OF MARKETING ADVANTAGES AND CONSTRAINTS
This section provides a more qualitative exploration of the marketing advantages and constraints of each product of interest. In addition to introducing some new data, results from the preceding quantitative sections are also summarized. Section 8.1 discusses a few additional results from the quantitative producer survey on how the selected products were sold, why that channel was chosen, why others did not sell the given products, and reported marketing difficulties among those who did sell. In section 8.2 Porter’s Five Forces and SWOT analysis are used to examine the marketing prospects of the products of interest.
8.1 Marketing opportunities and difficulties Table 8.1 below shows the proportion of households (among those who sold the relevant products) that sold through different marketing channels. For all products except for palm oil (and of course industrial palm) the dominant marketing channel was the local market, directly with consumers. In the case of palm oil 52% of sales were made to itinerant merchants who came to the village to purchase in bulk. Over half of charcoal purchases were also made outside the village, either with itinerant merchants or in towns with merchants or directly to customers. Palm soap was sold only in local markets by the highest portion of sellers compared to other products. This matches expectations based on the relative profitability of village versus town markets for these different products. The vast majority of industrial palm sales were to the SIPEF-CI factory, though 6% of sellers reported selling with itinerant merchants on the local market (which means that they cheated on their agreement to sell all their production to SIPEF-CI, if they had one).
Table 8.1: How are selected products sold?
Local market, directly to consumers
With merchants who come to village
In towns, directly to consumers
In towns, to merchants
To large factory/buyer
Akpi 45.3% 26.4% 9.4% 15.1% --
Industrial palm
-- 5.9% -- -- 94.1%
Palm fruits 51.5% 19.7% 6.1% 18.2% 0.8%
Palm oil 42.6% 51.9% -- 5.6% --
Palm soap 77.8% 5.6% 5.6% 5.6% --
Firewood 50% 37.5% 12.5% -- --
Charcoal 42.9% 14.3% 14.3% 14.3% --
*Note: These percentages are calculated just among those producers who sell the given product

!
!
62!
!
In the survey, those who sold the various products were also asked to explain why they chose the market channel(s) through which they sold, as well as if they themselves paid transport costs to the point of sale. Results show that households tended to choose their akpi buyers based on who would pay cash immediately, though offering the highest price and proximity were also important reasons. Sellers of industrial palm chose their buyers because of proximity, high price, and because many saw SIPEF-CI as the only buyer or had a contract with them. About 6% of respondents said they sold through a palm cooperative for producer solidarity. Raw palm fruit was sold to the closest market. Palm soap and charcoal were sold primarily to the closest market, while firewood buyers were chosen on the basis of who would pay cash. Interestingly, a small number of sellers of palm fruit and oil also said that they sold to buyers with whom they had a contract.
Regarding transport costs, in the majority of cases the producers themselves did not pay, except in the case of industrial palm, where 65% of sellers said that they covered transport costs, and the remainder was sold through one of the two transport cooperatives (because SIPEF-CI never pays transport costs). A fairly substantial proportion, 47%, of palm soap producers also said that they paid for transport costs, indicating that there are fewer itinerant buyers who come to villages looking for these products, but that the price differential between the village and final point of sale is big enough to motivate the producers to pay for transport.
Table 8.2: How is the buyer or market chosen, and who pays transport to point of sale?
% households citing given reason for sale on the chosen market Producer pays
transport Closest market
Highest price
Only buyer
Immediate cash Contract Producer
solidarity Akpi 21.8% 21.8% 18.2% 32.7% -- -- 21% Indust. palm 47.1% 17.6% 11.8% 5.9% 11.8% 5.9% 64.7% Palm fruits 39.4% 9.2% 18.3% 26.8% 2.1% -- 7.4%
Palm oil 34% 32.1% 13.2% 11.3% 1.9% -- 8.7% Palm soap 23.5% 47% 17.7% 11.8% -- -- 47%
Firewood 28.6% -- 14.3% 42.9% -- -- 0%
Charcoal 44.4% 33.3% -- 22.2% -- -- 16.7%
Table 8.3 below shows the reported reasons why those surveyed who did not sell the given products chose not to engage in sales. This is very important because it illustrates the major barriers to expanded marketing. In many cases the primary reason why a product was not sold was inadequate production volume of the raw product. Industrial palm and firewood are the two exceptions. The vast majority of producers (93.5%) in the survey did not sell industrial palm because they were too far away from the factory. Among those producers in the factory zone the two reasons given for not selling were inadequate production quantity and quality (58% and 35%). For firewood the main reason for not selling was that the household preferred to consume the wood for their own needs, though inadequate production was not far behind in the rankings.
Preferring to consume the product among the household was the second most common reason for failing to sell for most remaining products, except for charcoal, for which the fact that processing required too much time or money and not knowing how to process charcoal were commonly cited

!
!
63!
!
responses. A fair percentage of those surveyed also mentioned lack of knowledge about how to process as a constraint for selling palm oil and soap, and several also chose this reason for akpi. The time and money needed for processing was also mentioned as a constraint by between 8% and 12% of respondents for akpi, palm oil, palm soap, and firewood. Another significant reason cited for not selling firewood was the lack of buyers, since most households gather their own firewood and do not need to purchase it.
Table 8.3: Reasons for not selling the selected products
Not enough production
Prefer to consume
Not enough buyers
Too much work
Don’t know how to process
Don’t meet standards
Not near factory
Akpi 62.5% 17% -- 8% 13% -- Industrial palm
4% (58% near factory)
-- -- -- -- 2% (35% in factory zone)
93.5%
Palm fruits 46.5% 38.3% -- 2.8% -- -- -- Palm oil 56.3% 28.5% -- 10% 7.8% -- -- Palm soap 47.8% 20.3% -- 11.8% 26.3% -- -- Firewood 43% 49% 25.8% 7.5% -- -- -- Charcoal 31% -- 10.8% 29.3% 26% - --
Those households which did sell the selected products were asked if they had experienced any marketing difficulties. The results, displayed in Table 8.4, show that for all products except charcoal, the majority of respondents did not experience any difficulties. This does not mean that there are no barriers or difficulties in these markets, of course, but more likely that those who chose to sell did so because they did not face any difficulties (while those who did face difficulties stayed out of the market). The cases when sellers did report difficulties are thus very significant, even if they are in the minority.
Table 8.4: Marketing difficulties identified by sellers of selected products
None Low demand, high competition
Low prices
Transport, checkpoints expensive
Seasonality, spoilage
Unfavourable laws
Akpi 84% 6% 8% 2% -- -- Industrial palm
94.1% -- -- 5.9% -- --
Palm fruits 70.7% 13.6% 10.5% 1.5% 3% -- Palm oil 91.8% 4% -- 4% -- -- Palm soap 82.4% 5.9% 11.8% -- -- Firewood 57.1% 42.9% -- -- -- -- Charcoal 42.9% 14.3% -- -- -- 42.9%
The highest number of reported difficulties was among sellers of charcoal, 43% of whom said that unfavourable laws (required permits, checkpoints, tree ownership laws) made marketing difficult, and 14% of whom reported law demand as a major problem. The second highest level of difficulty was reported among sellers of palm fruits, primarily because of high competition, low prices,

!
!
64!
!
seasonality and spoilage, and some transport problems. Some akpi sellers also had difficulties because of low local demand and prices. Transport expenses (including bribes demanded at checkpoints) were reported as problems among a few sellers of akpi, industrial palm, palm oil and palm soap. The only reason that transport was not also reported as a difficulty for firewood and charcoal is that almost no sellers engaged in transport of these products themselves.
8.2 Porter’s Five Forces and SWOT Analysis This and the following sections will review the marketing opportunities and difficulties for the value chains of each separate product. This will be done using Porter’s Five Forces Model and a SWOT analysis chart. The combined information from the SWOT and Porter’s Five Forces analyses, along with the quantitative data already presented, will then be used (in section 9) to make conclusions about the different product value chains and to provide recommendations on the best ways to support their future development.
Porter’s Five Forces Model (Porter 2008) focuses on five forces that affect business competition and uses them to assess the competitive prospects of actors at each stage of the relevant value chain. These forces are: 1) rivalry among existing competitors, 2) threat of entry, 3) power of suppliers, 4) power of buyers, and 5) threat of substitutes. Looking at the stages of the relevant value chains through the lens of this model provides another method, in addition to the gross margin analysis, for determining the relative market power and profit-making potential at each level of the different value chains.
After Porter’s Five Forces are used to analyze the relative profitability prospects of the different stages in each value chain, SWOT analysis will be used to review other important elements of the value chain as a whole. SWOT analysis enumerates the strengths, weaknesses, opportunities and threats facing a business or value chain. Strengths refer to helpful characteristic and weaknesses to harmful characteristics which are internal to the business or value chain. Opportunities and threats are, by contrast, helpful and harmful elements of the external environment which may affect the business or value chain.
8.2.1 Akpi market Table 8.5 shows the Porter’s Five Forces analysis for akpi and Table 8.6 shows the SWOT analysis. Overall, these tables suggest that producer-processors have more power in the value chain than merchants because of the rarity of trees and higher entry barriers. This means that developing the value chain would benefit producer households first, and primarily female members, since women dominate all stages of the chain. Also, akpi is highly valued among certain ethnic groups such that most of the households who consume the product consider that there are no substitutes. Locally the value chain faces a situation where supplies are fairly low and decreasing while demand is strong and growing and the potential for exports is also on the rise. Thus investing in expansion of akpi production at this time could lead to major payoffs.
Though there are weaknesses in the akpi value chain which primarily revolve around difficulties of domestication, the list of opportunities shows that these weaknesses could be overcome if resources were devoted to applied research and extension efforts to domesticate akpi, as has been done in Cameroon. The threats facing the development of the chain are not substantial and are unlikely to be a problem if adequate resources are devoted to developing akpi propagation and planting methods, then spreading these technologies to women in cocoa farming communities.
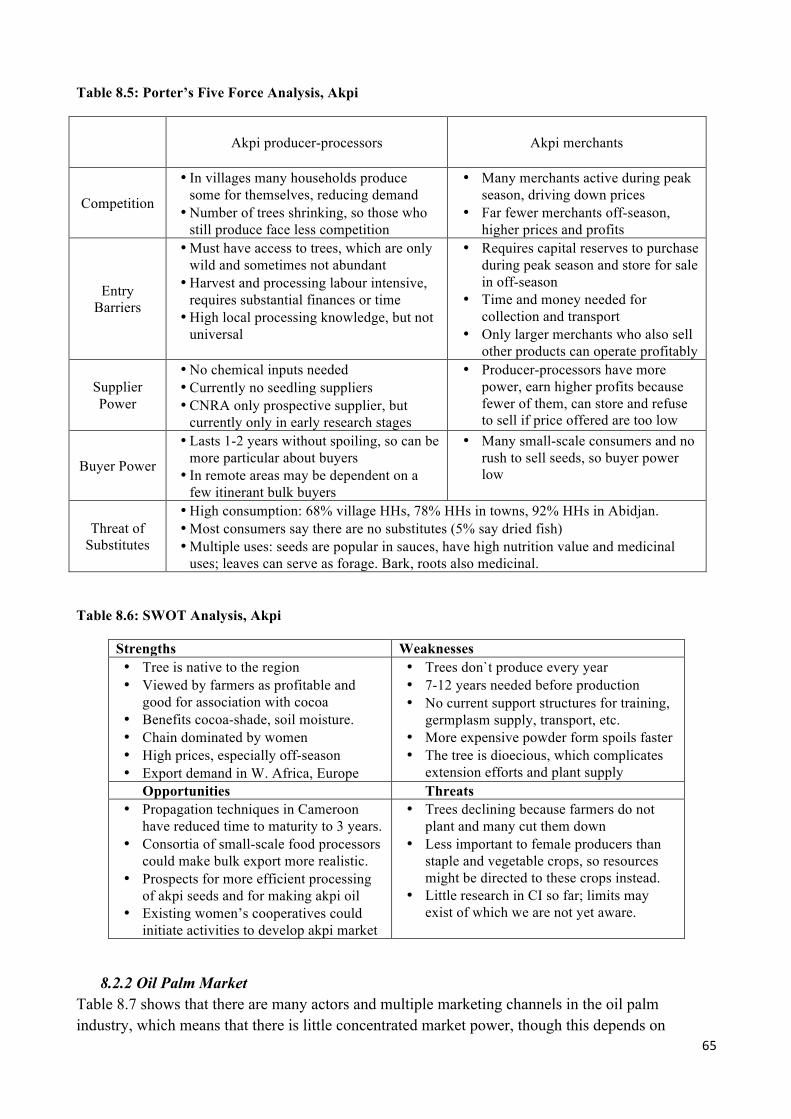
!
!
65!
!
Table 8.5: Porter’s Five Force Analysis, Akpi
Akpi producer-processors
Akpi merchants
Competition
• In villages many households produce some for themselves, reducing demand
• Number of trees shrinking, so those who still produce face less competition
• Many merchants active during peak season, driving down prices
• Far fewer merchants off-season, higher prices and profits
Entry Barriers
• Must have access to trees, which are only wild and sometimes not abundant
• Harvest and processing labour intensive, requires substantial finances or time
• High local processing knowledge, but not universal
• Requires capital reserves to purchase during peak season and store for sale in off-season
• Time and money needed for collection and transport
• Only larger merchants who also sell other products can operate profitably
Supplier Power
• No chemical inputs needed • Currently no seedling suppliers • CNRA only prospective supplier, but
currently only in early research stages
• Producer-processors have more power, earn higher profits because fewer of them, can store and refuse to sell if price offered are too low
Buyer Power
• Lasts 1-2 years without spoiling, so can be more particular about buyers
• In remote areas may be dependent on a few itinerant bulk buyers
• Many small-scale consumers and no rush to sell seeds, so buyer power low
Threat of Substitutes
• High consumption: 68% village HHs, 78% HHs in towns, 92% HHs in Abidjan. • Most consumers say there are no substitutes (5% say dried fish) • Multiple uses: seeds are popular in sauces, have high nutrition value and medicinal
uses; leaves can serve as forage. Bark, roots also medicinal.
Table 8.6: SWOT Analysis, Akpi
Strengths Weaknesses • Tree is native to the region • Viewed by farmers as profitable and
good for association with cocoa • Benefits cocoa-shade, soil moisture. • Chain dominated by women • High prices, especially off-season • Export demand in W. Africa, Europe
• Trees don`t produce every year • 7-12 years needed before production • No current support structures for training,
germplasm supply, transport, etc. • More expensive powder form spoils faster • The tree is dioecious, which complicates
extension efforts and plant supply Opportunities Threats
• Propagation techniques in Cameroon have reduced time to maturity to 3 years.
• Consortia of small-scale food processors could make bulk export more realistic.
• Prospects for more efficient processing of akpi seeds and for making akpi oil
• Existing women’s cooperatives could initiate activities to develop akpi market
• Trees declining because farmers do not plant and many cut them down
• Less important to female producers than staple and vegetable crops, so resources might be directed to these crops instead.
• Little research in CI so far; limits may exist of which we are not yet aware.
8.2.2 Oil Palm Market Table 8.7 shows that there are many actors and multiple marketing channels in the oil palm industry, which means that there is little concentrated market power, though this depends on

!
!
66!
!
geographic location. SIPEF-CI is the only industrial factory in the Soubre region, and several producers only produce the industrial variety of palm and might even have a contract to sell directly to SIPEF-CI (either directly or through their cooperative), so their marketing options are limited. However, the pull of the vibrant local market, with many bulk merchants, oil palm processors and soap makers, has led a large number of these producers to sell to both markets.
However, one downside to this situation is that the COOPALM and COOPAGRIS cooperatives, which are the primary suppliers of inputs and services to palm producers in the factory areas, earn lower revenues when their members choose to sell their palm on the local market instead of to SIPEF-CI through the cooperative. That is, these two significant advantages/opportunities in the palm market are mutually exclusive under the current system. This trade-off does not exist in the zones away from the factory, but there are also not the same beneficial support structures and multiple markets, and in remote areas producers have little power and can be forced to sell their perishable seeds to bulk merchants at low prices.
One other issue revealed in Table 8.7 is that in the local market there are far more potential substitute products for oil palm products, but at the industrial level there are not many substitutes and demand is strong and increasing.
Table 8.7: Porter’s Five Forces Analysis, Oil Palm Products
Palm producers Local palm fruit merchants
Local oil and soap processors, merchants
Industrial primary oil
processors (SIPEF-CI)
Competition
• Village demand low relative to supply
• Many small-scale producers
• Producer cooperatives in the factory areas = coordination not competition
• High number of merchants, especially in peak season
• Fewer households make own soap and oil
• Many processors in zone 5, fewer elsewhere
• SIPEF-CI is only factory in Soubre area • 15 large and 30 small-scale
processors in the country • Demand high, so no problem
w/ competition
Entry Barriers
• No barriers for small-scale producers with only wild trees
• Plantation costs about 210,500 F/ha *land is limited
• Means needed for rapid transport to avoid spoilage losses
• Capital investment needed for tools
• Processing requires expensive machines or a lot of labour + much wood and water
• Processing is dangerous
• Must be located in production areas, but land is limited • High capital costs for
factory, machinery, industrial plantation
Supplier Power
• CNRA is only supplier of certified seeds
• 2 coops are main source of inputs for zone 5 producers
• No established suppliers outside zone 5
• Producers earn higher profits than merchants, but neither have substantial market power
• Transport of fruits more expensive than oil, soap
• AIPH sets prices • 50% of supplies come from
smallholders and this share is expected to increase b/c of limits on plantations
Buyer • Gross margins, • Fruits spoil • Because oil lasts • There are relatively fewer

!
!
67!
!
Power especially for integrated producer-processors, higher than for any other product
• Multiple buying channels (though less in remote areas)
• Some have exclusive SIPEF-CI contracts
• Fruit spoils quickly, must be sold even at low prices
quickly, must be sold even at low prices • Many small-scale buyers and sellers, close to perfect competition
one year and soap indefinitely, can store and sell at best prices
• Multiple marketing channels, including bulk merchants and consumers
secondary oil processing companies (3 large, 5 small) • Negotiations occur within the
context of AIPH • Wilmar group (partner with
PALM-CI) controls 40% of world palm oil market
Threat of Substitutes
• Multiple uses of palm fruit: in sauces, for local oil and soap making, for industrial sale (local Dinor oil and export), palm wine
• Differentiated product- wild “African” variety earns more on the local market, SODEPALM variety demanded by factories, some local oil processors
• Many substitutes cited for local consumers. For palm fruit: peanuts, okra, eggplants, potato leaves. For red palm oil: tomato paste, refined oil. For palm soap: other soaps, detergents from stores.
• Oil factories and local processors can use no substitute products • Local merchants can switch easily switch to selling other products • Soap makers can use coconut as a substitute • Palm oil = 40% of worldwide oil market and share is growing because of increased demand in
Asia; next closest competitor is soybean oil = 22% of market
The SWOT analysis for oil palm suggests that strengths and opportunities far outweigh weaknesses and threats. With further research, training in best practices, and expansion of inputs, yields could be increased, and oil palm can be grown either on separate plantations or as barriers in cocoa fields (thus avoiding competition with cocoa trees and also protecting the fields from CSSV). The major threat in this scenario is that increased production will not be profitable to farmers if it leads to an oversupply of perishable seeds on the market. The key is to concentrate efforts in the area near the SIPEF-CI factory, where demand is highest, and in other areas to combine efforts to increase production with training and support of oil and soap production.
Table 8.8: SWOT analysis for oil palm products
Strengths Weaknesses • Palm is native and abundant in Soubré. • Can succeed on land where cocoa fails. • No major diseases and insect problems (only
when very young) so require few pesticides. • Good barrier against CSSV. • Peak production in April-June does not
interfere with main cocoa season. • Some degree of harvest all year round • Generates value for by-products: cocoa pods
burned to make potash used in soap making; seed residues from red oil production used to make black oil.
• Geographic and temporal price differentials very high
• Local knowledge of oil and soap processing widespread, though not ubiquitous
• Palm fruits spoil quickly • Yields low: 8 tons/ha for village plantations;
12 tons/ha for industrial plantations in CI; 22-26 tons/ha in Malaysia.
• Not a good shade tree for cocoa • Requires wide (9m x 9 m) spacing. • Trees produce after 7-8 years, production
declines after 18, must be replaced after 25. • Support structures only available near
factories

!
!
68!
!
Opportunities Threats • Vibrant local processing industry which is
looking to expand. • Industry organization by AIPH. • Industrial production is paid through bank
accounts, creating opportunity for loans • ANADER and cooperatives have already set
up local nurseries, and plan to do more • A great deal of research and technical
knowledge exists on palm in CI. • Recent legal victory against French
supermarket campaigning against palm oil • Some soap and oil cooperatives exist, could be
better developed. • Some demand for direct exports to W. Africa,
expats in Europe and US.
• If coop members sell to local market and not just SIPEF-CI it undermines the coop
• Increasing raw fruit production only without processing could = oversupply, low prices
• High transport costs including fees and bribes paid at checkpoints
• Negative publicity campaign for palm oil in several developed country markets
8.2.3 Timber and fuelwood market
Table 8.9: Porter’s Five Forces analysis – timber and fuelwood
Small-scale wood producers Local processors Local merchants
Industrial sawmills, timber companies
Competition
• Cocoa, rubber and palm plantations compete for land with trees for fuelwood and timber, contribute to decrease in wood supply
• Timber and fuelwood industries compete for the wood that remains • In villages there is still enough wood to gather for free that fuelwood
markets are underdeveloped • Areas with limited wood cannot support many processors or merchants • Some sawmills provide scraps to charcoal producers, firewood sellers • Board vendor cooperative coordinates marketing in Soubre
• Competition with fuelwood harvesters
• About 125 active companies in CI
• Suppliers from other tropical countries, low European demand = low prices
Entry Barriers
• Forestry code says that landowners do not own wild trees on their property
• Even planted trees cannot be legally harvested directly by smallholders
• Limits on land = timber and cocoa compete
• Up-front investment and long wait (10-50 years) before pay-off required
• Expensive materials needed: chainsaw, furnace
• Must have processing knowledge
• Permits, taxes required for legal operation
• Small-scale board making is illegal
• Foreigners barred from participation in some areas
• Permits, taxes required for legal operation
• High cost of transport
• Foreigners barred from participation in some areas
• Only a limited number of companies granted licenses and concessions by the government
• Very high capital investment needed (5-10 billion F) for concession fees, factory, trucks, etc.
• Need connections with companies abroad for export
Supplier Power
• No chemical input supplier networks
• No seedling networks serve smallholders
• SODEFOR, industrial timber companies are the only suppliers of seedlings currently
• Low supplier power, woodcutters can pay low prices for trees or pay in-kind by giving land-owner part of charcoal or firewood produced
• There are relatively more merchant and fewer processors, and processors face legal risks, so they
• Sawmills are vertically integrated, harvest wood from their concessions and transport to their own factories
• Producers who own land don’t legally own the trees, so they have no power

!
!
69!
!
have more market power
Buyer Power
• Timber societies own rights to trees, often cut without compensation
• Only tool for producers to gain power = destroy trees before can be harvested by timber company
• Few local woodcutters who must take risks have market power over producers
• Many bulk merchants, fewer processors, multiple channels, many consumers = low buyer power by merchants and consumers
• Cumbersome legal requirements (origin traceability, certification) needed to export, especially to Europe
• But multiple marketing channels, different countries and customers
Threat of Substitutes
• In villages firewood has almost no substitutes • In towns charcoal and gas are substitutes for wood. But wood retained for
niche tasks (cooking or long duration), charcoal preferred to gas by many. • Timber is a very differentiated product, with many different quality
levels: low quality, fast-growing trees can be used to make plywood and particle board where lumber is too expensive.
• Many countries supply wood worldwide, but certain tropical trees have limited supplies, highly demanded in niche markets.
Tables 8.9 and 8.10 show that the number one problem in the timber and fuelwood value chain is the current Forestry Code which depressed the incentive to plant trees, causing wood supplies to drop precipitously over time. The requirement for industrial timber companies to engage in reforestation has not helped to reverse this situation because over 50% are destroyed by farmers wishing to plant cocoa or another crop. Currently market power in the chain is in the hands of the vertically-integrated industrial sawmills who harvest and process timber, and at a local level it is in the hands of woodcutters and processors, many of whom operate illegally. Producers receive miniscule portions of the profits in the industry and such profits are only earned decades after the initial investment. Efforts need to focus on encouraging and helping producers to plan timber and fuelwood species on their lands, starting with a reform of the forest code. If this is done then there are adequate profits to be made and networks in place that local and export marketing will continue profitably. If wood production is not supported then the whole industry risks implosion.
Table 8.10: SWOT Analysis for timber and fuelwood Strengths Weaknesses • High local demand and established export market • Several highly demanded tree species native to CI • Some of the best timber species are also the best
shade trees for cocoa • Timber can be harvested almost all year round, so no
labour and vehicle bottlenecks. • There are a number of factories, transport structures
already in place not far from the Soubre area • Most sawmills are still earning profits, though they
are declining, and private woodcutting operations are very profitable, though illegal.
• Some fast-growing tree species make good fuelwood • Processing and commerce of wood constitutes a good
alternative income for women and young men • Dead cocoa and rubber can be used as fuelwood.
• Most tree species take a minimum of 30-35 years before they can be harvested.
• The Forestry code in CI creates perverse incentives, prevent landowners from profiting from their trees
• Traceability and other quality requirements for European and US markets are cumbersome and expensive.
• Taxes are high for industrial operations, fines and bribes are high for small-scale illegal operations.
• Transport difficult and expensive because of bad roads, constant need for vehicle repairs.
• Removing trees from the environment reduces the nutrient cycling and other benefits
• Cooking with wood and charcoal less healthy than using gas, electric stoves
Opportunities Threats • Forestry Code may be reformed to make farmers the
owner of their trees, which could improve incentives • Fuelwood harvest is a major source of deforestation,
not currently done in a sustainable manner
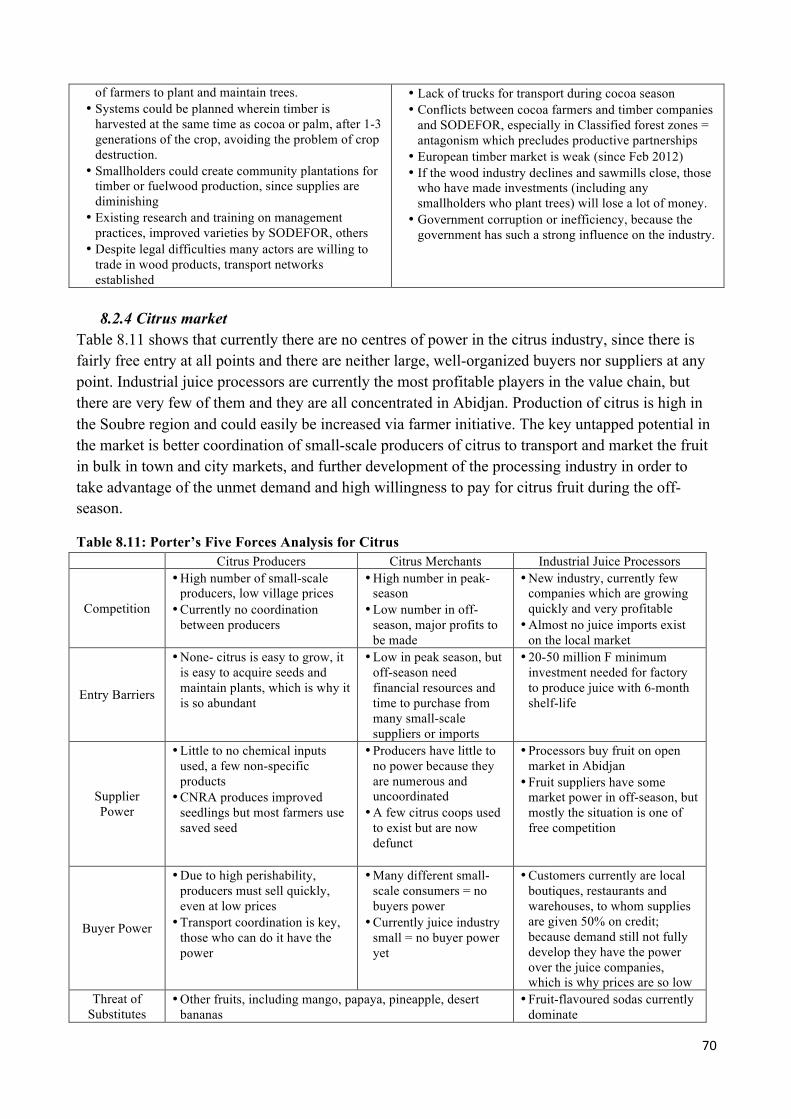
!
!
70!
!
of farmers to plant and maintain trees. • Systems could be planned wherein timber is
harvested at the same time as cocoa or palm, after 1-3 generations of the crop, avoiding the problem of crop destruction.
• Smallholders could create community plantations for timber or fuelwood production, since supplies are diminishing
• Existing research and training on management practices, improved varieties by SODEFOR, others
• Despite legal difficulties many actors are willing to trade in wood products, transport networks established
• Lack of trucks for transport during cocoa season • Conflicts between cocoa farmers and timber companies
and SODEFOR, especially in Classified forest zones = antagonism which precludes productive partnerships
• European timber market is weak (since Feb 2012) • If the wood industry declines and sawmills close, those
who have made investments (including any smallholders who plant trees) will lose a lot of money.
• Government corruption or inefficiency, because the government has such a strong influence on the industry.
8.2.4 Citrus market
Table 8.11 shows that currently there are no centres of power in the citrus industry, since there is fairly free entry at all points and there are neither large, well-organized buyers nor suppliers at any point. Industrial juice processors are currently the most profitable players in the value chain, but there are very few of them and they are all concentrated in Abidjan. Production of citrus is high in the Soubre region and could easily be increased via farmer initiative. The key untapped potential in the market is better coordination of small-scale producers of citrus to transport and market the fruit in bulk in town and city markets, and further development of the processing industry in order to take advantage of the unmet demand and high willingness to pay for citrus fruit during the off-season.
Table 8.11: Porter’s Five Forces Analysis for Citrus Citrus Producers Citrus Merchants Industrial Juice Processors
Competition
• High number of small-scale producers, low village prices
• Currently no coordination between producers
• High number in peak-season
• Low number in off-season, major profits to be made
• New industry, currently few companies which are growing quickly and very profitable
• Almost no juice imports exist on the local market
Entry Barriers
• None- citrus is easy to grow, it is easy to acquire seeds and maintain plants, which is why it is so abundant
• Low in peak season, but off-season need financial resources and time to purchase from many small-scale suppliers or imports
• 20-50 million F minimum investment needed for factory to produce juice with 6-month shelf-life
Supplier Power
• Little to no chemical inputs used, a few non-specific products
• CNRA produces improved seedlings but most farmers use saved seed
• Producers have little to no power because they are numerous and uncoordinated
• A few citrus coops used to exist but are now defunct
• Processors buy fruit on open market in Abidjan
• Fruit suppliers have some market power in off-season, but mostly the situation is one of free competition
Buyer Power
• Due to high perishability, producers must sell quickly, even at low prices
• Transport coordination is key, those who can do it have the power
• Many different small-scale consumers = no buyers power
• Currently juice industry small = no buyer power yet
• Customers currently are local boutiques, restaurants and warehouses, to whom supplies are given 50% on credit; because demand still not fully develop they have the power over the juice companies, which is why prices are so low
Threat of Substitutes
• Other fruits, including mango, papaya, pineapple, desert bananas
• Fruit-flavoured sodas currently dominate

!
!
71!
!
• Imported oranges • In off-season many HHs just go without fruit • Some consumers say no substitutes, value citrus highly for
health purposes (asthma, skin care)
• Existing companies have been able to price their products below soda prices
!
The SWOT analysis in Table 8.12 identifies a number of weaknesses in the citrus industry, but all could be overcome if the opportunities listed were realized. The development of a juice processing industry in Soubre alone might be enough to overcome the weaknesses and generate substantial profits for producers. It could provide an incentive for the development of cooperative transport structures and thus the oversupply of citrus during the peak season would quickly be transformed from a weakness into a strength. The only key threat involves potential difficulties in developing a citrus cooperative, belied by the failed example of the COCI citrus coop in Sassandra. Its failure may indicate that citrus cooperatives are inherently difficult to sustain. Further research should be conducted to analyze COCI and the reasons for its failure, to guide better development of a citrus cooperative in Soubre.
Table 8.12: SWOT analysis for citrus
Strengths Weaknesses • Abundant in the zone (the most abundant of all
trees discussed in focus groups) • Viewed favourably by producers, many of whom
have already planted in their fields • Produce 6-7 years after planting, 3-4 if grafted and
last 50 years • Considered a good CSSV barrier • High village consumption and high demand for
purchase in towns, cities • Nascent juice processing industry very profitable • Orange is most popular industrial juice flavour,
lemon is used to make bissap locally • There is a high profit margin for merchants who
transport citrus to cities
• Same height as cocoa tree, so can interfere with growth, and offers no benefits to soil.
• Spoils quickly (lasts only 1 week, maximum, at room temperature)
• In many villages S>D during peak seasons and a lot of fruits go to waste, prices are low.
• The industry is not organized, so prices are volatile and there are no support structures in place for research, germplasm supply, technical assistance, etc.
• Currently all fruit exports must go through Abidjan. • The types of oranges in Soubre are not export quality • Some treatment, including spraying of red ants and
removal of mistletoe, is necessary to get good yields and facilitate harvest.
• Transportation of citrus from many different fields to a large collection site is expensive and inefficient.
Opportunities Threats • A juice processing factory in Soubre or another
town in the region might be profitable • The essential oil industry, for which plantations and
empty factories still exist, could be revived. • D>S for raw fruits in cities even during peak
season, and everywhere in off-season, so better transport and preservation methods (via processing) could be very profitable.
• A coop of smallholders producers could be formed to supply factories or ship to cities
• Future support of the industry planned by FIRCA, ANADER, CNRA
• COCI, an essential oil factory in Sassandra that bought from a citrus cooperative, went bankrupt and still owes farmers 100 million F. This might indicate a weakness in the cooperative model or at least might have generated distrust in cooperatives. It could also be an indication that the essential oil industry cannot be revived.

!
!
72!
!
9: CONCLUSIONS AND RECOMMENDATIONS
In this final section all of the data compiled and discussed thus far is used to generate a set of conclusions regarding the potential for the selected products to improve producer incomes if promoted in an agroforestry system with cocoa. Then, a list of recommendations is provided for the best methods by which to develop the given value chain in order to maximize the benefits to cocoa producers.
9.1 Recommendations for akpi Akpi has a high potential for use in cocoa agroforestry systems because it is recognized as being beneficial for cocoa by many farmers already and its seeds have a high local demand with fairly well developed structures for collecting, processing, transporting and marketing. The fact that processed seeds can be stored for up to two years is a major benefit, since it means that the product can be sold year-round. However, there are still temporal and geographic price differentials (and thus profit opportunities) because bulk purchases for transport and storage across the year requires financial means which most small-scale merchants lack.
The number one weakness of the akpi value chain is the fact that it is not currently cultivated, and that the wild stocks are declining. An effort to develop propagation and cultivation methods, and conduct extension services on these technologies, is crucial. Other aspects of the chain which could be developed include storage of the seeds, to take greater advantage of the seasonal price differentials, and exports. The advantages of akpi—ease of cultivation, high local demand and well-developed informal marketing networks—mean that minimal efforts are required to deal with these three weak areas.
Primary recommendations for development of the akpi value chain in Soubre include:
1. Fund research efforts for domestication, including improved varieties, germination methods, and grafting for rapid propagation. Methods used in Cameroon have reduced time to maturity to only 3-4 years. These should be adopted in Côte d`Ivoire.
2. Develop a distribution mechanism of improved seeds and grafted seedlings, through CNRA and possibly other structures.
3. Develop a technical document with best practices for farmers. 4. Create a curriculum to train farmers in akpi propagation and management, run training
workshops through ANADER, cocoa cooperatives, ICRAF and other programs. 5. Support the provision of credit to producers and merchants to facilitate investments in
planting, processing, bulk purchases of akpi seeds during the peak season for storage in the off-season, and bulk purchases for export.
6. Support the formation of consortia of small-scale dried food product exporters, and help them to find customers who are able to place bulk orders of akpi.
7. Run a general promotion campaign for akpi products abroad and support export expansion via tax incentives, credit provision or subsidies.

!
!
73!
!
8. Introduce new processing methods which can reduce the processing time. Lessons can be learned from Cameroon where ICRAF scientists have reduced the time from 6-8 weeks to about 8 hours.
9.2 Recommendations for palm products Oil palm is currently more profitable and has a better developed market than akpi. However, it is not as promising for intercropping with cocoa for shade and soil improvement. In fact, though many cocoa farmers have left wild palm trees in their fields for economic reasons (as a source of products for consumption and sale) almost all agree that palm is damaging to cocoa. However, oil palm can play a useful role in cocoa agroforestry as a barrier crop against CSSV. Farmers, who are already interested in retaining some palm trees as is, would readily accept the notion of planting palm on field borders and to cordon off infected areas of their fields from those that are not infected. They simply need training to make them aware of this idea.
The major advantages of the oil palm value chain are that there are multiple marketing channels for producers (the industrial market, local consumers, large merchants, local processors), an almost universal knowledge about how to make sauce from the fruit, fairly widespread knowledge of how to make oil and palm soap, and strong supportive institutions which have been built up around the industrial palm sector, but which can also be tapped to benefit small-scale village producers. A major constraint is that in areas more distant from oil processing factories the support structures and multiple marketing channels which make palm such a profitable product are either in shorter supply or nonexistent. The local palm market is still vibrant in these areas but is relatively underdeveloped and depends only on wild palm.
Primary recommendations for development of the oil palm value chain in Soubre include:
1. Support creation of oil palm cooperatives not just in the factory areas, but also in other zones, to promote collective transport, marketing, nursery creation, input purchase and provision of training for farmers with small quantities of palm. They might even be able to coordinate sales to the SIPEF-CI factory to take advantage of their growing demand.
2. Develop and implement training programs, through ANADER and other bodies, on the best methods to incorporate palm with cocoa, especially as a CSSV barrier.
3. Support the creation of community nurseries, either using saved seeds or CNRA-improved seed varieties.
4. Develop and implement programs to train more people in methods of processing artisanal palm oil and soap.
5. Support the provision of credit for investments in palm planting, machinery and tools for processing, and bulk in-season purchases for sale in the off-season.
6. Encourage (via financing, tax incentives, a marketing campaign) direct export of artisanal palm oil and soap to other countries in West Africa and to expatriate populations in the US and Europe, either via cooperative groups or small-scale business consortia.
9.3 Recommendations for timber and fuelwood The timber and fuelwood industry in Côte d`Ivoire is currently on the cusp of a major crisis, one which could be averted with a few fundamental policy changes. Local and export demand for timber and fuelwood products are very high as supplies are diminishing. Though prices are rising because of this situation, this has not stimulated an increase in planting of trees to take advantage of

!
!
74!
!
potentially high future profits, for several reasons. The Forestry Code in its current form discourages smallholder farmers from planting trees since they do not have the right to harvest the trees. The current laws in fact give them an incentive to destroy many of the valuable timber trees in their own fields and those which are planted by timber societies and SODEFOR in classified forest zones, in an effort to open up more cocoa land (a crop they can actually profit from) and to prevent timber societies from destroying the cocoa when they come to harvest the timber species. Other reasons why farmers do not plant trees is because they tend to operate on short time-horizons (partly due to insecurity of land tenure) and thus are not interested in trees which will only yield profits after 30 years or more, there are no established networks for seedling and other input supplies, and they are not aware of the benefits that shade trees can provide to their cocoa crop.
At the same time there are a number of opportunities in the timber industry which could be used to turn the industry around and make timber and fuelwood cultivation a profitable complementary option for cocoa farmers. The rise of cocoa certification, which requires a minimum number of trees per hectare of cocoa, is one opportunity. Plans to change the Forestry Code in the near future could also be a major boon, if reforms are done the correctly. Also, the fact that many cocoa orchards are aging and need to be replanted or regenerated provides a good opportunity to simultaneously introduce agroforestry systems with timber species properly integrated into fields. Farmers are well aware that local fuelwood (and illegal timber) products are in high demand and profitable, and these markets have well-developed processing, transport, and marketing networks already. Thus, the key is to create a system in which cocoa producers can actually expect to gain a substantial portion of these profits, and they will jump at the chance to plant tree species.
Primary recommendations for development of the timber and fuelwood value chain in Soubre include:
1. Lobby for reforms of the Forestry Code which make farmers the owners of the tree species in their own fields and which allow them to harvest their own wood for sale.
2. Run communication campaigns to increase understanding of the Forestry Code, especially the provision that planted trees do belong to the landowner.
3. If the government wishes to retain limits on the number of legal wood harvesters then they should create a system of regulation which ensures that producers are paid a fair price for their trees when sold to licensed timber societies.
4. Reduce or eliminate the fees levied on local fuelwood and timber processors and merchants. 5. Create community nurseries through cocoa cooperatives, ANADER, and other initiatives,
for the most promising tree species (in terms of benefits to cocoa, potential use in charcoal and firewood, and potential sale for timber). This report suggests that frake is one of the most promising species for promotion.
6. Encourage the development of community plantations, especially of fuelwood. Incentives could be provided to set aside several hectares in each village for a plantation to supply local fuel needs for the future.
7. Support the provision of credit for investments in creation of timber plantations and purchase of processing tools (chainsaws, charcoal furnaces, carpentry equipment).
8. Develop and implement trainings for cocoa producers on the benefits of shade trees for cocoa, planting and management methods for timber species, best ways to market trees, charcoal processing methods, etc.

!
!
75!
!
9.4 Recommendations for citrus The citrus industry has the advantage of abundant supply, relative ease of production, familiarity with and interest in cultivation among cocoa farmers, and high local demand. The major constraint in the industry is difficulty in the collection and transportation of citrus fruits from remote villages to central markets with high demand. Prices in these villages are low and many fruits rot on the trees while in the towns and cities prices are fairly high and there is unmet demand. That is, there is a great untapped spatial arbitrage opportunity. However, there is an even more dramatic untapped temporal arbitrage opportunity, because the off-season for most fruits arrives around the same time (the dry period) and demand is still high though supplies are very low. Clearly, development of juice processing could be very profitable under such circumstances, and this could be done in such a way as to ensure substantial profits for producers. If this one action were taken, it would resolve the problem of oversupply in nearby towns and would stimulate increased harvest of existing citrus trees and planting of new ones by cocoa farmers, which could serve as a substantial alternative source of income.
Primary recommendations for development of the citrus value chain in Soubre include:
1. Support the establishment of an industrial juice processing factory in Soubre or another town in the region. V4C could either provide finance for such a project directly or help to find investors or partner organizations to provide finance.
2. Provide training and support projects to preserve citrus and other fruits using methods besides juice processing, such as jam-making and drying.
3. Support the development of transport and marketing cooperatives of citrus in Soubre. 4. Facilitate access to credit for investing in juice processing, trucks for transport, development
of nurseries, planting and maintenance of citrus plantations. 5. Conduct further research on improved citrus varieties and cultivation methods to lengthen
the season and increase yields. Develop methods to distribute these varieties to producers. 6. Develop and implement training on citrus nursery and plantation management, cooperative
organization, and artisanal juice processing.
!
!
76!
!
REFERENCES Asare, R. 2005. “Cocoa agroforests in West Africa: a look at activities on preferred trees in the
farming systems.” Forest & Landscape Working Papers no. 6-2005. Asare, R. and S. David. 2011. “Good agricultural practices for sustainable cocoa production: a
guide for farmer training. Manual no. 1: Planting, replanting and tree diversification in cocoa systems.” Sustainable Tree Crops Programme, International Institute of Tropical Agriculture, Accra, Ghana. July 2011 version.
Assiri, A.A., Z.A. Kacou, F.A., K.S. Ekra, E.A. Kacou, K.F. Dji, J.Y. Couloud, and A.R. Yapo.
2012. “Rentabilité économique des techniques de réhabilitation et de replantation des vieux vergers de cacaoyers (Theobroma cacao L.) en Côte d’Ivoire .” Journal of Animal & Plant Sciences 14, 2: 1939-1951.
Cloug, Y., H. Faust, and T. Tscharntk. 2009. “Cacao boom and bust: sustainability of
agroforests and opportunities for biodiversity conservation.” Conservation Letters 2: 197–205.
Gibson, J. 2007. “Consistently Inconsistent: Addressing income volatility among cocoa
producers in Ghana and Côte d’Ivoire.” Winnipeg: International Institute for Sustainable Development.
ICRAF. 2011. “Presentation Synoptique du Department de Soubre.” World Agroforestry Centre
Vision for Change Project, Internal Document. ICRAF. 2012. “Projet V4C: Rapport Annuel 2012.” World Agroforestry Centre: Abidjan, Côte
d’Ivoire. Institut National de la Statistique (INS). 1998. “Recensement Général de la Population et de
l'Habitat : Données socio-démographique et économiques des localités.” Tome 1: Résultats définitifs par localités, région du Sud-ouest. Abidjan.
Nkamleu, Y., J. Gockowski and S. David. 2007. “Investing in agrochemicals in the cocoa sector
of Côte d’Ivoire: Hypotheses, evidence and policy implications.” African Journal of Agriculture and Resource Economics 1, 2: 145-166.
Fair Labour Association (FLA). 2012. “Sustainable Management of Nestlé’s Cocoa Supply
Chain in the Ivory Coast—Focus on Labour Standards.” Fair Labour Association. Gockowski, J. and S. Dury. 1999. “The economics of cocoa-fruit agroforests in southern
Cameroon.” Paper present to International Workshop on Multi-strata Systems with Perennial Tree Crops. CATIE, Costa Rica, 22-25 February.
Ofori-Frimpong, K., A. Asase, J. Mason, and L. Danku. 2007. “Shaded versus unshaded cocoa:
implications on litter fall, decomposition, soil fertility and cocoa pod development.” Presented at the Symposium on Multistrata Agroforestry Systems with Perennial Crops. 17-21 September 2007: CATIE Turrialba, Costa Rica.
Porter, M.E. 2008. “The five competitive forces that shape strategy.” Harvard Business Review
January: 79–93.

!
!
77!
!
Pye-Smith, C. 2011. “Cocoa Futures: An innovative programme of research and training is
transforming the lives of cocoa growers in Indonesia and beyond.” ICRAF Trees for Change no. 9. Nairobi: World Agroforestry Centre.
Ruf, F. 2001. “Tree Crops as Deforestation and Reforestation Agents: the Case of Cocoa in
Côte d’Ivoire and Sulawesi.” In Anglesen, A. and D. Kaimowitz, eds. Agricultural Technologies and Tropical Deforestation. Oxon, UK: CABI Publishing.

!
!
78!
!
APPENDIX Organizations interviewed
Organization Contact Person Telephone, e-mail Notes CNRA Dr. Gnahoua Guy
Modeste 40570032 [email protected]
Leading researcher on akpi domestication in CI, operates cultivated test plot
Centre de Récherche Ecologique
Dr. Kouame N`dri Marie-Therèse
01500971 [email protected]
Expert in akpi cultivation, other native tree products
Direction Parc National de Tai
Cdt. Yapi Fabrice 34722299 Projects to propagate Irvinigia gabonensis; interested in other partnerships with ICRAF
ANADER, Abidjan, filière café-cacao
M. Ehougban Vincent 07613356/02503178
ANADER, Abidjan, filière hévéa et palmier à huile
M. Adjiri Eby 01050365 [email protected]
Planning to work with coops, start palm nurseries and trainings
EOLIS, transporter for Compagnie Fruitiere
M. Konan Issidor 20311765 Good contact if wish to develop citrus or other fruit exports
RAMA Céreal Mm. Coulibaly Aramatou
07059004 [email protected]
Small-scale enterprise producing dried food products, including akpi, for Abidjan and export market
COTRAVI M. Tapé Clement 07420808/07332963 [email protected]
Same as RAMA
Groupe Oban M. Banny 01383421 Same as RAMA Ngro Service 08093670 Small-scale direct
exporter to France of products including akpi
OCPV Mlle. Miete 07794352 [email protected]
can provide sales data on food crops for future research
INS (Institut National de Statistiques)
M. N’dri Yao Jonas 20228018/07528654 [email protected]
can provide access to consumption data for future research
Former STCP M. Dji Florent 08069905 STCP had successful program to promote frake
UCOFEACI Pres. Kone Epse Massou Maddiara
08389102 Did not speak to them directly
Centrale des Commercants CI
M. Dosso Mazin 08581864 Federation of merchant coops, interested in partnering on projects
FENACOVICI Mm. Irié Lou Colette or M. Kakou Pulias
22428634 49998279/46160475
Fed. of female food crop producers; interested in partnering on juice factory, and

!
!
79!
!
other projects CODISPROVI-CI Mm. Blé Zepherine 07051463
[email protected] Female food producer and merchant coop; interested in partnering on transport, input supply projects
FIRCA, direction fruits et agrumes
M. Ouyr 22528181 Provided manual on processing of mango and pineapple
IvoireOR M. Adonis Suy, M. Kamagate
09680048/06877793 New juice company in Abidjan
CNRA, filière des agrumes
M. Adopo Achille 02008646
PlantIvoire M. Traore Zana Justin 21353148/08000494 [email protected]
Citrus essential oil processor, exporter; factories in Agboville & Divo
RMG Soubre M. Honore Kouakou 08177262/04497112 [email protected]
In charge of local depot in Soubre
Dynapharm International
M. Koffi Romain 34722920/57526293 [email protected]
Supplier of organic fertilizer, including for oil palm
CNRA Iro Lame M. Allamba, Chef d’exploitation
02035533 Supplier of certified palm germplasm
Ministère d`Agriculture, direction hévéa et palmier
Mm. Kramou Mireille 20222481 [email protected]
AIPH M. Berthe, Secretaire Executif
07471700
COOPALM M. Kouakou N’Guessan Mathieu
07438600 [email protected]
Interested in partnerships to increase palm production, supply seedlings
COOPALM nursery M. Issidor Dibro 08106961 Nursery manager COOPAGRIS M. Zoundi Esther FENACOPAH-CI 22527135 Federation of palm
cooperatives SIPEF-CI, San Pedro office
M. Simon Pierre Minan, Chef de Departement Agricole
34712031/ 09595652
SOFIBEX M. Delfond Sylvain 34712066 Industrial sawmill, timber exporter
CIB Gagnoa M. Manga Felix, head of sales
05724914 Industrial sawmill, timber exporter
Inprobois M. Larché Fabien 21358916/08080840 [email protected]
Industrial sawmill, timber exporter
TranchIvoire M. Stefano Liverani 21360160 Industrial sawmill, timber exporter
Major local board seller in Soubre
M. Traore Zie 07365409
Ministère des Eaux et Forêts, Abidjan
M. Oualou 07585084
Ministère des Eaux et Cdt. Augou Tchidje, 07057969

!
!
80!
!
Forêts, Abidjan sous-directeur de l`économie forestière
Ministère des Eaux et Forêts, Soubre
Cdt. du zone 08063877 Interested in partnership with ICRAF, says agroforestry is a big priority for them this year
Ministère des Eaux et Forêts, Gagnoa
Cmd. Silue 01984901 Helped get contacts with Gagnoa sawmills
SODEFOR Soubre M. Dorey Christophe Have frake, framire, teak seedlings; interested in partnering to encourage producers to plant more timber trees
SODEFOR Gagnoa 03589826 SODEFOR San Pedro Mm. Guo, secretaire du
directeur 01507473
SODEFOR, Oumé M. Ouattara 01136898 Has iroko nursery in village of Sangoue, have seedlings to sell
Cocoa farmer who is intercropping cocoa and rubber
M. Zadi Mathurin 48355395 Field located near Kipiri, would be open to working with ICRAF
!
!
81!
!
Working(Paper(Series(!2011!124. An!assessment!of!farm!timber!value!chains!in!Mt!Kenya!area,!Kenya!
125. A!comparative!financial!analysis!of!current!land!use!systems!and!implications!for!the!adoption!of!improved!
agroforestry!in!the!East!Usambaras,!Tanzania!
126. Agricultural!monitoring!and!evaluation!systems!
127. Challenges!and!opportunities!for!collaborative!landscape!governance!in!the!East!Usambara!Mountains,!
Tanzania!
128. Transforming!knowledge!to!enhance!integrated!natural!resource!management!research,!development!and!
advocacy!in!the!highlands!of!Eastern!Africa!!
129. CarbonLforestry!projects!in!the!Philippines:!potential!and!challenges!The!Mt!Kitanglad!Range!forestLcarbon!
development!!!
130. Carbon!forestry!projects!in!the!Philippines:!potential!and!challenges.!The!Arakan!Forest!Corridor!forestLcarbon!
project!!
131. CarbonLforestry!projects!in!the!Philippines:!potential!and!challenges.!The!Laguna!Lake!Development!Authority’s!
forestLcarbon!development!project!
132. CarbonLforestry!projects!in!the!Philippines:!potential!and!challenges.!The!Quirino!forestLcarbon!development!
project!in!Sierra!Madre!Biodiversity!Corridor!
133. CarbonLforestry!projects!in!the!Philippines:!potential!and!challenges.!The!Ikalahan!ancestral!domain!forestL
carbon!development!!!
134. The!importance!of!local!traditional!institutions!in!the!management!of!natural!resources!in!the!highlands!of!
Eastern!Africa!!!
135. SocioLeconomic!assessment!of!irrigation!pilot!projects!in!Rwanda!
136. Performance!of!three!rambutan!varieties!(Nephelium!lappaceum!L.)!on!various!nursery!media!
137. Climate!change!adaptation!and!social!protection!in!agroforestry!systems:!enhancing!adaptive!capacity!and!
minimizing!risk!of!drought!in!Zambia!and!Honduras!
138. Does!value!chain!development!contribute!to!rural!poverty!reduction?!Evidence!of!asset!building!by!smallholder!
coffee!producers!in!Nicaragua!
139. Potential!for!biofuel!feedstock!in!Kenya!
140. Impact!of!fertilizer!trees!on!maize!production!and!food!security!in!six!districts!of!Malawi.!
!
2012!141. Fortalecimiento!de!capacidades!para!la!gestión!del!Santuario!Nacional!Pampa!Hermosa:!Construyendo!las!
bases!para!un!manejo!adaptativo!para!el!desarrollo!local.!Memorias!del!Proyect!
142. Understanding!rural!institutional!strengthening:!A!crossLlevel!policy!and!institutional!framework!for!sustainable!
development!in!Kenya!
143. Climate!change!vulnerability!of!agroforestry!
144. Rapid!assessment!of!the!inner!Niger!delta!of!Mali!
145. Designing!an!incentive!program!to!reduce!onLfarm!deforestation!in!the!East!Usambara!Mountains,!Tanzania!
146. Extent!of!adoption!of!conservation!agriculture!and!agroforestry!in!Africa:!the!case!of!Tanzania,!Kenya,!Ghana,!
and!Zambia!
147. Policy!incentives!for!scaling!up!conservation!agriculture!with!trees!in!Africa:!the!case!of!Tanzania,!Kenya,!Ghana!
and!Zambia!
148. Commoditized!or!coLinvested!environmental!services?!Rewards!for!environmental!services!scheme:!River!Care!
program!Way!Besai!watershed,!Lampung,!Indonesia.!
149. Assessment!of!the!headwaters!of!the!Blue!Nile!in!Ethiopia.!!
150. Assessment!of!the!uThukela!Watershed,!Kwazaulu.!!
151. Assessment!of!the!Oum!Zessar!Watershed!of!Tunisia.!!
152. Assessment!of!the!Ruwenzori!Mountains!in!Uganda.!!
153. History!of!agroforestry!research!and!development!in!Viet!Nam.!Analysis!of!research!opportunities!and!gaps.!!
154. REDD+!in!Indonesia:!a!historical!perspective!!
155. Agroforestry!and!forestry!in!Sulawesi!series:!livelihood!strategies!and!land!use!system!dynamics!in!South!
Sulawesi!!
156. Agroforestry!and!forestry!in!Sulawesi!series:!livelihood!strategies!and!land!use!system!dynamics!in!Southeast!
Sulawesi!!
157. Agroforestry!and!forestry!in!Sulawesi!series:!profitability!and!landLuse!systems!in!South!and!Southeast!Sulawesi!!

!
!
82!
!
158. Agroforestry!and!forestry!in!Sulawesi!series:!gender,!livelihoods!and!land!in!South!and!Southeast!Sulawesi!!159. Agroforestry!and!Forestry!in!Sulawesi!series:!agroforestry!extension!needs!at!the!community!level!in!AgFor!
project!sites!in!South!and!Southeast!Sulawesi,!Indonesia!!
160. Agroforestry!and!Forestry!in!Sulawesi!series:!Rapid!market!appraisal!of!agricultural,!plantation!and!forestry!
commodities!in!South!and!Southeast!Sulawesi!!
!
2013!161. Diagnosis!of!farming!systems!in!the!Agroforestry!for!Livelihoods!of!Smallholder!Farmers!in!Northwestern!Viet!
Nam!project!
162. Ecosystem vulnerability to climate change: a literature review 163. Local capacity for implementing payments for environmental services schemes: lessons from the RUPES project
in northeastern Viet Nam 164. Seri Agroforestri dan Kehutanan di Sulawesi: Agroforestry dan Kehutanan di Sulawesi: Strategi mata
pencaharian dan dinamika sistem penggunaan lahan di Sulawesi Selatan 165. Seri Agroforestri dan Kehutanan di Sulawesi: Mata pencaharian dan dinamika sistem penggunaan lahan di
Sulawesi Tenggara 166. Seri Agroforestri dan Kehutanan di Sulawesi: Profitabilitas sistem penggunaan lahan di Sulawesi Selatan dan
Sulawesi Tenggara 167. Seri Agroforestri dan Kehutanan di Sulawesi: Gender, mata pencarian dan lahan di Sulawesi Selatan dan
Sulawesi Tenggara 168. Seri Agroforestri dan Kehutanan di Sulawesi: Kebutuhan penyuluhan agroforestri pada tingkat masyarakat di
lokasi proyek AgFor di Sulawesi Selatan dan Tenggara, Indonesia 169. Seri Agroforestri dan Kehutanan di Sulawesi: Laporan hasil penilaian cepat untuk komoditas pertanian,
perkebunan dan kehutanan di Sulawesi Selatan dan Tenggara 170. Agroforestry, food and nutritional security 171. Stakeholder Preferences over Rewards for Ecosystem Services: Implications for a REDD+ Benefit Distribution
System in Viet Nam 172. Payments for ecosystem services schemes: project-level insights on benefits for ecosystems and the rural poor 173. Good practices for smallholder teak plantations: keys to success

The World Agroforestry Centre is an autonomous, non-profit research organization whose vision is a rural transformation in the developing world as smallholder households increase their use of trees in agricultural landscapes to improve food security, nutrition, income, health, shelter, social cohesion, energy resources and environmental sustainability. The Centre generates science-based knowledge about the diverse roles that trees play in agricultural landscapes, and uses its research to advance policies and practices, and their implementation that benefit the poor and the environment. It aims to ensure that all this is achieved by enhancing the quality of its science work, increasing operational efficiency, building and maintaining strong partnerships, accelerating the use and impact of its research, and promoting greater cohesion, interdependence and alignment within the organization.
United Nations Avenue, Gigiri • PO Box 30677 • Nairobi, 00100 • Kenya Telephone: +254 20 7224000 or via USA +1 650 833 6645
Fax: +254 20 7224001 or via USA +1 650 833 6646Email: [email protected] • www.worldagroforestry.org