market dominance & socioeconomic weight dynamics in the us
TRANSCRIPT
1
Market Dominance & Socioeconomic Weight Dynamics in the US
Pharmaceutical Industry
An extensive view on the OTC-Analgesics market
hhhhhhhhhhhhhhhhhhhhhhhhhhhhhhhhhhhhhhhhhhhhhhhhhhhhhhhhhhhhhhhhhhhhhhhhhhhhhhhhhhhhhhhhhhhhhhhhhhhhhhhhhhhhhhhhhhhhhhhhhhhhhhhhhhhhhhhhhhhhhhhhhhhhhhhhhhhhhhhhhhhhhhhhhhhhhhhhhhhhhhhhhhhhhhhhhhhhhhhhhhhhhhhhhhhhhhhhhhhhhhhhhhhhhhhhhhhhhhhhhhhhhhhhhhhhhhhhhhhhhhhhhhhhhhhhhhhhhhhhhhhhhhhhhhhhhhhhhhhhhhhhhhhhhhhh
Bachelor of Science
Edited by
Milan van Aagten
Supervised by
Stephan Jagau
February 2017
2
Abstract
Statement of Authenticity
During the last decades the US pharmaceutical industry has been subject to numerous incidents, challenging its highly self-valued image on trustworthiness and benevolence. This paper investigates how and to what extent pharmaceutical companies are able to secure the market share of their products. We focus on the over-the-counter analgesics market as to its homogeneous properties and substantial group of consumers. A regression on brand share has been performed with the number of years a company was allowed to sell in a monopoly position and total yearly lobbying expenditures as explaining variables. The company’s total assets and its market capitalization have been added as control variables. We find a highly significant positive effect of distributing years under exclusivity protection on brand share. We do not find evidence that implies a significant effect of total lobbying expenditures on the number of drugs sold relative to the total market sales.
This document is written by Milan van Aagten who declares to take full responsibility for the contents of this document. I declare that the text and the work presented in this document is
original and that no sources other than those mentioned in the text and its references have been used in creating it. The Faculty of Economics and Business is responsible solely for the
supervision of completion of the work, not for the contents.

3
TableofContents
Introduction1. WelcometothePharmaceuticalIndustry
2. Literaturereview
2.1Lobbyingandpoliticalpower2.2AdvertisementofOTCmedicine2.3Marketshareundergenericentry2.4Physician-industryinvolvement
3.Econometricanalysis Data 3.1Definingthemarket 3.2Dependentvariable 3.3Explanatoryvariables 3.3.1Operatingyearsinexclusivity 3.3.2Estimatingmarketdominance: Kwoka’sDominanceIndex 3.3.3Lobbyingexpenditures 3.4Controlvariables 3.4.1Direct-to-customeradvertisement 3.4.2Firmsizeindicators 3.5Results Method 3.6Themodel 3.7Paneldataspecifications 3.7.1Theindividualtimeseries 3.7.2Fixedeffectsestimation 3.8Post-regressionanalysis 3.8.1Linearity 3.8.2White’stestforheteroskedasticity 3.8.3Jarque-Beratestfornormality 3.8.4VIFonmulticollinearity 3.8.5Wooldridge-Drukkertestforautocorrelation
4.Concludingremarks 4.1Inretrospect 4.2Furtherresearchopportunities
ReferencingAppendix

4
Introduction
1. WelcometothePharmaceuticalIndustry
Theworldofpharmaceuticalsenduresrapidlyexpandingpressureastimegoesby.Thisisfora
greatextentduetoindustrydynamicsandself-inducedactionalthoughitisinconjunctionwith
aninvariantlegalandeconomicenvironmentinwhichtheindustryoperates.
WithmediaoutburstsasofMartinShkreli’s700%pricehike,initiatedbyhiscompanyTuring
Pharmaceuticals,ofDaraprim™,adrugusedforthetreatmentofaidscomplications.More
recentlyMylansparkedoutragewithregardtoitsEpiPen™,followinga500USdollarincrease
perpackageinjustsevenyears.MylanCEOHeatherBreschclaimstobea:‘’victimofadeficient
healthcaresystemasintermediariessuchaswholesalersandpharmacybenefitmanagersadd
totheultimatecostresultinginahigherpay-checkforpatients’’(Mangan,D.CNBC,2016).Both
CEO’sarguetoofferdiscountstoselectedcustomers.Thisgesturehoweverwillbeinsufficient
ashigherdrugpricesrampupinsurancepremiumsasasecondaryresult.
Concernslikethesedonotonlyraisequestionsregardingthemotivesbehindpriceincreases,it
testsourjudgmentonhowitisinanywayjustifiable.Includingaforementioned,theAmerican
pharmaceuticalindustryisrichonscandalsascorporaterap-sheetsarepervasiveenoughto
covermultipledecades.Allofwhichhavechallengedthegeneralconsensusconcerninghow
andifgiantpharmaceuticalcompaniesshouldexerttheamountofpowertheyhavegrownto
possess.OngoingoutrageouspricehikeslikeMylan’swillcontinuetoignitediscussion
regardingtheethicalenvironmenttheindustryisengagedin.
Itisevidenttodiscussboththecontroversyandacademicgravityoftheissueandhowitis
supportedbyexistingliterature.,especiallywhentakingintoaccountthatthenegativeeffectsof
industrypowerhavenotthoroughlybeenexposednorwithsufficientbackup.

5
AsnoUSlawexiststhatprotectspatientsorconsumersfromunreasonablepricehikesby
pharmaceuticalfirms,itmightbehelpfultoobservetheindustrydynamicsmoreclosely.
Inthelastdecadestheindustryhasbeentransformeddrasticallyfrommerelyamanufacturerof
chemicalstoaresearchorientedsectorthatcontributesgreatlytohealthcaretechnology.The
originofsuccessintheindustryingeneratingastreamofnewdrugswithimportanttherapeutic
benefitshasinvolvedtheindustryinintensepublicpolicydebatesonareasconsidering:
researchfinancing,theveracityofclaimsforitsproducts,thepriceschargedforthem
(moreoverwhopaysthosecharges)andthesociallyoptimaldegreeofpatentprotection.
Thedebateismainlyrevolvedaroundthewelfareeconomicissueoftheongoingtrade-off
betweenpromotinginnovativeeffortandsecuringcompetitivemarketoutcomes.TheR&D
sectoroftheindustryisheavilyreliantonpatentprotectionmeasures.Howeverwhilethe
monopolyinducedprofitsfromsalesinexclusivityserveasawarrantforinitialinvestment,
theyinhibitcompetitionandthusincreasedeadweightlossinthemarket.
HealthcareagentshavecontinuouslyarguedtobeforcedtoprioritizeandsecuretheirR&D
possibilitiesbeingvictimoffastgrowingcostsofdruginnovation,thusclaimingtorighteously
steeruptheirprices.
Itisgenerallypresumedthatdrasticpricehikeslikeaforementionedarelabeledas
unreasonable.Itbecomesthereforenecessarytoelaborateonthecasesinwhichsubstantial
pricehikesareindeedjustifiable.
Scherer,(2001)showsthatpharmaceuticalcompaniesareeconomicallyboundtoinvestvast
amountsofcapitalintheresearchwhichissubordinatetoinventneworhigherquality
medicine.Withcostsofdevelopingnewdrugshavingincreasedto2.6billiondollarsin2014
(PrMAProfileofBiopharmaceuticalindustry,2015),pharmaceuticalcompaniescollectively
claimtobeforcedtoraiselistprices.

6
NottomentiontheinvestmentexpendituresinR&Dconflictheavilywiththelackofa
correspondingincreaseinthenumberofmedicinebeingapprovedbytheU.S.Food&Drug
Administration(Pammolli,,Magazzini,Riccaboni,2011),whichindicatesofamorecostly
therapeuticinnovationprocess.
NonethelesscasesasthatofMylandonormallynotrevolvearoundnewtreatmentmethods.
Thecontroversyusuallyisnotaboutmedicinewithgroundbreakingtherapeuticproperties.Itis
silentlyassumedthatdespitetheseimmenseR&Dcoststherestillisanoutrageousamountof
incomingcashflowsleftnotdefinedtobeusedforoperationalfactorsonly.
Myaimistofindaclarificationofhowbigpharma-firmssecuretheirbrandshare,evenafter
competitionraisedbygenericentrants.Iaminspiredtoresearchhowthisdirectlyaffectsusas
patients.
Iwillthereforesubdividethemainquestionintotwo:
• Whatimpactdoesmarketpoweroratemporalprivilegeprovidingmarketpowerinthe
formofapatenthaveonbrandshare?
• Towhatextentisacompanyabletoaffectregulationinitsownadvantagewith
monetarymeans?
Iwillfocusmyresearchonanalgesicsthataresoldoverthecounter1(OTC).Whatmakesthis
marketespeciallyinterestingtostudyisthegapbetweentheperceiveddistinctionbetween
productsandtheactualabsenceofdifferentiationduetothealmosthomogeneousnatureofthe
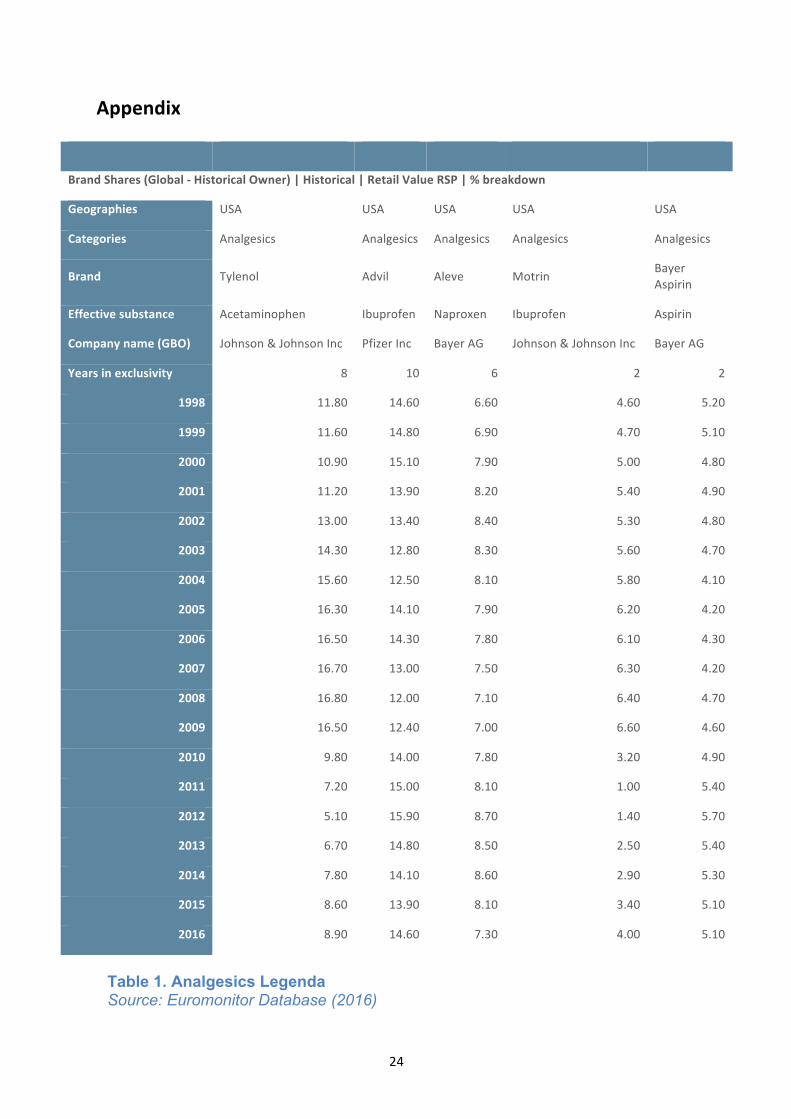
products.Theworkingsubstancedifferssolelybetweenibuprofenandacetaminophen(Table1,
Appendix).Thisrulesoutanyqualitybasedpreferencesaconsumercanhave.
Oneofthecorecontroversysparksrevolvingaroundpharmaceuticalcompaniesistheir
increasingpoliticalinfluence(Henry,Lexchin,2002).Especiallyaroundtheaffectsona
company’srelativemarketpowerandultimatelythenumberofproductstheysell,tous.
Possibleoutcomesofthisresearchmayallowustospeculateonoftenmadesubstantial
statementsincluding;thedeficiencyoftheUShealthcaresystem,acontaminated
pharmaceuticalindustryorneglectingcorporateregulation.
1AsstatedbytheU.S.Food&Drugadministration:‘’OTCdrugsaredrugsthathavebeenfoundtobesafeandappropriateforusewithoutthesupervisionofahealthcareprofessionalsuchasaphysician,andtheycanbepurchasedbyconsumerswithoutaprescription.’’

7
2. Literaturereview
Thepharmaceuticalindustryhascontinuouslybeenidentifiedasanattractiveareato
investigateasitissubjecttoanabundanceofscandals.Nexttopopularmediabeingmagnetized
towardstheindustry’slatestmovements,itattractsvastamountsofacademicsastheneedfor
well-foundedbackupinnewsreportsishigherthanever.Thecontroversyandlackoftrust
revolvingaroundtheindustrycanonlybeatplaceifhardevidenceisshownthatconflictswith
theargumentsgivenfortheiractions.Attemptsofdissectingtheindustrytoallowforthe
constructionofclearcorrelationsarenumerousandeachshineslightonadifferentelementof
theeconomicsofhealthcare.Allhavetheaimhowevertoultimatelyprovideuswithsome
explanationonhowtheindustrybehaves.Existingliteratureonpharmaceuticalsissegregated
intothreemainfields:
1.Theeffectsofdirect-to-customeradvertisementonOTCdrugs
2.Physicianinvolvementwithpharmaceuticalcompanies
3.Patentprotectionandtheinfluenceonbrandsharedynamicsandgenericcompetition
Allthreeofthemwillbeelaboratedon.
Advertisementandmorespecificallythepromotionofanytherapeuticnecessitieshasalways
beenaclassiccontroversialtopic.Theextenttowhichitscompetitiveeffectreacheshas
importantimplicationsforlegislationaroundadvertising,antitrustlitigationsandotherlegal
procedures.
Inthe1999paperbyJohnRizzoonantihypertensivemedication,hefindsthatproduct
detailing2systematicallylowersthepriceelasticityofdemand,handinganexplanationasto
whypharmaceuticalcompaniescontinuouslyraisepriceswithsuchease.Contrarytothis,Rizzo
findsthatthepricethefirmsetsisofnegativeandhighlysignificanteffectonitssales,which
thusconcludesthedisproportionallyhighcompensatingpowerofadvertisement.He
furthermorefoundthatgenericentrystronglycontributestothispricesensitivity.Causesgiven
inthepaperalllinktoincreasedbrandloyaltyresultingfromdrugdetailing.Thisisshown
howevertohavedetrimentaleffectsonpricecompetitioninthemarket.
ThesefindingsareconsistentwithHurwitzandCaves(1998),whofindevidenceofthe
inhibitionofentryintothemarketbyadvertising.Theystatethattrademarkholders’sales-
2Definition:Industryexplainingofdrugpropertiestoamedicalagent,perceivedasequivalenttoproductmarketing(Rizzo,1999).

8
promotionoutlaysdopreservetheirsharesagainstincursionbygenericentrants.
Correspondinglytheirresultsshowadiminishedeffectonbrandsharebyincoming
competition,afterintensecomparativeadvertising.SimilarlytoRizzotheystresstheindustry’s
highbrandloyalty.
AsthevastmajorityoftheOTCdrugsarehomogenousinnatureorhavesimilartherapeutic
propertiesitisanattractivemarkettodelveinto.Anderson,CilibertozandLiaukonyte(2008)
arguethatthegapbetweenactualandperceiveddiscrepancyofinparticularOTCanalgesicsis
generatedbyadvertising.TheOTCanalgesicsmarketischaracterizedbysubstantialadvertising
expendituresbythemarket’sleadingbrands.Advertising-to-salesratiosrangeanywherefrom
20-50%,beingmorethanasevenfoldofthepharmaceuticalindustry’saverage.Thepaper
showsthatconsumersformtheirbrandpreferencebasedonanythingbuttheworking
substancetheproductspossesses.Allaforementionedconcludeadvertisementeffectscannotbe
excludedfromthisresearch.
Anotherfocuspointofexistingliteratureonthehealthcaresystemisindustryinvolvementwith
healthcareagents,mostlybeingphysicians.ChrenandLandefeld(1982)foundthatphysician
interactionwithdrugcompanies,affectedphysicianrequestsfordrugstobeaddedtothe
hospitalformulary.Howevermorethanhalfofthenewmedicinerequestedofferedlittletono
therapeuticadvantageovercomparabledrugsalreadyontheformulary.
Physiciansareofferedcompensationsrangingfromgiftsandindustrypaidmealstosamples
andevenfundingfortravelandeducationalsymposia.Theattitudesabouttheseexpensesare
dividedandcontradictory.Asmuchas85%ofmedicalstudentsbelieveitisimproperfor
politicianstoacceptagift,whereasonly46%founditimproperforthemselvestoacceptagiftof
similarvaluefromapharmaceuticalcompany(Wazana,2000).Perhapstheconcernisrelated
tothepotentialconsequencesregardingcostlyprescriptiondrugsornegativeoutcomesfor
healthingeneral.Theconsensusaboutthistopicamongfuturephysiciansmayindicateofafar
stretchinginherenturgeforchange.
Anotherelementthatisessentialoftheindustryisitshistoricpatentprotectionpolicy.The
DrugPriceCompetitionandPatentTermRestorationAct3(alsoknownastheWaxman-HatchAct
of1984)wasamajorchangeinpublicpatentpolicy.Itservedasacompromisebetween
brandedandgenericproducersandsetaminimumfortheeffectiveperiodinwhichadrug
developercanmarketexclusively.Ontheotherhanditreducedtheburdenforgenericentrants
togaingovernmentapprovalwithrespecttoinordinatetesting.Nonetheless,aspatent
protectionhasalwaysbeendefinedasatradeoffbetweencompetitionandinnovation,Boldrin
3http://www.fda.gov/newsevents/testimony/ucm115033.htm

9
andLevine(2013)findnoempiricalevidencetoshowthatpatentsservetoincreaseinnovation
orproductivity.Evenwhenidentifyingthenumberofpatentsawardedwithinnovationthey
concludenosignificantcorrelation.
Themainfocuspointinexistentliteraturewithrespecttopatentprotectionistheeffectsof
expiration.Thesecondaryeffect,namelytheentryofgenericcompetition,haslikewisebeen
subjecttoahighlevelofinvestigation.Statman(1981)findsevidencesuggestingthatdrugs
protectedbypatentareabletoholdontotheirmarketpositionsbeyondexpiration,althoughin
generalgenericandothernamebrandsgraduallycaptureanincreasingshareofeachdrug's
market.Statmanalsostatesthatgenericcompetitioninthehospitalmarketismorevigorous
thaninthedrugstoremarket,despitetherelativelysmallersizeofthehospitalmarket.This
differencepresumablyisduetoagreaterincentivetoeconomizeorsimplyduetogreater
medicineknowledge.
Iwouldliketostresshoweverthereisaprominentlackofliteraturethatmagnifiesoncompany
effortstogainpoweronareasoutsideofthatofeconomicalormarketrelatedpower.The
pharmaceuticalindustrysetshighstakesatlobbying,spendingmorethan7millionUS$yearly
onaverage4.Thequestionconcerningtowhatextentbigpharma-firmsexerttheeconomic
powertheypossessinaffectingregulations,isonethatwillbecarefullyfocusedoninthispaper.
WithalIhavestilltoencounterliteraturethatdiscussesthenumberofyearsacompanywas
abletodistributeandsellitsproductunderpatentprotectionorhasadopteditasexplanatory
variableforcorporateperformance.Thetemporarymonopolypositionpatentsofferisassumed
tohavelong-lastingeffectsonbrandloyaltyandultimatelymarketshare.
Myaiminthisresearchisnotonlytoaddresstheexplanatoryvariablesofqualitythatis
profoundlyproveninexistingliterature,moreoveritistoincludeinfluencecomingfrom
directionsthathaveuntilnownotbeenlookedinto.
4Source:https://www.opensecrets.org/lobby

10
3. EconometricAnalysis
Thefollowingsectionwillelaborateonthedatathatisconsultedtoanalyzetheeffectsofmarket
dominanceandsocio-economicpoweronbrandshare.Themethodologywillbediscussed
includingathoroughdescriptionoftheempiricalmodelanditsvalidity.Toconcludea
subsectionisdevotedtogiveanextensiveviewontheregressionresults.
Data
3.1. Definingthemarket
Definingthemarketcorrectlyiscrucialinthisresearch,asIamcircumnavigatinganimportant
componentofindustryinfluenceonhealthcare,namelythedirectphysician-to-company
contact.Asmentionedbefore,physicianinvolvementwithpharmaceuticalfirmshasbeen
extensivelyinvestigated,showingaclearpositiveeffectonthequantityofdrugsthatisaddedto
thehospitalformulary(Chren,Landefeld,2000).
Yetwhenfocusingonover-the-countermedicineanditsdemanddynamics,anynon-monetary
compensationorsymposiaaimedatmedicalagentswouldhavenegligibleeffects,asthe
physicianishighlylimitedinhisattemptstoaffectthepatient'spreferenceondrugbrands.
Patientsdonotnormallyaskfortheirphysicians’adviceregardingrelativelyharmlessdrugs
boughtoverthecounter.
Thisoffersasolutiontotheinaccessibledataaboutphysicianinvolvementwithpharmaceutical
companies.Analyzingprescriptiondrugsandtheirpowerinthemarketwithoutincluding
industry-physiciancontactwouldgiveheavilybiasedresults.ThisiscontrarytoassessingOTC-
drugswithoutbiaswhenomittingthesamevariable.Thesub-marketofanalgesicsis
particularlyinterestingduetothesignificantdiscrepancybetweentruedifferentiationofalmost
homogeneousmedicalproductsandtheperceiveddifferentiationamongdifferentbrands.This
ispresumablyoriginatedinbrandimagedifferencescreatedbydrugadvertisement.
3.2-Dependentvariable
Analyzingthecompetitivepositionofaspecificdrugasksustoapplythemostaccurate
measure.Anaccuraterepresentationofaproduct’srelativepositioninthemarketisits
quantitysold,whichdirectsustothebrandsharepermedicineasdependentvariable.Dataon
thisisretrievedfromPassportdatabase,consistingoftime-seriesdataonOTCdrugbrand
sharesfrom1998to2016.Withal,theconceptofthisthesisarosefromthecontroversylinked
topricehikesinthepharmaceuticalindustrywithoutanyobviouseconomicalconsequence.
Thiseconomicalconsequenceisusuallyinitiatedbylowermedicinesalesorlowerquantity
demanded.Thislaysthefoundationofdefiningthedependentvariableasbrandshare,whichis
11
definedastherelativesalesofthemedicineagainstthetotalanalgesicssales.
3.3 Explanatoryvariables
3.3.1Operatingyearsinexclusivity5orunderpatent6
Bothpatentsandexclusivityareboundtoatrade-offbetweeninnovationandcompetition.
Offeringamonopolypositionforalimitedtimeguaranteesprofitsthatwarrantthe
manufacturer’sinitialinvestment.Thissignificantlydecreasesinnovationcostswhileonthe
otherhandnegativelyaffectingcompetitioninthemarket.
Statman(1981)showedthatdrugsprotectedbypatentareabletoholdontotheirmarket
positionbeyondexpirationdatesalthoughgenericsgraduallycaptureanincreasingmarket
share.ThesefindingsareconsistentwithFrank&Salkever’spaper(1991)whofindsadeclinein
priceelasticityofbrandnamemedicinedemandstemmingfrommarketentryduetopatent
loss,indicatingadiminishedthreattobrandnamedrugshare.Existingtheoryimplies
significanteffectsofyearsacompanyhasmarketeditsdruginexclusivity7on(post-generic
entry)marketshare,validatingthevariable’sexplanatoryfunction.
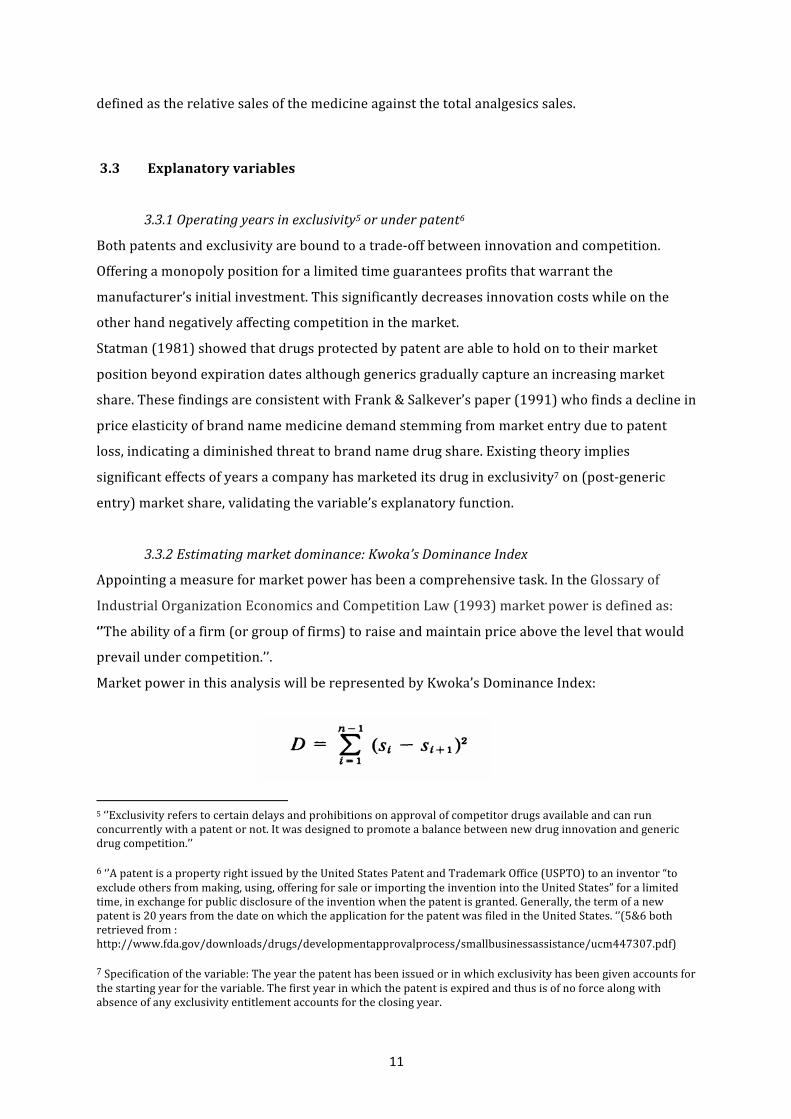
3.3.2Estimatingmarketdominance:Kwoka’sDominanceIndex
Appointingameasureformarketpowerhasbeenacomprehensivetask.IntheGlossaryof
IndustrialOrganizationEconomicsandCompetitionLaw(1993)marketpowerisdefinedas:
‘’Theabilityofafirm(orgroupoffirms)toraiseandmaintainpriceabovethelevelthatwould
prevailundercompetition.’’.
MarketpowerinthisanalysiswillberepresentedbyKwoka’sDominanceIndex:
5‘’Exclusivityreferstocertaindelaysandprohibitionsonapprovalofcompetitordrugsavailableandcanrunconcurrentlywithapatentornot.Itwasdesignedtopromoteabalancebetweennewdruginnovationandgenericdrugcompetition.’’
6‘’ApatentisapropertyrightissuedbytheUnitedStatesPatentandTrademarkOffice(USPTO)toaninventor“toexcludeothersfrommaking,using,offeringforsaleorimportingtheinventionintotheUnitedStates”foralimitedtime,inexchangeforpublicdisclosureoftheinventionwhenthepatentisgranted.Generally,thetermofanewpatentis20yearsfromthedateonwhichtheapplicationforthepatentwasfiledintheUnitedStates.‘’(5&6bothretrievedfrom:http://www.fda.gov/downloads/drugs/developmentapprovalprocess/smallbusinessassistance/ucm447307.pdf)
7Specificationofthevariable:Theyearthepatenthasbeenissuedorinwhichexclusivityhasbeengivenaccountsforthestartingyearforthevariable.Thefirstyearinwhichthepatentisexpiredandthusisofnoforcealongwithabsenceofanyexclusivityentitlementaccountsfortheclosingyear.

12
Itemphasizesthegapbetweensuccessivefirmswhentheyarerankedbysize.Thevaluesofthis
measurerangefrom1to0,withtheformervalueindicatingamonopolisticmarket.Conversely,
theclosertozerothemeasureis,theloweristhepowerofanysinglecompany(J.E.Kwoka,
1977).
Itisevidenttheindexinvestigatesonthemarketlevelandisunabletodiscusscompanyspecific
traits8.Thusanexternalfactor,namelythecompetitiveenvironmentofthecompany,willbe
usedratheracompanybasedvariable.KDIisthereforeconstantwithrespecttodrug,thoughit
remainstimevariant.
3.3.3Lobbyingexpenditures
Myintentionistoclasscompaniesbytheirnationalinfluenceonregulationsandbythelevelof
protectiontheyendurefromgovernmentsorotherinterestgroupssuchastradeunions.Their
specificlobbyingexpenditurescouldbeapreciseindicatorofthis‘’socio-economicweight.’’The
assumptionisthatthisultimatelyleadstobrandloyalty,evenaftergenericentry.
Opensecrets.orgprovidesanextensivedatabasewithannuallobbyingspendingpercompany,
Thevalidityofthedatapoolisconfirmedbyevenprovidingspecificlobbyingreportssortedby
nameofthelobbyistandissuethatislobbiedfororagainst.Itisassumedeffortstogain
influenceonregulationtakeasubstantialamountoftimetobeenforced.Thereforea1-year
laggedvalueoftotallobbyingexpendituresisusedintheregressiontoexplainbrandshare.
3.4 Controlvariables
3.4.1Direct-to-customer9advertisement
Themostprominentomittedvariablebiaswillberesultingfromignoringtheimmense
advertisingspendingbypharmaceuticalcompanies.TheOTC-analgesicsmarketischaracterized
byadvertisingexpenditurescomparabletotheirR&Dspendingwhenitcomestothetop
brands.HurwitzandCaves(1998)findevidencethatadvertisinginhibitsentryintothemarket.
Theyfoundtrademarkholders’sales-promotionoutlaysdopreservetheirsharesagainst
incursionbygenericentrants,whichjustifiesadvertisementspendingasanindependent
variable.Datasetsofasufficientsizehowever,areoughttobepurchasedwhichlimitsthedata
thatisattainable.TosolveIusean2001-2005averagegivenintheAnderson,Cilibertozand8I have considered taking a unit variable for market dominance being equal to 1 when market share would exceed the 40% (Definition retrieved from: https://stats.oecd.org/glossary/detail.asp?ID=3199). However the OTC-analgesics market showed to be highly competitive with market shares not exceeding the 20% benchmark.
9 While the advertising numbers include expenditures on multiple media, almost all of the advertising budgets were spent on broadcast television advertising, including network, cable, and spot TV (Anderson, Ciliberto, Liaukonyte, 2008).

13
LiaukonytepaperonOTC-analgesicsadvertisementin2008.Thisaveragerepresentstheshare
oftotaladvertisingexpendituresbythetoppainkillerbrands.Iwillusethisshareasaconstant
bylackofsuperiordata,whichpresumablywillaccountforthegrandpartoftheomitted
variablebias.Anderson(2008)furthermoreexposestotaladvertisementspendingtosalesratio,
whichwouldbeapoorerrepresentationassumingtheshareofvoice10tobelinearlyaffectedby
advertisementspending.
3.4.2TotalAssets&MarketCapitalization
OtherfactorsofinfluenceonmarketshareIaccountedforarecompanysizeand
correspondinglyitsmarketvalue.YearlydataisretrievedfromExcel’sintegratedDataStream
for1998till2016withUSdollarsasvaluta.
3.5 Results
Theresultsoftheindividualt-testsshownintable5showaclearpositivecorrelationbetween
theyearsacompany’sproductwasprotectedfromcompetitionanditspresentmarketshare.
Furthermoreinterestingtonoticeisthatnoneofthecontrolvariablesactuallycontributetothe
accuracyofthemodel.Notonlylobbyingexpendituresexperiencesincreasedsignificance,
Kwoka’sdominanceindexlikewiseseemstobetterexplainbrandsharewhenthecontrol
variablesareomitted,thoughata10%significancelevel.Wethereforeconcludethatno
evidencewasfoundtosuggestinequalityinthemarketimpactsadrug’smarketshare.
10 Share of voice is defined as the ‘’degree to which people see a company’s advertisements, etc. in a particular market, compared to those of competitors’’. ‘share of voice. (n.d.) Cambridge University Press. (2008) Retrieved from http://dictionary.cambridge.org/dictionary/english/share-of-voice

14
ThereisnoevidenceofsignificantinfluenceofahigherKwoka’sDominanceIndexon
pharmaceuticalsales.Thiscaneitherhintonadeficientvariabletomeasuremarketdominance
orofmoreconclusively,nosignificanteffectofanunequalmarketonbrandshare.
Reasonsforthismayincludethattheemergenceofacompetitiveenvironmentisa
comprehensiveandlengthyprocess,whichisassumedtobehighlytime-invariant.It
presumablyfluctuatesmostduringtheyearsfollowingpatentexpiration,yearsinwhichgeneric
entryrapidlyincreases.Combinationsoflaggedvaluescouldthereforebeofgreatervalue,
howeverthisrequirestheirjointsignificancetobetested.
Theincreaseinthemodel’sexplainingpowerafterremovingoneofthecontrolvariablesthat
indicatefirm-size,mayberesultingfrommulticollinearitybetweenmarketcapitalizationand
totalassets.Asbothimplytherelativesizeandmagnitudeofacompany,omittingonedoes
indeedimprovethemodel.

15
Method
3.6 TheModel
Thesetupoftheregressioncanbedescribedisasfollows.Paneldataisanalyzedforyears1998
–2016.
𝐵𝑟𝑎𝑛𝑑𝑠ℎ𝑎𝑟𝑒!" = 𝐵!𝐸𝑥𝑐𝑙𝑦𝑒𝑎𝑟𝑠! + 𝐵!𝐿𝑜𝑏𝐸𝑥𝑝!" + 𝐵!𝐾𝐷𝐼! + 𝐵!𝑀𝑎𝑟𝑘𝑒𝑡𝐶𝑎𝑝!" + 𝐵!𝑇𝑜𝑡𝑎𝑙𝐴𝑠𝑠𝑒𝑡𝑠!"+ 𝐵!𝐴𝑑𝑣𝑆ℎ𝑎𝑟𝑒! + 𝑣!"
:Idiosyncraticerror11
3.7 Paneldataspecifications
3.7.1Theindividualtimeseries
Thefactthatwearedealingwithyearlytimeseriesdataraisessomeessentialquestionsthat
needtobeansweredbeforeanalyzinglinearrelationshipsbetweenthetimeseries.Presenceof
stationarityofthetimeseriesiswhatrequirestobeexaminedfirst.Wecanencountertheriskof
spuriousregressioniftheserieshappentobenon-stationary12.Spuriousregressionindicatesa
professedlystronginter-timeseriesrelationship,whichleadstotheestimatorsbeing
inconsistent.TestingforstationarityiscommonlyexecutedbyaDickey-Fullertest.However
duetooursamplesizethathasamaximumof95observationsthesignificanceofthetestis
inherentlydecreased,thuswecanonlyassumestationarity.Toavoidinconsistentestimates
basedonthisassumption,weconsultGrangerandNewbold(1974)inthattheR2ofthemodel
cannotbegreaterthantheDurbin-Watsonstatistic,otherwisebeingindicativeofaspurious
regression.TheDurbin-Watsonstatisticisnotapplicableonpanel-datathereforeplacinga
statisticalanalysisofstationarityoutofreachwithinthescopeofthepresentanalysis.
Ifwefocusonthepropertiesofbrandsharewecanreasonthatitishighlydependentonother
companybehaviorandtheircorrespondingmarketshares.Consideringthesignificanteffectof
advertisementinfluenceonbrandloyaltyandultimatelynumberofproductssold(Rizzo1999)
wecanarguetheoreticallythatbrandsharedoesnothaveaunitroot,asaunitrootwouldimply
aweakorstronglylaggedeffectofadvertisement.InhisresearchRizzoavoidsusinglagged
valuesofmarketingexpendituresimplyingadirecteffectthatisnotlagged.
11Timeinvariant&druginvarianterrortermsomitted.Thisiselaboratedonin‘’Paneldataimplications’’
12http://sergei-sarkissian.com/papers/spurious.pdf

16
-50
5
Res
idua
ls
0 5 10 15Fitted values
3.7.2Fixedeffectsestimation
Primarilywetakeintoaccountthatpooled(perdrug)OLSwillnotbeapplicableheredueto
unobservedheterogeneity,conflictingwiththeGauss-Markovassumptionofazeroconditioned
meanfortheerrorterm13.AHausman-Testshowstheinitialnullhypothesisissoundlyrejected,
whichstatedtheindividual-leveleffectsareadequatelymodeledbyarandom-effectsmodel.
Thecovariancebetweenthetime-consistenterrorandexplanatoryvariablethereforedoesnot
holdtobeequalto0,justifyingafixedeffectsestimation.Nonethelessasestimatingwithfixed
effectsremovestheeffectoftime-invariantcharacteristics,itwillsubsequentlyomitanytime-
constantvariables.Theyearsthefirmhassoldthedruginexclusivityaswellastheaverage
shareofadvertisementspendingarebothtime-constantresultinginfixedeffectsestimation
beingunsuitable.Settlingforthisissuerequirestoaddyearlydummyvariablescombinedwith
dummiesforeachpharmaceuticalandexcludingfixedeffectsestimators.Thiswillpreventany
time-constantvariablebeingomitted.
3.8 Post-regressionanalysis
3.8.1Linearity
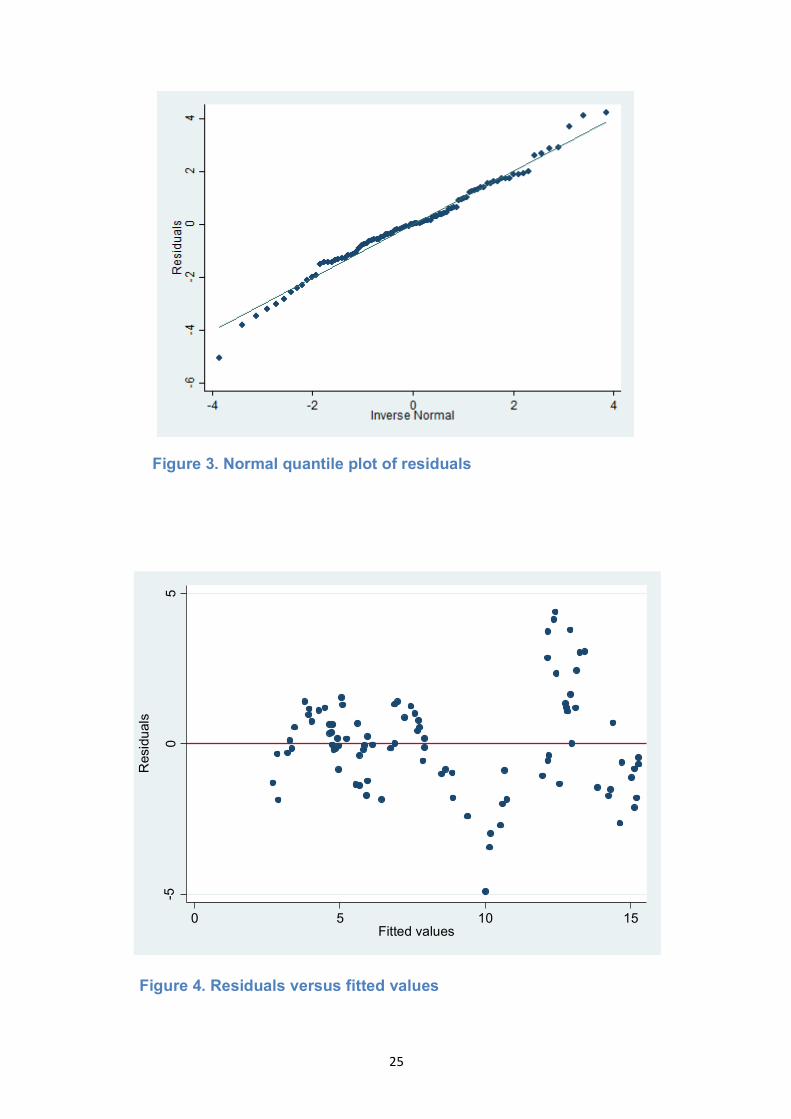
One of the Gauss Markov assumptions states the dependent variable, in our case market share,
requires to be a linear function of the set of explanatory variables. If we plot the residuals against the
predicted values it becomes clear whether or not we deal with nonlinearity. The points should be
distributed around the horizontal line in a symmetrical manner. As can be seen in Figure 2 the points
start symmetrically distributed
however as the values increase, more
outliers become visible. This violation
of linearity can lead to miss-specified
determinants. However interpreting
this distribution as nonlinear would be
impetuous, taking into account the
limited range of the sample size.
13Odell,P.L.(1983).Gauss–Markovtheorem.Encyclopediaofstatisticalsciences.
Figure 1. Residuals versus fitted values

17
Figure 2. Normal quantile plot of residuals
3.8.2Heteroskedasticity
AWhite’stesthasbeenappliedforheteroskedasticity,whichresultedinrejectingthenull
hypothesisstatingthatthevarianceofourerrorsgiventheexplanatoryvariablesisequalto0.
Wecanassumeheteroskedasticitytobepresentandhaveaccountedforitbyaddingrobust
errortermstoourregression.
3.8.3Normalityoftheresiduals
Violationsofnormalitycancreateproblemsfordeterminingwhethercoefficientsare
significantlydifferentfromzero.Askewederrordistributionisoughttobeexcludedstressing
theabsenceofanylargeoutliers.
Togiveanindicationoftheerrortermdistributionanormalquartileplotoftheresidualsis
showninFigure2.Astheplotissensitivetodeviationsfromnormalityinthetailswecan
concludethereisnoevidenceofnon-normality.Thisagreesclearlywithwhatisrevealedinthe
KernelDensityEstimate(Figure3).Nonetheless,consideringtherelativelysmallsamplesizea
Jarque-Beratestisperformedtofullysecuretheabsencenon-normality.Theoutcomedidnot
allowforrejectingthenull-hypothesisofhavingnormallydistributederrorterms.

18
3.8.4Multicollinearity
VarianceInflationFactors(VIF)havebeenusedtotestacorrelationbetweenanyofour
explanatoryvariables.Multicollinearitywillmanifestinourmodelbyinflatedstandarderrors,
whichdamagesthesignificanceoftheestimators.ApplyingVIFresultedinabsenceofany
collinearity,asnovaluethatwascalculatedexceeds4(Table3).Thesefindingsareconsistent
withthePearsonvaluesexposedinthecorrelationmatrix(seeAppendix,table4).
Figure 2. Kernel Density Estimate

19
3.8.5Autocorrelation
TotestifthereisarelationshipbetweentheerrortermsIperformedaWooldridge-Drukker
test.ThereasoningbehindpreferringtheWooldridgetestoverthecommonlyusedDurbin-
Watsonteststatisticisitssimplicitywithrespecttopanelmodeltestingalongwiththeabsence
oflargetablesprovidingthecriticalvaluesofboththecross-sectiondimension(i=1,...,N)and
thetime-dimension(i=1,...,T)(Wooldridge,2010).
Thetestindicatedwecouldnotrejectthenull-hypothesissuggestingthereisindeed
autocorrelation.TheoutcomeraisedfromperformingtheWooldridgetestcaninprinciple
originatefromthreecomplications:
1. Themissingofadecisiveexplanatoryvariable,causingomittedvariablebias
2. Afunctionallymiss-specifiedthemodel
3. Ameasurementerrorinoneormultipleexplanatoryvariables
Fromthese,ameasurementerrorofanindependentvariableismostplausible.For
advertisementspending,whichisproventobeofhighandsignificanteffectonOTC-
pharmaceuticalbrandshare(Anderson,Cilibertoz,Liaukonyte,2008),thevariableusedistoa
greatextentunspecified.Advertisingcanbesubdividedtocomparativeordetailingandauditive
orvisual,allhavingdifferentimpactlevels.Additionallyaconstantvalueisusedinsteadofa
linearestimation,asduetothelimiteddataused.
4. Concludingremarks
4.1Inretrospect
Theresultsshowaclearrelationbetweentheyearsthecompanycoulddistributeitsproduct
underprotectivemeasuresandthebrand’sshareofthemarket.Creatingamonopoly
environment,evenforalimitedtimeisaprivilegetoaccountforinthepharmaceuticalindustry.
Anexplanationforthiscanbethatwhenitcomestohealth,peopletendtocomposetheirbrand
loyaltyinanacceleratedfashion.Acomplementaryrisk-averseattitudetowardstryingnew
drugs,whilebeingcontentwithanalternative,islikelytoexist.
Focusingonlobbyingexpenditureswecanconcludethereisnotenoughstatisticalevidence
foundtoclaimtheyhavesignificantpositiveeffectsonaproductssales.Severalreasonsforthis
canbeacclaimed.Tostartlobbyingeffortsinthemodelaredefinedatthecompanylevel.As
manyplayersinthepharmaceuticalmarketalsohaveinvestmentsandstakesinother
20
industries,itcandifferfromyeartoyearwhatpercentageoflobbyingeffortisspecifically
aimedatOTCdrugreregulation.Thesecondexplanationmayberootedinthelaggedeffecton
regulationinfluenceattempts.Creatingnewlegalstructurestakesatremendousamountof
time,notevenconsideringitsimplementation.Ifthemostprominentpharma-firms
communicatetheiridealsitwillrequirerevisingofexistingandfuturelawswhichfurthermore
lengthenstheprocess.Thereforeusinga1-yearlagmightbesuboptimal,althoughourdataset
didnotallowforagreatnumberoflags.Athirdexplanationcontainsthemorecomplicatedweb
ofregulationaroundprescriptiondrugs,relativetothataroundmedicineboughtoverthe
counter.Thismayindicateofthatagreatpartoflobbyingistargetedatprescriptiondrug-
relatedissues.
Theshareofthetotalmarketadvertisementspendinghasnotbeenfoundtohaveasignificant
effectonabrand’smarketshare.Thismayshowthecomplicatedmannerofdefiningand
subdividingadvertisement.Anderson,CilibertozandLiaukonyte(2008)statethatwhether
drugpromotionisofcomparablenatureornothasgreatpositiveinfluenceingenericentry
inhibition,stressingtheimportanceofclassifyingadvertisement.Furthermoreadvertisement
expendituresareassumedtobelinearlycorrelatedtocompanybenefits,orifadvertisement
spendingcorrelatestoahighershareofvoice,therelationshipmaybehyperbolic(Rizzo,1999).
Inthisresearchaconstantisusedwhichishighlylikelytonegativelyimpactthevariable’s
explanatorysignificance.AsHurwitzandCaves(1998)emphasizethehighlevelofadvertising
impactonOTCdrugsales,anotideallyspecifiedregressorcanresultinserialcorrelation,which
weindeedfoundevidenceofusingvarianceinflatedfactors.
Remarkablytherewasnoevidenceofmulticollinearityinthemodel.Thetotalamountofassets
afirmhasnexttoitstotalmarketcapitalizationarebothindicatorsoffirmsize,whichsuggests
ofadegreeofcorrelation.Apossibleexplanationforthisisthatassetsarebalancedbythe
burdenofliabilitiesacompanycarries,whileitsvaluecalculatedfromstockpricemaybea
morehonestmarketrepresentationofitsvalue.
4.2FurtherResearchOpportunities
Agreatpartoftheinitialmotivationforthispaperliesinthedirecteffectonusaspatients.
Questioninghowthegrowingpoliticalentanglementofthepharmaceuticalindustrytogether
withfrequentoutrageouspricehikescorrelatetoconsumerhealthcareandconsumerbehavior
hasbeenkeytotheconstructionofthispaper.Examiningthequantitythatispurchasedofover-
the-counterpharmaceuticalscanonlypartlycoverthismatter.Amoreaccurateandauthentic
measureforindustrysocioeconomicpowerwouldthepriceelasticityofdemand,inparticular

21
thatofprescriptiondrug.Althoughexistingliteraturespreadsfromadvertisinginfluenceson
OTCmarketsharetotherelationofphysician-companycontactwithdrugsaddedtothehospital
formulary,Ihaveyettoencounterresearchwhichfocussesontheeffectsofregulationand
effortstoaffectthelegalenvironmentitforms.
Ideallyatime-seriesinvestigationwouldbeexecutedincludingdataon:
● advertisement,shareofvoiceorexpenditures
● patentprotection&exclusivity
● genericentry&marketsharechanges
● effortstogainsocio-economicpower,bothlobbyinginvestmentsandinvolvementof
industrywithhealthcareagents
● priceelasticitiesofdemand
Thiscombinedwithadatasetthatreachesfarbeforeandaftergenericentrywouldgive
interestinginsightsonthenatureofthiscomplicatedindustry.

22
Referencelist
Anderson,S.P.,Ciliberto,F.,&Liaukonyte,J.(2008).Gettingintoyourhead(ache):Advertising
contentforOTCanalgesics.MarketingScienceInstituteWorkingPaper.
Avorn,J.,Chen,M.,&Hartley,R.(1982).Scientificversuscommercialsourcesofinfluenceonthe
prescribingbehaviorofphysicians.TheAmericanjournalofmedicine,73(1),4-8.
Boldrin,M.,&Levine,D.K.(2013).Thecaseagainstpatents.Thejournalofeconomic
perspectives,27(1),3-22.
Kwoka,J.E.(1977).Largefirmdominanceandprice-costmarginsinmanufacturingindustries.
Southerneconomicjournal,183-189.
Frank,R.G.,&Salkever,D.S.(1991).Pricing,patentlossandthemarketforpharmaceuticals(No.
w3803).NationalBureauofEconomicResearch.
Granger,C.W.,&Newbold,P.(1974).Spuriousregressionsineconometrics.Journalof
econometrics,2(2),111-120. Henry,D.,&Lexchin,J.(2002).Thepharmaceuticalindustryasamedicines
provider.TheLancet,360(9345),1590-1595.
Hurwitz,M.A.,&Caves,R.E.(1988).Persuasionorinformation?Promotionandthesharesof
brandnameandgenericpharmaceuticals.Thejournaloflawandeconomics,31(2),299-320.
Mangan,D.(2016,August25).‘’MylanCEOBresch:'Noone'smorefrustratedthanme'about
EpiPenpricefuror.’’CNBC.Retrievedfrom:http://www.cnbc.com/2016/08/25/mylan-
expands-epipen-cost-cutting-programs-after-charges-of-price-gouging.html
Odell,P.L.(1983).Gauss–Markovtheorem.Encyclopediaofstatisticalsciences.
Pammolli,F.,Magazzini,L.,&Riccaboni,M.(2011).Theproductivitycrisisinpharmaceutical
R&D.NaturereviewsDrugdiscovery,10(6),428-438.)
Rizzo,J.A.(1999).Advertisingandcompetitionintheethicalpharmaceuticalindustry:Thecase
ofantihypertensivedrugs.TheJournalofLawandEconomics,42(1),89-116
23
Scherer,F.M.(2001).ThelinkbetweengrossprofitabilityandpharmaceuticalR&Dspending.
HealthAffairs,20(5),216-220.
Statman,M.(1981).Theeffectofpatentexpirationonthemarketpositionofdrugs.Managerial
andDecisionEconomics,2(2),61-66.
Wazana,A.(2000).Physiciansandthepharmaceuticalindustry:isagifteverjusta
gift?.Jama,283(3),373-380.
Wooldridge,J.M.(2010).Econometricanalysisofcrosssectionandpaneldata.MITpress.
24
Appendix
BrandShares(Global-HistoricalOwner)|Historical|RetailValueRSP|%breakdown
Geographies USA USA USA USA USA
Categories Analgesics Analgesics Analgesics Analgesics Analgesics
Brand Tylenol Advil Aleve MotrinBayerAspirin
Effectivesubstance Acetaminophen Ibuprofen Naproxen Ibuprofen Aspirin
Companyname(GBO) Johnson&JohnsonInc PfizerInc BayerAG Johnson&JohnsonInc BayerAG
Yearsinexclusivity 8 10 6 2 2
1998 11.80 14.60 6.60 4.60 5.20
1999 11.60 14.80 6.90 4.70 5.10
2000 10.90 15.10 7.90 5.00 4.80
2001 11.20 13.90 8.20 5.40 4.90
2002 13.00 13.40 8.40 5.30 4.80
2003 14.30 12.80 8.30 5.60 4.70
2004 15.60 12.50 8.10 5.80 4.10
2005 16.30 14.10 7.90 6.20 4.20
2006 16.50 14.30 7.80 6.10 4.30
2007 16.70 13.00 7.50 6.30 4.20
2008 16.80 12.00 7.10 6.40 4.70
2009 16.50 12.40 7.00 6.60 4.60
2010 9.80 14.00 7.80 3.20 4.90
2011 7.20 15.00 8.10 1.00 5.40
2012 5.10 15.90 8.70 1.40 5.70
2013 6.70 14.80 8.50 2.50 5.40
2014 7.80 14.10 8.60 2.90 5.30
2015 8.60 13.90 8.10 3.40 5.10
2016 8.90 14.60 7.30 4.00 5.10
Table 1. Analgesics Legenda Source: Euromonitor Database (2016)
25
-50
5
Res
idua
ls
0 5 10 15Fitted values
Figure 4. Residuals versus fitted values
Figure 3. Normal quantile plot of residuals

26
Figure 5. Kernel Density Estimate

27