market growth, trader participation and pricing in … energy futures, maturity spectrum, trader...
TRANSCRIPT

February 7, 2007 Market Growth, Trader Participation and Pricing in Energy Futures Markets
Michael S. Haigh Jeffrey H. Harris James A. Overdahl Michel A. Robe*
Abstract
We use a unique dataset on futures trader positions to document major
changes in the size and term structure of the U.S. crude oil futures market. We show that, as recently as 2000 trading activity in this market was heavily concentrated at the near end of the maturity spectrum. Since then, overall open interest has grown two-fold, with trader activity at the back end of the maturity spectrum increasing over twice as much as the market as a whole. The market growth in long-term (>3 years) positions generally started in 2004, which coincides with the growth in participation by commodity swap dealers in the futures markets. An analysis of the composition of traders participating in the market shows that almost all large-trader categories (commodity swap dealers and arbitrageurs; hedge funds; commercial dealers; and commercial producers) now carry aggregate net positions in long-term contracts comparable in magnitude to the size of their net positions in short-term (<3 months) contracts prior to 2003. Amidst this market growth, the prices of one-year and two-year futures became co-integrated with the price of the near-month futures for the first time in 2004. We provide evidence that the pricing convergence is linked to the growth in futures trading by commodity swap dealers and arbitrageurs. Our results have significant implications for those interested in the effectiveness of hedges constructed with long-term crude oil futures contracts and for those interested in the quality of information contained in futures prices across the term structure.
Keywords: Energy futures, Maturity Spectrum, Trader categories, Evolution. JEL codes: G10, G13, L89
* Haigh: Associate Chief Economist, U.S. Commodity Futures Trading Commission (CFTC), 1155 21st Street, NW,
Washington, DC 20581. Tel: (+1) 202-418-5063. Email: [email protected]. Harris: CFTC and Alfred Lerner College of Business and Economics at the University of Delaware, 320 Purnell Hall, Newark, DE 19716. Tel: (+1) 302-831-1812. Email: [email protected]. Overdahl: Chief Economist, U.S. Commodity Futures Trading Commission, 1155 21st Street, NW, Washington, DC 20581. Email: [email protected]. Tel: (+1) 202-418-5165. Robe: CFTC and Kogod School of Business at American University, 4400 Massachusetts Avenue NW, Washington, DC 20016. Tel: 202-885-1880. Email: [email protected]. Special thanks to Steven Cho for his help with the Large Traders Report data and for many useful comments. Thanks also to David Bessler, Andrei Kirilenko, David Reiffen, and participants at the OPEC workshop on the Impact of Financial Markets on the Price of Oil (Vienna) and to a seminar at the CFTC for helpful comments. This paper reflects the opinions of its authors only, and not those of the U.S. Commodity Futures Trading Commission, the Commissioners, or any other staff upon the Commission. All remaining errors and omissions, if any, are the authors’ sole responsibility.

1
I. Introduction Various types of hedgers and speculators interact in derivatives markets. Floor brokers
for example, may take positions, process information, and discover prices in these markets while
serving clients. In addition, arbitrageurs in derivatives markets may also serve to alleviate price
discrepancies and to improve the transfer of risk amongst investors.1 As derivatives markets
continue to expand, a natural question is to what extent changes in the magnitude and the
composition of trading affect pricing. In this paper, we use a unique dataset of New York
Mercantile Exchange (NYMEX) trader positions to document the significant growth in West
Texas Intermediate (WTI) crude oil futures market since 2000.2 We utilize proprietary details
about trader positions from the Commodities Futures Trading Commission’s (CFTC) Large
Trader Reporting System (LTRS) to show that this growth can be traced to a diverse set of trader
types.3 We find that increased participation by dealer/merchants, hedge funds and especially
commodity swap dealers and arbitrageurs contribute significantly to improved price efficiency in
one- and two-year contracts. In this regard, we demonstrate how increased participation by both
commercial and non-commercial traders can enhance market quality in commodity markets.
The NYMEX crude oil futures market has grown steadily this century across all futures
expiration dates. In nearby contracts (those expiring within three months) where price discovery
is centered, daily net positions have grown by 145% from early 2000 through mid-2006. Growth
has been even more dramatic in long-dated contracts (those expiring in three years or more),
exceeding 262% over this same time frame. Contracts for six or more years did not exist prior to
1999. As recently as 2000, the crude oil futures market was relatively illiquid at the far end, with
open interest in long-dated contracts amounting to less than 4.5% of total open interest. For most
categories of traders, however, we find that growth in the long-dated market has now made the
size of daily net positions in long-dated futures comparable in magnitude to the size of the
nearby market in 2000.
1 See Basak and Croitoru (2006). 2 These contracts comprise the world's largest-volume futures market on a physical commodity (Source: Nymex). 3 The CFTC provides historical public data in weekly Commitment of Traders (COT) Reports which aggregate these trader types into broad “Commercial” and “Noncommercial” traders. Each of these groups are quite heterogeneous and these reports do not break down activity by different maturities. On January 5, 2007 the CFTC began publishing COT—Supplemental reports which also include aggregate futures and options positions of Index Traders, but only for 12 agricultural commodities.

2
Our uniquely detailed position data allow us to examine how various types of traders
contribute to the development of both nearby and long-dated markets. We show that these
markets have experienced greater participation from nearly every type of trader at all term
horizons. In nearby contracts, commodity swap dealers have accounted for a major part of
growth, with floor brokers, dealer/merchants and manufacturers also contributing significant
proportions. In long-dated contracts, growth stems from an even wider set of participants with
hedge funds, commodity swap dealers, floor brokers, dealer/merchants and producers each
contributing substantially.
Notably, this period of significant market growth coincides with changes in the
fundamental relation between futures prices at different maturities as well. More specifically, we
find that prices of nearby, one- and two-year futures contracts first become statistically
significantly co-integrated in July, 2004 and have remained significantly linked through mid-
2006 (the end of our study period). We provide evidence that this pricing convergence is linked
to the growth in the market activity of dealer/merchants, hedge funds and commodity swap
dealers in the one- and two-year contracts. For example, we attribute the growth in hedge fund
trading, which is mainly in the form of calendar spread trading, to be significantly responsible
for the pricing convergence.4 We hypothesize that dealer/merchants, hedge funds and commodity
swap dealers convey information from clients and swap markets to the futures market and
provide competition for order flow in these contracts which enhances price discovery and
linkages between these market prices.
The development of price co-integration across contracts could allow traders to hedge
and arbitrage across futures contracts more effectively. The significance of this development
cannot be overstated, since the lack of derivative market integration can lead to poor market
liquidity and detrimental outcomes for traders who might rely on its existence for price discovery
and hedging purposes. For instance, in the early 1990s, when the vast majority of exchange-
4 For example, according to the CFTC’s January 23rd 2007 COT report spread trading by Non-Commercial traders – a category dominated by hedge funds (see Haigh, Hraniova and Overdahl (2007)) accounted for 28.4% of all open positions, whereas outright long and outright short trading by the Non-Commericals contributed just 8.4% and 6.5% of total open interest respectively.
3
traded crude oil futures had a maturity of less than four months, Metallgesellschaft AG lost over
$1.3 billion while executing a hedging strategy that went awry. Contributing to these losses was
the company’s inability to hedge long-term oil delivery commitments with a matching-maturity
portfolio of futures contracts and its inability to efficiently roll over large short-term positions
without experiencing large price impacts.5
As the Metallgesellschaft case illustrates, limitations in the maturity structure of
commodity futures markets can be a significant impediment to implementing effective hedging
strategies. Therefore, our results document that the growth in dealer/merchants, hedge fund and
commodity swap dealer participation during the past few years marks an important milestone in
the development of longer-term futures markets. Furthermore, our results provide empirical
support for the notion that greater participation by specific types of traders, such as arbitrageurs,
help to alleviate price discrepancies as modeled by Basak and Croitoru (1996).
Our results linking market development to the participation of specific traders is
important for academics who have written at length about the market impact of different types of
traders, risk management and speculative strategies, price discovery, and commodity forward
pricing curves. We show that specific trader types, particularly financial traders who may have
little vested interest in the underlying commodity, can add important dimensions toward
integrating derivative markets and making markets in general more informationally efficient.
The fact that increased arbitrageur and swap dealer activity explains much of the convergence in
nearby, one- and two-year futures prices complements evidence in Roll et al. (2006) that market
liquidity is related to the efficacy of arbitrage activities.
Our results are also crucial for policy makers, who look to futures prices as reliable
indicators of market expectations when implementing monetary and fiscal policies. We show
that futures prices at various contract horizons can display varying degrees of reliability,
depending not only on overall market activity but also on the types of trader types taking
positions in the contracts. Policy makers also make decisions that affect the development of
5 See Culp and Miller (1995) and Marthinsen (2005) for discussions of Metallgesellschaft AG’s energy-derivatives trading.

4
derivatives markets.6 Our results provide evidence that longer-term futures contracts have been
developing organically in the competitive market. Our results also demonstrate a strong link
between the trading positions taken by specific categories of traders and the price linkages
between futures contracts.
The remainder of the paper proceeds as follows. Section II places our contribution within
the related academic literature. Section III describes the data. Section IV documents significant
changes in the term structure of the crude oil futures market since 2000. Section V analyzes the
impact of those structural changes on futures pricing. Section VI concludes.
II. Related Work
A number of papers have used the publicly-available CFTC’s Commitment of Traders
(COT) reports, mostly to shed some light on speculative and hedging activity in futures markets.7
Our analysis highlights two limitations of these reports. First, they are highly aggregated, in that
they only differentiate between two broad categories of traders (“commercial” vs. “non-
commercial” categories) that are rather heterogeneous. In the case of WTI crude oil futures, the
“commercial trader” group includes such diverse participants as commodity swap dealers, oil
manufacturers, oil producers, and commercial dealers. One would expect these various sub-
categories to hold different types of positions – and our analysis confirms this intuition. Most
strikingly, as we illustrate later in the paper, whereas the commercial category as a whole is
typically net short in near-months (<3 months) oil futures, we document that one of the
commercial sub-categories (commodity swaps dealers) almost always holds a net long position
in near-month contracts. In the first half of 2006, for instance, commercial traders as a whole
were on average net short (-) 56,540 contracts. This aggregate figure, however, was the sum of a
net long position of (+) 90,140 for commodity swaps dealers and a short net position of (-)
146,680 contracts for all the other commercial sub-categories. Second, the publicly available
reports do not break down activity at different maturities, which obscures possible differential
6 As evidence of policy maker interest, we note that the United States Congress has held a number of hearings in the last two years on the topics of energy prices and volatility in oil markets. Likewise, the International Monetary Fund (IMF) has been devoting entire chapters of its high-profile, semi-annual World Economic Outlook to the implications of increasing energy prices and volatility for the macroeconomy (IMF (2005, 2006)). 7 See, e.g., Hartzmark (1987, 1991); Bessembinder (1992); Leuthold, Garcia & Lu (1994); Chang, Chou & Nelling (2000); de Roon, Nijman & Veld (2000); Wang (2003); Piazzesi & Swanson (2006); and references cited therein.

5
evolutions at the near- and far-ends of the market. Identifying such divergences is a major
element of the present study.
To our knowledge, the only papers providing some evidence on the maturity structure of
oil (or any commodity) futures markets are Neuberger (1999) and Ederington & Lee (2002).8 In
the process of rationalizing the use of short-maturity contracts to hedge long-term oil price risk,
Neuberger (1999) provides some summary data on crude-oil futures market activity at different
maturities from 1987 to 1994. Although the NYMEX first successfully introduced futures
contracts on WTI light sweet crude oil in 1983, contract maturities beyond 12 months did not
exist until 1989. By 1994, contracts had become available with intermediate maturities (up to 3
years), but Neuberger states that, “even in the last two years of that dataset, only 3% of the
contracts traded had a maturity beyond 1 year” (p. 438). One of only a handful of papers using
the disaggregated (non-public) version of the CFTC’s COT data is Ederington & Lee (2002)
who analyze heating-oil NYMEX futures position from June 1993 to March 1997 to document
trading patterns across various types of traders in that market.9 For their sample period, monthly
expiration dates were available up to 18 months into the future, yet they find that large traders in
their sample held 40.2% of their open interest in the upcoming winter months and 71.4% in the
shortest-three maturity contracts. In sum, both the Neuberger and Ederington and Lee paper’s
provide evidence consistent with the idea that prior to recent years there was precious little
activity in far-month oil futures contracts.
Certainly, crude-oil futures with maturities of up to seven years have been available since
1999. However, using data between 1999 and 2002, Lautier (2005) finds that short-, medium-
and long-term crude oil futures were priced during that time period as if these contracts traded in
segmented markets.10 More generally, the view that longer-term futures may be too illiquid to be
useful for hedging purposes has remained a piece of conventional wisdom in many policy circles
(where, amidst a generalized rise in energy prices, questions have been raised on how to
8 Many studies, in contrast, tackle the issue of the term structure of futures prices. See, e.g., Routledge, Seppi & Spatt (2000) and references cited therein. Litzenberger & Rabinowitz, 1995 investigate the theory and empirical evidence behind backwardation in oil futures markets. 9 The other studies are Chang, Pinegar & Schachter (1997); Weiner (2002); and, Haigh, Hranaiova & Overdahl (2007). Those studies focus mostly on identifying the impact of various types of “non-commercial” traders (as opposed to “hedgers”) in some specific futures markets. 10 See also Pilipović, 1998; Simon and Lautier, 2005; and references cited therein.

6
stimulate the growth of long-term hedging markets) as well as in academic circles (where papers
devising short-term hedging strategies for long-term price risk remain predicated on the notion
that long-maturity contracts, if at all available, are still highly illiquid – see, e.g., Veld-
Merkoulova and de Roon, 2003). A key contribution of our study is to show that, since 2004,
this conventional wisdom no longer applies in that (i) market activity in long-dated contracts (>3
years) now routinely exceed typical levels of activity in short-term (<3 months) contracts just a
few years ago and (ii) the prices of nearby and far-month contracts have become co-integrated.
The present paper is also part of a large literature on the role of specific categories of
traders in financial markets. Hedge funds, in particular, have drawn a lot of attention from
academics, investors, regulators, and the general public in recent years. Much of this scrutiny
has focused on the concern that speculators, such as hedge funds, might exert a disproportionate
and destabilizing effect on financial markets, which could ultimately lead to higher trading
costs.11 Brunnermeier and Nagel (2004) find that hedge funds did not exert a correcting force on
stock prices during the technology bubble. Haigh, Hranaiova & Overdahl (2007) document that
hedge fund activity does not affect prices in energy futures markets but hedge funds are vital to
the functioning of the market through the liquidity they provide to other participants. By contrast
to these papers, our pricing analysis deals with the impact of various categories of traders on the
linkages between markets rather than on the absolute price levels in a single market.12 Still, our
results complement the research in that we find that hedge fund activity was beneficial to price
discovery in the sense that their trading activity assists in bringing in line the prices of crude oil
futures at different maturities.13
Our analyses indicates that commodity swap dealers/arbitrageurs are instrumental in co-
integrating nearby, one- and two-year crude oil futures prices. Indeed, U.S. investors have
greatly increased their exposure to commodity prices through commodity index investing in the 11 Chan, Getmansky, Haas and Lo (2005) provide a concise review of the large academic literature on hedge funds. The evidence on whether funds are destabilizing is mixed. For example, Fung and Hsieh (2000) argue that funds exerted a significant market impact during the European Exchange Rate Mechanism (ERM) crisis in the early 1990s. By contrast, Choe et al. (1998), Fung et al. (2000), Goetzmann et al. (2000) and others conclude that hedge funds were not responsible for the Asian crisis in the late 1990s. 12 Haigh, Hranaiova & Overdahl (2007) also abstract from the questions related to the maturity structure of trader positions that are at the heart of our analysis. 13 Our study is also part of a literature interested in who trades derivatives, and why. Examples include Ederington and Lee (2002) in the case of heating oil futures markets, and Evans and Lyons (2005) in the case of foreign exchange derivatives.

7
last several years, and some of that exposure has found its way into futures markets. We
document the growth in market activity by commodity swap dealers/arbitrageurs, and show
empirically that this growth helps explain the improving price discovery between nearby, one-
and two-year futures contracts. These findings complement recent academic research on
possible advantages of investing in commodity futures markets (e.g., Erb and Harvey, 2006;
Rouwenhorst and Gorton, 2006); the theoretical results of Basak and Croitoru (2006) on the role
of financial traders with respect to price efficiency; and, the empirical finding that liquidity and
the efficacy of arbitrage activities are related (Roll et al. (2006)).14 III. Data
We analyze daily position and pricing data for NYMEX light sweet crude oil (West
Texas Intermediate grade, henceforth WTI) futures and options on futures contracts from the first
week of January 2000 through the first week of May 2006. The position data compiled for this
study originate from the CFTC’s Large Trader Reporting System (LTRS). Specifically, to help it
fulfill its mission of detecting and deterring futures market manipulation, the CFTC’s market
surveillance staff collects position-level information on the composition of open interest across
all futures and options-on-futures contracts for each market. These data must be filed daily by
traders whose positions meet or exceed the CFTC’s reporting threshold. For the WTI oil futures
and options market in our sample period, this threshold has been 350 contracts since May 16,
2000; prior to that date, it was 300 contracts. Many other similar positions are voluntarily
reported and are included in the database. We find that more than 90% of all WTI futures
positions end up being reported to the CFTC during our sample period.
The CFTC receives information on individual positions for every trading day. However,
here we focus on the Tuesday reports, for two reasons. First, and most importantly, the Tuesday
data are those which the CFTC summarizes in the weekly Commitment of Traders (COT) Report
that it makes available to the public every Friday at 3:30 p.m. Consequently, our findings are
14 Improved price discovery (shown through increased cointegration) and risk transfer are closely related (see Mattos and Garcia (2006)) and our results would suggest that increased cointegration in the crude oil market should lead to improved hedging opportunities.

8
directly comparable with those of the large number of extant studies that rely on COT data.15
Second, perhaps because the Tuesday reports are publicly available, they receive particular
attention within the Commission in terms of reconciling conflicting or erroneous reports.
A. Publicly Available Data When the CFTC publishes its crude oil COT report, traders are pooled into two broad
categories – “Commercial” and “Non-commercial.”16 The CFTC classifies all of a trader's
reported futures positions in a given commodity as commercial if the trader uses futures
contracts in that particular commodity for hedging as defined in (the CFTC's) regulations. A
trading entity generally gets classified as ‘commercial’ by filing a statement (with the CFTC)
that it is commercially ‘engaged in business activities hedged by the use of the futures or option
markets.’ In order to ensure that traders are classified with accuracy and consistency, the
Commission staff may exercise judgment in re-classifying a trader if it has additional
information about the trader’s use of the markets (CFTC, 2004). ‘Non-commercials’ comprise
many types of mostly financial traders, such as hedge funds, mutual funds, floor brokers, etc., as
well as those traders whose positions have been reported event though they are not registered
with the CFTC under the CEA.
Table 1 shows the type of information contained in the publicly-available weekly COT
reports of the WTI futures market and, while doing so, gives a snapshot of the overall growth of
this market since 2002. For the third week of July each year, Table 1 shows the open interest in
WTI light sweet crude oil futures and futures-equivalent (delta-adjusted) options positions for
commercial (left panel) and non-commercial (right panel) traders. For each category and each
year, the long and short “positions” are reported as fractions of the overall weekly open interest.
For example, on the short [long] side of the 773,500 open interest on July 16, 2002, 67.2%
[59.3%] of all positions were held by commercial traders and 1.5% [7.6%] were held by
15 A minor difference is that the large trader datasets we use includes all positions reported to the CFTC by reporting firms – even those positions of traders small enough that they have no regulatory obligation to do so. In other words, even our aggregate data are a bit more precise than the publicly available ones. A second difference is COT frequency, which is less than weekly in studies using pre-2000 data. Precisely, starting in 1962, COT data were compiled on an end-of-month basis and published on the 11th or 12th calendar day of the following month. The CFTC switched to mid-month and month-end reports in 1990; to every 2 weeks in 1992; and, to weekly in 2000. 16 COT reports also provide data on the overall long and short positions of non-reporting traders (NRP), which are the differences between the overall open interest and, respectively, the long and short positions of reporting traders.
9
reporting non-commercial traders, with the rest split between 24.3% in spread positions (i.e.
calendar spread positions constructed with both long and short futures positions) by reporting
non-commercial traders and 7% [8.8%] in short [long] positions held by non-reporting traders.
Table 1 shows that open interest has more than doubled during that period, from less than
800,000 contracts in 2002 to more than 1.7 million contracts in 2006 (each contract is for 1,000
barrels of oil, or approximately $75,000 at mid-2006 prices – so that July-2006 open interest
stood at more than $112 billion in notional value outstanding).
B. LTRS Data Whereas the publicly available data only identify the commercial and non-commercial
categories for crude oil, the data provided for this study break down these two very broad
categories into their respective components. That is, each reporting trader is classified into one
of the trader groups in the CFTC’s large-trader reporting system (LTRS). Table 2 provides a list
of these groups or sub-categories. Table 2.A provides a list of the ‘commercial’ sub-categories,
while Table 2.B provides a similar decomposition for the ‘non-commercial’ category. In both
Tables 2.A and 2.B, we highlight (in bold) which sub-categories are active in the crude oil
market.
1. Commercial Sub-Categories In Table 2.A, the main sub-categories are “dealer/merchant”, which includes wholesalers,
exporter/importers, crude oil marketers, etc.; “manufacturer”, which includes refiners,
fabricators, etc; “producer”, a self-explanatory grouping; and “commodity swap dealers”,
gathering all reporting swap dealers as well as arbitrageurs/broker dealers (financial swap dealers
and arbitrageuers/broker dealer sub-categories were merged with commodity swap dealers
partway through our sample data).17
Traders in the dealer/merchant, manufacturer and producer sub-categories are sometimes
referred to as “traditional” hedgers. The commodity swap sub-category, whose activity we will
see has grown significantly since 2000, incorporates the positions of “non-traditional” hedgers,
17 Haigh, Hranaiova & Overdahl (2007) identified, for the time period August 2003 – August 2004 in the WTI futures market, 27 commodity swap dealers, of which only one was an arbitrageur/broker dealer and only one was a financial swap dealer.

10
including “entities whose trading predominantly reflects hedging of over-the-counter (OTC)
transactions involving commodity indices—for example, swap dealers holding long futures
positions to hedge short OTC commodity index exposure opposite institutional traders such as
pension funds” (CFTC, 2006).
2. Non-Commercial Sub-Categories In Table 2.B, the most active sub-categories are “floor brokers & traders”, a group
including all reporting floor brokers and floor traders; and “hedge funds”, which comprise all
reporting commodity pool operators (CPOs), commodity trading advisors (CTAs), “associated
persons” (APs) controlling customer accounts as well as other “managed money” (MM) traders.
Despite these clear distinctions in groups that comprise ‘hedge funds”, a point of terminology is
in order at this stage. Hedge fund activity in energy derivatives markets has been a subject of
intense scrutiny in recent years by academic researchers, market participants, policy makers and
the media. However, there is no accepted definition of a “hedge fund” in futures markets, and
there is nothing in the statute governing futures trading that defines a hedge fund. Furthermore,
there is nothing that requires hedge funds to be categorized in the LTRS. Still, many hedge fund
complexes are either advised or operated by CFTC-registered CPOs and/or CTAs and APs who
may also control customer accounts. Through its LTRS, the CFTC therefore obtains positions of
the operators and advisors to hedge funds, even though it is not a requirement that these entities
provide the CFTC with the name of the hedge fund (or another trader) they are representing.18 It
is clear that many of the large CTA’s, CPO’s, and APs are considered to be hedge funds and
hedge fund operators. Accordingly, we will conform to the academic literature and to common
financial parlance by referring to these three types of institutions collectively as “hedge funds.”
In addition, for the purposes of this paper, market surveillance staff at the CFTC also identified
18 A commodity pool is defined as an investment trust, syndicate or a similar form of enterprise engaged in trading pooled funds in futures and options on futures contracts. A commodity pool is similar to a mutual fund company or any investment company in the security industry, except that it invests pooled money in the futures and options markets. Like securities counterparts, a commodity pool operator (CPO) might invest in certain markets, such as financial markets, like foreign currency or treasury bonds, or commodity markets like wheat, coffee and feeder cattle. Unlike operators of mutual funds, however, commodity pools may be either long or short derivative contracts. The principle objective of the CPO is that it provides smaller investors the opportunity to invest in futures and options markets with greater diversification while at the same time having access to professional trading management. The CPO is the entity that solicits funds from others for the purpose of pooling the funds for use in investing in futures and options on futures interests. The commodity-trading advisor (CTA) actually manages the accounts and funds invested in the CPO and is the equivalent of an advisor in the securities world.

11
other participants who were not registered in any of these three categories but were known to be
managing money and so these were also included in the hedge fund category (see bottom of
Table 2). Finally, NR represents those traders that have not yet been categorized or do not fit
any other category. “Non-reporting participants” are reporting traders who are not registered
under the Commodity Exchange Act (CEA).
We use LTRS data on both futures and options positions. Because our goal is to provide
a picture of the overall market for exchange-traded crude oil derivatives, all of the results we
report are for the sum of the futures and futures-equivalent (i.e., delta-adjusted) options positions
– both short and long. The options positions account for approximately 25% of the total market,
and we obtain qualitatively similar conclusions for changes in futures only (not reported)
although available.
IV. Large Trader Positions
For each group of traders, we use three measures of the group’s daily positions to assess
changes in the market. (i) We start with the net position of each group’s daily net position, which
may be short (-) or long (+). To provide a clear overall picture, we present annual or monthly
averages of those daily figures in Figures 1-3 and discuss those exhibits in Section IV.A. (ii) To
the extent that most traders hold different types of positions (long or short) at different maturities
and at different points in time, the mere averaging out daily positions is bound to understate the
extent of the futures market growth. In Section IV.B, we therefore carry out a similar analysis –
but after first taking the absolute value (+) of each position. That is, we take the absolute value,
every day, of the net position in each contract for each trader category; we then sum up these
absolute values appropriately (e.g., for all commercial groups, for all positions less than 3
months, etc.), and compute the various monthly or annual averages. Table 3 and Figures 4-6
provide either annual or monthly averages of those daily figures. Whereas the analysis of
Section IV.A tells us about the direction of different traders’ positions during sample sub-
periods, the analysis in Section IV.B provides us with an idea of the magnitude of these
positions.19
19 The absolute values computed in Section IV.B capture market growth for traders who have an underlying hedging motive and, hence, hold mostly outright (long or short) positions. To the extent that many non-commercial traders

12
A. Net Positions
From Table 1, we see that the net positions (long – short) of commercial and non-
commercial traders range from -3.7% (2005 commercial positions) to 9% (2003 non-commercial
positions) of the open interest across all contract maturities. Figure 1 provides a more complete
picture, by breaking down annual average net positions by contract maturity for commercial and
non-commercial traders, while Figures 2 and 3 provide a further disaggregation by trader type.
All three Figures are drawn based on the net daily positions in each contract for each trader
category. For each trading day in the sample period, we sum up the net positions appropriately
(e.g., for all commercial groups, or for all positions less than 3 months, etc.), and then compute
the relevant annual (Figures 1-2) or monthly (Figure 3) averages.
1. Net Positions for Commercial and Non-Commercial Traders – Broad Changes since 2000
Figure 1 shows the evolution of annual average daily net positions of commercial and
non-commercial traders over time. Several patterns emerge from the Figure. First, and least
surprising, is the fact that non-commercial and commercial traders on average take opposite-
direction positions. As shown in Section IV.B, the difference is made up of small (non-
reporting) traders, who comprise about 12% of the market at short maturities (<3 months) but
only 3% of the market at long maturities (>3 years).
Second, one cannot generalize from the fact that, in the three near-month contracts,
commercial traders are typically net short (-) whereas non-commercial traders are generally net
long (+). Instead, the direction of the two groups’ respective net exposures varies with contract
maturity, period of observation, etc. Whereas non-commercials generally have long (+) net
positions on average, especially in the three nearest-months contracts, they also tend to hold
short (-) positions in contracts with maturities beyond 4 or 5 years. Another example is found in
2001, when commercial traders (i.e., “hedgers”) were net long (+) near-months contracts, with
hold spread positions (i.e., are long at some maturity and short at another), however, it should be helpful to also have a measure of the open interest, in each contract maturity, for each trader category. This is beyond the scope of the current paper.

13
their average net short (-) position that year approximately equal to one third of their average net
long (+) position the following year.
Third, the annual average net positions of both of these two broad categories (commercial
and non- commercial traders) have more than tripled since 2000, averaging approximately
60,000 contracts a day that is each Tuesday in 2006.20 These growth rates are impressive in their
own right. They also hide a large amount of heterogeneity among different types of commercial
trader. These variations are the topic of the next subsection.
2. Trader Heterogeneity
Figure 2 provides a vivid illustration of the heterogeneity of trader participation within
the broad commercial group. Most strikingly, whereas the commercial category as a whole is
typically net short (-) in near-months (<3 months) crude oil futures, we see that one of the
commercial sub-categories (commodity swaps dealers which include commodity index traders)
almost always holds a net long (+) position in near-month contracts. From January 1st to May
9th 2006, for example, commercial traders as a whole were on average net short 56,540 (-)
contracts. However, this aggregate figure was the sum of an average net long position of 90,140
(+) for commodity swaps dealers and of an average net short position of 146,680 (-) contracts for
all the other (i.e., for the traditional) commercial sub-categories.
Figure 3 provides information similar to, but more detailed than, that in Figure 2. Figure
3 shows the monthly (rather than annual) average daily net positions in futures and adjusted (i.e.,
futures-equivalent) options positions, by contract maturity, of the four most important
commercial trader types: dealer/merchant, manufacturer, producer, and commodity swaps dealer.
The daily net positions in each contract for each reporting trader are summed up (e.g., for all
contracts with less than 3 months until maturity, etc.), and the monthly averages are then plotted.
The graphs are scaled to allow for easy comparisons of the relative sizes of the net positions held
by different trader categories. Two patterns readily emerge. First, all of these trader types have
20 The apparent drop in net positions between 2004 and 2006, which is most obvious for the near-months contracts, is an artifact of the change in composition of this broad category discussed in Section IV.A.2. Figure 4, drawn in a similar fashion to Figure 2 but with the absolute values of net positions, shows continuous growth between 2001 and 2006.

14
held both short (-) and long (+) net positions in at least some months of the sample period, in
contracts of all maturities. This finding indicates that one ought to be careful when trying to
make generalizations about the positions held by any given trader category. Second, for most
trader categories, while the magnitude of their net positions (be they long or short) in short-term
contracts has increased over the course of the sample period, the most dramatic change is the
quintupling of net positions taken by commodity swap dealers. B. Market Growth
While the growth in market activity is apparent in Figures 1-3, the growth is partly
obscured in these figures by the periodic changes in the direction of the net positions taken by
various types of traders. That is, when these successive net long (+) and short (-) positions are
averaged, the resulting picture could understate the actual growth of the market.
To tackle this issue, Figures 4, 5 and 6 as well as Table 3 carry out a similar analysis
using the absolute values of daily trader positions. In these Figures and in Table 3, we first take
the absolute value of the daily net positions in each contract for each trader group, then sum up
the resulting numbers appropriately (e.g., for all positions less than 3 months, etc.), and finally
compute annual or monthly averages. Because net positions make up a relatively constant
fraction of open interest for all contract maturities and across the sample period (ratios not
reported here), these figures provide a useful indication not only of the magnitude of the net
positions but also of the market as a whole.
Figure 4 shows continuous market growth between 2001 and 2006, with the largest
proportional increases at maturities less than 3 months and more than 3 years. Figures 5 and 6,
together with Table 3, provide additional details of those changes, and allow us to make several
observations.
(i) First, commodity swap dealers’ net positions increased by an order of magnitude,
from just over 10,000 contracts in 2000 to almost 100,000 contracts in 2006. This massive
growth started in 2002, and accelerated sharply from mid-2004 onward.
(ii) Second, Figure 5 illustrates that almost all large-trader categories at the end of our
observation period carry aggregate net positions in long-term (>3 years) contracts that are

15
comparable in magnitude to their analogous positions in short-term (<3 months) contracts prior
to 2003.21 Precisely, for five out of the six major large trader categories in the crude oil futures
market (commodity swaps dealers; hedge funds; commercial dealers/merchants; commercial
producers; and, floor brokers and traders), there are at least some months in 2006 when the
category’s average daily net position in long-term contracts exceeded the corresponding figure
for short-term contracts in at least some month prior to 2003. As Table 3 shows, the average
absolute value of daily net trader positions in 2006 even exceeds the corresponding figures for
the entire year 2000, in the case of swap dealers and floor brokers and traders.
(iii) Third, there are some exceptions to the overall increases in trader participation at
longer maturities. One is commercial oil manufacturers (refiners, fabricators, etc.), a category
that holds large net positions in short-term futures contracts but virtually none at long maturities.
Another exception is small traders (those with individual positions small enough that they do not
report their positions to the CFTC large-trader database), who account for approximately 12% of
net positions in near-term contracts but for only 3-4% of net positions in long-term contracts.
Fourth, the strongest market growth has taken place at contract maturities of less than 3 months
and more than 3 years. By comparison, net trader positions in intermediate-maturity contracts
have grown relatively less.
(iv) Finally, most of the growth of net positions in long-term (>3 years) contracts has
taken place since the end of 2003.
In the next Section, we investigate whether this market growth in general, or some of its
aspects, has had consequences for pricing and price discovery in the benchmark market for crude
oil futures.
V. Pricing
Price discovery and risk transfer are critical functions performed by futures markets.
Garbade and Silber (1983) show theoretically that risk transfer and price discovery are
interrelated, and that the ability of a market to simultaneously perform these functions depends
on the strength of the linkage between the derivative markets and the markets underlying those
21 Alhough, as discussed in Section IV.A, not always similar in direction.

16
derivatives. These authors illustrate that trading provides the linkage between cash and futures
prices, leads to a closer correlation between the prices, to a more efficient transmission of
information, and to improved hedging opportunities. A natural question is whether the growth in
futures market activity that we documented in Section IV has had consequences for the pricing
of crude oil futures and, consequently, the ability to better manage risk. Intuitively, price
discovery should improve in markets as they become less thinly traded. In this Section, we focus
on identifying changes in the relationships between the prices of futures contracts at different
maturities. Specifically we focus on the prices of the near-month, 1-year and 2-year futures
contracts.22
A. Methodology
A large volume of research has attempted to evaluate the degree of interconnectivity
between prices from different markets employing time-series techniques that are appropriate for
non-stationary and co-integrated data. In particular, much work on applied co-integration
analysis has relied on Johansen’s multivariate approach (Johansen, 1988, 1991; Johansen and
Juselius, 1990).
Simply stated, assume an n-dimensional vector of non-stationary time series, tY , (n = 3
here – nearby, one-year and two year contract). Assuming all variables are non-stationary and the
existence of co-integration, then the data generation process can be written (Johansen and
Juselius, 1990) as an error-correction representation as follows:
∑−
=−− +Π+∆Γ=∆
1
11
k
ittitit YYY ε . (1)
Equation (1) is a Vector AutoRegression (VAR) (in first differences) with the short run
parameters being captured by the Γi matrix, and the inclusion of the lagged-level component,
which is commonly known as the Error Correction Term. The combination of these two is
known as the Error Correction Model (ECM). There are three cases of interest. First, if Π is full
22 In this paper, we focus on nearby month, 1-year and 2-year futures because over this period of time monthly contracts are traded out 2 years enabling us to create rolling daily positions at these different maturities while at the same time ensure the one year interval between the maturities remain constant.

17
rank, then tY is stationary in levels – and, indeed, a VAR in levels is an appropriate model.
Second, if Π has zero rank, implying it contains no long run information and the appropriate
model would be a VAR in first differences and third, if the rank of Π is a positive number r and
is less than p there exist matrices β and α with dimensions p x r such that Π is a (3x3)
coefficient matrix that may be factored as 'αβ . The β matrix is a matrix of co-integrating
parameters and the matrix α is a matrix of weights (commonly known as the speed of
adjustment parameters) with which each co-integrating vector enters the n equations. Hypothesis
tests can conveniently be conducted on these matrices. Assuming non stationary oil futures
prices, we can examine the long run relationships between the contract maturities by determining
the number of co-integrating vectors, r as follows:
H1(r): Π = 'αβ (2)
The trace test (Johansen, 1991) is conducted to determine r. The null hypothesis for the trace
test is that there are most r (0 ≤ r ≤ p) co-integrating vectors.
To examine the stability of the long and short run relationships between nearby and
distant futures markets for crude oil in this paper, we apply recursive co-integration techniques
(Hansen and Johansen, 1993, 1999). These techniques allow us to test for the level of co-
integration between price series during our sample period. The recursive technique allows us to
recover two ECM representations. In the “Z-representation,” all the parameters of the ECM ( β
and α ) are re-estimated during the recursions, while under the “R-representation” the short-run
parameters (α ) are kept fixed to their full sample values and only the long run parameters ( β )
are re-estimated.
In this study, we define tY as composed of three elements, which represent the nearby,
one year and two year price series for crude oil futures. Under both of these representations, we
perform the trace tests to visually inspect the time path of the statistics to identify any changes to
the co-integrating relationships amongst the price series. From equation (1) the Trace test is
calculated as

18
Tracej = ˆln(1 ),p
ii j
T λ=
−∑ j = 1,…, p-1, (3)
and each statistic is scaled by the 90% quantile of the trace distribution derived for the selected
model.
B. Estimation of the Error Correction Model
We use Tuesday settlement prices from January 4, 1999 through May 9, 2006, provided
by Bridge CRB, for the near-month (or “Nearby”), one-year out and two-year out WTI crude oil
futures contracts. The first year of data (52 weeks) is utilized to start the cointegration modeling
(in particular, the recursive analysis) so that the price and position samples match the starting
date for our position sample, i.e., January 4, 2000.
Table 4 provides summary statistics of these three price series between January 2000 and
May 2006. It is worth noting that the maximum of each of these price series are roughly seven
times larger than the corresponding minimums which reflects the increase in oil prices during our
sample period.23
In order to implement our Error Correction Model, we first check the order of integration
of each of the price series within the futures maturity spectrum. As can be seen from Table 5,
each series is integrated of the first order confirming that the analyses will be conducted on the
differenced price series. We then estimate the ECM using the maximum likelihood technique
outlined by Johansen and Juselius (1990). The lag length order was selected based on lag
reduction statistics and 8 lags were deemed to be the optimal lag length.24
Table 6 presents the decision rule based on the trace tests for the number of co-
integrating vectors. We first fail to reject the null hypotheses on r ≤ 1. At p = 0.079 there 23 The simple unconditional correlations between the three price series are greater than 0.95, which suggests a close link between the series. We also analyzed the correlation between spot price data and the three futures prices series. The unconditional correlation between spot prices and nearby, one year and two year contracts are 0.999, 0.98 and 0.97. Consequently given that spot prices and nearby prices are effectively identical we infer that using spot instead of nearby prices would yield similar results. 24 These results are excluded to conserve space but are available upon request.

19
appears to be some weak evidence of the existence of two co-integrating vectors. However, to
keep the analysis tractable, we estimate our ECM with one co-integrating vector.25 We also test
the individual elements of 'β against zero in the factorization Π='αβ and investigate the
possibility of weak exogeneity of each of the series (testing whether each element of the α vector
is equal to zero) and the results are presented in the lower portion of Table 6. In particular, the
middle panel explores the possibility that one of the three series is not in the co-integrating
space. We reject the null that price i is not present in the co-integrating space for each series.
With respect to the short-run adjustment toward the long run relationships,α , we also test for
weak exogeneity on each market. For each market we test for whether or not it responds to
perturbations in the co-integrating space. Inspection of the lower panel of Table 6 suggests that
both the nearby and 1-year contracts are weakly exogenous and that the 2 year contract does all
the adjusting to the long-run equilibrium. Implications of this finding are explored below.
In order to study the development of the level of cointegration between contracts of
differing maturities we apply recursive cointegration techniques which also allows us to examine
the stability and possible strengthening of the relationship over time. This technique has been
employed in other studies (e.g., convergence across stock markets, interest rates in different
countries etc) by Bremnes et al., 1997; Diamandis et al., 2000, Yang et al., 2004, but has yet to
be been applied to price discovery in futures markets. Following Hansen and Johansen
(1993,1999), here we conduct the rank constancy test based on what is known as the “R-
representation” whereby the short-run parameters captured in the Γi matrix are held fixed to their
full sample values and only the long run parameters in equation (1) are re-estimated at each time
interval. The mathematics behind the ‘R-representation’ are excluded to conserve space and
interested readers are directed to Hansen and Johansen (1993, 1999). Recursive cointegration
analysis is conducted on the single cointegrating vector tying the three time series together and
25 Residuals from this estimated ECM seem to be well behaved. Specifically, Lagrangian Multiplier tests for first and second order autocorrelation using an auxiliary regression, as described by Godfrey (1988, Chapter 5) are conducted. We reject both orders of autocorrelation comfortably with p-values of 0.994 and 0.536 respectively. The test statistics for no conditional heteroskedasticity are rejected, but Rahbek et al. (2002) show that the rank test for cointegration is robust to moderate ARCH effects, so this appears not to be a problem in this case (these results are excluded to conserve space but are available upon request).

20
Figure 7 presents a time series plot of the normalized trace statistic (normalized by the 5% level
of significance) for each week between January 2000 and May 2006.
As shown in Figure 7, results based on recursive cointegration are far more informative
than the standard Johansen cointegration technique to the extent that they illustrate the change in
the long run relationship between the series. As can be seen from the time series plot, the 3
contract maturities were not in long run cointegration in January 2000 (the trace value was below
1) but the series tended toward 1 (moving toward cointegration) in 2002 and 2003. On the 6th
July 2004 all series became cointegrated and have essentially remained cointegrated ever since.
In addition to the time path of the trace statistic we are also able to recover the speed of
adjustment parameters (α ) for each of the series in the cointegrating vector. Each speed of
adjustment parameter measures the degree to which each variable (contract maturity price series)
responds to the deviation from the long-run equilibrium relationship. The ‘larger’ (in absolute
value) the speed of adjustment, the faster the speed of adjustment from the previous period’s
deviation from long run equilibrium. At the opposite end of the spectrum a small value implies
that the price series in question is unresponsive to last period’s equilibrium error. A speed of
adjustment equal to zero implies that a series is weakly exogenous. Thus the absence of Granger
causality for cointegrated variables requires the additional condition that the speed of adjustment
coefficient be equal to zero. As can be seen from Table 6, results suggest that both the nearby
and one year contracts are weakly exogenous, and it is the two year contract that adjusts toward
the long run equilibrium. Thus, the two year contract cannot cause changes in the nearby and
one year contract as they do not adjust to perturbations. The opposite is not true.
The recursive estimates of the speed of adjustment parameters and the 5% confidence
intervals for all three series are presented in Figure 8. As can be seen in the time series plots for
the vast majority of the time the speed of adjustment parameters for the nearby and one year
contract are statistically indistinguishable from zero. Interestingly, around the same time that the
maturities became cointegrated (mid-2004), the second year maturity speed of adjustment
parameter become statistically significantly different than zero. It has, for the most part,
remained statistically different than zero since that time.

21
C. Explaining the Convergence between Price Series
We examine the growing convergence between crude oil futures contracts more
rigorously in Tables 7 and 8. To this end, we use the trace statistic (plotted in Figure 7) as the
dependent variable and use position data from the various categories of traders as explanatory
variables. In this manner, our tests capture changes in the level of participation over time that can
be tied to the concurrent increase in the trace statistic.26
We first estimate simple regressions explaining the change in the level of cointegration
using positions scaled by the mean (long plus short positions divided by the mean) for each
category of trader independently in Table 7. We estimate several specifications, reporting the
relation between each individual trader type and the cointegration Trace statistic independently.
We report three specifications in Table 7 as follows:
Spec 1: 5 ( Year+ Year)+t tTrace Near One Twoα β ε= + +
Spec 2: 1 4( ) ( Year+ Year)+t tTrace Near One Twoα β β ε= + +
Spec 3: 1 2 3( ) ( Year)+ ( Year)+t tTrace Near One Twoα β β β ε= + +
For example, in specification 1 we use the pooled activity in all three contracts (nearby,
one-year and two-year) by trader category separately in a robust OLS regression to explain
movements in the Trace statistic. As indicated in the lower portion of Table 7, swap dealer,
hedge fund and non-reporting dealer positions appear to be significantly related to the
strengthening of the cointegration level among the different contract maturities. Notably
however, the explanatory power of swap dealer positions (with an adjusted R2 of 0.21) greatly
exceeds the explanatory power of all other trader category positions. Dealer/merchant, producer
26 Other studies employing recursive cointegration techniques attempt to explain changes in the level of cointegration over time by commenting on changes (often abrupt) in trace values using information on actual (usually one-time) events. For instance, Phylaktis and Ravazzolo (2006) explain convergence in international stock markets using information on foreign ownership restrictions and Yang, Kolari and Sutanto (2004) attribute a sudden change in cointegration levels between stock markets to the global emerging markets crisis during 1997-1998. In a similar vein to our paper, Haigh (2000) examines the development of cointegration across time but fails to link trading volume in freight futures contracts to increased cointegration levels in pricing within freight markets.

22
and floor trader positions are generally unrelated to cointegration levels whereas manufacturer
and others show some marginal contribution to cointegration over time.
Specification 2 parses out the incremental explanatory power of nearby positions from
the analysis. As shown in the middle portion of Table 7, partially disaggregating positions by
contract length uniformly increases the explanatory power of these regressions (the adjusted R2
for non-reporting traders increases by 0.43, for instance). Furthermore, positions in the nearby
contract tend to be most strongly related to cointegration over time. Aggregate one- and two-
year commodity swap dealer positions continue to explain a large proportion of the price
convergence. Aggregate one- and two-year positions are significant for most non-commercial
traders (floor traders and hedge funds) as well.
Specification 3 (upper portion of Table 7) fully disaggregates the effects of nearby, one-
and two-year contract positions across trader type. With these specifications, we continue to see
an increase in the explanatory power of most regressions. As with Specification 2, we continue
to see that positions in nearby contracts contribute significantly to cointegration for all trader
categories except dealer/merchants. Significance of one- and two-year contract positions is less
significant for most traders, except for producers and commodity swap dealers where all three
(nearby, one- and two-year) positions remain strongly related to increased cointegration among
these contracts over time.
We also estimate models based on the positions of all trader categories concurrently in
Table 8. Similar to the individual trader position regressions we estimate several specifications
that attempt to explain the development of cointegration among nearby, one- and two-year
contract prices. To illustrate, the equivalent pooled model for specification three used in the
individual regression is as follows:
Inclu
1 2 3 4
5 6 7 8
9 10 11 12
13
( ) ( Year)+ ( Year)+ ( )( Year)+ ( Year)+ ( ) ( Year)+( Year)+ ( ) ( Year)+ ( Year)
+ ( )
tTrace AD Near AD One AD Two AM NearAM One AM Two AO Near AO OneAO Two AP Near AP One AP Two
AS Near
α β β β ββ β β ββ β β ββ
= + + +
+
+
14 15 16
17 18 19 20
21 22 23 24
( Year)+ ( Year)+ ( )( Year)+ ( Year)+ ( ) ( Year)+( Year)+ ( ) ( Year)+ ( Year)+ .t
AS One AS Two FBT NearFBT One FBT Two MMT Near MMT OneMMT Two NRP Near NRP One NRP Two
β β ββ β β ββ β β β ε
+ +
+
+

23
ding multiple trader categories within the same regression adds significant explanatory power,
with the adjusted R2 for these models ranging from 0.56 to 0.75. When nearby, one- and two-
year contracts are pooled, several trader group positions are significantly linked to the
development of cointegration. Notably, commodity swap dealers have the greatest positive
influence on cointegration. Only non-reporting traders share the positive relation in pooled data.
When we disaggregate data, the influence of commodity swap dealer positions is strongly
significant in one- and two- year positions, both individually and when pooled. Commodity
swap dealer positions in the nearby contract is not significantly related to the development of
cointegration over time. However, in disaggregated data, we also find that other trader positions
are significantly related to cointegration. Notably, dealer/merchant positions in the two-year
contract, hedge fund positions in the one-year contract and non-reporting trader positions in the
nearby contract are also strongly related to the development of cointegration over time. While
these other trader groups also help to explain the convergence in the price series, commodity
swap dealer positions dominate in terms of explaining convergence, whether we focus on
disaggregated or pooled regressions.
To summarize, we find that nearby contract prices (which are highly correlated with cash
prices), one- and two-year futures prices have become more cointegrated over time primarily
because commodity swap dealers have increased positions at one- and two-year horizons. This
result holds when examining individual trader positions in isolation (Table 7) and when
controlling for all other trader positions in the market (Table 8). As such, increased commodity
swap dealer participation in crude oil futures markets over 2000-2006 has generated better price
discovery in one- and two-year futures markets. The improved linkages among these contracts
allow for better, more efficient risk management in the markets for crude oil.
VI. Conclusions
In this paper, we document major changes in the size and term structure of the benchmark
U.S. market for crude oil futures since the turn of the millennium. In particular, we document the
growth especially at the far end of the market. We show that, as recently as 2000, activity was
heavily concentrated at the near end of the maturity spectrum. Since then, overall open interest

24
has more than doubled, with trader activity at the back end of the maturity spectrum increasing
over twice as much as the market as a whole. The market growth in long-term (>3 years)
positions generally started in 2004. An analysis of the composition of traders participating in the
market shows that almost all large-trader categories (commodity swap dealers, hedge funds,
commercial dealer/merchants, commercial producers) now carry aggregate net positions in long-
term contracts comparable in magnitude to the size of their net positions in short-term (<3
months) contracts prior to 2003.
We document that, in the wake of this market growth, the prices of one-year and two-
year futures became co-integrated with the price of the near-month futures in 2004. Price
discovery and risk transfer are critical functions performed by futures markets, and the ability of
a market to simultaneously perform these functions depends on the strength of the linkage
between the derivative and underlying markets. To explore this issue, using unique position
level data we investigate, for the first known time, the question of which class of trader is
responsible for the strengthening cointegration between nearby and distant futures contracts in
crude oil. We find that the growth of activity by a class of traders, known as commodity swap
dealers, explains much of this convergence. This class of traders, more than any other, by its
trading activity allows other categories of traders to better manage risk with futures contracts
several years into the future. The major changes we document have potentially significant
implications for those interested in the effectiveness of hedges constructed with crude oil futures
and for those interested in the quality of information contained in futures prices across the term
structure.

25
References Bessembinder, Hendrik, 1992. “Systematic Risk, Hedging Pressure, and Risk Premiums in
Futures Markets,” Review of Financial Studies, 5 (4), pp. 637-67. Basak, Suleyman and Benjamin Croitoru, 2006. “On the Role of Arbitrageurs in Rational
Markets,” Journal of Financial Economics, 81 (1), pp. 143-73. Bremnes, Helge, Østein Gjerde and Frode Saettem, 1997. “A Multivariate Cointegration
Analysis of Interest Rates in the Eurocurrency Market.” Journal of International Money and Finance, 16, pp. 767–78.
CFTC, 2004. Backgrounder: The Commitments of Traders Report. Washington, DC: U.S.
Commodity Futures Trading Commission, July. Available online at: http://www.cftc.gov/opa/backgrounder/opacot596.htm CFTC, 2006. Notice Regarding Supplemental Commitments of Traders Report. Washington,
DC: U.S. Commodity Futures Trading Commission, December 5. Available online at: http://www.cftc.gov/files/cftc/cftcnoticeonsupplementalcotreport.pdf Chan, N. T., M. Getmansky, S.M. Haas and A.W. Lo., 2005, “Systemic Risk and Hedge Funds”
MIT Sloan Research Paper No. 4535-05
Chang, Eric, Ray Y. Chou and Edward F. Nelling, 2000. "Market Volatility and the Demand for Hedging in Stock Index Futures,” Journal of Futures Markets, 20 (2), pp. 105-25.
Chang, Eric C., J. Michael Pinegar and Barry Schachter, 1997. "Interday Variations in Volume,
Variance and Participation of Large Speculators Source." Journal of Banking and Finance, 21 (6), pp. 797-810.
Choe, H., B.C. Kho and R.M Stulz., 1998, “Do Foreign Investors Destabilize Stock Markets?”
The Korean Experience in 1997. Technical Report 6661, NBER Working Paper. Culp, C and M. Miller., 1995, “Metallgesellschaft and the Economics of Synthetic Storage.”
Journal of Applied Corporate Finance, 8, pp. 62 – 75. de Roon, Frans A., Theo E. Nijman, and Chris Veld, 2000. “Hedging Pressure Effects in Futures
Markets,” Journal of Finance, 55 (3), pp. 1437-56. Diamandis, Panayiotis, Dimitris A. Georoutsos and Georgios P. Kouretas, 2000. “The Monetary
Model in the Presence of I(2) Components: Long Run Relationships, Short Run Dynamics and Forecasting of the Greek Drachma.” Journal of International Money and Finance, 19 (6), pp. 917–41.
Ederington, Louis and Jae He Lee, 2002. "Who Trades Futures and How: Evidence from the
Heating Oil Futures Market," Journal of Business, 75 (2), pp. 353-73.

26
Evans, Martin and Richard K. Lyons, 2005. "Do Currency Markets Absorb News Quickly?"
Journal of International Money and Finance, 24 (2), pp. 197-217. Fung, W., and D. Hsieh., 2000, “Measuring the Market Impact of Hedge Funds.” Journal of Empirical Finance, 7, 1 – 36. Fung, W., D. Hsieh and K. Tsatsaronis, 2000, “Do Hedge Funds Disrupt Emerging Markets? In
Litan, R.E. and Snatomero, A.M., editors, Brookings-Wharton Papers on Financial Services, pages 377 – 421.
Garbade, K.D and W.L. Silber, 1983. “Price Movements and Price Discovery in Futures and
Cash Markets.” The Review of Economics and Statistics 65, pp. 289–97. Godfrey, L.G, 1998. Misspecification Tests in Econometrics. Cambridge: Cambridge University
Press. Goetzmann, W.N., S. J. Brown and J.M Park, 2000, “Hedge Funds and the Asian Currency
Crisis of 1997.” Journal of Portfolio Management, 26(4) 95 – 101. Haigh, Michael S., “Cointegration, Unbiased Expectations and Forecasting in the BIFFEX
Freight Futures Market,” The Journal of Futures Markets, 20(6), (2000): 545-571. Haigh, Michael S., Jana Hranaiova & James A. Overdahl, Forthcoming 2007. “Price Volatility,
Liquidity Provision and the Role of Hedge Funds in Energy Futures Markets.” Journal of Alternative Investments.
Hansen, Henrik and Søren Johansen, 1993. “Recursive Estimation in Co-integrated VAR
Models.” Discussion Paper, Institute of Mathematical Statistics, University of Copenhagen. Hansen, Henrik and Søren Johansen, 1999. “Some Tests for Parameter Constancy in Co-
integrated VAR Models.” Econometrics Journal, 2 (2), pp. 306-33. Hartzmark, Michael L., 1987. “Returns to Individual Traders of Futures: Aggregate Results,”
Journal of Political Economy, 95 (6), pp. 1292-306. Hartzmark, Michael L., 1991. “Luck versus Forecast Ability: Determinants of Trader
Performance in Futures Markets,” Journal of Business, 64 (1), pp. 49-74. IMF, 2005. World Economic Outlook: Globalization and External Imbalances. Washington, DC:
April. IMF, 2006. World Economic Outlook: Globalization and Inflation. Washington, DC: April. Johansen, S., 1988. “Statistical Analysis of Cointegration Vectors,” Journal of Economic
Dynamics and Control, 12, 231-254.
27
Johansen, S., 1991. ‘Estimation and Hypothesis Testing of Cointegrating Vectors in Gaussian
Vector Autoregressive Models. Econometrica, 59, 1551 – 1580. Johansen, S., & Juselius, K., 1990. “Maximum Liklihood Estimation and Inference on
Cointegration-with Applications to the Demand for Money. Oxford Bulletin of Economics and Statistics, 52, 169 – 210.
Lautier, Delphine, 2005. “Segmentation in the Crude Oil Futures Term Structure.” Finance
India, 19 (4), pp. 1303-20. Leuthold, Raymond M., Philip Garcia and Richard Lu, 1994. “The Returns and Forecasting
Ability of Large Traders in the Frozen Pork Bellies Futures Market,” Journal of Business, 67 (3), pp. 459-73.
Litzenberger, R.H., and N. Rabinowitz, 1995. „Bacwadation in Oil Futures Markets: Theory and
Empirical Evidence, Journal of Finance, 50 (5), pp 1517 – 1545. Marthinsen, John, 2005. Risk Takers: Uses and Abuses of Financial Derivatives. Boston:
Addison-Wesley. Mattos, F. and P. Garcia., 2006. “Price Discovery and Risk Transfer in Thinly Traded Markets:
Evidence from Brazilian Agricultural Futures Markets.” Review of Futures Markets, 14 (4), pp. 471-83.
Neuberger, Anthony, 1999. “Hedging Long-Term Exposures with Multiple Short-Term Futures
Contracts.” Review of Financial Studies, 12(3), pp. 429-59. Piazzesi, Monika and Eric Swanson, 2006. “Futures Prices as Risk-adjusted Forecasts of
Monetary Policy,” NBER Working Paper No. 10547. Cambridge, MA: National Bureau of Economic Research (June 2004, updated September 2006).
Phylaktis, Kate and Fabiola Ravazzolo, 2006. “Stock Market Linkages in Emerging Markets:
Implications for International Portfolio Diversification.” Journal of International Financial Markets, Institutions and Money, 15 (2), pp. 91-106.
Pilipović, Dragana, 1998. Energy Risk. McGraw Hill, New York, xiv+248 pp. Rahbek, Anders, Ernst Hansen, and Jonathan G. Dennis, 2002. “ARCH Innovations and their
Impact on Cointegration Rank Testing.” Working paper, Department of Statistics and Operations Research, University of Copenhagen, June.
Roll, Richard, Eduardo Schwartz and Avindhar Subrahmanyam, 2006. “Liquidity and the Law
of One Price: The Case of the Futures/Cash Basis,” Journal of Finance, Forthcoming.

28
Routledge, Brian R., Duane J. Seppi and Chester S. Spatt, 2000. “Equilibrium Forward Curves for Commodities,” Journal of Finance, 55 (3), pp. 1297-338.
Simon, Yves and Delphine Lautier, 2005. Marchés Derivés des Matières Premières. Economica,
Paris. 548 pp. Veld-Merkoulova, Yulia and Frans A. de Roon, 2003. “Hedging Long-Term Commodity Risk.”
Journal of Futures Markets, 23 (2), pp. 109-34. Wang, Changyun, 2003. "The Behavior and Performance of Major Types of Futures Traders,"
Journal of Futures Markets, 23 (1), pp. 1-31. Weiner, Robert J., 2002. “Sheep in Wolves Clothing? Speculators and Price Volatility in
Petroleum Futures.” Quarterly Review of Economics and Finance, 42 (2), pp. 391 – 400. Yang, Jian, James W. Kolari and Peter W. Sutanto, 2004. “On the Stability of Long Run
Relationships between Emerging and U.S. Stock Markets.” Journal of Multinational Financial Management, 14, pp. 233-48.

29
Table 1: Open Interest in Crude Oil Futures and Options, 2002-2006
Non-Commercial (%) Commercial (%) Total Open long short spread long short Interest
2002 7.6 1.5 24.3 59.3 67.2 773,550 2003 14.0 5.0 18.6 60.4 67.6 779,513 2004 11.8 4.6 19.6 62.1 68.5 1,026,123 2005 9.4 5.1 26.5 58.5 62.2 1,303,209 2006 12.1 6.3 30.9 52.5 58.3 1,706,416
Notes: Table 1 provides a snapshot of open interest changes since 2002. Open interest data are from the weekly Commitment of Traders Reports from July 16, 2002 through July 19, 2006. For each year, the snapshot is for the third week of July. We report the open interest for the sum of futures and adjusted options (i.e., total) positions of commercial and non-commercial traders. When the CFTC publishes its weekly Commitment of Traders Report, reporting traders are categorized into two broad groups: “Commercials” (left panel), who have declared an underlying hedging purpose, and “Non-commercials” (right panel), who have not. For each category, the long and short positions are reported as fractions of the overall open interest. For example, on the short [long] side of the 773,500 open interest on Tuesday, July 16, July 2002, 67.2% [59.3%] of all positions were held by commercial traders and 1.5% [7.6%] were held by reporting non-commercial traders, with the rest split between 24.3% in spread positions (i.e., calendar spread positions constructed with long and short futures positions) by reporting non-commercial traders and 7% [8.8%] in outright short [long] positions held by non-reporting traders.

30
Table 2: Large trader categories
Table 2A: Commercial Traders CFTC Code CFTC Name Present in WTI futures & options markets
18 Co-Operative AD Dealer/Merchant Y AM Manufacturer Y AO Agricultural/Natural Resources – Other Y (very small) AP Producer Y AS Commodity Swaps/Derivatives Dealer Y FA Arbitrageur or Broker/Dealer Y (merged into AS) FB Non U.S. Commercial Bank FC U.S. Commercial Bank FD Endowment or Trust FE Mutual Fund FF Pension Fund FG Insurance Company FH Hedge Fund FM Mortgage Originator FO Financial – Other FP Managed Account or Pool FS Financial Swaps/Derivatives Dealer Y (merged into AS) FT Corporate Treasurer LF Livestock Feeder LO Livestock – Other LS Livestock Slaughterer 18 Co-Operative
Table 2B: Non-commercial Traders CFTC Code CFTC Name Present in WTI futures & options markets
HF Hedge Funds Y FBT Floor Broker /Trader Y FCM Futures Commission Merchant Y (very small)
IB Introducing Broker Y (very small) NR NON-REPORTING TRADER Y
Notes: Table 2 lists the trader sub-categories in the CFTC’s large-trader reporting system (LTRS). Bolded entries are those on which most of our analysis focuses. When the CFTC publishes its weekly Commitment of Traders Report, these various sub-categories are aggregated in two broad groups: “Commercials” (Table 2A), who have declared an underlying hedging purpose, and “Non-commercials” (Table 2B), who have not. In Table 2A, “Dealer/Merchant” (AD) includes wholesalers, exporter/importers, crude oil marketers, shippers, etc. “Manufacturer” (AM) includes refiners, fabricators, etc. “Agricultural / Natural Resources – Other” (AO) may include, for example, end users. “Commodity Swaps/Derivatives Dealers” (AS) aggregate all reporting “Swaps/Derivatives Dealers” (FS) and “Arbitrageurs or Broker Dealers” (FA), two categories that were merged in the CFTC’s internal reporting system part-way through our sample period. In Table 2B, “Hedge Funds” (HF) aggregate all reporting Commodity Pool Operators (CPO), Commodity Trading Advisors (CTAs), “Associated Persons” (APs) controlling customer accounts as well as other “Managed Money” (MM) traders. “Floor Brokers & Traders” (FBT) aggregate all reporting floor brokers and floor traders. NR represents those traders that have not yet been categorized or do not fit any other category. “Non-reporting participants” (NR) are reporting trader who is not registered under the Commodity Exchange Act (CEA). Note: FH under the Commercial category includes hedge funds in financial contracts that are shown to be hedging. This category has very few participants and is not relevant to our study.

Table 3: Absolute Value of Net Positions at ≠ Maturities: Changes Since 2000
Panel A: Commercial vs. Non-commercial Categories
<3 month 3-36 months >3 years2000 2006 growth 2000 2006 growth 2000 2006 growth
Commercial 106,027 268,974 154% 192,348 203,242 6% 14,820 42,344 186%Non-commercial 34,997 76,327 118% 39,390 100,500 155% 2,222 19,352 771%
Total 141,025 345,301 145% 231,739 303,742 31% 17,042 61,696 262%
Panel B: Traditional vs. Non-traditional Commercial Traders
<3 month 3-36 months >3 years2000 2006 growth 2000 2006 growth 2000 2006 growth
Other Commercial 10,624 100,493 846% 37,917 55,691 47% 2,517 14,612 481%Traditional 95,403 168,481 77% 154,431 147,551 -4% 12,302 27,732 125%
Total 106,027 268,974 154% 192,348 203,242 6% 14,820 42,344 186%
Panel C: Individual Trader Sub-categories
<3 month 3-36 months >3 years2000 2006 growth 2000 2006 growth 2000 2006 growth
Dealers (AD) 31,709 75,836 139% 69,957 68,589 -2% 3,664 12,852 251%Manufacturers (AM) 28,678 59,365 107% 25,219 23,451 -7% 3,926 2,324 -41%
Other Commercials (AO) 3,906 6,389 64% 5,262 6,396 22% - 686 -Producers (AP) 28,862 26,891 -7% 53,337 49,115 -8% 4,707 11,870 152%
Swap Dealers (AS) 10,624 100,493 846% 37,917 55,691 47% 2,517 14,612 481%Floor Brokers (FBT) 2,913 11,237 286% 20,077 31,785 58% 720 4,145 475%Hedge Funds (HF) 26,662 43,913 65% 16,361 55,889 242% 1,019 11,198 999%
Non-Reporting (NRP) 5,422 21,177 291% 2,953 12,826 334% 482 4,009 731%Total 138,777 345,301 149% 231,082 303,742 31% 17,035 61,696 262%
Notes: Table 3 shows the yearly averages (2000-2006) of the absolute values of the net futures and adjusted options positions of commercial and non-commercial traders by contract maturity. “Commercial” traders include AD = Dealer/Merchant, AM = Manufacturer, AO = Agricultural and Natural Resource - Other, AP = Producer, AS = Commodity Swaps / Derivatives Dealer (which includes FS = Financial Swaps / Derivatives Dealer FA = Arbitrageur or Broker/Dealer). “Non-commercial” traders include FBT = Floor Broker / Floor Trader; HF = Hedge Fund; as well as, the reported positions of traders not subject to the reporting requirement and the positions of traders that have not yet been categorized or do not fit any other category. After taking the absolute value of the daily net positions in each contract for each trader group, figures are summed up appropriately (e.g., for all commercial groups, or for all positions less than 3 months, etc.), and the annual averages are then computed. Table 3 is directly comparable to Figures 4-6 below.

32
Table 4: Descriptive statistics and correlation analysis on weekly prices Nearby 1-year contract 2-year contract
Mean 34.67 32.01 30.43
Median 29.99 25.46 23.70
Standard deviation 14.01 15.33 15.07
3m 0.96 1.35 1.45
4m 0.09 0.62 0.82
Minimum 11.37 12.92 14.06
Maximum 74.61 76.96 74.07
Unconditional Correlations
Nearby 1-year contract 2-year contract
Nearby 1
1-year contract 0.98 1
2-year contract 0.97 1.00 1
Notes: Table 3 provides summary statistics of the daily settlement price series for the near-month, 1- and 2-year out WTI sweet crude oil futures contracts between 1/4/2000 and 5/9/2006. In line with the analysis of trader positions, the prices used are those for Tuesday settlements. m3 and m4 represent sample skewness and kurtosis respectively.
Table 5: Augmented Dickey-Fuller (ADF) tests for order of integration on futures prices
Test is on the estimated coefficient θ1from the following prototype model:
∑=
∆++=∆K
1kk-tk1-t10t X X X βθθ
Price Series K HO: I(1) vs. HA: I(0) ADF
HO: I(2) vs. HA: I(1) ADF
Nearby 0 -0.49 -21.59
1-yr contract 1 1.98 -22.01
2-yr contract 1 2.71 -22.50
Notes: Critical values are taken from Fuller (1976). They are –2.57 (10%), –2.88* (5%) and –3.46 (1%). Therefore, based on these results are series are I(1). The optimal lag length (K) is based on the Schwarz Bayesian Criterion (1978).

33
Table 6. Cointegration Analysis of Prices
Trace tests on order of cointegrationa λtrace test statistic HO: critical value(p-value)
45.21 r = 0 35.07 (0.002) 22.82 r ≤ 1 20.16 (0.020) 8.23 r ≤ 2 9.14 (0.076)
Tests for exclusion from the cointegrating vectorb
HO: 2
)1(χ value(p value)
Nearby Nβ = 0 1.11 (0.291)
1 yr contract 1β = 0 2.94 (0.087) 2 yr contract 2β = 0 2.99 (0.084)
Tests for weak exogeneityb HO: 2
)1(χ value (p value)
Nearby Iα =0 0.02 (0.291)
1 yr contract Bα = 0 1.20 (0.273)
2 yr contract Gα = 0 3.09 (0.079)
Notes:
a Tests are on eigenvalues with the Π matrix. The λtrace statistic is - ∑+=
−2
1
)),1ln((ri
iN λ where λi are
ordered (largest to smallest) eigenvalues on Π. bTests are based on the following: T = N(ln(1-λR) – ln(1-λU), where λR is the eigenvalue calculated with the restriction and λU the eigenvalue calculated without the restriction. Based upon these results all 3 futures appear to be a part of the co-integrating relationship (at the p = 0.08 level), and both the nearby and the 1 yr contract are weakly exogenous.

34
Table 7. Explaining the Trace Statistic with Position Data from Individual Categories
Constant
Near
1-year
2-year
1-year
+ 2-year
Near + 1-year + 2-year
2R
Dealer/Merchants 30.49*** 0.694 -2.874*** 1.240*** 0.03 Manufacturers 27.59*** 2.543** -1.568** 0.985*** 0.05
Other Ag & Nat Resource
32.30*** -2.89*** -0.24 0.38*** 0.07
Producers 26.80*** 4.25*** -2.30*** 0.80*** 0.09 Swap Dealers 17.92*** 5.68*** 7.14*** -1.17*** 0.40
Floor Brokers/Traders
22.87*** 5.30*** 0.79 0.60* 0.10
Hedge Funds 23.61*** 5.08*** 1.10* -0.24 0.16 Non-reporting 22.14*** 7.54*** 0.10 -0.21* 0.50
Dealer/Merchants 28.77*** 0.527 0.126 0.00
Manufacturers 26.65*** 2.65** 0.13 0.02 Other Ag & Nat
Resource 32.12*** -2.99*** 0.21** 0.06
Producers 25.51*** 4.17*** -0.06 0.04 Swap Dealers 21.30*** 6.34*** 0.96*** 0.35
Floor Brokers/Traders
22.98*** 5.30*** 0.640*** 0.15
Hedge Funds 23.91*** 5.20*** 0.22*** 0.16 Non-reporting 22.19*** 7.59*** -0.11 0.50
Dealer/Merchants 29.15*** 0.13 0.00
Manufacturers 29.08*** 0.159* 0.01 Other Ag & Nat
Resource 29.13*** 0.14* 0.00
Producers 29.32*** 0.08 0.00 Swap Dealers 24.45*** 1.70*** 0.21
Floor Brokers/Traders
26.57*** 1.00 0.06
Hedge Funds 28.31*** 0.42*** 0.05 Non-reporting 27.70*** 0.62*** 0.07
Columns labeled “Near”, “1-year” and “2-year” contain the parameter estimates associated with nearby, one year and two futures positions respectively. “1-year + 2-year” is associated with the sum of one and two year positions and “Near + 1-year + 2-year” reflects the pooling of nearby, one year and two year positions. *, **, and *** represent significance at the 10%, 5% and 1% levels respectively. All regressions are run using Newey-West estimators.

35
Table 8. Explaining the Trace Statistic with Position Data from Multiple Categories (1) (2) (3) (4) Constant 31.61*** 29.96*** 29.12*** 25.50***
Near -6.08*** -4.45*** -3.85*** 1-year -4.91*** 2-year 2.71***
(1-year + 2-year) -0.21
Dealer/Merchants
(Near + 1-year + 2-year) -0.75*** Near 0.04 -0.82 0.23
1-year -0.72** 2-year -0.30
(1-year + 2-year) -0.29**
Manufacturers
(Near + 1-year + 2-year) -0.45*** Near -1.49*** -0.79** -0.60*
1-year -0.08 2-year -0.44***
(1-year + 2-year) -0.29*
Other Ag & Nat Resource
(Near + 1-year + 2-year) -0.15 Near -3.57*** -2.42** -2.67***
1-year 0.12 2-year 0.01
(1-year + 2-year) -0.69***
Producers
(Near + 1-year + 2-year) -1.50*** Near 1.52 0.09 -1.33
1-year 3.88*** 2-year 3.02***
(1-year + 2-year) 3.19***
Commodity Swap Dealers
(Near + 1-year + 2-year) 5.55*** Near -0.19 -0.40 -0.66
1-year -0.07 2-year -0.28
(1-year + 2-year) -1.15***
Floor Brokers/Traders
(Near + 1-year + 2-year) -1.52*** Near -2.73*** -2.44** -2.74***
1-year 0.47*** 2-year -1.59***
(1-year + 2-year) -0.12
Hedge Funds
(Near + 1-year + 2-year) -0.413 Near 10.45*** 9.79*** 10.98***
1-year 0.21 2-year -0.96***
(1-year + 2-year) 0.10
Non-reporting
(Near + 1-year + 2-year) 0.59*** 2R 0.72 0.72 0.75 0.56
Columns labeled “Near”, “1-year” and “2-year” contain the parameter estimates associated with nearby, one year and two futures positions respectively. “1-year + 2-year” is associated with the sum of one and two year positions and “Near + 1-year + 2-year” reflects the pooling of nearby, one year and two year positions. *, **, and *** represent significance at the 10%, 5% and 1% levels respectively. All regressions are run using Newey-West estimators.

34
Figure 1: Net Positions at ≠ Maturities: Snapshot of Changes Since 2000
Average Daily NET Crude Oil Futures Positions:Non-commercial Traders
-100000
10000200003000040000500006000070000
< 3 mos
.
3-6 m
os.
6-9 m
os.
9-12 m
os.
1-2 yr
s.
2-3 yr
s.
3-4 yr
s.
4-5 yr
s.
5-6 yr
s.
>6 yrs.
2000200120022003200420052006
Average Daily NET Crude Oil Futures Positions:All Commercial Traders
-70000-60000-50000-40000-30000-20000-10000
010000
< 3 mos
.
3-6 m
os.
6-9 m
os.
9-12 m
os.
1-2 yr
s.
2-3 yr
s.
3-4 yr
s.
4-5 yr
s.
5-6 yr
s.
>6 yrs.
2000200120022003200420052006
Notes: Figure 1 shows the average annual net position of commercial and non-commercial traders by contract maturity. “Commercial traders” include AD = Dealer/Merchant, AM = Manufacturer, AO = Agricultural and Natural Resource - other, AP = Producer, AS = Commodity Swaps/Derivatives Dealer, (which includes FS = Financial Swaps / Derivatives Dealer FA = Arbitrageur or Broker/Dealer). “Non-commercial traders” include HF = Hedge Fund, FBT = Floor Broker/Floor Trader, , as well as the reported positions of traders not subject to the reporting requirement and the positions of traders that have not yet been categorized or do not fit any other category. The daily net positions in each contract for each reporting trader are summed up appropriately (e.g., for all commercial traders, for all positions less than 3 months, etc.), and the annual averages are then computed. Figure 1 is directly comparable to Figure 4 below.

37
Figure 2: Illustrating the Heterogeneity of the Commercial Trader Group
Average Daily NET Crude Oil Futures Positions:Non-commercial Traders
-20000-10000
010000
2000030000
4000050000
60000
< 3mos.
3-6mos.
6-9mos.
9-12mos.
1-2yrs.
2-3yrs.
3-4yrs.
4-5yrs.
5-6yrs.
>6yrs.
20002006
Average Daily NET Crude Oil Futures Positions:All Commercial Traders
-60000-50000
-40000-30000-20000
-100000
1000020000
< 3mos.
3-6mos.
6-9mos.
9-12mos.
1-2yrs.
2-3yrs.
3-4yrs.
4-5yrs.
5-6yrs.
>6yrs.
20002006
Average Daily Net Crude Futures + AO Positions:Swap Dealers (incl. Commodity Index Traders)
-40000-20000
020000400006000080000
100000120000140000160000
< 3mos.
3-6mos.
6-9mos.
9-12mos.
1-2yrs.
2-3yrs.
3-4yrs.
4-5yrs.
5-6yrs.
>6yrs.
20002006
Average Daily Net Crude Futures + AO Positions: Traditional Commercial Traders (AP,AM,AD)
-160000-140000-120000-100000-80000-60000-40000-20000
02000040000
< 3mos.
3-6mos.
6-9mos.
9-12mos.
1-2yrs.
2-3yrs.
3-4yrs.
4-5yrs.
5-6yrs.
>6yrs.
2000
2006
Notes: Figure 2 shows the average annual net futures + adjusted options (i.e., futures equivalent) positions of commercial and non-commercial traders by contract maturity. “Non-commercial traders” include mostly FBT = Floor Broker/Floor Trader and HF = Hedge Fund. “Commercial traders” include mostly AD = Dealer/Merchant, AM = Manufacturer, AP = Producer, and AS = Commodity Swaps/Derivatives Dealer, (which includes FS = Financial Swaps / Derivatives Dealer FA = Arbitrageur or Broker/Dealer). The daily net positions in each contract for each reporting trader are summed up appropriately (e.g., for all commercial traders, for all positions less than 3 months, etc.), and the annual averages are then computed. The bottom figures decompose the overall net position of all commercial traders between the traditional commercial categories (commercial crude oil dealers, manufacturers, and producers) and the “new kid on the block”, i.e., the Commodity Swaps/Derivatives Dealer.

38
Figure 3a: Net Positions of the Major Commercial Trader Types, 2000-2006
-80000-70000-60000-50000-40000-30000-20000-10000
010000200003000040000
2000
-01
2001
-01
2002
-01
2003
-01
2004
-01
2005
-01
2006
-01
<3mos.4-5 yrs.5-6 yrs.>6 yrs.
Net Positions in Crude Oil Futures + Options Over Time--Commercial Dealers (AD)
-100000-90000-80000-70000-60000-50000-40000-30000-20000-10000
01000020000
2000
-01
2001
-01
2002
-01
2003
-01
2004
-01
2005
-01
2006
-01
<3mos.4-5 yrs.5-6 yrs.>6 yrs.
Net Positions in Crude Oil Futures + Options Over Time--Commercial Manufacturers (AM)
-60000-50000-40000-30000-20000-10000
0100002000030000400005000060000
2000
-01
2001
-01
2002
-01
2003
-01
2004
-01
2005
-01
2006
-01
<3mos.4-5 yrs.5-6 yrs.>6 yrs.
Net Positions in Crude Oil Futures + Options Over Time -- Commercial Producers (AP)
-100000
100002000030000400005000060000700008000090000
100000110000
2000
-01
2001
-01
2002
-01
2003
-01
2004
-01
2005
-01
2006
-01
<3mos.4-5 yrs.5-6 yrs.>6 yrs.
Net Positions in Crude Oil Futures + Options Over Time -- Commodity Swap Dealers (AS)
Notes: Figure 3a shows the average monthly net futures + adjusted options (i.e., futures equivalent) positions, by contract maturity, of the four most important commercial trader types: AD = Dealer/Merchant, AM = Manufacturer, AP = Producer, and AS = Commodity Swaps/Derivatives Dealer (which includes FS = Financial Swaps / Derivatives Dealer FA = Arbitrageur or Broker/Dealer). The daily net positions in each contract for each reporting trader are summed up appropriately (e.g., for all contracts with less than 3 months until maturity, etc.), and the monthly averages are then plotted. The graphs are scaled to allow for easy comparisons of the relative sizes of the net positions held by different trader categories. Figure 3a is directly comparable to Figures 5a and 6a below.
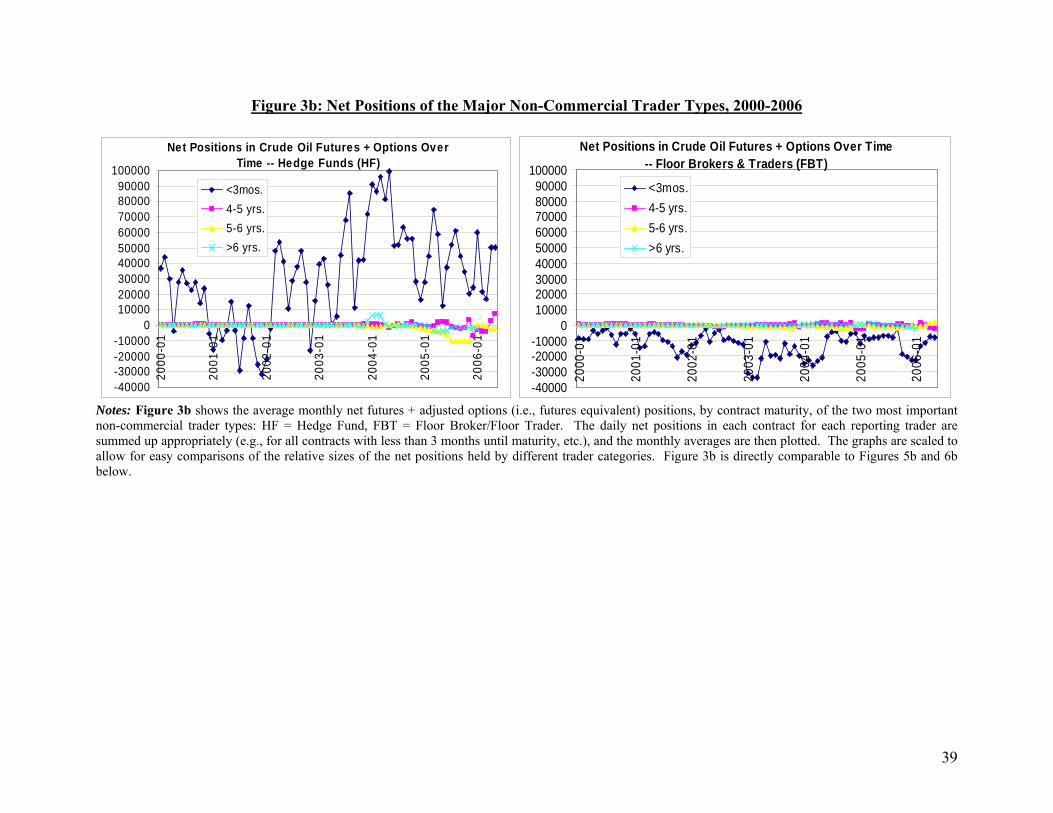
39
Figure 3b: Net Positions of the Major Non-Commercial Trader Types, 2000-2006
-40000-30000-20000-10000
0100002000030000400005000060000700008000090000
10000020
00-0
1
2001
-01
2002
-01
2003
-01
2004
-01
2005
-01
2006
-01
<3mos.4-5 yrs.5-6 yrs.>6 yrs.
Net Positions in Crude Oil Futures + Options Over Time -- Hedge Funds (HF)
-40000-30000-20000-10000
0100002000030000400005000060000700008000090000
100000
2000
-01
2001
-01
2002
-01
2003
-01
2004
-01
2005
-01
2006
-01
<3mos.4-5 yrs.5-6 yrs.>6 yrs.
Net Positions in Crude Oil Futures + Options Over Time -- Floor Brokers & Traders (FBT)
Notes: Figure 3b shows the average monthly net futures + adjusted options (i.e., futures equivalent) positions, by contract maturity, of the two most important non-commercial trader types: HF = Hedge Fund, FBT = Floor Broker/Floor Trader. The daily net positions in each contract for each reporting trader are summed up appropriately (e.g., for all contracts with less than 3 months until maturity, etc.), and the monthly averages are then plotted. The graphs are scaled to allow for easy comparisons of the relative sizes of the net positions held by different trader categories. Figure 3b is directly comparable to Figures 5b and 6b below.

40
Figure 4: Absolute Value of Net Positions at ≠ Maturities: Changes Since 2000
Average Daily Absolute Value of NET Crude Oil Futures + Options Positions: Commercial Traders
0
50000100000
150000
200000250000
< 3 mos
.
3-6 m
os.
6-9 m
os.
9-12 m
os.
1-2 yr
s.
2-3 yr
s.
3-4 yr
s.
4-5 yr
s.
5-6 yr
s.
>6 yrs.
2000200120022003200420052006
Average Daily Absolute Value of NET Crude Oil Futures + Options Positions: Non-Comm'l Traders
0
50000
100000
150000200000
250000
< 3 mos
.
3-6 m
os.
6-9 m
os.
9-12 m
os.
1-2 yr
s.
2-3 yr
s.
3-4 yr
s.
4-5 yr
s.
5-6 yr
s.
>6 yrs.
2000200120022003200420052006
Notes: Figure 4 shows the yearly averages (2000-2006) of the absolute values of the net position of commercial and non-commercial traders by contract maturity. “Commercial” traders include AD = Dealer/Merchant, AM = Manufacturer, AO = Agricultural and Natural Resource - Other, AP = Producer, AS = Commodity Swaps / Derivatives Dealer (which includes FS = Financial Swaps / Derivatives Dealer FA = Arbitrageur or Broker/Dealer). “Non-commercial” traders include HF = Hedge Fund, FBT = Floor Broker / Floor Trader, , as well as the reported positions of traders not subject to the reporting requirement and the positions of traders that have not yet been categorized or do not fit any other category. After taking the absolute value of the daily net positions in each contract for each trader group, figures are summed up appropriately (e.g., for all commercial groups, or for all positions less than 3 months, etc.), and the annual averages are then computed. Figure 4 is directly comparable to Figure 1 above.

41
Figure 5a: Magnitude of Short- vs. Long-term Net Positions of Commercial Trader Types, 2000-2006
0
20000
40000
60000
80000
100000
120000
2000
-01
2001
-01
2002
-01
2003
-01
2004
-01
2005
-01
2006
-01
<3mos.>3 yrs.1-2 yrs.
Absolute Value of Net Positions in Crude Oil Futures + Options Over Time: Commercial Dealers (AD)
a1
0
20000
40000
60000
80000
100000
120000
2000
-01
2001
-01
2002
-01
2003
-01
2004
-01
2005
-01
2006
-01
<3mos.>3 yrs.1-2 yrs.
Absolute Value of Net Positions in Crude Oil Futures + Options Over Time: Commercial Producers (AP)
0
20000
40000
60000
80000
100000
120000
2000
-01
2001
-01
2002
-01
2003
-01
2004
-01
2005
-01
2006
-01
<3mos.>3 yrs.1-2 yrs.
Absolute Value of Net Positions in Crude Oil Futures + Options Over Time: Commodity Swap Dealers (AS)
0
20000
40000
60000
80000
100000
120000
2000
-01
2001
-01
2002
-01
2003
-01
2004
-01
2005
-01
2006
-01
<3mos.
>3 yrs.
1-2 yrs .
Absolute Value of Net Positions in Crude Oil Futures + Options Over Time:Commercial Manufacturers (AM)
Notes: Figure 5a shows the average monthly magnitudes of the net futures + adjusted options (i.e., futures equivalent) positions, by contract maturity, of the four commercial trader types: AD = Dealer/Merchant, AP = Producer, AM = Manufacturer,, and AS = Commodity Swaps/Derivatives Dealer (which includes FS = Financial Swaps / Derivatives Dealer FA = Arbitrageur or Broker/Dealer). After taking the absolute value of the daily net positions in each contract for each trader group, figures are summed up appropriately (e.g., for all positions less than 3 months, etc.), and the annual averages are then computed. The graphs are scaled to allow for easy comparisons of the relative sizes of the net positions held by different trader categories. Figure 5a is directly comparable to Figure 3a above and to Figure 6a below.
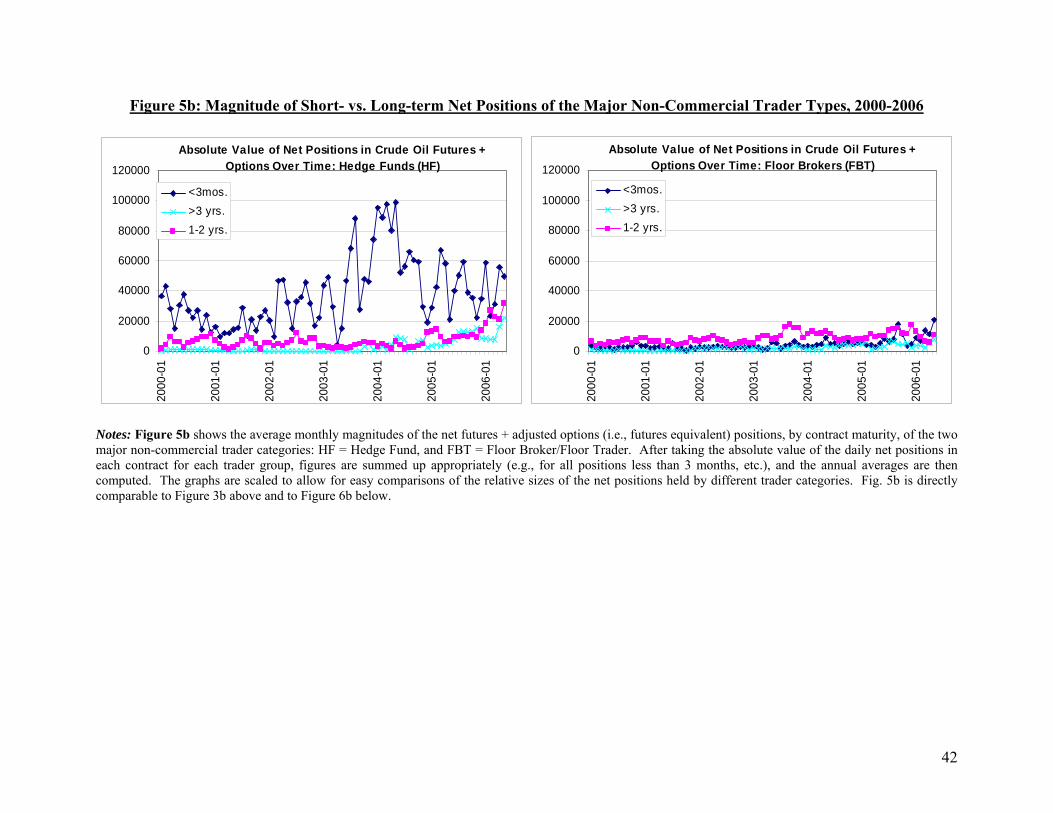
42
Figure 5b: Magnitude of Short- vs. Long-term Net Positions of the Major Non-Commercial Trader Types, 2000-2006
0
20000
40000
60000
80000
100000
12000020
00-0
1
2001
-01
2002
-01
2003
-01
2004
-01
2005
-01
2006
-01
<3mos.>3 yrs.1-2 yrs.
Absolute Value of Net Positions in Crude Oil Futures + Options Over Time: Hedge Funds (HF)
0
20000
40000
60000
80000
100000
120000
2000
-01
2001
-01
2002
-01
2003
-01
2004
-01
2005
-01
2006
-01
<3mos.>3 yrs.1-2 yrs.
Absolute Value of Net Positions in Crude Oil Futures + Options Over Time: Floor Brokers (FBT)
Notes: Figure 5b shows the average monthly magnitudes of the net futures + adjusted options (i.e., futures equivalent) positions, by contract maturity, of the two major non-commercial trader categories: HF = Hedge Fund, and FBT = Floor Broker/Floor Trader. After taking the absolute value of the daily net positions in each contract for each trader group, figures are summed up appropriately (e.g., for all positions less than 3 months, etc.), and the annual averages are then computed. The graphs are scaled to allow for easy comparisons of the relative sizes of the net positions held by different trader categories. Fig. 5b is directly comparable to Figure 3b above and to Figure 6b below.

43
Figure 6a: Magnitude of Short- vs. Very Long-term Net Positions of Commercial Trader Types, 2000-2006
0
20000
40000
60000
80000
100000
120000
2000
-01
2001
-01
2002
-01
2003
-01
2004
-01
2005
-01
2006
-01
<3mos.
4-5 yrs .
5-6 yrs .
>6 yrs .
Absolute Value of Net Positions in Crude Oil Futures + Options Over Time: Commercial Dealers (AD)
0
20000
40000
60000
80000
100000
120000
2000
-01
2001
-01
2002
-01
2003
-01
2004
-01
2005
-01
2006
-01
<3mos.
4-5 yrs.
5-6 yrs.>6 yrs.
Absolute Value of Net Positions in Crude Oil Futures + Options Over Time: Commercial Producers (AP)
0
20000
40000
60000
80000
100000
120000
2000
-01
2001
-01
2002
-01
2003
-01
2004
-01
2005
-01
2006
-01
<3mos.
4-5 yrs .
5-6 yrs .
>6 yrs .
Absolute Value of Net Positions in Crude Oil Futures + Options Over Time: Commodity Swap Dealers (AS)
0
20000
40000
60000
80000
100000
120000
2000
-01
2001
-01
2002
-01
2003
-01
2004
-01
2005
-01
2006
-01
<3mos.4-5 yrs .
5-6 yrs .
>6 yrs.
Absolute Value of Net Positions in Crude Oil Futures + Options Over Time: Commercial Manufacturers (AM)
Notes: Figure 6a shows the average monthly magnitudes of the net futures + adjusted options (i.e., futures equivalent) positions, by contract maturity, of the four commercial trader types: AD = Dealer/Merchant, AP = Producer, AM = Manufacturer,, and AS = Commodity Swaps/Derivatives Dealer (which includes FS = Financial Swaps / Derivatives Dealer FA = Arbitrageur or Broker/Dealer).. After taking the absolute value of the daily net positions in each contract for each trader group, figures are summed up appropriately (e.g., for all positions less than 3 months, etc.), and the annual averages are then computed. The graphs are scaled to allow for easy comparisons of the relative sizes of the net positions held by different trader categories. Figure 6a is directly comparable to Figures 3 and 5 above.

44
Figure 6b: Magnitude of Short- vs. Very Long-term Net Positions of the Major Non-Commercial Trader Types, 2000-2006
0
20000
40000
60000
80000
100000
12000020
00-0
1
2001
-01
2002
-01
2003
-01
2004
-01
2005
-01
2006
-01
<3mos.
4-5 yrs.
5-6 yrs.
>6 yrs .
Absolute Value of Net Positions in Crude Oil Futures + Options Over Time: Hedge funds (HF)
0
20000
40000
60000
80000
100000
120000
2000
-01
2001
-01
2002
-01
2003
-01
2004
-01
2005
-01
2006
-01
<3mos.
4-5 yrs.
5-6 yrs.
>6 yrs.
Absolute Value of Net Positions in Crude Oil Futures + Options Over Time: Floor Brokers & Traders (FBT)
Notes: Figure 6b shows the average monthly magnitudes of the net futures + adjusted options (i.e., futures equivalent) positions, by contract maturity, of the two major non-commercial trader categories: MMT = Managed Money Trader, and FBT = Floor Broker/Floor Trader. After taking the absolute value of the daily net positions in each contract for each trader group, figures are summed up appropriately (e.g., for all positions less than 3 months, etc.), and the annual averages are then computed. The graphs are scaled to allow for easy comparisons of the relative sizes of the net positions held by different trader categories. Figure 6b is directly comparable to Figures 3b and 5b above.

45
Figure 7. Recursively Calculated Trace Test Statistic Scaled by the 5% Critical value for Nearby, One & Two Year Contracts.
0
0.5
1
1.5
2
2.5
1/4/00 6/4/00 11/4/00 4/4/01 9/4/01 2/4/02 7/4/02 12/4/02 5/4/03 10/4/03 3/4/04 8/4/04 1/4/05 6/4/05 11/4/05 4/4/06
Date
Stan
dard
ized
Tra
ce S
tatis
tic
The R-1 form of the trace statistic is represented by the light (red) line. The 5% critical value is represented by the solid black line.

46
Figure 8. The Time Paths of the Speed of Adjustment Parameters (and 5% confidence interval)
Nearby Futures Contract
-3
-2.5
-2-1.5
-1
-0.5
00.5
1
1.5
1/4/2000 6/4/2000 11/4/2000 4/4/2001 9/4/2001 2/4/2002 7/4/2002 12/4/2002 5/4/2003 10/4/2003 3/4/2004 8/4/2004 1/4/2005 6/4/2005 11/4/2005 4/4/2006Date
Spee
d of
Adj
ustm
ent
Para
met
er
One Year Futures Contract
-2.5
-2
-1.5
-1
-0.5
0
0.5
1
1/4/2000 6/4/2000 11/4/2000 4/4/2001 9/4/2001 2/4/2002 7/4/2002 12/4/2002 5/4/2003 10/4/2003 3/4/2004 8/4/2004 1/4/2005 6/4/2005 11/4/2005 4/4/2006Date
Spee
d of
Adj
ustm
ent
Para
met
er
Two Year Futures Contract
-1.2
-1
-0.8
-0.6
-0.4
-0.2
0
0.2
0.4
0.6
1/4/2000 6/4/2000 11/4/2000 4/4/2001 9/4/2001 2/4/2002 7/4/2002 12/4/2002 5/4/2003 10/4/2003 3/4/2004 8/4/2004 1/4/2005 6/4/2005 11/4/2005 4/4/2006Date
Spee
d of
Adj
ustm
ent
Para
met
er

47