market opportunities and challenges for indian organic
TRANSCRIPT
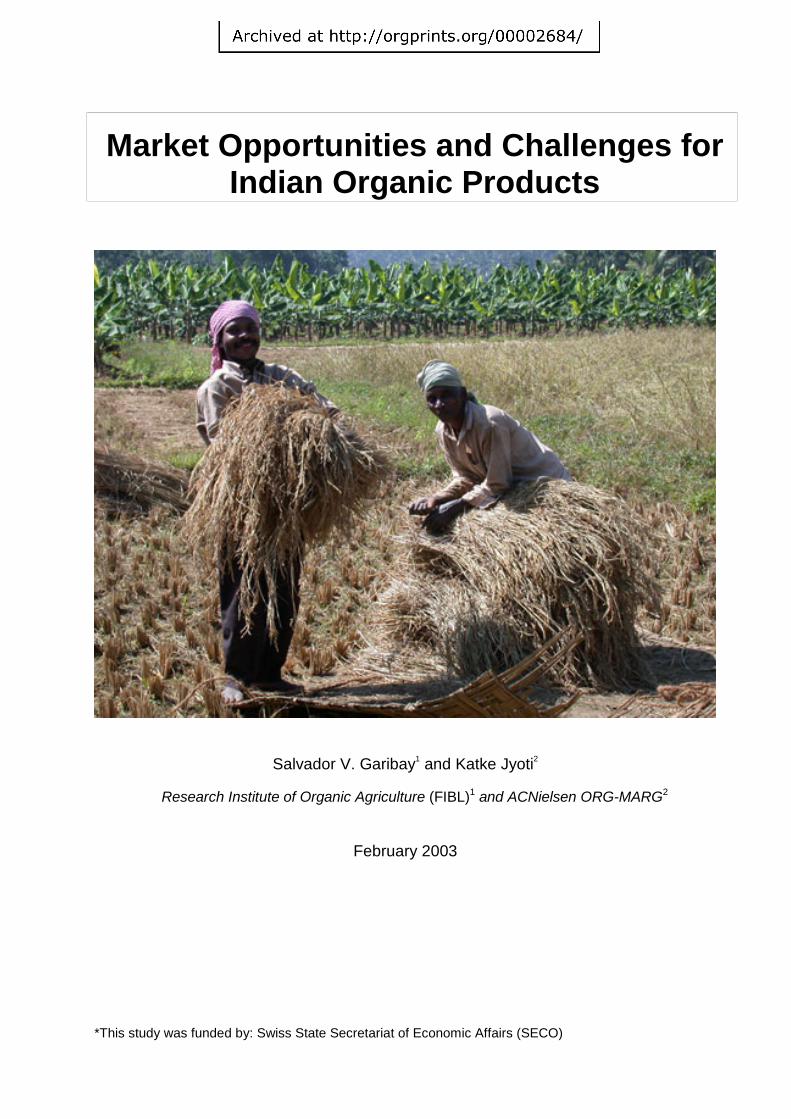
Market Opportunities and Challenges for Indian Organic Products
Salvador V. Garibay1 and Katke Jyoti2
Research Institute of Organic Agriculture (FIBL)1 and ACNielsen ORG-MARG2
February 2003
*This study was funded by: Swiss State Secretariat of Economic Affairs (SECO)
Market Opportunities and Challenges for Indian Organic Products 2
1 INTRODUCTION......................................................................................................4
1.1 Objectives of the study......................................................................................4 1.2 Methodology......................................................................................................4
2 INDIAN DOMESTIC MARKET .................................................................................6 2.1 Organic agriculture in India ...............................................................................6 2.2 Indian organic products.....................................................................................7 2.3 Producers / exporters / traders..........................................................................7 2.4 Most common organic products exported from India ........................................8 2.5 Products for which Indian production has a comparative advantage ................8 2.6 Reasons for unsold stock of organic products.................................................10 2.7 Potential customers for organic products in the domestic market ...................10 2.8 Non-governmental organizations (NGOs) .......................................................11 2.9 Certification .....................................................................................................12 2.10 Frame conditions of the organic market in India..............................................15 2.11 Consumers......................................................................................................16 2.12 Demand for Indian organic products in the domestic and export markets.......18 2.13 Supply .............................................................................................................20
3 THE INTERNATIONAL MARKET...........................................................................23 3.1 The international organic market scenario ......................................................23 3.2 Current trading of Indian organic products in the export market......................25 3.3 Potential for organic products in the selected export markets.........................26 3.4 Structure of sales channels in the selected export markets ............................29 3.5 Obstacles for selling Indian organic products in the selected export markets and possible solutions................................................................................................29
4 SUMMARY AND RECOMMENDATIONS .............................................................31 4.1 Summary.........................................................................................................31 4.2 Recommendations ..........................................................................................33
5 REFERENCES......................................................................................................36
Market Opportunities and Challenges for Indian Organic Products 3
PREAMBLE The Swiss State Secretariat of Economic Affairs (SECO) has decided to support a project by Indian NGOs to set up an internationally recognized organic certification program. The main aim of the project is to improve the livelihood of small farmers by improving market access, both domestic and international. In light of this, SECO was interested in conducting a study of the domestic and export market to provide Indian farmers with the necessary information. ACNielsen ORG-MARG Pvt. Ltd. and FiBL conducted a market study on organic products in India and in export markets. The findings of this study are detailed in the report.
Market Opportunities and Challenges for Indian Organic Products 4
1 INTRODUCTION Organic agriculture offers trade opportunities for farmers in the developing and developed countries. This market of organic products is expected to grow globally in the coming years and high growth rates over the medium term (from 10-15 to 25-30 %) are expected (Yussefi and Willer, 2002). This organic market expansion makes it possible for farmers to reap the benefits of a trade with relatively high price premiums (Yussefi and Willer, 2002). However, this market is not very well known to most farmers, especially those living in the developing countries. Furthermore, information about it is not readily available to farmers in the developing countries. The absence of sufficient technical and market information and financial support also means that few farmers will risk changing their method of production. In developing countries it is therefore essential for major key players (e.g. NGOs, farmer organizations, traders, exporters etc.) that promote organic farming to have up-to-date information on the available opportunities (market requirements) and trends of the organic market. One example is India, a country with a huge number of small farmers who still use traditional methods and do farming with few agricultural inputs. NGOs that promote organic farming and other organizations support farmers in these aspects. An organic movement is now emerging in India on different levels (producer groups, trainers and advisors, certification bodies and processors and traders). So dissemination of information about the opportunities and challenges for Indian organic products on the domestic and international market is of fundamental concern in order to allow continued development of the organic agriculture movement in this country. 1.1 Objectives of the study
i. To analyze the potential for organic products in the Indian domestic market;
ii. To identify the necessary steps to develop the domestic market;
iii. To assess demand and requirements in the international market and identify measures to improve the quality of Indian organic products in line with international market requirements;
iv. To formulate strategies for both the domestic and international markets with a
special focus on market access for small and medium-sized farmers and enterprises.
1.2 Methodology Indian Domestic Market and Production To determine the characteristics of the Indian domestic organic market primary research and secondary research was carried out. The primary research involved gathering data from Indian producers/exporters/traders, non-governmental organizations (NGOs), certifying agencies, commodity boards and consumers. Detailed questionnaires were
Market Opportunities and Challenges for Indian Organic Products 5
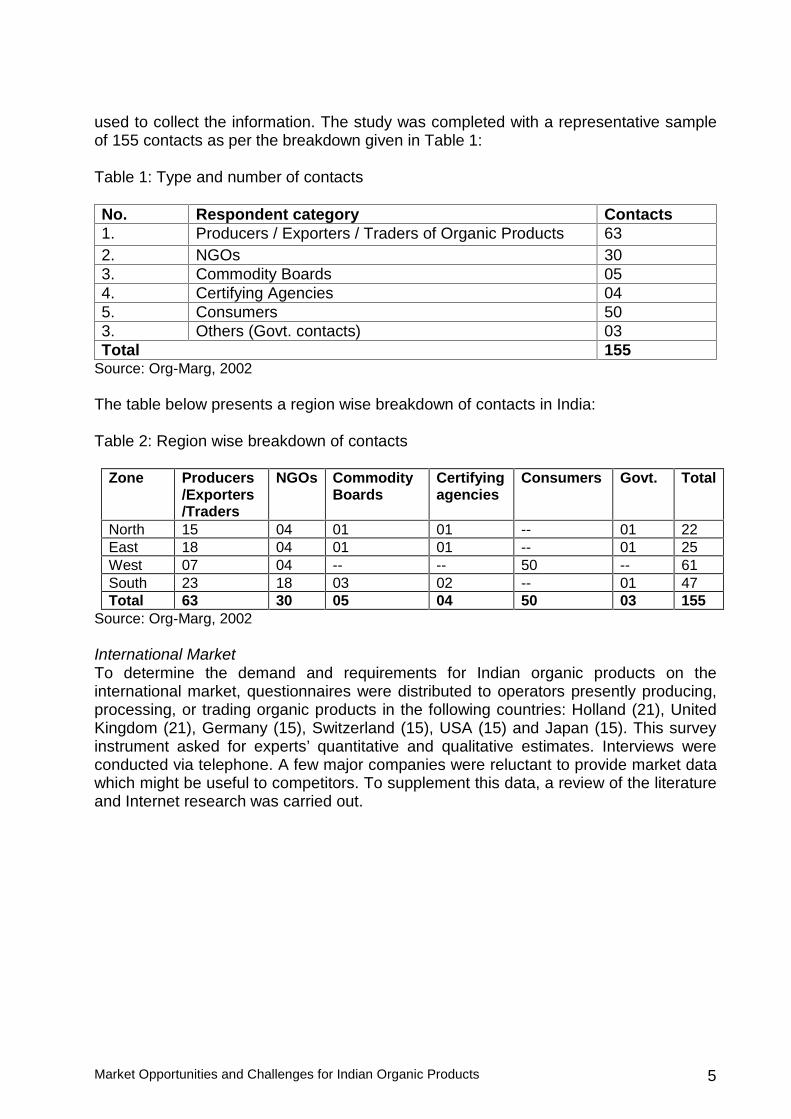
used to collect the information. The study was completed with a representative sample of 155 contacts as per the breakdown given in Table 1: Table 1: Type and number of contacts No. Respondent category Contacts 1. Producers / Exporters / Traders of Organic Products 63 2. NGOs 30 3. Commodity Boards 05 4. Certifying Agencies 04 5. Consumers 50 3. Others (Govt. contacts) 03 Total 155
Source: Org-Marg, 2002 The table below presents a region wise breakdown of contacts in India: Table 2: Region wise breakdown of contacts
Zone Producers /Exporters /Traders
NGOs Commodity Boards
Certifying agencies
Consumers Govt. Total
North 15 04 01 01 -- 01 22 East 18 04 01 01 -- 01 25 West 07 04 -- -- 50 -- 61 South 23 18 03 02 -- 01 47 Total 63 30 05 04 50 03 155
Source: Org-Marg, 2002 International Market To determine the demand and requirements for Indian organic products on the international market, questionnaires were distributed to operators presently producing, processing, or trading organic products in the following countries: Holland (21), United Kingdom (21), Germany (15), Switzerland (15), USA (15) and Japan (15). This survey instrument asked for experts’ quantitative and qualitative estimates. Interviews were conducted via telephone. A few major companies were reluctant to provide market data which might be useful to competitors. To supplement this data, a review of the literature and Internet research was carried out.
Market Opportunities and Challenges for Indian Organic Products 6
2 INDIAN DOMESTIC MARKET 2.1 Organic agriculture in India History and development Organic Agriculture is not a new concept to India. At the beginning of the 19th century, Sir Albert Howard, one of the most important pioneers of organic farming, worked in India for many years, studying soil-plant interactions and developing composting methods. In doing so, he capitalized substantially on India’s highly sophisticated traditional agricultural systems, which had long applied many of the principles of organic farming (e.g. crop rotations with legumes, mixed cropping, botanical pesticides etc.). Though the introduction of Green Revolution agricultural technology in the 1960s reached the main production areas of the country, there were still certain areas (especially mountain areas) and communities (especially certain tribes) that did not adopt the use of agro-chemicals. Therefore, some areas can be classified as ’organic by default’, though their significance and extent has been rather overemphasized in recent statements made by some government officials and NGOs representatives. However, an increasing number of farmers have consciously abandoned agro-chemicals and now produce organically, as a viable alternative to Green Revolution agriculture. Significance of organic agriculture for Indian farmers In the Indian context, organic farming can be significant in two distinct ways:
1.) To increase the efficiency and sustainability of production: Organic farming can help to reduce production costs (especially where labor is cheap compared to input costs) and to increase or stabilize yields on marginal soils. This is especially relevant for smallholders in marginal areas where Green Revolution agriculture has lead to a depletion of soil fertility and to high debts because of increase in input costs.
2.) To increase product value: In areas where farmers have access to established organic markets within the country or abroad, products can achieve a higher price compared to the conventional market. Especially in the trend of decreasing prices for agricultural products, this can be an important way to stabilize or even increase incomes.
Ideally, both aspects mentioned above are combined. The focus of this study, however, is on certified organic products that, because of their organic quality, can be sold with a price premium in the domestic and export markets. Extent of organic production It is yet not possible to make valid estimates of the extent of organic production in India. Information is scarce and scattered, and is not easily accessible from nodal point operators like certification bodies for reasons of competition. Diverse sources (ITC= International Trade Center and SÖL= Stifitung Ökologie & Landbau) approached different area values of organic production in India. From the surveyed stakeholders it can be concluded that there are more than one hundred organic projects operating, organized by NGOs, GOs or private companies, involving at least 10,000 small farmers in organic certification schemes. In order to collect reliable and comprehensive data, a centrally managed database is most urgently needed. The Agricultural and Processed Food Products Export Development Authority (APEDA) announced that they were planning to establish such a database soon. The Indian Government has recognized the export potential of organic agriculture and is in the process of strengthening the sector by putting a legal framework in place. This includes creating national organic standards and the possibility of accrediting in-country inspection and certification bodies.
Market Opportunities and Challenges for Indian Organic Products 7
2.2 Indian organic products By February 2002, around 1426 farms in India have been certified as organic farms with an area of around 2,775 hectares (Source: data adapted from the report “The Real Green Revolution” and FAO statistics). Considering that Indian agriculture as a whole accounts for about 180 million hectares, the total land under certified organic production is a negligible area of just 0.0015%. Major products being produced organically in India are given in Table 3. Table 3: Major products produced in India by organic farming Type Products Commodity Tea, coffee, rice ,wheat Spices Cardamom, black pepper, white pepper, ginger, turmeric, vanilla,
mustard, tamarind, clove, cinnamon, nutmeg, mace, chili Pulses Red gram, black gram Fruits Mango, banana, pineapple, passion fruit, sugarcane, orange, cashew
nut, walnut Vegetables Okra, brinjal, garlic, onion, tomato, potato Oil seeds Sesame, castor, sunflower Others Cotton, herbal extracts*
Source: Org-Marg, 2002 (Field survey and the publication - Organic and Biodynamic farming, Government of India, planning commission). * Details are appended in Annex I 2.3 Producers / exporters / traders Around 41% of the 63 respondents (producers / exporters / traders) deal solely in products produced by organic farming. The rest of the respondents (37) deal partially in organic products. Respondents with partial involvement in organic production were probed further on their interest in going over completely to organic farming products. 54% of these respondents (20) indicated their willingness to do so (see Chart 1). In general, tea, bananas, honey, mangoes and oranges are the main products which respondents were interested in growing organically. Of the 63 respondents involved in organic products, 42 of them were actual producers of organic products. The most common products grown organically in India are presented in Chart 2. Tea is currently the most common product produced by means of organic farming. Chart 1: Plans for 100% organic production (Source: Org-Marg, 2002)
Not interested
46%
Interested54%
Base : 37
Market Opportunities and Challenges for Indian Organic Products 8
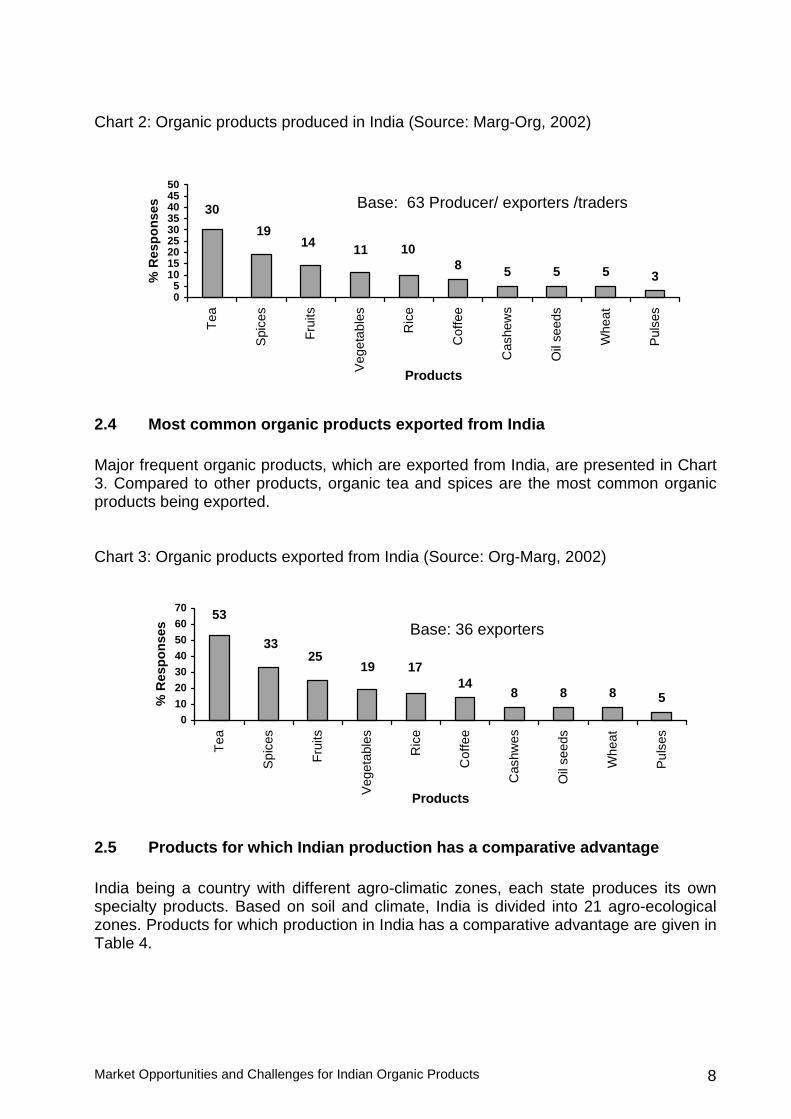
Chart 2: Organic products produced in India (Source: Marg-Org, 2002)
2.4 Most common organic products exported from India Major frequent organic products, which are exported from India, are presented in Chart 3. Compared to other products, organic tea and spices are the most common organic products being exported. Chart 3: Organic products exported from India (Source: Org-Marg, 2002)
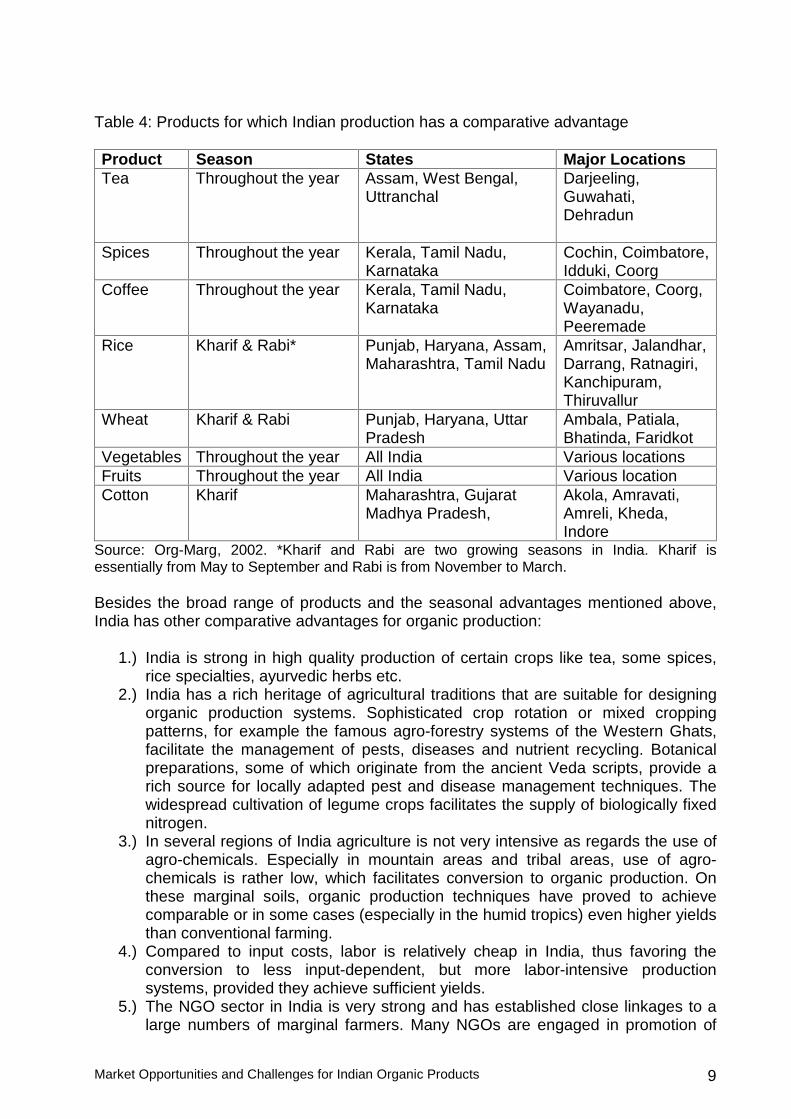
2.5 Products for which Indian production has a comparative advantage India being a country with different agro-climatic zones, each state produces its own specialty products. Based on soil and climate, India is divided into 21 agro-ecological zones. Products for which production in India has a comparative advantage are given in Table 4.
8 5 5 5 3
30
1914 11 10
05
101520253035404550
Tea
Spi
ces
Fru
its
Veg
etab
les
Ric
e
Cof
fee
Cas
hew
s
Oil
seed
s
Whe
at
Pul
ses
Products
% R
esp
on
ses
Base: 36 exporters
Base: 63 Producer/ exporters /traders
148 8 8 5
171925
33
53
0
10
20
30
40
50
60
70
Tea
Spi
ces
Fru
its
Veg
etab
les
Ric
e
Cof
fee
Cas
hwes
Oil
seed
s
Whe
at
Pul
ses
Products
% R
esp
on
ses
Market Opportunities and Challenges for Indian Organic Products 9
Table 4: Products for which Indian production has a comparative advantage Product Season States Major Locations Tea Throughout the year Assam, West Bengal,
Uttranchal Darjeeling, Guwahati, Dehradun
Spices Throughout the year Kerala, Tamil Nadu, Karnataka
Cochin, Coimbatore, Idduki, Coorg
Coffee Throughout the year Kerala, Tamil Nadu, Karnataka
Coimbatore, Coorg, Wayanadu, Peeremade
Rice Kharif & Rabi* Punjab, Haryana, Assam, Maharashtra, Tamil Nadu
Amritsar, Jalandhar, Darrang, Ratnagiri, Kanchipuram, Thiruvallur
Wheat Kharif & Rabi Punjab, Haryana, Uttar Pradesh
Ambala, Patiala, Bhatinda, Faridkot
Vegetables Throughout the year All India Various locations Fruits Throughout the year All India Various location Cotton Kharif Maharashtra, Gujarat
Madhya Pradesh, Akola, Amravati, Amreli, Kheda, Indore
Source: Org-Marg, 2002. *Kharif and Rabi are two growing seasons in India. Kharif is essentially from May to September and Rabi is from November to March. Besides the broad range of products and the seasonal advantages mentioned above, India has other comparative advantages for organic production:
1.) India is strong in high quality production of certain crops like tea, some spices, rice specialties, ayurvedic herbs etc.
2.) India has a rich heritage of agricultural traditions that are suitable for designing organic production systems. Sophisticated crop rotation or mixed cropping patterns, for example the famous agro-forestry systems of the Western Ghats, facilitate the management of pests, diseases and nutrient recycling. Botanical preparations, some of which originate from the ancient Veda scripts, provide a rich source for locally adapted pest and disease management techniques. The widespread cultivation of legume crops facilitates the supply of biologically fixed nitrogen.
3.) In several regions of India agriculture is not very intensive as regards the use of agro-chemicals. Especially in mountain areas and tribal areas, use of agro-chemicals is rather low, which facilitates conversion to organic production. On these marginal soils, organic production techniques have proved to achieve comparable or in some cases (especially in the humid tropics) even higher yields than conventional farming.
4.) Compared to input costs, labor is relatively cheap in India, thus favoring the conversion to less input-dependent, but more labor-intensive production systems, provided they achieve sufficient yields.
5.) The NGO sector in India is very strong and has established close linkages to a large numbers of marginal farmers. Many NGOs are engaged in promotion of
Market Opportunities and Challenges for Indian Organic Products 10
organic farming and provide training, extension services information and marketing services to farming communities.
6.) The Indian Government has realized the potential significance of organic agriculture for the country and has recently started to support organic agriculture on a large scale and on various levels. A national regulatory framework (standards, accreditation regulations) has already been passed in 2000. There are various schemes and events to support and facilitate exports of organic products (e.g. the large conference ‘Indian Organic Products – Global Markets’ held in Delhi in December 2002, mainly sponsored by the Indian Government). The Ministry of Agriculture announced that various forms of support for organic producers, processors and traders were to be included within the latest five-year plan.
2.6 Reasons for unsold stock of organic products Price and lack of marketing of the product are the major reasons cited for the unsold stock of organic products in the national market. In the export market, import traders mentioned the following reasons:
• Lack of information on availability and certification; • Price expectations too high in relation to quality; • Low consistency of quality and contamination; • Reliability of exporters; • Slow shipment, restrictions on importing Indian organic products.
However, the Agricultural and Processed Food Products Export Development Authority (APEDA) and other institutions are carrying out the following measures to improve the trade image of India:
• Training programs for producers and certification agencies; • Improving the quality of research and development; • Setting up a research institution aimed at improving different aspects of organic
production; • Promoting certification programs; • Developing national policies for organic production; • Improving the quality of products, packaging, logistic infrastructure and technical
support (different institutions are involved); • Promoting Indian organic products at international fairs (e.g. Bio-Fach) and
promotional programs in the media (e.g. video films); • Application for accreditation under different countries' national organic
regulations. 2.7 Potential customers for organic products in the domestic market In order to assess the profile of potential customers in domestic market, traders, exporters and producers were asked to indicate the type of customers who were interested in buying organic products. They were presented with a selection of 3 customer types: Upper class, Upper-middle class and Lower-middle class. 90% of the respondents believed upper class consumers to be interested in buying organic
Market Opportunities and Challenges for Indian Organic Products 11
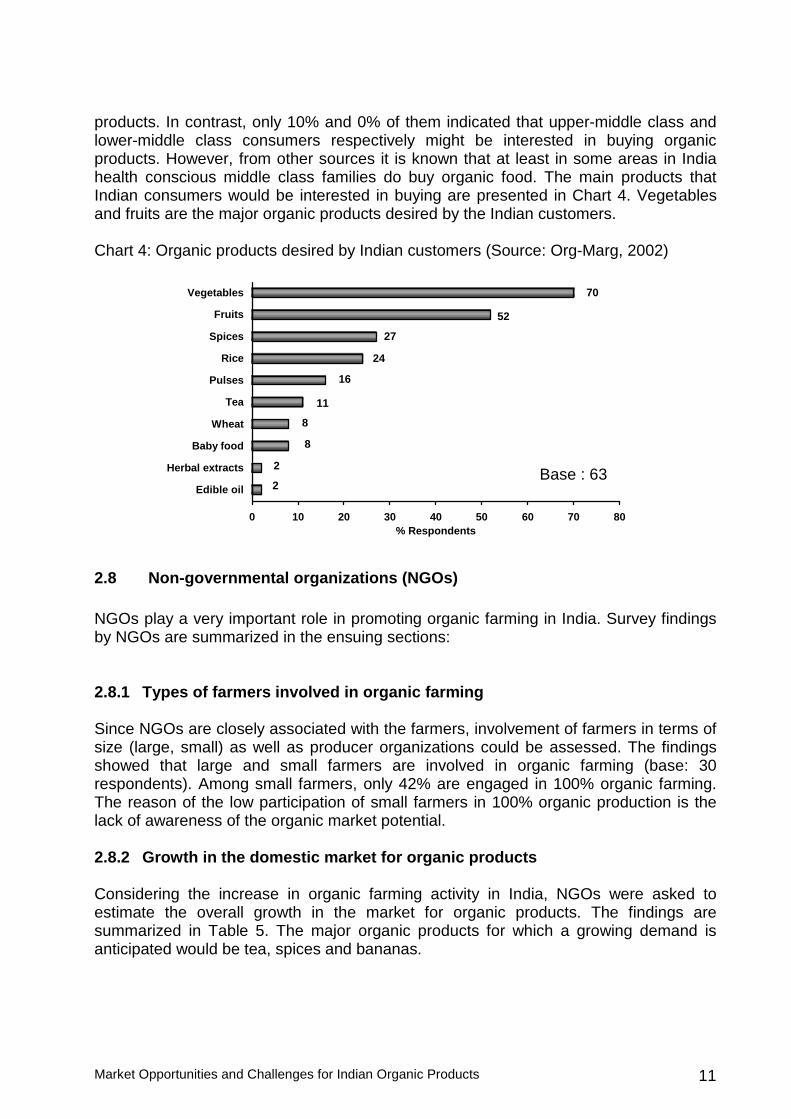
products. In contrast, only 10% and 0% of them indicated that upper-middle class and lower-middle class consumers respectively might be interested in buying organic products. However, from other sources it is known that at least in some areas in India health conscious middle class families do buy organic food. The main products that Indian consumers would be interested in buying are presented in Chart 4. Vegetables and fruits are the major organic products desired by the Indian customers. Chart 4: Organic products desired by Indian customers (Source: Org-Marg, 2002)
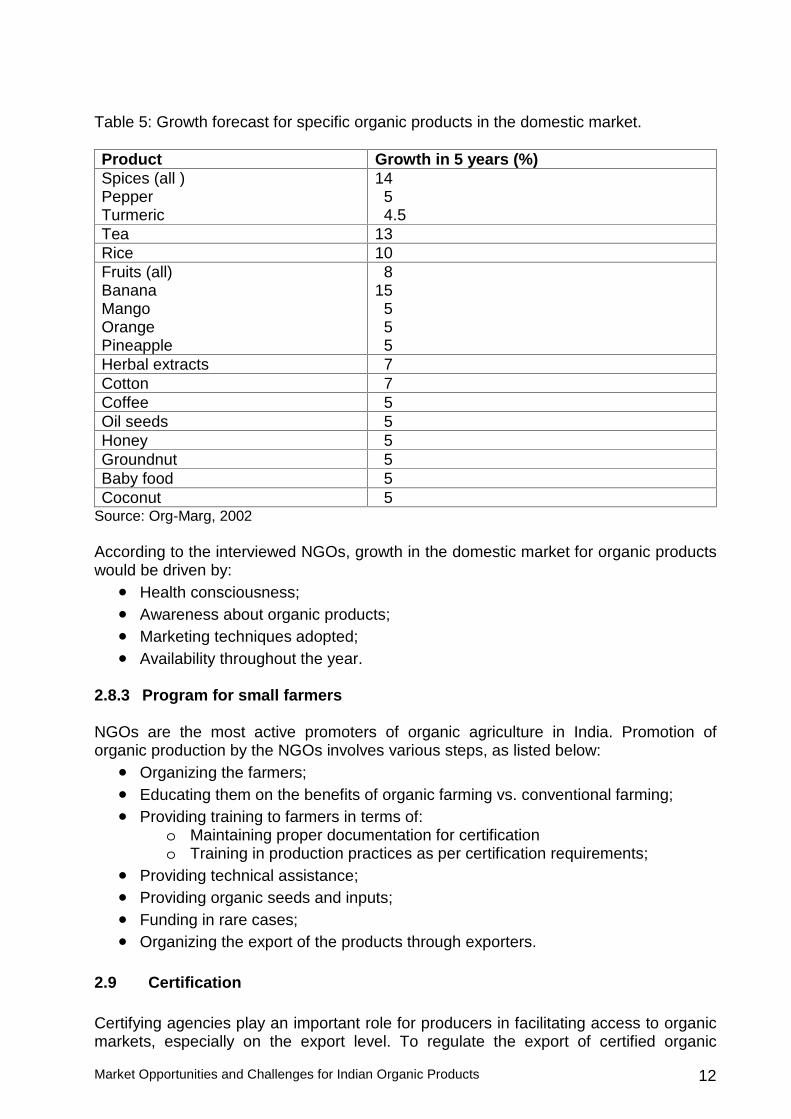
2.8 Non-governmental organizations (NGOs) NGOs play a very important role in promoting organic farming in India. Survey findings by NGOs are summarized in the ensuing sections: 2.8.1 Types of farmers involved in organic farming Since NGOs are closely associated with the farmers, involvement of farmers in terms of size (large, small) as well as producer organizations could be assessed. The findings showed that large and small farmers are involved in organic farming (base: 30 respondents). Among small farmers, only 42% are engaged in 100% organic farming. The reason of the low participation of small farmers in 100% organic production is the lack of awareness of the organic market potential. 2.8.2 Growth in the domestic market for organic products Considering the increase in organic farming activity in India, NGOs were asked to estimate the overall growth in the market for organic products. The findings are summarized in Table 5. The major organic products for which a growing demand is anticipated would be tea, spices and bananas.
2
2
8
8
11
16
24
27
52
70
0 10 20 30 40 50 60 70 80
Edible oil
Herbal extracts
Baby food
Wheat
Tea
Pulses
Rice
Spices
Fruits
Vegetables
% Respondents
Base : 63
Market Opportunities and Challenges for Indian Organic Products 12
Table 5: Growth forecast for specific organic products in the domestic market. Product Growth in 5 years (%) Spices (all ) Pepper Turmeric
14 5 4.5
Tea 13 Rice 10 Fruits (all) Banana Mango Orange Pineapple
8 15 5 5 5
Herbal extracts 7 Cotton 7 Coffee 5 Oil seeds 5 Honey 5 Groundnut 5 Baby food 5 Coconut 5
Source: Org-Marg, 2002 According to the interviewed NGOs, growth in the domestic market for organic products would be driven by:
• Health consciousness; • Awareness about organic products; • Marketing techniques adopted; • Availability throughout the year.
2.8.3 Program for small farmers NGOs are the most active promoters of organic agriculture in India. Promotion of organic production by the NGOs involves various steps, as listed below:
• Organizing the farmers; • Educating them on the benefits of organic farming vs. conventional farming; • Providing training to farmers in terms of:
o Maintaining proper documentation for certification o Training in production practices as per certification requirements;
• Providing technical assistance; • Providing organic seeds and inputs; • Funding in rare cases; • Organizing the export of the products through exporters.
2.9 Certification Certifying agencies play an important role for producers in facilitating access to organic markets, especially on the export level. To regulate the export of certified organic
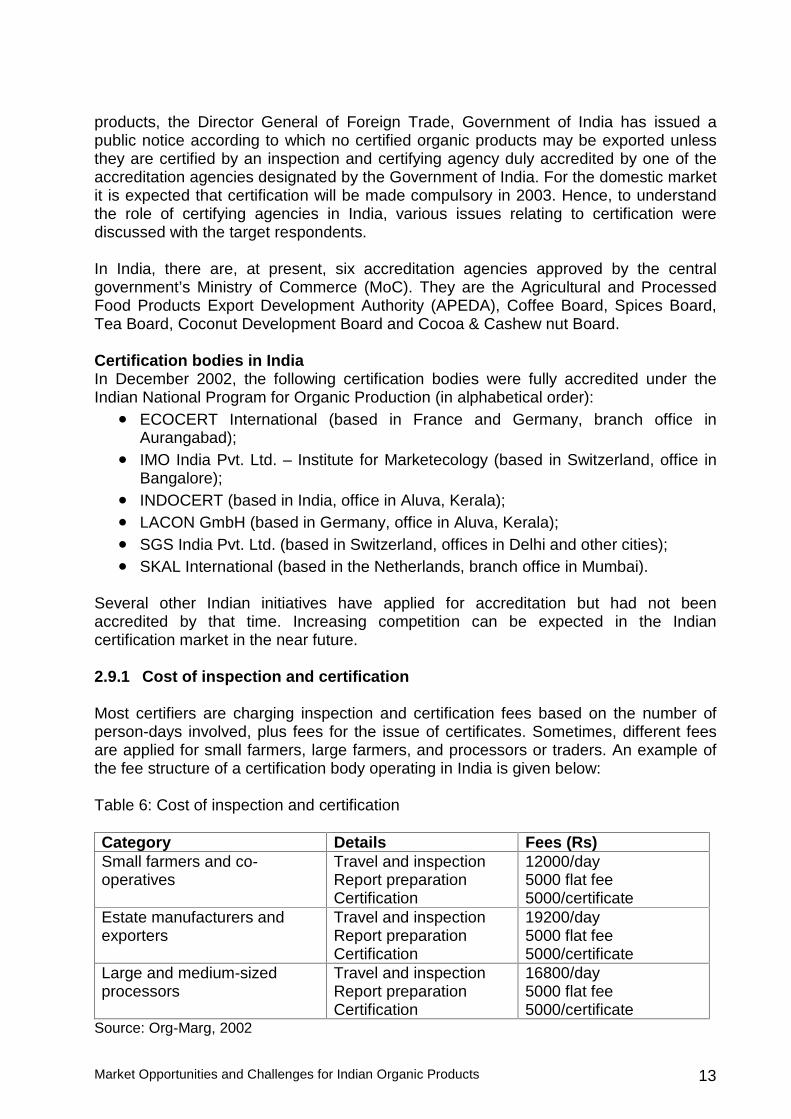
Market Opportunities and Challenges for Indian Organic Products 13
products, the Director General of Foreign Trade, Government of India has issued a public notice according to which no certified organic products may be exported unless they are certified by an inspection and certifying agency duly accredited by one of the accreditation agencies designated by the Government of India. For the domestic market it is expected that certification will be made compulsory in 2003. Hence, to understand the role of certifying agencies in India, various issues relating to certification were discussed with the target respondents. In India, there are, at present, six accreditation agencies approved by the central government’s Ministry of Commerce (MoC). They are the Agricultural and Processed Food Products Export Development Authority (APEDA), Coffee Board, Spices Board, Tea Board, Coconut Development Board and Cocoa & Cashew nut Board. Certification bodies in India In December 2002, the following certification bodies were fully accredited under the Indian National Program for Organic Production (in alphabetical order):
• ECOCERT International (based in France and Germany, branch office in Aurangabad);
• IMO India Pvt. Ltd. – Institute for Marketecology (based in Switzerland, office in Bangalore);
• INDOCERT (based in India, office in Aluva, Kerala); • LACON GmbH (based in Germany, office in Aluva, Kerala); • SGS India Pvt. Ltd. (based in Switzerland, offices in Delhi and other cities); • SKAL International (based in the Netherlands, branch office in Mumbai).
Several other Indian initiatives have applied for accreditation but had not been accredited by that time. Increasing competition can be expected in the Indian certification market in the near future. 2.9.1 Cost of inspection and certification Most certifiers are charging inspection and certification fees based on the number of person-days involved, plus fees for the issue of certificates. Sometimes, different fees are applied for small farmers, large farmers, and processors or traders. An example of the fee structure of a certification body operating in India is given below: Table 6: Cost of inspection and certification Category Details Fees (Rs) Small farmers and co-operatives
Travel and inspection Report preparation Certification
12000/day 5000 flat fee 5000/certificate
Estate manufacturers and exporters
Travel and inspection Report preparation Certification
19200/day 5000 flat fee 5000/certificate
Large and medium-sized processors
Travel and inspection Report preparation Certification
16800/day 5000 flat fee 5000/certificate
Source: Org-Marg, 2002
Market Opportunities and Challenges for Indian Organic Products 14
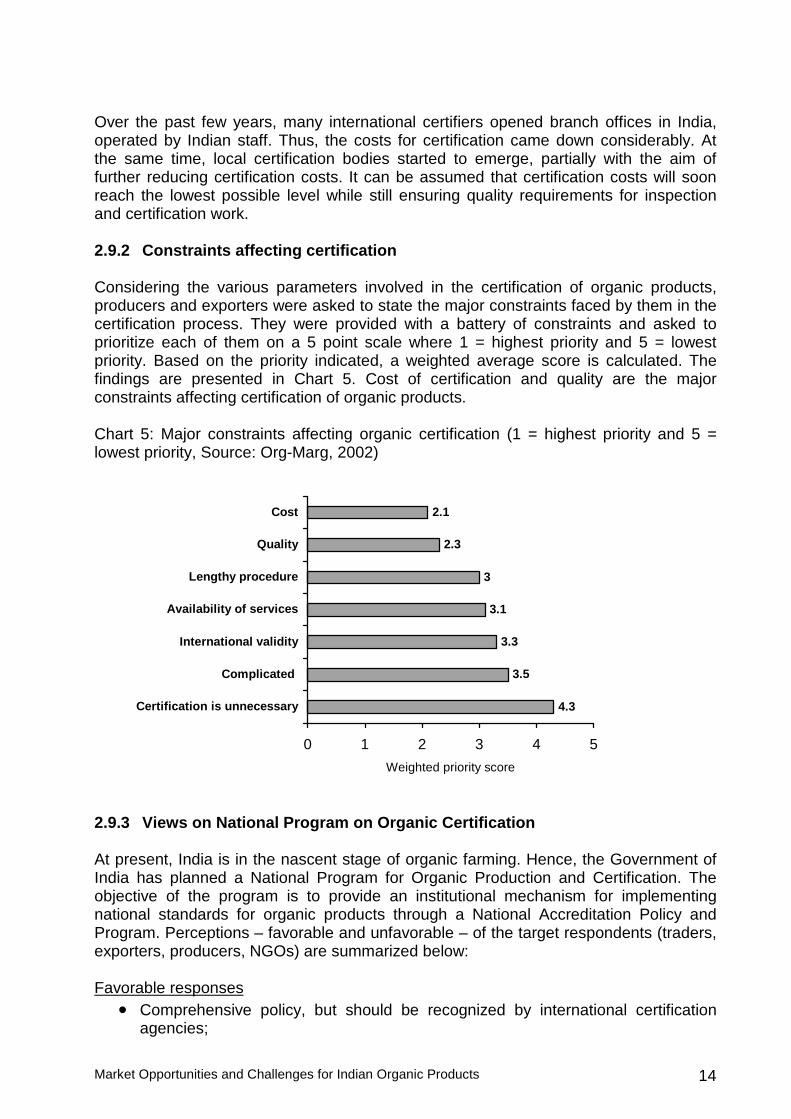
Over the past few years, many international certifiers opened branch offices in India, operated by Indian staff. Thus, the costs for certification came down considerably. At the same time, local certification bodies started to emerge, partially with the aim of further reducing certification costs. It can be assumed that certification costs will soon reach the lowest possible level while still ensuring quality requirements for inspection and certification work. 2.9.2 Constraints affecting certification Considering the various parameters involved in the certification of organic products, producers and exporters were asked to state the major constraints faced by them in the certification process. They were provided with a battery of constraints and asked to prioritize each of them on a 5 point scale where 1 = highest priority and 5 = lowest priority. Based on the priority indicated, a weighted average score is calculated. The findings are presented in Chart 5. Cost of certification and quality are the major constraints affecting certification of organic products. Chart 5: Major constraints affecting organic certification (1 = highest priority and 5 = lowest priority, Source: Org-Marg, 2002)
2.9.3 Views on National Program on Organic Certification At present, India is in the nascent stage of organic farming. Hence, the Government of India has planned a National Program for Organic Production and Certification. The objective of the program is to provide an institutional mechanism for implementing national standards for organic products through a National Accreditation Policy and Program. Perceptions – favorable and unfavorable – of the target respondents (traders, exporters, producers, NGOs) are summarized below: Favorable responses
• Comprehensive policy, but should be recognized by international certification agencies;
4.3
3.5
3.3
3.1
3
2.3
2.1
0 1 2 3 4 5
Certification is unnecessary
Complicated
International validity
Availability of services
Lengthy procedure
Quality
Cost
Weighted priority score
Market Opportunities and Challenges for Indian Organic Products 15
• Encourages organic farming in India; • Attracts more certification agencies in India; this will reduce the cost for
certification, which is a major constraint for small farmers; • Different agencies have different parameters; therefore standardization would
help; • Certification bodies should tie up with other certification agencies in other
countries; • National Certification would centralize the certification procedure.
Unfavorable responses
• We do not require a National Organic Certificate; • Increased complications; • Lengthier process; • Should be applicable to export market only; • National Organic Certification is complicated and costly.
2.10 Frame conditions of the organic market in India In India organic production has yet to be developed. In order to understand the frame conditions of organic farming for the various categories viz. Government authorities, certification organizations, NGOs, traders, processing industry and producers, various problems and suggestions were discussed and are summarized below: Table 7: Frame conditions of the organic market in India Category Present problems What needs to be changed? Government authorities
• So far low involvement / interest • No subsidies provided to organic
producers • Lots of paper work (e.g. duty) • No initiatives to educate farmers • Delay on policy implementation • Target only export market • No marketing support
• Plans for organic farming • Provide subsidies to organic
producers • Reduce documentation • Education and training • Awareness creation among Indian
consumers (market promotion)
Certification organizations
• High cost of certification • No standardization in terms of
regulations
• Reduce cost of certification • Link up with NGOs • Standardization of regulations
NGOs • Lack of funds • Not completely linked up with
certification agencies • Lack of proper infrastructure • Unorganized
• Availability of funds • Improved infrastructure • Organized operation
Traders - domestic
• Low level of awareness • Low domestic market • Low price realization • Lack of proper marketing network
• Create awareness (promotion) • Increase retail chain of organic
products • Support for marketing initiatives
Process industry • Lack of organic raw materials • No standardization in terms of
processes
• Improve availability of organic raw materials
• Process standardization
Market Opportunities and Challenges for Indian Organic Products 16
• No dependable supply of organic products
• Availability of upgraded processing technologies
• Improve market information • Availability of latest processing
technologies
Organization of organic producers
• Not organized • Some do not provide any benefits
to farmers associated • Over expectations • Lack of organic raw materials • Lack of effort to target domestic
market • Lack of modern technology
• Organized network • Organizations should provide
proper margins for farmers • Realistic information • Organize supply • Support through modern
technology
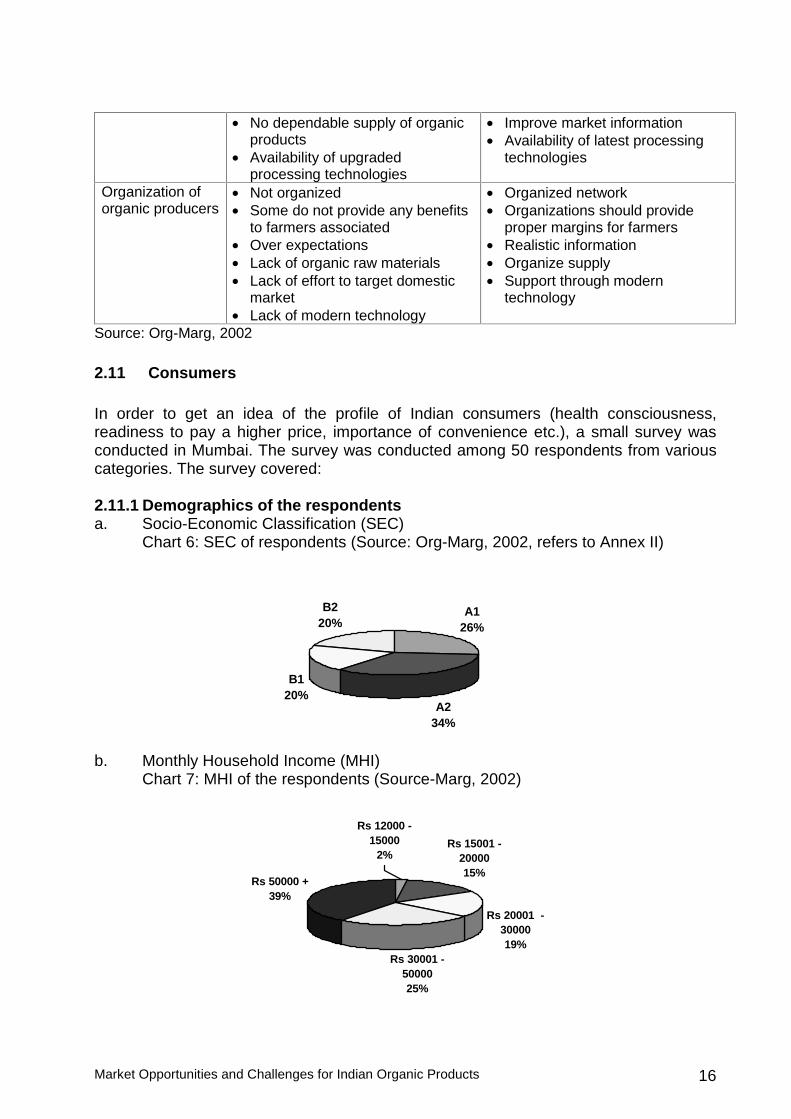
Source: Org-Marg, 2002 2.11 Consumers In order to get an idea of the profile of Indian consumers (health consciousness, readiness to pay a higher price, importance of convenience etc.), a small survey was conducted in Mumbai. The survey was conducted among 50 respondents from various categories. The survey covered: 2.11.1 Demographics of the respondents a. Socio-Economic Classification (SEC)
Chart 6: SEC of respondents (Source: Org-Marg, 2002, refers to Annex II)
b. Monthly Household Income (MHI) Chart 7: MHI of the respondents (Source-Marg, 2002)
A126%
A234%
B120%
B220%
Rs 15001 - 2000015%
Rs 20001 - 3000019%
Rs 30001 - 5000025%
Rs 50000 +39%
Rs 12000 - 15000
2%
Market Opportunities and Challenges for Indian Organic Products 17
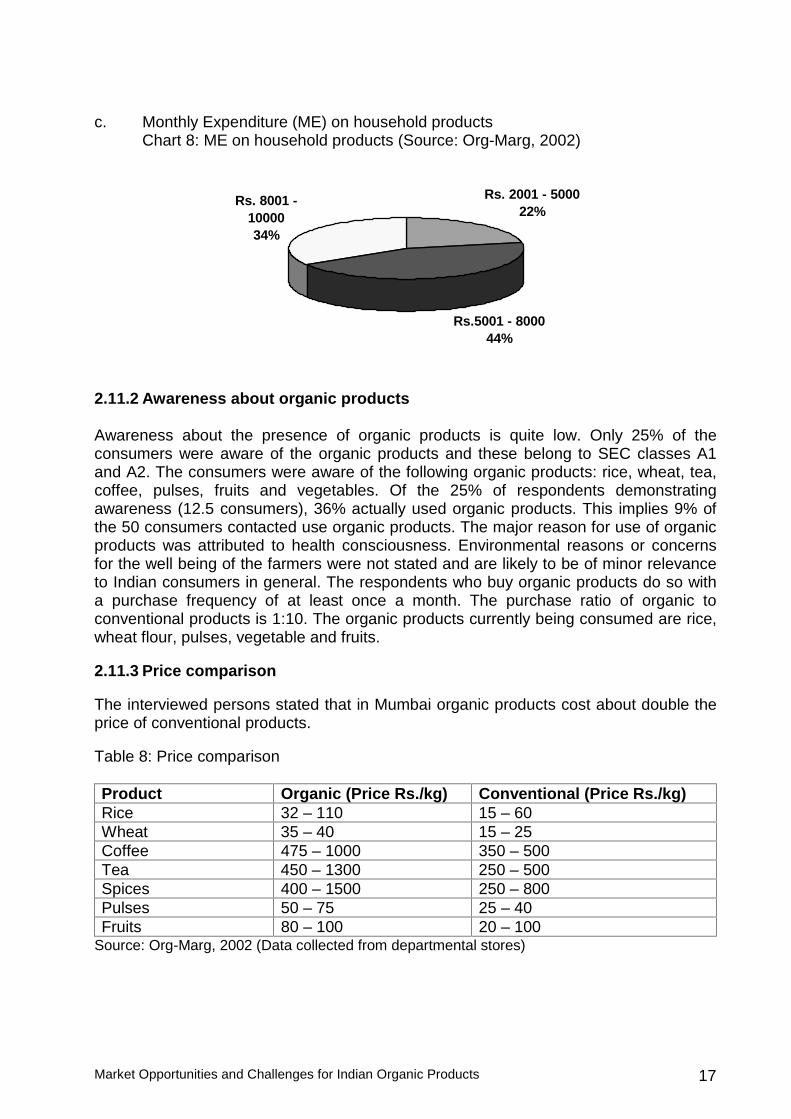
c. Monthly Expenditure (ME) on household products Chart 8: ME on household products (Source: Org-Marg, 2002)
2.11.2 Awareness about organic products Awareness about the presence of organic products is quite low. Only 25% of the consumers were aware of the organic products and these belong to SEC classes A1 and A2. The consumers were aware of the following organic products: rice, wheat, tea, coffee, pulses, fruits and vegetables. Of the 25% of respondents demonstrating awareness (12.5 consumers), 36% actually used organic products. This implies 9% of the 50 consumers contacted use organic products. The major reason for use of organic products was attributed to health consciousness. Environmental reasons or concerns for the well being of the farmers were not stated and are likely to be of minor relevance to Indian consumers in general. The respondents who buy organic products do so with a purchase frequency of at least once a month. The purchase ratio of organic to conventional products is 1:10. The organic products currently being consumed are rice, wheat flour, pulses, vegetable and fruits. 2.11.3 Price comparison The interviewed persons stated that in Mumbai organic products cost about double the price of conventional products. Table 8: Price comparison Product Organic (Price Rs./kg) Conventional (Price Rs./kg) Rice 32 – 110 15 – 60 Wheat 35 – 40 15 – 25 Coffee 475 – 1000 350 – 500 Tea 450 – 1300 250 – 500 Spices 400 – 1500 250 – 800 Pulses 50 – 75 25 – 40 Fruits 80 – 100 20 – 100
Source: Org-Marg, 2002 (Data collected from departmental stores)
Rs. 2001 - 500022%
Rs.5001 - 800044%
Rs. 8001 - 1000034%
Market Opportunities and Challenges for Indian Organic Products 18
2.11.4 Non-consumers of organic products Lack of awareness is the main reason for non-consumption of organic products. Following appropriate education, prima facie, all the non-consumers indicated an interest in consuming organic products, mainly due to increased health consciousness.
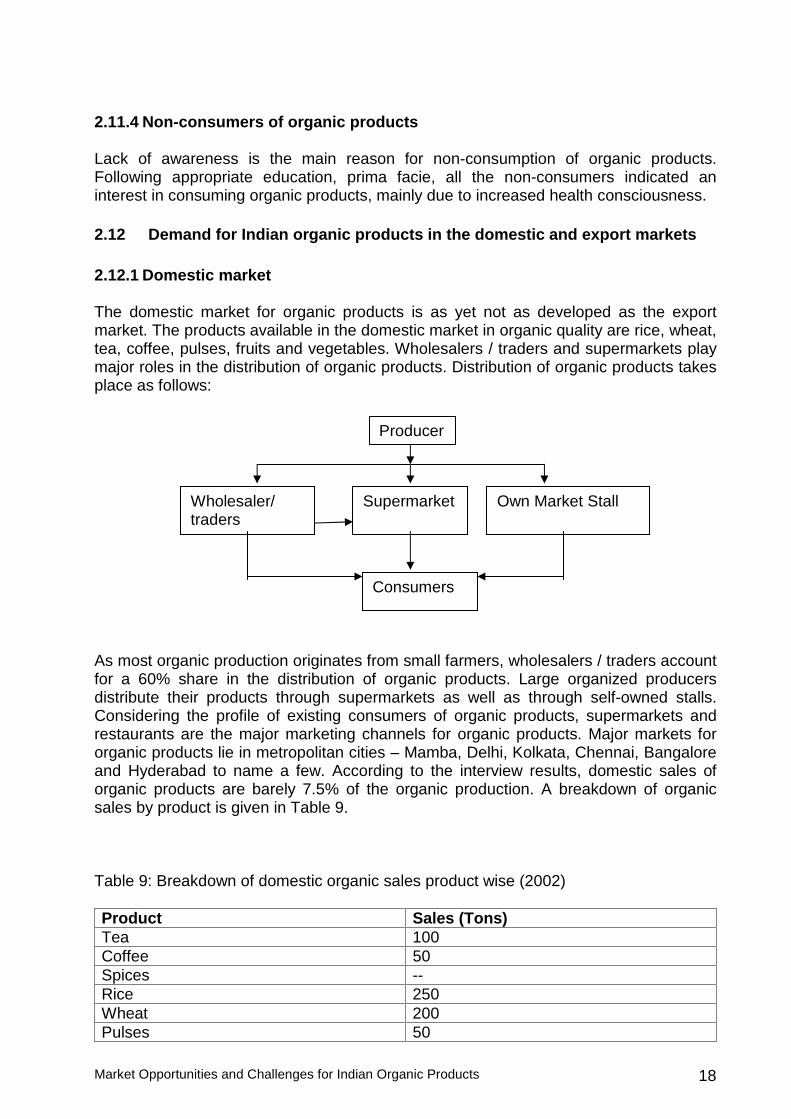
2.12 Demand for Indian organic products in the domestic and export markets 2.12.1 Domestic market The domestic market for organic products is as yet not as developed as the export market. The products available in the domestic market in organic quality are rice, wheat, tea, coffee, pulses, fruits and vegetables. Wholesalers / traders and supermarkets play major roles in the distribution of organic products. Distribution of organic products takes place as follows: As most organic production originates from small farmers, wholesalers / traders account for a 60% share in the distribution of organic products. Large organized producers distribute their products through supermarkets as well as through self-owned stalls. Considering the profile of existing consumers of organic products, supermarkets and restaurants are the major marketing channels for organic products. Major markets for organic products lie in metropolitan cities – Mamba, Delhi, Kolkata, Chennai, Bangalore and Hyderabad to name a few. According to the interview results, domestic sales of organic products are barely 7.5% of the organic production. A breakdown of organic sales by product is given in Table 9. Table 9: Breakdown of domestic organic sales product wise (2002) Product Sales (Tons) Tea 100 Coffee 50 Spices -- Rice 250 Wheat 200 Pulses 50
Producer
Wholesaler/ traders
Supermarket Own Market Stall
Consumers
Market Opportunities and Challenges for Indian Organic Products 19
Fruits and vegetables 400 Total 1050
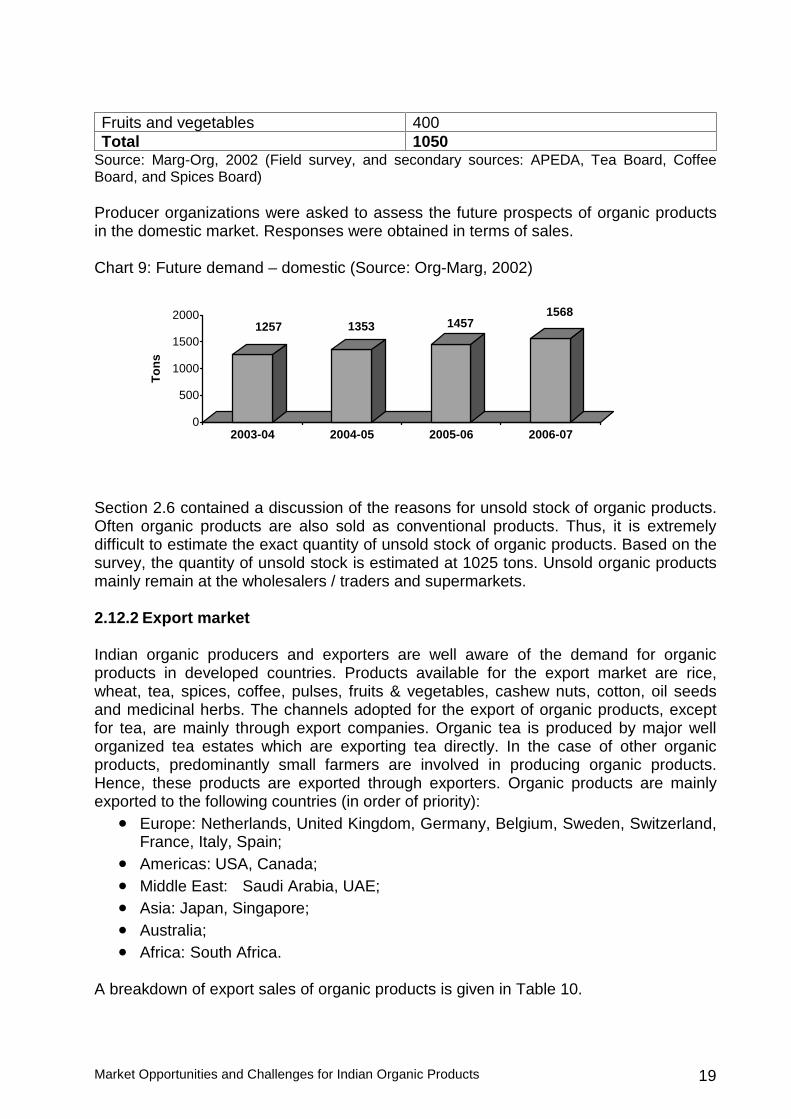
Source: Marg-Org, 2002 (Field survey, and secondary sources: APEDA, Tea Board, Coffee Board, and Spices Board) Producer organizations were asked to assess the future prospects of organic products in the domestic market. Responses were obtained in terms of sales. Chart 9: Future demand – domestic (Source: Org-Marg, 2002)
Section 2.6 contained a discussion of the reasons for unsold stock of organic products. Often organic products are also sold as conventional products. Thus, it is extremely difficult to estimate the exact quantity of unsold stock of organic products. Based on the survey, the quantity of unsold stock is estimated at 1025 tons. Unsold organic products mainly remain at the wholesalers / traders and supermarkets. 2.12.2 Export market Indian organic producers and exporters are well aware of the demand for organic products in developed countries. Products available for the export market are rice, wheat, tea, spices, coffee, pulses, fruits & vegetables, cashew nuts, cotton, oil seeds and medicinal herbs. The channels adopted for the export of organic products, except for tea, are mainly through export companies. Organic tea is produced by major well organized tea estates which are exporting tea directly. In the case of other organic products, predominantly small farmers are involved in producing organic products. Hence, these products are exported through exporters. Organic products are mainly exported to the following countries (in order of priority):
• Europe: Netherlands, United Kingdom, Germany, Belgium, Sweden, Switzerland, France, Italy, Spain;
• Americas: USA, Canada; • Middle East: Saudi Arabia, UAE; • Asia: Japan, Singapore; • Australia; • Africa: South Africa.
A breakdown of export sales of organic products is given in Table 10.
1257 1353 14571568
0
500
1000
1500
2000
To
ns
2003-04 2004-05 2005-06 2006-07
Market Opportunities and Challenges for Indian Organic Products 20
Table 10: Export sales product wise (2002). Product Sales (Tons) Tea 3000 Coffee 550 Spices 700 Rice 2500 Wheat 1150 Pulses 300 Oil Seeds 100 Fruits & Vegetables 1800 Cashew nut 375 Cotton 1200 Herbal Products 250 Total 11,925
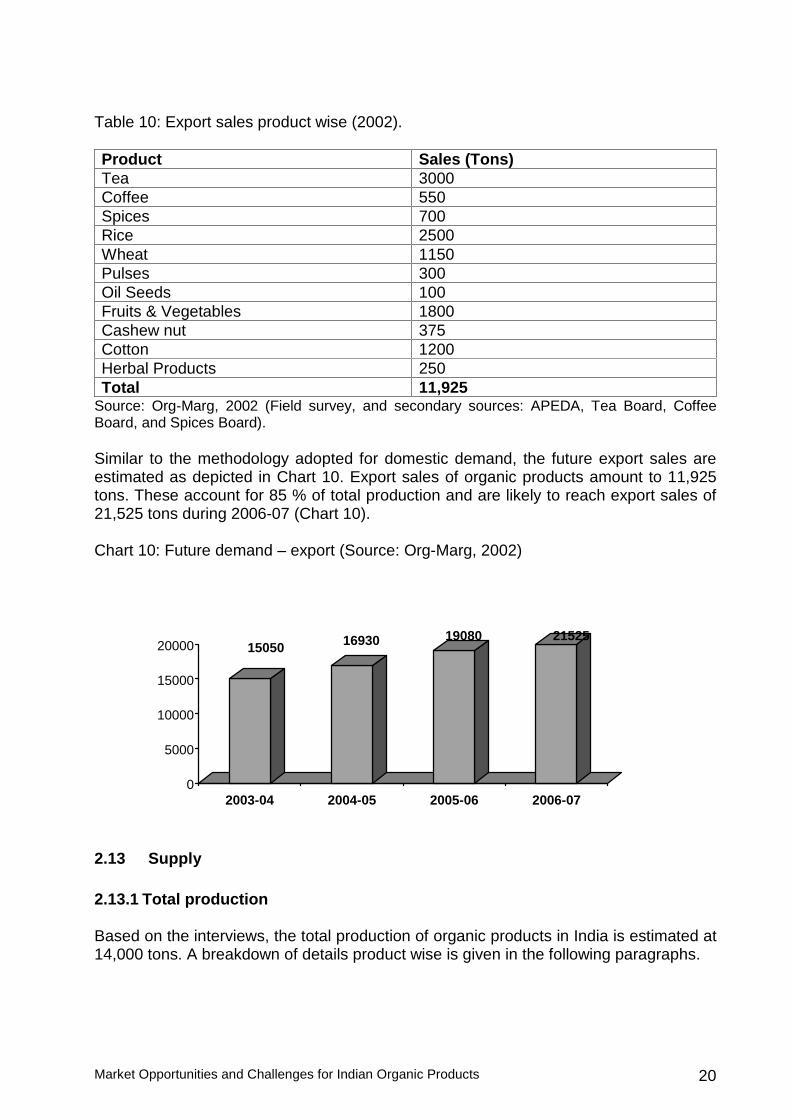
Source: Org-Marg, 2002 (Field survey, and secondary sources: APEDA, Tea Board, Coffee Board, and Spices Board). Similar to the methodology adopted for domestic demand, the future export sales are estimated as depicted in Chart 10. Export sales of organic products amount to 11,925 tons. These account for 85 % of total production and are likely to reach export sales of 21,525 tons during 2006-07 (Chart 10). Chart 10: Future demand – export (Source: Org-Marg, 2002)
2.13 Supply 2.13.1 Total production Based on the interviews, the total production of organic products in India is estimated at 14,000 tons. A breakdown of details product wise is given in the following paragraphs.
15050 16930 19080 21525
0
5000
10000
15000
20000
2003-04 2004-05 2005-06 2006-07
Market Opportunities and Challenges for Indian Organic Products 21
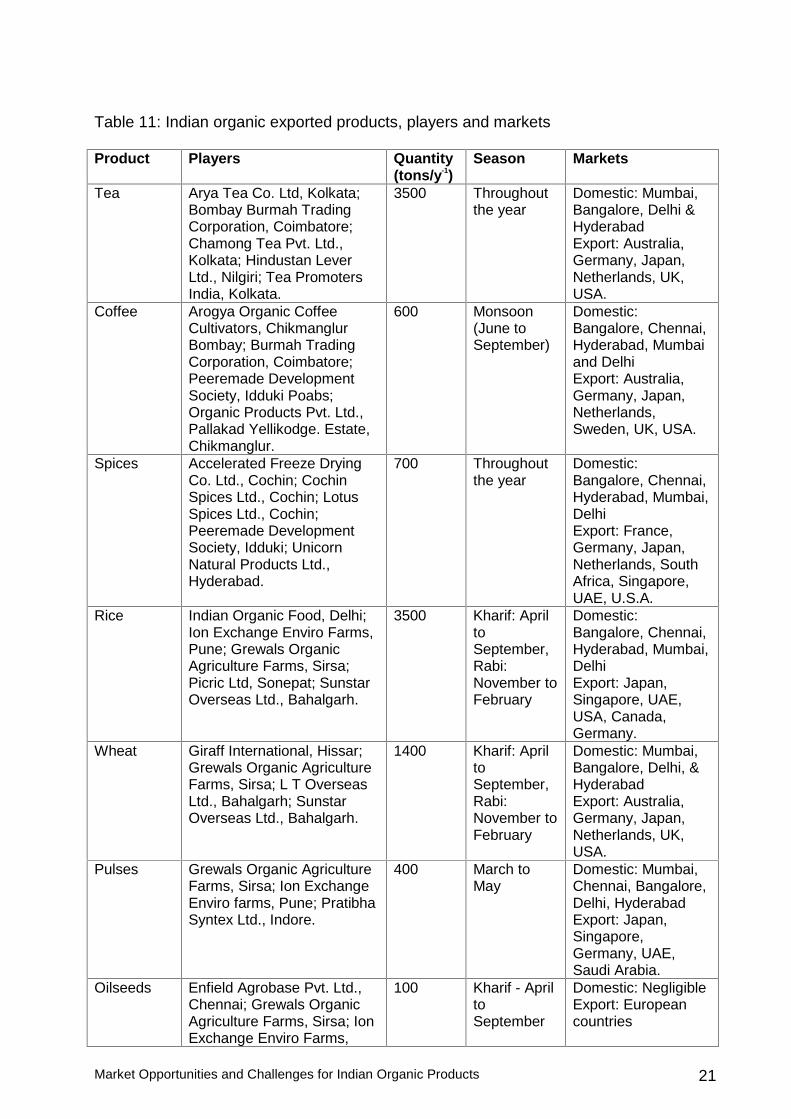
Table 11: Indian organic exported products, players and markets Product Players Quantity
(tons/y-1) Season Markets
Tea Arya Tea Co. Ltd, Kolkata; Bombay Burmah Trading Corporation, Coimbatore; Chamong Tea Pvt. Ltd., Kolkata; Hindustan Lever Ltd., Nilgiri; Tea Promoters India, Kolkata.
3500 Throughout the year
Domestic: Mumbai, Bangalore, Delhi & Hyderabad Export: Australia, Germany, Japan, Netherlands, UK, USA.
Coffee Arogya Organic Coffee Cultivators, Chikmanglur Bombay; Burmah Trading Corporation, Coimbatore; Peeremade Development Society, Idduki Poabs; Organic Products Pvt. Ltd., Pallakad Yellikodge. Estate, Chikmanglur.
600 Monsoon (June to September)
Domestic: Bangalore, Chennai, Hyderabad, Mumbai and Delhi Export: Australia, Germany, Japan, Netherlands, Sweden, UK, USA.
Spices Accelerated Freeze Drying Co. Ltd., Cochin; Cochin Spices Ltd., Cochin; Lotus Spices Ltd., Cochin; Peeremade Development Society, Idduki; Unicorn Natural Products Ltd., Hyderabad.
700 Throughout the year
Domestic: Bangalore, Chennai, Hyderabad, Mumbai, Delhi Export: France, Germany, Japan, Netherlands, South Africa, Singapore, UAE, U.S.A.
Rice Indian Organic Food, Delhi; Ion Exchange Enviro Farms, Pune; Grewals Organic Agriculture Farms, Sirsa; Picric Ltd, Sonepat; Sunstar Overseas Ltd., Bahalgarh.
3500 Kharif: April to September, Rabi: November to February
Domestic: Bangalore, Chennai, Hyderabad, Mumbai, Delhi Export: Japan, Singapore, UAE, USA, Canada, Germany.
Wheat Giraff International, Hissar; Grewals Organic Agriculture Farms, Sirsa; L T Overseas Ltd., Bahalgarh; Sunstar Overseas Ltd., Bahalgarh.
1400 Kharif: April to September, Rabi: November to February
Domestic: Mumbai, Bangalore, Delhi, & Hyderabad Export: Australia, Germany, Japan, Netherlands, UK, USA.
Pulses Grewals Organic Agriculture Farms, Sirsa; Ion Exchange Enviro farms, Pune; Pratibha Syntex Ltd., Indore.
400 March to May
Domestic: Mumbai, Chennai, Bangalore, Delhi, Hyderabad Export: Japan, Singapore, Germany, UAE, Saudi Arabia.
Oilseeds Enfield Agrobase Pvt. Ltd., Chennai; Grewals Organic Agriculture Farms, Sirsa; Ion Exchange Enviro Farms,
100 Kharif - April to September
Domestic: Negligible Export: European countries
Market Opportunities and Challenges for Indian Organic Products 22
Pune. Fruits & Vegetables
Grewals Organic Agriculture Farms, Sirsa; Mahesh Agri Exim Pvt. Ltd.., Surat; Ion Exchange Enviro Farms , Pune; IQF Foods Ltd., Bangalore; Namadharis Fresh, Bangalore; Picric Ltd., Sonepat
2500 Throughout the year
Domestic: Mumbai, Chennai, Bangalore, Delhi, & Hyderabad Export: Australia, France, Germany, Italy, Sweden, Switzerland, Netherlands, USA, UK
Cashew nut Narayan Ganesh Prabhu Zantye & Co. Goa; Trading Organic Association, Goa.
375 March to June
Domestic: Nil Export: European Countries
Others: Cotton, medicinal herbs & extracts, aloe vera, sapota
Pratibha Syntex Ltd., Indore; Maikaal bioRe Pvt. Ltd., Mhow; Rohini Herbal, Chennai; Khadinge Plants and Herbs Pvt. Ltd.
Cotton 1200, Herbs 250
Domestic: Mumbai, Bangalore, Delhi, & Hyderabad Export: Australia, Belgium, Germany, Switzerland, Italy, Japan, Netherlands, UK, USA
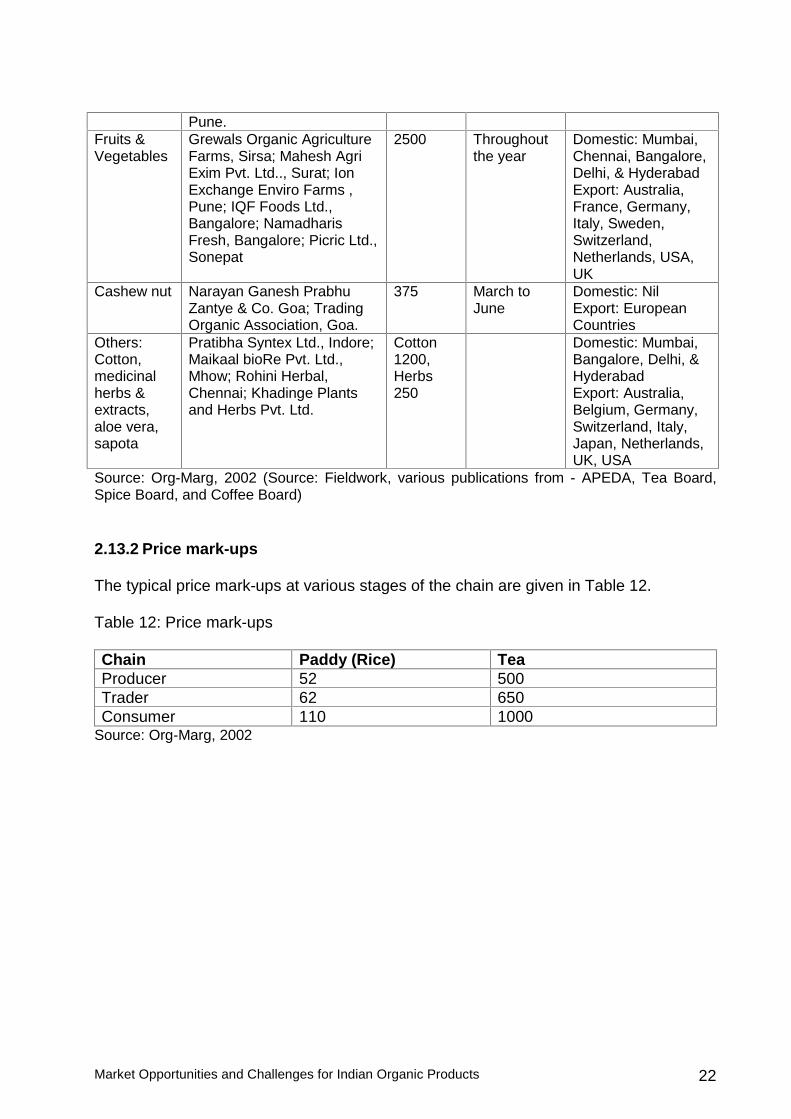
Source: Org-Marg, 2002 (Source: Fieldwork, various publications from - APEDA, Tea Board, Spice Board, and Coffee Board) 2.13.2 Price mark-ups The typical price mark-ups at various stages of the chain are given in Table 12. Table 12: Price mark-ups Chain Paddy (Rice) Tea Producer 52 500 Trader 62 650 Consumer 110 1000
Source: Org-Marg, 2002
Market Opportunities and Challenges for Indian Organic Products 23
3 THE INTERNATIONAL MARKET 3.1 The international organic market scenario Worldwide sales of organic products reached 26 billion US$ in 2001. The better selling products have been milk products and vegetables. Strong growth is found especially in those countries that have an active organic sector. One of the factors that promote growth in organic markets worldwide is consumer awareness of health, environment issues (Yossefi and Willer, 2002) and food scandals. Other factors that influence further development of the organic market are the increasing promotions and marketing strategies used by key players, such as retailers (Yossefi and Willer, 2002). Developing countries are expanding their organic market into developed countries and in parallel are building a domestic market. However, in order to help developing countries improve their sales opportunities in export markets, traders need to know the general conditions that exist in the developed countries. The Japanese organic market The largest Asian market for organic products is found in Japan (Yossefi and Willer, 2002). The Japanese organic market has been characterized as a market with high demand for organic products and strong purchasing power, and with low domestic supply of organic products (Hiraga, 2002). The annual growth rate of the organic market is about 20 percent (Yossefi and Willer, 2002). The Official Organic Certification system became mandatory in April 2001. Organic products have to be labeled with the Japanese Organic State logo (JAS) and therefore the imported organic products must meet Japanese national standards. It is likely that the ’Organic JAS Mark’ is well known to Japanese consumers (Yossefi and Willer, 2002). Japan is considered a major importer of organic products, which are mainly supplied by Australia, New Zealand, the USA and Canada. The most commonly imported organic products are soybean, organic frozen vegetables, mate tea and bananas (Yossefi and Willer, 2002). According to Hiraga (2002), food is a huge business in Japan. The Japanese spent more than 660 billion US$ on food in 1995. These figures have increased phenomenally in recent years. The International Trade Center (2001) estimated retail sales of Japanese organic food and beverages at about 2.5-3.0 billion US$. The Japanese Integrated Market Institute estimated the Japanese organic food market at 2.8 billion US$ in 2000, of which 360 million was imported. According to the Japanese Integrated Market Institute, imports of organic products are likely to grow by 40% (Hiraga, 2002). In Japan, organic products are marketed for sale through various channels such as large companies (e.g. Kirin), family businesses, the Japanese Tei-Kei system, consumer cooperatives, etc.; however, delivery services control the largest organic market share (Yossefi and Willer, 2002).
Market Opportunities and Challenges for Indian Organic Products 24
According to Hiraga (2002), the Japanese choose organic food because they are concerned about food safety. A variety of food scares have frightened Japanese consumers (e.g. food poisoning, BSE crises etc.). The US organic market With retail sales of organic food and beverages of about 9.5 billion US$ for 2001, the US is the world’s largest market for organic products (Kortbech, 2002). Kortbech states that sales might reach 20 billion US$ by 2005 (Kortbech, 2002). The main factors in this positive growth are strong consumer awareness of health and environmental issues (Kortbech 2002, Yossefi and Willer 2002). In the United States, organic food is sold to consumers through the following channels: natural food stores (48%), conventional grocery stores (49%) and direct-to-consumer markets (3%) (Greene, 2002). According to Greene (2002), fresh produce remains the top selling organic category, followed by non-dairy beverages, breads and grains, packaged foods (frozen and dried prepared foods, baby food, soups, and desserts), and dairy products. Organic dairy was the most rapidly growing organic food segment during the 1990s, followed closely by sales of juice, soymilk and other non-dairy beverages (Greene, 2002). Organic meat sales accounted for 3 percent of total organic sales in 2000, according to industry statistics, and the jump in organically raised livestock between 1997 and 2001 confirms the fast growing pace of this sector (Greene, 2002). According to Kortbech (2002), developing countries have sales opportunities in the following product categories:
• Tropical products (coffee, cocoa, tea, tropical fruits and vegetables); • Off-season products (fruit and vegetables); • In-season products (fruits and vegetables in temporary or permanent short
supply); • Specialty and other products (wines, ethnic foods, herbs, spices, essential oils,
sugar, feed grains, and seed grains). Concerning pricing, Kortbech (2002) suggests that producer and exporter in developing countries should not overestimate the price premium payable in the USA. Normally the U.S. organic consumer may accept price premiums of 10-20%, or a maximum of 25%. If the price premium is higher, the consumer will usually avoid buying organic products. Therefore, producers and exporters should base their export prices on realistic production costs and price expectations. To be certain that organic products will be accepted in the US organic market, the producer/exporter should choose a certification body that provides access to the US market, for example, a certification body accredited by the National Organic Program (NOP); alternatively it is possible to have organic products re-certified by an accredited certification agency (Kortbech 2002). The European organic market The European market for organic food is undergoing strong expansion (Hamm et al. 2002). However, its development varies from country to country. By the year 2005 the share of organic foods in the European market is estimated to reach values of between
Market Opportunities and Challenges for Indian Organic Products 25
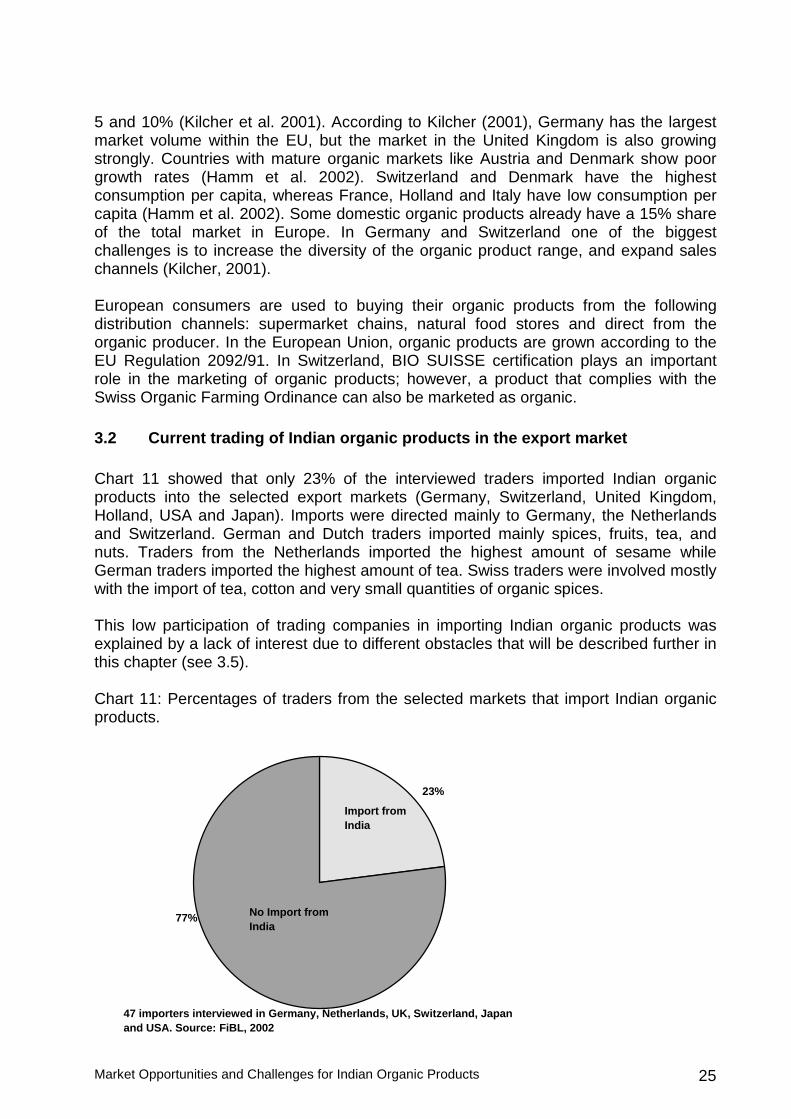
5 and 10% (Kilcher et al. 2001). According to Kilcher (2001), Germany has the largest market volume within the EU, but the market in the United Kingdom is also growing strongly. Countries with mature organic markets like Austria and Denmark show poor growth rates (Hamm et al. 2002). Switzerland and Denmark have the highest consumption per capita, whereas France, Holland and Italy have low consumption per capita (Hamm et al. 2002). Some domestic organic products already have a 15% share of the total market in Europe. In Germany and Switzerland one of the biggest challenges is to increase the diversity of the organic product range, and expand sales channels (Kilcher, 2001). European consumers are used to buying their organic products from the following distribution channels: supermarket chains, natural food stores and direct from the organic producer. In the European Union, organic products are grown according to the EU Regulation 2092/91. In Switzerland, BIO SUISSE certification plays an important role in the marketing of organic products; however, a product that complies with the Swiss Organic Farming Ordinance can also be marketed as organic. 3.2 Current trading of Indian organic products in the export market Chart 11 showed that only 23% of the interviewed traders imported Indian organic products into the selected export markets (Germany, Switzerland, United Kingdom, Holland, USA and Japan). Imports were directed mainly to Germany, the Netherlands and Switzerland. German and Dutch traders imported mainly spices, fruits, tea, and nuts. Traders from the Netherlands imported the highest amount of sesame while German traders imported the highest amount of tea. Swiss traders were involved mostly with the import of tea, cotton and very small quantities of organic spices. This low participation of trading companies in importing Indian organic products was explained by a lack of interest due to different obstacles that will be described further in this chapter (see 3.5). Chart 11: Percentages of traders from the selected markets that import Indian organic products.
No Import fromIndia
Import fromIndia
77%
23%
47 importers interviewed in Germany, Netherlands, UK, Switzerland, Japan and USA. Source: FiBL, 2002
Market Opportunities and Challenges for Indian Organic Products 26
The Indian organic products that are traded in the selected market are shown in Table 13. The values shown are totals for each product across the different countries. Sesame is one product that is imported in higher volumes, followed by organic fruits (such as frozen mango puree and pineapple juice). In the third place come the well-known Indian spices, such as black and white pepper, ginger etc. Out of the tea varieties, higher amounts of black tea than green tea are imported. Table 13: Imported Indian organic products in the selected markets Product Volumes
(tons) Season % of turnover
Tea (green and black) 65 Through out the year 10-15 Spices (mainly pepper, ginger and hibiscus)
132 Through out the year 10-15
Fruits (mango and pineapple) 160 May-July, November-May 6 -10 Nuts (walnut and cashew nut) 28 October and July 10-15 Sesame 600 Through out the year 10-15 Base: 8 traders Source: FiBL, 2002 Questioned on the proportion of Indian products in relation to the total market volume for their trading companies, traders answer with an average estimate of 10%. Traders’ estimates of the annual growth rate in turnover of imported Indian organic products since 2000 was between 10-15% (Table 13) No information was obtained about the suppliers and the origins of the Indian organic products; traders in the selected export markets did not respond on these points. 3.3 Potential for organic products in the selected export markets 3.3.1 Sales and potential demand for organic products in the selected export markets In order to identify some trends relevant to supplying the selected export markets with Indian organic products, traders were asked about their own estimates of the following products: rice, spices, coffee, tea, pineapple, mango, bananas, vanilla, nuts and protein grains. The following alternatives were given: 1. Very good, 2. Good, 3. Moderate, 4. Poor. From the data obtained, average values were calculated across the different products (Table 14). In their responses to the questions about sales and potential of the listed products, traders (20) were optimistic concerning their sales and the potential for the listed organic products in their corresponding markets. Their opinion ranged from ’good’ to ’moderate’ conditions. No one considered the present market situation for the given products to be ’very good’. On the other hand, traders rated the prospects of being supplied (availability) with Indian organic products from ’moderate’ to ’poor’. Traders explained that they do not have reliable information about organic products from India, and that India still has an image as a country where organic products are not produced. Of course some traders reported positive experiences of obtaining organic products from India; some of them even carry out their own organic projects, such as organic basmati rice production.
Market Opportunities and Challenges for Indian Organic Products 27
Table 14: Frame conditions for sales of organic products in the selected export markets Product Sales Potential Availability Tea good-moderate good-moderate good-moderate Rice Good good-moderate moderate-poor Protein grains good-moderate good poor Spices good-moderate good-moderate moderate Vanilla good-moderate good-moderate moderate-poor Mango moderate-good moderate-good moderate-poor Pineapple good-moderate good-moderate moderate-poor Bananas good-moderate moderate moderate-poor Nuts Good good poor
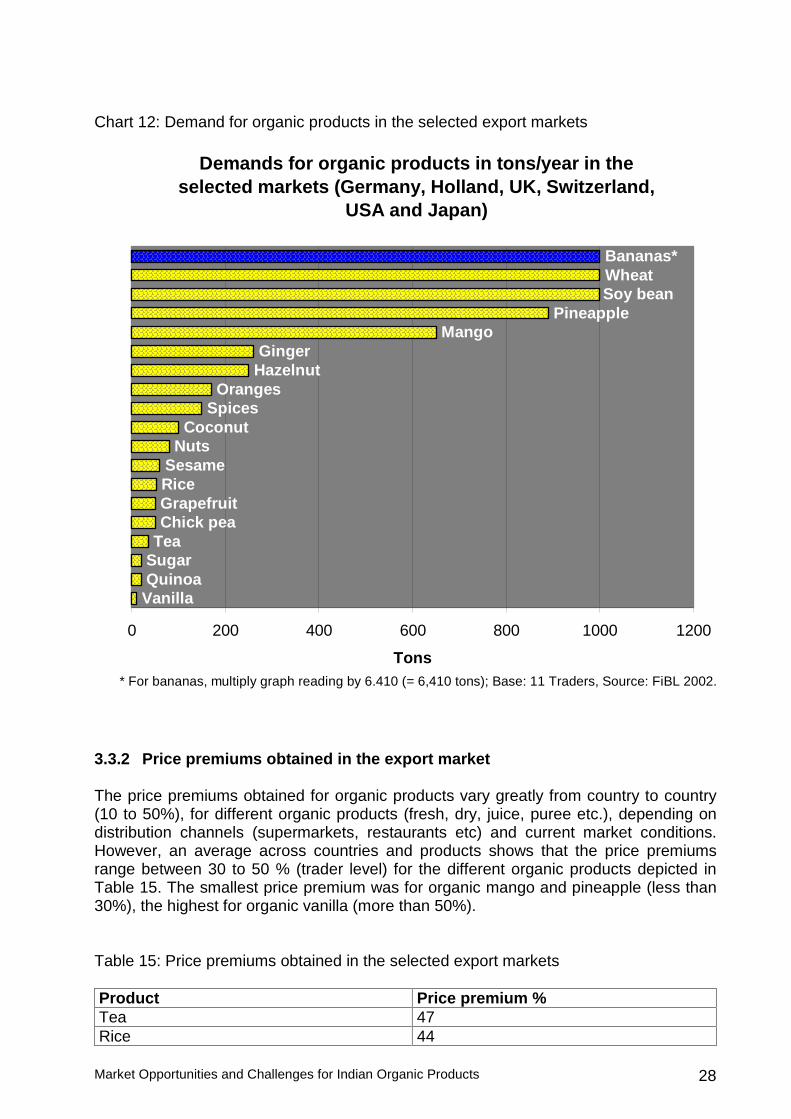
Base: 20 traders Source: FiBL, 2002 Further analysis of this data shows that even with traditional Indian products, such as spices, traders are not confident of obtaining supplies of spices of organic quality. In the case of organic rice, the potential availability from India was rated ’moderate’ to ’poor’. Organic tea was the only product for which traders rated availability from India as ’good’. Chart 12 shows the annual demand for organic products (tons) for sale in the selected markets. Of the products mentioned, bananas are sold in high quantities followed by wheat and soybean. Tropical organic fruits such as pineapple and mango occupy third place. The rest of the organic products mentioned are sold in quantities ranging from 10 to 260 tons per year. The suppliers of these products are from neighboring countries like Sri Lanka, China, Thailand, or South America, Africa and Europe. To the question which organic products would be interesting to get from India, the interviewed traders mentioned the following products:
• Basmati rice (if there is enough volume and possible combination with fair trade); • Spices (from small quantities to 50 tons); • Tea (only if high quality, up to 40 tons); • Coffee (only if high quality); • Mango (fresh, dry and puree, small quantities up to 50 tons); • Pineapple (juice, dry, small quantities up to 50 tons); • Bananas (fresh and dry, small quantities up to 70 tons); • Organic vanilla (only if good price and high quality, up to 10 tons); • Cashew nuts (only if good price and high quality); • Protein grains (of interest if there is not a problem with the quality).
From the traders’ point of view, the quantities to be imported depend mostly on quality, price, reliable shipments and available volumes.
Market Opportunities and Challenges for Indian Organic Products 28
Chart 12: Demand for organic products in the selected export markets
Demands for organic products in tons/year in the selected markets (Germany, Holland, UK, Switzerland,
USA and Japan)
VanillaQuinoaSugarTeaChick peaGrapefruitRiceSesame
NutsCoconut
SpicesOranges
HazelnutGinger
Mango
WheatSoy bean
Pineapple
Bananas*
0 200 400 600 800 1000 1200
Tons* For bananas, multiply graph reading by 6.410 (= 6,410 tons); Base: 11 Traders, Source: FiBL 2002.
3.3.2 Price premiums obtained in the export market The price premiums obtained for organic products vary greatly from country to country (10 to 50%), for different organic products (fresh, dry, juice, puree etc.), depending on distribution channels (supermarkets, restaurants etc) and current market conditions. However, an average across countries and products shows that the price premiums range between 30 to 50 % (trader level) for the different organic products depicted in Table 15. The smallest price premium was for organic mango and pineapple (less than 30%), the highest for organic vanilla (more than 50%). Table 15: Price premiums obtained in the selected export markets Product Price premium % Tea 47 Rice 44
Market Opportunities and Challenges for Indian Organic Products 29
Protein grains 44 Spices 30 Vanilla 53 Mango 25 Pineapple 28 Bananas 31 Nuts 40
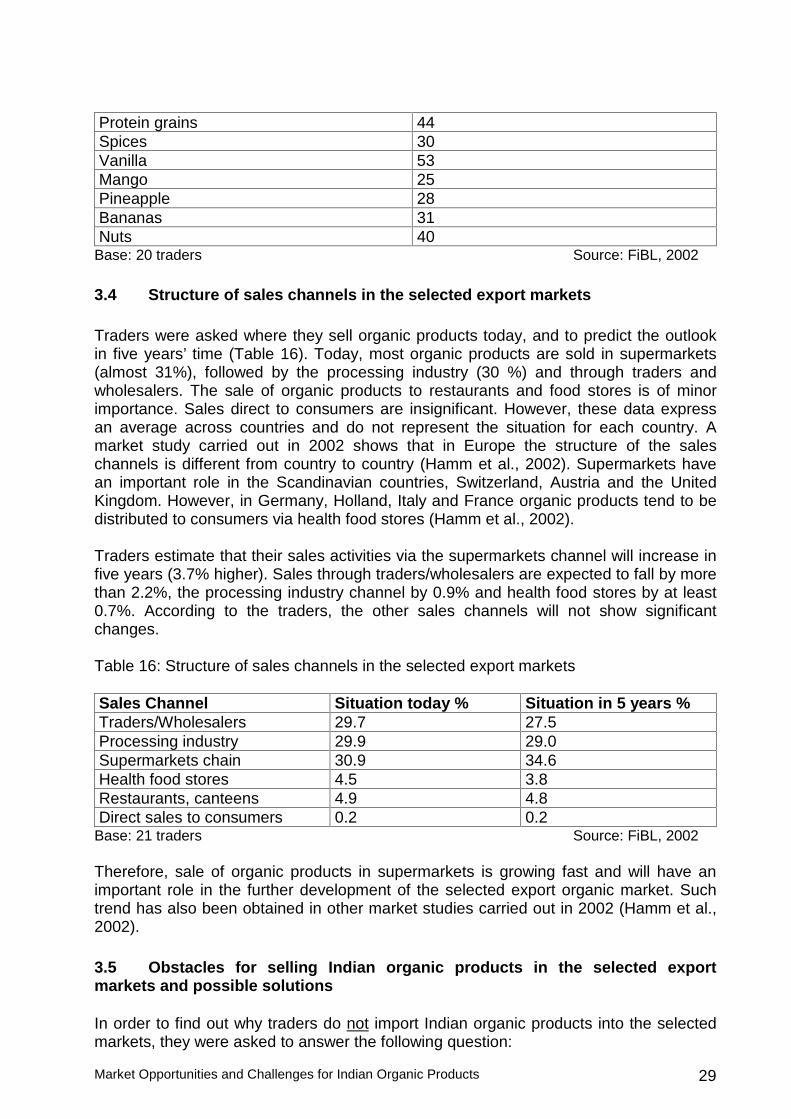
Base: 20 traders Source: FiBL, 2002 3.4 Structure of sales channels in the selected export markets Traders were asked where they sell organic products today, and to predict the outlook in five years’ time (Table 16). Today, most organic products are sold in supermarkets (almost 31%), followed by the processing industry (30 %) and through traders and wholesalers. The sale of organic products to restaurants and food stores is of minor importance. Sales direct to consumers are insignificant. However, these data express an average across countries and do not represent the situation for each country. A market study carried out in 2002 shows that in Europe the structure of the sales channels is different from country to country (Hamm et al., 2002). Supermarkets have an important role in the Scandinavian countries, Switzerland, Austria and the United Kingdom. However, in Germany, Holland, Italy and France organic products tend to be distributed to consumers via health food stores (Hamm et al., 2002). Traders estimate that their sales activities via the supermarkets channel will increase in five years (3.7% higher). Sales through traders/wholesalers are expected to fall by more than 2.2%, the processing industry channel by 0.9% and health food stores by at least 0.7%. According to the traders, the other sales channels will not show significant changes. Table 16: Structure of sales channels in the selected export markets Sales Channel Situation today % Situation in 5 years % Traders/Wholesalers 29.7 27.5 Processing industry 29.9 29.0 Supermarkets chain 30.9 34.6 Health food stores 4.5 3.8 Restaurants, canteens 4.9 4.8 Direct sales to consumers 0.2 0.2
Base: 21 traders Source: FiBL, 2002 Therefore, sale of organic products in supermarkets is growing fast and will have an important role in the further development of the selected export organic market. Such trend has also been obtained in other market studies carried out in 2002 (Hamm et al., 2002). 3.5 Obstacles for selling Indian organic products in the selected export markets and possible solutions In order to find out why traders do not import Indian organic products into the selected markets, they were asked to answer the following question:
Market Opportunities and Challenges for Indian Organic Products 30
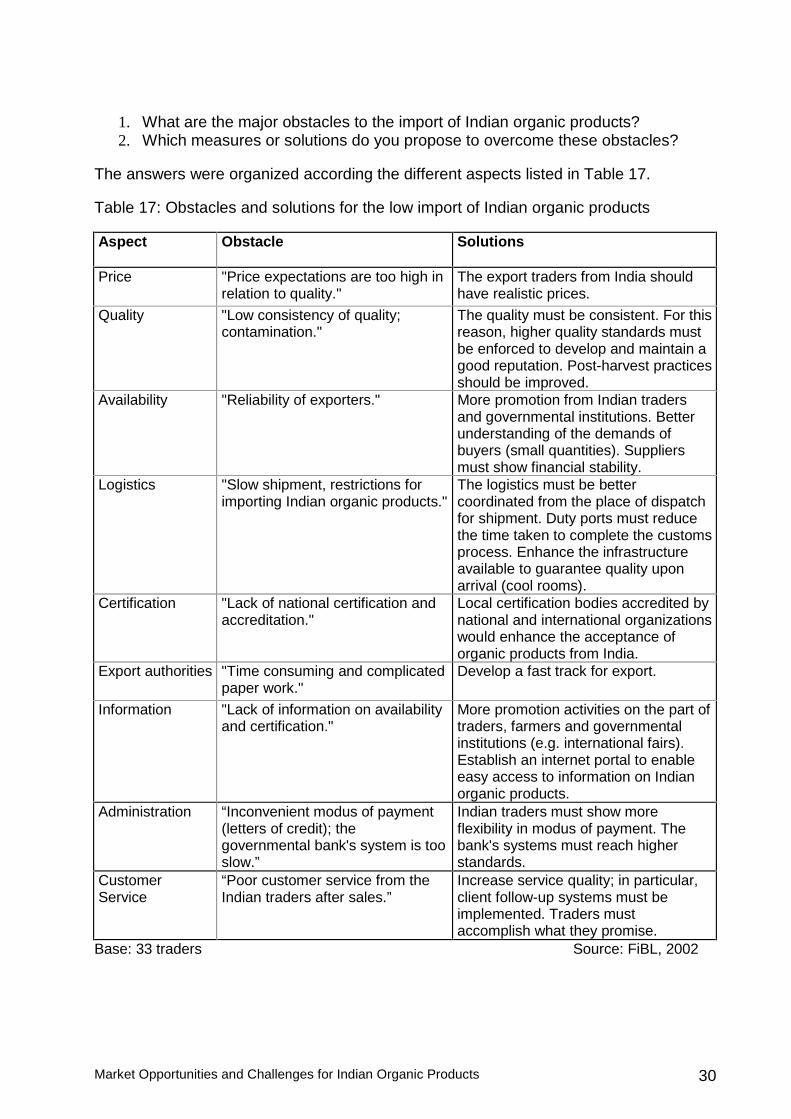
1. What are the major obstacles to the import of Indian organic products? 2. Which measures or solutions do you propose to overcome these obstacles?
The answers were organized according the different aspects listed in Table 17. Table 17: Obstacles and solutions for the low import of Indian organic products Aspect Obstacle Solutions
Price "Price expectations are too high in relation to quality."
The export traders from India should have realistic prices.
Quality "Low consistency of quality; contamination."
The quality must be consistent. For this reason, higher quality standards must be enforced to develop and maintain a good reputation. Post-harvest practices should be improved.
Availability "Reliability of exporters." More promotion from Indian traders and governmental institutions. Better understanding of the demands of buyers (small quantities). Suppliers must show financial stability.
Logistics "Slow shipment, restrictions for importing Indian organic products."
The logistics must be better coordinated from the place of dispatch for shipment. Duty ports must reduce the time taken to complete the customs process. Enhance the infrastructure available to guarantee quality upon arrival (cool rooms).
Certification "Lack of national certification and accreditation."
Local certification bodies accredited by national and international organizations would enhance the acceptance of organic products from India.
Export authorities "Time consuming and complicated paper work."
Develop a fast track for export.
Information "Lack of information on availability and certification."
More promotion activities on the part of traders, farmers and governmental institutions (e.g. international fairs). Establish an internet portal to enable easy access to information on Indian organic products.
Administration “Inconvenient modus of payment (letters of credit); the governmental bank's system is too slow.”
Indian traders must show more flexibility in modus of payment. The bank's systems must reach higher standards.
Customer Service
“Poor customer service from the Indian traders after sales.”
Increase service quality; in particular, client follow-up systems must be implemented. Traders must accomplish what they promise.
Base: 33 traders Source: FiBL, 2002
Market Opportunities and Challenges for Indian Organic Products 31
4 SUMMARY AND RECOMMENDATIONS
4.1 Summary 4.1.1 Organic farming scenario Organic farming in India is in a nascent stage. According to official statistics, until February 2001 there were only 304 organic farms in India and the figure has increased to 1,426 farms during February 2002. The area under organic cultivation as on February 2002 was 2,775 hectares, accounting for barely 0.0015% of total agricultural land (Source: Adopted from report “The Real Green Revolution and FAO statistics”). However, the database is still very poor and it can be assumed that the real figures are much higher. Organic products produced in India are tea, spices, fruits and vegetables, rice, coffee, cashew nuts, oil seeds, wheat, pulses, cotton and herbal extracts. India is classified into 21 agro-ecological zones based on temperature, soil conditions, and rainfall. Hence, each zone has a comparative advantage for the production of different products, e.g. tea in the eastern region, spices and coffee in the southern region, rice and wheat in the northern region, cotton in the western region. Products with potential in the domestic market are fruit, vegetables, rice and wheat. Products with potential in the export market are tea, rice, fruits and vegetables, cotton, wheat and spices. Besides these potentials India has the following advantages:
• India is strong in high quality production of tea, spices, rice specialties, ayurvedic herbs etc;
• India has a rich heritage of agricultural traditions which are suitable for designing organic production systems;
• In several regions of India agriculture is not very intensive as regards the use of agro-chemicals (mountain areas);
• The labor is relatively cheap compared to agro-chemicals;
• The NGO sector in India is very strong and has established close linkages to large numbers of marginal farmers;
• The Indian Government started to support organic agriculture on a large scale and on various levels.
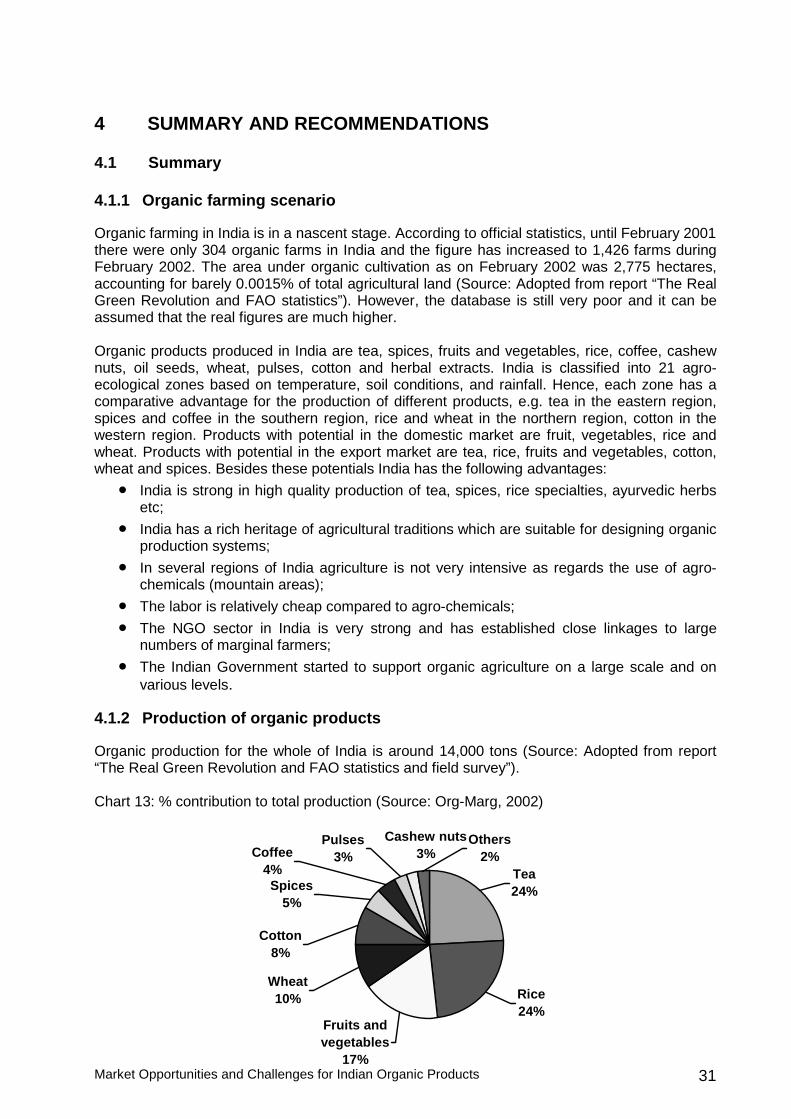
4.1.2 Production of organic products Organic production for the whole of India is around 14,000 tons (Source: Adopted from report “The Real Green Revolution and FAO statistics and field survey”). Chart 13: % contribution to total production (Source: Org-Marg, 2002)
Wheat10%
Fruits and vegetables
17%
Rice24%
Tea24%
Pulses3%Coffee
4%
Cashew nuts3%
Others2%
Spices5%
Cotton8%
Market Opportunities and Challenges for Indian Organic Products 32
4.1.3 Market for organic products According to the survey, domestic sales of organic products amount to 1050 tons. This accounts for barely 7.5 % of total organic production and is likely to reach domestic sales of 1,568 tons during 2006-07. Major domestic markets are cities like Mumbai, Bangalore, Delhi, Chennai and Hyderabad. Distribution channels are via traders /wholesalers and supermarket chains. In India, organic consumers are generally found in the urban upper-middle class or upper class, though some sellers do state that lower-middle class families in smaller towns, especially families with children, also number among their clients. Organic vegetables and fruits are the major organic products desired by Indian customers. The market has not grown large so far due to lack of marketing initiatives from key players (producers, traders, NGOs, etc.), the low awareness of organic products from customers and their higher price. However, there seems to be increasing health awareness spreading among the literate part of the Indian population, and pesticides were broadly discussed in the media as a likely source of various health problems. Indian traditions also put emphasis on the importance of diet. It can be assumed therefore that awareness of the health benefits of consuming organic products will increase considerably in the coming years. Recently, a number of domestic marketing initiatives have been launched, some of which have registered positive success. A semi-government-operated cooperation initiative has started to sell organic products in a number of outlets in the major cities. Several brand-name companies have begun to include organic products in their lines. Even in rural areas, numerous farmers’ groups and NGOs have started selling organic products. However, as yet very little information is available on the size and success of the domestic organic market. According to this survey, export sales of organic products amount to 11,925 tons. These account for 85 % of total production and are likely reach export sales of 21,525 tons during 2006-07. The major export markets are Australia, Belgium Canada, France, Germany, Italy, Japan, Netherlands, Sweden, Singapore, South Africa, Saudi Arabia, UAE, the United Kingdom and USA. Tea is exported directly by the producers (states). Other organic products are produced mainly by small farmers, and hence exported through exporters. However, other organic products also produced by organized players are exported directly to various countries. 4.1.4 Unsold stock of organic products in the Indian and export market Unsold stock of certified organic products was about 1025 tons in 2002. Unsold stock is mainly left with wholesalers / traders level as well as in supermarkets. Major reasons for unsold stock are the high price and lack of marketing initiatives in the domestic market. Traders from the selected export markets mentioned the following reasons for not carrying imports of Indian organic products (these are arranged in order of priority):
• Lack of information on availability and certification; • Price expectations too high in relation to quality; • Low consistency of quality and contamination; • Reliability of exporters; • Slow shipment, restrictions on importing Indian organic products;
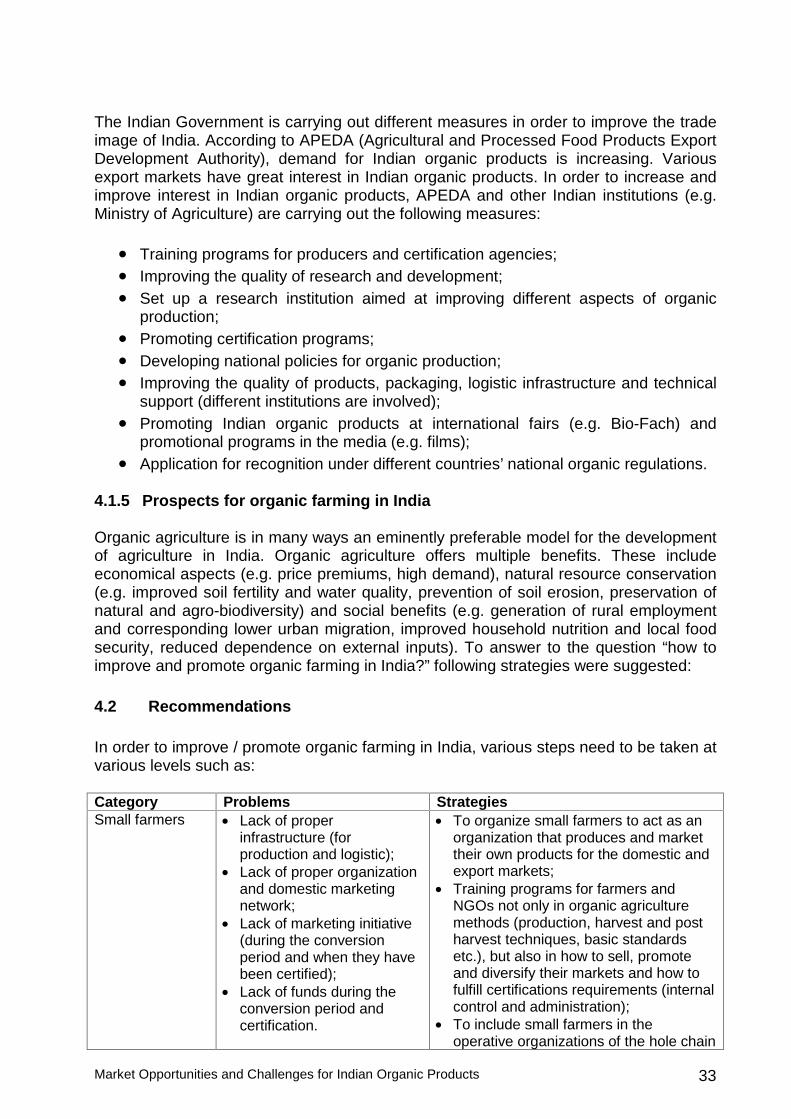
Market Opportunities and Challenges for Indian Organic Products 33
The Indian Government is carrying out different measures in order to improve the trade image of India. According to APEDA (Agricultural and Processed Food Products Export Development Authority), demand for Indian organic products is increasing. Various export markets have great interest in Indian organic products. In order to increase and improve interest in Indian organic products, APEDA and other Indian institutions (e.g. Ministry of Agriculture) are carrying out the following measures:
• Training programs for producers and certification agencies; • Improving the quality of research and development; • Set up a research institution aimed at improving different aspects of organic
production; • Promoting certification programs; • Developing national policies for organic production; • Improving the quality of products, packaging, logistic infrastructure and technical
support (different institutions are involved); • Promoting Indian organic products at international fairs (e.g. Bio-Fach) and
promotional programs in the media (e.g. films); • Application for recognition under different countries’ national organic regulations.
4.1.5 Prospects for organic farming in India Organic agriculture is in many ways an eminently preferable model for the development of agriculture in India. Organic agriculture offers multiple benefits. These include economical aspects (e.g. price premiums, high demand), natural resource conservation (e.g. improved soil fertility and water quality, prevention of soil erosion, preservation of natural and agro-biodiversity) and social benefits (e.g. generation of rural employment and corresponding lower urban migration, improved household nutrition and local food security, reduced dependence on external inputs). To answer to the question “how to improve and promote organic farming in India?” following strategies were suggested: 4.2 Recommendations In order to improve / promote organic farming in India, various steps need to be taken at various levels such as: Category Problems Strategies Small farmers • Lack of proper
infrastructure (for production and logistic);
• Lack of proper organization and domestic marketing network;
• Lack of marketing initiative (during the conversion period and when they have been certified);
• Lack of funds during the conversion period and certification.
• To organize small farmers to act as an organization that produces and market their own products for the domestic and export markets;
• Training programs for farmers and NGOs not only in organic agriculture methods (production, harvest and post harvest techniques, basic standards etc.), but also in how to sell, promote and diversify their markets and how to fulfill certifications requirements (internal control and administration);
• To include small farmers in the operative organizations of the hole chain
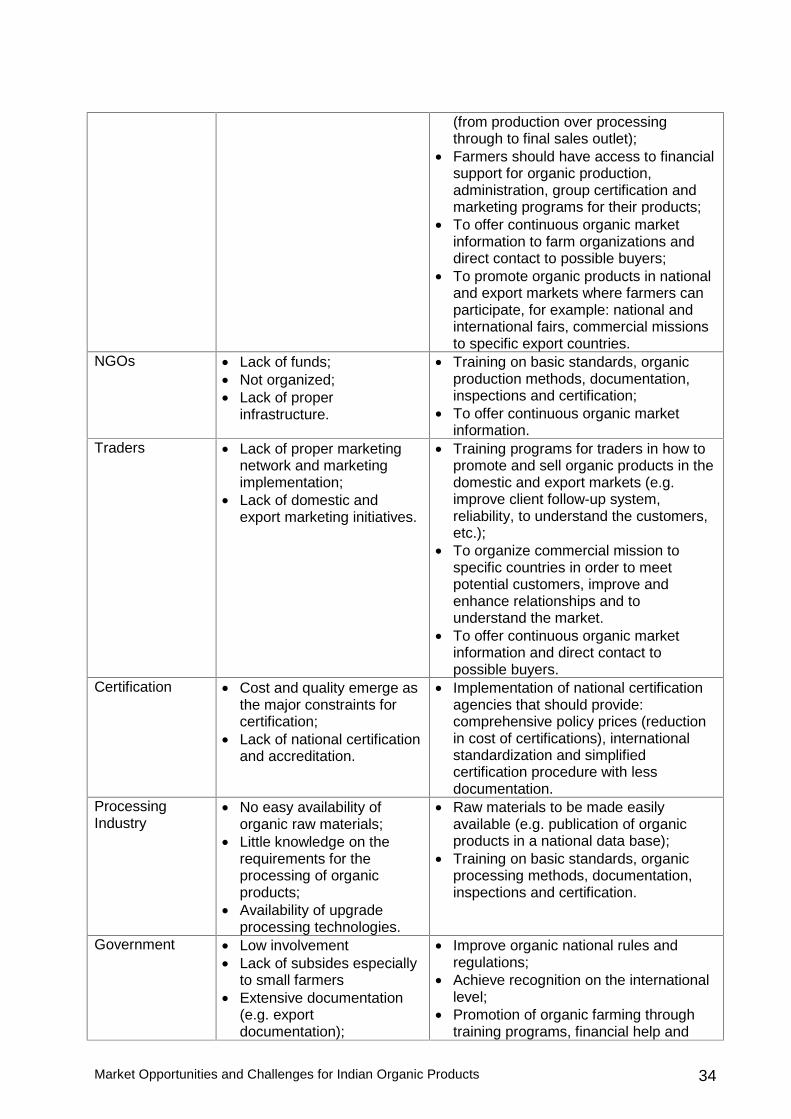
Market Opportunities and Challenges for Indian Organic Products 34
(from production over processing through to final sales outlet);
• Farmers should have access to financial support for organic production, administration, group certification and marketing programs for their products;
• To offer continuous organic market information to farm organizations and direct contact to possible buyers;
• To promote organic products in national and export markets where farmers can participate, for example: national and international fairs, commercial missions to specific export countries.
NGOs • Lack of funds; • Not organized; • Lack of proper
infrastructure.
• Training on basic standards, organic production methods, documentation, inspections and certification;
• To offer continuous organic market information.
Traders • Lack of proper marketing network and marketing implementation;
• Lack of domestic and export marketing initiatives.
• Training programs for traders in how to promote and sell organic products in the domestic and export markets (e.g. improve client follow-up system, reliability, to understand the customers, etc.);
• To organize commercial mission to specific countries in order to meet potential customers, improve and enhance relationships and to understand the market.
• To offer continuous organic market information and direct contact to possible buyers.
Certification • Cost and quality emerge as the major constraints for certification;
• Lack of national certification and accreditation.
• Implementation of national certification agencies that should provide: comprehensive policy prices (reduction in cost of certifications), international standardization and simplified certification procedure with less documentation.
Processing Industry
• No easy availability of organic raw materials;
• Little knowledge on the requirements for the processing of organic products;
• Availability of upgrade processing technologies.
• Raw materials to be made easily available (e.g. publication of organic products in a national data base);
• Training on basic standards, organic processing methods, documentation, inspections and certification.
Government • Low involvement • Lack of subsides especially
to small farmers • Extensive documentation
(e.g. export documentation);
• Improve organic national rules and regulations;
• Achieve recognition on the international level;
• Promotion of organic farming through training programs, financial help and
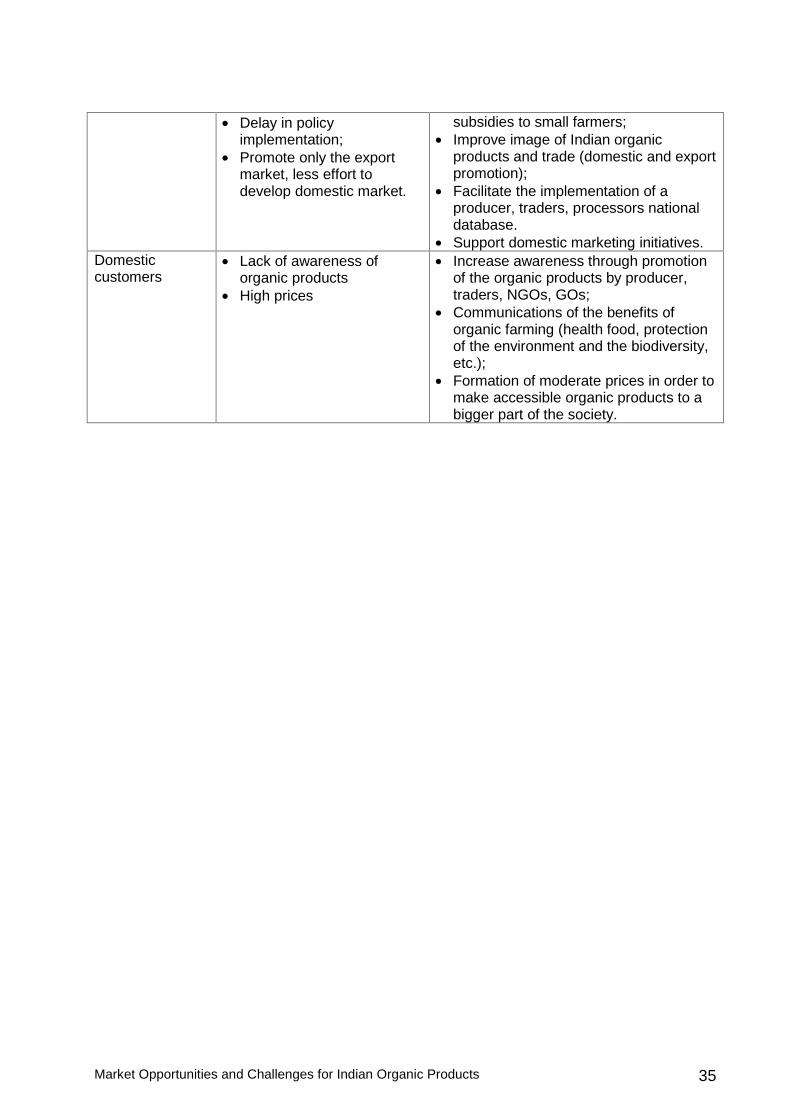
Market Opportunities and Challenges for Indian Organic Products 35
• Delay in policy implementation;
• Promote only the export market, less effort to develop domestic market.
subsidies to small farmers; • Improve image of Indian organic
products and trade (domestic and export promotion);
• Facilitate the implementation of a producer, traders, processors national database.
• Support domestic marketing initiatives. Domestic customers
• Lack of awareness of organic products
• High prices
• Increase awareness through promotion of the organic products by producer, traders, NGOs, GOs;
• Communications of the benefits of organic farming (health food, protection of the environment and the biodiversity, etc.);
• Formation of moderate prices in order to make accessible organic products to a bigger part of the society.
Market Opportunities and Challenges for Indian Organic Products 36
5 REFERENCES Greene C. 2002. Organic Farming and Marketing in the U.S. Economic Research Service. U.S.D.A. Washington, DC. Hamm U., Gronefeld F. and Halpin D. 2002. Organic Marketing Initiatives and Rural Development: Analysis of the European Market for Organic Food. School of Management and Business. Aberystwyth, United Kingdom. Hiraga M. 2002. Japanese Organic Market: Market opportunities and characteristics. Bio Market Inc. Japan. Kilcher L., Landau B., Richter T. and Schmid O. 2001. The Organic Market in Switzerland and the European Union: Overview and Market Access Information for Producer and International Trading Companies. Swiss Import Promotion Program and Research Institute of Organic Agriculture. Zürich/Frick, Switzerland. Kortbech O.R. 2002. The United States Market for Organic Food and Beverages. International Trade Center. UNCTAD/WTO. Organic and Biodynamic farming. 2001. Government of India, planning commission, September 2001. Parrot N. and Mardsen T. 2002. The Real Green Revolution: Organic and Agroecological Farming in the South. Greenpeace Environmental Trust. London, United Kingdom. Yussefi M. and Willer H. 2002. Organic Agriculture World Wide 2002, Statistics and Future Prospects. Stiftung Ökologie and Landbau. Bad Dürkheim, Germany.
Market Opportunities and Challenges for Indian Organic Products 37
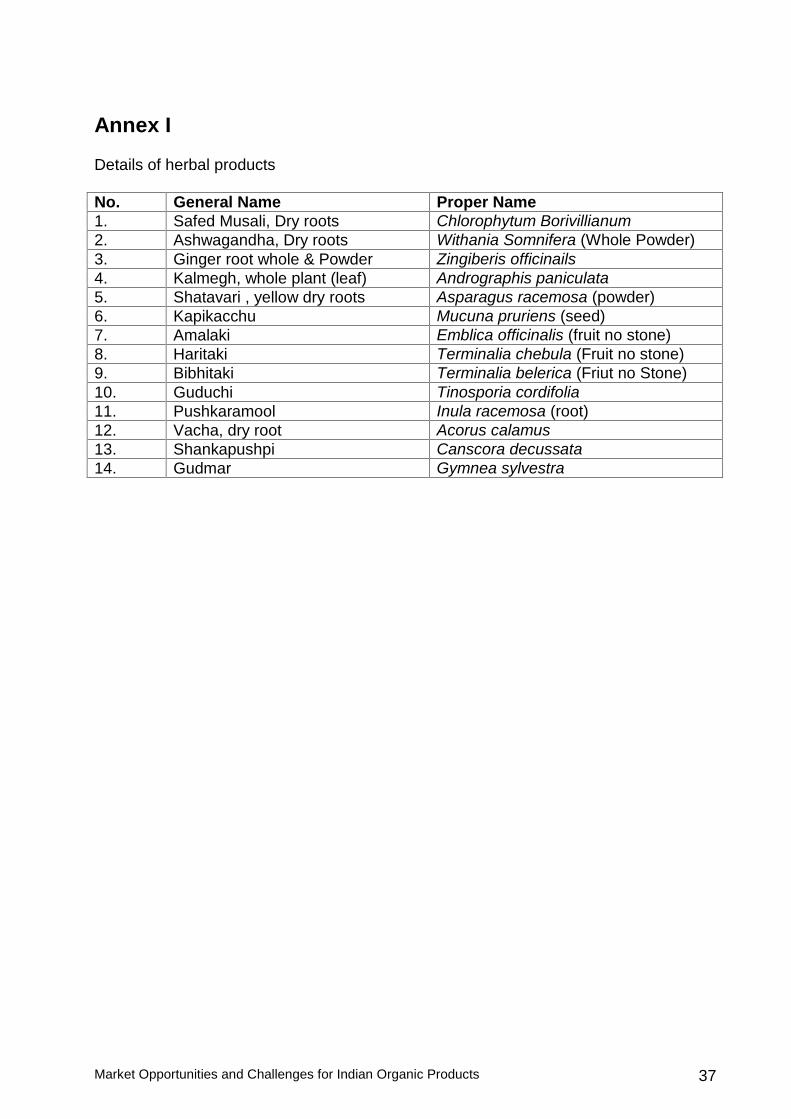
Annex I Details of herbal products No. General Name Proper Name 1. Safed Musali, Dry roots Chlorophytum Borivillianum 2. Ashwagandha, Dry roots Withania Somnifera (Whole Powder) 3. Ginger root whole & Powder Zingiberis officinails 4. Kalmegh, whole plant (leaf) Andrographis paniculata 5. Shatavari , yellow dry roots Asparagus racemosa (powder) 6. Kapikacchu Mucuna pruriens (seed) 7. Amalaki Emblica officinalis (fruit no stone) 8. Haritaki Terminalia chebula (Fruit no stone) 9. Bibhitaki Terminalia belerica (Friut no Stone) 10. Guduchi Tinosporia cordifolia 11. Pushkaramool Inula racemosa (root) 12. Vacha, dry root Acorus calamus 13. Shankapushpi Canscora decussata 14. Gudmar Gymnea sylvestra
Market Opportunities and Challenges for Indian Organic Products 38
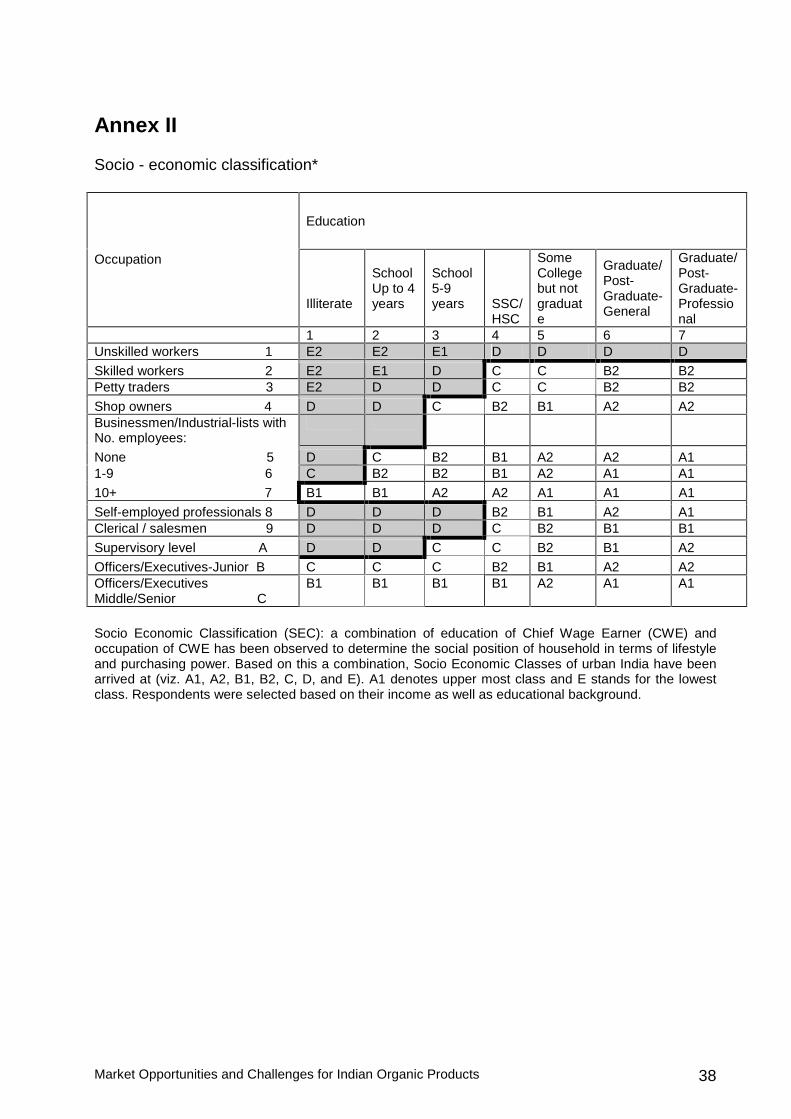
Annex II Socio - economic classification*
Education
Occupation Illiterate
School Up to 4 years
School 5-9 years
SSC/HSC
Some College but not graduate
Graduate/ Post- Graduate- General
Graduate/ Post- Graduate- Professional
1 2 3 4 5 6 7 Unskilled workers 1 E2 E2 E1 D D D D
Skilled workers 2 E2 E1 D C C B2 B2 Petty traders 3 E2 D D C C B2 B2
Shop owners 4 D D C B2 B1 A2 A2 Businessmen/Industrial-lists with No. employees:
None 5 D C B2 B1 A2 A2 A1 1-9 6 C B2 B2 B1 A2 A1 A1
10+ 7 B1 B1 A2 A2 A1 A1 A1
Self-employed professionals 8 D D D B2 B1 A2 A1 Clerical / salesmen 9 D D D C B2 B1 B1
Supervisory level A D D C C B2 B1 A2
Officers/Executives-Junior B C C C B2 B1 A2 A2 Officers/Executives Middle/Senior C
B1 B1 B1 B1 A2 A1 A1
Socio Economic Classification (SEC): a combination of education of Chief Wage Earner (CWE) and occupation of CWE has been observed to determine the social position of household in terms of lifestyle and purchasing power. Based on this a combination, Socio Economic Classes of urban India have been arrived at (viz. A1, A2, B1, B2, C, D, and E). A1 denotes upper most class and E stands for the lowest class. Respondents were selected based on their income as well as educational background.