market outlook 04-09-2013
TRANSCRIPT

7/30/2019 Market Outlook 04-09-2013
http://slidepdf.com/reader/full/market-outlook-04-09-2013 1/12
www.angelbroking.com
Market Outlook September 4, 2013
Dealer’s Diary Indian markets are expected to open flat to negative tracking flat opening in SGX
Nifty. Most of the Asian markets are trading in the negative territory.
The US markets managed to end Tuesday's trading mostly higher but were well off
their best levels of the day. Lingering concerns about the situation in Syria and theoutlook for the Federal Reserve's stimulus program limited the upside for the
markets. The major averages all ended the day in positive territory, partly offsetting
the losses posted last week. Meanwhile the European markets ended Tuesday's
session with mixed results, following the strong gains of the previous session. A
report that missiles had been launched in the Mediterranean Sea caused the
markets to drop sharply in the morning. However, they bounced back after the
launch turned out to be part of a joint test between the U.S. and Israeli militaries
Indian shares fell sharply on Tuesday, as the rupee fell over 3 percent to breach
the 68 level to the dollar, stoking concerns afresh on the external front. Worries
about the fiscal deficit also returned to the fore after the Rajya Sabha passed the
Food Security Bill and Goldman Sachs joined the downgrading bandwagon,
sharply cutting India's GDP forecast for FY14 to 4 percent from 6 percent
previously and to 5.4 percent from 6.8 percent for FY15.
Markets Today
The trend deciding level for the day is 18,469/ 5,415 levels. If NIFTY trades above
this level during the first half-an-hour of trade then we may witness a further rally
up to 18,773 – 19,311 / 5,507 – 5,673 levels. However, if NIFTY trades below
18,469/ 5,415 levels for the first half-an-hour of trade then it may correct up to
17,931 – 17,628/ 5,250 – 5,158 levels.
Indices S2 S1 PIVOT R1 R2
SENSEX 17,628 17,931 18,469 18,773 19,311
NIFTY 5,158 5,250 5,415 5,507 5,673
News Analysis
Steel players raise steel prices TCS bags deal from DNB, Norway’s largest financial group LIC Housing Finance raises home loan rates by 35 bps
Refer detailed news analysis on the following page
Net Inflows (September 02, 2013)
` cr Purch Sales Net MTD YTD
FII 2,516 2,014 502 502 59,699MFs 267 471 (204) (204) (13,200)
FII Derivatives (September 03, 2013)
` cr Purch Sales Net Open Interest
Index Futures 2,530 4,380 (1,851) 10,734
Stock Futures 2,855 2,631 224 25,832
Gainers / Losers
Gainers Losers
Company Price (`) chg (%) Company Price (`) chg (%)
MCX 411 5.0 Axis Bank 783 (9.3)
Lupin 840 2.6 Yes Bank 229 (9.1)
Mphasis 442 2.1 Piramal Ent 566 (8.9)
Britannia Inds 730 2.1 TV18 Broadcast 17 (8.7)
Amara Raja 258 2.0 Indusind Bank 349 (8.5)
Domestic Indices Chg (%) (Pts) (Close)
BSE Sensex (3.4) (651) 18,235
Nifty (3.8) (209) 5,341
MID CAP (1.9) (100) 5,276
SMALL CAP (1.0) (50) 5,194
BSE HC (2.2) (198) 8,840
BSE PSU (1.5) (78) 4,982
BANKEX (5.1) (527) 9,871
AUTO (1.5) (157) 10,082
METAL (2.8) (222) 7,809
OIL & GAS (3.6) (303) 8,054
BSE IT (1.4) (113) 7,925
Global Indices Chg (%) (Pts) (Close)
Dow Jones 0.2 24 14,834NASDAQ 0.6 23 3,613
FTSE (0.6) (38) 6,468
Nikkei 3.0 406 13,978
Hang Sang 1.0 219 22,395
Straits Times (0.0) (1) 3,055
Shanghai Com 1.2 25 2,123
Indian ADR Chg (%) (Pts) (Close)
INFY (2.0) (0.9) $45.5
WIT (1.4) (0.1) $8.9IBN (2.0) (0.5) $25.5
HDB (4.8) (1.4) $27.6
Advances / Declines BSE NSE
Advances 766 344
Declines 1,509 951
Unchanged 141 79
Volumes (` cr)
BSE 2,184
NSE 11,401

7/30/2019 Market Outlook 04-09-2013
http://slidepdf.com/reader/full/market-outlook-04-09-2013 2/12
www.angelbroking.com
Market Outlook September 4, 2013
Steel players raise steel prices
Domestic steel makers including SAIL, JSW Steel, Essar Steel etc have announced
to raise steel price by ` 700- ` 2,500/tonne. The increase in price is mainly backed
by sharp INR depreciation against the US$ over the past two months. INR
depreciation increases the landed cost of imported steel in India which gives anopportunity to domestic steel makers to raise prices. However, we remain skeptical
on steel demand in India during FY2014 given the slowdown in demand in auto,
slow moving capex cycle, high interest rates etc. Hence, we believe the price hikes
will eventually result in some discounts by some steel makers during 2HFY2014.
Nevertheless, we believe some steel makers such as JSW Steel and Essar Steel will
be able to raise their exports. Overall, we maintain our Neutral view on the
Ferrous sector although we maintain our positive stance on some stocks. We have
an Accumulate rating on Tata Steel with a target price of `313 and Buy rating on
NMDC with a target price of `143.
TCS bags deal from DNB, Norway’s largest financial group
TCS announced that the company has been selected by DNB to drive the
company’s strategic transformation by leveraging information technology. It is a
six year multi-million Euro contract which comprises delivery of application
maintenance and development services across DNB’s IT portfolio, spanning
channels, core-banking and master data areas. The agreement comes as part of
DNB’s strategic vision to rank amongst Europe’s most efficient digital banks. We
continue to remain positive on TCS but owing to recent sharp run up in the stock
price, we maintain our Neutral rating on the stock.
LIC Housing Finance raises home loan rates by 35 bps
LIC Housing Finance has raised interest rates on home loans by 35 basis points,
but has not hiked its prime lending rates which would mean the existing floating
rate customers pay the same rate as earlier. It has raised rates on two of its
schemes - Bhagyalashmi Plus (to 10.35% from 10.0%) and Super Choice (to
10.6% from 10.25%) and has also launched a new scheme wherein it would
charge a fixed interest rate of 11.50% for 10 years. Recent liquidity tightening
measures has exposed BFSI companies (more to the NBFCs, as they are largely
wholesale funded nature) to increased funding costs and thereby putting pressures
on the margins. Earlier HDFC has also raised their base lending rate. We believe
that as these measures are likely to remain over near term, it would become
inevitable for the company to raise its base lending rate, which it has not done
now. At CMP, the stock is trading at 1.0x FY2015E ABV. We prefer to wait and
watch macro developments in the near term, before we revisit our outlook and
rating on the stock. We maintain our Neutral rating on the stock.
Economic and Political News
Commerce ministry pushes RBI for bringing exports under priority sector Goldman Sachs cuts FY14 GDP forecast to 4%; sees Rupee at 72/dollar CII recommends 10-point agenda for economic revival Raghuram Rajan to take over as RBI chief on Sept 5

7/30/2019 Market Outlook 04-09-2013
http://slidepdf.com/reader/full/market-outlook-04-09-2013 3/12
www.angelbroking.com
Market Outlook September 4, 2013
Corporate News
General Motors India recalls 4,000 units of Sail model PSU buyback: Govt. taking money out of the back door ITC price hike: Stronger margins ahead
Source: Economic Times, Business Standard, Business Line, Financial Express, Mint

7/30/2019 Market Outlook 04-09-2013
http://slidepdf.com/reader/full/market-outlook-04-09-2013 4/12
Global economic events release calendar
Date Time Country Event Description Unit Period Bloomberg Data
Last Reported Estimated
September 4, 2013 1:25PM Germany PMI Services Value Aug F 52.40 52.40
2:30PM Euro Zone Euro-Zone GDP s.a. (QoQ) % Change 2Q P 0.30 0.30
September 5, 2013 6:00PM US Initial Jobless claims Thousands Aug 31 331.00 330.00
4:30PM UK BOE Announces rates % Ratio Sep 5 0.50 0.50
5:15PM Euro Zone ECB announces interest rates % Sep 5 0.50 0.50
September 6, 2013 2:00PM UK Industrial Production (YoY) % Change Jul 1.20 (1.70)
6:00PM US Change in Nonfarm payrolls Thousands Aug 162.00 180.00
6:00PM US Unnemployment rate % Aug 7.40 7.40
September 8, 2013 4:29PM China Exports YoY% % Change Aug 5.10 5.20
September 9, 2013 7:00AM China Consumer Price Index (YoY) % Change Aug 2.70 2.60
September 10, 2013 11:00AM China Industrial Production (YoY) % Change Aug 9.70 9.90
4:29PM India Imports YoY% % Change Aug (6.20) --
4:29PM India Exports YoY% % Change Aug 11.64 --
September 11, 2013 2:00PM UK Jobless claims change % Change Aug (29.20) --
September 12, 2013 5:30PM India Industrial Production YoY % Change Jul (2.20) --
September 13, 2013 6:00PM US Producer Price Index (mom) % Change Aug -- 0.10
September 16, 2013 12:00PM India Monthly Wholesale Prices YoY% % Change Aug 5.79 --
2:30PM Euro Zone Euro-Zone CPI (YoY) % Aug F 1.30 --
6:45PM US Industrial Production % Aug 0.04 --
September 17, 2013 2:00PM UK CPI (YoY) % Change Aug 2.80 --
6:00PM US Consumer price index (mom) % Change Aug 0.20 --
September 18, 2013 11:00AM India RBI Repo rate % Sep 18 7.25 --
11:00AM India RBI Cash Reserve ratio % Sep 18 4.00 --
11:00AM India RBI Reverse Repo rate % Sep 18 6.25 --6:00PM US Housing Starts Thousands Aug 896.00 --
6:00PM US Building permits Thousands Aug 954.00 --
11:30PM US FOMC rate decision % Sep 18 0.25 --
September 19, 2013 7:30PM US Existing home sales Million Aug 5.39 --
Source: Bloomberg, Angel Research
September 04, 2013
Market Outlook

7/30/2019 Market Outlook 04-09-2013
http://slidepdf.com/reader/full/market-outlook-04-09-2013 5/12
Market Outlook
September 04, 2013
www.angelbroking.com
Macro watch
Exhibit 1: Q uarterly G DP trends
Source: CSO, Angel Research
Exhibit 2: IIP trends
Source: MOSPI, Angel Research
Exhibit 3: M onthly WPI inflation trends
Source: MOSPI, Angel Research
Exhibit 4: Manufacturing and services PMI
Source: Ma rket, Angel Research; N ote: Level above 50 ind icates expansion
Exhibit 5: Exports and imp orts growth trends
Source: Bloomberg, Angel Research
Exhibit 6: Key policy rates
Source: RBI, Angel Research
7.7
11.4
9.5
8.69.2
9.9
7.5
6.56.0
5.1 5.4 5.24.7 4.8
4.4
3.0
4.0
5.0
6.0
7.0
8.0
9.0
10.0
11.0
12.0
3 Q F Y 1 0
4 Q F Y 1 0
1 Q F Y 1 1
2 Q F Y 1 1
3 Q F Y 1 1
4 Q F Y 1 1
1 Q F Y 1 2
2 Q F Y 1 2
3 Q F Y 1 2
4 Q F Y 1 2
1 Q F Y 1 3
2 Q F Y 1 3
3 Q F Y 1 3
4 Q F Y 1 3
1 Q F Y 1 4
(%)
(0.1)
2.0
(0.7)
8.4
(1.0) (0.6)
2.5
0.6
3.5
1.9
(2.8)(2.2)
(4.0)
(2.0)
-
2.0
4.0
6.0
8.0
10.0
J u l - 1 2
A u g - 1
2
S e p - 1
2
O c - 1
2
N o - 1
2
D e c - 1
2
J a n - 1
3
F e b
- 1 3
M a r - 1 3
A p r - 1 3
M a y - 1
3
J u n - 1
3
(%)
8.17.3 7.2 7.3 7.3 7.3
5.7
4.8 4.6 4.9
5.8
0.0
1.0
2.0
3.0
4.0
5.0
6.0
7.0
8.0
9.0
S e p - 1
2
O c - 1
2
N o - 1
2
D e c - 1
2
J a n - 1
3
F e b
- 1 3
M a r - 1 3
A p r - 1 3
M a y - 1
3
J u n - 1
3
J u l - 1 3
(%)
46.0
48.0
50.0
52.0
54.0
56.0
58.0
60.0
M a y - 1
2
J u n - 1
2
J u l - 1 2
A u g - 1
2
S e p - 1
2
O c - 1
2
N o v - 1
2
D e c - 1
2
J a n - 1
3
F e b
- 1 3
M a r - 1 3
A p r - 1 3
M a y - 1
3
J u n - 1
3
J u l - 1 3
Mfg. PMI Services PMI
(15.0)
(12.0)
(9.0)
(6.0)
(3.0)
0.0
3.0
6.0
9.0
12.0
15.0
A u g - 1
2
S e p - 1
2
O c - 1
2
N o - 1
2
D e c - 1
2
J a n - 1
3
F e b
- 1 3
M a r - 1 3
A p r - 1 3
M a - 1
3
J u n - 1
3
J u l - 1 3
Exports yoy growth Imports yoy growth(%)
3.00
4.00
5.00
6.00
7.00
8.00
9.00
A u g - 1 2
S e p - 1 2
O c - 1 2
O c - 1 2
N o - 1 2
D e c - 1 2
D e c - 1 2
J a n - 1 3
F e b - 1 3
F e b - 1 3
M a r - 1 3
A p r - 1 3
A p r - 1 3
M a - 1 3
J u n - 1 3
J u n - 1 3
J u l - 1 3
A u g - 1 3
Repo rate Reverse Repo rate CRR(%)
7/30/2019 Market Outlook 04-09-2013
http://slidepdf.com/reader/full/market-outlook-04-09-2013 6/12
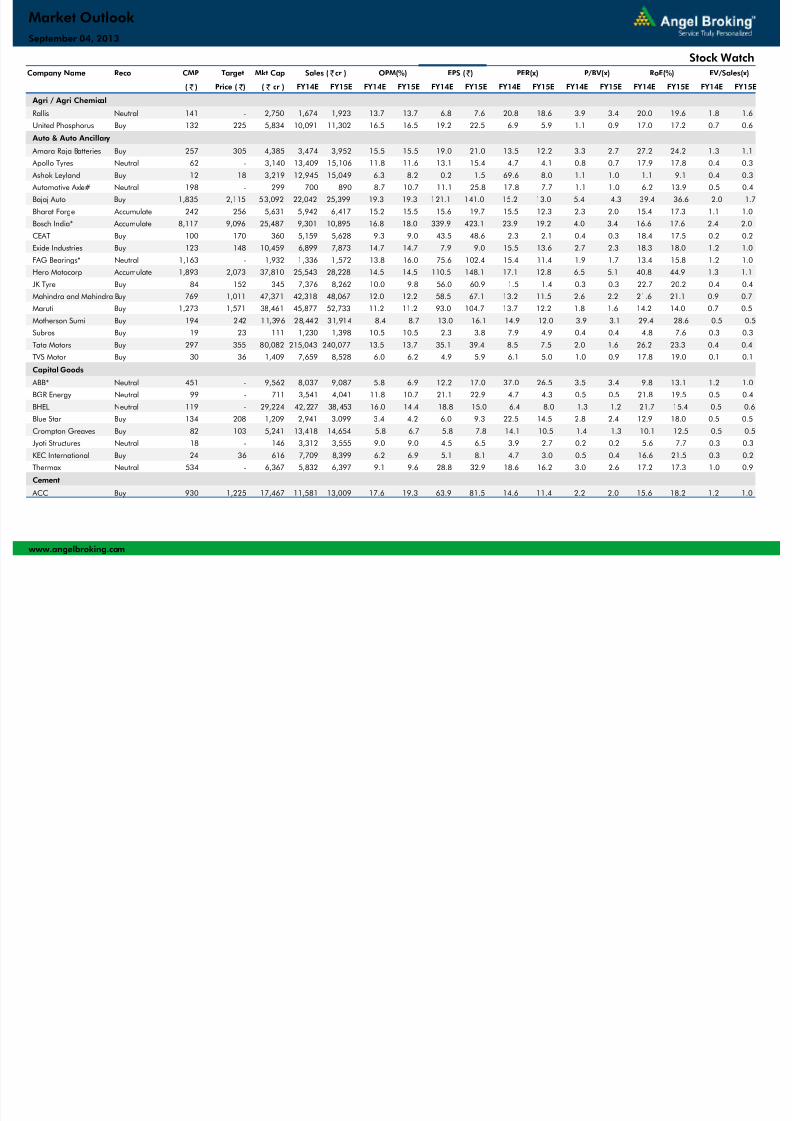
Company Name Reco CMP Target Mkt Cap Sales ( Čcr ) OPM(%) EPS (Č) PER(x) P/BV(x) RoE(%) EV/Sales(x)
( Č ) Price ( Č) ( Č cr ) FY14E FY15E FY14E FY15E FY14E FY15E FY14E FY15E FY14E FY15E FY14E FY15E FY14E FY15E
Agri / Agri Chemical
Rallis Neutral 141 - 2,750 1,674 1,923 13.7 13.7 6.8 7.6 20.8 18.6 3.9 3.4 20.0 19.6 1.8 1.6
United Phosphorus Buy 132 225 5,834 10,091 11,302 16.5 16.5 19.2 22.5 6.9 5.9 1.1 0.9 17.0 17.2 0.7 0.6
Auto & Auto Ancillary
Amara Raja Batteries Buy 257 305 4,385 3,474 3,952 15.5 15.5 19.0 21.0 13.5 12.2 3.3 2.7 27.2 24.2 1.3 1.1
Apollo Tyres Neutral 62 - 3,140 13,409 15,106 11.8 11.6 13.1 15.4 4.7 4.1 0.8 0.7 17.9 17.8 0.4 0.3
Ashok Leyland Buy 12 18 3,219 12,945 15,049 6.3 8.2 0.2 1.5 69.6 8.0 1.1 1.0 1.1 9.1 0.4 0.3
Automotive Axle# Neutral 198 - 299 700 890 8.7 10.7 11.1 25.8 17.8 7.7 1.1 1.0 6.2 13.9 0.5 0.4
Bajaj Auto Buy 1,835 2,115 53,092 22,042 25,399 19.3 19.3 121.1 141.0 15.2 13.0 5.4 4.3 39.4 36.6 2.0 1.7
Bharat Forge Accumulate 242 256 5,631 5,942 6,417 15.2 15.5 15.6 19.7 15.5 12.3 2.3 2.0 15.4 17.3 1.1 1.0
Bosch India* Accumulate 8,117 9,096 25,487 9,301 10,895 16.8 18.0 339.9 423.1 23.9 19.2 4.0 3.4 16.6 17.6 2.4 2.0
CEAT Buy 100 170 360 5,159 5,628 9.3 9.0 43.5 48.6 2.3 2.1 0.4 0.3 18.4 17.5 0.2 0.2
Exide Industries Buy 123 148 10,459 6,899 7,873 14.7 14.7 7.9 9.0 15.5 13.6 2.7 2.3 18.3 18.0 1.2 1.0
FAG Bearings* Neutral 1,163 - 1,932 1,336 1,572 13.8 16.0 75.6 102.4 15.4 11.4 1.9 1.7 13.4 15.8 1.2 1.0
Hero Motocorp Accumulate 1,893 2,073 37,810 25,543 28,228 14.5 14.5 110.5 148.1 17.1 12.8 6.5 5.1 40.8 44.9 1.3 1.1
JK Tyre Buy 84 152 345 7,376 8,262 10.0 9.8 56.0 60.9 1.5 1.4 0.3 0.3 22.7 20.2 0.4 0.4
Mahindra and Mahindra Buy 769 1,011 47,371 42,318 48,067 12.0 12.2 58.5 67.1 13.2 11.5 2.6 2.2 21.6 21.1 0.9 0.7
Maruti Buy 1,273 1,571 38,461 45,877 52,733 11.2 11.2 93.0 104.7 13.7 12.2 1.8 1.6 14.2 14.0 0.7 0.5
Motherson Sumi Buy 194 242 11,396 28,442 31,914 8.4 8.7 13.0 16.1 14.9 12.0 3.9 3.1 29.4 28.6 0.5 0.5
Subros Buy 19 23 111 1,230 1,398 10.5 10.5 2.3 3.8 7.9 4.9 0.4 0.4 4.8 7.6 0.3 0.3
Tata Motors Buy 297 355 80,082 215,043 240,077 13.5 13.7 35.1 39.4 8.5 7.5 2.0 1.6 26.2 23.3 0.4 0.4
TVS Motor Buy 30 36 1,409 7,659 8,528 6.0 6.2 4.9 5.9 6.1 5.0 1.0 0.9 17.8 19.0 0.1 0.1
Capital Goods
ABB* Neutral 451 - 9,562 8,037 9,087 5.8 6.9 12.2 17.0 37.0 26.5 3.5 3.4 9.8 13.1 1.2 1.0
BGR Energy Neutral 99 - 711 3,541 4,041 11.8 10.7 21.1 22.9 4.7 4.3 0.5 0.5 21.8 19.5 0.5 0.4
BHEL Neutral 119 - 29,224 42,227 38,453 16.0 14.4 18.8 15.0 6.4 8.0 1.3 1.2 21.7 15.4 0.5 0.6
Blue Star Buy 134 208 1,209 2,941 3,099 3.4 4.2 6.0 9.3 22.5 14.5 2.8 2.4 12.9 18.0 0.5 0.5
Crompton Greaves Buy 82 103 5,241 13,418 14,654 5.8 6.7 5.8 7.8 14.1 10.5 1.4 1.3 10.1 12.5 0.5 0.5
Jyoti Structures Neutral 18 - 146 3,312 3,555 9.0 9.0 4.5 6.5 3.9 2.7 0.2 0.2 5.6 7.7 0.3 0.3
KEC International Buy 24 36 616 7,709 8,399 6.2 6.9 5.1 8.1 4.7 3.0 0.5 0.4 16.6 21.5 0.3 0.2
Thermax Neutral 534 - 6,367 5,832 6,397 9.1 9.6 28.8 32.9 18.6 16.2 3.0 2.6 17.2 17.3 1.0 0.9
Cement
ACC Buy 930 1,225 17,467 11,581 13,009 17.6 19.3 63.9 81.5 14.6 11.4 2.2 2.0 15.6 18.2 1.2 1.0
www.angelbroking.com
Market Outlook
Stock Watch
September 04, 2013

7/30/2019 Market Outlook 04-09-2013
http://slidepdf.com/reader/full/market-outlook-04-09-2013 7/12
Company Name Reco CMP Target Mkt Cap Sales ( Čcr ) OPM(%) EPS (Č) PER(x) P/BV(x) RoE(%) EV/Sales(x)
( Č ) Price ( Č) ( Č cr ) FY14E FY15E FY14E FY15E FY14E FY15E FY14E FY15E FY14E FY15E FY14E FY15E FY14E FY15E
Cement
Ambuja Cements Neutral 168 - 25,981 9,975 11,409 22.4 23.1 9.4 11.1 18.0 15.1 2.7 2.5 15.7 17.2 2.1 1.7
India Cements Neutral 48 - 1,459 4,796 5,357 16.4 16.1 7.3 9.5 6.5 5.0 0.4 0.4 6.4 8.0 0.7 0.6
J K Lakshmi Cement Buy 58 79 678 2,235 2,684 19.4 21.4 15.0 18.4 3.8 3.1 0.5 0.4 13.2 14.3 0.4 0.9
Madras Cements Neutral 155 - 3,679 4,010 4,524 23.5 23.4 14.9 18.3 10.4 8.5 1.4 1.2 14.0 15.2 1.5 1.3
Shree Cement^ Neutral 3,589 - 12,504 6,316 7,162 26.5 25.7 294.6 340.5 12.2 10.5 2.7 2.2 24.0 22.7 1.5 1.2
UltraTech Cement Neutral 1,442 - 39,525 22,021 25,274 22.0 21.6 99.5 113.3 14.5 12.7 2.3 2.0 16.7 16.6 1.8 1.7
Construction
Ashoka Buildcon Buy 45 60 713 1,912 2,131 21.0 21.5 5.0 5.5 9.0 8.3 0.7 0.6 8.8 7.6 1.7 1.7
Consolidated Co Neutral 6 - 110 1,715 1,824 2.4 6.2 (2.9) (0.4) (2.0) (16.5) 0.2 0.2 0.5 0.5
IRB Infra Buy 61 106 2,016 3,805 4,248 45.1 45.3 15.0 15.8 4.1 3.9 0.6 0.5 14.5 13.9 2.7 3.0
ITNL Buy 112 156 2,174 7,423 7,970 27.5 28.7 30.3 32.0 3.7 3.5 0.5 0.5 15.0 14.0 2.4 2.5
IVRCL Infra Neutral 10 - 313 5,673 5,892 7.8 7.6 (1.7) (2.0) (6.2) (5.2) 0.2 0.2 0.6 0.6
Jaiprakash Asso. Buy 34 41 7,600 12,946 14,897 24.7 25.6 1.2 2.7 27.9 12.8 0.6 0.6 2.0 4.3 2.5 2.2
Larsen & Toubro Buy 695 1,002 64,264 68,946 78,040 10.0 10.0 49.0 55.2 14.2 12.6 2.0 1.8 14.9 15.3 1.1 1.0
Nagarjuna Const. Buy 17 30 430 6,167 6,945 8.0 8.2 2.7 3.6 6.3 4.6 0.2 0.2 2.7 3.6 0.4 0.4
Punj Lloyd Neutral 21 - 689 12,726 14,226 8.2 8.2 0.9 1.0 24.2 20.3 0.2 0.2 1.0 1.2 0.6 0.6
Sadbhav Engg. Buy 54 99 813 2,462 2,731 10.6 10.6 5.3 6.0 10.2 9.0 0.9 0.8 9.2 9.6 0.6 0.6
Simplex Infra Buy 39 56 194 6,237 6,908 9.1 9.0 9.9 13.9 4.0 2.8 0.1 0.1 3.7 5.0 0.5 0.4
Unity Infra Neutral 18 - 130 2,146 2,339 12.9 13.0 9.3 9.6 1.9 1.8 0.2 0.1 8.0 7.7 0.6 0.7
Financials
Allahabad Bank Neutral 66 - 3,305 6,843 7,528 2.5 2.5 26.0 30.1 2.5 2.2 0.4 0.3 11.8 12.4 - -
Andhra Bank Neutral 48 - 2,683 4,868 5,390 2.4 2.5 12.3 16.6 3.9 2.9 0.4 0.4 7.9 10.0 - -
Axis Bank Buy 783 1,023 36,711 19,280 22,886 3.3 3.3 130.7 157.1 6.0 5.0 1.0 0.8 17.3 18.1 - -
Bank of Baroda Neutral 460 - 19,397 15,896 17,947 2.2 2.3 95.4 124.4 4.8 3.7 0.6 0.5 12.0 14.2 - -
Bank of India Neutral 135 - 8,030 14,482 16,069 2.3 2.2 55.0 62.2 2.5 2.2 0.4 0.3 13.7 13.9 - -
Bank of Maharashtra Neutral 37 - 2,454 4,529 4,780 3.0 2.8 12.3 11.8 3.0 3.2 0.5 0.4 16.5 14.1 - -
Canara Bank Neutral 194 - 8,610 11,454 12,378 2.0 2.0 52.4 60.5 3.7 3.2 0.4 0.4 9.8 10.4 - -
Central Bank Neutral 50 - 5,249 8,196 9,202 2.4 2.4 6.1 15.9 8.3 3.2 0.6 0.5 5.2 12.8 - -
Corporation Bank Neutral 243 - 3,717 5,641 6,083 2.0 2.0 82.7 98.1 2.9 2.5 0.4 0.3 12.6 13.5 - -
Dena Bank Neutral 43 - 1,502 3,307 3,531 2.2 2.4 17.5 21.6 2.5 2.0 0.3 0.3 11.9 13.2 - -
Federal Bank Neutral 230 - 3,930 2,798 3,250 3.0 3.0 38.1 51.9 6.0 4.4 0.6 0.5 9.8 12.3 - -
www.angelbroking.com
Market Outlook
Stock Watch
September 04, 2013

7/30/2019 Market Outlook 04-09-2013
http://slidepdf.com/reader/full/market-outlook-04-09-2013 8/12
Company Name Reco CMP Target Mkt Cap Sales ( Čcr ) OPM(%) EPS (Č) PER(x) P/BV(x) RoE(%) EV/Sales(x)
( Č ) Price ( Č) ( Č cr ) FY14E FY15E FY14E FY15E FY14E FY15E FY14E FY15E FY14E FY15E FY14E FY15E FY14E FY15E
Financials
HDFC Neutral 700 - 108,890 8,679 10,350 3.6 3.6 37.5 44.7 18.7 15.7 3.9 3.5 30.1 30.7 - -
HDFC Bank Buy 565 692 135,103 27,392 33,264 4.6 4.6 36.3 45.1 15.6 12.5 3.2 2.7 21.9 22.8 - -
ICICI Bank Buy 784 951 90,482 25,727 29,969 3.2 3.2 83.2 96.7 9.4 8.1 1.2 1.1 14.9 15.4 - -
IDBI Bank Neutral 53 - 7,057 9,518 10,468 2.0 2.0 15.5 22.1 3.4 2.4 0.4 0.3 10.2 13.3 - -
Indian Bank Neutral 63 - 2,723 5,940 6,396 2.7 2.7 24.9 32.9 2.5 1.9 0.3 0.2 10.3 12.4 - -
IOB Neutral 39 - 3,613 7,692 8,627 2.2 2.3 8.1 15.2 4.8 2.6 0.3 0.3 5.9 10.5 - -
J & K Bank Neutral 1,056 - 5,120 3,038 3,370 3.7 3.9 214.2 202.6 4.9 5.2 0.9 0.8 19.8 16.3 - -
LIC Housing Finance Neutral 157 - 7,913 2,001 2,495 2.2 2.3 23.8 28.8 6.6 5.4 1.1 1.0 17.3 18.2 - -
Oriental Bank Neutral 126 - 3,667 6,918 7,459 2.6 2.5 46.7 52.5 2.7 2.4 0.3 0.3 10.8 11.1 - -
Punjab Natl.Bank Neutral 410 - 14,477 20,766 23,515 3.4 3.4 135.0 164.8 3.0 2.5 0.5 0.4 14.4 15.7 - -
South Ind.Bank Neutral 19 - 2,588 1,800 2,023 2.7 2.7 3.7 4.2 5.2 4.6 0.8 0.7 16.2 16.2 - -
St Bk of India Neutral 1,475 - 100,916 65,392 74,467 3.0 3.0 178.5 226.1 8.3 6.5 1.1 0.9 12.1 14.0 - -
Syndicate Bank Neutral 64 - 3,871 6,740 7,512 2.5 2.5 21.0 23.5 3.1 2.7 0.4 0.3 12.6 12.8 - -
UCO Bank Neutral 50 - 3,767 6,770 7,017 2.8 2.6 14.8 15.5 3.4 3.2 0.6 0.5 14.4 13.5 - -
Union Bank Neutral 102 - 6,057 10,458 11,809 2.5 2.5 32.0 40.6 3.2 2.5 0.4 0.3 11.6 13.4 - -
United Bank Neutral 28 - 1,057 3,386 3,884 2.3 2.5 12.4 20.0 2.3 1.4 0.2 0.2 10.0 14.7 - -
Vijaya Bank Neutral 35 - 1,710 2,718 2,941 1.8 1.9 7.0 9.0 4.9 3.9 0.4 0.4 8.2 9.8 - -
Yes Bank Neutral 229 - 8,263 4,417 5,486 2.7 2.8 42.9 49.5 5.4 4.6 1.2 1.0 23.9 22.8 - -
FMCG
Asian Paints Neutral 399 - 38,253 12,332 14,524 16.3 16.1 13.9 16.0 28.7 24.9 9.1 7.3 35.2 32.5 3.0 2.5
Britannia Neutral 730 - 8,753 6,422 7,367 6.9 7.3 24.2 29.7 30.2 24.6 10.7 8.2 39.6 37.7 1.4 1.1
Colgate Neutral 1,202 - 16,345 3,588 4,130 18.9 19.4 41.2 48.4 29.2 24.9 25.9 20.1 100.0 91.0 4.4 3.8
Dabur India Neutral 164 - 28,552 7,183 8,297 16.8 16.9 5.4 6.3 30.6 26.0 10.8 8.6 39.2 36.7 4.0 3.4
GlaxoSmith Con* Neutral 4,114 - 17,304 3,617 4,259 16.1 16.4 122.2 148.7 33.7 27.7 10.5 8.4 34.1 33.7 4.3 3.6
Godrej Consumer Neutral 810 - 27,572 7,801 9,017 16.2 15.9 25.1 29.7 32.2 27.3 6.9 5.8 24.9 24.2 3.7 3.1
HUL Neutral 614 - 132,866 28,415 31,962 13.6 14.1 16.7 18.2 36.8 33.8 35.4 25.7 112.2 88.1 4.5 4.0
ITC Neutral 302 - 239,274 34,294 39,991 36.8 37.0 11.3 13.3 26.8 22.7 8.8 7.1 36.1 34.9 6.7 5.6
Marico Neutral 210 - 13,542 5,104 5,876 15.1 15.2 7.2 8.6 29.4 24.5 5.7 4.7 21.1 20.9 2.7 2.3
Nestle* Neutral 4,934 - 47,575 9,330 10,860 21.8 21.9 123.3 149.7 40.0 33.0 19.7 14.4 56.4 50.3 5.1 4.3
Tata Global Neutral 142 - 8,753 8,070 8,958 9.8 9.9 7.6 8.5 18.7 16.7 2.2 2.1 9.3 9.7 1.1 0.9
www.angelbroking.com
Market Outlook
Stock Watch
September 04, 2013

7/30/2019 Market Outlook 04-09-2013
http://slidepdf.com/reader/full/market-outlook-04-09-2013 9/12
Company Name Reco CMP Target Mkt Cap Sales ( Čcr ) OPM(%) EPS (Č) PER(x) P/BV(x) RoE(%) EV/Sales(x)
( Č ) Price ( Č) ( Č cr ) FY14E FY15E FY14E FY15E FY14E FY15E FY14E FY15E FY14E FY15E FY14E FY15E FY14E FY15E
IT
HCL Tech^ Neutral 1,023 - 71,303 32,266 35,103 23.5 22.6 69.7 74.0 14.7 13.8 4.0 3.2 26.5 23.0 2.0 1.8
Hexaware* Neutral 131 - 3,916 2,273 2,575 22.2 21.5 12.4 13.4 10.6 9.8 2.7 2.3 25.4 23.5 1.6 1.3
Infosys Neutral 3,034 - 174,215 48,731 52,962 26.9 27.1 180.8 200.3 16.8 15.2 3.6 3.1 20.4 19.3 2.9 2.6
Infotech Enterprises Neutral 186 - 2,072 2,128 2,341 17.2 17.6 21.3 23.2 8.7 8.0 1.3 1.2 14.9 14.0 0.6 0.5
KPIT Cummins Buy 130 155 2,507 2,769 3,122 18.3 17.8 15.3 16.6 8.5 7.8 1.8 1.4 20.9 18.4 0.9 0.7
Mindtree Neutral 1,045 - 4,344 2,871 3,110 20.4 20.7 102.6 111.2 10.2 9.4 2.5 2.0 24.8 20.3 1.2 1.0
Mphasis& Neutral 442 - 9,293 6,827 7,342 21.0 21.2 47.0 51.3 9.4 8.6 1.7 1.5 14.3 14.2 0.9 0.7
NIIT Neutral 19 - 316 1,144 1,267 9.0 9.1 4.3 5.4 4.5 3.6 0.5 0.4 10.3 12.0 0.1 -
Persistent Neutral 584 - 2,334 1,590 1,774 23.5 23.8 48.5 56.9 12.0 10.3 1.9 1.7 16.4 16.1 1.1 0.9
TCS Neutral 2,001 - 391,611 80,353 91,576 30.0 30.0 91.0 103.2 22.0 19.4 7.1 5.7 31.5 29.2 4.6 4.0
Tech Mahindra Accumulate 1,400 1,485 32,517 17,749 19,406 22.5 21.0 113.6 114.2 12.3 12.3 3.6 2.8 27.9 22.1 1.6 1.3
Wipro Neutral 479 - 118,113 43,610 47,320 21.6 22.2 30.0 33.0 16.0 14.5 3.6 3.0 20.7 19.4 2.3 2.0
Media
D B Corp Accumulate 238 267 4,361 1,783 1,968 23.8 25.0 13.6 16.0 17.5 14.9 4.2 3.7 22.5 22.9 2.4 2.1
HT Media Buy 90 112 2,115 2,205 2,380 14.1 14.4 7.6 8.4 11.8 10.7 1.3 1.2 10.7 10.7 0.6 0.5
Jagran Prakashan Buy 82 104 2,710 1,683 1,845 19.7 20.8 5.9 6.9 13.9 11.8 2.6 2.4 19.4 21.2 1.7 1.5
PVR Neutral 379 - 1,503 1,359 1,540 17.3 17.4 17.2 21.6 22.0 17.6 2.2 2.0 10.3 12.0 1.5 1.4
Sun TV Network Neutral 395 - 15,555 2,287 2,551 69.7 70.5 20.0 23.3 19.7 16.9 4.9 4.3 26.4 27.3 6.5 5.7
Metals & Mining
Bhushan Steel Reduce 456 419 10,320 12,640 15,667 28.5 31.5 25.9 38.6 17.6 11.8 1.0 1.0 6.1 8.5 2.6 2.1
Coal India Neutral 261 - 164,983 68,303 69,884 32.5 30.3 27.5 25.0 9.5 10.4 3.6 2.5 40.2 33.1 1.6 1.5
Electrosteel Castings Buy 11 15 347 1,976 2,017 11.8 12.7 0.1 1.2 166.2 8.8 0.1 - 0.1 1.9 0.6 0.1
GMDC Buy 82 115 2,608 1,701 1,985 47.8 48.8 17.4 20.6 4.7 4.0 0.9 0.8 20.7 20.9 1.1 0.7
Hind. Zinc Buy 117 143 49,500 12,389 13,093 48.5 51.7 15.2 17.0 7.7 6.9 1.3 1.2 18.5 18.0 1.8 1.4
Hindalco Neutral 104 - 19,998 95,465 102,491 8.4 9.0 13.9 17.2 7.5 6.1 0.6 0.5 7.6 8.7 0.6 0.5
JSW Steel Neutral 524 - 12,663 45,022 48,140 16.0 15.9 68.5 77.0 7.7 6.8 0.7 0.6 9.3 9.7 0.8 0.7
MOIL Accumulate 208 223 3,499 956 982 42.3 44.3 25.3 26.2 8.2 7.9 1.1 1.0 14.6 13.7 1.0 1.1
Monnet Ispat Buy 108 139 686 2,199 2,575 21.6 22.8 30.7 38.6 3.5 2.8 0.3 0.2 7.7 8.9 1.4 1.1
Nalco Neutral 33 - 8,505 7,270 7,521 13.6 13.8 2.8 2.9 11.9 11.4 0.7 0.7 5.9 6.0 0.6 0.6
NMDC Buy 118 142 46,685 10,718 11,514 66.6 64.5 15.5 16.1 7.6 7.3 1.5 1.4 21.2 20.0 2.3 2.1
SAIL Neutral 46 - 19,040 44,060 54,227 9.2 10.9 5.3 6.8 8.7 6.8 0.5 0.5 5.2 6.5 0.7 0.6
www.angelbroking.com
Market Outlook
Stock Watch
September 04, 2013

7/30/2019 Market Outlook 04-09-2013
http://slidepdf.com/reader/full/market-outlook-04-09-2013 10/12
Company Name Reco CMP Target Mkt Cap Sales ( Čcr ) OPM(%) EPS (Č) PER(x) P/BV(x) RoE(%) EV/Sales(x)
( Č ) Price ( Č) ( Č cr ) FY14E FY15E FY14E FY15E FY14E FY15E FY14E FY15E FY14E FY15E FY14E FY15E FY14E FY15E
Metals & Mining
Sesa Goa* Neutral 184 - 54,550 3,817 5,781 12.1 17.7 27.0 29.6 6.8 6.2 0.8 0.7 12.9 12.5 15.1 10.0
Tata Steel Accumulate 281 317 27,315 153,862 167,209 9.4 10.5 32.8 53.5 8.6 5.3 0.7 0.7 9.0 13.2 0.5 0.5
Sarda Buy 82 98 295 1,323 1,398 17.2 17.9 25.3 27.8 3.3 3.0 0.3 0.3 9.5 9.6 0.6 0.5
Prakash Industries Buy 30 37 408 2,486 2,637 15.2 15.0 13.7 14.2 2.2 2.1 0.2 0.2 9.1 8.7 0.4 0.3
Godawari Power andIspat
Neutral 77 - 252 2,171 2,317 14.9 15.8 36.4 46.6 2.1 1.7 0.2 0.2 11.6 13.0 0.5 0.4
Oil & Gas
Cairn India Accumulate 324 364 61,880 18,403 17,925 71.9 62.1 62.1 57.4 5.2 5.6 1.1 0.9 22.6 17.8 2.1 1.9GAIL Neutral 300 - 38,086 49,700 48,822 16.0 16.6 32.9 33.4 9.1 9.0 1.4 1.2 15.9 14.4 0.3 0.2
ONGC Buy 251 350 214,828 164,816 196,050 33.7 36.6 30.0 38.7 8.4 6.5 1.3 1.1 16.0 18.5 1.0 0.7
Reliance Indus tr ies Accumulate 830 953 268,176 417,018 442,434 8.4 8.4 70.3 75.2 11.8 11.0 1.2 1.1 12.0 11.6 0.6 0.6
Gujarat Gas* Neutral 199 - 2,549 3,270 3,414 12.8 12.6 22.6 23.1 8.8 8.6 2.3 2.1 28.2 25.6 0.6 0.5
Indraprastha Gas Neutral 257 - 3,595 3,656 4,456 21.5 18.6 25.7 26.8 10.0 9.6 2.0 1.7 22.1 19.6 1.0 0.8
Petronet LNG Accumulate 121 135 9,049 39,449 43,315 5.3 5.9 14.1 16.9 8.6 7.2 1.7 1.4 21.7 21.9 0.3 0.3
Gujarat State PetronetLtd.
Buy 49 67 2,760 1,002 1,021 91.4 91.5 8.2 8.4 6.0 5.9 0.8 0.7 14.3 13.0 2.2 2.1
Pharmaceuticals
Alembic Pharma Buy 131 165 2,468 1,736 2,008 17.1 18.9 10.5 13.8 12.5 9.5 3.8 2.9 34.4 34.7 1.5 1.2
Aurobindo Pharma Buy 183 271 5,319 6,641 7,637 15.9 15.9 17.3 20.6 10.6 8.9 1.7 1.4 19.5 18.9 1.3 1.1
Aventis* Neutral 2,401 - 5,530 1,682 1,917 15.6 15.6 91.9 101.7 26.1 23.6 3.7 3.6 15.6 17.1 2.8 2.3
Cadila Healthcare Buy 642 894 13,135 7,123 8,367 15.5 15.7 37.3 44.7 17.2 14.4 3.6 3.0 22.9 22.9 2.2 1.8
Cipla Buy 406 477 32,579 9,274 10,796 23.1 23.1 21.0 23.8 19.3 17.1 3.1 2.7 17.2 16.8 3.3 2.7
Dr Reddy's Accumulate 2,210 2,535 37,569 13,377 15,350 20.4 20.1 112.1 126.6 19.7 17.5 4.2 3.5 23.5 21.8 2.9 2.5
Dishman Pharma Buy 41 73 330 1,394 1,534 22.5 22.4 14.8 16.6 2.8 2.5 0.3 0.3 10.8 11.0 0.9 0.7
GSK Pharma* Neutral 2,282 - 19,332 2,744 2,964 22.0 23.4 59.2 66.6 38.6 34.3 9.6 9.2 24.9 27.5 6.2 5.7
Indoco Remedies Buy 62 78 570 747 906 15.3 15.3 5.9 7.6 10.5 8.1 1.3 1.1 12.5 14.4 1.0 0.8
Ipca labs Neutral 647 - 8,158 3,246 3,830 20.5 21.7 36.2 44.9 17.9 14.4 4.2 3.3 26.1 25.7 2.7 2.2
Lupin Accumulate 840 904 37,639 11,576 13,855 22.0 22.0 35.8 43.0 23.5 19.5 5.7 4.5 27.1 25.8 3.3 2.7
Ranbaxy* Neutral 409 - 17,285 10,400 11,331 6.6 8.4 11.4 15.2 35.8 26.9 3.8 3.3 11.1 13.1 1.8 1.6
Sun Pharma Neutral 510 - 105,719 13,509 15,846 41.0 41.0 16.5 19.9 30.9 25.7 6.2 5.2 22.0 22.0 7.3 6.1
Power
GIPCL Accumulate 62 65 932 1,444 1,482 33.4 33.0 13.7 14.8 4.5 4.2 0.5 0.5 12.3 12.0 0.7 0.5
NTPC Buy 128 163 105,542 75,046 81,780 23.5 23.9 12.7 13.6 10.1 9.4 1.2 1.1 12.2 12.0 2.1 2.1
Real Estate
DLF Buy 127 179 22,683 8,293 9,622 36.5 36.1 5.7 6.7 22.3 18.9 0.8 0.8 3.7 4.1 4.8 4.0
www.angelbroking.com
Market Outlook
Stock Watch
September 04, 2013

7/30/2019 Market Outlook 04-09-2013
http://slidepdf.com/reader/full/market-outlook-04-09-2013 11/12
Company Name Reco CMP Target Mkt Cap Sales ( Čcr ) OPM(%) EPS (Č) PER(x) P/BV(x) RoE(%) EV/Sales(x)
( Č ) Price ( Č) ( Č cr ) FY14E FY15E FY14E FY15E FY14E FY15E FY14E FY15E FY14E FY15E FY14E FY15E FY14E FY15E
Real Estate
MLIFE Buy 404 483 1,648 888 1,002 27.0 29.9 33.9 42.1 11.9 9.6 1.2 1.1 9.9 11.2 2.4 2.2
Telecom
Bharti Airtel Buy 285 350 113,926 83,535 92,173 32.0 33.1 9.2 12.9 31.1 22.1 2.0 1.9 6.8 8.9 2.1 1.8
Idea Cellular Neutral 150 - 49,751 26,717 29,443 30.6 29.8 5.5 6.7 27.6 22.3 3.1 2.7 11.1 12.0 2.2 1.9
Rcom Neutral 126 - 26,027 22,050 23,647 30.6 30.8 3.2 5.2 39.5 24.2 0.8 0.7 1.9 3.1 2.9 2.5
Others
Abbott India* Buy 1,390 1,628 2,954 1,788 1,996 12.5 12.7 71.7 81.4 19.4 17.1 3.9 3.4 21.7 21.2 1.4 1.2
Bajaj Electricals Buy 155 184 1,544 3,885 4,472 4.0 5.8 6.8 15.4 22.9 10.1 2.0 1.7 8.8 17.3 0.4 0.4
Cera Sanitaryware Buy 483 613 611 631 797 14.5 13.7 42.6 51.1 11.3 9.5 2.7 2.2 26.5 25.3 1.0 0.8
Cravatex Buy 266 307 69 248 284 6.5 7.3 27.2 38.2 9.8 7.0 1.5 1.3 15.7 18.5 0.4 0.4
Finolex Cables Buy 50 68 769 2,563 2,899 9.8 9.8 10.1 11.3 5.0 4.5 0.7 0.6 14.3 13.8 0.2 0.2
Force Motors Buy 281 349 366 2,304 2,649 3.1 3.6 28.0 43.7 10.0 6.4 0.3 0.3 3.1 4.7 0.1 0.1
Goodyear India* Accumulate 300 345 693 1,458 1,542 8.3 9.0 32.3 37.0 9.3 8.1 1.7 1.5 19.5 19.3 0.3 0.2
Hitachi Buy 105 153 285 1,080 1,199 8.9 9.1 18.3 19.1 5.7 5.5 1.0 0.9 19.2 17.0 0.4 0.3
Honeywell Automation* Neutral 2,389 - 2,112 1,842 2,131 7.7 7.8 111.1 130.9 21.5 18.3 2.7 2.4 13.3 13.9 1.0 0.9
IFB Agro Buy 134 156 120 491 642 12.3 13.8 35.0 50.9 3.8 2.6 0.6 0.5 18.2 21.6 0.2 0.1
ITD Cementation Buy 146 194 168 1,365 1,502 10.9 11.2 18.2 28.0 8.0 5.2 0.4 0.4 5.1 7.4 0.5 0.5
Jyothy Laboratories Buy 152 199 2,519 1,244 1,523 14.1 14.2 5.9 10.0 25.6 15.2 3.1 2.7 12.7 18.8 2.4 1.9
MRF Buy 13,055 16,218 5,537 11,799 12,587 14.1 13.5 1,792.0 1,802.0 7.3 7.2 1.5 1.3 23.5 19.2 0.6 0.5
Page Industries Buy 3,952 4,669 4,408 1,059 1,296 19.5 19.8 125.0 155.6 31.6 25.4 15.7 11.5 56.3 52.2 4.3 3.5
Relaxo Footwears Buy 721 981 865 1,196 1,401 11.9 12.6 55.6 75.4 13.0 9.6 3.1 2.4 27.1 28.1 0.9 0.7
Siyaram Silk Mills Buy 184 228 173 1,158 1,322 10.6 11.0 60.5 75.9 3.1 2.4 0.5 0.4 16.8 18.1 0.4 0.3
Styrolution ABS India* Buy 349 492 614 1,007 1,108 8.4 8.7 30.3 35.1 11.5 9.9 1.3 1.2 11.7 12.2 0.6 0.5
TAJ GVK Buy 55 108 347 300 319 35.8 36.2 7.9 9.1 7.0 6.1 0.9 0.8 13.9 14.4 1.5 1.2
Tata Sponge Iron Buy 260 371 400 814 849 17.0 17.6 64.6 69.2 4.0 3.8 0.6 0.5 14.5 13.8 0.1 (0.1)
TTK Healthcare Buy 492 632 382 416 481 4.5 6.1 16.2 25.3 30.4 19.4 3.7 3.3 12.6 18.1 0.8 0.7
Tree House Buy 224 297 805 153 194 53.0 52.8 12.4 15.6 18.1 14.3 2.1 1.9 11.8 13.1 5.4 4.1
TVS Srichakra Buy 169 230 130 1,591 1,720 6.1 6.4 30.5 38.3 5.6 4.4 0.7 0.7 13.5 15.5 0.3 0.2
United Spirits Neutral 2,279 - 33,118 12,294 14,162 12.0 12.0 42.1 67.7 54.1 33.7 3.8 3.4 9.1 10.7 3.0 2.6
Vesuvius India* Buy 349 439 709 600 638 20.1 19.4 35.7 36.6 9.8 9.6 1.8 1.5 19.4 17.1 1.0 0.9
HSIL Buy 80 117 525 2,042 2,363 14.6 14.8 12.3 16.5 6.5 4.8 0.5 0.5 7.6 9.4 0.7 0.6
Source: Company, Angel Research; Note: *December year end; #September year end; &October year end; Price as on September 03, 2013*Note: Sesa Goa's numbers reflect the standalone Sesa Goa business only. We will revise our numbers once the consolidated entity Sesa- Sterlite is formed.
www.angelbroking.com
Market Outlook
Stock Watch
September 04, 2013

7/30/2019 Market Outlook 04-09-2013
http://slidepdf.com/reader/full/market-outlook-04-09-2013 12/12
Research Team Tel: 022 - 39357800 E-mail: [email protected] Website: www.angelbroking.com
DISCLAIMER
This document is solely for the personal information of the recipient, and must not be singularly used as the basis of any investment
decision. Nothing in this document should be construed as investment or financial advice. Each recipient of this document should makesuch investigations as they deem necessary to arrive at an independent evaluation of an investment in the securities of the companiesreferred to in this document (including the merits and risks involved), and should consult their own advisors to determine the merits andrisks of such an investment.
Angel Broking Pvt. Limited, its affiliates, directors, its proprietary trading and investment businesses may, from time to time, makeinvestment decisions that are inconsistent with or contradictory to the recommendations expressed herein. The views contained in thisdocument are those of the analyst, and the company may or may not subscribe to all the views expressed within.Reports based on technical and derivative analysis center on studying charts of a stock's price movement, outstanding positions andtrading volume, as opposed to focusing on a company's fundamentals and, as such, may not match with a report on a company'sfundamentals.
The information in this document has been printed on the basis of publicly available information, internal data and other reliable sourcesbelieved to be true, but we do not represent that it is accurate or complete and it should not be relied on as such, as this document is forgeneral guidance only. Angel Broking Pvt. Limited or any of its affiliates/ group companies shall not be in any way responsible for any loss or damage that may arise to any person from any inadvertent error in the information contained in this report. Angel Broking Pvt.Limited has not independently verified all the information contained within this document. Accordingly, we cannot testify, nor make any representation or warranty, express or implied, to the accuracy, contents or data contained within this document. While Angel BrokingPvt. Limited endeavours to update on a reasonable basis the information discussed in this material, there may be regulatory, compliance,or other reasons that prevent us from doing so.
This document is being supplied to you solely for your information, and its contents, information or data may not be reproduced,redistributed or passed on, directly or indirectly.
Angel Broking Pvt. Limited and its affiliates may seek to provide or have engaged in providing corporate finance, investment banking orother advisory services in a merger or specific transaction to the companies referred to in this report, as on the date of this report or inthe past.
Neither Angel Broking Pvt. Limited, nor its directors, employees or affiliates shall be liable for any loss or damage that may arise from orin connection with the use of this information.
Note: Please refer to the important `Stock Holding Disclosure' report on the Angel website (Research Section). Also, please refer to thelatest update on respective stocks for the disclosure status in respect of those stocks. Angel Broking Pvt. Limited and its affiliates may haveinvestment positions in the stocks recommended in this report.
Market Outlook September 04, 2013