market outlook 12th august 2011
TRANSCRIPT
8/6/2019 Market Outlook 12th August 2011
http://slidepdf.com/reader/full/market-outlook-12th-august-2011 1/6
1
Market OutlookIndia Research August 12, 2011
Please refer to important disclosures at the end of this report Sebi Registration No: INB 010996539
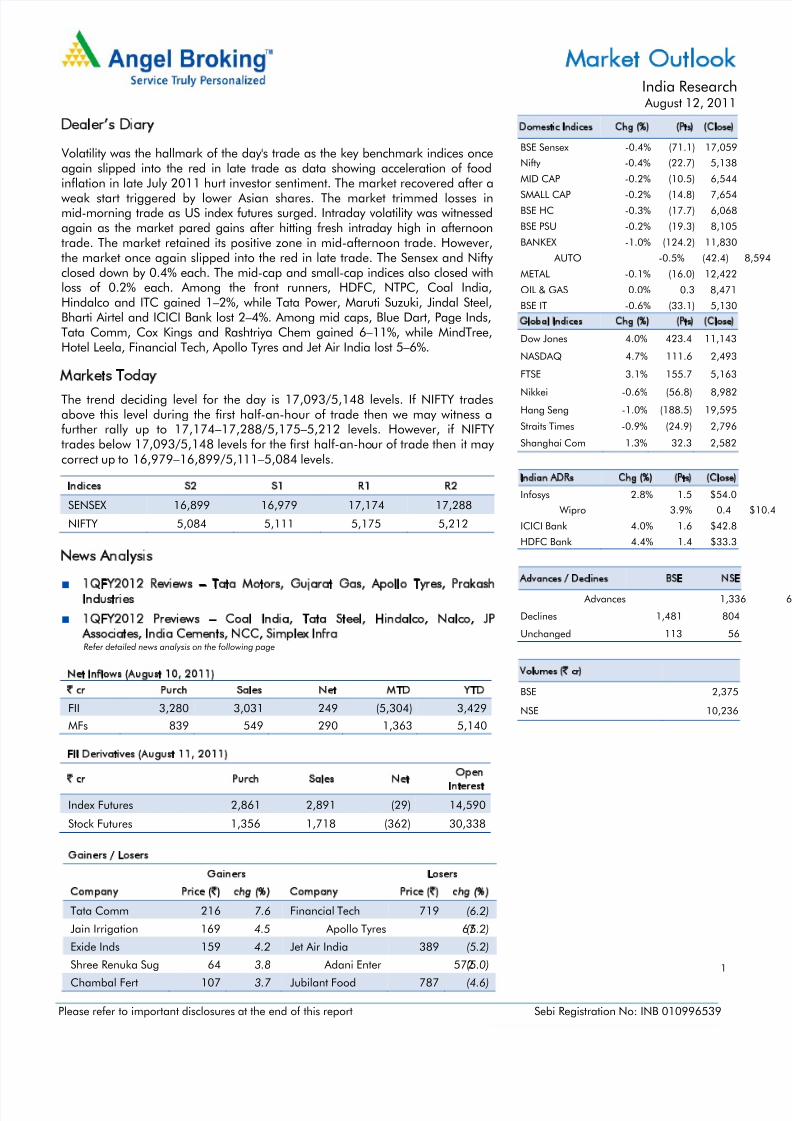
Dealer’s Diary
Volatility was the hallmark of the day's trade as the key benchmark indices onceagain slipped into the red in late trade as data showing acceleration of food
inflation in late July 2011 hurt investor sentiment. The market recovered after aweak start triggered by lower Asian shares. The market trimmed losses inmid-morning trade as US index futures surged. Intraday volatility was witnessedagain as the market pared gains after hitting fresh intraday high in afternoontrade. The market retained its positive zone in mid-afternoon trade. However,the market once again slipped into the red in late trade. The Sensex and Nifty closed down by 0.4% each. The mid-cap and small-cap indices also closed withloss of 0.2% each. Among the front runners, HDFC, NTPC, Coal India,Hindalco and ITC gained 1–2%, while Tata Power, Maruti Suzuki, Jindal Steel,Bharti Airtel and ICICI Bank lost 2–4%. Among mid caps, Blue Dart, Page Inds,Tata Comm, Cox Kings and Rashtriya Chem gained 6–11%, while MindTree,Hotel Leela, Financial Tech, Apollo Tyres and Jet Air India lost 5–6%.
Markets Today
The trend deciding level for the day is 17,093/5,148 levels. If NIFTY tradesabove this level during the first half-an-hour of trade then we may witness afurther rally up to 17,174–17,288/5,175–5,212 levels. However, if NIFTYtrades below 17,093/5,148 levels for the first half-an-hour of trade then it may correct up to 16,979–16,899/5,111–5,084 levels.
Indices S2 S1 R1 R2
SENSEX 16,899 16,979 17,174 17,288
NIFTY 5,084 5,111 5,175 5,212
News Analysis
1QFY2012 Reviews – Tata Motors, Gujarat Gas, Apollo Tyres, PrakashIndustries
1QFY2012 Previews – Coal India, Tata Steel, Hindalco, Nalco, JPAssociates, India Cements, NCC, Simplex InfraRefer detailed news analysis on the following page
Net Inflows (August 10, 2011)
` cr Purch Sales Net MTD YTD
FII 3,280 3,031 249 (5,304) 3,429
MFs 839 549 290 1,363 5,140
FII Derivatives (August 11, 2011)
` cr Purch Sales NetOpen
Interest
Index Futures 2,861 2,891 (29) 14,590
Stock Futures 1,356 1,718 (362) 30,338
Gainers / Losers
Gainers Losers
Company Price (`) chg (%) Company Price (`) chg (%)
Tata Comm 216 7.6 Financial Tech 719 (6.2)
Jain Irrigation 169 4.5 Apollo Tyres 67(5.2)
Exide Inds 159 4.2 Jet Air India 389 (5.2)
Shree Renuka Sug 64 3.8 Adani Enter 572(5.0)
Chambal Fert 107 3.7 Jubilant Food 787 (4.6)
Domestic Indices Chg (%) (Pts) (Close)
BSE Sensex -0.4% (71.1) 17,059
Nifty -0.4% (22.7) 5,138
MID CAP -0.2% (10.5) 6,544
SMALL CAP -0.2% (14.8) 7,654
BSE HC -0.3% (17.7) 6,068
BSE PSU -0.2% (19.3) 8,105
BANKEX -1.0% (124.2) 11,830
AUTO -0.5% (42.4) 8,594
METAL -0.1% (16.0) 12,422
OIL & GAS 0.0% 0.3 8,471
BSE IT -0.6% (33.1) 5,130
Global Indices Chg (%) (Pts) (Close)
Dow Jones 4.0% 423.4 11,143
NASDAQ 4.7% 111.6 2,493
FTSE 3.1% 155.7 5,163
Nikkei -0.6% (56.8) 8,982
Hang Seng -1.0% (188.5) 19,595
Straits Times -0.9% (24.9) 2,796
Shanghai Com 1.3% 32.3 2,582
Indian ADRs Chg (%) (Pts) (Close)
Infosys 2.8% 1.5 $54.0
Wipro 3.9% 0.4 $10
ICICI Bank 4.0% 1.6 $42.8
HDFC Bank 4.4% 1.4 $33.3
Advances / Declines BSE NSE
Advances 1,336
Declines 1,481 804
Unchanged 113 56
Volumes (` cr)
BSE 2,375
NSE 10,236

8/6/2019 Market Outlook 12th August 2011
http://slidepdf.com/reader/full/market-outlook-12th-august-2011 2/6
August 12, 2011 2
Market Outlook | India Research
1QFY2012 Result Reviews
Tata Motors
Tata Motors (TML) recorded lower-than-expected bottom-line performance for 1QFY2012,largely on account of cost pressures and higher tax rate at Jaguar and Land Rover (JLR).On the consolidated front, top line registered in-line 24.1% yoy growth (down 5.7% qoq) to ` 33,572cr, aided largely by 19.9% yoy growth in JLR revenue. JLR’s performance was ledby an 8.6% yoy increase in volumes and a 10.4% yoy increase in net average realisation.Operating margin declined by 163bp yoy (flat qoq) to 12.6%, broadly in-line with ourestimates of 12.5%. Margin contraction can be attributed mainly to raw-material costpressures, which increased by 226bp yoy during the quarter. Net profit stood at ` 2,000crvs. our estimate of ` 2,226cr, reporting flat yoy growth; however, it declined significantly by 24.2% on a sequential basis. Higher interest cost on account of bond issuance in May 2011 and high tax rate due to China operations negatively impacted the bottom-lineperformance.
On a standalone basis, TML reported 14.2% yoy (down 18.5% qoq) growth in its top line
to ` 11,898cr, aided by 8.7% yoy (down 16.4% qoq) growth in volumes and 10.1% growthin realisation, led by price increases. Operating margin declined substantially by 297bpyoy (down 41bp qoq) to 8.1% due to higher input cost pressures and increased levels ofhigher other expenditure. As a result, net profit increased marginally by 1.4% yoy (down30% qoq) to ` 401cr.
AT ` 846, TML is trading at 5.3x and 4.8x FY2012E and FY2013E earnings. We shallrevise our estimates and release a detailed result note soon. The stock rating is currentlyunder review.
Gujarat Gas
Gujarat Gas reported its 2QCY2011 results. The company’s top line increased by 39.9%yoy to ` 584cr mainly on account of higher realisation, led by the recent price hikes.Natural gas volume sold grew by 1.8% yoy to 302mmscm. Average sales realisation stoodat ` 19.1/scm, (+35.6% yoy and +11.2% qoq), led by hike in selling prices of industrialretail and CNG segments. EBITDA grew by 51.0% yoy to ` 140cr, while EBITDA marginexpanded by 176bp yoy on the back of the recent price hike across segments.Consequently, the company’s net profit grew by 67.1% yoy to ` 97cr. We maintain ourNeutral view on the stock.
Apollo Tyres
Apollo Tyres (Apollo) registered a lower-than-expected performance on the net profit fronton account of continued raw-material cost pressures and higher interest cost, led by commissioning of the Chennai facility. Consolidated revenue posted better-than-expected55% yoy (3.4% qoq) growth to ` 2,822cr, aided by a 34.4% yoy (flat qoq) jump in volumesand a 15.3% yoy (3.4% qoq) increase in average realisation. Domestic and Europerevenue grew by strong 74.9% and 37.9% yoy, respectively, while South Africa witnessed amodest 5.1% yoy increase in revenue. Operating margin declined by 239bp yoy (289bpqoq) to 8.5%, mainly due to the 48.5% (6.5% qoq) and 25% yoy (14% qoq) increase innatural rubber and carbon black prices. As a result, net profit grew marginally by 4% yoy ` 77cr. However, on a sequential basis, net profit declined significantly by 57.8%.Further, a substantial increase in interest cost, which jumped 83.2% yoy, impacted net
profit growth.
At ` 67, the stock is trading at 5x and 4.2x FY2012E and FY2013E earnings, respectively.We retain our Buy rating on the stock; however, the target price is under review. We shallrelease a detailed result note soon.

8/6/2019 Market Outlook 12th August 2011
http://slidepdf.com/reader/full/market-outlook-12th-august-2011 3/6
August 12, 2011 3
Market Outlook | India Research
Prakash Industries
Prakash Industries’ net sales increased by 7.3% yoy to ` 499cr, mainly on account of aincrease in average realisation across product categories. However, EBITDA decreased by 2.3% yoy to ` 91cr. Despite increased realisation, EBITDA margin dipped by 180bp yoy to
18.2% on account of a sharp rise in iron ore and coal costs. On account of lower interestcosts, net profit increased by 2.0% yoy to ` 71cr. The company’s 125MW power expansionhas been delayed again by a quarter to December 2011. We maintain our Buy rating,while we keep our target price under review.
1QFY2012 Result Previews
Coal India
Coal India is slated to report its 1QFY2012 results. We expect net sales to increase by
26.3% yoy to ` 15,078cr mainly on account of higher coal prices. EBITDA margin isexpected to expand by 887bp yoy to 34.3% in 1QFY2012. Net profit is expected toincrease by 56.1% yoy to ` 3,943cr. We maintain our Neutral view on the stock.
Tata Steel
Tata Steel is slated to report its consolidated 1QFY2012 results. We expect net sales toincrease by 27.5% yoy to ` 34,668cr mainly on account of higher steel prices. However,EBITDA margin is expected to contract by 367bp yoy to 12.6% on account of higherraw-material costs (mainly in its European operations). Net profit is expected todecrease by 0.4% yoy to ` 1,858cr. We maintain our Buy rating on the stock with a target
price of `799.
Hindalco
Hindalco is slated to report its standalone 1QFY2012 results. The company had already reported Novelis’ results on August 10, 2011. We expect consolidated net sales to increaseby 17.7% yoy to ` 19,476cr mainly on account of higher aluminium prices. However,EBITDA margin is expected to contract by 136bp yoy to 9.9% on account of rising cost ofkey inputs (primarily coal). Net profit is expected to increase by 7.8% yoy to ` 819cr.We maintain our Buy rating on the stock with a target price of `242.
Nalco
Nalco is slated to report its 1QFY2012 results. We expect net sales to increase by 31.5%yoy to ` 1,698cr mainly on account of higher aluminium prices. However, EBITDA marginis expected to contract by 488bp yoy to 25.6% due to rise in prices of key inputs (primarily coal). Net profit is expected to decrease by 5.6% yoy to ` 268cr. We maintain our Neutralview on the stock.

8/6/2019 Market Outlook 12th August 2011
http://slidepdf.com/reader/full/market-outlook-12th-august-2011 4/6
August 12, 2011 4
Market Outlook | India Research
JP Associates
JP Associates (JAL) is expected to announce its fourth quarter results. We expect JAL to postmodest top-line growth of 11.6% yoy to ` 3,588cr ( ` 3,215cr) for the quarter. We expectmarginal growth of 2.0% in C&EPC revenue to ` 1,466cr. For the cement segment,we expect JAL to post revenue of ` 1,487cr – volume of 4.2mt with realisation of
` 3,622/tonne for the quarter. The real estate sector is expected to continue its robustperformance and post healthy top-line growth of 60% yoy to ` 585.8cr.
Overall, we expect JAL to post EBITDA margin of 24.0%, a jump of 274bp yoy, owing toincreased contribution from the high-margin real estate segment. The bottom line isexpected to come in at ` 199.3cr, registering a yoy jump of 88.4% (adjusting forextraordinary post tax gain of ` 410cr in 1QFY2011) for the quarter.
We have valued JAL’s cement business at 6.5x EV/EBITDA ( ` 67.4/share) and constructiondivision at FY2013E target EV/EBITDA multiple of 6.5x ( ` 32.1/share). We have valued itspower and real estate businesses on market cap basis (giving 15% holding company discount), contributing ` 61.8/share to our target price. The treasury shares ( ` 7.2/share)
have been valued at the current market price, whereas net debt is accounted for on a pershare basis in our valuation at ` 61.8. We maintain our Buy view on the stock with an SOTPtarget price of `108.
India Cements
India Cements is expected to announce its 1QFY2012 results. We expect the top line togrow by 16.5% yoy to ` 1,026cr on account of higher cement realisation. Cement prices,which reached all-time high levels in March 2011, were sustained in the southern regionresulting in strong realisation for the company. OPM is expected to expand by 579bp yoy to 16.1% despite the increase in power and fuel and freight costs on account of the
substantial improvement in realisation. Net profit is expected to grow by 68.6% yoy to ` 42cr. We maintain our Neutral view on the stock.
Nagarjuna Construction Company
We expect Nagarjuna Construction Company (NCC) to post poor numbers for 1QFY2012.On the top-line front, NCC is expected to post modest growth of 7.6% yoy to ` 1,169.5cr.EBITDA margin is expected to be flat at ~9.7%. However, a shocker should come on theearnings front, as we expect the company to post a decline of 38.9% yoy/29.0% qoq to ` 25.3cr for the quarter. This would be primarily on account of burgeoning interest cost(jump of ~96.3% yoy), led by elongated working capital cycle. The financial closure status
for the 1,320MW power plant, which was guided by the company to be achieved inMarch, would be another important development for the quarter. We maintain our Buyrating on the stock with a target price of `109.
Simplex Infra
For Simplex Infra, we project flat top-line growth of 6.3% yoy to ` 1,251cr for 1QFY2012.This subdued performance would be mainly on account of slowdown faced by thecompany on the international front. It should be noted that during the last quarter orderawarding activity had picked up on the international front, but we believe it would taketime for the same to get converted into revenue. We expect EBITDA margin to remain
stable at 10.2%, in-line with management's guidance. However, the bottom line isexpected to be under pressure due to increased interest cost (yoy expected jump of ~41%),resulting in a yoy decline of around 10.1% to ` 32.5cr for the quarter. We maintain our Buyview on the stock with a target price of `404.

8/6/2019 Market Outlook 12th August 2011
http://slidepdf.com/reader/full/market-outlook-12th-august-2011 5/6
August 12, 2011 5
Market Outlook | India Research
Economic and Political News
July exports surge 82%, may slow from now
Food inflation rises to 9.9%
DTC set to miss deadline again
RBI surplus profit dips 20% in FY2011, liquidity overhang blamed
Corporate News
SBI, ICICI Bank hike lending rates 50bp
HCL Tech to create US$1bn business analytics segment
Manappuram Finance to raise ` 750cr through NCDs
Mahindra auto component arm pushes for integration
Source: Economic Times, Business Standard, Business Line, Financial Express, Mint
Events for the day
Bajaj Hind Results
BF Utilities Results
BPCL Results
Century Tex Results
Coal India Results D B Realty Results HDIL Results Hindalco Inds Results HPCL Results
India Cements Results
Jaiprakash Asso Results
KSK Energy Results NCC Results Patel Engr Results Pipavav Ship Results Punj Lloyd Results Simplex Infra Results Spicejet Results Tata Steel Results Tech Mahindra Results Unitech Results
Videocon Inds Results

8/6/2019 Market Outlook 12th August 2011
http://slidepdf.com/reader/full/market-outlook-12th-august-2011 6/6
August 12, 2011 6
Market Outlook | India Research
Research Team Tel: 022-3935 7800 E-mail: [email protected] Website: www.angelbroking.com
DISCLAIMER
This document is solely for the personal information of the recipient, and must not be singularly used as the basis of any investment
decision. Nothing in this document should be construed as investment or financial advice. Each recipient of this document should make
such investigations as they deem necessary to arrive at an independent evaluation of an investment in the securities of the companiesreferred to in this document (including the merits and risks involved), and should consult their own advisors to determine the merits and
risks of such an investment.
Angel Broking Limited, its affiliates, directors, its proprietary trading and investment businesses may, from time to time, make investment
decisions that are inconsistent with or contradictory to the recommendations expressed herein. The views contained in this document are
those of the analyst, and the company may or may not subscribe to all the views expressed within.
Reports based on technical and derivative analysis center on studying charts of a stock's price movement, outstanding positions and
trading volume, as opposed to focusing on a company's fundamentals and, as such, may not match with a report on a company's
fundamentals.
The information in this document has been printed on the basis of publicly available information, internal data and other reliable sources
believed to be true, but we do not represent that it is accurate or complete and it should not be relied on as such, as this document is forgeneral guidance only. Angel Broking Limited or any of its affiliates/ group companies shall not be in any way responsible for any loss or
damage that may arise to any person from any inadvertent error in the information contained in this report. Angel Broking Limited has
not independently verified all the information contained within this document. Accordingly, we cannot testify, nor make any representation
or warranty, express or implied, to the accuracy, contents or data contained within this document. While Angel Broking Limited
endeavours to update on a reasonable basis the information discussed in this material, there may be regulatory, compliance, or other
reasons that prevent us from doing so.
This document is being supplied to you solely for your information, and its contents, information or data may not be reproduced,
redistributed or passed on, directly or indirectly.
Angel Broking Limited and its affiliates may seek to provide or have engaged in providing corporate finance, investment banking or other
advisory services in a merger or specific transaction to the companies referred to in this report, as on the date of this report or in the past.
Neither Angel Broking Limited, nor its directors, employees or affiliates shall be liable for any loss or damage that may arise from or in
connection with the use of this information.
Note: Please refer to the important ‘Stock Holding Disclosure' report on the Angel website (Research Section). Also, please refer to thelatest update on respective stocks for the disclosure status in respect of those stocks. Angel Broking Limited and its affiliates may haveinvestment positions in the stocks recommended in this report.
Angel Broking Ltd: BSE Sebi Regn No : INB 010996539 / CDSL Regn No: IN - DP - CDSL - 234 - 2004 / PMS Regn Code: PM/INP000001546
Angel Capital & Debt Market Ltd: INB 231279838 / NSE FNO: INF 231279838 / NSE Member code -12798 Angel Commodities Broking (P) Ltd: MCX Member ID: 12685 / FMC Regn No: MCX / TCM /
CORP / 0037 NCDEX : Member ID 00220 / FMC Regn No: NCDEX / TCM / CORP / 0302
Address: 6th Floor, Ackruti Star, Central Road, MIDC, Andheri (E), Mumbai - 400 093.
Tel: (022) 3935 7800
Ratings (Returns): Buy (> 15%) Accumulate (5% to 15%) Neutral (-5 to 5%)Reduce (-5% to 15%) Sell (< -15%)