market pulse report second quarter 2014 · market pulse report second quarter 2014 scott bushkie,...
TRANSCRIPT

1
Market Pulse ReportSecond Quarter 2014
Scott Bushkie, CBI, M&AMI, IBBA Marketing Chair
Lisa Riley, Ph.D. IBBA Marketing Chair
Craig Everett, Ph.D., MBA Assistant Professor of Finance
Director, Pepperdine Private Capital Markets Project
2
This research was made possible with the support of the International Business Brokers Association (IBBA) and M&A
Source.

3
ACKNOWLEDGEMENTS
We’d also like to thank the following people at The GraziadioSchool of Business and Management for their contributions:
Dean Linda LivingstoneAssociate Dean David M. Smith
Mike Sims, Executive Officer, CERJohn K. Paglia, Associate Professor of Finance
Douglass Gore, Director of Public RelationsMark Chun, Director, Center for Applied Research
Bill Bleuel, Professor of Decision SciencesIrina Shaykhutdinova, Research Analyst

4
I. About the Market Pulse Report……….……….…………........5
II. Current Business Environment……………………….…..……7
III. Business Transactions Closed in the Last 3 Months……….11
IV. Business Transactions Terminated in the Last 3 Months…..96
V. Business Expectations…………………………………....…...99VI. About the respondents………………..….………………..…102
Outline
5
The International Business Brokers Association (IBBA) and M&A
Source, in partnership with Pepperdine Private Capital Markets
Project, have set a goal to provide quality information on a
quarterly basis in order to become the go-to source for Main
Street and Lower Middle Market transactions. The “Market
Pulse Report” gives you timely and accurate data to help you
build and maintain a successful and sustainable business.
I.AbouttheMarketPulseReport

6
• 25 questions• Invited participants were members of the
International Business Brokers Association (IBBA),IBBAAffiliates/Chapters, and/or M&A Source
• 202 completed responses• Responses collected from July 1 to July 15, 2014
AbouttheSurvey

7
IV. CurrentBusinessEnvironment
8
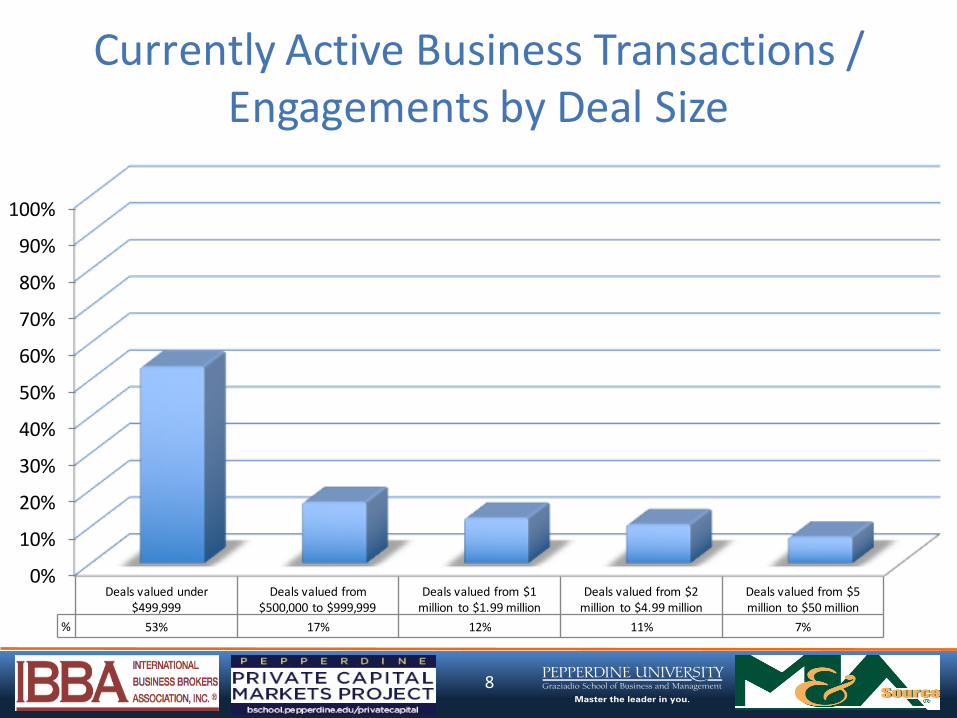
CurrentlyActiveBusinessTransactions /Engagements byDealSize
0%
10%
20%
30%
40%
50%
60%
70%
80%
90%
100%
Dealsvaluedunder$499,999
Dealsvaluedfrom$500,000to$999,999
Dealsvaluedfrom$1million to$1.99million
Dealsvaluedfrom$2million to$4.99million
Dealsvaluedfrom$5million to$50million
% 53% 17% 12% 11% 7%

9
BusinessTransactions That Are Currently inEscrow/Accepted LOI/Due Diligence byDealSize
0%10%20%30%40%50%60%70%80%90%100%
Dealsvaluedunder$499,999
Dealsvaluedfrom$500,000to$999,999
Dealsvaluedfrom$1million to$1.99million
Dealsvaluedfrom$2million to$4.99million
Dealsvaluedfrom$5million to$50million
% 50% 11% 15% 17% 7%

10
PercentageofBabyBoomersasNewClients
0%
10%
20%
30%
40%
50%
60%
70%
80%
90%
100%
Ofyournewlistingclientsin2014,whatpercentageareBabyBoomers?
Ofyournew'buyer'clientsin2014,whatpercentageareBabyBoomers?
64%
39%

11
II. BusinessTransactionsClosedintheLast3Months

12
NumberofBusinessTransactionsClosedbyRespondentsintheLast3Months
Numberofresponses=101
0
10
20
30
40
50
60
1 2 3 4 5 6 8 10 >10Number ofRespondents 54 19 14 5 4 1 1 2 1
13
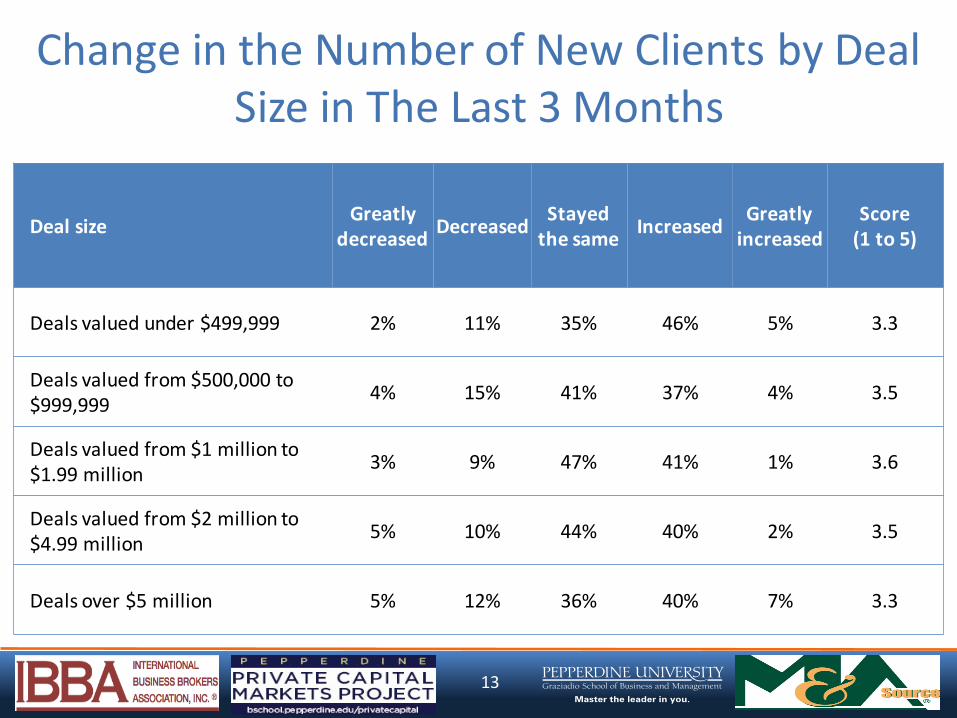
ChangeintheNumberofNewClientsbyDealSizeinTheLast3Months
Dealsize Greatlydecreased Decreased Stayed
thesame Increased Greatlyincreased
Score(1to5)
Dealsvaluedunder$499,999 2% 11% 35% 46% 5% 3.3
Dealsvaluedfrom$500,000to$999,999 4% 15% 41% 37% 4% 3.5
Dealsvaluedfrom$1millionto$1.99million 3% 9% 47% 41% 1% 3.6
Dealsvaluedfrom$2millionto$4.99million 5% 10% 44% 40% 2% 3.5
Dealsover$5million 5% 12% 36% 40% 7% 3.3
14
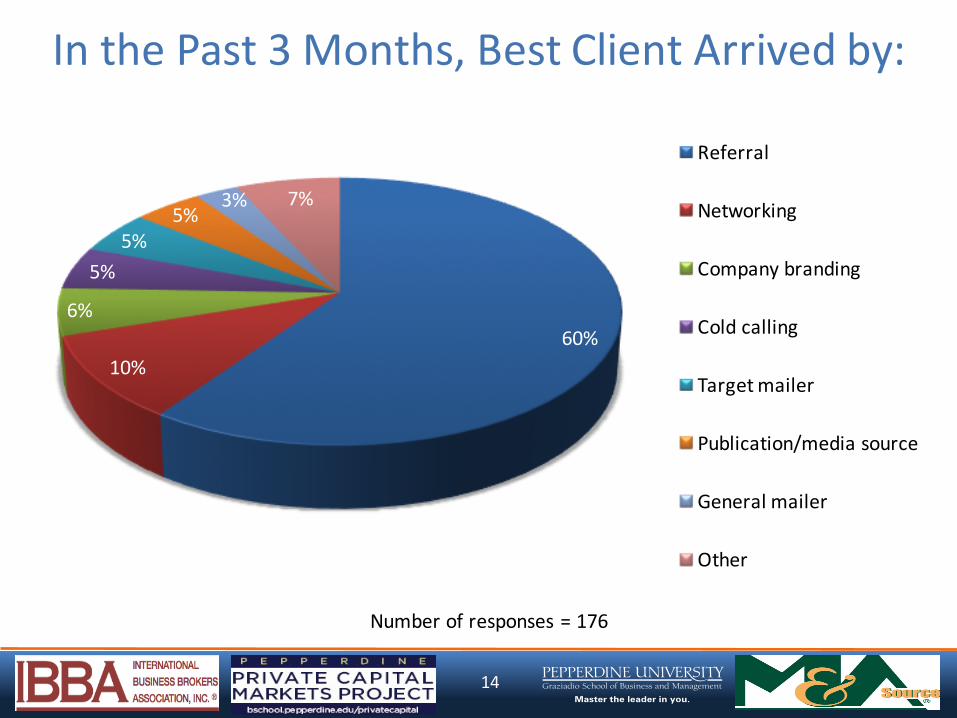
InthePast 3Months,Best Client Arrived by:
Numberofresponses=176
60%10%
6%
5%5%
5%3% 7%
Referral
Networking
Companybranding
Coldcalling
Targetmailer
Publication/mediasource
Generalmailer
Other

15
TypesofReferrals
41%
18%
13%
12%Pastclient
Attorney
Financialadvisor
Accountant

16
Was it Buyer’s or Seller’s Market intheLast3Months?
Number ofresponses 96 81 80 63 42
0%10%20%30%40%50%60%70%80%90%100%
Dealsvaluedunder$499,999
Dealsvaluedfrom$500,000to$999,999
Dealsvaluedfrom$1million to$1.99million
Dealsvaluedfrom$2million to$4.99million
Dealsvaluedfrom$5million to$50million
Buyer'smarket 69% 53% 53% 49% 31%
Seller'smarket 31% 47% 48% 51% 69%

17
ReasonsForTheRobustActivityInToday’sMarket
0%
10%
20%
30%
40%
50%
60%
70%
80%
90%
100%
Morebuyers Betterperformingbusinesses
Strongerconfidence/lessuncertainty
Moresellers Lowinterestrates/cheapmoney
Moreaggressivefinancing
Excessivecashoncorporatebalancesheets
Other
% 20% 19% 18% 17% 10% 9% 3% 3%

18
NumberofClientsWhoTriedtoSellTheirBusinessOnTheir OwnPriortoContacting
Respondents
0%
10%
20%
30%
40%
50%
60%
70%
80%
90%
100%
0 1 2 3 4 5 6 9 10+% 44% 32% 12% 5% 2% 3% 1% 1% 1%
19
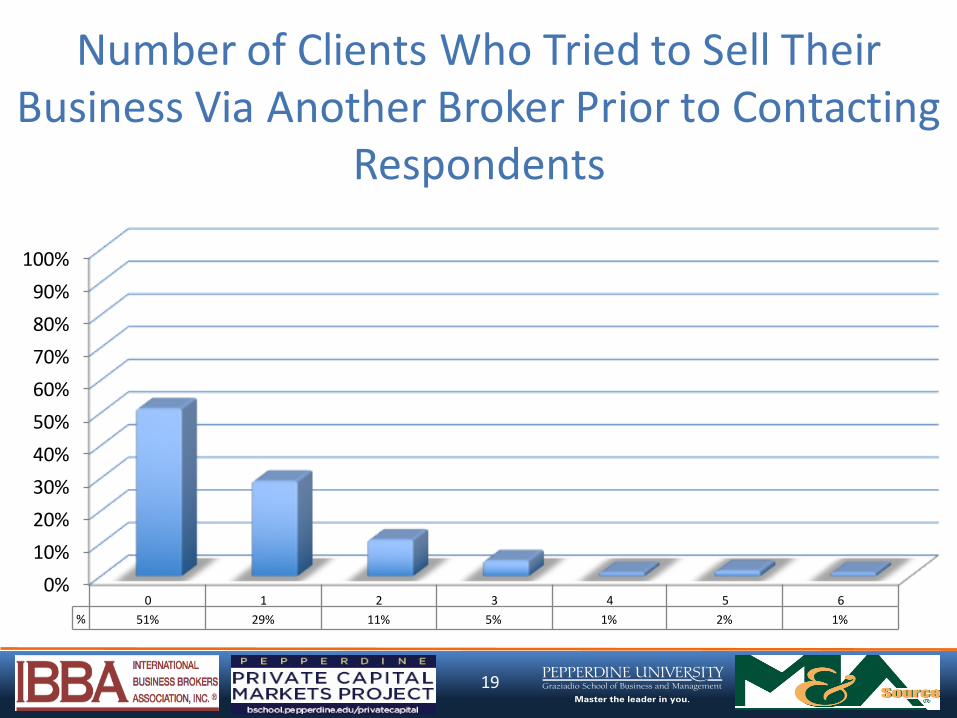
NumberofClientsWhoTriedtoSellTheirBusinessViaAnotherBrokerPriortoContacting
Respondents
0%10%20%30%40%50%60%70%80%90%100%
0 1 2 3 4 5 6% 51% 29% 11% 5% 1% 2% 1%

20
NumberofClientsWhoApproachedbyaBuyerPriorContactingRespondents
0%
10%
20%
30%
40%
50%
60%
70%
80%
90%
100%
0 1 2 3 4 5% 47% 26% 21% 3% 1% 2%

21
NumberofClientsWhoApproachedbyAnotherBrokerPriortoContactingRespondents
0%
10%
20%
30%
40%
50%
60%
70%
80%
90%
100%
0 1 2 3 4 5 6 7 10+% 35% 24% 20% 9% 4% 4% 2% 1% 1%

22
BusinessTransactionsClosedintheLast3MonthsbyDealSize
0%
10%
20%
30%
40%
50%
60%
70%
80%
90%
100%
Dealsvaluedunder$499,999
Dealsvaluedfrom$500,000to$999,999
Dealsvaluedfrom$1million to$1.99million
Dealsvaluedfrom$2million to$4.99million
Dealsvaluedfrom$5million to$50million
% 57% 17% 16% 6% 4%

23
BusinessTransactionsofAllSizes,Comparison

24
MedianTimetoCloseaDeal(Months)
0
1
2
3
4
5
6
7
8
9
10
<500K 500K- 1M 1M- 2M 2M- 5M 5M- 50M
3
5
6 6 6

25
MedianSDEMultiplePaid
0.0
0.5
1.0
1.5
2.0
2.5
3.0
3.5
4.0
4.5
5.0
<500K 500K- 1M 1M- 2M
2.0
2.83.1

26
MedianEBITDAMultiplePaid
0.0
0.5
1.0
1.5
2.0
2.5
3.0
3.5
4.0
4.5
5.0
<500K 500K- 1M 1M- 2M 2M- 5M 5M- 50M
2.62.9
4.34.5
5.4

27
MultipleType
0%10%20%30%40%50%60%70%80%90%100%
<500K 500K- 1M 1M- 2M 2M- 5M 5M- 50MSDEincludingworkingcapital 15% 16% 26% 0% 0%SDEnot includingworkingcapital 65% 46% 47% 9% 0%EBITDAincludingworkingcapital 3% 11% 0% 36% 0%EBITDAnot includingworkingcapital 16% 24% 5% 36% 50%TTMEBITDAincludingworkingcapital 0% 0% 11% 18% 50%TTMEBITDAnotincludingworkingcapital 0% 3% 11% 0% 0%

28
BuyerType
0%10%20%30%40%50%60%70%80%90%100%
<500K 500K- 1M 1M- 2M 2M- 5M 5M- 50M1sttimeindividual 55% 49% 32% 64% 0%individualwhoowned abusiness 32% 31% 21% 27% 25%existingcompany/strategicbuyer 11% 17% 42% 9% 25%PEfirm- Platform 0% 0% 5% 0% 50%PEfirm- Add-on 0% 0% 0% 0% 0%Other 2% 3% 0% 0% 0%

29
#1Reason forSeller to Go to Market
0%
20%
40%
60%
80%
100%
<500K 500K- 1M 1M- 2M 2M- 5M 5M- 50MAcquisition 1% 3% 5% 9% 0%Burntout 18% 11% 11% 0% 0%Familyissues 15% 6% 0% 18% 50%Health 12% 9% 5% 0% 0%Newopportunity 18% 29% 16% 9% 0%Potentialtaxesincreases 0% 0% 0% 0% 0%Relocation/moving 11% 11% 5% 9% 0%Retirement 18% 29% 53% 36% 25%Unsolicitedoffer 0% 0% 0% 9% 25%Other 6% 3% 5% 9% 0%
30
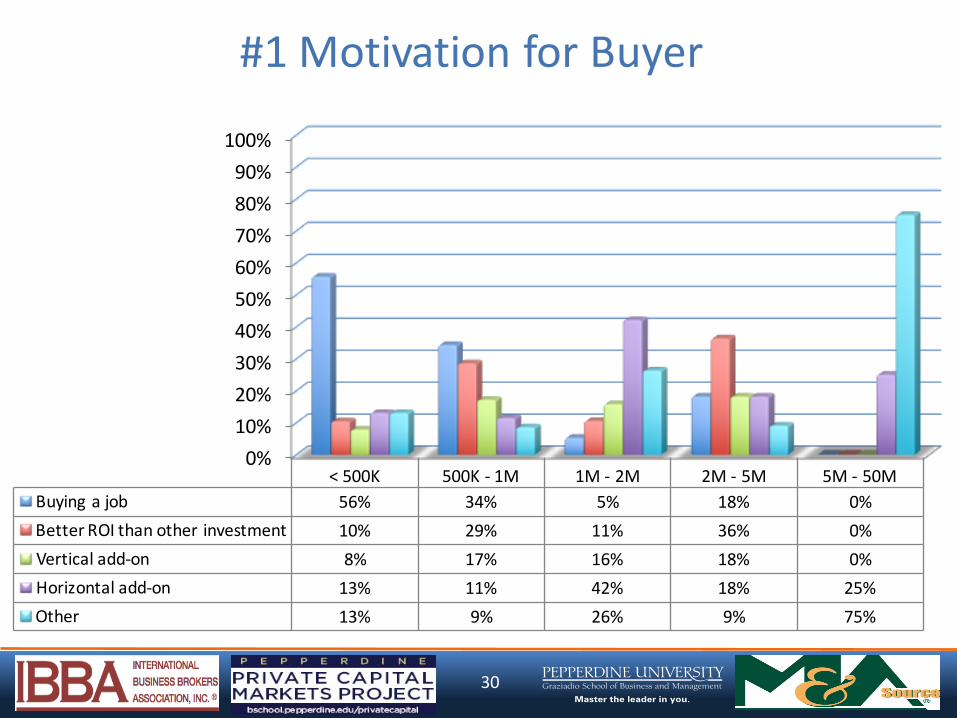
#1MotivationforBuyer
0%10%20%30%40%50%60%70%80%90%100%
<500K 500K- 1M 1M- 2M 2M- 5M 5M- 50MBuyingajob 56% 34% 5% 18% 0%BetterROIthanotherinvestment 10% 29% 11% 36% 0%Verticaladd-on 8% 17% 16% 18% 0%Horizontaladd-on 13% 11% 42% 18% 25%Other 13% 9% 26% 9% 75%

31
FinancingStructure
0%10%20%30%40%50%60%70%80%90%100%
<500K 500K- 1M 1M- 2M 2M- 5M 5M- 50MBuyersequity 73% 54% 64% 62% 25%Seniordebt 10% 21% 27% 23% 43%Sellerfinancing 13% 18% 9% 10% 0%Earnout 0% 3% 1% 1% 27%Sellerretainedequity 1% 2% 0% 3% 5%Mezzaninefinancing 0% 0% 0% 0% 0%Other 2% 2% 0% 1% 0%
32
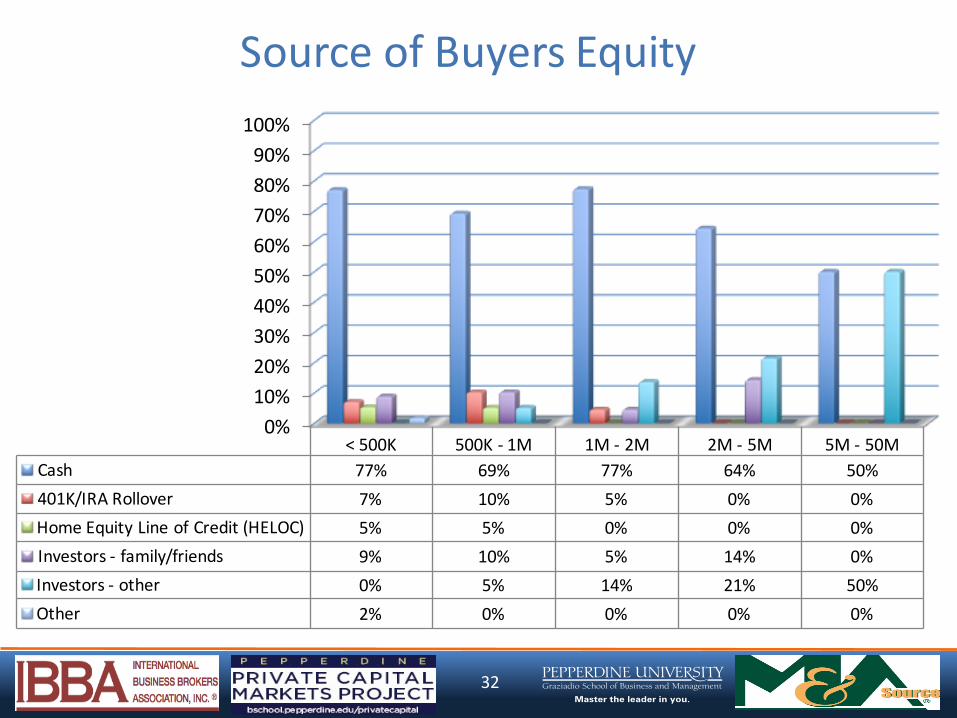
SourceofBuyersEquity
0%10%20%30%40%50%60%70%80%90%100%
<500K 500K- 1M 1M- 2M 2M- 5M 5M- 50MCash 77% 69% 77% 64% 50%401K/IRARollover 7% 10% 5% 0% 0%HomeEquityLineofCredit(HELOC) 5% 5% 0% 0% 0%Investors- family/friends 9% 10% 5% 14% 0%Investors- other 0% 5% 14% 21% 50%Other 2% 0% 0% 0% 0%
33
II-I BusinessTransactionsValuedunder$499,999
34
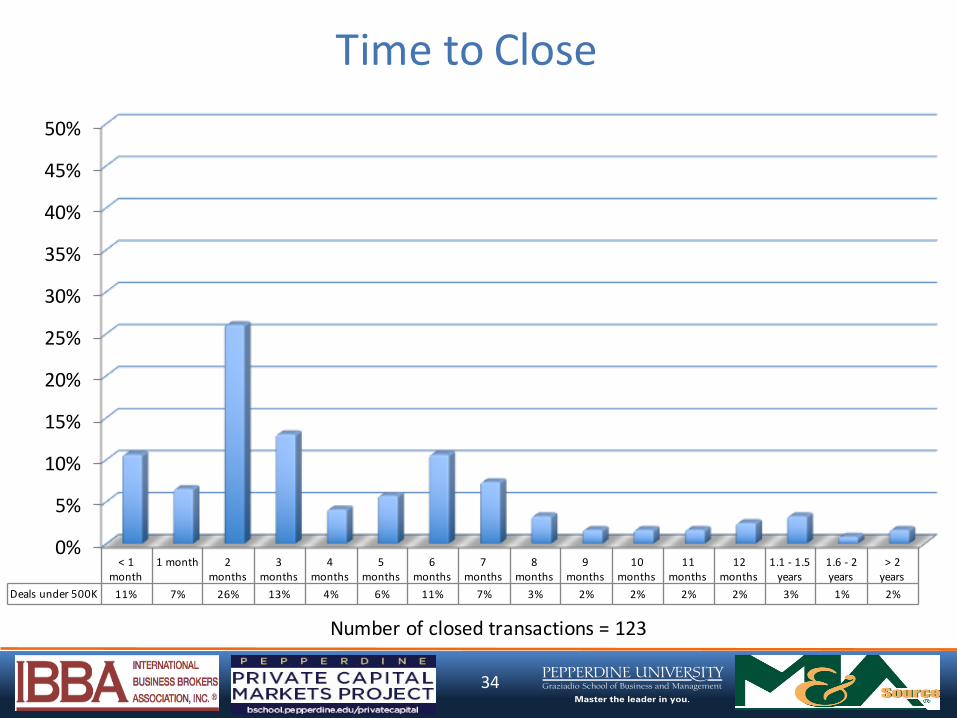
TimetoClose
Numberofclosedtransactions=123
0%
5%
10%
15%
20%
25%
30%
35%
40%
45%
50%
<1month
1month 2months
3months
4months
5months
6months
7months
8months
9months
10months
11months
12months
1.1- 1.5years
1.6- 2years
>2years
Dealsunder500K 11% 7% 26% 13% 4% 6% 11% 7% 3% 2% 2% 2% 2% 3% 1% 2%
35
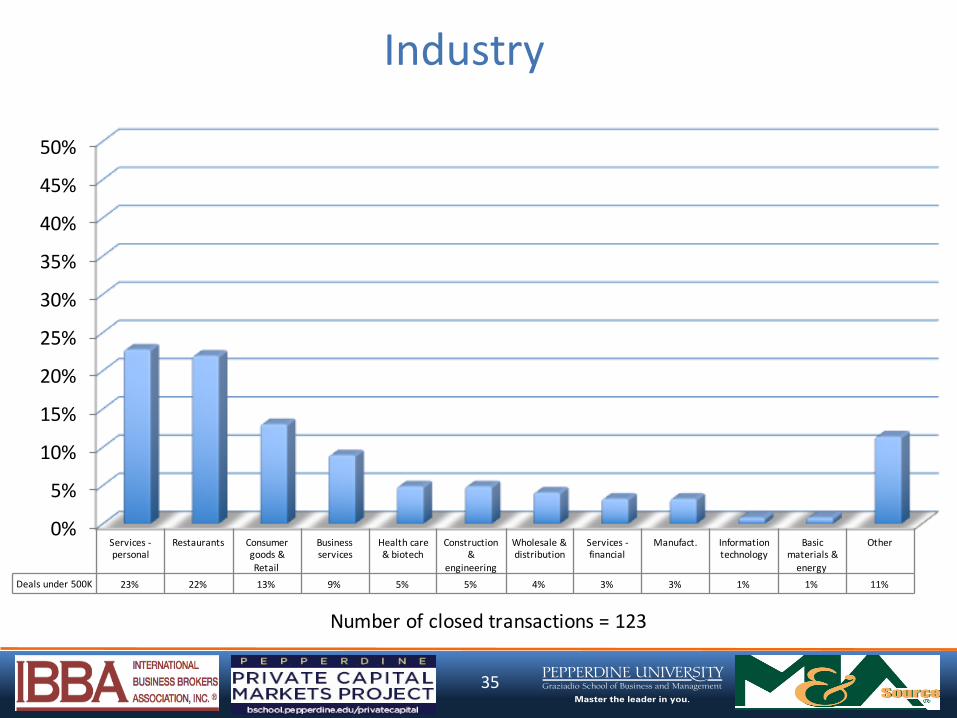
Industry
Numberofclosedtransactions=123
0%
5%
10%
15%
20%
25%
30%
35%
40%
45%
50%
Services-personal
Restaurants Consumergoods&Retail
Businessservices
Healthcare&biotech
Construction&
engineering
Wholesale&distribution
Services-financial
Manufact. Informationtechnology
Basicmaterials&energy
Other
Dealsunder500K 23% 22% 13% 9% 5% 5% 4% 3% 3% 1% 1% 11%

36
SDEMultiplePaid
Numberofclosedtransactions=99
0%
5%
10%
15%
20%
25%
30%
35%
40%
45%
50%
0.25 0.5 0.75 1 1.25 1.5 1.75 2 2.25 2.5 2.75 3 3.5 4 4.5 10Dealsunder 500K 6% 4% 1% 5% 4% 12% 13% 15% 10% 7% 7% 5% 2% 6% 1% 1%

37
EBITDAMultiplePaid
Numberofclosedtransactions=24
0%
5%
10%
15%
20%
25%
30%
35%
40%
45%
50%
0.25 0.75 1 1.25 1.5 1.75 2 2.25 2.5 2.75 3 3.25 8.25Dealsunder 500K 8% 4% 8% 4% 8% 4% 8% 4% 25% 4% 8% 4% 8%
38
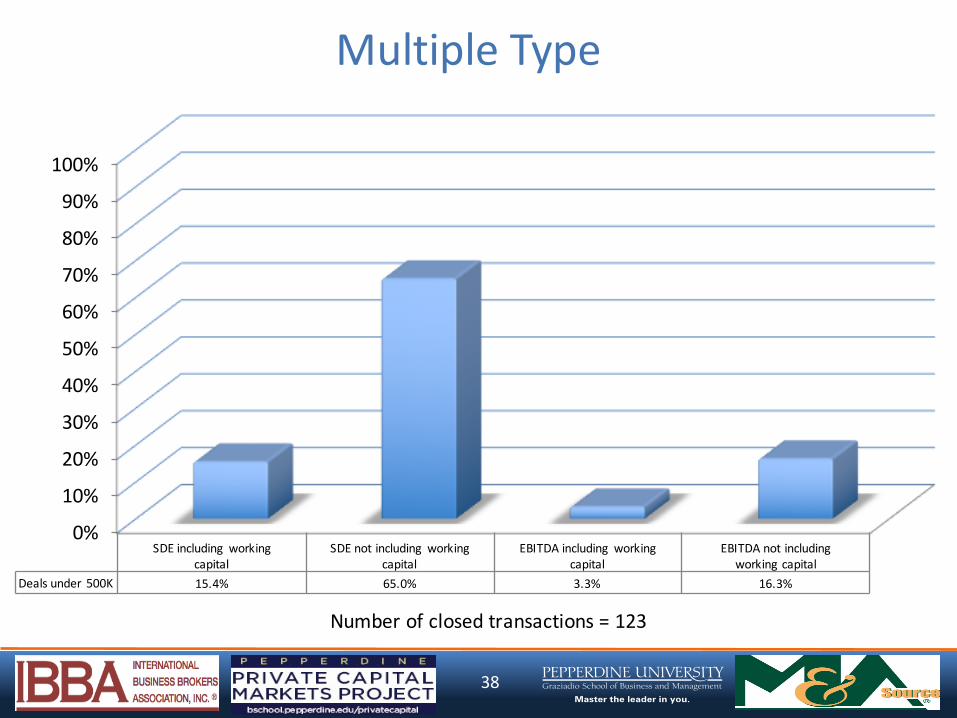
MultipleType
Numberofclosedtransactions=123
0%
10%
20%
30%
40%
50%
60%
70%
80%
90%
100%
SDEincluding workingcapital
SDEnotincluding workingcapital
EBITDAincluding workingcapital
EBITDAnotincludingworkingcapital
Dealsunder 500K 15.4% 65.0% 3.3% 16.3%
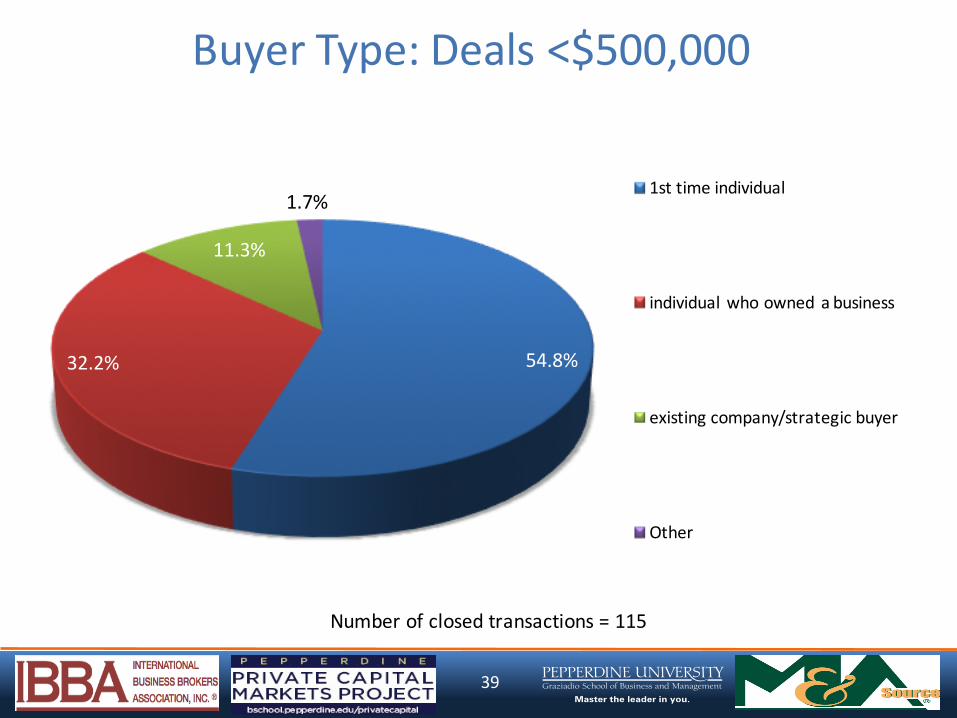
39
BuyerType:Deals<$500,000
Numberofclosedtransactions=115
54.8%32.2%
11.3%
1.7%1sttimeindividual
individualwhoowned abusiness
existingcompany/strategicbuyer
Other

40
#1Reason forSeller to Go to Market
Numberofclosedtransactions=115
0%
5%
10%
15%
20%
25%
30%
35%
40%
45%
50%
Retirement Burnt out New/betteropportunity
Familyissues Health Relocation/moving
Recapitalization
Other
Dealsunder 500K 18% 18% 18% 15% 12% 11% 1% 6%

41
BuyerLocation(Distance)
Numberofclosedtransactions=115
0%
5%
10%
15%
20%
25%
30%
35%
40%
45%
50%
within 20miles within 50miles within 100miles morethan100milesDealsunder 500K 50% 22% 3% 24%

42
BuyerLocation(Global)
Numberofclosedtransactions=115
0%
5%
10%
15%
20%
25%
30%
35%
40%
45%
50%
within city within state within country international buyerDealsunder 500K 43% 28% 19% 10%

43
#1MotivationforBuyer
Numberofclosedtransactions=115
0%
5%
10%
15%
20%
25%
30%
35%
40%
45%
50%
Buyingajob Horizontal add-on Better ROIthanotherinvestment
Verticaladd-on Other
Dealsunder 500K 56% 13% 10% 8% 13%
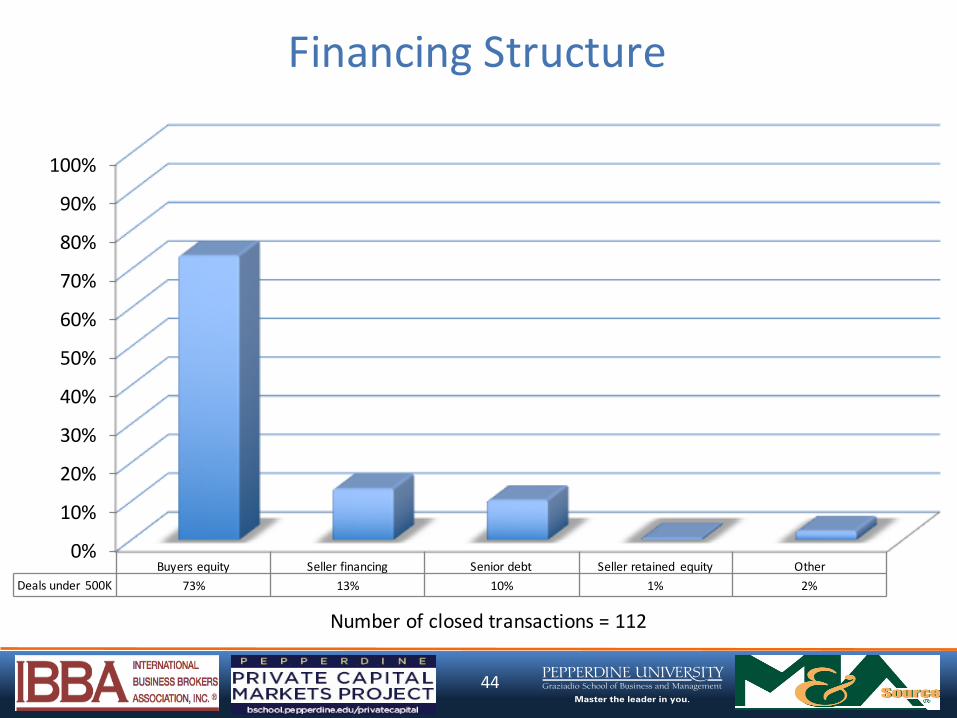
44
FinancingStructure
Numberofclosedtransactions=112
0%
10%
20%
30%
40%
50%
60%
70%
80%
90%
100%
Buyersequity Sellerfinancing Seniordebt Sellerretained equity OtherDealsunder 500K 73% 13% 10% 1% 2%
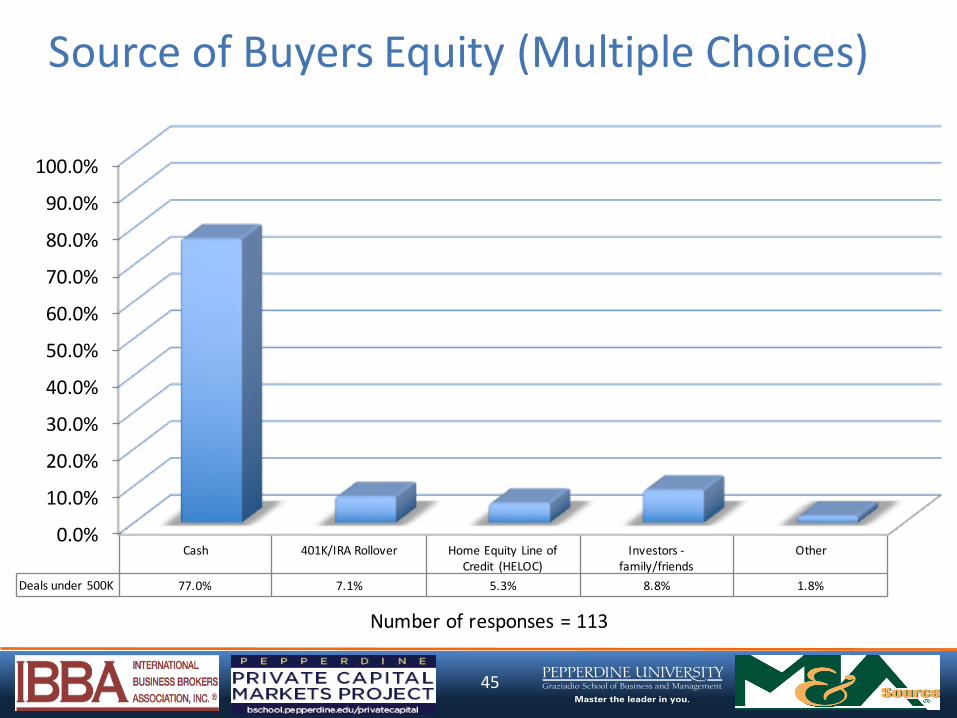
45
SourceofBuyersEquity(MultipleChoices)
Numberofresponses=113
0.0%
10.0%
20.0%
30.0%
40.0%
50.0%
60.0%
70.0%
80.0%
90.0%
100.0%
Cash 401K/IRARollover HomeEquityLineofCredit (HELOC)
Investors-family/friends
Other
Dealsunder 500K 77.0% 7.1% 5.3% 8.8% 1.8%
46
II-II BusinessTransactionsValuedfrom$500,000to$999,999

47
TimetoClose
Numberofclosedtransactions=37
0%
5%
10%
15%
20%
25%
30%
35%
40%
45%
50%
1month 2months 3months 4months 5months 6months 7months 8months 9months 11months 12months 1.1- 1.5years
Dealsfrom$500Kto$1M 5% 16% 14% 5% 14% 8% 3% 5% 3% 3% 16% 8%

48
Industry
Numberofclosedtransactions=37
0%
5%
10%
15%
20%
25%
30%
35%
40%
45%
50%
Consumergoods& Retail
Businessservices
Services-personal
Restaurants Wholesale&distribution
Healthcare&biotech
Construction&engineering
Services-financial
Informationtechnology
Other
Dealsunder500K 19% 16% 8% 8% 8% 5% 5% 5% 3% 22%

49
SDEMultiplePaid
Numberofclosedtransactions=23
0%
5%
10%
15%
20%
25%
30%
35%
40%
45%
50%
1.5 2 2.25 2.5 2.75 3 3.5 3.75 4Dealsfrom$500Kto$1M 4% 4% 17% 13% 13% 35% 4% 4% 4%

50
EBITDAMultiplePaid
Numberofclosedtransactions=14
0%
5%
10%
15%
20%
25%
30%
35%
40%
45%
50%
0.25 1.75 2 2.25 2.5 2.75 3 4 4.5 7.5 >10Dealsfrom$500Kto$1M 7% 7% 7% 7% 7% 14% 14% 14% 7% 7% 7%
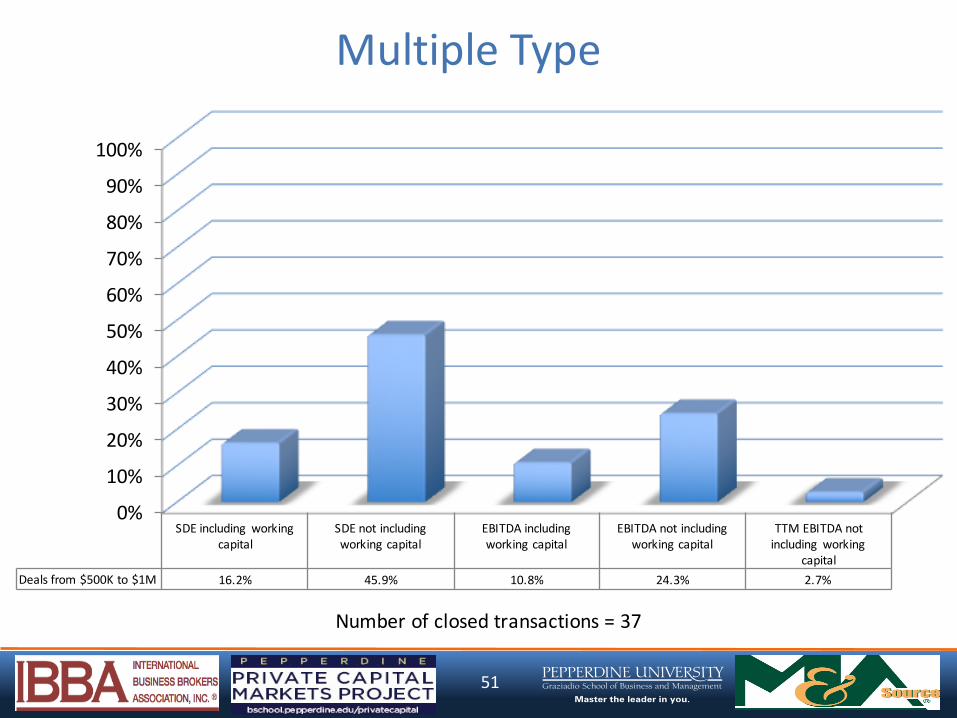
51
MultipleType
Numberofclosedtransactions=37
0%
10%
20%
30%
40%
50%
60%
70%
80%
90%
100%
SDEincluding workingcapital
SDEnotincludingworkingcapital
EBITDAincludingworkingcapital
EBITDAnotincludingworkingcapital
TTMEBITDAnotincluding working
capitalDealsfrom$500Kto$1M 16.2% 45.9% 10.8% 24.3% 2.7%
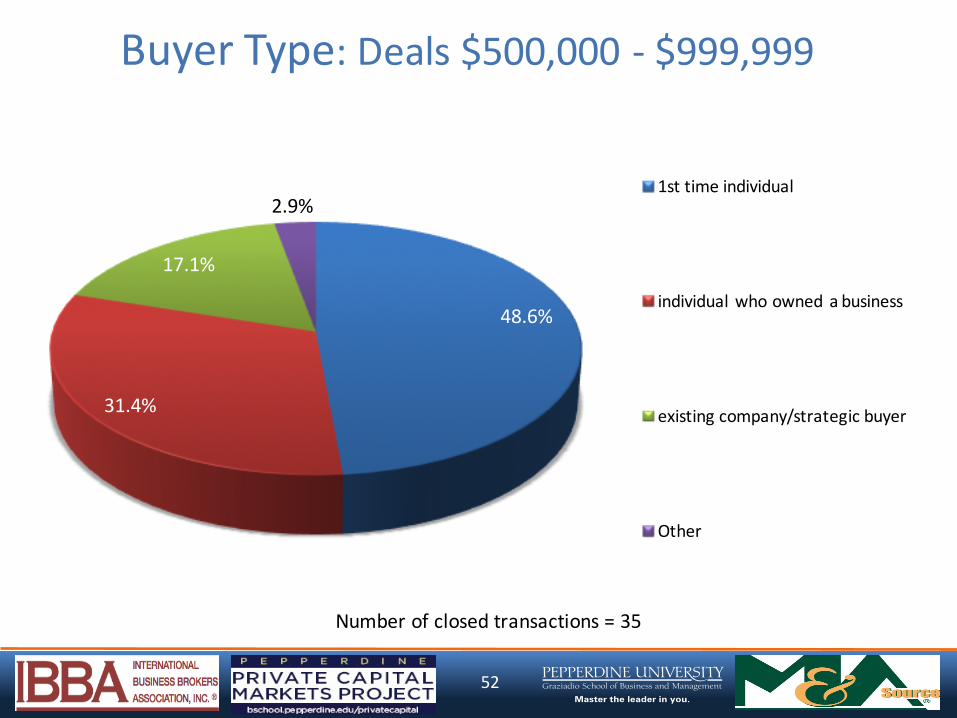
52
BuyerType:Deals$500,000- $999,999
Numberofclosedtransactions=35
48.6%
31.4%
17.1%
2.9%1sttimeindividual
individualwhoowned abusiness
existingcompany/strategicbuyer
Other
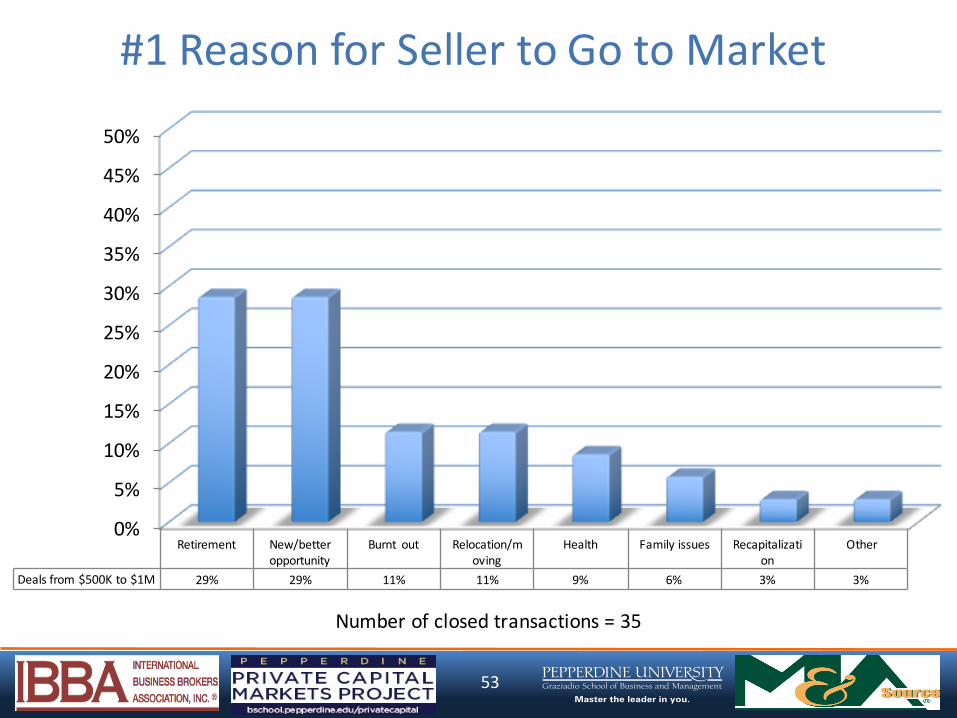
53
#1Reason forSeller to Go to Market
Numberofclosedtransactions=35
0%
5%
10%
15%
20%
25%
30%
35%
40%
45%
50%
Retirement New/betteropportunity
Burnt out Relocation/moving
Health Familyissues Recapitalization
Other
Dealsfrom$500Kto$1M 29% 29% 11% 11% 9% 6% 3% 3%
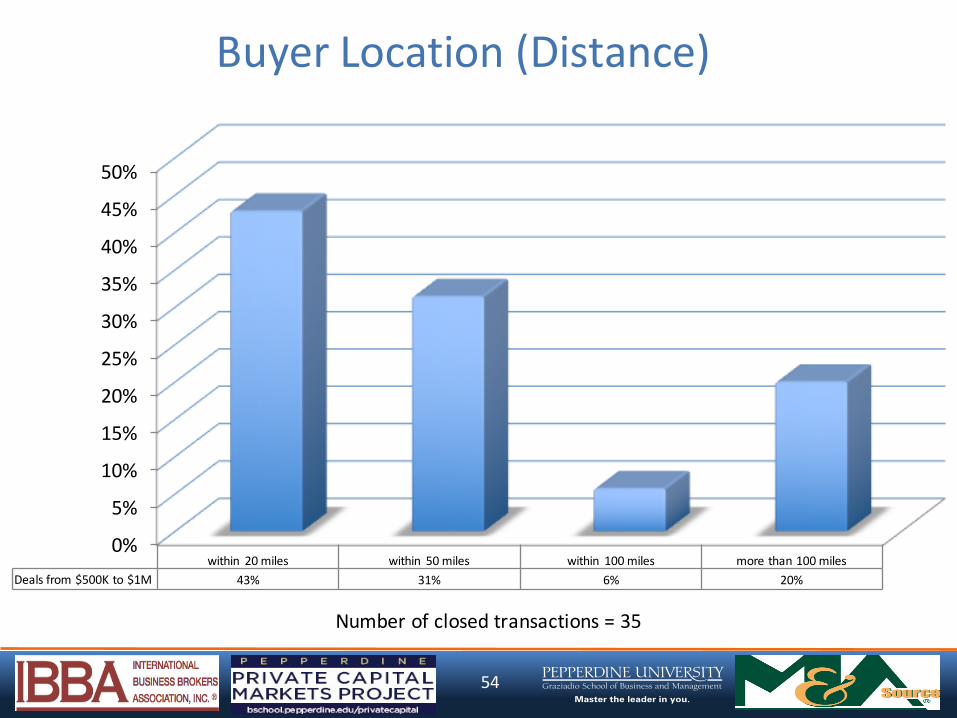
54
BuyerLocation(Distance)
Numberofclosedtransactions=35
0%
5%
10%
15%
20%
25%
30%
35%
40%
45%
50%
within 20miles within 50miles within 100miles morethan100milesDealsfrom$500Kto$1M 43% 31% 6% 20%

55
BuyerLocation(Global)
Numberofclosedtransactions=35
0%
5%
10%
15%
20%
25%
30%
35%
40%
45%
50%
within city within state within country international buyerDealsfrom$500Kto$1M 34% 46% 17% 3%

56
#1MotivationforBuyer
Numberofclosedtransactions=35
0%
5%
10%
15%
20%
25%
30%
35%
40%
45%
50%
Buyingajob Horizontal add-on Better ROIthanotherinvestment
Verticaladd-on Other
Dealsfrom$500Kto$1M 34% 11% 29% 17% 9%

57
FinancingStructure
Numberofclosedtransactions=34
0%
10%
20%
30%
40%
50%
60%
70%
80%
90%
100%
Buyersequity Seniordebt Sellerfinancing Earnout Sellerretainedequity
Other
Dealsfrom$500Kto$1M 54% 21% 18% 3% 2% 2%

58
SourceofBuyersEquity
Numberofresponses=39
0.0%
10.0%
20.0%
30.0%
40.0%
50.0%
60.0%
70.0%
80.0%
90.0%
100.0%
Cash 401K/IRARollover Investors-family/friends
HomeEquityLineofCredit (HELOC)
Investors- other
Dealsfrom$500Kto$1M 69.2% 10.3% 10.3% 5.1% 5.1%

59
II-III BusinessTransactionsValuedfrom$1Millionto$1.99Million
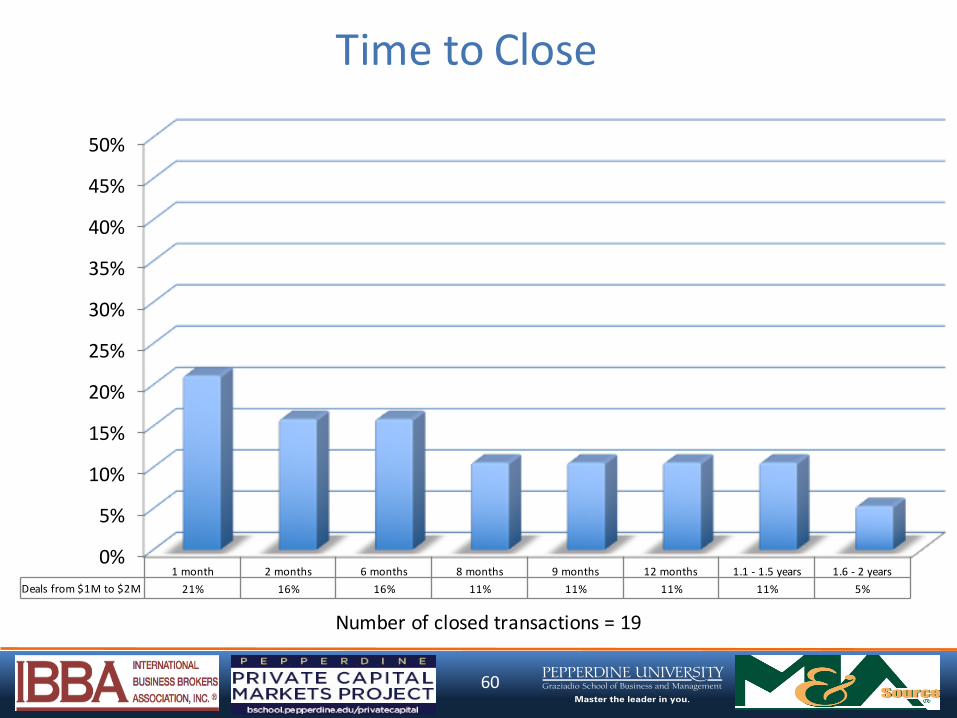
60
TimetoClose
Numberofclosedtransactions=19
0%
5%
10%
15%
20%
25%
30%
35%
40%
45%
50%
1month 2months 6months 8months 9months 12months 1.1- 1.5years 1.6- 2yearsDealsfrom$1Mto$2M 21% 16% 16% 11% 11% 11% 11% 5%
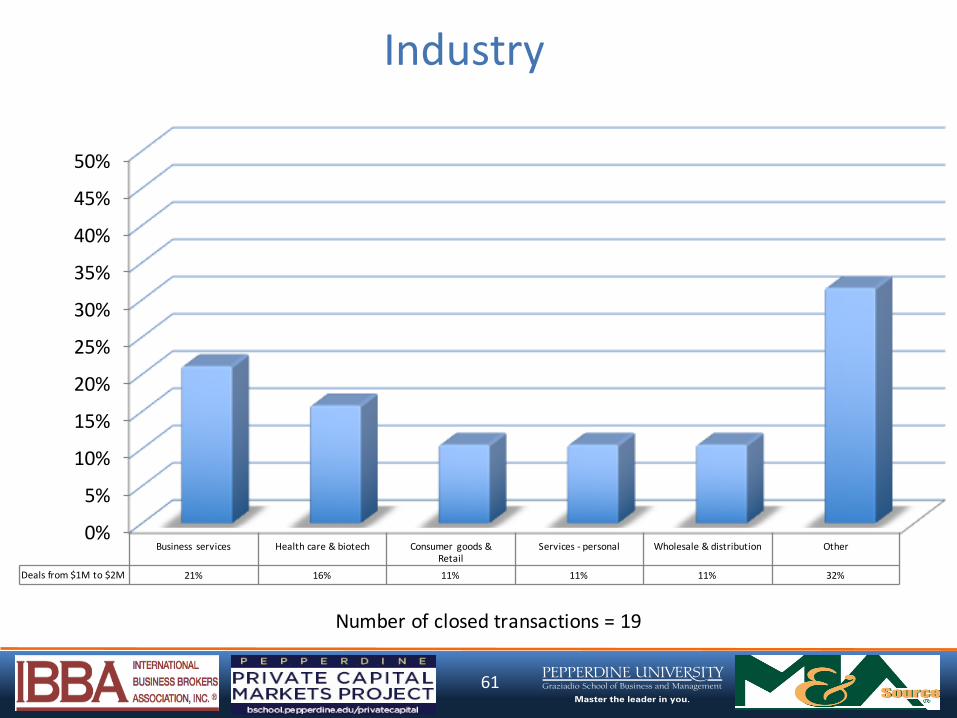
61
Industry
Numberofclosedtransactions=19
0%
5%
10%
15%
20%
25%
30%
35%
40%
45%
50%
Business services Healthcare&biotech Consumer goods&Retail
Services- personal Wholesale&distribution Other
Dealsfrom$1Mto$2M 21% 16% 11% 11% 11% 32%
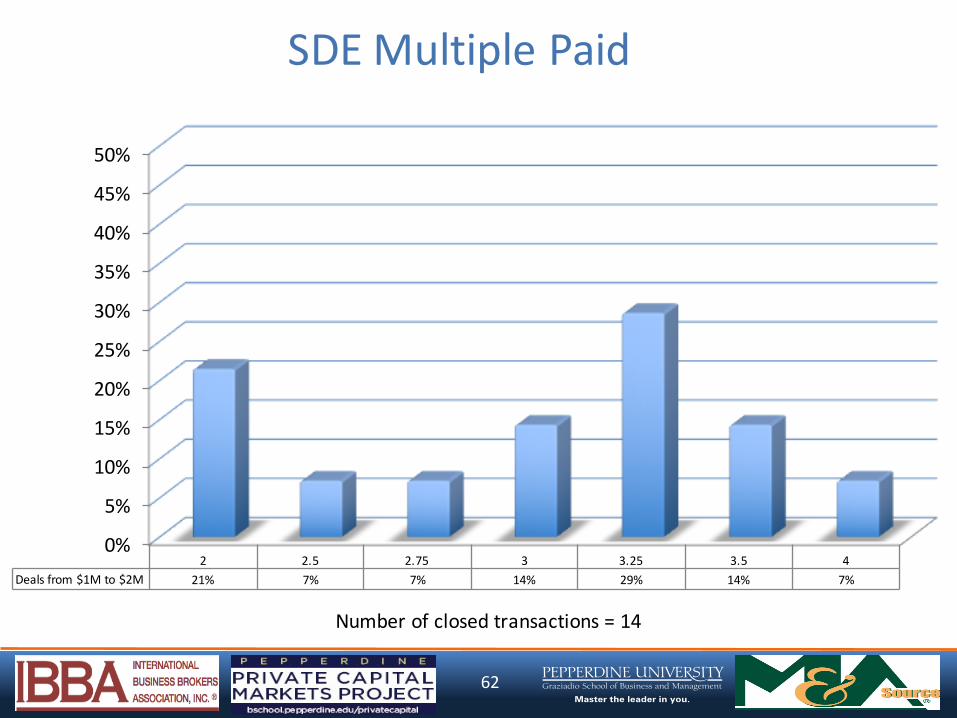
62
SDEMultiplePaid
Numberofclosedtransactions=14
0%
5%
10%
15%
20%
25%
30%
35%
40%
45%
50%
2 2.5 2.75 3 3.25 3.5 4Dealsfrom$1Mto$2M 21% 7% 7% 14% 29% 14% 7%
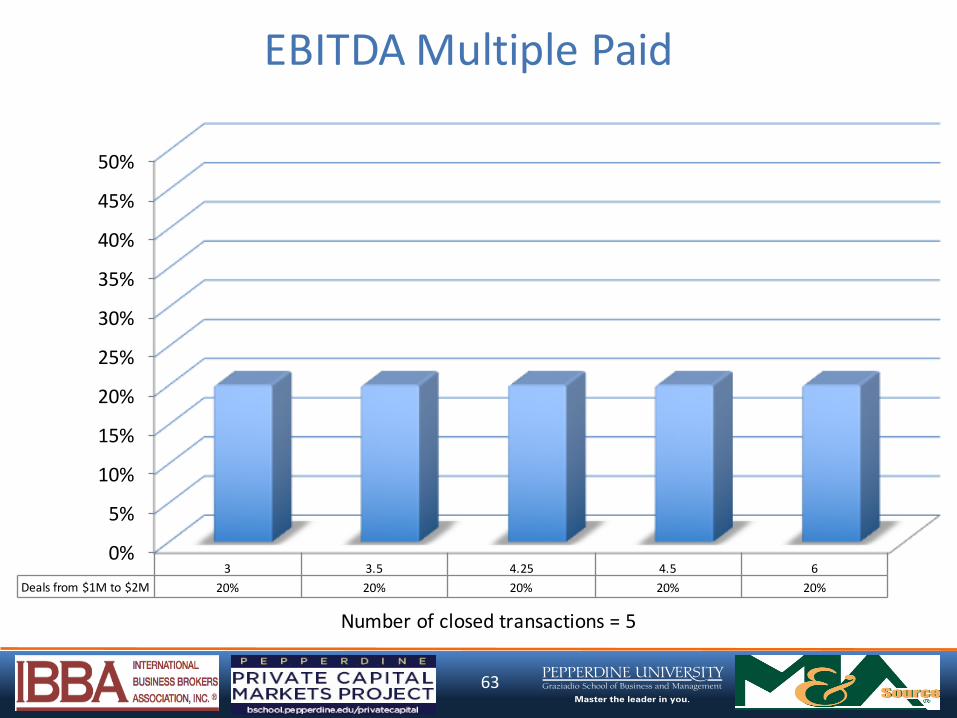
63
EBITDAMultiplePaid
Numberofclosedtransactions=5
0%
5%
10%
15%
20%
25%
30%
35%
40%
45%
50%
3 3.5 4.25 4.5 6Dealsfrom$1Mto$2M 20% 20% 20% 20% 20%

64
MultipleType
Numberofclosedtransactions=19
0%
10%
20%
30%
40%
50%
60%
70%
80%
90%
100%
SDEincluding workingcapital
SDEnotincludingworkingcapital
EBITDAnotincludingworkingcapital
TTMEBITDAincludingworkingcapital
TTMEBITDAnotincluding working
capitalDealsfrom$1Mto$2M 26.3% 47.4% 5.3% 11% 10.5%

65
BuyerType:Deals$1Million- $1.99Million
Numberofclosedtransactions=19
31.6%
21.1%
42.1%
5.3%
1sttimeindividual
individualwhoowned abusiness
existingcompany/strategicbuyer
PEfirm- Platform

66
#1Reason forSeller to Go to Market
Numberofclosedtransactions=19
0%
5%
10%
15%
20%
25%
30%
35%
40%
45%
50%
Retirement New/betteropportunity
Burnt out Relocation/moving
Health Recapitalization Other
Dealsfrom$1Mto$2M 53% 16% 11% 5% 5% 5% 5%

67
BuyerLocation(Distance)
Numberofclosedtransactions=19
0%
5%
10%
15%
20%
25%
30%
35%
40%
45%
50%
within 20miles within 50miles within 100miles morethan100milesDealsfrom$1Mto$2M 63% 5% 5% 26%
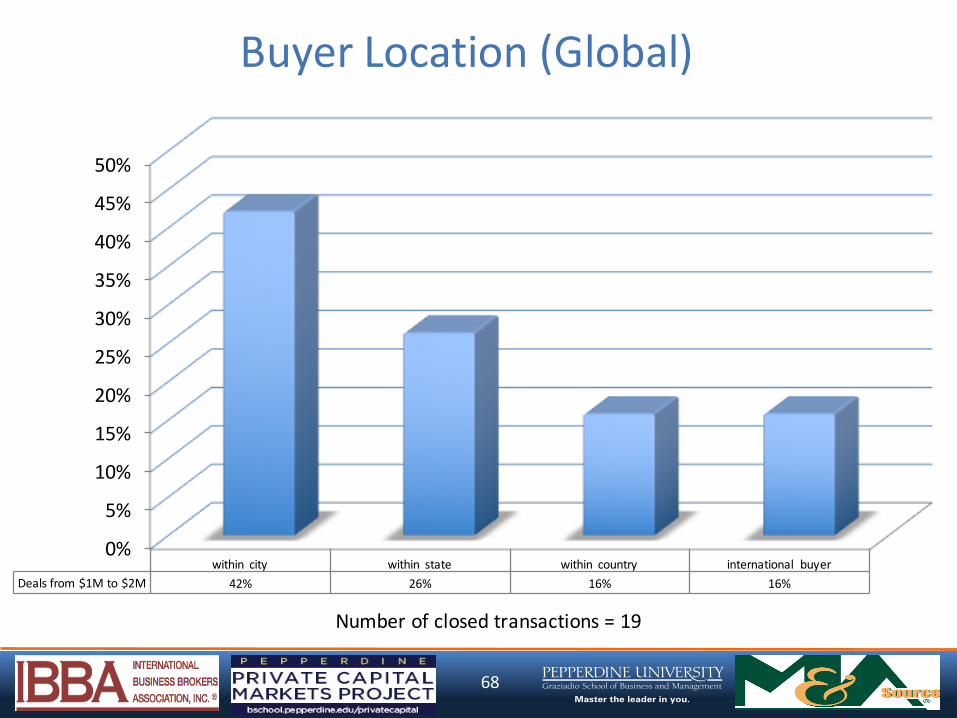
68
BuyerLocation(Global)
Numberofclosedtransactions=19
0%
5%
10%
15%
20%
25%
30%
35%
40%
45%
50%
within city within state within country international buyerDealsfrom$1Mto$2M 42% 26% 16% 16%

69
#1MotivationforBuyer
Numberofclosedtransactions=19
0%
5%
10%
15%
20%
25%
30%
35%
40%
45%
50%
Horizontal add-on Better ROIthanotherinvestment
Verticaladd-on Buyingajob Other
Dealsfrom$1Mto$2M 42% 11% 16% 5% 26%

70
FinancingStructure
Numberofclosedtransactions=19
0%
10%
20%
30%
40%
50%
60%
70%
80%
90%
100%
Buyersequity Seniordebt Sellerfinancing EarnoutDealsfrom$1Mto$2M 64% 27% 9% 1%

71
SourceofBuyersEquity
Numberofresponses=22
0.0%
10.0%
20.0%
30.0%
40.0%
50.0%
60.0%
70.0%
80.0%
90.0%
100.0%
Cash Investors- other 401K/IRARollover Investors- family/friendsDealsfrom$1Mto$2M 77.3% 13.6% 4.5% 4.5%

72
II-IV BusinessTransactionsValuedfrom$2Millionto$4.99Million
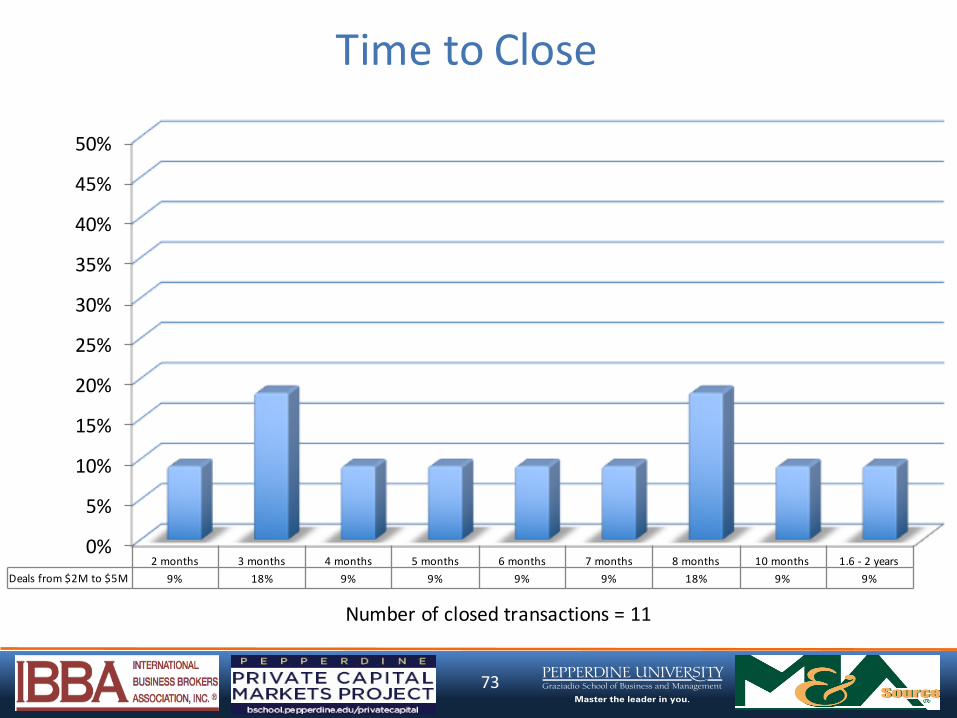
73
TimetoClose
Numberofclosedtransactions=11
0%
5%
10%
15%
20%
25%
30%
35%
40%
45%
50%
2months 3months 4months 5months 6months 7months 8months 10months 1.6- 2yearsDealsfrom$2Mto$5M 9% 18% 9% 9% 9% 9% 18% 9% 9%

74
Industry
Numberofclosedtransactions=11
0%
5%
10%
15%
20%
25%
30%
35%
40%
45%
50%
Wholesale&distribution
Manufact. Business services Healthcare&biotech
Consumer goods&Retail
Restaurants Informationtechnology
Dealsfrom$2Mto$5M 27% 27% 9% 9% 9% 9% 9%

75
EBITDAMultiplePaid
Numberofclosedtransactions=10
0%
5%
10%
15%
20%
25%
30%
35%
40%
45%
50%
3 3.25 3.5 4 5 5.5 8Dealsfrom$2Mto$5M 20% 10% 10% 10% 30% 10% 10%

76
MultipleType
Numberofclosedtransactions=11
0%
10%
20%
30%
40%
50%
60%
70%
80%
90%
100%
SDEnotincluding workingcapital
EBITDAincluding workingcapital
EBITDAnotincludingworkingcapital
TTMEBITDAincludingworkingcapital
Dealsfrom$2Mto$5M 9.1% 36.4% 36.4% 18%

77
BuyerType:Deals$2Million- $4.99Million
Numberofclosedtransactions=11
63.6%
27.3%
9.1%
individualwhoowned abusiness
existingcompany/strategicbuyer
PEfirm- Platform
78
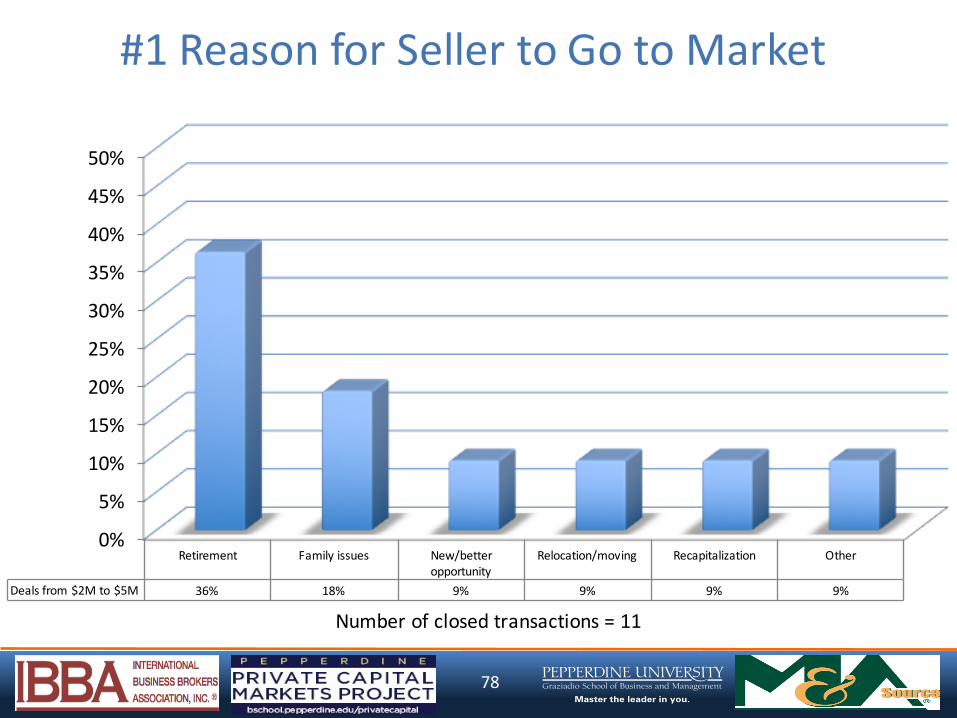
#1Reason forSeller to Go to Market
Numberofclosedtransactions=11
0%
5%
10%
15%
20%
25%
30%
35%
40%
45%
50%
Retirement Familyissues New/betteropportunity
Relocation/moving Recapitalization Other
Dealsfrom$2Mto$5M 36% 18% 9% 9% 9% 9%

79
BuyerLocation(Distance)
Numberofclosedtransactions=11
0%
5%
10%
15%
20%
25%
30%
35%
40%
45%
50%
within 50miles within 100miles morethan100milesDealsfrom$2Mto$5M 45% 18% 36%
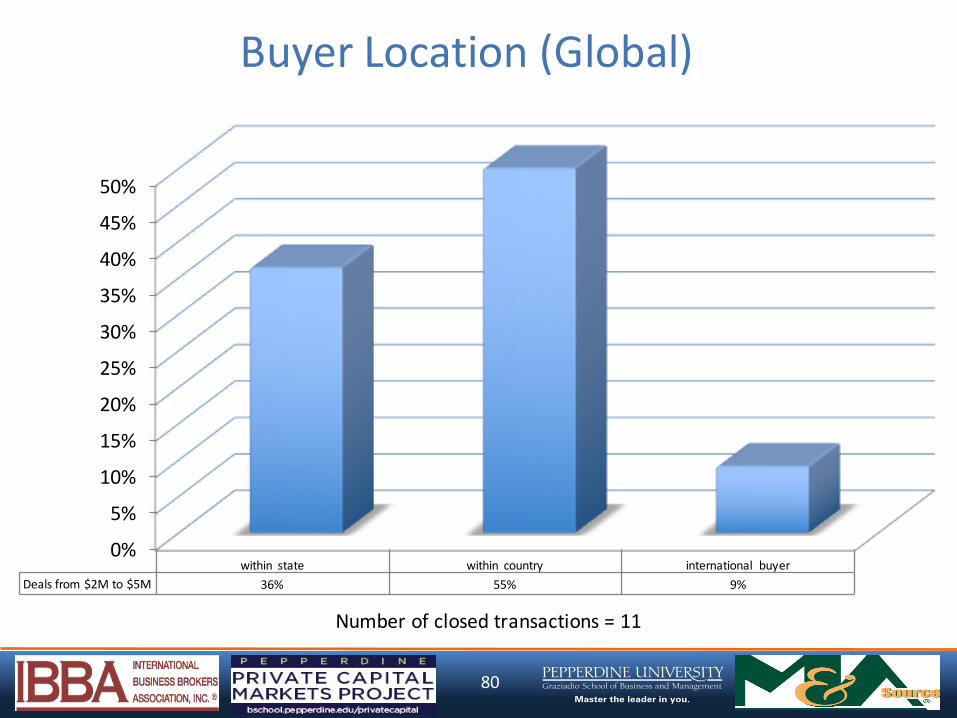
80
BuyerLocation(Global)
Numberofclosedtransactions=11
0%
5%
10%
15%
20%
25%
30%
35%
40%
45%
50%
within state within country international buyerDealsfrom$2Mto$5M 36% 55% 9%

81
#1MotivationforBuyer
Numberofclosedtransactions=11
0%
5%
10%
15%
20%
25%
30%
35%
40%
45%
50%
Better ROIthanotherinvestment
Horizontal add-on Verticaladd-on Buyingajob Other
Dealsfrom$2Mto$5M 36% 18% 18% 18% 9%

82
FinancingStructure
Numberofclosedtransactions=11
0%
10%
20%
30%
40%
50%
60%
70%
80%
90%
100%
Buyersequity Seniordebt Sellerfinancing Sellerretainedequity
Earnout Other
Dealsfrom$2Mto$5M 62% 23% 10% 3% 1% 1%
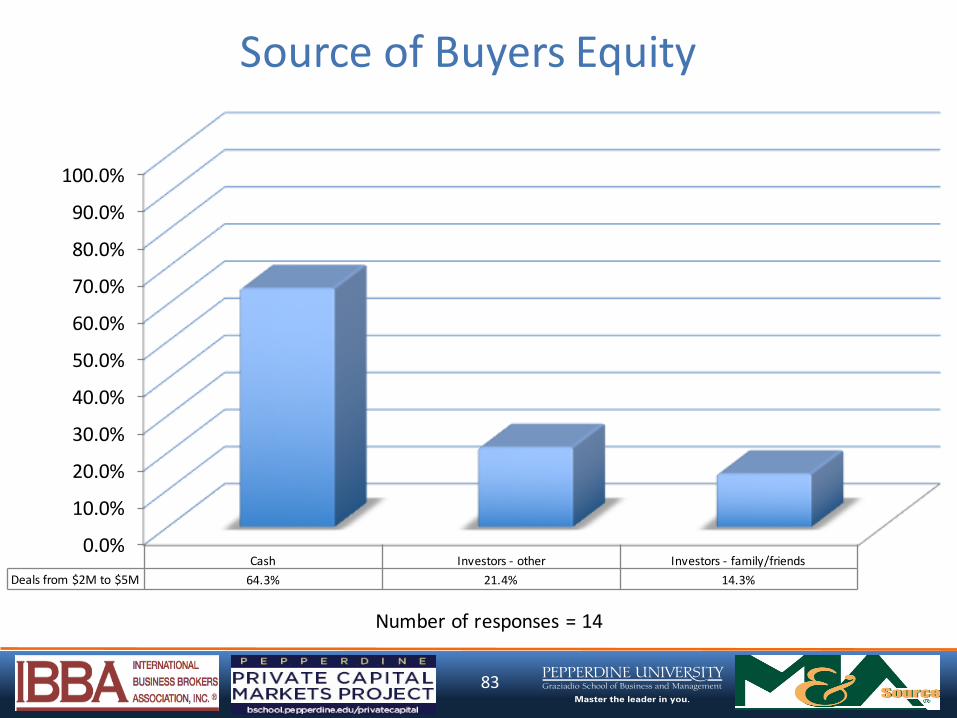
83
SourceofBuyersEquity
Numberofresponses=14
0.0%
10.0%
20.0%
30.0%
40.0%
50.0%
60.0%
70.0%
80.0%
90.0%
100.0%
Cash Investors- other Investors- family/friendsDealsfrom$2Mto$5M 64.3% 21.4% 14.3%

84
II-V BusinessTransactionsValuedOver$5 Million

85
TimetoClose
Numberofclosedtransactions=4
0%
5%
10%
15%
20%
25%
30%
35%
40%
45%
50%
2months 3months 9months 12monthsDealsfrom$5Mto$50M 25% 25% 25% 25%

86
Industry
Numberofclosedtransactions=4
0%
5%
10%
15%
20%
25%
30%
35%
40%
45%
50%
Business services Manufact. Consumer goods&Retail
Dealsfrom$5Mto$50M 50% 25% 25%

87
EBITDAMultiplePaid
Numberofclosedtransactions=4
0%
5%
10%
15%
20%
25%
30%
35%
40%
45%
50%
4.25 4.75 6Dealsfrom$5Mto$50M 25% 25% 50%
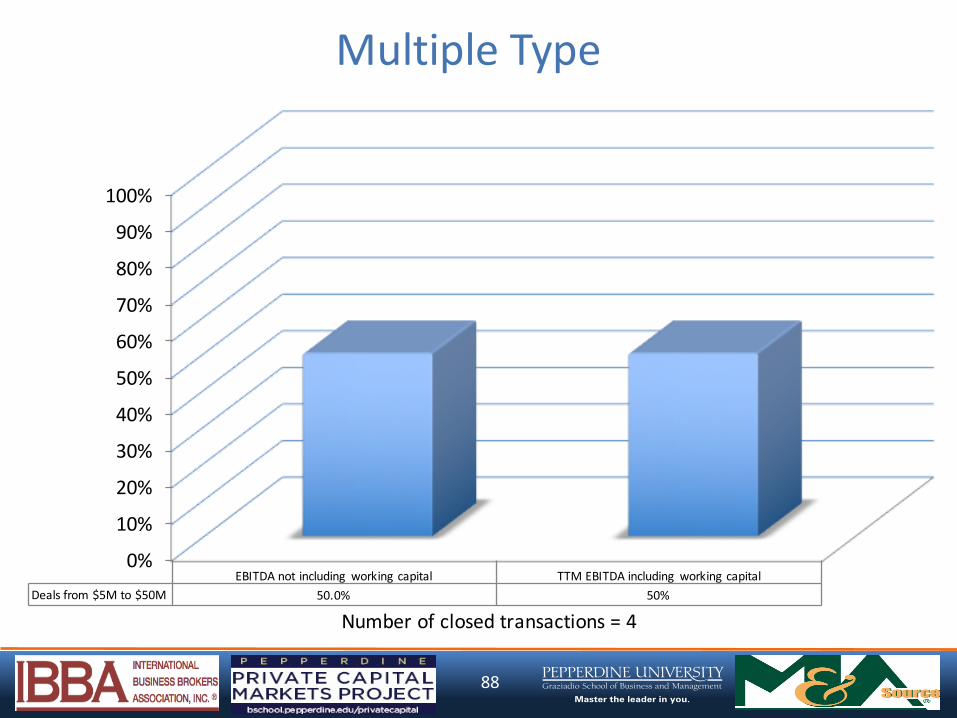
88
MultipleType
Numberofclosedtransactions=4
0%
10%
20%
30%
40%
50%
60%
70%
80%
90%
100%
EBITDAnotincluding workingcapital TTMEBITDAincluding workingcapitalDealsfrom$5Mto$50M 50.0% 50%

89
BuyerType:Deals>$5Million
Numberofclosedtransactions=4
25.0%
25.0%
50.0%
individualwhoowned abusiness
existingcompany/strategicbuyer
PEfirm- Platform

90
#1Reason forSeller to Go to Market
Numberofclosedtransactions=4
0%5%10%15%20%25%30%35%40%45%50%
Familyissues RetirementDealsfrom$5Mto$50M 50% 25%

91
BuyerLocation(Distance)
Numberofclosedtransactions=4
0%
5%
10%
15%
20%
25%
30%
35%
40%
45%
50%
within 20miles morethan100milesDealsfrom$5Mto$50M 50% 50%
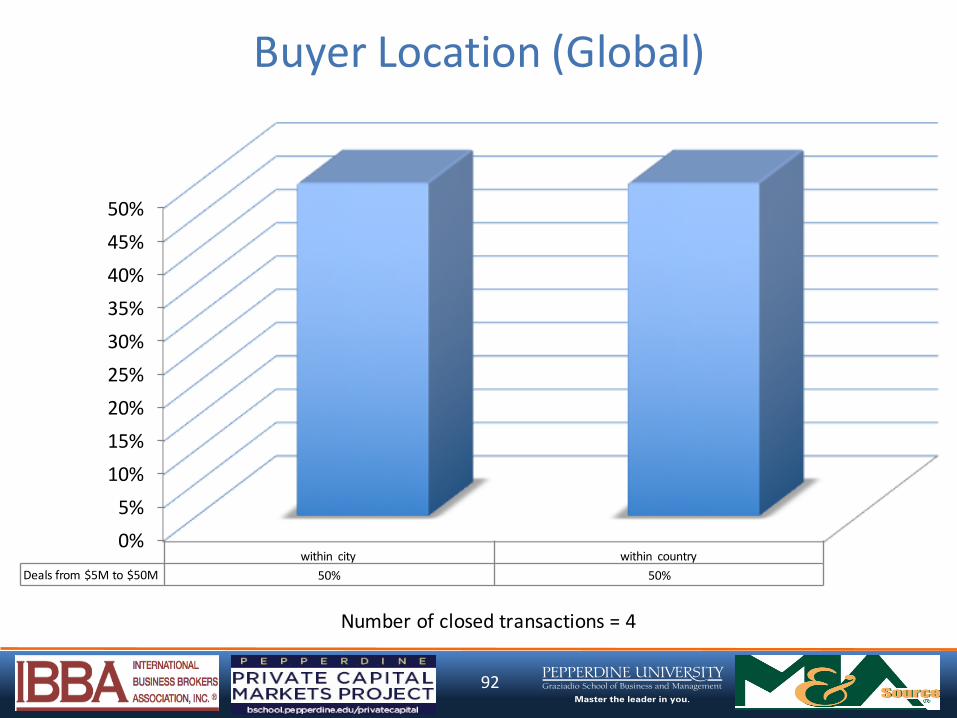
92
BuyerLocation (Global)
Numberofclosedtransactions=4
0%5%10%15%20%25%30%35%40%45%50%
within city within countryDealsfrom$5Mto$50M 50% 50%

93
#1MotivationforBuyer
Numberofclosedtransactions=4
0%5%10%15%20%25%30%35%40%45%50%
Horizontal add-on OtherDealsfrom$5Mto$50M 25% 75%
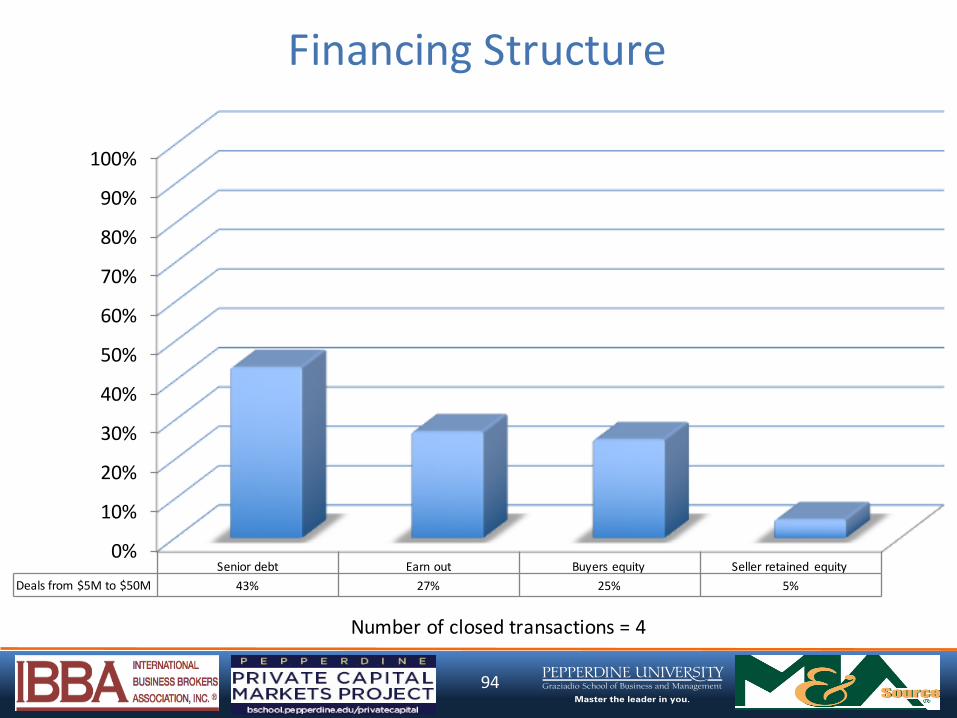
94
FinancingStructure
Numberofclosedtransactions=4
0%
10%
20%
30%
40%
50%
60%
70%
80%
90%
100%
Seniordebt Earnout Buyersequity Sellerretained equityDealsfrom$5Mto$50M 43% 27% 25% 5%

95
SourceofBuyersEquity
Numberofresponses=4
0.0%10.0%20.0%30.0%40.0%50.0%60.0%70.0%80.0%90.0%100.0%
Cash Investors- otherDealsfrom$5Mto$50M 50.0% 50.0%

96
III. BusinessTransactionsTerminatedintheLast3Months
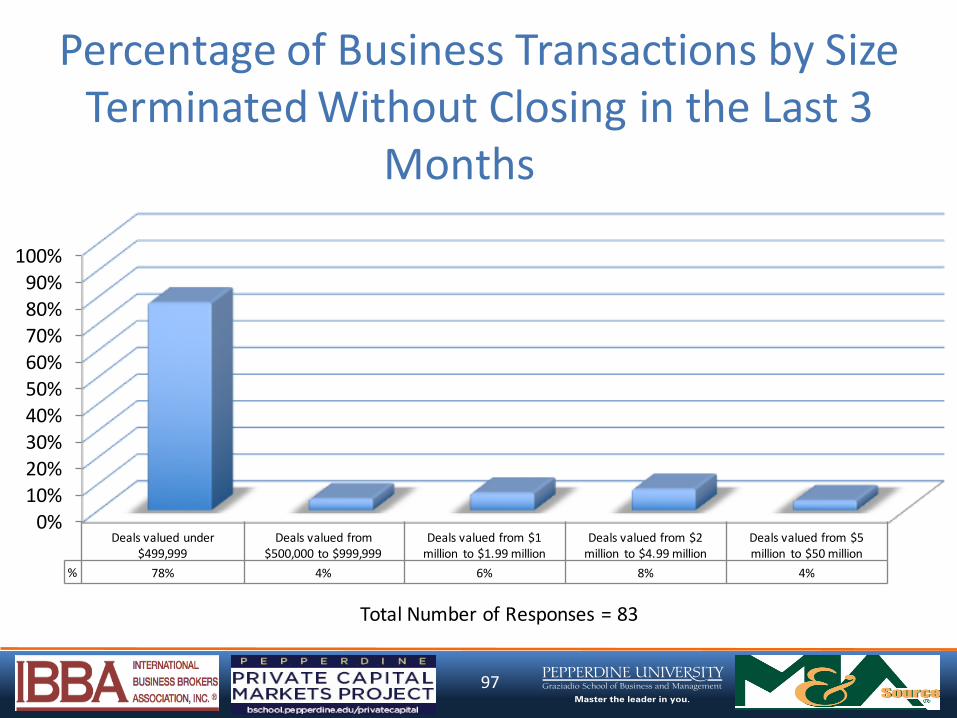
97
PercentageofBusinessTransactionsbySizeTerminatedWithoutClosingintheLast3
Months
TotalNumberofResponses=83
0%10%20%30%40%50%60%70%80%90%100%
Dealsvaluedunder$499,999
Dealsvaluedfrom$500,000to$999,999
Dealsvaluedfrom$1million to$1.99million
Dealsvaluedfrom$2million to$4.99million
Dealsvaluedfrom$5million to$50million
% 78% 4% 6% 8% 4%
98
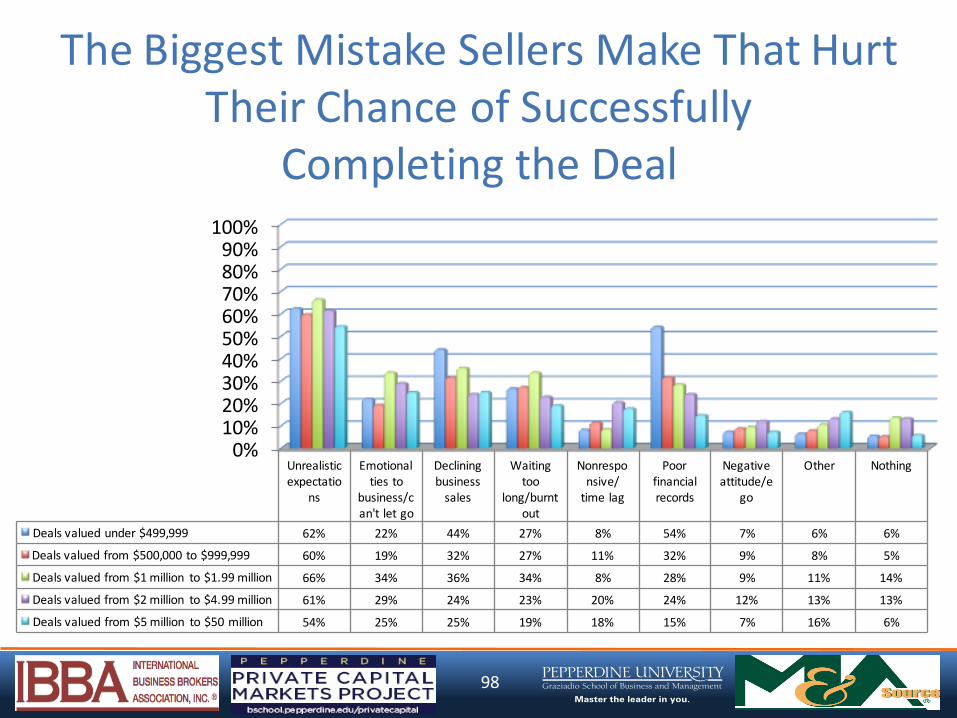
The Biggest Mistake Sellers Make That HurtTheir Chance of Successfully
Completing theDeal
0%10%20%30%40%50%60%70%80%90%100%
Unrealisticexpectatio
ns
Emotionaltiesto
business/can'tletgo
Decliningbusinesssales
Waitingtoo
long/burntout
Nonresponsive/ timelag
Poorfinancialrecords
Negativeattitude/e
go
Other Nothing
Dealsvaluedunder$499,999 62% 22% 44% 27% 8% 54% 7% 6% 6%
Dealsvaluedfrom$500,000to$999,999 60% 19% 32% 27% 11% 32% 9% 8% 5%
Dealsvaluedfrom$1million to$1.99million 66% 34% 36% 34% 8% 28% 9% 11% 14%
Dealsvaluedfrom$2million to$4.99million 61% 29% 24% 23% 20% 24% 12% 13% 13%
Dealsvaluedfrom$5million to$50million 54% 25% 25% 19% 18% 15% 7% 16% 6%

99
V. Expectations

100
Expectationsof Business Listings /Engagementsfrom New Clients intheNext3Months
Dealsize Greatlydecrease Decrease Staythe
same Increase Greatlyincrease
Score(1to5)
Dealsvaluedunder$499,999 0.0% 6.3% 32.3% 58.3% 3.1% 3.6
Dealsvaluedfrom$500,000to$999,999 0.0% 1.3% 22.5% 71.3% 5.0% 3.8
Dealsvaluedfrom$1million to$1.99million 1.3% 2.6% 26.9% 66.7% 2.6% 3.7
Dealsvaluedfrom$2million to$4.99million 0.0% 4.9% 41.0% 47.5% 6.6% 3.6
Dealsover$5million 0.0% 2.4% 31.7% 63.4% 2.4% 3.7

101
ExpectationsforBusinessValuationMultiples intheNext3Months
Dealsize Greatlydecrease Decrease Staythe
same Increase Greatlyincrease Score(1to5)
Dealsvaluedunder$499,999 0.0% 5.3% 75.8% 18.9% 0.0% 3.1
Dealsvaluedfrom$500,000to$999,999 0.0% 3.8% 74.7% 21.5% 0.0% 3.2
Dealsvaluedfrom$1million to$1.99million 1.3% 2.6% 69.2% 26.9% 0.0% 3.2
Dealsvaluedfrom$2million to$4.99million 0.0% 4.7% 73.4% 21.9% 0.0% 3.2
Dealsover$5million 0.0% 2.4% 61.0% 36.6% 0.0% 3.3
102
VI.AbouttheRespondents

103
DetailsAbouttheRespondentsGeographicLocation
01-23-56-78-1011-1516-20more than 20
CA#
OR#
WA#
MT# ND# MN#
ID#WY#
SD#
NV#UT#
AZ#
CO#
NM#
TX#
NE#
KS#
OK# AR#
LA#MS# AL#
FL#
GA#
TN#SC#
NC#
VA#WV#KY#MO#
IL#IA#
WI#MI#
IN#OH#
MD#
PA#NJ#
NY#
ME#
NH#VT#MA#RI#
CT#
HI#AK#
104
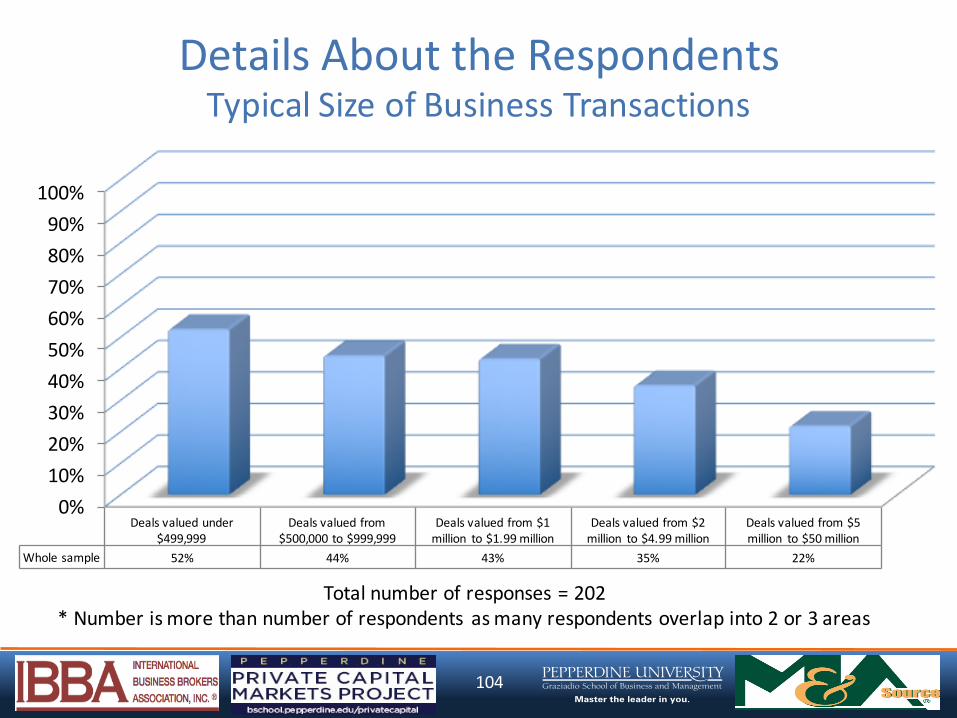
Totalnumberofresponses=202*Numberismorethannumberofrespondents asmanyrespondentsoverlapinto2or3areas
DetailsAbouttheRespondentsTypicalSizeofBusinessTransactions
0%10%20%30%40%50%60%70%80%90%100%
Dealsvaluedunder$499,999
Dealsvaluedfrom$500,000to$999,999
Dealsvaluedfrom$1million to$1.99million
Dealsvaluedfrom$2million to$4.99million
Dealsvaluedfrom$5million to$50million
Wholesample 52% 44% 43% 35% 22%

105
DetailsAbouttheRespondentsMemberships/MultipleMemberships
50%
29%
27%
7%
6%
4%
4%
3%
2%
2%
1%
1%
1%
1%
1%
1%
10%
5%
0% 10% 20% 30% 40% 50% 60%
IBBA
M&ASource
BusinessBrokers ofFlorida
California Association ofBusiness Brokers
FloridaBusinessBrokers Association
GeorgiaAssociation ofBusiness Brokers
NewEnglandBusinessBrokersAssociation
Colorado Association ofBusiness Intermediaries
Carolina - VirginiaBusinessBrokers Association
TexasAssociation ofBusiness Brokers
ArizonaBusinessBrokers Association
Mid-Atlantic BusinessIntermediaries Association, Inc.
MichiganBusinessBrokersAssociation
MidwestBusinessBrokersIntermediaries
OhioBusinessBrokersAssociation
PennsylvaniaBusinessBrokers Association
Other
None

106
DetailsAbouttheRespondentsWorkingExperience
7%5%
4%5%
3%
9%
6%1%5%3%7%
19%
7%
17%
Lessthan1year
1year
2years
3years
4years
5years
6years
7years
8years
9years
10years
11-15years
16-20years
>20years

107
DetailsAbouttheRespondentsProfessionalCredentials
0%
10%
20%
30%
40%
50%
60%
70%
80%
90%
100%
CBI MBA CBB M&AMI CMEA BCI CPA AM&AA CM&AA ABI CMSBB ASA Other None% 43% 25% 10% 9% 7% 5% 4% 3% 2% 1% 1% 1% 23% 23%

108
DetailsAbouttheRespondents

109
THANK YOU!
Scott Bushkie, CBI, M&AMI, IBBA Marketing [email protected]
Lisa Riley, Ph.D., IBBA Marketing [email protected]
Craig Everett, Ph.D., MBA Assistant Professor of Finance
Director, Pepperdine Private Capital Markets Projecthttp://bschool.pepperdine.edu/privatecapital