market reforms in greece 1990-2008 failures and opportunities nicos christodoulakis athens...
TRANSCRIPT

MARKET REFORMS IN GREECE 1990-2008Failures and Opportunities
Nicos ChristodoulakisAthens University of Economics and Business Hellenic Observatory, European Institute, LSE
June 2009

Phases of reforms in Greece
• The abandonment of the Stabilization Programand the years with serial elections: 1989-1990
• The phase of hostility: 1990-93
• The timid comeback: 1994-96
• Acceleration towards EMU
• The post-EMU reform-fatigue • After the Global crisis: Action or inertia?

Pre-crisis: The cost of changes falls unequally on the various groups of society. Reforms are delayed because some groups veto policies that are deemed to be disproportionately costly to their vested interests.
Post-crisis: The occurrence of a crisis reveals which group suffers a higher cost from postponing the reforms and this eventually weakens the resistance of the status quo.
cf. How the 1994 forex crisis changed the attitudes of Trade-Unions vis-à-vis the EMU
The “crisis hypothesis” :
Fernandez and Rodrik (1991); Drazen (2000)

Previous practices are overturned and new socio-economic paradigms are established.
e.g. Eastern Europe after the collapse of communism in 1989-90. Latin America after the fall of military dictatorships in the 1980s.
Reforms gain socio-political support if voters are convinced that the benefits will be widely shared and not expropriated by new powerful nomenclatures.
cf. The new policy agenda prevailing in Greece after 1990.Greece was even termed as the “last Eastern-European state”
A “regime change”
Desai and Olofsgard (2006).

Market-reform requirements emerge when a country seeks to become a member of a supranational institution where some kind of eligibility criteria applies.
e.g. - IMF Structural Programs - Terms of reference in international aid. - Participation in the World Trade Organisation - Membership in the European Union.
The country has the obligation (or the opportunity) to adopt and implement a reform-agenda
Imposing “external conditionality”
Giavazzi and Pagano (1988); Alesina and Drazen (1991)
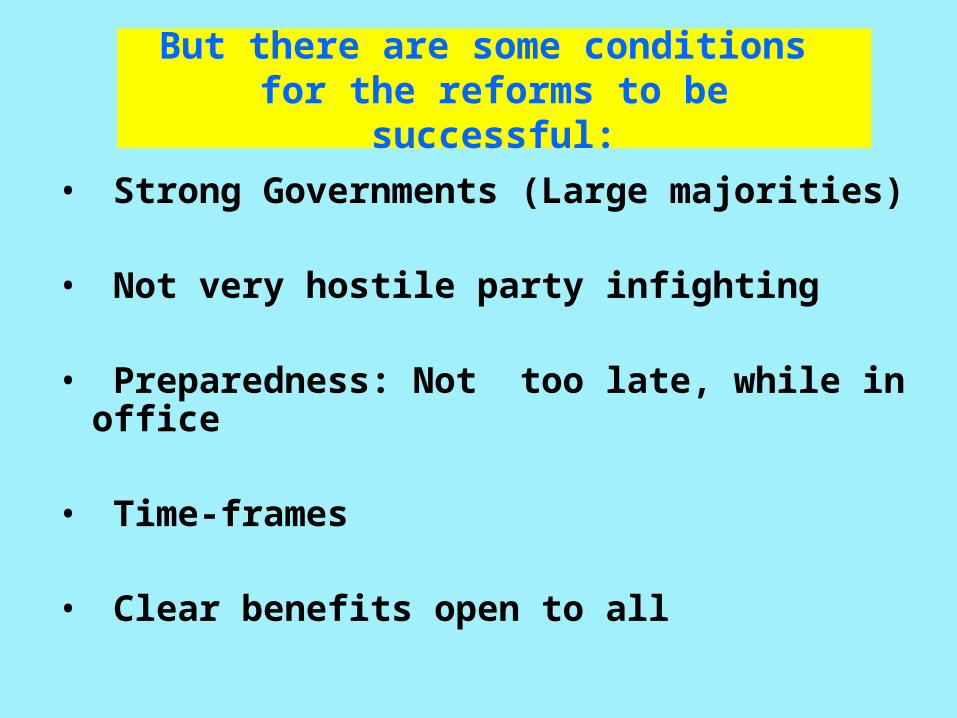
But there are some conditions for the reforms to be successful:
• Strong Governments (Large majorities)
• Not very hostile party infighting
• Preparedness: Not too late, while in office • Time-frames
• Clear benefits open to all
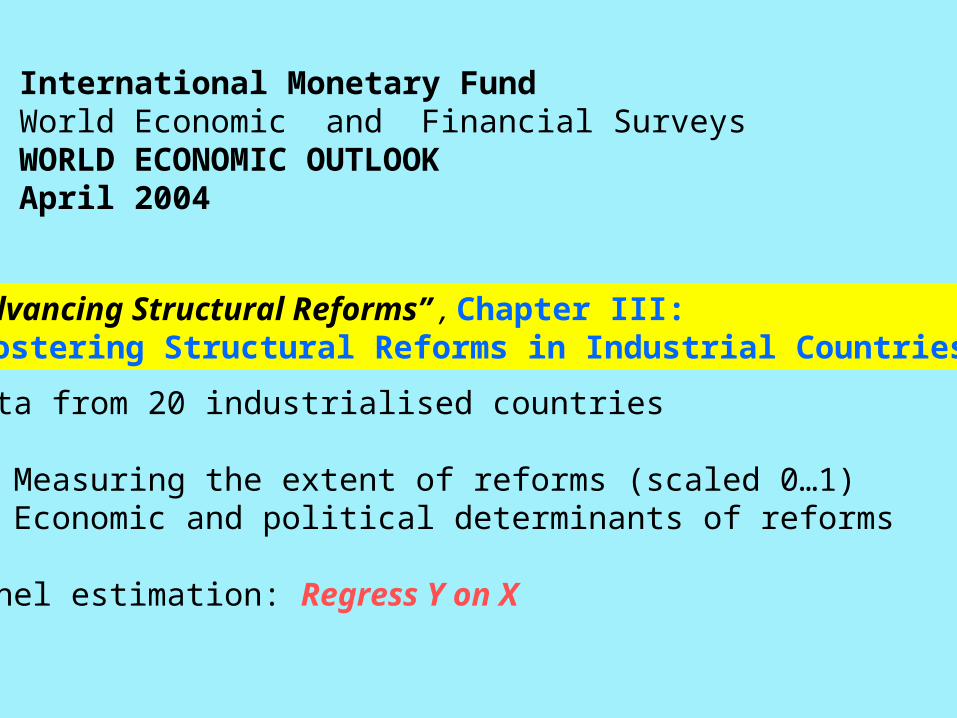
International Monetary FundWorld Economic and Financial SurveysWORLD ECONOMIC OUTLOOKApril 2004
“Advancing Structural Reforms” , Chapter III: “Fostering Structural Reforms in Industrial Countries”
Data from 20 industrialised countries
Y: Measuring the extent of reforms (scaled 0…1)X: Economic and political determinants of reforms
Panel estimation: Regress Y on X
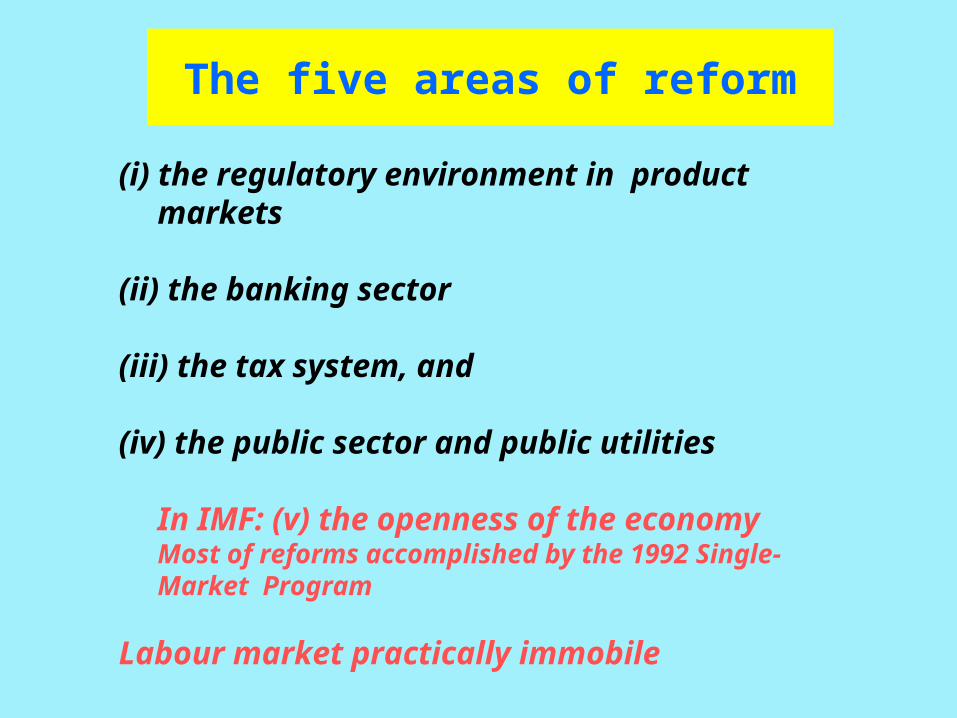
(i) the regulatory environment in product markets
(ii) the banking sector
(iii) the tax system, and
(iv) the public sector and public utilities
In IMF: (v) the openness of the economyMost of reforms accomplished by the 1992 Single-Market Program
Labour market practically immobile
The five areas of reform
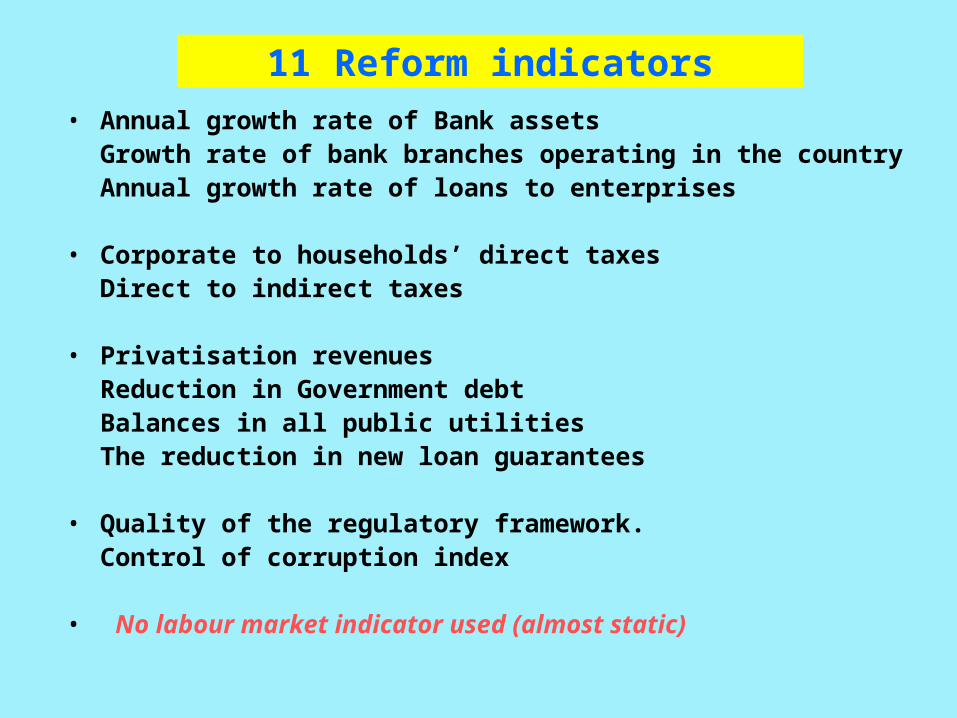
11 Reform indicators
• Annual growth rate of Bank assets Growth rate of bank branches operating in the countryAnnual growth rate of loans to enterprises
• Corporate to households’ direct taxesDirect to indirect taxes
• Privatisation revenues Reduction in Government debtBalances in all public utilities The reduction in new loan guarantees
• Quality of the regulatory framework. Control of corruption index • No labour market indicator used (almost static)

0
100
200
300
400
500
1500
2000
2500
3000
3500
4000
90 92 94 96 98 00 02 04 06 08
Assets(lhs)
Branches(rhs)
Loans toenterprises(lhs)
Bill
ion
Eu
ros
The banking sector increased enormously …
0
4
8
12
16
20
24
90 92 94 96 98 00 02 04 06 08
EMU
Spread in corporateLending rates btwGreece and Germany
… and Lending Rates to Enterprises dived
0
20
40
60
80
100
120
90 92 94 96 98 00 02 04 06 08
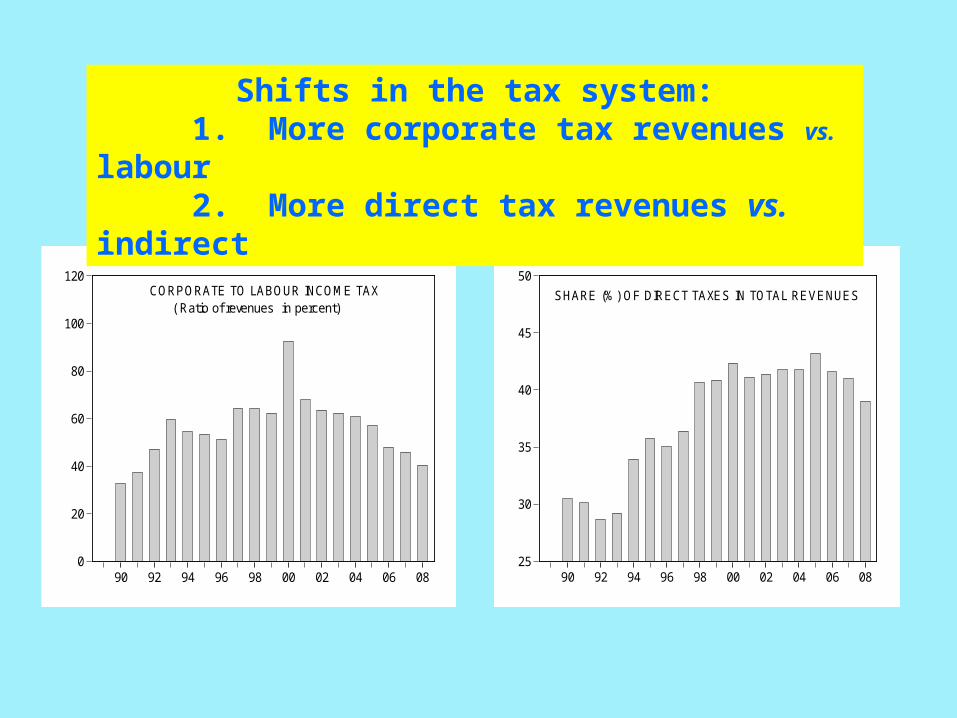
CORPORATE TO LABOUR INCOME TAX ( Ratio of revenues in percent)
25
30
35
40
45
50
90 92 94 96 98 00 02 04 06 08
SHARE (%) OF DIRECT TAXES IN TOTAL REVENUES
Shifts in the tax system:1. More corporate tax revenues vs. labour2. More direct tax revenues vs. indirect

0.4
0.8
1.2
1.6
2.0
2.4
2.8
3.2
3.6
90 92 94 96 98 00 02 04 06 08
NEW STATE GUARANTEESFOR LOANS BY PUBLIC UTILITIES AS % OF GDP
0.0
0.5
1.0
1.5
2.0
2.5
3.0
3.5
90 92 94 96 98 00 02 04 06 08
PRIVATISATION PROCEEDSAS % OF GDP
Exposing Public Utilities to market pressures(… of sorts)Flotation, Privatisations and Business Plans

64
66
68
70
72
74
76
88 90 92 94 96 98 00 02 04 06 08
CONTROL OF CORRUPTIONNo corruption=100, Source: World Bank
0.70
0.75
0.80
0.85
0.90
0.95
1.00
1.05
90 92 94 96 98 00 02 04 06
QUALITY OF REGULATORY ENVIRONMENT(Score index, World Band Indicators, 2008)
Market-environment improved in the way to EMU … and faded a few years later
-10
0
10
20
30
40
EMU12 GRE OECD
ALP EPLTSS UBS WFIR FLXERIP
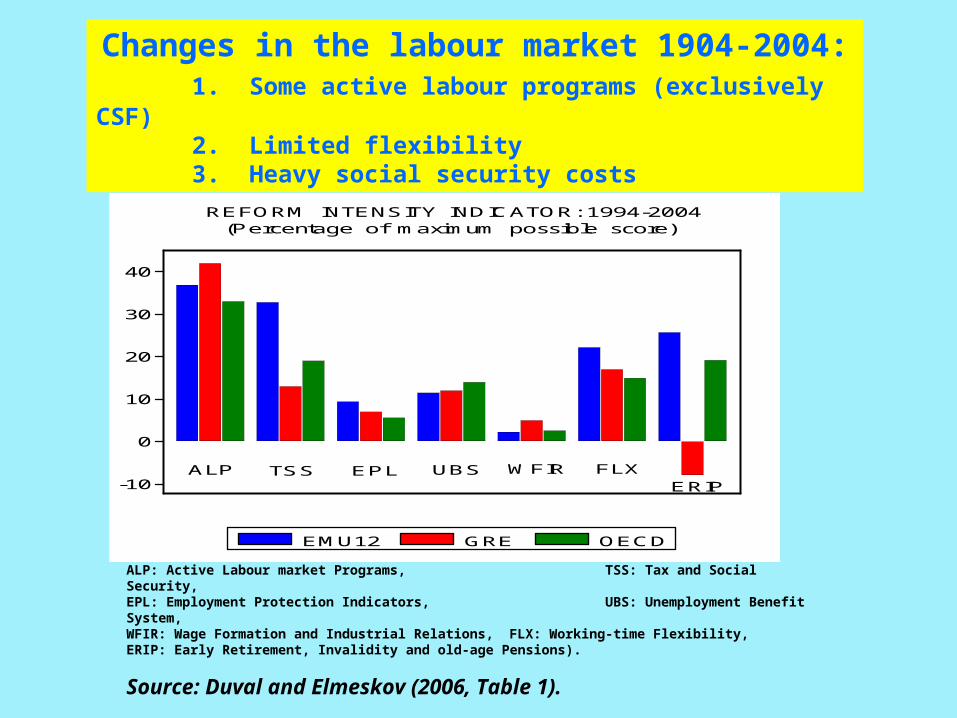
REFORM INTENSITY INDICATOR: 1994-2004 (Percentage of maximum possible score)
Changes in the labour market 1904-2004:1. Some active labour programs (exclusively CSF)2. Limited flexibility3. Heavy social security costs
ALP: Active Labour market Programs, TSS: Tax and Social Security, EPL: Employment Protection Indicators, UBS: Unemployment Benefit System, WFIR: Wage Formation and Industrial Relations, FLX: Working-time Flexibility, ERIP: Early Retirement, Invalidity and old-age Pensions).
Source: Duval and Elmeskov (2006, Table 1).

Determinants of reforms
• Government’s inclination to reforms
• How strong is the government
• How well prepared to undertake reforms
• Political uncertainty (elections, protests)
• Economic environment: Prospects
• External factors: Shocks, conditionality

6 Determinants of reforms
• Ideology of Government : C=2, L=0, Centre-left=1
• Majority in Parliament: Seats over 150• Election years : 1 if elections, 0 otherwise• First year in office:1 the year after elections
• Growth rate (current or moving-average)• EMU process: At 2000=10, else: 10-t

PARLIAMENTARY MAJORITY
0
5
10
15
20
25 Conservative
Socialist
The political landscape:1. Six alterations in Government2. Two Governments with slim majorities

-2
-1
0
1
2
3
4
5
6
90 92 94 96 98 00 02 04 06 08
GROWTH RATE
The economic perspective:1. Volatile growth in 1990-932. Growth accelerates in the run-up to EMU2. The post-Olympics fatigue

(0.046, t=12.75)
(0.124,t=3.36) (0
(0.236,t=3.42) (0.02,t=3.01)
0.598Reforms( 1)
-0.808(first year)+0.065(majority)
0.377(Growth)+0.187(EMU)
Reforms( ) tt
2
.064,t=2.89)
:1990 2008, R =0.96, DW=2.41
SURE
Path-dependentprocess
Governmentsstrong, butunprepared
Growth and EMU critical
What determines reforms in Greece ?

Some conclusions:
• Reform process is path-dependent• New governments unprepared for reforms• Weak governments difficult to accomplish
reforms• Strong growth enables the reform process
(compensation payments, new opportunities)
• EMU the main catalyst for reforms
What lessons for the future?
• Governments beware:- have a clear mandate for reforms- avoid coalitions- avoid frequent elections- act quickly (learn from Obama’s 100days)
• Fight the recession:
Reforms as a promise, not a punishment
• Conform with EMU requirements

LISBON Strategy for Growth no more suitable as a reform framework
1. Came late (cf The Maastricht Criteria)Launched in 2000, after EMU began!
2. Unfocused (cf Stability & Growth Pact)2000: EU the “knowledge society” by 20102005: Re-launched: Growth and Employment2006: Four priorities (Barroso, Jan. 2006) - Education – Research – Innovation
- Unleashing the SMEs - Employment / Participation / Security
- Energy / Supply
3. Implementation: Loose and same across EU27

Especially for Greece:
1. Focus on the New Asymmetries
Current Account Deficits
GNI / GDP asymmetries
2. Openness/Competitiveness, attracting FDI
3. Indebtedness: Huge cost of borrowing
A major reform drive is needed
Some suggestions:
• Public awareness: Measure (and publish) the cost of avoiding the reform
• Benchmark information from other EU countries
• Set major priorities to achieve critical mass(avoid the endless reform menus)
• Identify gainers and opposers
• Single and identifiable decision-making: - Eliminate co-authority on reforms
- Reduce veto-points
• Make reform-opposing practices to bear (or at least share) the cost of foregone opportunities

Thank you for your attention!
Ευχαριστώ πολύ!