market report 2015-industrial q4
TRANSCRIPT
Industrial Market ReportWest Michigan Q4 - Year End 2015
100 Grandville Ave SW Suite 100Grand Rapids, MI 49503616. 776. 0100 www.naiwwm.com
*Also serving the Kalamazoo & Southwest Michiganareas from our new Kalamazoo office*
Wisinski ofWest Michigan
Office • Industrial • Retail • Multi-Family

Looking Ahead at the Industrial Market in Sixteen. The West Michigan Industrial Market during 2015 continued to show significant activity and vibrancy with the vacancy rate falling from 4.8% at the end of 2014 to 4.1% at the end of 2015. Demand for space, both industrial and warehous-ing, continued at a very active pace. In certain size sectors of the market there were notable inventory shortages which required some creative thinking in terms of building reuse and creative adaptive approaches. A number of warehousing facilities were converted for manufacturing use, which in most cases required additional infrastructure installation such as power, compressed air and additional office space.
This activity was reflected across all sectors within each Kent County submarket. This growth also continued westward to the Lake Michigan shoreline with active markets being evi-denced in Ottawa, Allegan and Muskegon Counties.Given the continued strength in both the automotive and furniture mar-kets it is anticipated that 2016 will be a carbon copy of 2015 in terms of industrial demand. It is anticipated, however, that in 2016 we will begin to see additional new construction to satisfy space needs tht are unable to be met by current avail-able inventory.
Both sale prices on a per square foot basis, and lease prices, on a per square foot basis, showed continued strengthening and it is anticipated that trend will continue forward. New construction costs remain higher relative to the reuse and re-adaptation of existing buildings, however, that gap will con-tinue to narrow as inventory remains tight.
* The information contained herein has been given to us by sources we deem reliable. We have no reason to doubt its accuracy, however, we do not make any guarantees. All information should be verified before relying thereon.
* Source: NAIWisinskiofWestMI, CoStar Property®, & U.S. Bureau of Labor Statistics
Land sales started to
increase in numbers
during 2015 and
that is expected to
continue into 2016.
This is a direct
result of users not
being able to locate
suitable building
solutions for their
industrial real
estate requirements
within the existing
available inventory.
GRAND RAPIDS, MI
The Market
- Stuart Kingma, SIOR Principal | NAI Member

Construction Trends Across the US
0
10
20
30
40
50
60
70
1993 1996 1999 2002 2005 2008 2011 2014
$ Bi
llion
s
10
20
30
40
50
60
70
80
90
1993 1996 1999 2002 2005 2008 2011 2014
$ Bi
llion
s
Well Below Average
0
10
20
30
40
50
60
70
80
90
1993 1996 1999 2002 2005 2008 2011 2014
$ Bi
llion
s
0
20
40
60
80
100
120
1993 1996 1999 2002 2005 2008 2011 2014
$ Bi
llion
s
A New High and Soaring
0500
1,0001,5002,0002,5003,0003,5004,0004,5005,000
2004 2005 2006 2007 2008 2009 2010 2011 2012 2013
Total, All Structure Types Single Family Houses
Source: Census Housing Starts. -to-date, Oct 2015
2014 2015*

West MichiganIndustrial Submarket Statistics
Industrial Statistical Changes
CONSTRUCTION
CONSTRUCTION
ASKING RATES
ASKING RATES
VACANCY RATE
VACANCY RATE
NET ABSORPTION
NET ABSORPTION
3Q15 vs. 4Q15
4Q14 vs. 4Q15
2015 Q4 Snapshot Submarket Total RBA Vacant
Available SFVacancy
RateTotal Average
NNN Rate ($/SF/Yr)Total Net
Absorption (SF)Total Under
Construction SF
LakeshoreWarehouse 9,823,628 345,174 3.5% $3.02 -81,097 -Manufacturing 23,789,091 989,895 4.2% $2.43 16,747 -Hightech Flex 989,227 13,987 1.4% $5.47 2,500 -Total 34,601,946 1,349,056 3.9% $3.64 -61,850 -NortheastWarehouse 4,836,315 184,810 3.8% $10.75 279,870 -
Manufacturing 7,096,095 841,591 11.8% $2.73 300,661 -Hightech Flex 669,606 40,620 6.0% $5.31 - -Total 12,602,016 1,067,021 8.5% $6.26 580,531 -NorthwestWarehouse 4,253,441 254,041 6.0% $3.25 600 -Manufacturing 12,828,618 547,288 4.3% $3.13 8,300 -Hightech Flex 1,228,188 500 - $7.25 - -Total 18,310,247 801,829 4.4% $4.54 8,900 -SoutheastWarehouse 21,916,436 822,007 3.8% $6.97 27,920 91,433Manufacturing 25,394,583 1,134,598 4.5% $3.98 -3,031 -Hightech Flex 2,960,161 122,691 4.1% $5.60 11,059 -Total 50,271,180 2,079,296 4.1% $5.51 35,948 91,433SouthwestWarehouse 8,057,755 181,846 2.2% $3.03 43,263 -Manufacturing 21,832,884 463,246 2.1% $3.35 57,632 -Hightech Flex 759,689 28,643 3.7% $5.04 -16,200 -Total 30,650,328 673,735 2.2% $3.80 84,695 -
Total Overall 146,435,717 5,970,937 4.1% $4.75 648,224 91,433
Last Quarter vs. This Quarter
Last Year vs. This Year

Industrial Total Market Report
-500,000
0
500,000
1,000,000
1,500,000
2011 2012 2013 2014 2015
RBA Delivered Warehouse RBA Delivered Manufacturing RBA Delivered Hightech Flex
0.00%
2.00%
4.00%
6.00%
8.00%
10.00%
2011 2012 2013 2014 2015
Vacancy Rate
Vacancy Rates- Warehouse Vacancy Rates- Manufacturing Vacancy Rates- Hightech Flex
$0.00
$2.00
$4.00
$6.00
$8.00
2011 2012 2013 2014 2015
Triple Net Rental Rate
Triple Net Rental Rates- Warehouse Triple Net Rental Rates- Manufacturing
Triple Net Rental Rates- Hightech Flex
0
50,000
100,000
150,000
200,000
2011 2012 2013 2014 2015
New Construction by SF
New Construction Warehouse New Construction Manufacturing New Construction Hightech Flex
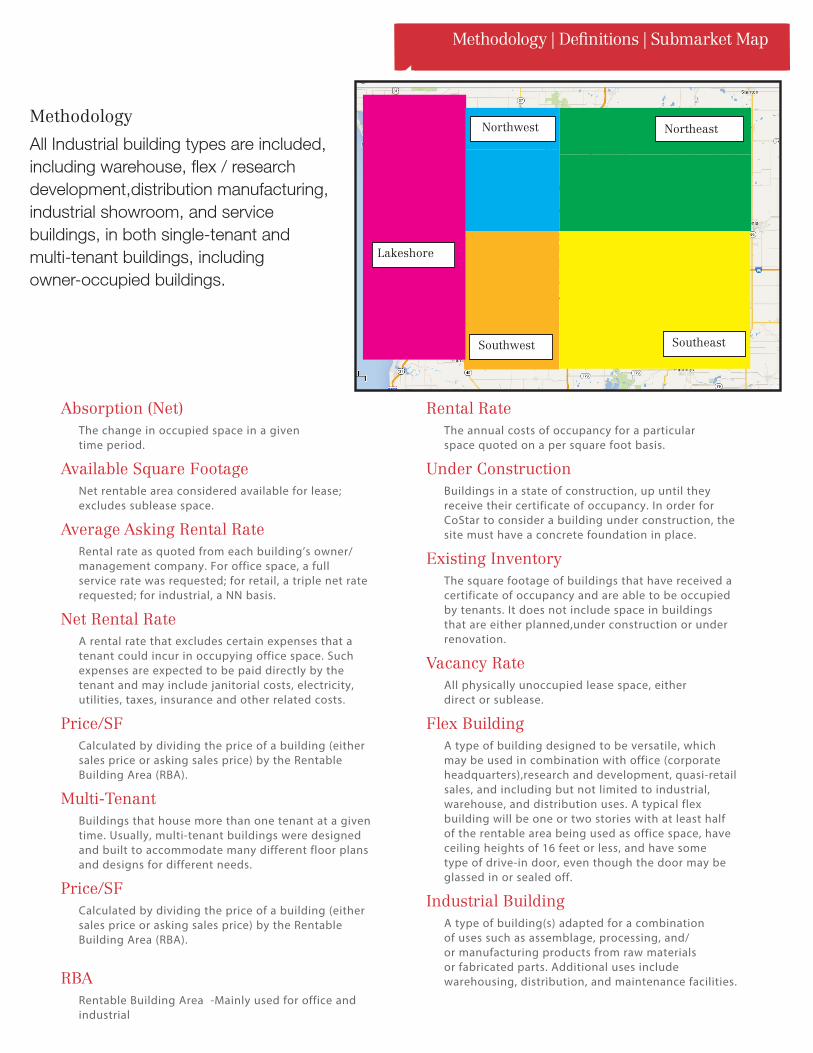
Methodology | Definitions | Submarket Map
Rental RateThe annual costs of occupancy for a particularspace quoted on a per square foot basis.
Under ConstructionBuildings in a state of construction, up until they receive their certificate of occupancy. In order for CoStar to consider a building under construction, the site must have a concrete foundation in place.
Existing InventoryThe square footage of buildings that have received a certificate of occupancy and are able to be occupied by tenants. It does not include space in buildings that are either planned,under construction or under renovation.
Vacancy RateAll physically unoccupied lease space, either direct or sublease.
Flex Building A type of building designed to be versatile, which may be used in combination with office (corporate headquarters),research and development, quasi-retail sales, and including but not limited to industrial, warehouse, and distribution uses. A typical flex building will be one or two stories with at least half of the rentable area being used as office space, have ceiling heights of 16 feet or less, and have some type of drive-in door, even though the door may be glassed in or sealed off.
Industrial Building A type of building(s) adapted for a combination of uses such as assemblage, processing, and/ or manufacturing products from raw materials or fabricated parts. Additional uses include warehousing, distribution, and maintenance facilities.
Absorption (Net)The change in occupied space in a given time period.
Available Square FootageNet rentable area considered available for lease; excludes sublease space.
Average Asking Rental RateRental rate as quoted from each building’s owner/management company. For office space, a full service rate was requested; for retail, a triple net rate requested; for industrial, a NN basis.
Net Rental RateA rental rate that excludes certain expenses that a tenant could incur in occupying office space. Such expenses are expected to be paid directly by the tenant and may include janitorial costs, electricity, utilities, taxes, insurance and other related costs.
Price/SFCalculated by dividing the price of a building (either sales price or asking sales price) by the Rentable Building Area (RBA).
Multi-TenantBuildings that house more than one tenant at a given time. Usually, multi-tenant buildings were designed and built to accommodate many different floor plans and designs for different needs.
Price/SFCalculated by dividing the price of a building (either sales price or asking sales price) by the Rentable Building Area (RBA).
RBARentable Building Area -Mainly used for office and industrial
Southwest
Northeast
Southeast
Northwest
Lakeshore
All Industrial building types are included, including warehouse, flex / research development,distribution manufacturing, industrial showroom, and service buildings, in both single-tenant and multi-tenant buildings, including owner-occupied buildings.
Methodology

Doug Taatjes, CCIM, SIOR616 292 [email protected]
Chris Prins616 242 [email protected]
Kara Schroer 269 459 [email protected]
David Smies, CCIM, SIOR616 242 [email protected]
Jeremy Veenstra616 242 [email protected]
Chadwick Versluis, SIOR616 242 [email protected]
Stanley Wisinski III, SIOR, CCIM616 575 [email protected]
Marc Tourangeau269 207 [email protected]
Meet Our Team
Industrial SpecialistsJim Badaluco, SIOR616 450 [email protected]
Dane Davis269 459 [email protected]
Stuart Kingma, SIOR616 575 [email protected]
Kurt Kunst, SIOR, CCIM 616 242 [email protected]
In the spring of 2011, two successful and reputable companies, The Wisinski Group and NAI West Michigan merged. The merger represents collaboration, rich traditions, innovative technologies, unique cultures and diversity of skills and specialties which ultimately benefit our clients. We’re going back to our fundamentals, strengthening our core and becoming stronger in the services we provide our clients. Our focus is simple, building client relationships for life by offering market appropriate advice and then executing. Our success is a direct result of its unwavering commitment to providing the best possible service to each and every client. Our Brokers, with their 562 plus years of combined experience (20.1 years average), possess the knowledge and expertise to manage the most complex transactions in industrial, office, retail, and multifamily specialities throughout West Michigan.
Through our affiliation with NAI Global, we can also assist you with your commercial real estate needs throughout the US & globally right here from West Michigan.
NAI Wisinski of West MichiganAt a Glance
Achieve More.Local Knowledge. Global Reach.
100 Grandville Ave SW Suite 100Grand Rapids, MI 49503616. 776. 0100 www.naiwwm.com
facebook.com/naiwwm
@naiwwm
nai-wisinski-of-west-michigan
Wisinski ofWest Michigan
Office • Industrial • Retail • Multi-Family