market report 2018 - fearnley securities
TRANSCRIPT
MARKET REPORT 2018

This Report has been produced by FearnleyProject Finance AS (FPF) on a best effort basisand is based upon information accessible to FPFfrom sources FPF deems reliable. The Report ismade solely for the use as information toinvestors in connection with the projects, andmay not be reproduced or redistributed, inwhole or in part, to any other person.
FPF makes no representation or warranty(expressed or implied) as to, and no relianceshould be placed on, any information, includingprojections, estimates, targets and opinions,contained herein, and no liability whatsoever isaccepted as to any errors, omissions ormisstatements contained herein, and,accordingly, FPF or any of its group companies orany such person’s officers or employees doesnot accept any liability whatsoever arising
directly or indirectly from the use of this Report.
Should one or more of the risks or uncertaintiesmaterialize, or should underlying assumptionsprove to be incorrect, actual results may varymaterially from those described in this Report.FPF does not assume any obligations for suchloss and FPF does not assume any obligation toupdate or correct the information included inthis Report.
By receiving this report you acknowledge thatyou will be solely responsible for your ownassessment of the project and the shippingmarket and that you will conduct your ownanalysis and are solely responsible for formingyour own view of the project.
An investment in the real estate market and/or
shipping market involves risk and several factorscould cause the actual result of the investment.General economic and business conditions,changes in the domestic and foreign marketsand laws and regulation and other factors mayhave an impact on the project and eachinvestors’ investment. If information containedin this report is used as basis for investments,the investor is obliged to check and compare theinformation herein with the official accounts andinformation published by the company at alltimes.
Purchase agreement, charter parties andcorporate documentation such as partnershipagreement and other relevant documentation,can be obtained from FPF.
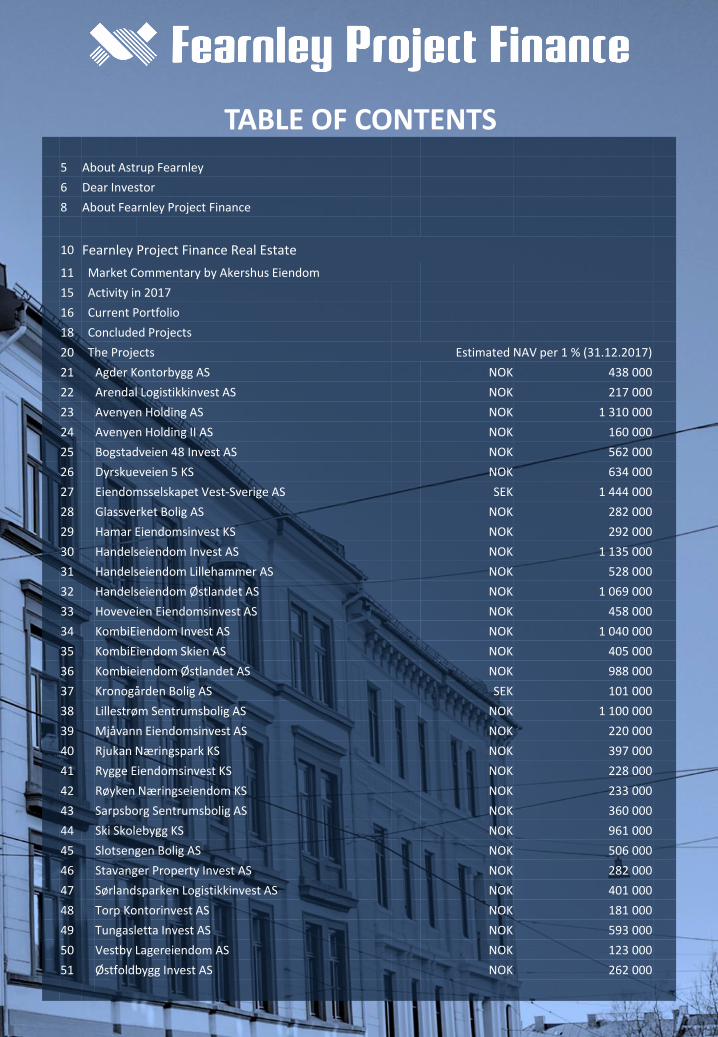
TABLE OF CONTENTS
5 About Astrup Fearnley
6 Dear Investor
8 About Fearnley Project Finance
10 Fearnley Project Finance Real Estate
11 Market Commentary by Akershus Eiendom
15 Activity in 2017
16 Current Portfolio
18 Concluded Projects
20 The Projects Estimated NAV per 1 % (31.12.2017)
21 Agder Kontorbygg AS NOK 438 000
22 Arendal Logistikkinvest AS NOK 217 000
23 Avenyen Holding AS NOK 1 310 000
24 Avenyen Holding II AS NOK 160 000
25 Bogstadveien 48 Invest AS NOK 562 000
26 Dyrskueveien 5 KS NOK 634 000
27 Eiendomsselskapet Vest-Sverige AS SEK 1 444 000
28 Glassverket Bolig AS NOK 282 000
29 Hamar Eiendomsinvest KS NOK 292 000
30 Handelseiendom Invest AS NOK 1 135 000
31 Handelseiendom Lillehammer AS NOK 528 000
32 Handelseiendom Østlandet AS NOK 1 069 000
33 Hoveveien Eiendomsinvest AS NOK 458 000
34 KombiEiendom Invest AS NOK 1 040 000
35 KombiEiendom Skien AS NOK 405 000
36 Kombieiendom Østlandet AS NOK 988 000
37 Kronogården Bolig AS SEK 101 000
38 Lillestrøm Sentrumsbolig AS NOK 1 100 000
39 Mjåvann Eiendomsinvest AS NOK 220 000
40 Rjukan Næringspark KS NOK 397 000
41 Rygge Eiendomsinvest KS NOK 228 000
42 Røyken Næringseiendom KS NOK 233 000
43 Sarpsborg Sentrumsbolig AS NOK 360 000
44 Ski Skolebygg KS NOK 961 000
45 Slotsengen Bolig AS NOK 506 000
46 Stavanger Property Invest AS NOK 282 000
47 Sørlandsparken Logistikkinvest AS NOK 401 000
48 Torp Kontorinvest AS NOK 181 000
49 Tungasletta Invest AS NOK 593 000
50 Vestby Lagereiendom AS NOK 123 000
51 Østfoldbygg Invest AS NOK 262 000
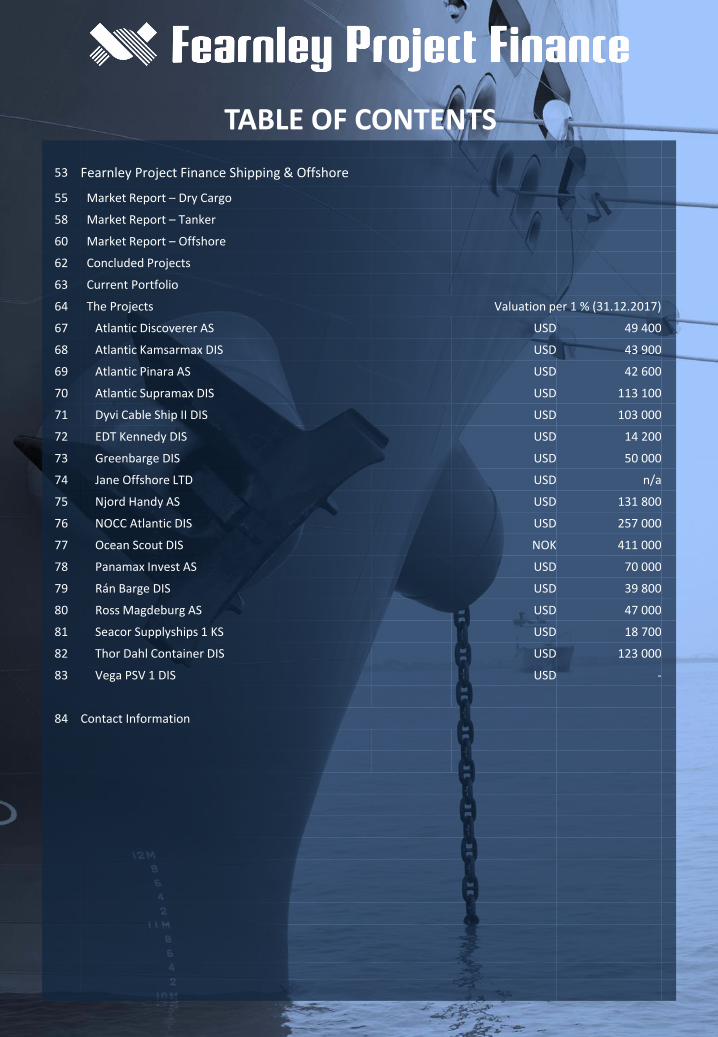
TABLE OF CONTENTS
53 Fearnley Project Finance Shipping & Offshore
55 Market Report – Dry Cargo
58 Market Report – Tanker
60 Market Report – Offshore
62 Concluded Projects
63 Current Portfolio
64 The Projects Valuation per 1 % (31.12.2017)
67 Atlantic Discoverer AS USD 49 400
68 Atlantic Kamsarmax DIS USD 43 900
69 Atlantic Pinara AS USD 42 600
70 Atlantic Supramax DIS USD 113 100
71 Dyvi Cable Ship II DIS USD 103 000
72 EDT Kennedy DIS USD 14 200
73 Greenbarge DIS USD 50 000
74 Jane Offshore LTD USD n/a
75 Njord Handy AS USD 131 800
76 NOCC Atlantic DIS USD 257 000
77 Ocean Scout DIS NOK 411 000
78 Panamax Invest AS USD 70 000
79 Rán Barge DIS USD 39 800
80 Ross Magdeburg AS USD 47 000
81 Seacor Supplyships 1 KS USD 18 700
82 Thor Dahl Container DIS USD 123 000
83 Vega PSV 1 DIS USD -
84 Contact Information
TABLE OF CONTENTS
5 Market Report 2018
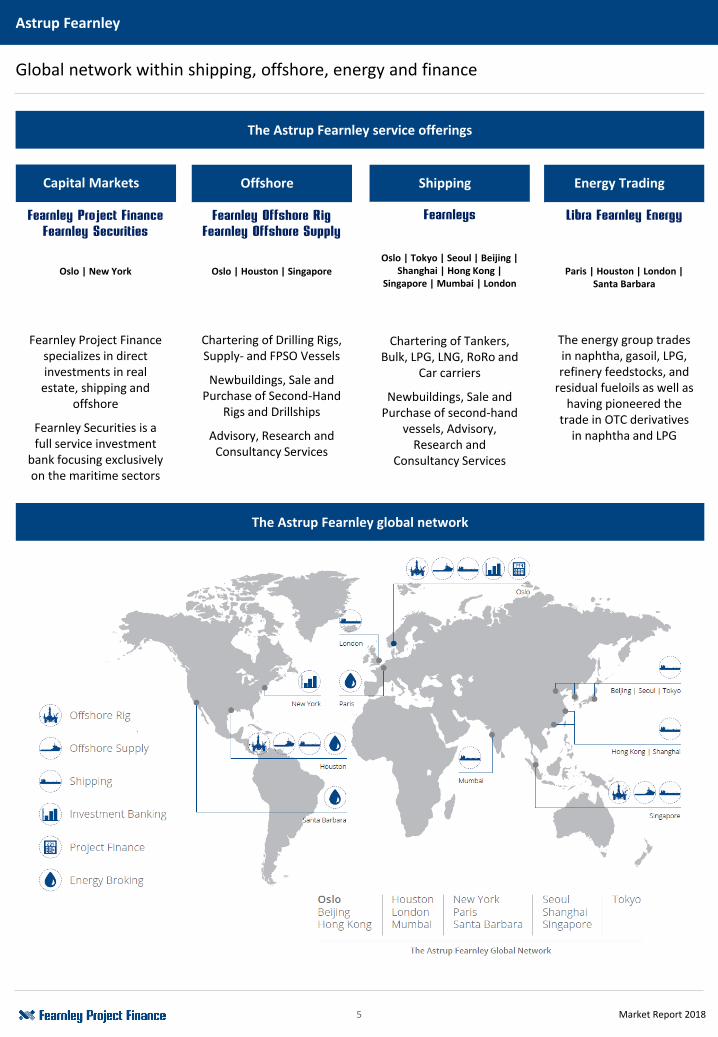
The Astrup Fearnley service offerings
Global network within shipping, offshore, energy and finance
Astrup Fearnley
Capital Markets Offshore Shipping Energy Trading
Fearnley Project Finance
Fearnley Securities
Oslo | New York
Fearnley Project Financespecializes in direct investments in real
estate, shipping and offshore
Fearnley Securities is a full service investment
bank focusing exclusively on the maritime sectors
Fearnley Offshore Rig
Fearnley Offshore Supply
Oslo | Houston | Singapore
Chartering of Drilling Rigs, Supply- and FPSO Vessels
Newbuildings, Sale and Purchase of Second-Hand
Rigs and Drillships
Advisory, Research and Consultancy Services
Fearnleys
Oslo | Tokyo | Seoul | Beijing |Shanghai | Hong Kong |
Singapore | Mumbai | London
Chartering of Tankers, Bulk, LPG, LNG, RoRo and
Car carriers
Newbuildings, Sale and Purchase of second-hand
vessels, Advisory, Research and
Consultancy Services
Libra Fearnley Energy
Paris | Houston | London | Santa Barbara
The energy group trades in naphtha, gasoil, LPG, refinery feedstocks, and
residual fueloils as well as having pioneered the
trade in OTC derivatives in naphtha and LPG
The Astrup Fearnley global network
6 Market Report 2018
Dear Investor
Fearnley Project Finance
We are pleased to present our latest shipping, offshoreand real estate market report with updated valuations ofour current projects under management year end 2017.Purchase and sales activity along with respective andhistorical returns can be found later in the report.
2017 was in many respects a strong year. For real estate,another year of growth and positive returns in theNorwegian real estate market is behind us. It probablyoutperformed compared to general expectations. Ownersof, and those who have been able to buy prime property,has experienced a significant increase in values.
Prime assets has reached a level where the effect ofgearing is marginal. Competition from family office,domestic and foreign pre-committed capital, as well assome pensions funds is not easy to match. The historicalgap between Oslo and other Nordic and European capitalsis about to close. Prime assets are seen as safe bets and itis hard to disagree. Still, many investors are looking to putcapital to work more efficiently at a higher level of risk.
Oslo is one of the fastest growing cities in Europe, makingdevelopment opportunities in the CBD scarce. In additionto prevailing low interest rates and expectations of rentalgrowth particularly in the CBD, governmentmanifestations on city and infrastructure development aredefinitively playing an important role. In spite of sometransactions being triggered by the rapid increase invalue, we register a lack of willingness to let prime assetsgo. However, demand and liquidity for all assets close toand in the greater Oslo area remain high.
The same principles apply for residential real estate, withinvestors clearly divided when considering purchaseopportunities. Timing and size (number of units) are moreimportant with some wanting to adjust their generalexposure. However, despite not being the flavour of themonth, residential development projects close totransportation hubs still attracts enough interest toachieve close to all time high price levels. Largedevelopers are still hungry for quality projects.
Fearnley Project Finance will continue to search forattractive purchase opportunities, predominantly in ourhome market in and around greater Oslo, but also higheryielding assets in other major Norwegian cities. Our mostimportant criteria remains unchanged. These areunderlying rental demand at the specific location,satisfactory rental level, counterparty credit risk as well asproperty value pr. square metre.
Development and value-add opportunities are alsoeagerly considered. As an independent player, we are able
to co-operate with anyone who can contribute to thepartnership. Coordinating strengths and bringing projectstogether is something we take great pride and joy indoing.
From an administrative perspective the project financeindustry is also facing a new reality, doing our best inevaluating and complying with new regulation fromfinancial authorities. Investors who wish to take part inour projects are obliged to accept the increasing level ofinformation required. Therefore digital solutions for easyuse and access for our investors are being implemented.
In shipping there were some sparks of optimism in thesecond half of 2016. After so many challenging years, onedid not really dare to believe the gloomy times were over.Asset prices were at a historical low when we entered theyear. The discount to newbuilding parity was at ahistorical high and the order book was moderate to lowfor most segments. All this pointed towards a recovery ofvalues and earnings. And it happened. Values picked up,albeit at a more moderate pace than seen in otherrebounding markets. Capital started to drip in the secondhalf of 2016 and continued with increased force in 2017.When earnings also picked up, the effect was enforced.Today, we see an unusual sound balance between netearnings and values for containers and dry bulk, withdirect yields approaching 14-15% in several segments. Thesale and purchase activity has been high, but everyonefears that new building orders will soon gain momentum.The market can handle some new orders, but this needsto be watched carefully.
Offshore has been the opportunistic case for investors in2017. Some argue that the overhang of vessels and rigs isso huge, that it will require a significant boost in demandto rectify the sins of the massive construction when oilprice was well above USD 100/barrel. On the other hand,the world’s thirst for oil is still there in spite of theincreased focus on green energy. There is a potentialunder- investment in new fields and drilling of new wells,which can result in a quicker rebound than investorsexpect. With the oil price testing USD 70/ barrel for thefirst time since 2015, we enter 2018 with far moreoptimism than last year.
Banks in both real estate and shipping are under greatpressure having to comply with new regulation as well asincreased competition from alternative sources offunding. As a result, traditional financing is available, butless so to the unfamiliar face in shipping. However, projectfinancing in real estate with bankable names on the list ofshareholders are able to get superior debt financingconditions.
7 Market Report 2018
Dear investor
Fearnley Project Finance
This said, a stronger and more efficient bond market hasreplaced a large portion of traditional bank financing andnow represents about 30% of the total Norwegian lendingvolume.
In shipping, even strong names struggle to get the amountof support they used to. Ship-owners can still findcommercial value in 15 year old ships, but the bank willdisagree, at least when the numbers are put into the BaselIII model. The answer is probably no loan regardless of thestrength of the owner. The restrained access to traditionalbank financing partly explains why the value increase isrelatively modest. Mr. Gearing, the super hero that crashlanded in 2008 has not gained the power he had. Peoplemay have short memory, but regulator’s do not. Thispushes traditional shipping banks to reduce theirexposure to our industry. Still, the capitalistic model needthe capital pecking order. The first capital into a project isthe safest and cheapest whilst the last to fill up the need,is the most expensive and riskiest. Traditional bankfinancing therefore leaves an open hole that needs to befilled by capital less expensive than equity. Examples areniche banks, leasing schemes in China and Japan andother structured financing solutions. Not surprisingly, thecost of capital is higher, but quite often, the terms such asloan to value and repayment profile, are more favourable.Thus, the capital is there for good projects. Luckily, so far,few new building projects are defined as good.
Our activity for 2017 can be summarised as follows; in realestate a total of 12 transactions was completed,equivalent to NOK 2,1 billion. 7 new projects wereestablished, within retail (big box), logistic, residentialdevelopment and combined property. Measured bynumber of units, shipping had a record year with 21container vessels, 4 dry bulk vessels, 1 offshore unit, 1 carcarrier and 1 LPG vessel. This involved values of abt. USD260 million. In addition, we were incremental in theestablishment of MPC Container Ships ASA. What initiallywas a project with one vessel in Fearnley Project Finance,is today a listed company on Oslo Axess. In closecooperation with Fearnley Securities, we wereinstrumental in the first two equity raisings.
Furthermore, for both real estate and shipping, we expectthe second hand market to stay strong and we encouragepotential buyers and sellers to make contact with ProjectSales.
We thank all our partners, investors, banks and serviceproviders for your support and remain at your disposal fordiscussions related to running projects and new ventures.
Fearnley Project Finance AS
Real Estate | Shipping & Offshore
Haakon SheteligManaging Partner, Real Estate
Tor KildalManaging Partner, Shipping & Offshore
8 Market Report 2018
About | Fearnley Project Finance
Fearnley Project Finance
Fearnley Project Finance, a subsidiary of the Astrup Fearnley Group, is a fully integrated project finance house. We specialize in structuring and financing direct investments in
shipping and real estate projects for high net worth individuals and institutional investors, both in Norway and internationally.
Business Areas & Value Chain
• Identifying and presenting investment opportunities
• Optimizing capital structure between debt and equity
• Due diligence, negotiations and closing
• Dividend payments• Cash flow budgeting• Covenant compliance
management• Tax reporting• Commercial follow-up• Annual reporting for
the SPC
• Quarterly valuations based on underlying asset values (NAV) and traded shares
• Facilitate and execute second hand trade
• Newsletter with buy and sell interest, and latest transactions
• Continuously consideration of exit based on hold/sell analysis and market forecasts
• Due diligence, negotiations and closing
ExitValuation &
secondhand trading
Business Management
Structuring & syndication
The Astrup Fearnley group can trace its history back to1869 when Thomas Fearnley established a shipping andagency business in Oslo, Norway. Today the AstrupFearnley Group employs approximately 300 peopleacross the world through its offices in Europe, US andAsia.
Fearnley Project Finance AS was established in 1981. Itsinception came as a direct result of an increased demandamong investors for direct investments within theshipping segment. Capital was scarce for shipowners andFearnley Project Finance found its niche as a provider offinancing to a variety of shipping projects.
Fearnley Project Finance entry into real estate startedwith the economic downturn in the late 1980’s andbeginning of the 1990’s. A sharp decrease in demand andhigh interest rates pushed real estate prices to a recordlow. Fearnley Project Finance saw this as an opportunityfor their investors to enter the real estate market atattractive prices.
Being part of the Astrup Fearnley Group allows FearnleyProject Finance to utilize the Groups resources and
expertise within business areas such as shipping,offshore, consulting, equity and debt capital markets.Fearnley Project Finance was the first project brokinghouse in Norway and is recognised for integrity,professionalism and speed of execution.
The real estate team consists of seven employees, whichmanage a real estate portfolio of approximately NOK 5,4billion within the following segments; office, retail,logistics, industrial, development and residential.
The shipping & offshore team consists of six employees,which manage a portfolio of approximately USD 170million, consisting of 19 projects and 24 vessels. Thediversified portfolio ranges from commodity basedshipping such as dry bulk and tank, to offshore andindustrial shipping. Furthermore, the shipping & offshoreteam aims to provide its clients with the best risk-rewardthrough a wide range of structures, from sale-leasebacks,to asset-backed bond structures and pure equityinvestments.

REAL ESTATE
10 Market Report 2018
About | Fearnley Project Finance Real Estate
Fearnley Project Finance Real Estate
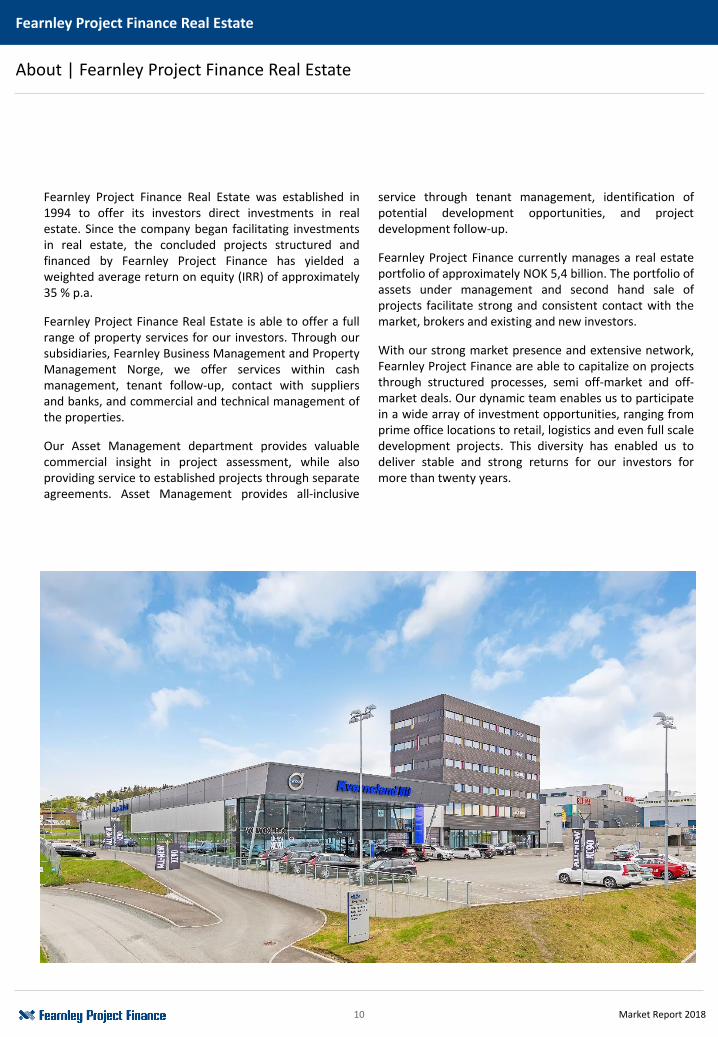
Fearnley Project Finance Real Estate was established in1994 to offer its investors direct investments in realestate. Since the company began facilitating investmentsin real estate, the concluded projects structured andfinanced by Fearnley Project Finance has yielded aweighted average return on equity (IRR) of approximately35 % p.a.
Fearnley Project Finance Real Estate is able to offer a fullrange of property services for our investors. Through oursubsidiaries, Fearnley Business Management and PropertyManagement Norge, we offer services within cashmanagement, tenant follow-up, contact with suppliersand banks, and commercial and technical management ofthe properties.
Our Asset Management department provides valuablecommercial insight in project assessment, while alsoproviding service to established projects through separateagreements. Asset Management provides all-inclusive
service through tenant management, identification ofpotential development opportunities, and projectdevelopment follow-up.
Fearnley Project Finance currently manages a real estateportfolio of approximately NOK 5,4 billion. The portfolio ofassets under management and second hand sale ofprojects facilitate strong and consistent contact with themarket, brokers and existing and new investors.
With our strong market presence and extensive network,Fearnley Project Finance are able to capitalize on projectsthrough structured processes, semi off-market and off-market deals. Our dynamic team enables us to participatein a wide array of investment opportunities, ranging fromprime office locations to retail, logistics and even full scaledevelopment projects. This diversity has enabled us todeliver stable and strong returns for our investors formore than twenty years.
11 Market Report 2018
Fearnley Project Finance Real Estate
Market Commentary
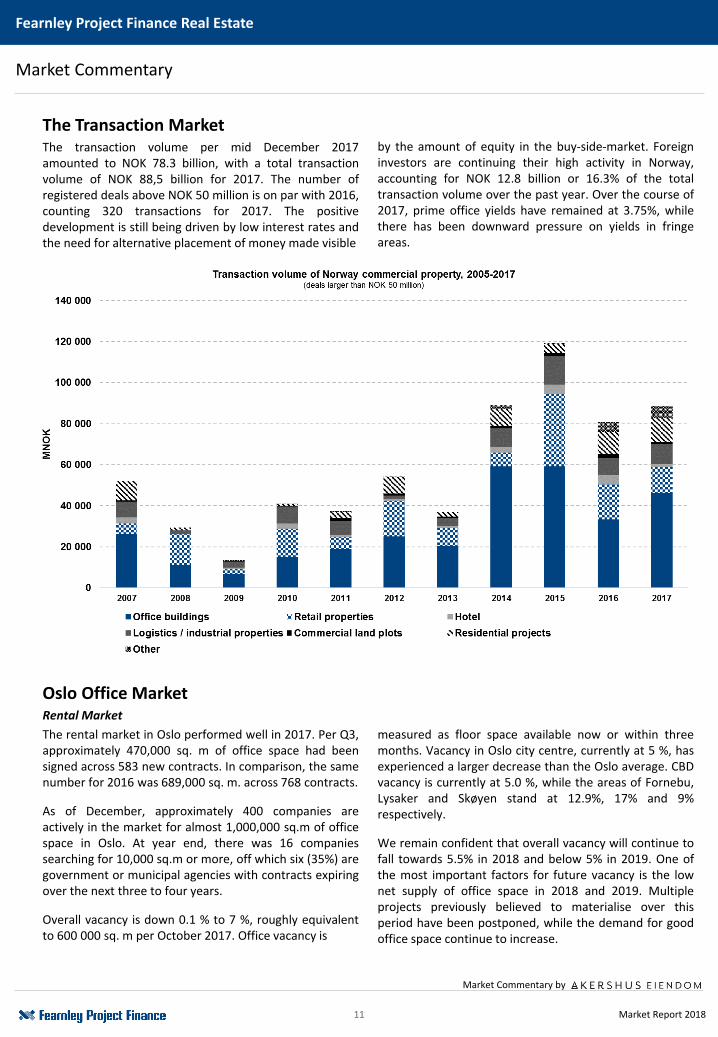
The Transaction MarketThe transaction volume per mid December 2017amounted to NOK 78.3 billion, with a total transactionvolume of NOK 88,5 billion for 2017. The number ofregistered deals above NOK 50 million is on par with 2016,counting 320 transactions for 2017. The positivedevelopment is still being driven by low interest rates andthe need for alternative placement of money made visible
by the amount of equity in the buy-side-market. Foreigninvestors are continuing their high activity in Norway,accounting for NOK 12.8 billion or 16.3% of the totaltransaction volume over the past year. Over the course of2017, prime office yields have remained at 3.75%, whilethere has been downward pressure on yields in fringeareas.
Oslo Office MarketRental Market
The rental market in Oslo performed well in 2017. Per Q3,approximately 470,000 sq. m of office space had beensigned across 583 new contracts. In comparison, the samenumber for 2016 was 689,000 sq. m. across 768 contracts.
As of December, approximately 400 companies areactively in the market for almost 1,000,000 sq.m of officespace in Oslo. At year end, there was 16 companiessearching for 10,000 sq.m or more, off which six (35%) aregovernment or municipal agencies with contracts expiringover the next three to four years.
Overall vacancy is down 0.1 % to 7 %, roughly equivalentto 600 000 sq. m per October 2017. Office vacancy is
measured as floor space available now or within threemonths. Vacancy in Oslo city centre, currently at 5 %, hasexperienced a larger decrease than the Oslo average. CBDvacancy is currently at 5.0 %, while the areas of Fornebu,Lysaker and Skøyen stand at 12.9%, 17% and 9%respectively.
We remain confident that overall vacancy will continue tofall towards 5.5% in 2018 and below 5% in 2019. One ofthe most important factors for future vacancy is the lownet supply of office space in 2018 and 2019. Multipleprojects previously believed to materialise over thisperiod have been postponed, while the demand for goodoffice space continue to increase.
Market Commentary by
12 Market Report 2018
Fearnley Project Finance Real Estate
Market Commentary
Prime office space rent remains at NOK 4,200 in 2017,while the cost for good quality space in the CBD is in theNOK 3,200 - 4,200 range. In the prime Oslo CBD area, weexpect the rents to see an increase over the years tocome, following the development in Stockholm. The mainreason for this is the increasing focus on effectiveutilisation of office space and the willingness to pay forextra services. For central Oslo, we expect the rentalgrowth in 2018 and 2019 to lie in the interval + 5 % to +10 %, somewhat down from our previous expectations.The rent levels in the western fringe are expected toremain at their current levels due to higher vacancycoupled with low demand for office space in the area.
Greater Oslo Logistics MarketThe prime rent for logistics space in Oslo still stands atNOK 1,200 per sq. m. per year. Observed rents are stillhigh in the area from Berger to Vinterbro, as these hubscontinue to be very popular due to their proximity to E6and sort driving distance from Oslo. We expect stablerents going forward due to good availability of suitableland plots for logistics in these areas.
The activity in the leasing market has been high during2017 and approximately 145,000 sq. m of new logisticsspace entered the market. Prime yield is below 5 % in theGrorud and Oslo fringe areas.
The vacancy in the greater Oslo region measured as floorspace available now or within 3 months stands at 4 % as ofQ3, up from 2016. The transaction market has continuedthe 2016 pace, and we have registered 46 transactionstotaling at NOK 7.7 billion.
Retail MarketThe retail market experienced growth throughout 2017 asinterest rates and inflation have remained low fuellingconsumer spending. Consumer confidence havecontinued the momentum from 2016 and we are now atthe highest levels since 2011. However, aligned with thegrowth in retail we see changes in consumer behaviourthat affect retailer’s physical expansion, such as increasedonline shopping and click-and-collect. Moreover, theNorwegian retail volume index published by StatisticsNorway shows positive y-o-y growth throughout 2017,although with some weakness in the second half of theyear.
The real estate market for retail have been slow withsmall amounts of property in the market. Thus, it isdifficult to assess the yield and value development in thesegment. High street vacancy continues to stay at lowlevels, structural vacancy aside, keeping the market rentstable for prime retail space.
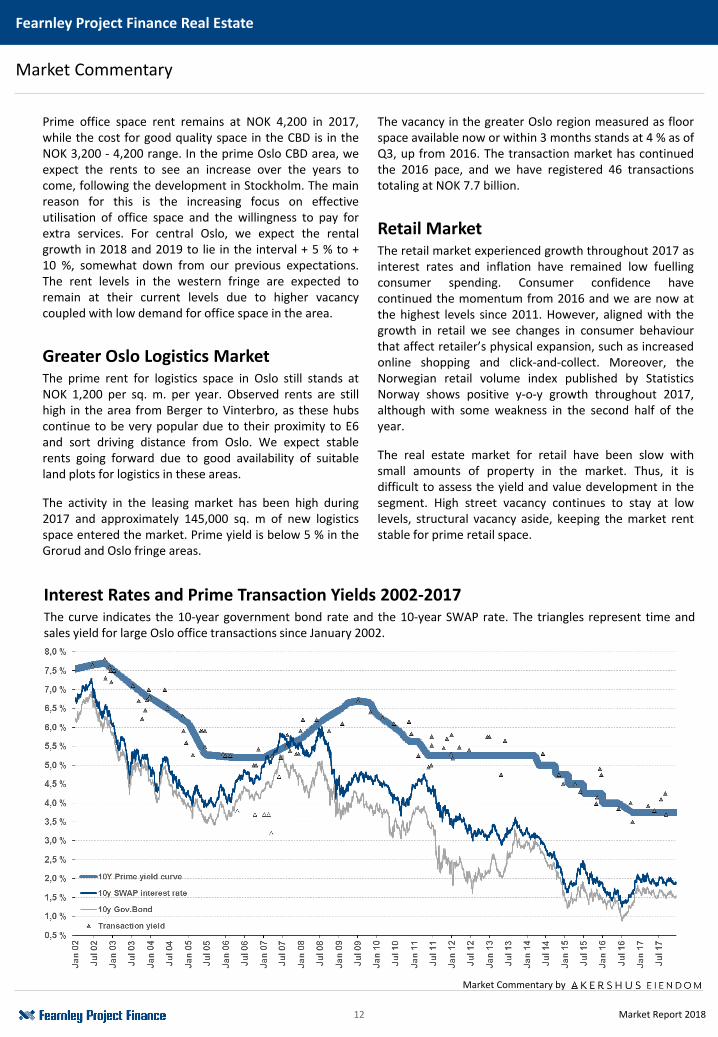
Interest Rates and Prime Transaction Yields 2002-2017The curve indicates the 10-year government bond rate and the 10-year SWAP rate. The triangles represent time andsales yield for large Oslo office transactions since January 2002.
Market Commentary by

13 Market Report 2018
Fearnley Project Finance Real Estate
Market Commentary
In 2017 the transaction volume for retail real estateamounted to NOK 12.2 billion or approximately 16 % ofthe total transaction market, a not insignificant decreasefrom NOK 17.2 billion in 2016. The decrease in volume aremainly driven by the low supply of shopping centres andfewer large portfolio deals.
The Big-Box retail market accounted for approx. 26 % ofthe retail market as of December 2017 (NOK 3.1 billion).One of the most noteworthy deals of 2017 is the sale ofNorwegian outlet Vestby for NOK 1.1 billion. The primeyield estimate for Bix-Box retail property is currently at5.25 %.
Residential Property Market
According to Eiendom Norge, FINN and Eiendomsverdi AS,the Norwegian residential prices are down 0.4 % Y-o-Y asof November 2017. As of 01.01.2017, the Norwegiangovernment implemented several measures in order tocalm the sharply increasing residential prices. Thesemeasures include maximum debt ratio of 5 times gross
income and mandatory amortization if loan value exceed60 % housing price. Month-by-month prices have fallensince April, so the year-by-year graphs are lagging indepicting the actual decline. A higher degree ofuncertainty has beset the market. While major domesticforecasters see a relatively modest decline, the risk isperceived as much higher by international observers.Indirectly, the currency markets also demonstrate ahigher risk perception, with residential prices blamed as amain reason for the low value of the Krone.
Market for new homes
The new building market has seen the highest levels ofactivity since the early 1980’s, with many new projectsstarted or currently under construction. The sale of newdwellings peaked in the beginning of 2017, but has fallensharply since. The Q3 sales volume of new homes was35% lower than last year’s Q3 in Norway as a whole and75% lower in Oslo. We expect sales to keep falling untilmid-2018 before picking up again. Following this, newconstruction starts peak at the end of 2017 and thevolume is expected to fall throughout 2018.
Market Commentary by
14 Market Report 2018
Fearnley Project Finance Real Estate
Market Commentary
Regional MarketsBergen
The transaction market has continued its strong trend in2017. The total transaction volume closed at NOK 5.45billion divided amongst 27 transactions. Prime yield in theregion are still in the 4.75 – 5.5 % range, while there havebeen several transactions in the 6 - 7% range.
Rent levels in the region have remained stable throughout2017 and the vacancy have remained at approximately10% since 2016. The highest vacancy is still observed inthe Sandsli and Kokstad areas, where premises are offeredat a discount.
Stavanger
The transaction market has remained stable throughout2017. Investors seem to still favour CBD over the Forusarea where the vacancy risk has been deemed high, dueto the decline of oil exploration activity. The prime yieldcontinues to stay at the 5% level, while most transactionshave landed a yield around 8%. The transaction volumeended at NOK 6.43 billion divided on 15 transactions.
High vacancy in the region is putting downwards pressureon the rent levels, and some areas have seen rents belowNOK 1,000 per sq. m, even for high standard premises.Prime rent in the CBD remains at NOK 2,600 per sq. m,and CBD rents have not fallen further during 2017.
Trondheim
The Trondheim transaction market is currently driven byactive buyers, especially syndicates. The transaction
volume totalled at NOK 3 billion in 2017, compared to therecorded volume of NOK 4.3 billion in 2016. A noteworthydeal is SpareBank 1’s sale of Søndre gt. 4-10 forapproximately NOK 750 million.
While the CBD office rents have remained stable in the1,000 – 1,950 per sq. m per year, the rent levels in thefringe locations have been under downward pressure dueto increased vacancy.
Office vacancy has been steady just above 9% during 2017and stands at 9.5% as of Q4 2017. The vacancy is highestin the fringe areas, especially around Sluppen,Fossegrenda and Tiller, south of the city centre. Vacancy isset to rise for 2019, due to a large volume of new projectsbeing completed.
The 2018 Outlook
Looking forward to 2018, we expect the transactionmarket to remain strong as the interest rates areexpected to remain low. The weakening of the kronemight keep the market attractive to foreign investors. Thedomestic investors also have the same reasoning for acontinuous desire for more commercial property as theyhave during the last couple of years; in short, the lack ofother saving opportunities and the low interest rates.From late 2018, this might change if the market playersstart believing in the predicted rise in interest rates. As ofnow, the improved economic conditions might lead tomore optimism in the leasing market and rising rents,which will offset some of the expected decline in valuedue to higher interest rates.
The Norwegian market is now lagging the US and Europein both the growth and the interest rate cycles. Thedevelopment in the major markets will thus give earlywarnings of how the leasing market and the investmentclimate affects commercial property.
Market Commentary by
15 Market Report 2018
With a total value of
NOK 905 million
Concluded
5 projects
Established
7 projectsWith a total value of
NOK 1 180 million
Activity in 2017
Fearnley Project Finance Real Estate
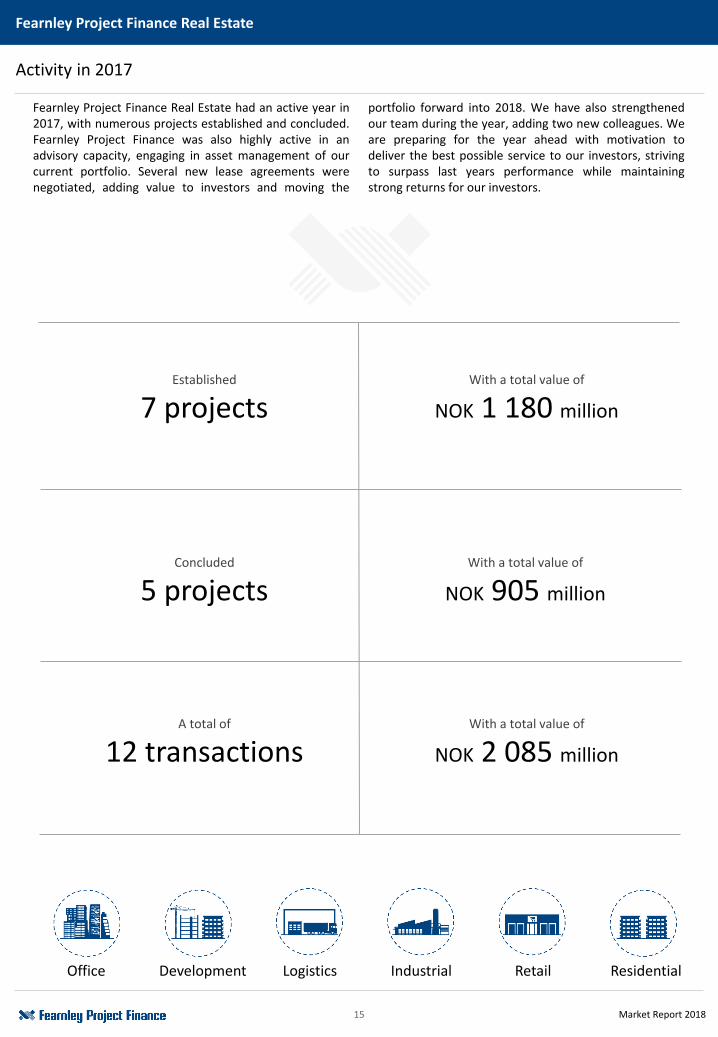
Fearnley Project Finance Real Estate had an active year in2017, with numerous projects established and concluded.Fearnley Project Finance was also highly active in anadvisory capacity, engaging in asset management of ourcurrent portfolio. Several new lease agreements werenegotiated, adding value to investors and moving the
portfolio forward into 2018. We have also strengthenedour team during the year, adding two new colleagues. Weare preparing for the year ahead with motivation todeliver the best possible service to our investors, strivingto surpass last years performance while maintainingstrong returns for our investors.
Office Development Logistics Industrial Retail Residential
A total of
12 transactionsWith a total value of
NOK 2 085 million
16 Market Report 2018
18 %
67 %
4 %
4 %
7 %
Fearnley Project Finance Real Estate
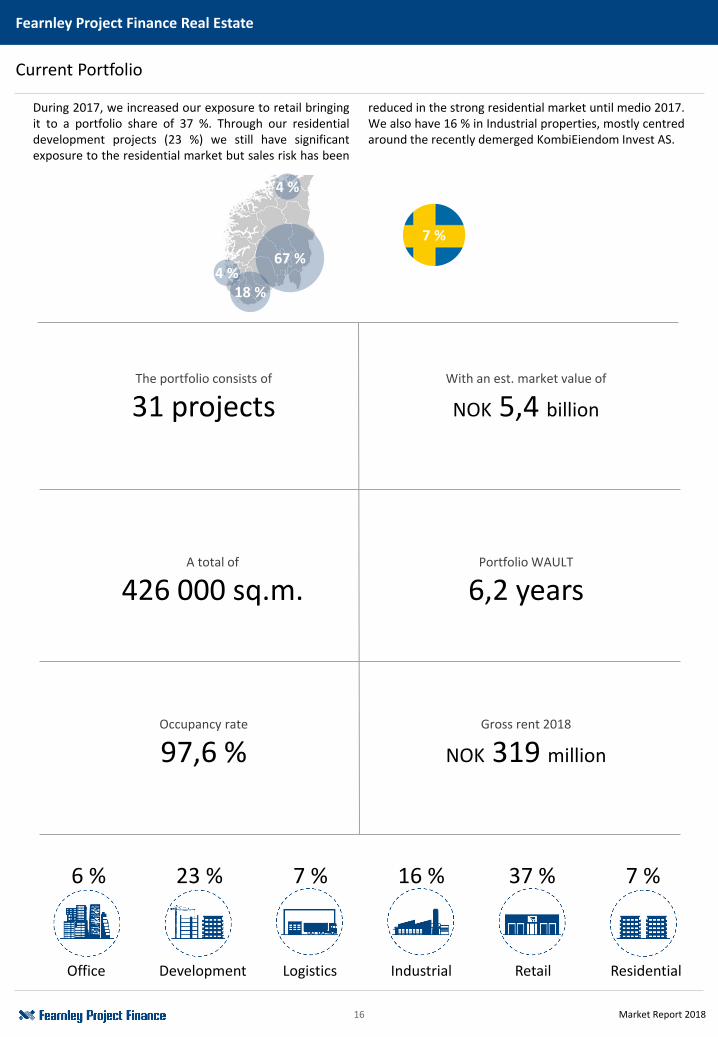
Current Portfolio
With an est. market value of
NOK 5,4 billion
The portfolio consists of
31 projects
A total of
426 000 sq.m.Portfolio WAULT
6,2 years
Occupancy rate
97,6 %Gross rent 2018
NOK 319 million
During 2017, we increased our exposure to retail bringingit to a portfolio share of 37 %. Through our residentialdevelopment projects (23 %) we still have significantexposure to the residential market but sales risk has been
reduced in the strong residential market until medio 2017.We also have 16 % in Industrial properties, mostly centredaround the recently demerged KombiEiendom Invest AS.
Office Development Logistics Industrial Retail Residential
6 % 23 % 7 % 7 %16 % 37 %
17 Market Report 2018
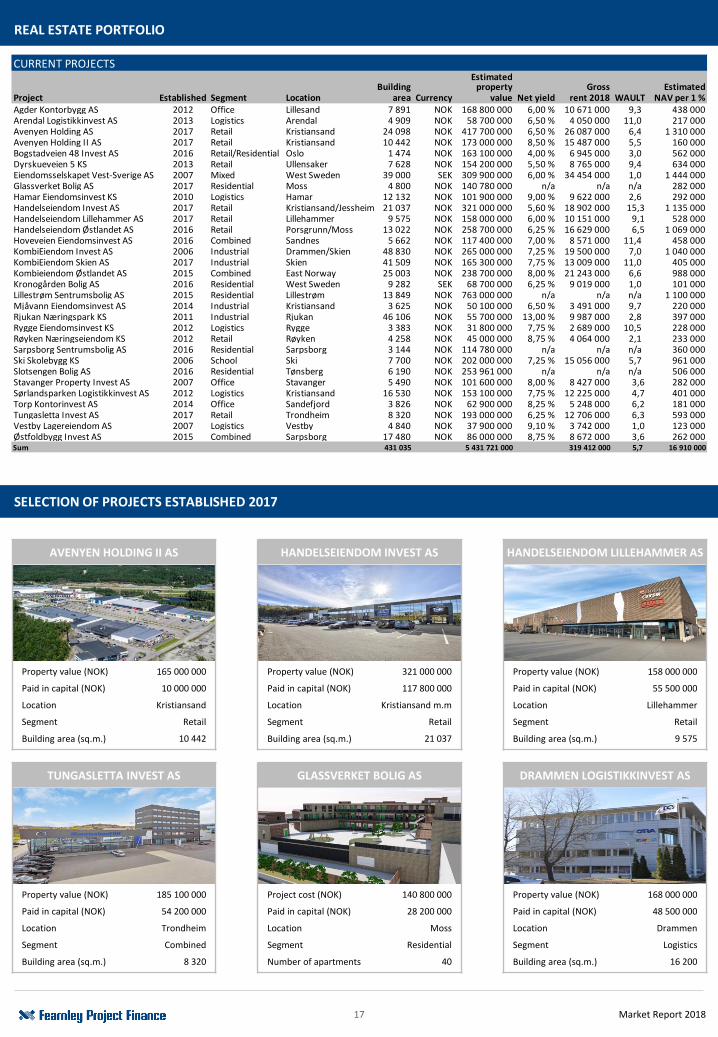
AVENYEN HOLDING II AS
Property value (NOK) 165 000 000
Paid in capital (NOK) 10 000 000
Location Kristiansand
Segment Retail
Building area (sq.m.) 10 442
HANDELSEIENDOM INVEST AS
Property value (NOK) 321 000 000
Paid in capital (NOK) 117 800 000
Location Kristiansand m.m
Segment Retail
Building area (sq.m.) 21 037
HANDELSEIENDOM LILLEHAMMER AS
Property value (NOK) 158 000 000
Paid in capital (NOK) 55 500 000
Location Lillehammer
Segment Retail
Building area (sq.m.) 9 575
TUNGASLETTA INVEST AS
Property value (NOK) 185 100 000
Paid in capital (NOK) 54 200 000
Location Trondheim
Segment Combined
Building area (sq.m.) 8 320
GLASSVERKET BOLIG AS
Project cost (NOK) 140 800 000
Paid in capital (NOK) 28 200 000
Location Moss
Segment Residential
Number of apartments 40
DRAMMEN LOGISTIKKINVEST AS
Property value (NOK) 168 000 000
Paid in capital (NOK) 48 500 000
Location Drammen
Segment Logistics
Building area (sq.m.) 16 200
CURRENT PROJECTSEstimated
Building property Gross EstimatedProject Established Segment Location area Currency value Net yield rent 2018 WAULT NAV per 1 %Agder Kontorbygg AS 2012 Office Lillesand 7 891 NOK 168 800 000 6,00 % 10 671 000 9,3 438 000Arendal Logistikkinvest AS 2013 Logistics Arendal 4 909 NOK 58 700 000 6,50 % 4 050 000 11,0 217 000Avenyen Holding AS 2017 Retail Kristiansand 24 098 NOK 417 700 000 6,50 % 26 087 000 6,4 1 310 000Avenyen Holding II AS 2017 Retail Kristiansand 10 442 NOK 173 000 000 8,50 % 15 487 000 5,5 160 000Bogstadveien 48 Invest AS 2016 Retail/Residential Oslo 1 474 NOK 163 100 000 4,00 % 6 945 000 3,0 562 000Dyrskueveien 5 KS 2013 Retail Ullensaker 7 628 NOK 154 200 000 5,50 % 8 765 000 9,4 634 000Eiendomsselskapet Vest-Sverige AS 2007 Mixed West Sweden 39 000 SEK 309 900 000 6,00 % 34 454 000 1,0 1 444 000Glassverket Bolig AS 2017 Residential Moss 4 800 NOK 140 780 000 n/a n/a n/a 282 000Hamar Eiendomsinvest KS 2010 Logistics Hamar 12 132 NOK 101 900 000 9,00 % 9 622 000 2,6 292 000Handelseiendom Invest AS 2017 Retail Kristiansand/Jessheim/Notodden21 037 NOK 321 000 000 5,60 % 18 902 000 15,3 1 135 000 Handelseiendom Lillehammer AS 2017 Retail Lillehammer 9 575 NOK 158 000 000 6,00 % 10 151 000 9,1 528 000 Handelseiendom Østlandet AS 2016 Retail Porsgrunn/Moss 13 022 NOK 258 700 000 6,25 % 16 629 000 6,5 1 069 000 Hoveveien Eiendomsinvest AS 2016 Combined Sandnes 5 662 NOK 117 400 000 7,00 % 8 571 000 11,4 458 000KombiEiendom Invest AS 2006 Industrial Drammen/Skien 48 830 NOK 265 000 000 7,25 % 19 500 000 7,0 1 040 000KombiEiendom Skien AS 2017 Industrial Skien 41 509 NOK 165 300 000 7,75 % 13 009 000 11,0 405 000Kombieiendom Østlandet AS 2015 Combined East Norway 25 003 NOK 238 700 000 8,00 % 21 243 000 6,6 988 000Kronogården Bolig AS 2016 Residential West Sweden 9 282 SEK 68 700 000 6,25 % 9 019 000 1,0 101 000Lillestrøm Sentrumsbolig AS 2015 Residential Lillestrøm 13 849 NOK 763 000 000 n/a n/a n/a 1 100 000Mjåvann Eiendomsinvest AS 2014 Industrial Kristiansand 3 625 NOK 50 100 000 6,50 % 3 491 000 9,7 220 000Rjukan Næringspark KS 2011 Industrial Rjukan 46 106 NOK 55 700 000 13,00 % 9 987 000 2,8 397 000Rygge Eiendomsinvest KS 2012 Logistics Rygge 3 383 NOK 31 800 000 7,75 % 2 689 000 10,5 228 000Røyken Næringseiendom KS 2012 Retail Røyken 4 258 NOK 45 000 000 8,75 % 4 064 000 2,1 233 000Sarpsborg Sentrumsbolig AS 2016 Residential Sarpsborg 3 144 NOK 114 780 000 n/a n/a n/a 360 000Ski Skolebygg KS 2006 School Ski 7 700 NOK 202 000 000 7,25 % 15 056 000 5,7 961 000Slotsengen Bolig AS 2016 Residential Tønsberg 6 190 NOK 253 961 000 n/a n/a n/a 506 000Stavanger Property Invest AS 2007 Office Stavanger 5 490 NOK 101 600 000 8,00 % 8 427 000 3,6 282 000Sørlandsparken Logistikkinvest AS 2012 Logistics Kristiansand 16 530 NOK 153 100 000 7,75 % 12 225 000 4,7 401 000Torp Kontorinvest AS 2014 Office Sandefjord 3 826 NOK 62 900 000 8,25 % 5 248 000 6,2 181 000Tungasletta Invest AS 2017 Retail Trondheim 8 320 NOK 193 000 000 6,25 % 12 706 000 6,3 593 000Vestby Lagereiendom AS 2007 Logistics Vestby 4 840 NOK 37 900 000 9,10 % 3 742 000 1,0 123 000Østfoldbygg Invest AS 2015 Combined Sarpsborg 17 480 NOK 86 000 000 8,75 % 8 672 000 3,6 262 000Sum 431 035 5 431 721 000 319 412 000 5,7 16 910 000
|
SELECTION OF PROJECTS ESTABLISHED 2017
REAL ESTATE PORTFOLIO
18 Market Report 2018
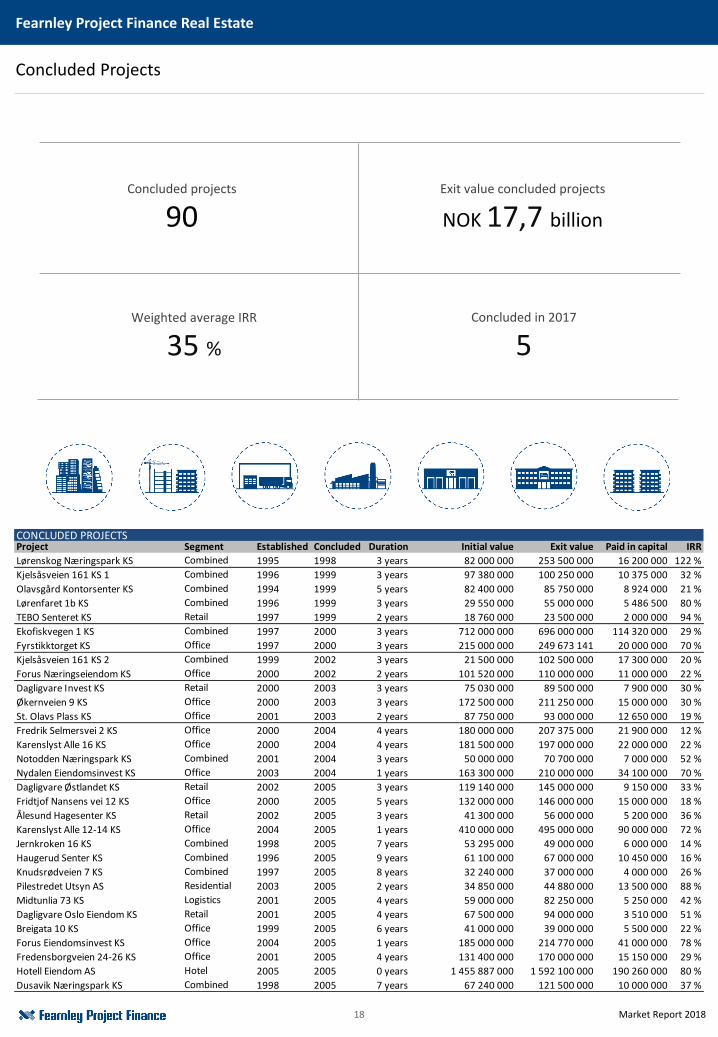
CONCLUDED PROJECTSProject Segment Established Concluded Duration Initial value Exit value Paid in capital IRR
Lørenskog Næringspark KS 1995 1998 3 years 82 000 000 253 500 000 16 200 000 122 %
Kjelsåsveien 161 KS 1 1996 1999 3 years 97 380 000 100 250 000 10 375 000 32 %
Olavsgård Kontorsenter KS 1994 1999 5 years 82 400 000 85 750 000 8 924 000 21 %
Lørenfaret 1b KS 1996 1999 3 years 29 550 000 55 000 000 5 486 500 80 %
TEBO Senteret KS 1997 1999 2 years 18 760 000 23 500 000 2 000 000 94 %
Ekofiskvegen 1 KS 1997 2000 3 years 712 000 000 696 000 000 114 320 000 29 %
Fyrstikktorget KS 1997 2000 3 years 215 000 000 249 673 141 20 000 000 70 %
Kjelsåsveien 161 KS 2 1999 2002 3 years 21 500 000 102 500 000 17 300 000 20 %
Forus Næringseiendom KS 2000 2002 2 years 101 520 000 110 000 000 11 000 000 22 %
Dagligvare Invest KS 2000 2003 3 years 75 030 000 89 500 000 7 900 000 30 %
Økernveien 9 KS 2000 2003 3 years 172 500 000 211 250 000 15 000 000 30 %
St. Olavs Plass KS 2001 2003 2 years 87 750 000 93 000 000 12 650 000 19 %
Fredrik Selmersvei 2 KS 2000 2004 4 years 180 000 000 207 375 000 21 900 000 12 %
Karenslyst Alle 16 KS 2000 2004 4 years 181 500 000 197 000 000 22 000 000 22 %
Notodden Næringspark KS 2001 2004 3 years 50 000 000 70 700 000 7 000 000 52 %
Nydalen Eiendomsinvest KS 2003 2004 1 years 163 300 000 210 000 000 34 100 000 70 %
Dagligvare Østlandet KS 2002 2005 3 years 119 140 000 145 000 000 9 150 000 33 %
Fridtjof Nansens vei 12 KS 2000 2005 5 years 132 000 000 146 000 000 15 000 000 18 %
Ålesund Hagesenter KS 2002 2005 3 years 41 300 000 56 000 000 5 200 000 36 %
Karenslyst Alle 12-14 KS 2004 2005 1 years 410 000 000 495 000 000 90 000 000 72 %
Jernkroken 16 KS 1998 2005 7 years 53 295 000 49 000 000 6 000 000 14 %
Haugerud Senter KS 1996 2005 9 years 61 100 000 67 000 000 10 450 000 16 %
Knudsrødveien 7 KS 1997 2005 8 years 32 240 000 37 000 000 4 000 000 26 %
Pilestredet Utsyn AS 2003 2005 2 years 34 850 000 44 880 000 13 500 000 88 %
Midtunlia 73 KS 2001 2005 4 years 59 000 000 82 250 000 5 250 000 42 %
Dagligvare Oslo Eiendom KS 2001 2005 4 years 67 500 000 94 000 000 3 510 000 51 %
Breigata 10 KS 1999 2005 6 years 41 000 000 39 000 000 5 500 000 22 %
Forus Eiendomsinvest KS 2004 2005 1 years 185 000 000 214 770 000 41 000 000 78 %
Fredensborgveien 24-26 KS 2001 2005 4 years 131 400 000 170 000 000 15 150 000 29 %
Hotell Eiendom AS 2005 2005 0 years 1 455 887 000 1 592 100 000 190 260 000 80 %
Dusavik Næringspark KS 1998 2005 7 years 67 240 000 121 500 000 10 000 000 37 %
Combined
Combined
Combined
Combined
Combined
Retail
Combined
Office
Office
Office
Retail
Office
Office
Office
Office
Combined
Office
Retail
Office
Retail
Combined
Combined
Combined
Residential
Logistics
Retail
Office
Office
Office
Hotel
Combined
Concluded Projects
Fearnley Project Finance Real Estate
Concluded projects
90Exit value concluded projects
NOK 17,7 billion
Weighted average IRR
35 %Concluded in 2017
5
19 Market Report 2018
Fearnley Project Finance Real Estate
Concluded Projects continued
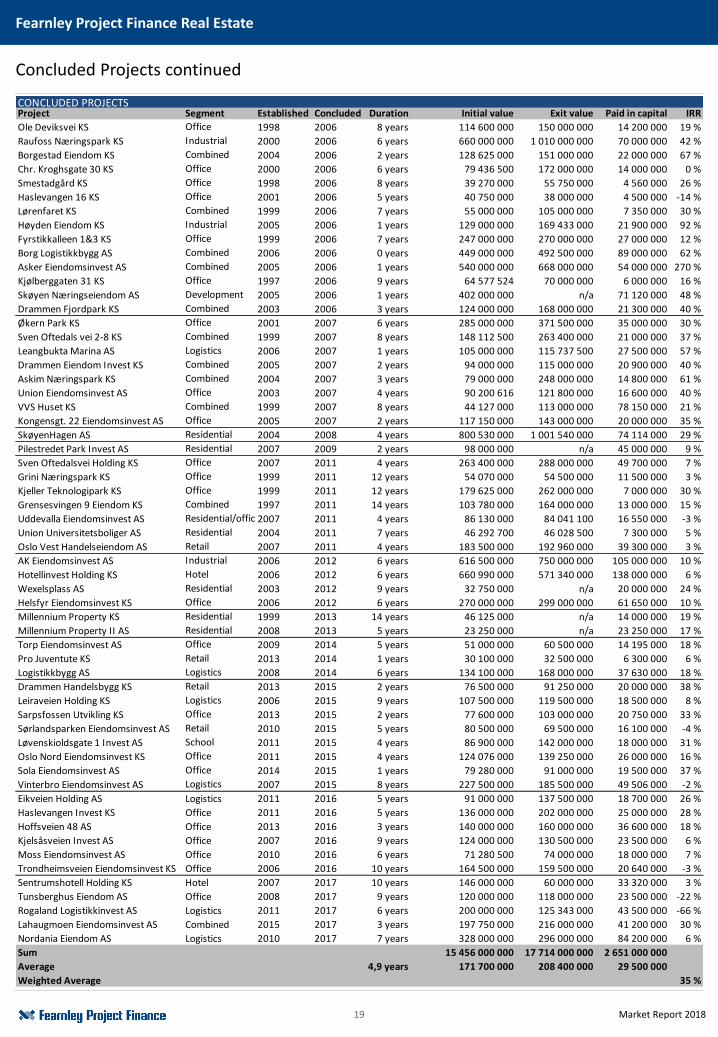
CONCLUDED PROJECTSProject Segment Established Concluded Duration Initial value Exit value Paid in capital IRR
Ole Deviksvei KS 1998 2006 8 years 114 600 000 150 000 000 14 200 000 19 %
Raufoss Næringspark KS 2000 2006 6 years 660 000 000 1 010 000 000 70 000 000 42 %
Borgestad Eiendom KS 2004 2006 2 years 128 625 000 151 000 000 22 000 000 67 %
Chr. Kroghsgate 30 KS 2000 2006 6 years 79 436 500 172 000 000 14 000 000 0 %
Smestadgård KS 1998 2006 8 years 39 270 000 55 750 000 4 560 000 26 %
Haslevangen 16 KS 2001 2006 5 years 40 750 000 38 000 000 4 500 000 -14 %
Lørenfaret KS 1999 2006 7 years 55 000 000 105 000 000 7 350 000 30 %
Høyden Eiendom KS 2005 2006 1 years 129 000 000 169 433 000 21 900 000 92 %
Fyrstikkalleen 1&3 KS 1999 2006 7 years 247 000 000 270 000 000 27 000 000 12 %
Borg Logistikkbygg AS 2006 2006 0 years 449 000 000 492 500 000 89 000 000 62 %
Asker Eiendomsinvest AS 2005 2006 1 years 540 000 000 668 000 000 54 000 000 270 %
Kjølberggaten 31 KS 1997 2006 9 years 64 577 524 70 000 000 6 000 000 16 %
Skøyen Næringseiendom AS 2005 2006 1 years 402 000 000 n/a 71 120 000 48 %
Drammen Fjordpark KS 2003 2006 3 years 124 000 000 168 000 000 21 300 000 40 %
Økern Park KS 2001 2007 6 years 285 000 000 371 500 000 35 000 000 30 %
Sven Oftedals vei 2-8 KS 1999 2007 8 years 148 112 500 263 400 000 21 000 000 37 %
Leangbukta Marina AS 2006 2007 1 years 105 000 000 115 737 500 27 500 000 57 %
Drammen Eiendom Invest KS 2005 2007 2 years 94 000 000 115 000 000 20 900 000 40 %
Askim Næringspark KS 2004 2007 3 years 79 000 000 248 000 000 14 800 000 61 %
Union Eiendomsinvest AS 2003 2007 4 years 90 200 616 121 800 000 16 600 000 40 %
VVS Huset KS 1999 2007 8 years 44 127 000 113 000 000 78 150 000 21 %
Kongensgt. 22 Eiendomsinvest AS 2005 2007 2 years 117 150 000 143 000 000 20 000 000 35 %
SkøyenHagen AS 2004 2008 4 years 800 530 000 1 001 540 000 74 114 000 29 %
Pilestredet Park Invest AS 2007 2009 2 years 98 000 000 n/a 45 000 000 9 %
Sven Oftedalsvei Holding KS 2007 2011 4 years 263 400 000 288 000 000 49 700 000 7 %
Grini Næringspark KS 1999 2011 12 years 54 070 000 54 500 000 11 500 000 3 %
Kjeller Teknologipark KS 1999 2011 12 years 179 625 000 262 000 000 7 000 000 30 %
Grensesvingen 9 Eiendom KS 1997 2011 14 years 103 780 000 164 000 000 13 000 000 15 %
Uddevalla Eiendomsinvest AS 2007 2011 4 years 86 130 000 84 041 100 16 550 000 -3 %
Union Universitetsboliger AS 2004 2011 7 years 46 292 700 46 028 500 7 300 000 5 %
Oslo Vest Handelseiendom AS 2007 2011 4 years 183 500 000 192 960 000 39 300 000 3 %
AK Eiendomsinvest AS 2006 2012 6 years 616 500 000 750 000 000 105 000 000 10 %
Hotellinvest Holding KS 2006 2012 6 years 660 990 000 571 340 000 138 000 000 6 %
Wexelsplass AS 2003 2012 9 years 32 750 000 n/a 20 000 000 24 %
Helsfyr Eiendomsinvest KS 2006 2012 6 years 270 000 000 299 000 000 61 650 000 10 %
Millennium Property KS 1999 2013 14 years 46 125 000 n/a 14 000 000 19 %
Millennium Property II AS 2008 2013 5 years 23 250 000 n/a 23 250 000 17 %
Torp Eiendomsinvest AS 2009 2014 5 years 51 000 000 60 500 000 14 195 000 18 %
Pro Juventute KS 2013 2014 1 years 30 100 000 32 500 000 6 300 000 6 %
Logistikkbygg AS 2008 2014 6 years 134 100 000 168 000 000 37 630 000 18 %
Drammen Handelsbygg KS 2013 2015 2 years 76 500 000 91 250 000 20 000 000 38 %
Leiraveien Holding KS 2006 2015 9 years 107 500 000 119 500 000 18 500 000 8 %
Sarpsfossen Utvikling KS 2013 2015 2 years 77 600 000 103 000 000 20 750 000 33 %
Sørlandsparken Eiendomsinvest AS 2010 2015 5 years 80 500 000 69 500 000 16 100 000 -4 %
Løvenskioldsgate 1 Invest AS 2011 2015 4 years 86 900 000 142 000 000 18 000 000 31 %
Oslo Nord Eiendomsinvest KS 2011 2015 4 years 124 076 000 139 250 000 26 000 000 16 %
Sola Eiendomsinvest AS 2014 2015 1 years 79 280 000 91 000 000 19 500 000 37 %
Vinterbro Eiendomsinvest AS 2007 2015 8 years 227 500 000 185 500 000 49 506 000 -2 %
Eikveien Holding AS Logistics 2011 2016 5 years 91 000 000 137 500 000 18 700 000 26 %
Haslevangen Invest KS Office 2011 2016 5 years 136 000 000 202 000 000 25 000 000 28 %
Hoffsveien 48 AS Office 2013 2016 3 years 140 000 000 160 000 000 36 600 000 18 %
Kjelsåsveien Invest AS Office 2007 2016 9 years 124 000 000 130 500 000 23 500 000 6 %
Moss Eiendomsinvest AS Office 2010 2016 6 years 71 280 500 74 000 000 18 000 000 7 %
Trondheimsveien Eiendomsinvest KS Office 2006 2016 10 years 164 500 000 159 500 000 20 640 000 -3 %
Sentrumshotell Holding KS Hotel 2007 2017 10 years 146 000 000 60 000 000 33 320 000 3 %
Tunsberghus Eiendom AS Office 2008 2017 9 years 120 000 000 118 000 000 23 500 000 -22 %
Rogaland Logistikkinvest AS Logistics 2011 2017 6 years 200 000 000 125 343 000 43 500 000 -66 %
Lahaugmoen Eiendomsinvest AS Combined 2015 2017 3 years 197 750 000 216 000 000 41 200 000 30 %
Nordania Eiendom AS Logistics 2010 2017 7 years 328 000 000 296 000 000 84 200 000 6 %
Sum 15 456 000 000 17 714 000 000 2 651 000 000
Average 4,9 years 171 700 000 208 400 000 29 500 000
Weighted Average 35 %
Logistics
Office
Retail
Logistics
Retail
Logistics
Office
Retail
School
Office
Office
Office
Residential
Residential
Retail
Office
Residential/office
Residential
Industrial
Hotel
Residential
Residential
Office
Office
Combined
Development
Combined
Office
Combined
Office
Residential
Combined
Office
Combined
Logistics
Combined
Combined
Combined
Industrial
Combined
Office
Office
Office
Office
Office
Combined
Industrial
Office
THE PROJECTS
21 Market Report 2018
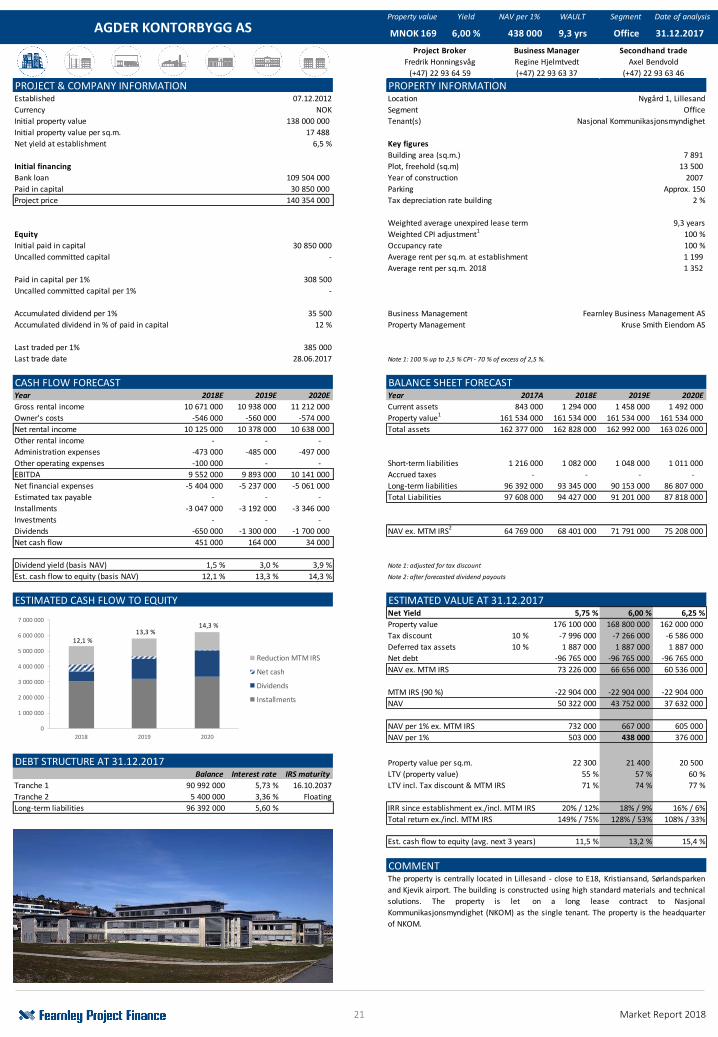
Property value Yield NAV per 1% WAULT Segment Date of analysis
PROJECT & COMPANY INFORMATION PROPERTY INFORMATIONEstablished 07.12.2012 Location Nygård 1, Lillesand
Currency NOK Segment Office
Initial property value 138 000 000 Tenant(s) Nasjonal Kommunikasjonsmyndighet
Initial property value per sq.m. 17 488
Net yield at establishment 6,5 % Key figures
Building area (sq.m.) 7 891
Initial financing Plot, freehold (sq.m) 13 500
Bank loan 109 504 000 Year of construction 2007
Paid in capital 30 850 000 Parking Approx. 150
Project price 140 354 000 Tax depreciation rate building 2 %
Weighted average unexpired lease term 9,3 years
Equity Weighted CPI adjustment1
100 %
Initial paid in capital 30 850 000 Occupancy rate 100 %
Uncalled committed capital - Average rent per sq.m. at establishment 1 199
Average rent per sq.m. 2018 1 352
Paid in capital per 1% 308 500
Uncalled committed capital per 1% -
Accumulated dividend per 1% 35 500 Business Management Fearnley Business Management AS
Accumulated dividend in % of paid in capital 12 % Property Management Kruse Smith Eiendom AS
Last traded per 1% 385 000
Last trade date 28.06.2017 Note 1: 100 % up to 2,5 % CPI - 70 % of excess of 2,5 %.
CASH FLOW FORECAST BALANCE SHEET FORECASTYear 2018E 2019E 2020E Year 2017A 2018E 2019E 2020E
Gross rental income 10 671 000 10 938 000 11 212 000 Current assets 843 000 1 294 000 1 458 000 1 492 000
Owner's costs -546 000 -560 000 -574 000 Property value1
161 534 000 161 534 000 161 534 000 161 534 000
Net rental income 10 125 000 10 378 000 10 638 000 Total assets 162 377 000 162 828 000 162 992 000 163 026 000
Other rental income - - -
Administration expenses -473 000 -485 000 -497 000
Other operating expenses -100 000 - - Short-term liabilities 1 216 000 1 082 000 1 048 000 1 011 000
EBITDA 9 552 000 9 893 000 10 141 000 Accrued taxes - - - -
Net financial expenses -5 404 000 -5 237 000 -5 061 000 Long-term liabilities 96 392 000 93 345 000 90 153 000 86 807 000
Estimated tax payable - - - Total Liabilities 97 608 000 94 427 000 91 201 000 87 818 000
Installments -3 047 000 -3 192 000 -3 346 000
Investments - - -
Dividends -650 000 -1 300 000 -1 700 000 NAV ex. MTM IRS2 64 769 000 68 401 000 71 791 000 75 208 000
Net cash flow 451 000 164 000 34 000
Dividend yield (basis NAV) 1,5 % 3,0 % 3,9 % Note 1: adjusted for tax discount
Est. cash flow to equity (basis NAV) 12,1 % 13,3 % 14,3 % Note 2: after forecasted dividend payouts
ESTIMATED CASH FLOW TO EQUITY ESTIMATED VALUE AT 31.12.2017Net Yield 5,75 % 6,00 % 6,25 %
Property value 176 100 000 168 800 000 162 000 000
Tax discount 10 % -7 996 000 -7 266 000 -6 586 000
Deferred tax assets 10 % 1 887 000 1 887 000 1 887 000
Net debt -96 765 000 -96 765 000 -96 765 000
NAV ex. MTM IRS 73 226 000 66 656 000 60 536 000
MTM IRS (90 %) -22 904 000 -22 904 000 -22 904 000
NAV 50 322 000 43 752 000 37 632 000
NAV per 1% ex. MTM IRS 732 000 667 000 605 000
NAV per 1% 503 000 438 000 376 000
DEBT STRUCTURE AT 31.12.2017 Property value per sq.m. 22 300 21 400 20 500
Balance Interest rate IRS maturity LTV (property value) 55 % 57 % 60 %
Tranche 1 90 992 000 5,73 % 16.10.2037 LTV incl. Tax discount & MTM IRS 71 % 74 % 77 %
Tranche 2 5 400 000 3,36 % Floating
Long-term liabilities 96 392 000 5,60 % IRR since establishment ex./incl. MTM IRS 20% / 12% 18% / 9% 16% / 6%
Total return ex./incl. MTM IRS 149% / 75% 128% / 53% 108% / 33%
Est. cash flow to equity (avg. next 3 years) 11,5 % 13,2 % 15,4 %
COMMENT
(+47) 22 93 63 46
The property is centrally located in Lillesand - close to E18, Kristiansand, Sørlandsparken
and Kjevik airport. The building is constructed using high standard materials and technical
solutions. The property is let on a long lease contract to Nasjonal
Kommunikasjonsmyndighet (NKOM) as the single tenant. The property is the headquarter
of NKOM.
Project Broker Business Manager Secondhand trade
Fredrik Honningsvåg Regine Hjelmtvedt Axel Bendvold
AGDER KONTORBYGG AS Office 31.12.2017
(+47) 22 93 64 59 (+47) 22 93 63 37
MNOK 169 6,00 % 438 000 9,3 yrs
12,1 %13,3 %
14,3 %
0
1 000 000
2 000 000
3 000 000
4 000 000
5 000 000
6 000 000
7 000 000
2018 2019 2020
Reduction MTM IRS
Net cash
Dividends
Installments

22 Market Report 2018
Property value Yield NAV per 1% WAULT Segment Date of analysis
PROJECT & COMPANY INFORMATION PROPERTY INFORMATIONEstablished 25.10.2013 Location Åsbieveien 25, Arendal
Currency NOK Segment Logistics
Initial property value 47 250 000 Tenant(s) DSV Road AS
Initial property value per sq.m. 9 625
Net yield at establishment 7,5 % Key figures
Building area (sq.m.) 4 909
Initial financing Plot, freehold (sq.m) 34 725
Bank loan 33 550 000 Year of construction 2004
Paid in capital 12 500 000 Parking Approx. 100
Project price 46 050 000 Tax depreciation rate building 4 %
Weighted average unexpired lease term 11 years
Equity Weighted CPI adjustment1
100 %
Initial paid in capital 12 500 000 Occupancy rate 100 %
Uncalled committed capital - Average rent per sq.m. at establishment 769
Average rent per sq.m. 2018 825
Paid in capital per 1% 125 000
Uncalled committed capital per 1% -
Accumulated dividend per 1% 87 800 Business Management Fearnley Business Management AS
Accumulated dividend in % of paid in capital 70 %
Last traded per 1% 245 000
Last trade date 26.09.2017 Note 1: Maximum 2 %
CASH FLOW FORECAST BALANCE SHEET FORECASTYear 2018E 2019E 2020E Year 2017A 2018E 2019E 2020E
Gross rental income 4 050 000 4 131 000 4 214 000 Current assets 929 000 1 439 000 1 685 000 1 637 000
Owner's costs -232 000 -238 000 -244 000 Property value1
56 634 000 56 634 000 56 634 000 56 634 000
Net rental income 3 818 000 3 893 000 3 970 000 Total assets 57 563 000 58 073 000 58 319 000 58 271 000
Other rental income - - -
Administration expenses -230 000 -236 000 -243 000
Other operating expenses - - - Short-term liabilities 75 000 72 000 75 000 72 000
EBITDA 3 588 000 3 657 000 3 727 000 Accrued taxes 488 000 452 000 487 000 507 000
Net financial expenses -890 000 -859 000 -888 000 Long-term liabilities 35 000 000 33 600 000 32 200 000 30 800 000
Estimated tax payable -488 000 -452 000 -487 000 Total Liabilities 35 563 000 34 124 000 32 762 000 31 379 000
Installments -1 400 000 -1 400 000 -1 400 000
Investments - - -
Dividends -300 000 -700 000 -1 000 000 NAV ex. MTM IRS2
22 000 000 23 949 000 25 557 000 26 892 000
Net cash flow 510 000 246 000 -48 000
Dividend yield (basis NAV) 1,4 % 3,2 % 4,6 % Note 1: adjusted for tax discount
Est. cash flow to equity (basis NAV) 10,3 % 10,9 % 10,9 % Note 2: after forecasted dividend payouts
ESTIMATED CASH FLOW TO EQUITY ESTIMATED VALUE AT 31.12.2017Net Yield 6,25 % 6,50 % 6,75 %
Property value 61 100 000 58 700 000 56 600 000
Tax discount 10 % -2 306 000 -2 066 000 -1 856 000
NPV other rental income - - -
Net debt -34 634 000 -34 634 000 -34 634 000
NAV ex. MTM IRS 24 160 000 22 000 000 20 110 000
MTM IRS (90 %) -257 000 -257 000 -257 000
NAV 23 903 000 21 743 000 19 853 000
NAV per 1% ex. MTM IRS 242 000 220 000 201 000
NAV per 1% 239 000 217 000 199 000
DEBT STRUCTURE AT 31.12.2017 Property value per sq.m. 12 400 12 000 11 500
Balance Interest rate IRS maturity LTV (property value) 57 % 60 % 62 %
Tranche 1 20 000 000 2,03 % Floating LTV incl. Tax discount & MTM IRS 60 % 62 % 64 %
Tranche 2 15 000 000 3,26 % 05.04.2027
Long-term liabilities 35 000 000 2,56 % IRR since establishment ex./incl. MTM IRS 28% / 28% 26% / 26% 24% / 24%
Total return ex./incl. MTM IRS 164% / 161% 146% / 144% 131% / 129%
Est. cash flow to equity (avg. next 3 years) 9,7 % 10,7 % 11,7 %
COMMENT
(+47) 22 93 63 46
The building was constructed in 2004 and is DSV Road AS' headquarter and
logistics/distribution center for southern Norway. The property is located in Stoa industrial
and retail area outside Arendal along E18. The main part of the building consists of
warehouse and distribution terminal. The building is located on a large freehold plot with
some development potential.
Project Broker Business Manager Secondhand trade
Fredrik Honningsvåg Monica Staff Axel Bendvold
ARENDAL LOGISTIKKINVEST AS Logistics 31.12.2017
(+47) 22 93 64 59 (+47) 22 93 64 39
MNOK 59 6,50 % 217 000 11 yrs
10,3 %10,9 % 10,9 %
-500 000
0
500 000
1 000 000
1 500 000
2 000 000
2 500 000
2018 2019 2020
Reduction MTM IRS
Net cash
Dividends
Installments
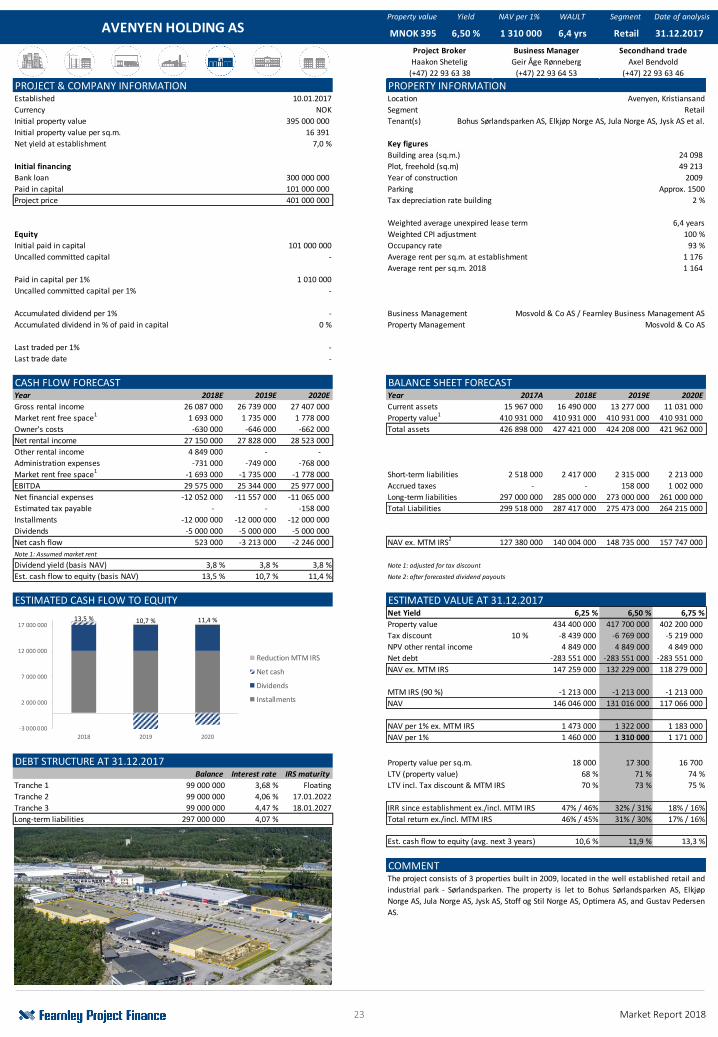
23 Market Report 2018
Property value Yield NAV per 1% WAULT Segment Date of analysis
PROJECT & COMPANY INFORMATION PROPERTY INFORMATIONEstablished 10.01.2017 Location Avenyen, Kristiansand
Currency NOK Segment Retail
Initial property value 395 000 000 Tenant(s) Bohus Sørlandsparken AS, Elkjøp Norge AS, Jula Norge AS, Jysk AS et al.
Initial property value per sq.m. 16 391
Net yield at establishment 7,0 % Key figures
Building area (sq.m.) 24 098
Initial financing Plot, freehold (sq.m) 49 213
Bank loan 300 000 000 Year of construction 2009
Paid in capital 101 000 000 Parking Approx. 1500
Project price 401 000 000 Tax depreciation rate building 2 %
Weighted average unexpired lease term 6,4 years
Equity Weighted CPI adjustment 100 %
Initial paid in capital 101 000 000 Occupancy rate 93 %
Uncalled committed capital - Average rent per sq.m. at establishment 1 176
Average rent per sq.m. 2018 1 164
Paid in capital per 1% 1 010 000
Uncalled committed capital per 1% -
Accumulated dividend per 1% - Business Management Mosvold & Co AS / Fearnley Business Management AS
Accumulated dividend in % of paid in capital 0 % Property Management Mosvold & Co AS
Last traded per 1% -
Last trade date -
CASH FLOW FORECAST BALANCE SHEET FORECASTYear 2018E 2019E 2020E Year 2017A 2018E 2019E 2020E
Gross rental income 26 087 000 26 739 000 27 407 000 Current assets 15 967 000 16 490 000 13 277 000 11 031 000
Market rent free space1
1 693 000 1 735 000 1 778 000 Property value1
410 931 000 410 931 000 410 931 000 410 931 000
Owner's costs -630 000 -646 000 -662 000 Total assets 426 898 000 427 421 000 424 208 000 421 962 000
Net rental income 27 150 000 27 828 000 28 523 000
Other rental income 4 849 000 - -
Administration expenses -731 000 -749 000 -768 000
Market rent free space1 -1 693 000 -1 735 000 -1 778 000 Short-term liabilities 2 518 000 2 417 000 2 315 000 2 213 000
EBITDA 29 575 000 25 344 000 25 977 000 Accrued taxes - - 158 000 1 002 000
Net financial expenses -12 052 000 -11 557 000 -11 065 000 Long-term liabilities 297 000 000 285 000 000 273 000 000 261 000 000
Estimated tax payable - - -158 000 Total Liabilities 299 518 000 287 417 000 275 473 000 264 215 000
Installments -12 000 000 -12 000 000 -12 000 000
Dividends -5 000 000 -5 000 000 -5 000 000
Net cash flow 523 000 -3 213 000 -2 246 000 NAV ex. MTM IRS2
127 380 000 140 004 000 148 735 000 157 747 000
Note 1: Assumed market rent
Dividend yield (basis NAV) 3,8 % 3,8 % 3,8 % Note 1: adjusted for tax discount
Est. cash flow to equity (basis NAV) 13,5 % 10,7 % 11,4 % Note 2: after forecasted dividend payouts
ESTIMATED CASH FLOW TO EQUITY ESTIMATED VALUE AT 31.12.2017Net Yield 6,25 % 6,50 % 6,75 %
Property value 434 400 000 417 700 000 402 200 000
Tax discount 10 % -8 439 000 -6 769 000 -5 219 000
NPV other rental income 4 849 000 4 849 000 4 849 000
Net debt -283 551 000 -283 551 000 -283 551 000
NAV ex. MTM IRS 147 259 000 132 229 000 118 279 000
MTM IRS (90 %) -1 213 000 -1 213 000 -1 213 000
NAV 146 046 000 131 016 000 117 066 000
NAV per 1% ex. MTM IRS 1 473 000 1 322 000 1 183 000
NAV per 1% 1 460 000 1 310 000 1 171 000
DEBT STRUCTURE AT 31.12.2017 Property value per sq.m. 18 000 17 300 16 700
Balance Interest rate IRS maturity LTV (property value) 68 % 71 % 74 %
Tranche 1 99 000 000 3,68 % Floating LTV incl. Tax discount & MTM IRS 70 % 73 % 75 %
Tranche 2 99 000 000 4,06 % 17.01.2022
Tranche 3 99 000 000 4,47 % 18.01.2027 IRR since establishment ex./incl. MTM IRS 47% / 46% 32% / 31% 18% / 16%
Long-term liabilities 297 000 000 4,07 % Total return ex./incl. MTM IRS 46% / 45% 31% / 30% 17% / 16%
Est. cash flow to equity (avg. next 3 years) 10,6 % 11,9 % 13,3 %
COMMENT
Retail 31.12.2017
(+47) 22 93 63 38 (+47) 22 93 64 53
MNOK 395 6,50 % 1 310 000 6,4 yrs
(+47) 22 93 63 46
The project consists of 3 properties built in 2009, located in the well established retail and
industrial park - Sørlandsparken. The property is let to Bohus Sørlandsparken AS, Elkjøp
Norge AS, Jula Norge AS, Jysk AS, Stoff og Stil Norge AS, Optimera AS, and Gustav Pedersen
AS.
Project Broker Business Manager Secondhand trade
Haakon Shetelig Geir Åge Rønneberg Axel Bendvold
AVENYEN HOLDING AS
13,5 % 10,7 % 11,4 %
-3 000 000
2 000 000
7 000 000
12 000 000
17 000 000
2018 2019 2020
Reduction MTM IRS
Net cash
Dividends
Installments
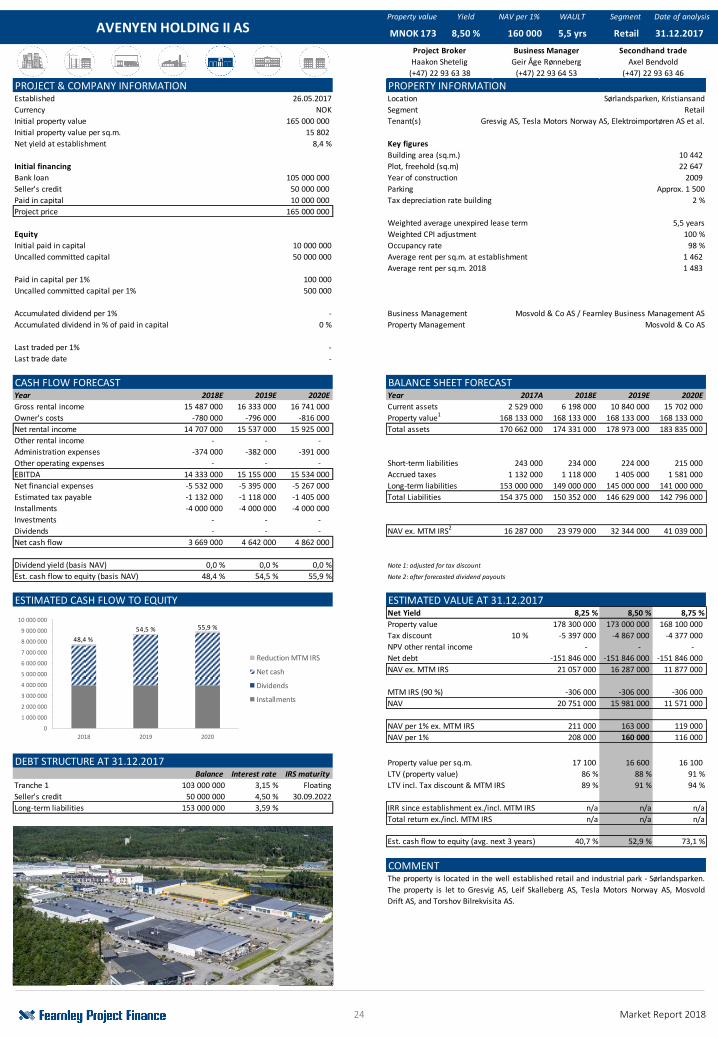
24 Market Report 2018
Property value Yield NAV per 1% WAULT Segment Date of analysis
PROJECT & COMPANY INFORMATION PROPERTY INFORMATIONEstablished 26.05.2017 Location Sørlandsparken, Kristiansand
Currency NOK Segment Retail
Initial property value 165 000 000 Tenant(s) Gresvig AS, Tesla Motors Norway AS, Elektroimportøren AS et al.
Initial property value per sq.m. 15 802
Net yield at establishment 8,4 % Key figures
Building area (sq.m.) 10 442
Initial financing Plot, freehold (sq.m) 22 647
Bank loan 105 000 000 Year of construction 2009
Seller's credit 50 000 000 Parking Approx. 1 500
Paid in capital 10 000 000 Tax depreciation rate building 2 %
Project price 165 000 000
Weighted average unexpired lease term 5,5 years
Equity Weighted CPI adjustment 100 %
Initial paid in capital 10 000 000 Occupancy rate 98 %
Uncalled committed capital 50 000 000 Average rent per sq.m. at establishment 1 462
Average rent per sq.m. 2018 1 483
Paid in capital per 1% 100 000
Uncalled committed capital per 1% 500 000
Accumulated dividend per 1% - Business Management Mosvold & Co AS / Fearnley Business Management AS
Accumulated dividend in % of paid in capital 0 % Property Management Mosvold & Co AS
Last traded per 1% -
Last trade date -
CASH FLOW FORECAST BALANCE SHEET FORECASTYear 2018E 2019E 2020E Year 2017A 2018E 2019E 2020E
Gross rental income 15 487 000 16 333 000 16 741 000 Current assets 2 529 000 6 198 000 10 840 000 15 702 000
Owner's costs -780 000 -796 000 -816 000 Property value1
168 133 000 168 133 000 168 133 000 168 133 000
Net rental income 14 707 000 15 537 000 15 925 000 Total assets 170 662 000 174 331 000 178 973 000 183 835 000
Other rental income - - -
Administration expenses -374 000 -382 000 -391 000
Other operating expenses - - - Short-term liabilities 243 000 234 000 224 000 215 000
EBITDA 14 333 000 15 155 000 15 534 000 Accrued taxes 1 132 000 1 118 000 1 405 000 1 581 000
Net financial expenses -5 532 000 -5 395 000 -5 267 000 Long-term liabilities 153 000 000 149 000 000 145 000 000 141 000 000
Estimated tax payable -1 132 000 -1 118 000 -1 405 000 Total Liabilities 154 375 000 150 352 000 146 629 000 142 796 000
Installments -4 000 000 -4 000 000 -4 000 000
Investments - - -
Dividends - - - NAV ex. MTM IRS2
16 287 000 23 979 000 32 344 000 41 039 000
Net cash flow 3 669 000 4 642 000 4 862 000
Dividend yield (basis NAV) 0,0 % 0,0 % 0,0 % Note 1: adjusted for tax discount
Est. cash flow to equity (basis NAV) 48,4 % 54,5 % 55,9 % Note 2: after forecasted dividend payouts
ESTIMATED CASH FLOW TO EQUITY ESTIMATED VALUE AT 31.12.2017Net Yield 8,25 % 8,50 % 8,75 %
Property value 178 300 000 173 000 000 168 100 000
Tax discount 10 % -5 397 000 -4 867 000 -4 377 000
NPV other rental income - - -
Net debt -151 846 000 -151 846 000 -151 846 000
NAV ex. MTM IRS 21 057 000 16 287 000 11 877 000
MTM IRS (90 %) -306 000 -306 000 -306 000
NAV 20 751 000 15 981 000 11 571 000
NAV per 1% ex. MTM IRS 211 000 163 000 119 000
NAV per 1% 208 000 160 000 116 000
DEBT STRUCTURE AT 31.12.2017 Property value per sq.m. 17 100 16 600 16 100
Balance Interest rate IRS maturity LTV (property value) 86 % 88 % 91 %
Tranche 1 103 000 000 3,15 % Floating LTV incl. Tax discount & MTM IRS 89 % 91 % 94 %
Seller's credit 50 000 000 4,50 % 30.09.2022
Long-term liabilities 153 000 000 3,59 % IRR since establishment ex./incl. MTM IRS n/a n/a n/a
Total return ex./incl. MTM IRS n/a n/a n/a
Est. cash flow to equity (avg. next 3 years) 40,7 % 52,9 % 73,1 %
COMMENT
BILDE
Retail 31.12.2017
(+47) 22 93 63 38 (+47) 22 93 64 53
MNOK 173 8,50 % 160 000 5,5 yrs
(+47) 22 93 63 46
The property is located in the well established retail and industrial park - Sørlandsparken.
The property is let to Gresvig AS, Leif Skalleberg AS, Tesla Motors Norway AS, Mosvold
Drift AS, and Torshov Bilrekvisita AS.
Project Broker Business Manager Secondhand trade
Haakon Shetelig Geir Åge Rønneberg Axel Bendvold
AVENYEN HOLDING II AS
48,4 %
54,5 % 55,9 %
0
1 000 000
2 000 000
3 000 000
4 000 000
5 000 000
6 000 000
7 000 000
8 000 000
9 000 000
10 000 000
2018 2019 2020
Reduction MTM IRS
Net cash
Dividends
Installments
25 Market Report 2018
Property value Yield NAV per 1% WAULT Segment Date of analysis
PROJECT & COMPANY INFORMATION PROPERTY INFORMATIONEstablished 25.10.2016 Location Bogstadveien 48, Oslo
Currency NOK Segment Retail
Initial property value 147 500 000 Tenant(s) Norli Libris AS, Kicks Norge AS
Initial property value per sq.m. 100 068
Net yield at establishment 4,2 % Key figures
Building area (sq.m.) 1 474
Initial financing Plot, freehold (sq.m) 527
Bank loan 94 900 000 Year of construction 1894 / 2010
Paid in capital 46 000 000
Project price 140 900 000 Tax depreciation rate building (retail) 2 %
Weighted average unexpired lease term - retail 3,6 years
Equity Weighted average unexpired lease term - residential 1,9 years
Initial paid in capital 46 000 000 Weighted CPI adjustment 93 %
Uncalled committed capital - Occupancy rate 92 %
Average rent per sq.m. retail at establishment 7 800
Paid in capital per 1% 460 000 Average rent per sq.m. retail 2018 8 000
Uncalled committed capital per 1% -
Accumulated dividend per 1% - Business Management Fearnley Business Management AS
Accumulated dividend in % of paid in capital 0 % Property Management Property Management Norge AS
Last traded per 1% -
Last trade date -
CASH FLOW FORECAST BALANCE SHEET FORECASTYear 2018E 2019E 2020E Year 2017A 2018E 2019E 2020E
Gross rental income 6 945 000 7 106 000 7 271 000 Current assets - 1 526 000 1 128 000 969 000
Owner's costs -422 000 -432 000 -443 000 Property value1
152 564 000 152 564 000 152 564 000 152 564 000
Net rental income 6 523 000 6 674 000 6 828 000 Total assets 152 564 000 154 090 000 153 692 000 153 533 000
Other rental income - - -
Administration expenses -284 000 -292 000 -299 000
Other operating expenses -303 000 -311 000 -319 000 Short-term liabilities 494 000 489 000 473 000 442 000
EBITDA 5 936 000 6 071 000 6 210 000 Accrued taxes 134 000 584 000 632 000 703 000
Net financial expenses -3 091 000 -3 038 000 -2 890 000 Long-term liabilities 94 900 000 93 900 000 91 053 000 88 206 000
Estimated tax payable -134 000 -584 000 -632 000 Total Liabilities 95 528 000 94 973 000 92 158 000 89 351 000
Installments -1 000 000 -2 847 000 -2 847 000
Investments -185 000 - -
Dividends - - - NAV ex. MTM IRS2
57 036 000 59 117 000 61 534 000 64 182 000
Net cash flow 1 526 000 -398 000 -159 000
Dividend yield (basis NAV) 0,0 % 0,0 % 0,0 % Note 1: adjusted for tax discount
Est. cash flow to equity (basis NAV) 4,8 % 4,7 % 5,0 % Note 2: after forecasted dividend payouts
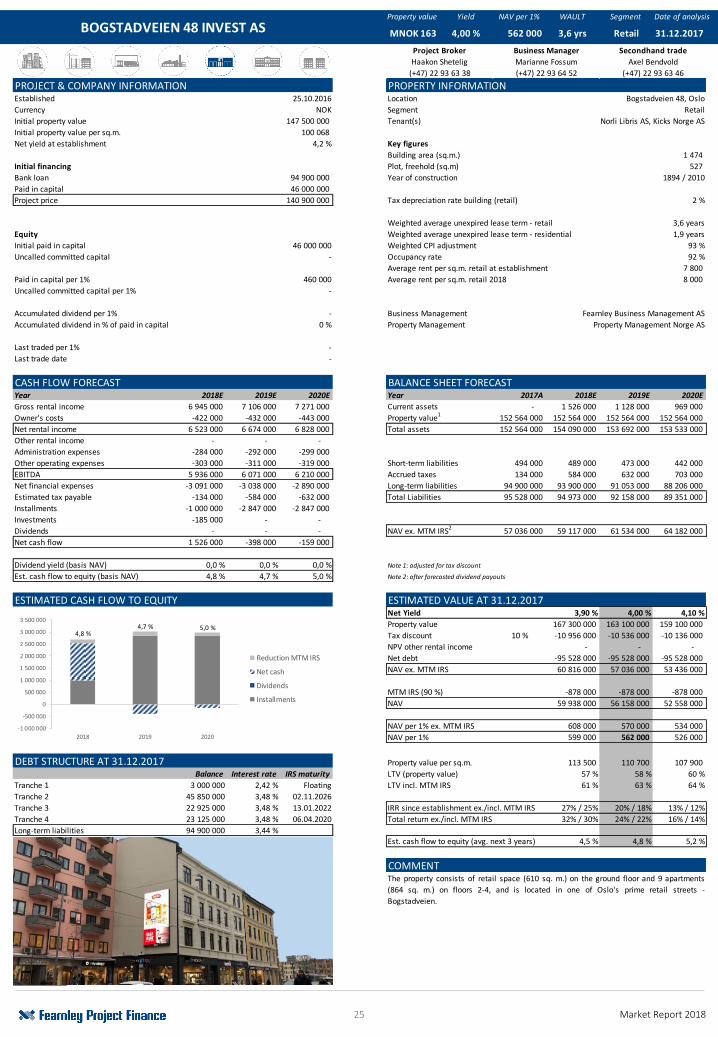
ESTIMATED CASH FLOW TO EQUITY ESTIMATED VALUE AT 31.12.2017Net Yield 3,90 % 4,00 % 4,10 %
Property value 167 300 000 163 100 000 159 100 000
Tax discount 10 % -10 956 000 -10 536 000 -10 136 000
NPV other rental income - - -
Net debt -95 528 000 -95 528 000 -95 528 000
NAV ex. MTM IRS 60 816 000 57 036 000 53 436 000
MTM IRS (90 %) -878 000 -878 000 -878 000
NAV 59 938 000 56 158 000 52 558 000
NAV per 1% ex. MTM IRS 608 000 570 000 534 000
NAV per 1% 599 000 562 000 526 000
DEBT STRUCTURE AT 31.12.2017 Property value per sq.m. 113 500 110 700 107 900
Balance Interest rate IRS maturity LTV (property value) 57 % 58 % 60 %
Tranche 1 3 000 000 2,42 % Floating LTV incl. MTM IRS 61 % 63 % 64 %
Tranche 2 45 850 000 3,48 % 02.11.2026
Tranche 3 22 925 000 3,48 % 13.01.2022 IRR since establishment ex./incl. MTM IRS 27% / 25% 20% / 18% 13% / 12%
Tranche 4 23 125 000 3,48 % 06.04.2020 Total return ex./incl. MTM IRS 32% / 30% 24% / 22% 16% / 14%
Long-term liabilities 94 900 000 3,44 %
Est. cash flow to equity (avg. next 3 years) 4,5 % 4,8 % 5,2 %
COMMENT
Retail 31.12.2017
(+47) 22 93 63 38 (+47) 22 93 64 52
MNOK 163 4,00 % 562 000 3,6 yrs
(+47) 22 93 63 46
The property consists of retail space (610 sq. m.) on the ground floor and 9 apartments
(864 sq. m.) on floors 2-4, and is located in one of Oslo's prime retail streets -
Bogstadveien.
Project Broker Business Manager Secondhand trade
Haakon Shetelig Marianne Fossum Axel Bendvold
BOGSTADVEIEN 48 INVEST AS
4,8 %4,7 % 5,0 %
-1 000 000
-500 000
0
500 000
1 000 000
1 500 000
2 000 000
2 500 000
3 000 000
3 500 000
2018 2019 2020
Reduction MTM IRS
Net cash
Dividends
Installments
26 Market Report 2018
Property value Yield NAV per 1% WAULT Segment Date of analysis
PROJECT & COMPANY INFORMATION PROPERTY INFORMATIONEstablished 01.07.2013 Location Dyrskuevegen 5, Kløfta
Currency NOK Segment Retail
Initial property value 105 000 000 Tenant(s) DNB Bank ASA, Megaflis AS
Initial property value per sq.m. 13 599
Net yield at establishment 7,0 % Key figures
Building area (sq.m.) 7 721
Initial financing Plot, freehold (sq.m) 21 710
Bank loan 71 000 000 Year of construction 2007
Paid in capital 31 700 750 Parking Approx. 250
Project price 102 700 750 Tax depreciation rate building 2 %
Weighted average unexpired lease term 9,4 years
Equity Weighted CPI adjustment 86 %
Initial paid in capital 31 700 750 Occupancy rate 100 %
Uncalled committed capital - Average rent per sq.m. at establishment 986
Average rent per sq.m. 2018 1 135
Paid in capital per 1% 317 008
Uncalled committed capital per 1% -
Accumulated dividend per 1% 298 008 Business Management Fearnley Business Management AS
Accumulated dividend in % of paid in capital 94 % Property Management Property Management Norge AS
Last traded per 1% 770 000
Last trade date 07.04.2017
CASH FLOW FORECAST BALANCE SHEET FORECASTYear 2018E 2019E 2020E Year 2017A 2018E 2019E 2020E
Gross rental income 8 765 000 8 953 000 9 145 000 Current assets 1 375 000 2 112 000 2 206 000 2 461 000
Owner's costs -282 000 -289 000 -296 000 Property value1
146 166 000 146 166 000 146 166 000 146 166 000
Net rental income 8 483 000 8 664 000 8 849 000 Total assets 147 541 000 148 278 000 148 372 000 148 627 000
Other rental income - - -
Administration expenses -417 000 -427 000 -438 000
Other operating expenses - - - Short-term liabilities 563 000 542 000 520 000 499 000
EBITDA 8 066 000 8 237 000 8 411 000 Accrued taxes 84 000 101 000 106 000 114 000
Net financial expenses -2 345 000 -2 242 000 -2 150 000 Long-term liabilities 83 300 000 79 900 000 76 500 000 73 100 000
Estimated tax payable -84 000 -101 000 -106 000 Total Liabilities 83 947 000 80 543 000 77 126 000 73 713 000
Installments -3 400 000 -3 400 000 -3 400 000
Investments - - -
Dividends -1 500 000 -2 400 000 -2 500 000 NAV ex. MTM IRS2
63 594 000 67 735 000 71 246 000 74 914 000
Net cash flow 737 000 94 000 255 000
Dividend yield (basis NAV) 2,4 % 3,8 % 3,9 % Note 1: adjusted for tax discount
Est. cash flow to equity (basis NAV) 8,9 % 9,4 % 9,8 % Note 2: after forecasted dividend payouts
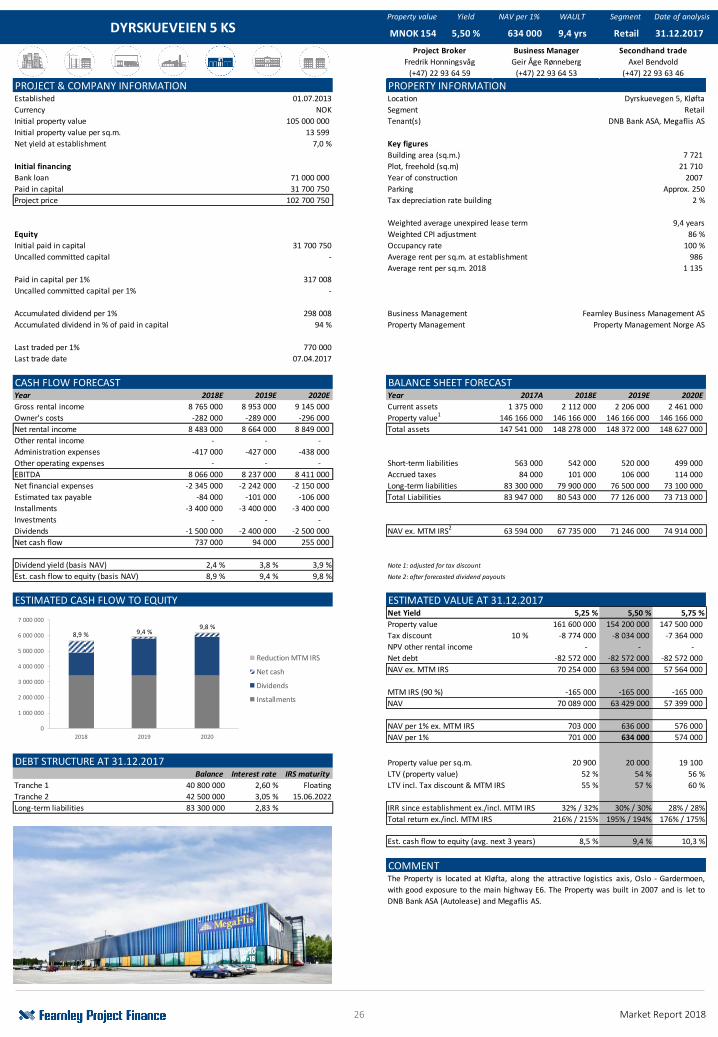
ESTIMATED CASH FLOW TO EQUITY ESTIMATED VALUE AT 31.12.2017Net Yield 5,25 % 5,50 % 5,75 %
Property value 161 600 000 154 200 000 147 500 000
Tax discount 10 % -8 774 000 -8 034 000 -7 364 000
NPV other rental income - - -
Net debt -82 572 000 -82 572 000 -82 572 000
NAV ex. MTM IRS 70 254 000 63 594 000 57 564 000
MTM IRS (90 %) -165 000 -165 000 -165 000
NAV 70 089 000 63 429 000 57 399 000
NAV per 1% ex. MTM IRS 703 000 636 000 576 000
NAV per 1% 701 000 634 000 574 000
DEBT STRUCTURE AT 31.12.2017 Property value per sq.m. 20 900 20 000 19 100
Balance Interest rate IRS maturity LTV (property value) 52 % 54 % 56 %
Tranche 1 40 800 000 2,60 % Floating LTV incl. Tax discount & MTM IRS 55 % 57 % 60 %
Tranche 2 42 500 000 3,05 % 15.06.2022
Long-term liabilities 83 300 000 2,83 % IRR since establishment ex./incl. MTM IRS 32% / 32% 30% / 30% 28% / 28%
Total return ex./incl. MTM IRS 216% / 215% 195% / 194% 176% / 175%
Est. cash flow to equity (avg. next 3 years) 8,5 % 9,4 % 10,3 %
COMMENT
(+47) 22 93 63 46
The Property is located at Kløfta, along the attractive logistics axis, Oslo - Gardermoen,
with good exposure to the main highway E6. The Property was built in 2007 and is let to
DNB Bank ASA (Autolease) and Megaflis AS.
Project Broker Business Manager Secondhand trade
Fredrik Honningsvåg Geir Åge Rønneberg Axel Bendvold
DYRSKUEVEIEN 5 KS Retail 31.12.2017
(+47) 22 93 64 59 (+47) 22 93 64 53
MNOK 154 5,50 % 634 000 9,4 yrs
8,9 % 9,4 %9,8 %
0
1 000 000
2 000 000
3 000 000
4 000 000
5 000 000
6 000 000
7 000 000
2018 2019 2020
Reduction MTM IRS
Net cash
Dividends
Installments
27 Market Report 2018
Property value Yield NAV per 1% WAULT Segment Date of analysis
PROJECT & COMPANY INFORMATION PROPERTY INFORMATIONEstablished 13.06.2007 Location West-Sweden
Currency SEK Segment Mixed
Initial property value 435 500 000 Tenant(s) Private/Commercial/School
Initial property value per sq.m. 8 710
Net yield at establishment 6,2 % Key figures
Building area (sq.m.) 39 000
Initial financing Number of apartments Approx. 350
Bank loan 356 479 000 Year of construction 1929/1948/1958/1969/1973/1991/2004
Paid in capital 81 863 000 Parking Approx. 350
Project price 438 342 000 Tax depreciation rate building 2-4 %
Equity Weighted average unexpired lease term 1 year
Initial paid in capital 81 863 000 Weighted CPI adjustment Approx. 100 %
Issue of new shares in August 2014 5 677 000 Occupancy rate Approx. 95 %
Sum paid in capital 87 540 000 Average rent per sq.m. at establishment 649
Average rent per sq.m. 2018 883
Paid in capital per 1% 875 400
Paid in capital per 1% (NOK) 752 950
Accumulated dividend per 1% 128 163 Business Management Fearnley Business Management AS
Accumulated dividend in % of paid in capital 15 % Property Management APF AB, Trollhättan
Last traded per 1% (NOK) 1 000 000
Last trade date 30.03.2017
CASH FLOW FORECAST BALANCE SHEET FORECASTYear 2018E 2019E 2020E Year 2017A 2018E 2019E 2020E
Gross rental income 34 454 000 35 324 000 36 202 000 Current assets 3 700 000 4 892 000 1 209 000 7 881 000
Owner's costs -15 859 000 -16 018 000 -16 178 000 Property value1
301 668 000 301 668 000 301 668 000 301 668 000
Net rental income 18 595 000 19 306 000 20 024 000 Total assets 305 368 000 306 560 000 302 877 000 309 549 000
Other rental income - - -
Administration expenses -3 024 000 -3 054 000 -3 084 000
Other operating expenses -10 900 000 -10 900 000 - Short-term liabilities 397 000 400 000 387 000 376 000
EBITDA 4 671 000 5 352 000 16 940 000 Accrued taxes 1 500 000 529 000 677 000 3 240 000
Net financial expenses -2 267 000 -2 274 000 -2 212 000 Long-term liabilities 159 098 000 158 786 000 153 954 000 149 410 000
Estimated tax payable -1 500 000 -529 000 -677 000 Total Liabilities 160 995 000 159 715 000 155 018 000 153 026 000
Installments -312 000 -4 832 000 -4 544 000
Sale of apartments 600 000 600 000 600 000
Dividends - -2 000 000 -3 435 000 NAV ex. MTM IRS2
144 373 000 146 845 000 147 859 000 156 523 000
Net cash flow 1 192 000 -3 683 000 6 672 000
Dividend yield (basis NAV) 0,0 % 1,4 % 2,4 % Note 1: adjusted for tax discount
Est. cash flow to equity (basis NAV) 1,0 % 2,2 % 10,1 % Note 2: after forecasted dividend payouts
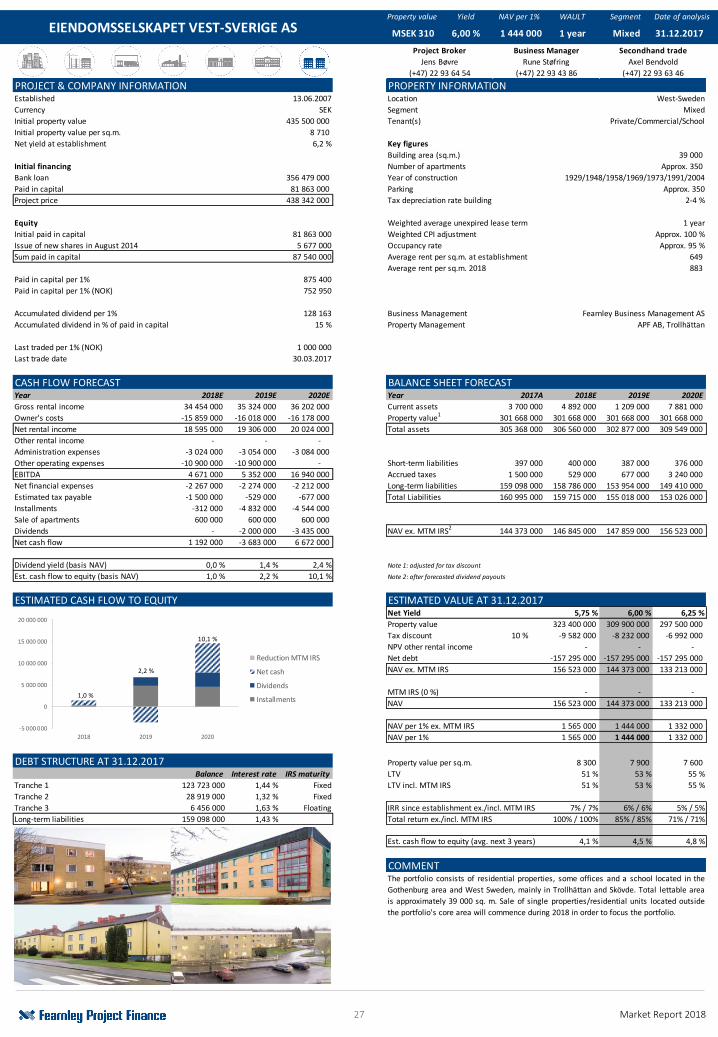
ESTIMATED CASH FLOW TO EQUITY ESTIMATED VALUE AT 31.12.2017Net Yield 5,75 % 6,00 % 6,25 %
Property value 323 400 000 309 900 000 297 500 000
Tax discount 10 % -9 582 000 -8 232 000 -6 992 000
NPV other rental income - - -
Net debt -157 295 000 -157 295 000 -157 295 000
NAV ex. MTM IRS 156 523 000 144 373 000 133 213 000
MTM IRS (0 %) - - -
NAV 156 523 000 144 373 000 133 213 000
NAV per 1% ex. MTM IRS 1 565 000 1 444 000 1 332 000
NAV per 1% 1 565 000 1 444 000 1 332 000
DEBT STRUCTURE AT 31.12.2017 Property value per sq.m. 8 300 7 900 7 600
Balance Interest rate IRS maturity LTV 51 % 53 % 55 %
Tranche 1 123 723 000 1,44 % Fixed LTV incl. MTM IRS 51 % 53 % 55 %
Tranche 2 28 919 000 1,32 % Fixed
Tranche 3 6 456 000 1,63 % Floating IRR since establishment ex./incl. MTM IRS 7% / 7% 6% / 6% 5% / 5%
Long-term liabilities 159 098 000 1,43 % Total return ex./incl. MTM IRS 100% / 100% 85% / 85% 71% / 71%
Est. cash flow to equity (avg. next 3 years) 4,1 % 4,5 % 4,8 %
COMMENT
Mixed 31.12.2017
(+47) 22 93 64 54 (+47) 22 93 43 86
MSEK 310 6,00 % 1 444 000 1 year
(+47) 22 93 63 46
The portfolio consists of residential properties, some offices and a school located in the
Gothenburg area and West Sweden, mainly in Trollhättan and Skövde. Total lettable area
is approximately 39 000 sq. m. Sale of single properties/residential units located outside
the portfolio's core area will commence during 2018 in order to focus the portfolio.
Project Broker Business Manager Secondhand trade
Jens Bøvre Rune Støfring Axel Bendvold
EIENDOMSSELSKAPET VEST-SVERIGE AS
1,0 %
2,2 %
10,1 %
-5 000 000
0
5 000 000
10 000 000
15 000 000
20 000 000
2018 2019 2020
Reduction MTM IRS
Net cash
Dividends
Installments
28 Market Report 2018
Expected completion Paid in capital per 1 % Segment Date of analysis
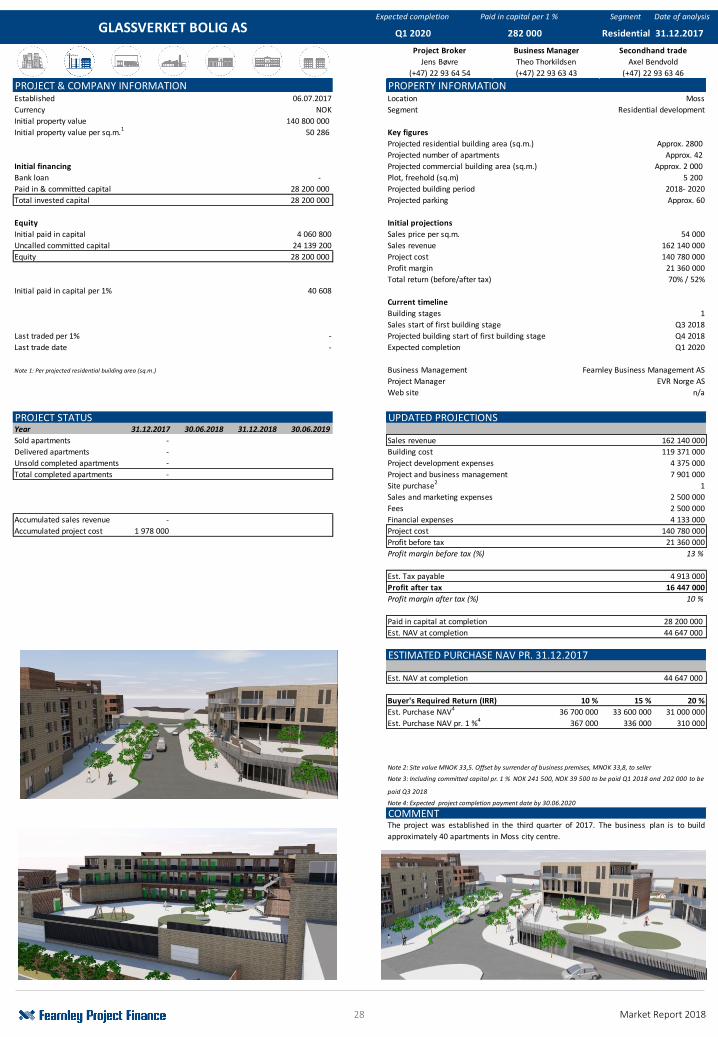
PROJECT & COMPANY INFORMATION PROPERTY INFORMATIONEstablished 06.07.2017 Location Moss
Currency NOK Segment Residential development
Initial property value 140 800 000
Initial property value per sq.m.1 50 286 Key figures
Projected residential building area (sq.m.) Approx. 2800
Projected number of apartments Approx. 42
Initial financing Projected commercial building area (sq.m.) Approx. 2 000
Bank loan - Plot, freehold (sq.m) 5 200
Paid in & committed capital 28 200 000 Projected building period 2018- 2020
Total invested capital 28 200 000 Projected parking Approx. 60
Equity Initial projections
Initial paid in capital 4 060 800 Sales price per sq.m. 54 000
Uncalled committed capital 24 139 200 Sales revenue 162 140 000
Equity 28 200 000 Project cost 140 780 000
Profit margin 21 360 000
Total return (before/after tax) 70% / 52%
Initial paid in capital per 1% 40 608
Current timeline
Building stages 1
Sales start of first building stage Q3 2018
Last traded per 1% - Projected building start of first building stage Q4 2018
Last trade date - Expected completion Q1 2020
Note 1: Per projected residential building area (sq.m.) Business Management Fearnley Business Management AS
Project Manager EVR Norge AS
Web site n/a
PROJECT STATUS UPDATED PROJECTIONSYear 31.12.2017 30.06.2018 31.12.2018 30.06.2019
Sold apartments - Sales revenue 162 140 000
Delivered apartments - Building cost 119 371 000
Unsold completed apartments - Project development expenses 4 375 000
Total completed apartments - Project and business management 7 901 000
Site purchase2 1
Sales price per sq.m. sold 64 200 Sales and marketing expenses 2 500 000
Fees 2 500 000
Accumulated sales revenue - Financial expenses 4 133 000
Accumulated project cost 1 978 000 Project cost 140 780 000
Profit before tax 21 360 000
Profit margin before tax (%) 13 %
Est. Tax payable 4 913 000
Profit after tax 16 447 000
Profit margin after tax (%) 10 %
Paid in capital at completion 28 200 000
Est. NAV at completion 44 647 000
ESTIMATED PURCHASE NAV PR. 31.12.2017
Est. NAV at completion 44 647 000
Buyer's Required Return (IRR) 10 % 15 % 20 %
Est. Purchase NAV4 36 700 000 33 600 000 31 000 000
Est. Purchase NAV pr. 1 %4 367 000 336 000 310 000
Note 2: Site value MNOK 33,5. Offset by surrender of business premises, MNOK 33,8, to seller
Note 4: Expected project completion payment date by 30.06.2020
COMMENT
Note 3: Including committed capital pr. 1 % NOK 241 500, NOK 39 500 to be paid Q1 2018 and 202 000 to be
paid Q3 2018
GLASSVERKET BOLIG AS
Jens Bøvre Theo Thorkildsen
282 000 Residential 31.12.2017
(+47) 22 93 64 54 (+47) 22 93 63 43
Project Broker Business Manager
Q1 2020
The project was established in the third quarter of 2017. The business plan is to build
approximately 40 apartments in Moss city centre.
(+47) 22 93 63 46
Secondhand trade
Axel Bendvold
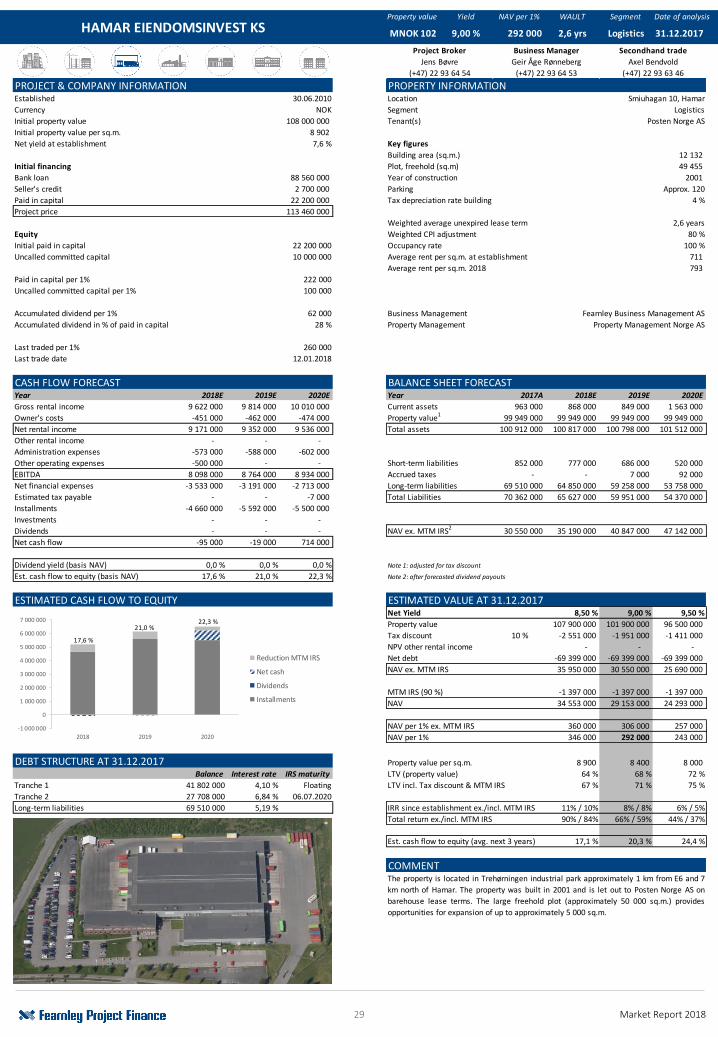
29 Market Report 2018
Property value Yield NAV per 1% WAULT Segment Date of analysis
PROJECT & COMPANY INFORMATION PROPERTY INFORMATIONEstablished 30.06.2010 Location Smiuhagan 10, Hamar
Currency NOK Segment Logistics
Initial property value 108 000 000 Tenant(s) Posten Norge AS
Initial property value per sq.m. 8 902
Net yield at establishment 7,6 % Key figures
Building area (sq.m.) 12 132
Initial financing Plot, freehold (sq.m) 49 455
Bank loan 88 560 000 Year of construction 2001
Seller's credit 2 700 000 Parking Approx. 120
Paid in capital 22 200 000 Tax depreciation rate building 4 %
Project price 113 460 000
Weighted average unexpired lease term 2,6 years
Equity Weighted CPI adjustment 80 %
Initial paid in capital 22 200 000 Occupancy rate 100 %
Uncalled committed capital 10 000 000 Average rent per sq.m. at establishment 711
Average rent per sq.m. 2018 793
Paid in capital per 1% 222 000
Uncalled committed capital per 1% 100 000
Accumulated dividend per 1% 62 000 Business Management Fearnley Business Management AS
Accumulated dividend in % of paid in capital 28 % Property Management Property Management Norge AS
Last traded per 1% 260 000
Last trade date 12.01.2018
CASH FLOW FORECAST BALANCE SHEET FORECASTYear 2018E 2019E 2020E Year 2017A 2018E 2019E 2020E
Gross rental income 9 622 000 9 814 000 10 010 000 Current assets 963 000 868 000 849 000 1 563 000
Owner's costs -451 000 -462 000 -474 000 Property value1
99 949 000 99 949 000 99 949 000 99 949 000
Net rental income 9 171 000 9 352 000 9 536 000 Total assets 100 912 000 100 817 000 100 798 000 101 512 000
Other rental income - - -
Administration expenses -573 000 -588 000 -602 000
Other operating expenses -500 000 - - Short-term liabilities 852 000 777 000 686 000 520 000
EBITDA 8 098 000 8 764 000 8 934 000 Accrued taxes - - 7 000 92 000
Net financial expenses -3 533 000 -3 191 000 -2 713 000 Long-term liabilities 69 510 000 64 850 000 59 258 000 53 758 000
Estimated tax payable - - -7 000 Total Liabilities 70 362 000 65 627 000 59 951 000 54 370 000
Installments -4 660 000 -5 592 000 -5 500 000
Investments - - -
Dividends - - - NAV ex. MTM IRS2
30 550 000 35 190 000 40 847 000 47 142 000
Net cash flow -95 000 -19 000 714 000
Dividend yield (basis NAV) 0,0 % 0,0 % 0,0 % Note 1: adjusted for tax discount
Est. cash flow to equity (basis NAV) 17,6 % 21,0 % 22,3 % Note 2: after forecasted dividend payouts
ESTIMATED CASH FLOW TO EQUITY ESTIMATED VALUE AT 31.12.2017Net Yield 8,50 % 9,00 % 9,50 %
Property value 107 900 000 101 900 000 96 500 000
Tax discount 10 % -2 551 000 -1 951 000 -1 411 000
NPV other rental income - - -
Net debt -69 399 000 -69 399 000 -69 399 000
NAV ex. MTM IRS 35 950 000 30 550 000 25 690 000
MTM IRS (90 %) -1 397 000 -1 397 000 -1 397 000
NAV 34 553 000 29 153 000 24 293 000
NAV per 1% ex. MTM IRS 360 000 306 000 257 000
NAV per 1% 346 000 292 000 243 000
DEBT STRUCTURE AT 31.12.2017 Property value per sq.m. 8 900 8 400 8 000
Balance Interest rate IRS maturity LTV (property value) 64 % 68 % 72 %
Tranche 1 41 802 000 4,10 % Floating LTV incl. Tax discount & MTM IRS 67 % 71 % 75 %
Tranche 2 27 708 000 6,84 % 06.07.2020
Long-term liabilities 69 510 000 5,19 % IRR since establishment ex./incl. MTM IRS 11% / 10% 8% / 8% 6% / 5%
Total return ex./incl. MTM IRS 90% / 84% 66% / 59% 44% / 37%
Est. cash flow to equity (avg. next 3 years) 17,1 % 20,3 % 24,4 %
COMMENT
Logistics 31.12.2017
(+47) 22 93 64 54 (+47) 22 93 64 53
MNOK 102 9,00 % 292 000 2,6 yrs
(+47) 22 93 63 46
The property is located in Trehørningen industrial park approximately 1 km from E6 and 7
km north of Hamar. The property was built in 2001 and is let out to Posten Norge AS on
barehouse lease terms. The large freehold plot (approximately 50 000 sq.m.) provides
opportunities for expansion of up to approximately 5 000 sq.m.
Project Broker Business Manager Secondhand trade
Jens Bøvre Geir Åge Rønneberg Axel Bendvold
HAMAR EIENDOMSINVEST KS
17,6 %
21,0 %22,3 %
-1 000 000
0
1 000 000
2 000 000
3 000 000
4 000 000
5 000 000
6 000 000
7 000 000
2018 2019 2020
Reduction MTM IRS
Net cash
Dividends
Installments
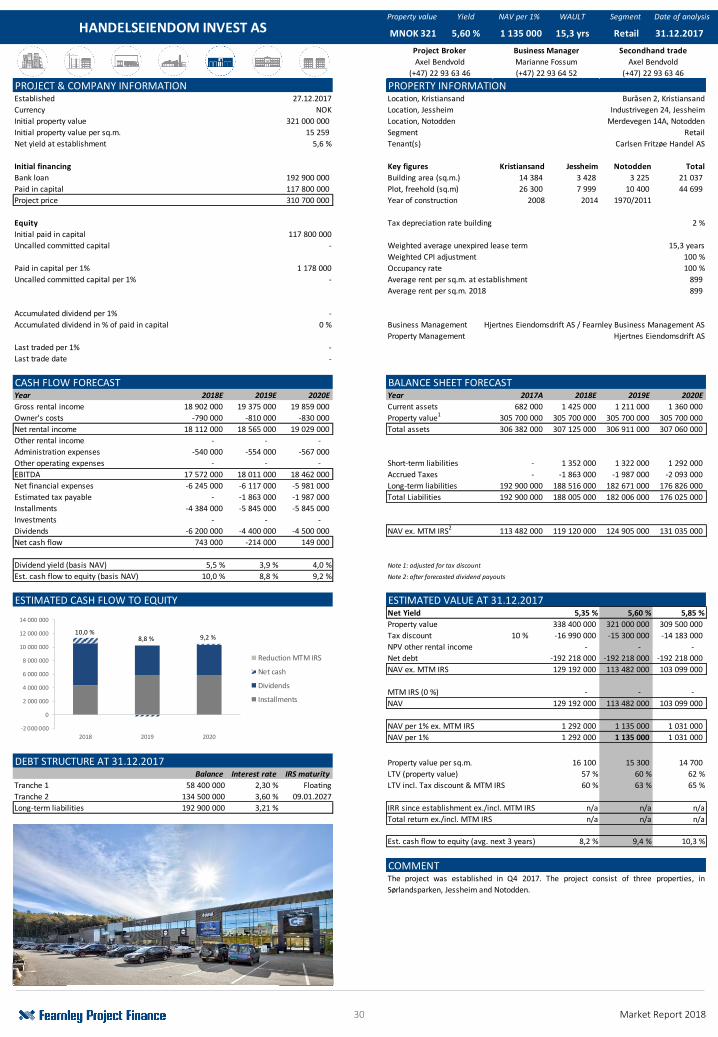
30 Market Report 2018
Property value Yield NAV per 1% WAULT Segment Date of analysis
PROJECT & COMPANY INFORMATION PROPERTY INFORMATIONEstablished 27.12.2017 Location, Kristiansand Buråsen 2, Kristiansand
Currency NOK Location, Jessheim Industrivegen 24, Jessheim
Initial property value 321 000 000 Location, Notodden Merdevegen 14A, Notodden
Initial property value per sq.m. 15 259 Segment Retail
Net yield at establishment 5,6 % Tenant(s) Carlsen Fritzøe Handel AS
Initial financing Key figures Kristiansand Jessheim Notodden Total
Bank loan 192 900 000 Building area (sq.m.) 14 384 3 428 3 225 21 037
Paid in capital 117 800 000 Plot, freehold (sq.m) 26 300 7 999 10 400 44 699
Project price 310 700 000 Year of construction 2008 2014 1970/2011
Equity Tax depreciation rate building 2 %
Initial paid in capital 117 800 000
Uncalled committed capital - Weighted average unexpired lease term 15,3 years
Weighted CPI adjustment 100 %
Paid in capital per 1% 1 178 000 Occupancy rate 100 %
Uncalled committed capital per 1% - Average rent per sq.m. at establishment 899
Average rent per sq.m. 2018 899
Accumulated dividend per 1% -
Accumulated dividend in % of paid in capital 0 % Business Management Hjertnes Eiendomsdrift AS / Fearnley Business Management AS
Property Management Hjertnes Eiendomsdrift AS
Last traded per 1% -
Last trade date -
CASH FLOW FORECAST BALANCE SHEET FORECASTYear 2018E 2019E 2020E Year 2017A 2018E 2019E 2020E
Gross rental income 18 902 000 19 375 000 19 859 000 Current assets 682 000 1 425 000 1 211 000 1 360 000
Owner's costs -790 000 -810 000 -830 000 Property value1
305 700 000 305 700 000 305 700 000 305 700 000
Net rental income 18 112 000 18 565 000 19 029 000 Total assets 306 382 000 307 125 000 306 911 000 307 060 000
Other rental income - - -
Administration expenses -540 000 -554 000 -567 000
Other operating expenses - - - Short-term liabilities - 1 352 000 1 322 000 1 292 000
EBITDA 17 572 000 18 011 000 18 462 000 Accrued Taxes - -1 863 000 -1 987 000 -2 093 000
Net financial expenses -6 245 000 -6 117 000 -5 981 000 Long-term liabilities 192 900 000 188 516 000 182 671 000 176 826 000
Estimated tax payable - -1 863 000 -1 987 000 Total Liabilities 192 900 000 188 005 000 182 006 000 176 025 000
Installments -4 384 000 -5 845 000 -5 845 000
Investments - - -
Dividends -6 200 000 -4 400 000 -4 500 000 NAV ex. MTM IRS2
113 482 000 119 120 000 124 905 000 131 035 000
Net cash flow 743 000 -214 000 149 000
Dividend yield (basis NAV) 5,5 % 3,9 % 4,0 % Note 1: adjusted for tax discount
Est. cash flow to equity (basis NAV) 10,0 % 8,8 % 9,2 % Note 2: after forecasted dividend payouts
ESTIMATED CASH FLOW TO EQUITY ESTIMATED VALUE AT 31.12.2017Net Yield 5,35 % 5,60 % 5,85 %
Property value 338 400 000 321 000 000 309 500 000
Tax discount 10 % -16 990 000 -15 300 000 -14 183 000
NPV other rental income - - -
Net debt -192 218 000 -192 218 000 -192 218 000
NAV ex. MTM IRS 129 192 000 113 482 000 103 099 000
MTM IRS (0 %) - - -
NAV 129 192 000 113 482 000 103 099 000
NAV per 1% ex. MTM IRS 1 292 000 1 135 000 1 031 000
NAV per 1% 1 292 000 1 135 000 1 031 000
DEBT STRUCTURE AT 31.12.2017 Property value per sq.m. 16 100 15 300 14 700
Balance Interest rate IRS maturity LTV (property value) 57 % 60 % 62 %
Tranche 1 58 400 000 2,30 % Floating LTV incl. Tax discount & MTM IRS 60 % 63 % 65 %
Tranche 2 134 500 000 3,60 % 09.01.2027
Long-term liabilities 192 900 000 3,21 % IRR since establishment ex./incl. MTM IRS n/a n/a n/a
Total return ex./incl. MTM IRS n/a n/a n/a
Est. cash flow to equity (avg. next 3 years) 8,2 % 9,4 % 10,3 %
COMMENT
[Insert bilde ]
15,3 yrs
Secondhand trade
Axel Bendvold
(+47) 22 93 63 46
MNOK 321 5,60 %
Project Broker
Axel Bendvold
1 135 000
The project was established in Q4 2017. The project consist of three properties, in
Sørlandsparken, Jessheim and Notodden.
Business Manager
Marianne Fossum
HANDELSEIENDOM INVEST AS Retail 31.12.2017
(+47) 22 93 63 46 (+47) 22 93 64 52
10,0 %8,8 % 9,2 %
-2 000 000
0
2 000 000
4 000 000
6 000 000
8 000 000
10 000 000
12 000 000
14 000 000
2018 2019 2020
Reduction MTM IRS
Net cash
Dividends
Installments
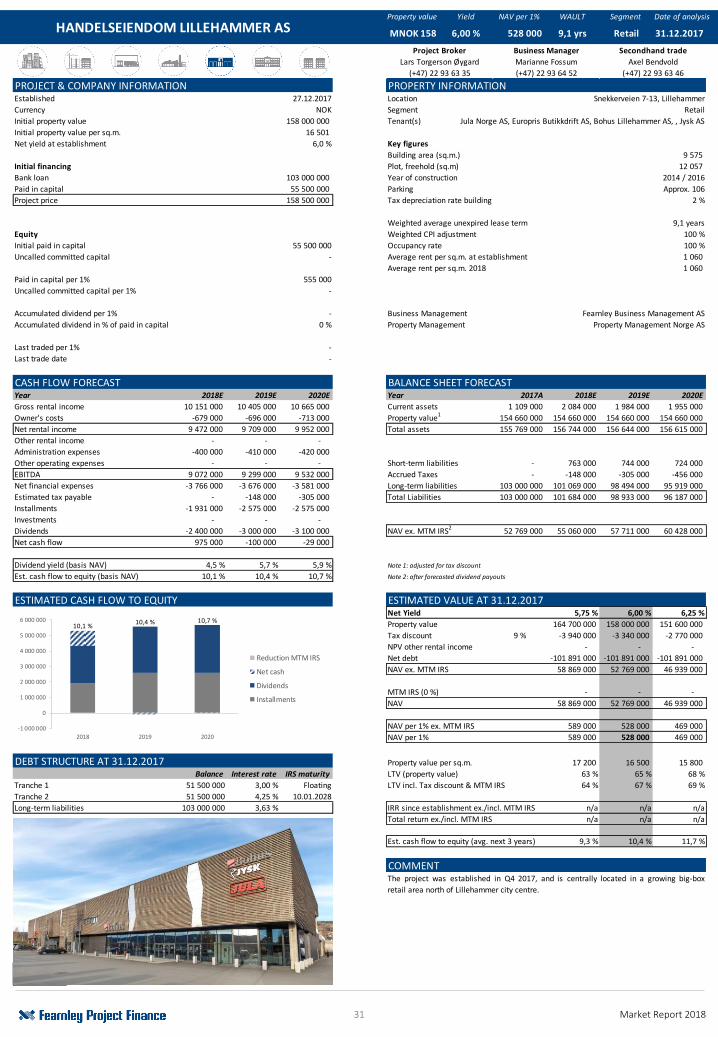
31 Market Report 2018
Property value Yield NAV per 1% WAULT Segment Date of analysis
PROJECT & COMPANY INFORMATION PROPERTY INFORMATIONEstablished 27.12.2017 Location Snekkerveien 7-13, Lillehammer
Currency NOK Segment Retail
Initial property value 158 000 000 Tenant(s) Jula Norge AS, Europris Butikkdrift AS, Bohus Lillehammer AS, , Jysk AS
Initial property value per sq.m. 16 501
Net yield at establishment 6,0 % Key figures
Building area (sq.m.) 9 575
Initial financing Plot, freehold (sq.m) 12 057
Bank loan 103 000 000 Year of construction 2014 / 2016
Paid in capital 55 500 000 Parking Approx. 106
Project price 158 500 000 Tax depreciation rate building 2 %
Weighted average unexpired lease term 9,1 years
Equity Weighted CPI adjustment 100 %
Initial paid in capital 55 500 000 Occupancy rate 100 %
Uncalled committed capital - Average rent per sq.m. at establishment 1 060
Average rent per sq.m. 2018 1 060
Paid in capital per 1% 555 000
Uncalled committed capital per 1% -
Accumulated dividend per 1% - Business Management Fearnley Business Management AS
Accumulated dividend in % of paid in capital 0 % Property Management Property Management Norge AS
Last traded per 1% -
Last trade date -
CASH FLOW FORECAST BALANCE SHEET FORECASTYear 2018E 2019E 2020E Year 2017A 2018E 2019E 2020E
Gross rental income 10 151 000 10 405 000 10 665 000 Current assets 1 109 000 2 084 000 1 984 000 1 955 000
Owner's costs -679 000 -696 000 -713 000 Property value1
154 660 000 154 660 000 154 660 000 154 660 000
Net rental income 9 472 000 9 709 000 9 952 000 Total assets 155 769 000 156 744 000 156 644 000 156 615 000
Other rental income - - -
Administration expenses -400 000 -410 000 -420 000
Other operating expenses - - - Short-term liabilities - 763 000 744 000 724 000
EBITDA 9 072 000 9 299 000 9 532 000 Accrued Taxes - -148 000 -305 000 -456 000
Net financial expenses -3 766 000 -3 676 000 -3 581 000 Long-term liabilities 103 000 000 101 069 000 98 494 000 95 919 000
Estimated tax payable - -148 000 -305 000 Total Liabilities 103 000 000 101 684 000 98 933 000 96 187 000
Installments -1 931 000 -2 575 000 -2 575 000
Investments - - -
Dividends -2 400 000 -3 000 000 -3 100 000 NAV ex. MTM IRS2
52 769 000 55 060 000 57 711 000 60 428 000
Net cash flow 975 000 -100 000 -29 000
Dividend yield (basis NAV) 4,5 % 5,7 % 5,9 % Note 1: adjusted for tax discount
Est. cash flow to equity (basis NAV) 10,1 % 10,4 % 10,7 % Note 2: after forecasted dividend payouts
ESTIMATED CASH FLOW TO EQUITY ESTIMATED VALUE AT 31.12.2017Net Yield 5,75 % 6,00 % 6,25 %
Property value 164 700 000 158 000 000 151 600 000
Tax discount 9 % -3 940 000 -3 340 000 -2 770 000
NPV other rental income - - -
Net debt -101 891 000 -101 891 000 -101 891 000
NAV ex. MTM IRS 58 869 000 52 769 000 46 939 000
MTM IRS (0 %) - - -
NAV 58 869 000 52 769 000 46 939 000
NAV per 1% ex. MTM IRS 589 000 528 000 469 000
NAV per 1% 589 000 528 000 469 000
DEBT STRUCTURE AT 31.12.2017 Property value per sq.m. 17 200 16 500 15 800
Balance Interest rate IRS maturity LTV (property value) 63 % 65 % 68 %
Tranche 1 51 500 000 3,00 % Floating LTV incl. Tax discount & MTM IRS 64 % 67 % 69 %
Tranche 2 51 500 000 4,25 % 10.01.2028
Long-term liabilities 103 000 000 3,63 % IRR since establishment ex./incl. MTM IRS n/a n/a n/a
Total return ex./incl. MTM IRS n/a n/a n/a
Est. cash flow to equity (avg. next 3 years) 9,3 % 10,4 % 11,7 %
COMMENT
[Insert bilde ]
(+47) 22 93 63 46
The project was established in Q4 2017, and is centrally located in a growing big-box
retail area north of Lillehammer city centre.
Project Broker Business Manager Secondhand trade
Lars Torgerson Øygard Marianne Fossum Axel Bendvold
HANDELSEIENDOM LILLEHAMMER AS Retail 31.12.2017
(+47) 22 93 63 35 (+47) 22 93 64 52
MNOK 158 6,00 % 528 000 9,1 yrs
10,1 %10,4 % 10,7 %
-1 000 000
0
1 000 000
2 000 000
3 000 000
4 000 000
5 000 000
6 000 000
2018 2019 2020
Reduction MTM IRS
Net cash
Dividends
Installments
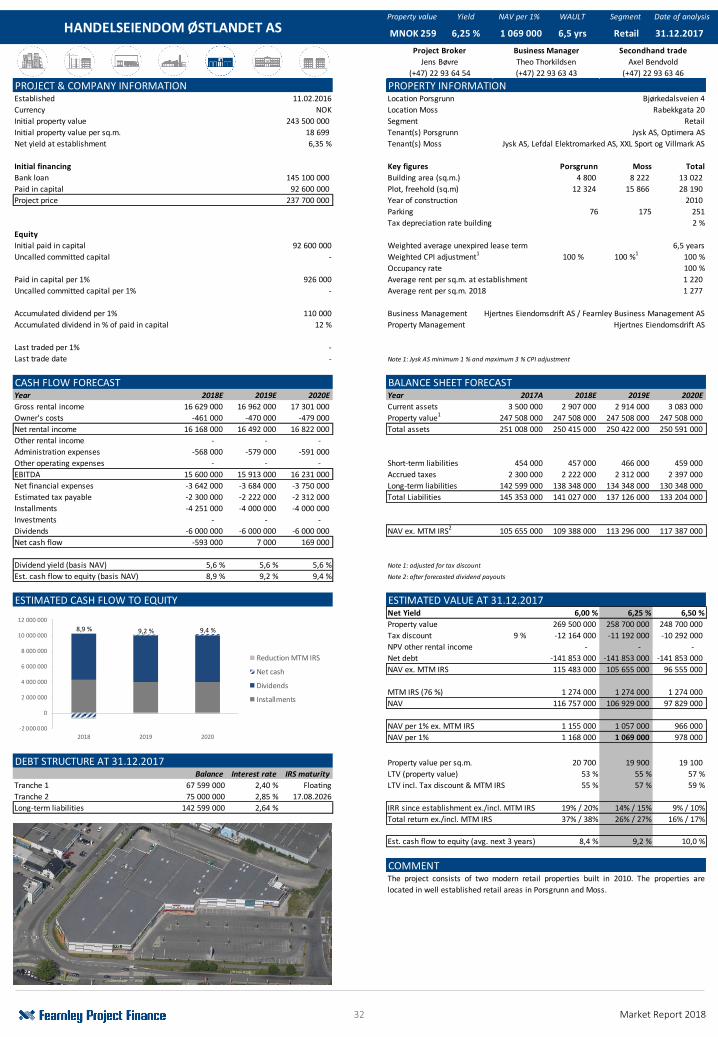
32 Market Report 2018
Property value Yield NAV per 1% WAULT Segment Date of analysis
PROJECT & COMPANY INFORMATION PROPERTY INFORMATIONEstablished 11.02.2016 Location Porsgrunn Bjørkedalsveien 4
Currency NOK Location Moss Rabekkgata 20
Initial property value 243 500 000 Segment Retail
Initial property value per sq.m. 18 699 Tenant(s) Porsgrunn Jysk AS, Optimera AS
Net yield at establishment 6,35 % Tenant(s) Moss Jysk AS, Lefdal Elektromarked AS, XXL Sport og Villmark AS
Initial financing Key figures Porsgrunn Moss Total
Bank loan 145 100 000 Building area (sq.m.) 4 800 8 222 13 022
Paid in capital 92 600 000 Plot, freehold (sq.m) 12 324 15 866 28 190
Project price 237 700 000 Year of construction 2010
Parking 76 175 251
Tax depreciation rate building 2 %
Equity
Initial paid in capital 92 600 000 Weighted average unexpired lease term 6,5 years
Uncalled committed capital - Weighted CPI adjustment1 100 % 100 %1 100 %
Occupancy rate 100 %
Paid in capital per 1% 926 000 Average rent per sq.m. at establishment 1 220
Uncalled committed capital per 1% - Average rent per sq.m. 2018 1 277
Accumulated dividend per 1% 110 000 Business Management Hjertnes Eiendomsdrift AS / Fearnley Business Management AS
Accumulated dividend in % of paid in capital 12 % Property Management Hjertnes Eiendomsdrift AS
Last traded per 1% -
Last trade date - Note 1: Jysk AS minimum 1 % and maximum 3 % CPI adjustment
CASH FLOW FORECAST BALANCE SHEET FORECASTYear 2018E 2019E 2020E Year 2017A 2018E 2019E 2020E
Gross rental income 16 629 000 16 962 000 17 301 000 Current assets 3 500 000 2 907 000 2 914 000 3 083 000
Owner's costs -461 000 -470 000 -479 000 Property value1
247 508 000 247 508 000 247 508 000 247 508 000
Net rental income 16 168 000 16 492 000 16 822 000 Total assets 251 008 000 250 415 000 250 422 000 250 591 000
Other rental income - - -
Administration expenses -568 000 -579 000 -591 000
Other operating expenses - - - Short-term liabilities 454 000 457 000 466 000 459 000
EBITDA 15 600 000 15 913 000 16 231 000 Accrued taxes 2 300 000 2 222 000 2 312 000 2 397 000
Net financial expenses -3 642 000 -3 684 000 -3 750 000 Long-term liabilities 142 599 000 138 348 000 134 348 000 130 348 000
Estimated tax payable -2 300 000 -2 222 000 -2 312 000 Total Liabilities 145 353 000 141 027 000 137 126 000 133 204 000
Installments -4 251 000 -4 000 000 -4 000 000
Investments - - -
Dividends -6 000 000 -6 000 000 -6 000 000 NAV ex. MTM IRS2
105 655 000 109 388 000 113 296 000 117 387 000
Net cash flow -593 000 7 000 169 000
Dividend yield (basis NAV) 5,6 % 5,6 % 5,6 % Note 1: adjusted for tax discount
Est. cash flow to equity (basis NAV) 8,9 % 9,2 % 9,4 % Note 2: after forecasted dividend payouts
ESTIMATED CASH FLOW TO EQUITY ESTIMATED VALUE AT 31.12.2017Net Yield 6,00 % 6,25 % 6,50 %
Property value 269 500 000 258 700 000 248 700 000
Tax discount 9 % -12 164 000 -11 192 000 -10 292 000
NPV other rental income - - -
Net debt -141 853 000 -141 853 000 -141 853 000
NAV ex. MTM IRS 115 483 000 105 655 000 96 555 000
MTM IRS (76 %) 1 274 000 1 274 000 1 274 000
NAV 116 757 000 106 929 000 97 829 000
NAV per 1% ex. MTM IRS 1 155 000 1 057 000 966 000
NAV per 1% 1 168 000 1 069 000 978 000
DEBT STRUCTURE AT 31.12.2017 Property value per sq.m. 20 700 19 900 19 100
Balance Interest rate IRS maturity LTV (property value) 53 % 55 % 57 %
Tranche 1 67 599 000 2,40 % Floating LTV incl. Tax discount & MTM IRS 55 % 57 % 59 %
Tranche 2 75 000 000 2,85 % 17.08.2026
Long-term liabilities 142 599 000 2,64 % IRR since establishment ex./incl. MTM IRS 19% / 20% 14% / 15% 9% / 10%
Total return ex./incl. MTM IRS 37% / 38% 26% / 27% 16% / 17%
Est. cash flow to equity (avg. next 3 years) 8,4 % 9,2 % 10,0 %
COMMENT
Retail 31.12.2017
(+47) 22 93 64 54 (+47) 22 93 63 43
MNOK 259 6,25 % 1 069 000 6,5 yrs
(+47) 22 93 63 46
The project consists of two modern retail properties built in 2010. The properties are
located in well established retail areas in Porsgrunn and Moss.
Project Broker Business Manager Secondhand trade
Jens Bøvre Theo Thorkildsen Axel Bendvold
HANDELSEIENDOM ØSTLANDET AS
8,9 % 9,2 % 9,4 %
-2 000 000
0
2 000 000
4 000 000
6 000 000
8 000 000
10 000 000
12 000 000
2018 2019 2020
Reduction MTM IRS
Net cash
Dividends
Installments
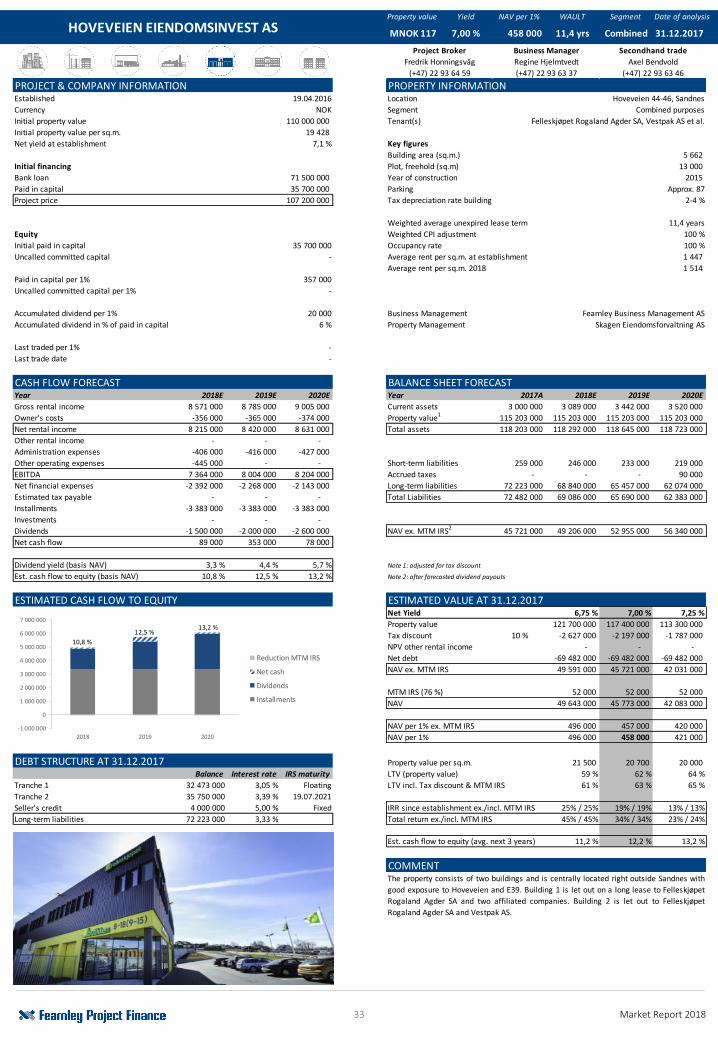
33 Market Report 2018
Property value Yield NAV per 1% WAULT Segment Date of analysis
PROJECT & COMPANY INFORMATION PROPERTY INFORMATIONEstablished 19.04.2016 Location Hoveveien 44-46, Sandnes
Currency NOK Segment Combined purposes
Initial property value 110 000 000 Tenant(s) Felleskjøpet Rogaland Agder SA, Vestpak AS et al.
Initial property value per sq.m. 19 428
Net yield at establishment 7,1 % Key figures
Building area (sq.m.) 5 662
Initial financing Plot, freehold (sq.m) 13 000
Bank loan 71 500 000 Year of construction 2015
Paid in capital 35 700 000 Parking Approx. 87
Project price 107 200 000 Tax depreciation rate building 2-4 %
Weighted average unexpired lease term 11,4 years
Equity Weighted CPI adjustment 100 %
Initial paid in capital 35 700 000 Occupancy rate 100 %
Uncalled committed capital - Average rent per sq.m. at establishment 1 447
Average rent per sq.m. 2018 1 514
Paid in capital per 1% 357 000
Uncalled committed capital per 1% -
Accumulated dividend per 1% 20 000 Business Management Fearnley Business Management AS
Accumulated dividend in % of paid in capital 6 % Property Management Skagen Eiendomsforvaltning AS
Last traded per 1% -
Last trade date -
CASH FLOW FORECAST BALANCE SHEET FORECASTYear 2018E 2019E 2020E Year 2017A 2018E 2019E 2020E
Gross rental income 8 571 000 8 785 000 9 005 000 Current assets 3 000 000 3 089 000 3 442 000 3 520 000
Owner's costs -356 000 -365 000 -374 000 Property value1
115 203 000 115 203 000 115 203 000 115 203 000
Net rental income 8 215 000 8 420 000 8 631 000 Total assets 118 203 000 118 292 000 118 645 000 118 723 000
Other rental income - - -
Administration expenses -406 000 -416 000 -427 000
Other operating expenses -445 000 - - Short-term liabilities 259 000 246 000 233 000 219 000
EBITDA 7 364 000 8 004 000 8 204 000 Accrued taxes - - - 90 000
Net financial expenses -2 392 000 -2 268 000 -2 143 000 Long-term liabilities 72 223 000 68 840 000 65 457 000 62 074 000
Estimated tax payable - - - Total Liabilities 72 482 000 69 086 000 65 690 000 62 383 000
Installments -3 383 000 -3 383 000 -3 383 000
Investments - - -
Dividends -1 500 000 -2 000 000 -2 600 000 NAV ex. MTM IRS2
45 721 000 49 206 000 52 955 000 56 340 000
Net cash flow 89 000 353 000 78 000
Dividend yield (basis NAV) 3,3 % 4,4 % 5,7 % Note 1: adjusted for tax discount
Est. cash flow to equity (basis NAV) 10,8 % 12,5 % 13,2 % Note 2: after forecasted dividend payouts
ESTIMATED CASH FLOW TO EQUITY ESTIMATED VALUE AT 31.12.2017Net Yield 6,75 % 7,00 % 7,25 %
Property value 121 700 000 117 400 000 113 300 000
Tax discount 10 % -2 627 000 -2 197 000 -1 787 000
NPV other rental income - - -
Net debt -69 482 000 -69 482 000 -69 482 000
NAV ex. MTM IRS 49 591 000 45 721 000 42 031 000
MTM IRS (76 %) 52 000 52 000 52 000
NAV 49 643 000 45 773 000 42 083 000
NAV per 1% ex. MTM IRS 496 000 457 000 420 000
NAV per 1% 496 000 458 000 421 000
DEBT STRUCTURE AT 31.12.2017 Property value per sq.m. 21 500 20 700 20 000
Balance Interest rate IRS maturity LTV (property value) 59 % 62 % 64 %
Tranche 1 32 473 000 3,05 % Floating LTV incl. Tax discount & MTM IRS 61 % 63 % 65 %
Tranche 2 35 750 000 3,39 % 19.07.2021
Seller's credit 4 000 000 5,00 % Fixed IRR since establishment ex./incl. MTM IRS 25% / 25% 19% / 19% 13% / 13%
Long-term liabilities 72 223 000 3,33 % Total return ex./incl. MTM IRS 45% / 45% 34% / 34% 23% / 24%
Est. cash flow to equity (avg. next 3 years) 11,2 % 12,2 % 13,2 %
COMMENT
(+47) 22 93 63 46
The property consists of two buildings and is centrally located right outside Sandnes with
good exposure to Hoveveien and E39. Building 1 is let out on a long lease to Felleskjøpet
Rogaland Agder SA and two affiliated companies. Building 2 is let out to Felleskjøpet
Rogaland Agder SA and Vestpak AS.
Project Broker Business Manager Secondhand trade
Fredrik Honningsvåg Regine Hjelmtvedt Axel Bendvold
HOVEVEIEN EIENDOMSINVEST AS Combined 31.12.2017
(+47) 22 93 64 59 (+47) 22 93 63 37
MNOK 117 7,00 % 458 000 11,4 yrs
10,8 %
12,5 %13,2 %
-1 000 000
0
1 000 000
2 000 000
3 000 000
4 000 000
5 000 000
6 000 000
7 000 000
2018 2019 2020
Reduction MTM IRS
Net cash
Dividends
Installments
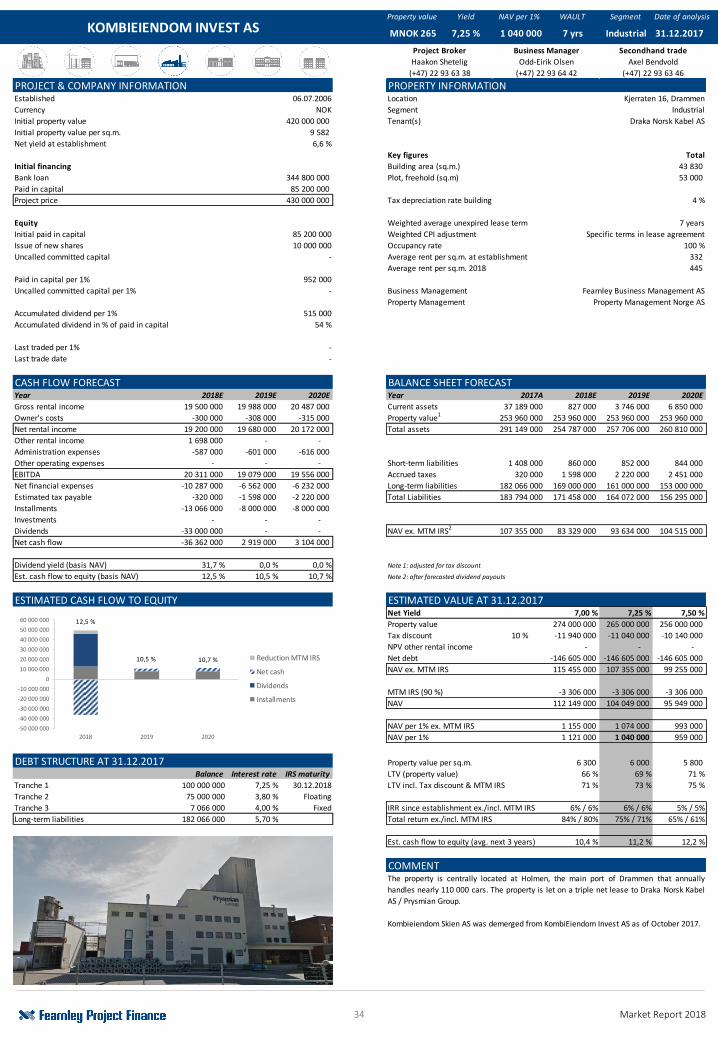
34 Market Report 2018
Property value Yield NAV per 1% WAULT Segment Date of analysis
PROJECT & COMPANY INFORMATION PROPERTY INFORMATIONEstablished 06.07.2006 Location Kjerraten 16, Drammen
Currency NOK Segment Industrial
Initial property value 420 000 000 Tenant(s) Draka Norsk Kabel AS
Initial property value per sq.m. 9 582
Net yield at establishment 6,6 %
Key figures Total
Initial financing Building area (sq.m.) 43 830
Bank loan 344 800 000 Plot, freehold (sq.m) 53 000
Paid in capital 85 200 000
Project price 430 000 000 Tax depreciation rate building 4 %
Equity Weighted average unexpired lease term 7 years
Initial paid in capital 85 200 000 Weighted CPI adjustment Specific terms in lease agreement
Issue of new shares 10 000 000 Occupancy rate 100 %
Uncalled committed capital - Average rent per sq.m. at establishment 332
Average rent per sq.m. 2018 445
Paid in capital per 1% 952 000
Uncalled committed capital per 1% - Business Management Fearnley Business Management AS
Property Management Property Management Norge AS
Accumulated dividend per 1% 515 000
Accumulated dividend in % of paid in capital 54 %
Last traded per 1% -
Last trade date -
CASH FLOW FORECAST BALANCE SHEET FORECASTYear 2018E 2019E 2020E Year 2017A 2018E 2019E 2020E
Gross rental income 19 500 000 19 988 000 20 487 000 Current assets 37 189 000 827 000 3 746 000 6 850 000
Owner's costs -300 000 -308 000 -315 000 Property value1
253 960 000 253 960 000 253 960 000 253 960 000
Net rental income 19 200 000 19 680 000 20 172 000 Total assets 291 149 000 254 787 000 257 706 000 260 810 000
Other rental income 1 698 000 - -
Administration expenses -587 000 -601 000 -616 000
Other operating expenses - - - Short-term liabilities 1 408 000 860 000 852 000 844 000
EBITDA 20 311 000 19 079 000 19 556 000 Accrued taxes 320 000 1 598 000 2 220 000 2 451 000
Net financial expenses -10 287 000 -6 562 000 -6 232 000 Long-term liabilities 182 066 000 169 000 000 161 000 000 153 000 000
Estimated tax payable -320 000 -1 598 000 -2 220 000 Total Liabilities 183 794 000 171 458 000 164 072 000 156 295 000
Installments -13 066 000 -8 000 000 -8 000 000
Investments - - -
Dividends -33 000 000 - - NAV ex. MTM IRS2
107 355 000 83 329 000 93 634 000 104 515 000
Net cash flow -36 362 000 2 919 000 3 104 000
Dividend yield (basis NAV) 31,7 % 0,0 % 0,0 % Note 1: adjusted for tax discount
Est. cash flow to equity (basis NAV) 12,5 % 10,5 % 10,7 % Note 2: after forecasted dividend payouts
ESTIMATED CASH FLOW TO EQUITY ESTIMATED VALUE AT 31.12.2017Net Yield 7,00 % 7,25 % 7,50 %
Property value 274 000 000 265 000 000 256 000 000
Tax discount 10 % -11 940 000 -11 040 000 -10 140 000
NPV other rental income - - -
Net debt -146 605 000 -146 605 000 -146 605 000
NAV ex. MTM IRS 115 455 000 107 355 000 99 255 000
MTM IRS (90 %) -3 306 000 -3 306 000 -3 306 000
NAV 112 149 000 104 049 000 95 949 000
NAV per 1% ex. MTM IRS 1 155 000 1 074 000 993 000
NAV per 1% 1 121 000 1 040 000 959 000
DEBT STRUCTURE AT 31.12.2017 Property value per sq.m. 6 300 6 000 5 800
Balance Interest rate IRS maturity LTV (property value) 66 % 69 % 71 %
Tranche 1 100 000 000 7,25 % 30.12.2018 LTV incl. Tax discount & MTM IRS 71 % 73 % 75 %
Tranche 2 75 000 000 3,80 % Floating
Tranche 3 7 066 000 4,00 % Fixed IRR since establishment ex./incl. MTM IRS 6% / 6% 6% / 6% 5% / 5%
Long-term liabilities 182 066 000 5,70 % Total return ex./incl. MTM IRS 84% / 80% 75% / 71% 65% / 61%
Est. cash flow to equity (avg. next 3 years) 10,4 % 11,2 % 12,2 %
COMMENT
(+47) 22 93 63 46
The property is centrally located at Holmen, the main port of Drammen that annually
handles nearly 110 000 cars. The property is let on a triple net lease to Draka Norsk Kabel
AS / Prysmian Group.
Kombieiendom Skien AS was demerged from KombiEiendom Invest AS as of October 2017.
Project Broker Business Manager Secondhand trade
Haakon Shetelig Odd-Eirik Olsen Axel Bendvold
KOMBIEIENDOM INVEST AS Industrial 31.12.2017
(+47) 22 93 63 38 (+47) 22 93 64 42
MNOK 265 7,25 % 1 040 000 7 yrs
12,5 %
10,5 % 10,7 %
-50 000 000
-40 000 000
-30 000 000
-20 000 000
-10 000 000
0
10 000 000
20 000 000
30 000 000
40 000 000
50 000 000
60 000 000
2018 2019 2020
Reduction MTM IRS
Net cash
Dividends
Installments
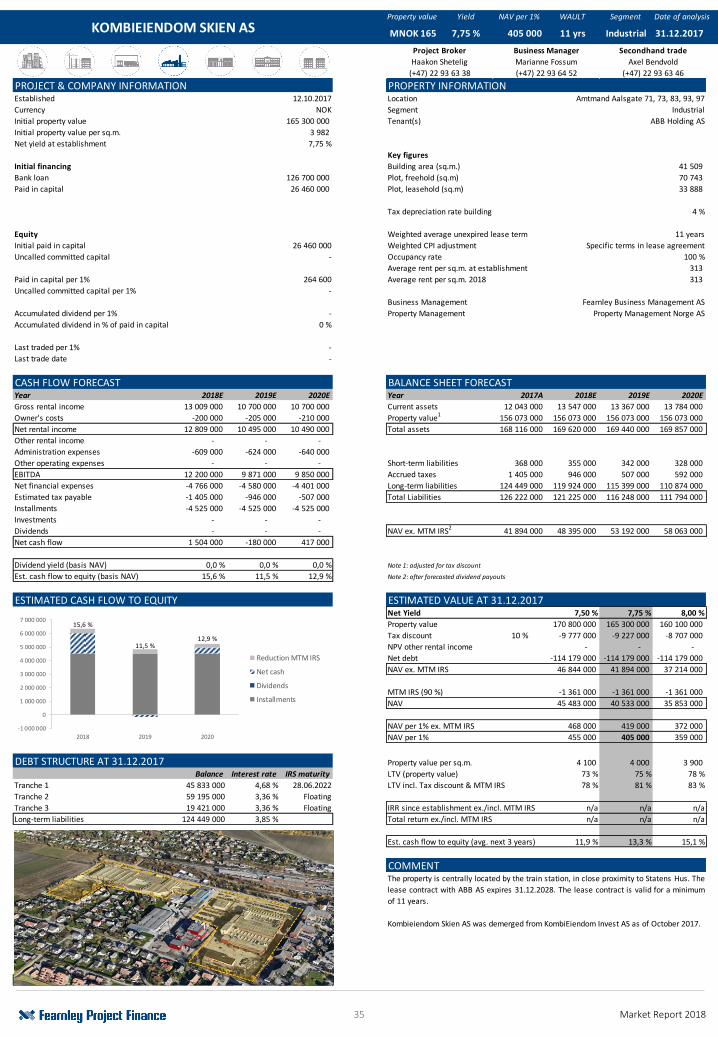
35 Market Report 2018
Property value Yield NAV per 1% WAULT Segment Date of analysis
PROJECT & COMPANY INFORMATION PROPERTY INFORMATIONEstablished 12.10.2017 Location Amtmand Aalsgate 71, 73, 83, 93, 97
Currency NOK Segment Industrial
Initial property value 165 300 000 Tenant(s) ABB Holding AS
Initial property value per sq.m. 3 982
Net yield at establishment 7,75 %
Key figures
Initial financing Building area (sq.m.) 41 509
Bank loan 126 700 000 Plot, freehold (sq.m) 70 743
Paid in capital 26 460 000 Plot, leasehold (sq.m) 33 888
Tax depreciation rate building 4 %
Equity Weighted average unexpired lease term 11 years
Initial paid in capital 26 460 000 Weighted CPI adjustment Specific terms in lease agreement
Uncalled committed capital - Occupancy rate 100 %
Average rent per sq.m. at establishment 313
Paid in capital per 1% 264 600 Average rent per sq.m. 2018 313
Uncalled committed capital per 1% -
Business Management Fearnley Business Management AS
Accumulated dividend per 1% - Property Management Property Management Norge AS
Accumulated dividend in % of paid in capital 0 %
Last traded per 1% -
Last trade date -
CASH FLOW FORECAST BALANCE SHEET FORECASTYear 2018E 2019E 2020E Year 2017A 2018E 2019E 2020E
Gross rental income 13 009 000 10 700 000 10 700 000 Current assets 12 043 000 13 547 000 13 367 000 13 784 000
Owner's costs -200 000 -205 000 -210 000 Property value1
156 073 000 156 073 000 156 073 000 156 073 000
Net rental income 12 809 000 10 495 000 10 490 000 Total assets 168 116 000 169 620 000 169 440 000 169 857 000
Other rental income - - -
Administration expenses -609 000 -624 000 -640 000
Other operating expenses - - - Short-term liabilities 368 000 355 000 342 000 328 000
EBITDA 12 200 000 9 871 000 9 850 000 Accrued taxes 1 405 000 946 000 507 000 592 000
Net financial expenses -4 766 000 -4 580 000 -4 401 000 Long-term liabilities 124 449 000 119 924 000 115 399 000 110 874 000
Estimated tax payable -1 405 000 -946 000 -507 000 Total Liabilities 126 222 000 121 225 000 116 248 000 111 794 000
Installments -4 525 000 -4 525 000 -4 525 000
Investments - - -
Dividends - - - NAV ex. MTM IRS2
41 894 000 48 395 000 53 192 000 58 063 000
Net cash flow 1 504 000 -180 000 417 000
Dividend yield (basis NAV) 0,0 % 0,0 % 0,0 % Note 1: adjusted for tax discount
Est. cash flow to equity (basis NAV) 15,6 % 11,5 % 12,9 % Note 2: after forecasted dividend payouts
ESTIMATED CASH FLOW TO EQUITY ESTIMATED VALUE AT 31.12.2017Net Yield 7,50 % 7,75 % 8,00 %
Property value 170 800 000 165 300 000 160 100 000
Tax discount 10 % -9 777 000 -9 227 000 -8 707 000
NPV other rental income - - -
Net debt -114 179 000 -114 179 000 -114 179 000
NAV ex. MTM IRS 46 844 000 41 894 000 37 214 000
MTM IRS (90 %) -1 361 000 -1 361 000 -1 361 000
NAV 45 483 000 40 533 000 35 853 000
NAV per 1% ex. MTM IRS 468 000 419 000 372 000
NAV per 1% 455 000 405 000 359 000
DEBT STRUCTURE AT 31.12.2017 Property value per sq.m. 4 100 4 000 3 900
Balance Interest rate IRS maturity LTV (property value) 73 % 75 % 78 %
Tranche 1 45 833 000 4,68 % 28.06.2022 LTV incl. Tax discount & MTM IRS 78 % 81 % 83 %
Tranche 2 59 195 000 3,36 % Floating
Tranche 3 19 421 000 3,36 % Floating IRR since establishment ex./incl. MTM IRS n/a n/a n/a
Long-term liabilities 124 449 000 3,85 % Total return ex./incl. MTM IRS n/a n/a n/a
Est. cash flow to equity (avg. next 3 years) 11,9 % 13,3 % 15,1 %
COMMENT
(+47) 22 93 63 46
The property is centrally located by the train station, in close proximity to Statens Hus. The
lease contract with ABB AS expires 31.12.2028. The lease contract is valid for a minimum
of 11 years.
Kombieiendom Skien AS was demerged from KombiEiendom Invest AS as of October 2017.
Project Broker Business Manager Secondhand trade
Haakon Shetelig Marianne Fossum Axel Bendvold
KOMBIEIENDOM SKIEN AS Industrial 31.12.2017
(+47) 22 93 63 38 (+47) 22 93 64 52
MNOK 165 7,75 % 405 000 11 yrs
15,6 %
11,5 %12,9 %
-1 000 000
0
1 000 000
2 000 000
3 000 000
4 000 000
5 000 000
6 000 000
7 000 000
2018 2019 2020
Reduction MTM IRS
Net cash
Dividends
Installments
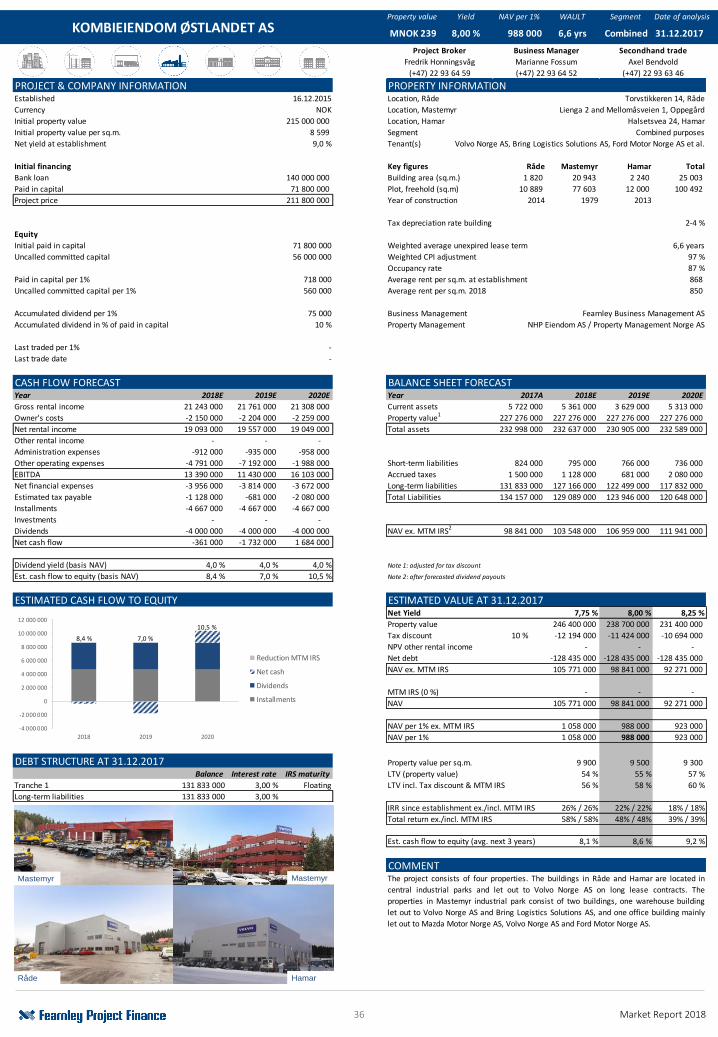
36 Market Report 2018
Property value Yield NAV per 1% WAULT Segment Date of analysis
PROJECT & COMPANY INFORMATION PROPERTY INFORMATIONEstablished 16.12.2015 Location, Råde Torvstikkeren 14, Råde
Currency NOK Location, Mastemyr Lienga 2 and Mellomåsveien 1, Oppegård
Initial property value 215 000 000 Location, Hamar Halsetsvea 24, Hamar
Initial property value per sq.m. 8 599 Segment Combined purposes
Net yield at establishment 9,0 % Tenant(s) Volvo Norge AS, Bring Logistics Solutions AS, Ford Motor Norge AS et al.
Initial financing Key figures Råde Mastemyr Hamar Total
Bank loan 140 000 000 Building area (sq.m.) 1 820 20 943 2 240 25 003
Paid in capital 71 800 000 Plot, freehold (sq.m) 10 889 77 603 12 000 100 492
Project price 211 800 000 Year of construction 2014 1979 2013
Tax depreciation rate building 2-4 %
Equity
Initial paid in capital 71 800 000 Weighted average unexpired lease term 6,6 years
Uncalled committed capital 56 000 000 Weighted CPI adjustment 97 %
Occupancy rate 87 %
Paid in capital per 1% 718 000 Average rent per sq.m. at establishment 868
Uncalled committed capital per 1% 560 000 Average rent per sq.m. 2018 850
Accumulated dividend per 1% 75 000 Business Management Fearnley Business Management AS
Accumulated dividend in % of paid in capital 10 % Property Management NHP Eiendom AS / Property Management Norge AS
Last traded per 1% -
Last trade date -
CASH FLOW FORECAST BALANCE SHEET FORECASTYear 2018E 2019E 2020E Year 2017A 2018E 2019E 2020E
Gross rental income 21 243 000 21 761 000 21 308 000 Current assets 5 722 000 5 361 000 3 629 000 5 313 000
Owner's costs -2 150 000 -2 204 000 -2 259 000 Property value1
227 276 000 227 276 000 227 276 000 227 276 000
Net rental income 19 093 000 19 557 000 19 049 000 Total assets 232 998 000 232 637 000 230 905 000 232 589 000
Other rental income - - -
Administration expenses -912 000 -935 000 -958 000
Other operating expenses -4 791 000 -7 192 000 -1 988 000 Short-term liabilities 824 000 795 000 766 000 736 000
EBITDA 13 390 000 11 430 000 16 103 000 Accrued taxes 1 500 000 1 128 000 681 000 2 080 000
Net financial expenses -3 956 000 -3 814 000 -3 672 000 Long-term liabilities 131 833 000 127 166 000 122 499 000 117 832 000
Estimated tax payable -1 128 000 -681 000 -2 080 000 Total Liabilities 134 157 000 129 089 000 123 946 000 120 648 000
Installments -4 667 000 -4 667 000 -4 667 000
Investments - - -
Dividends -4 000 000 -4 000 000 -4 000 000 NAV ex. MTM IRS2
98 841 000 103 548 000 106 959 000 111 941 000
Net cash flow -361 000 -1 732 000 1 684 000
Dividend yield (basis NAV) 4,0 % 4,0 % 4,0 % Note 1: adjusted for tax discount
Est. cash flow to equity (basis NAV) 8,4 % 7,0 % 10,5 % Note 2: after forecasted dividend payouts
ESTIMATED CASH FLOW TO EQUITY ESTIMATED VALUE AT 31.12.2017Net Yield 7,75 % 8,00 % 8,25 %
Property value 246 400 000 238 700 000 231 400 000
Tax discount 10 % -12 194 000 -11 424 000 -10 694 000
NPV other rental income - - -
Net debt -128 435 000 -128 435 000 -128 435 000
NAV ex. MTM IRS 105 771 000 98 841 000 92 271 000
MTM IRS (0 %) - - -
NAV 105 771 000 98 841 000 92 271 000
NAV per 1% ex. MTM IRS 1 058 000 988 000 923 000
NAV per 1% 1 058 000 988 000 923 000
DEBT STRUCTURE AT 31.12.2017 Property value per sq.m. 9 900 9 500 9 300
Balance Interest rate IRS maturity LTV (property value) 54 % 55 % 57 %
Tranche 1 131 833 000 3,00 % Floating LTV incl. Tax discount & MTM IRS 56 % 58 % 60 %
Long-term liabilities 131 833 000 3,00 %
IRR since establishment ex./incl. MTM IRS 26% / 26% 22% / 22% 18% / 18%
Total return ex./incl. MTM IRS 58% / 58% 48% / 48% 39% / 39%
Est. cash flow to equity (avg. next 3 years) 8,1 % 8,6 % 9,2 %
COMMENT
Combined 31.12.2017
(+47) 22 93 64 59 (+47) 22 93 64 52
MNOK 239 8,00 % 988 000 6,6 yrs
(+47) 22 93 63 46
The project consists of four properties. The buildings in Råde and Hamar are located in
central industrial parks and let out to Volvo Norge AS on long lease contracts. The
properties in Mastemyr industrial park consist of two buildings, one warehouse building
let out to Volvo Norge AS and Bring Logistics Solutions AS, and one office building mainly
let out to Mazda Motor Norge AS, Volvo Norge AS and Ford Motor Norge AS.
Project Broker Business Manager Secondhand trade
Fredrik Honningsvåg Marianne Fossum Axel Bendvold
KOMBIEIENDOM ØSTLANDET AS
8,4 % 7,0 %
10,5 %
-4 000 000
-2 000 000
0
2 000 000
4 000 000
6 000 000
8 000 000
10 000 000
12 000 000
2018 2019 2020
Reduction MTM IRS
Net cash
Dividends
Installments
Råde
Mastemyr
Hamar
Mastemyr
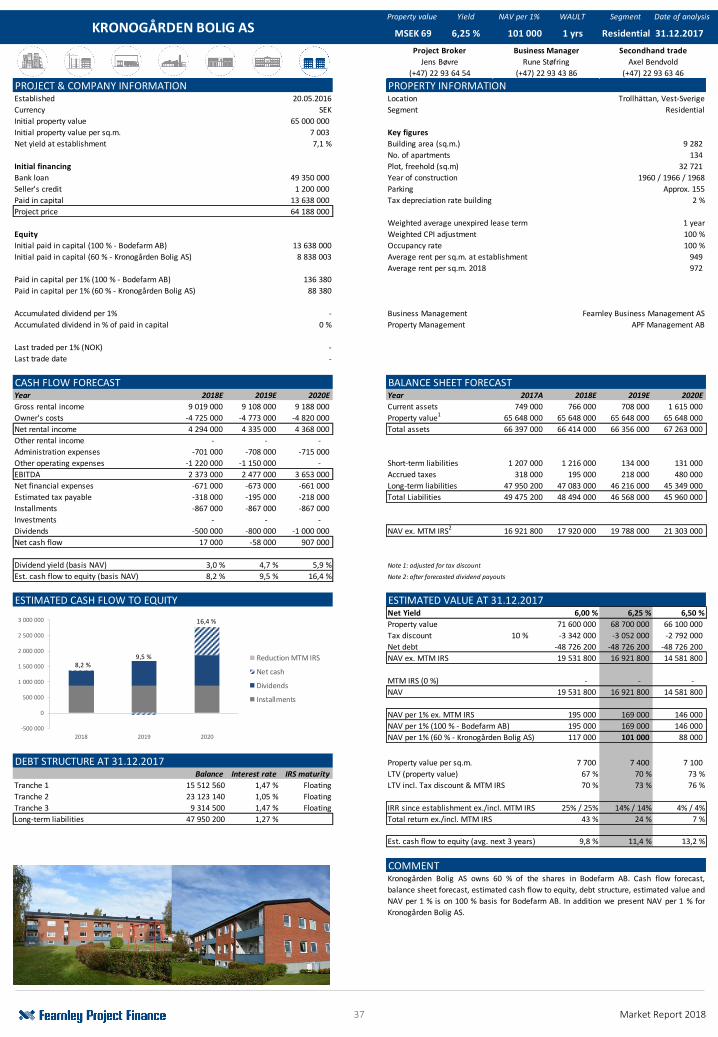
37 Market Report 2018
Property value Yield NAV per 1% WAULT Segment Date of analysis
PROJECT & COMPANY INFORMATION PROPERTY INFORMATIONEstablished 20.05.2016 Location Trollhättan, Vest-Sverige
Currency SEK Segment Residential
Initial property value 65 000 000
Initial property value per sq.m. 7 003 Key figures
Net yield at establishment 7,1 % Building area (sq.m.) 9 282
No. of apartments 134
Initial financing Plot, freehold (sq.m) 32 721
Bank loan 49 350 000 Year of construction 1960 / 1966 / 1968
Seller's credit 1 200 000 Parking Approx. 155
Paid in capital 13 638 000 Tax depreciation rate building 2 %
Project price 64 188 000
Weighted average unexpired lease term 1 year
Equity Weighted CPI adjustment 100 %
Initial paid in capital (100 % - Bodefarm AB) 13 638 000 Occupancy rate 100 %
Initial paid in capital (60 % - Kronogården Bolig AS) 8 838 003 Average rent per sq.m. at establishment 949
Average rent per sq.m. 2018 972
Paid in capital per 1% (100 % - Bodefarm AB) 136 380
Paid in capital per 1% (60 % - Kronogården Bolig AS) 88 380
Accumulated dividend per 1% - Business Management Fearnley Business Management AS
Accumulated dividend in % of paid in capital 0 % Property Management APF Management AB
Last traded per 1% (NOK) -
Last trade date -
CASH FLOW FORECAST BALANCE SHEET FORECASTYear 2018E 2019E 2020E Year 2017A 2018E 2019E 2020E
Gross rental income 9 019 000 9 108 000 9 188 000 Current assets 749 000 766 000 708 000 1 615 000
Owner's costs -4 725 000 -4 773 000 -4 820 000 Property value1
65 648 000 65 648 000 65 648 000 65 648 000
Net rental income 4 294 000 4 335 000 4 368 000 Total assets 66 397 000 66 414 000 66 356 000 67 263 000
Other rental income - - -
Administration expenses -701 000 -708 000 -715 000
Other operating expenses -1 220 000 -1 150 000 - Short-term liabilities 1 207 000 1 216 000 134 000 131 000
EBITDA 2 373 000 2 477 000 3 653 000 Accrued taxes 318 000 195 000 218 000 480 000
Net financial expenses -671 000 -673 000 -661 000 Long-term liabilities 47 950 200 47 083 000 46 216 000 45 349 000
Estimated tax payable -318 000 -195 000 -218 000 Total Liabilities 49 475 200 48 494 000 46 568 000 45 960 000
Installments -867 000 -867 000 -867 000
Investments - - -
Dividends -500 000 -800 000 -1 000 000 NAV ex. MTM IRS2
16 921 800 17 920 000 19 788 000 21 303 000
Net cash flow 17 000 -58 000 907 000
Dividend yield (basis NAV) 3,0 % 4,7 % 5,9 % Note 1: adjusted for tax discount
Est. cash flow to equity (basis NAV) 8,2 % 9,5 % 16,4 % Note 2: after forecasted dividend payouts
ESTIMATED CASH FLOW TO EQUITY ESTIMATED VALUE AT 31.12.2017Net Yield 6,00 % 6,25 % 6,50 %
Property value 71 600 000 68 700 000 66 100 000
Tax discount 10 % -3 342 000 -3 052 000 -2 792 000
Net debt -48 726 200 -48 726 200 -48 726 200
NAV ex. MTM IRS 19 531 800 16 921 800 14 581 800
MTM IRS (0 %) - - -
NAV 19 531 800 16 921 800 14 581 800
NAV per 1% ex. MTM IRS 195 000 169 000 146 000
NAV per 1% (100 % - Bodefarm AB) 195 000 169 000 146 000
NAV per 1% (60 % - Kronogården Bolig AS) 117 000 101 000 88 000
DEBT STRUCTURE AT 31.12.2017 Property value per sq.m. 7 700 7 400 7 100
Balance Interest rate IRS maturity LTV (property value) 67 % 70 % 73 %
Tranche 1 15 512 560 1,47 % Floating LTV incl. Tax discount & MTM IRS 70 % 73 % 76 %
Tranche 2 23 123 140 1,05 % Floating
Tranche 3 9 314 500 1,47 % Floating IRR since establishment ex./incl. MTM IRS 25% / 25% 14% / 14% 4% / 4%
Long-term liabilities 47 950 200 1,27 % Total return ex./incl. MTM IRS 43 % 24 % 7 %
Est. cash flow to equity (avg. next 3 years) 9,8 % 11,4 % 13,2 %
COMMENT
(+47) 22 93 63 46
Kronogården Bolig AS owns 60 % of the shares in Bodefarm AB. Cash flow forecast,
balance sheet forecast, estimated cash flow to equity, debt structure, estimated value and
NAV per 1 % is on 100 % basis for Bodefarm AB. In addition we present NAV per 1 % for
Kronogården Bolig AS.
Project Broker Business Manager Secondhand trade
Jens Bøvre Rune Støfring Axel Bendvold
KRONOGÅRDEN BOLIG AS Residential 31.12.2017
(+47) 22 93 64 54 (+47) 22 93 43 86
MSEK 69 6,25 % 101 000 1 yrs
8,2 %9,5 %
16,4 %
-500 000
0
500 000
1 000 000
1 500 000
2 000 000
2 500 000
3 000 000
2018 2019 2020
Reduction MTM IRS
Net cash
Dividends
Installments
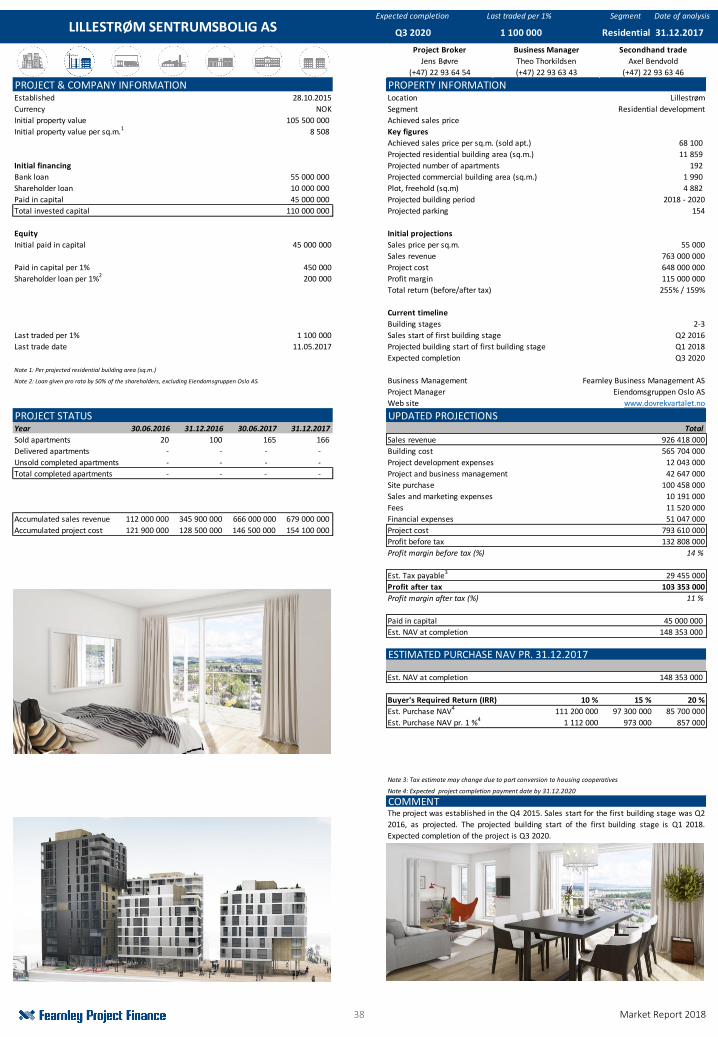
38 Market Report 2018
Expected completion Last traded per 1% Segment Date of analysis
PROJECT & COMPANY INFORMATION PROPERTY INFORMATIONEstablished 28.10.2015 Location Lillestrøm
Currency NOK Segment Residential development
Initial property value 105 500 000 Achieved sales price
Initial property value per sq.m.1 8 508 Key figures
Achieved sales price per sq.m. (sold apt.) 68 100
Projected residential building area (sq.m.) 11 859
Initial financing Projected number of apartments 192
Bank loan 55 000 000 Projected commercial building area (sq.m.) 1 990
Shareholder loan 10 000 000 Plot, freehold (sq.m) 4 882
Paid in capital 45 000 000 Projected building period 2018 - 2020
Total invested capital 110 000 000 Projected parking 154
Equity Initial projections
Initial paid in capital 45 000 000 Sales price per sq.m. 55 000
Sales revenue 763 000 000
Paid in capital per 1% 450 000 Project cost 648 000 000
Shareholder loan per 1%2 200 000 Profit margin 115 000 000
Total return (before/after tax) 255% / 159%
Current timeline
Building stages 2-3
Last traded per 1% 1 100 000 Sales start of first building stage Q2 2016
Last trade date 11.05.2017 Projected building start of first building stage Q1 2018
Expected completion Q3 2020
Note 1: Per projected residential building area (sq.m.)
Note 2: Loan given pro rata by 50% of the shareholders, excluding Eiendomsgruppen Oslo AS. Business Management Fearnley Business Management AS
Project Manager Eiendomsgruppen Oslo AS
Web site www.dovrekvartalet.no
PROJECT STATUS UPDATED PROJECTIONSYear 30.06.2016 31.12.2016 30.06.2017 31.12.2017 Total
Sold apartments 20 100 165 166 Sales revenue 926 418 000
Delivered apartments - - - - Building cost 565 704 000
Unsold completed apartments - - - - Project development expenses 12 043 000
Total completed apartments - - - - Project and business management 42 647 000
Site purchase 100 458 000
Sales price per sq.m. sold 64 200 Sales and marketing expenses 10 191 000
Fees 11 520 000
Accumulated sales revenue 112 000 000 345 900 000 666 000 000 679 000 000 Financial expenses 51 047 000
Accumulated project cost 121 900 000 128 500 000 146 500 000 154 100 000 Project cost 793 610 000
Profit before tax 132 808 000
Profit margin before tax (%) 14 %
Est. Tax payable3 29 455 000
Profit after tax 103 353 000
Profit margin after tax (%) 11 %
Paid in capital 45 000 000
Est. NAV at completion 148 353 000
ESTIMATED PURCHASE NAV PR. 31.12.2017
Est. NAV at completion 148 353 000
Buyer's Required Return (IRR) 10 % 15 % 20 %
Est. Purchase NAV4
111 200 000 97 300 000 85 700 000
Est. Purchase NAV pr. 1 %4
1 112 000 973 000 857 000
Note 3: Tax estimate may change due to part conversion to housing cooperatives
Note 4: Expected project completion payment date by 31.12.2020
COMMENT
LILLESTRØM SENTRUMSBOLIG AS
Jens Bøvre
Secondhand trade
Axel Bendvold
Project Broker Business Manager
The project was established in the Q4 2015. Sales start for the first building stage was Q2
2016, as projected. The projected building start of the first building stage is Q1 2018.
Expected completion of the project is Q3 2020.
Q3 2020
(+47) 22 93 63 46
1 100 000 Residential 31.12.2017
Theo Thorkildsen
(+47) 22 93 64 54 (+47) 22 93 63 43
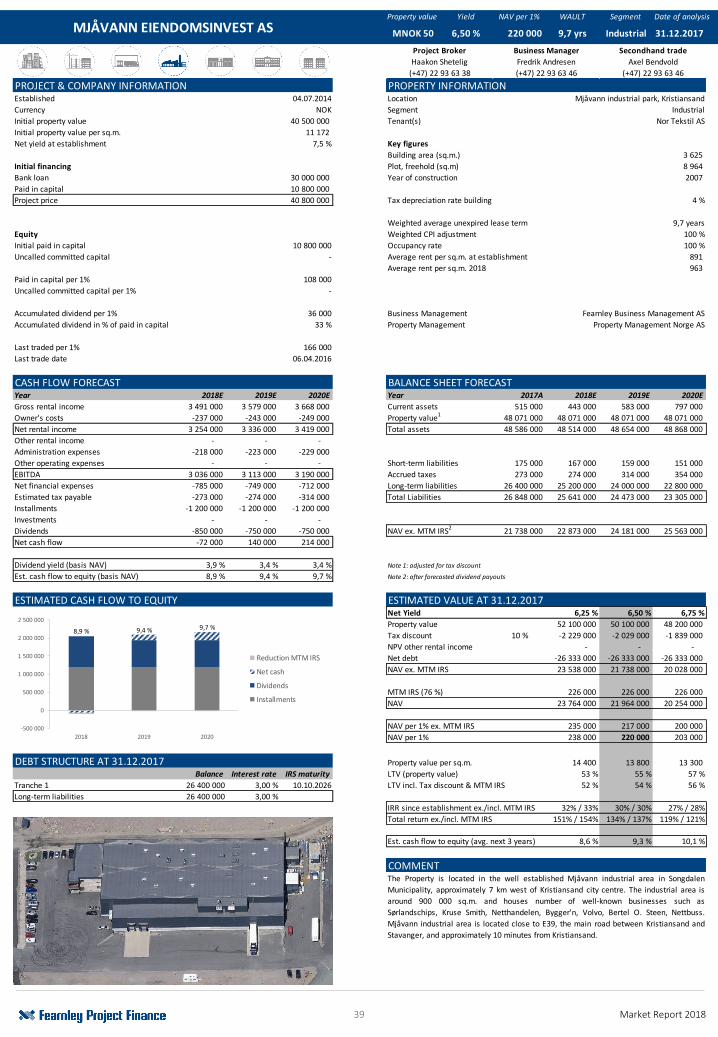
39 Market Report 2018
Property value Yield NAV per 1% WAULT Segment Date of analysis
PROJECT & COMPANY INFORMATION PROPERTY INFORMATIONEstablished 04.07.2014 Location Mjåvann industrial park, Kristiansand
Currency NOK Segment Industrial
Initial property value 40 500 000 Tenant(s) Nor Tekstil AS
Initial property value per sq.m. 11 172
Net yield at establishment 7,5 % Key figures
Building area (sq.m.) 3 625
Initial financing Plot, freehold (sq.m) 8 964
Bank loan 30 000 000 Year of construction 2007
Paid in capital 10 800 000
Project price 40 800 000 Tax depreciation rate building 4 %
Weighted average unexpired lease term 9,7 years
Equity Weighted CPI adjustment 100 %
Initial paid in capital 10 800 000 Occupancy rate 100 %
Uncalled committed capital - Average rent per sq.m. at establishment 891
Average rent per sq.m. 2018 963
Paid in capital per 1% 108 000
Uncalled committed capital per 1% -
Accumulated dividend per 1% 36 000 Business Management Fearnley Business Management AS
Accumulated dividend in % of paid in capital 33 % Property Management Property Management Norge AS
Last traded per 1% 166 000
Last trade date 06.04.2016
CASH FLOW FORECAST BALANCE SHEET FORECASTYear 2018E 2019E 2020E Year 2017A 2018E 2019E 2020E
Gross rental income 3 491 000 3 579 000 3 668 000 Current assets 515 000 443 000 583 000 797 000
Owner's costs -237 000 -243 000 -249 000 Property value1
48 071 000 48 071 000 48 071 000 48 071 000
Net rental income 3 254 000 3 336 000 3 419 000 Total assets 48 586 000 48 514 000 48 654 000 48 868 000
Other rental income - - -
Administration expenses -218 000 -223 000 -229 000
Other operating expenses - - - Short-term liabilities 175 000 167 000 159 000 151 000
EBITDA 3 036 000 3 113 000 3 190 000 Accrued taxes 273 000 274 000 314 000 354 000
Net financial expenses -785 000 -749 000 -712 000 Long-term liabilities 26 400 000 25 200 000 24 000 000 22 800 000
Estimated tax payable -273 000 -274 000 -314 000 Total Liabilities 26 848 000 25 641 000 24 473 000 23 305 000
Installments -1 200 000 -1 200 000 -1 200 000
Investments - - -
Dividends -850 000 -750 000 -750 000 NAV ex. MTM IRS2
21 738 000 22 873 000 24 181 000 25 563 000
Net cash flow -72 000 140 000 214 000
Dividend yield (basis NAV) 3,9 % 3,4 % 3,4 % Note 1: adjusted for tax discount
Est. cash flow to equity (basis NAV) 8,9 % 9,4 % 9,7 % Note 2: after forecasted dividend payouts
ESTIMATED CASH FLOW TO EQUITY ESTIMATED VALUE AT 31.12.2017Net Yield 6,25 % 6,50 % 6,75 %
Property value 52 100 000 50 100 000 48 200 000
Tax discount 10 % -2 229 000 -2 029 000 -1 839 000
NPV other rental income - - -
Net debt -26 333 000 -26 333 000 -26 333 000
NAV ex. MTM IRS 23 538 000 21 738 000 20 028 000
MTM IRS (76 %) 226 000 226 000 226 000
NAV 23 764 000 21 964 000 20 254 000
NAV per 1% ex. MTM IRS 235 000 217 000 200 000
NAV per 1% 238 000 220 000 203 000
DEBT STRUCTURE AT 31.12.2017 Property value per sq.m. 14 400 13 800 13 300
Balance Interest rate IRS maturity LTV (property value) 53 % 55 % 57 %
Tranche 1 26 400 000 3,00 % 10.10.2026 LTV incl. Tax discount & MTM IRS 52 % 54 % 56 %
Long-term liabilities 26 400 000 3,00 %
IRR since establishment ex./incl. MTM IRS 32% / 33% 30% / 30% 27% / 28%
Total return ex./incl. MTM IRS 151% / 154% 134% / 137% 119% / 121%
Est. cash flow to equity (avg. next 3 years) 8,6 % 9,3 % 10,1 %
COMMENT
(+47) 22 93 63 46
The Property is located in the well established Mjåvann industrial area in Songdalen
Municipality, approximately 7 km west of Kristiansand city centre. The industrial area is
around 900 000 sq.m. and houses number of well-known businesses such as
Sørlandschips, Kruse Smith, Netthandelen, Bygger'n, Volvo, Bertel O. Steen, Nettbuss.
Mjåvann industrial area is located close to E39, the main road between Kristiansand and
Stavanger, and approximately 10 minutes from Kristiansand.
Project Broker Business Manager Secondhand trade
Haakon Shetelig Fredrik Andresen Axel Bendvold
MJÅVANN EIENDOMSINVEST AS Industrial 31.12.2017
(+47) 22 93 63 38 (+47) 22 93 63 46
MNOK 50 6,50 % 220 000 9,7 yrs
8,9 % 9,4 % 9,7 %
-500 000
0
500 000
1 000 000
1 500 000
2 000 000
2 500 000
2018 2019 2020
Reduction MTM IRS
Net cash
Dividends
Installments
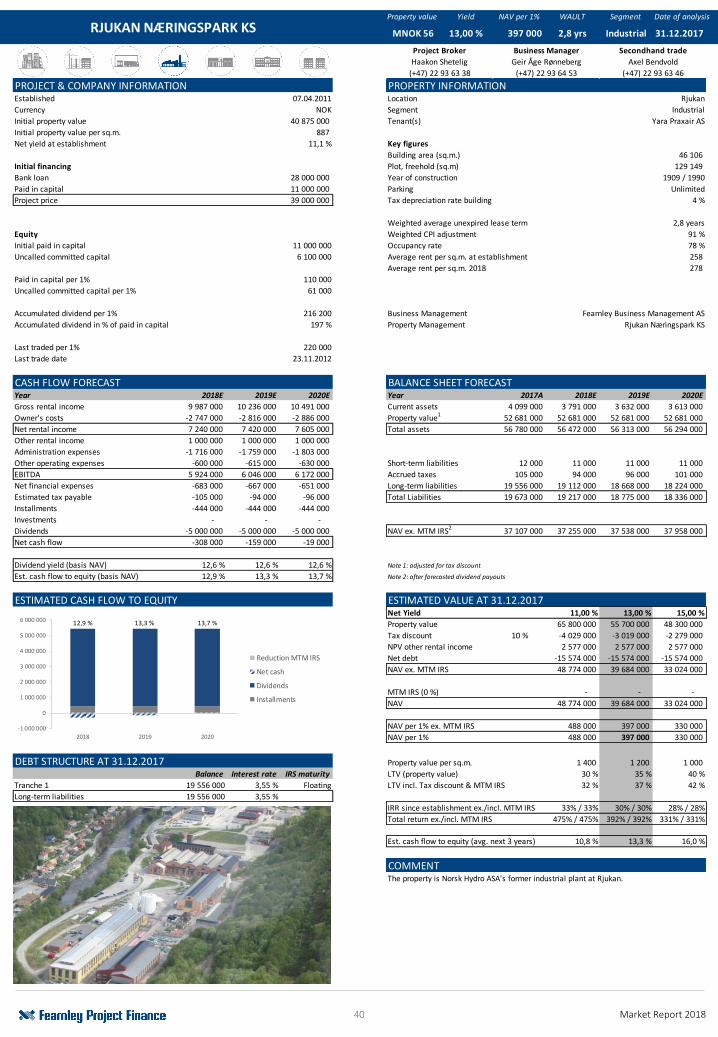
40 Market Report 2018
Property value Yield NAV per 1% WAULT Segment Date of analysis
PROJECT & COMPANY INFORMATION PROPERTY INFORMATIONEstablished 07.04.2011 Location Rjukan
Currency NOK Segment Industrial
Initial property value 40 875 000 Tenant(s) Yara Praxair AS
Initial property value per sq.m. 887
Net yield at establishment 11,1 % Key figures
Building area (sq.m.) 46 106
Initial financing Plot, freehold (sq.m) 129 149
Bank loan 28 000 000 Year of construction 1909 / 1990
Paid in capital 11 000 000 Parking Unlimited
Project price 39 000 000 Tax depreciation rate building 4 %
Weighted average unexpired lease term 2,8 years
Equity Weighted CPI adjustment 91 %
Initial paid in capital 11 000 000 Occupancy rate 78 %
Uncalled committed capital 6 100 000 Average rent per sq.m. at establishment 258
Average rent per sq.m. 2018 278
Paid in capital per 1% 110 000
Uncalled committed capital per 1% 61 000
Accumulated dividend per 1% 216 200 Business Management Fearnley Business Management AS
Accumulated dividend in % of paid in capital 197 % Property Management Rjukan Næringspark KS
Last traded per 1% 220 000
Last trade date 23.11.2012
CASH FLOW FORECAST BALANCE SHEET FORECASTYear 2018E 2019E 2020E Year 2017A 2018E 2019E 2020E
Gross rental income 9 987 000 10 236 000 10 491 000 Current assets 4 099 000 3 791 000 3 632 000 3 613 000
Owner's costs -2 747 000 -2 816 000 -2 886 000 Property value1
52 681 000 52 681 000 52 681 000 52 681 000
Net rental income 7 240 000 7 420 000 7 605 000 Total assets 56 780 000 56 472 000 56 313 000 56 294 000
Other rental income 1 000 000 1 000 000 1 000 000
Administration expenses -1 716 000 -1 759 000 -1 803 000
Other operating expenses -600 000 -615 000 -630 000 Short-term liabilities 12 000 11 000 11 000 11 000
EBITDA 5 924 000 6 046 000 6 172 000 Accrued taxes 105 000 94 000 96 000 101 000
Net financial expenses -683 000 -667 000 -651 000 Long-term liabilities 19 556 000 19 112 000 18 668 000 18 224 000
Estimated tax payable -105 000 -94 000 -96 000 Total Liabilities 19 673 000 19 217 000 18 775 000 18 336 000
Installments -444 000 -444 000 -444 000
Investments - - -
Dividends -5 000 000 -5 000 000 -5 000 000 NAV ex. MTM IRS2
37 107 000 37 255 000 37 538 000 37 958 000
Net cash flow -308 000 -159 000 -19 000
Dividend yield (basis NAV) 12,6 % 12,6 % 12,6 % Note 1: adjusted for tax discount
Est. cash flow to equity (basis NAV) 12,9 % 13,3 % 13,7 % Note 2: after forecasted dividend payouts
ESTIMATED CASH FLOW TO EQUITY ESTIMATED VALUE AT 31.12.2017Net Yield 11,00 % 13,00 % 15,00 %
Property value 65 800 000 55 700 000 48 300 000
Tax discount 10 % -4 029 000 -3 019 000 -2 279 000
NPV other rental income 2 577 000 2 577 000 2 577 000
Net debt -15 574 000 -15 574 000 -15 574 000
NAV ex. MTM IRS 48 774 000 39 684 000 33 024 000
MTM IRS (0 %) - - -
NAV 48 774 000 39 684 000 33 024 000
NAV per 1% ex. MTM IRS 488 000 397 000 330 000
NAV per 1% 488 000 397 000 330 000
DEBT STRUCTURE AT 31.12.2017 Property value per sq.m. 1 400 1 200 1 000
Balance Interest rate IRS maturity LTV (property value) 30 % 35 % 40 %
Tranche 1 19 556 000 3,55 % Floating LTV incl. Tax discount & MTM IRS 32 % 37 % 42 %
Long-term liabilities 19 556 000 3,55 %
IRR since establishment ex./incl. MTM IRS 33% / 33% 30% / 30% 28% / 28%
Total return ex./incl. MTM IRS 475% / 475% 392% / 392% 331% / 331%
Est. cash flow to equity (avg. next 3 years) 10,8 % 13,3 % 16,0 %
COMMENT
(+47) 22 93 63 46
The property is Norsk Hydro ASA's former industrial plant at Rjukan.
Project Broker Business Manager Secondhand trade
Haakon Shetelig Geir Åge Rønneberg Axel Bendvold
RJUKAN NÆRINGSPARK KS Industrial 31.12.2017
(+47) 22 93 63 38 (+47) 22 93 64 53
MNOK 56 13,00 % 397 000 2,8 yrs
12,9 % 13,3 % 13,7 %
-1 000 000
0
1 000 000
2 000 000
3 000 000
4 000 000
5 000 000
6 000 000
2018 2019 2020
Reduction MTM IRS
Net cash
Dividends
Installments
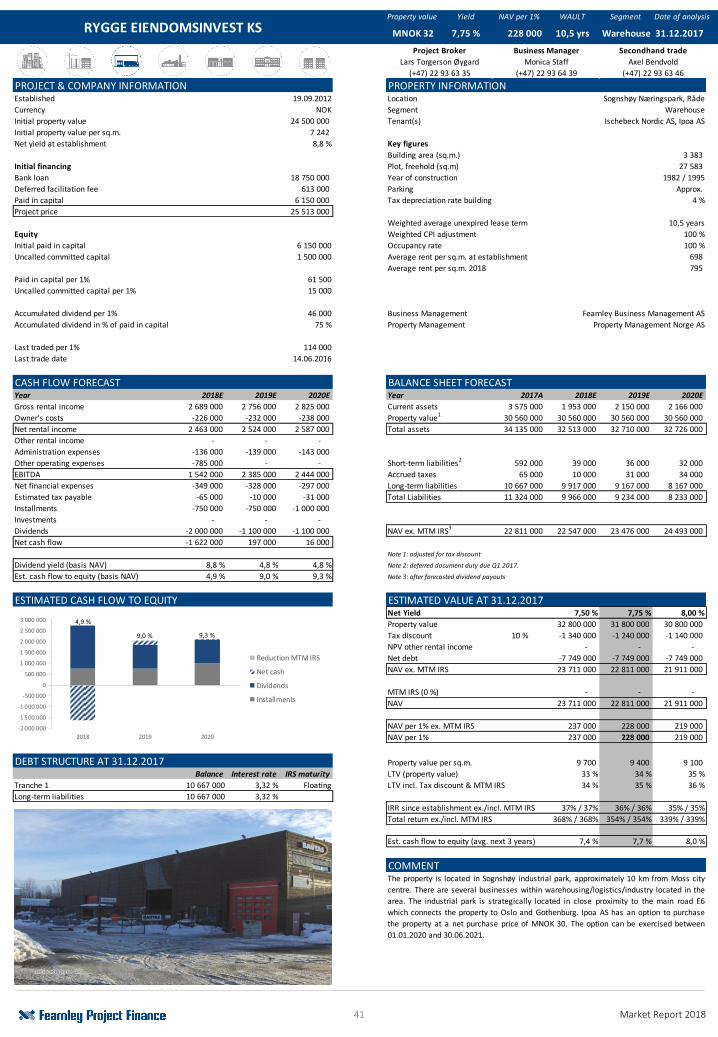
41 Market Report 2018
Property value Yield NAV per 1% WAULT Segment Date of analysis
PROJECT & COMPANY INFORMATION PROPERTY INFORMATIONEstablished 19.09.2012 Location Sognshøy Næringspark, Råde
Currency NOK Segment Warehouse
Initial property value 24 500 000 Tenant(s) Ischebeck Nordic AS, Ipoa AS
Initial property value per sq.m. 7 242
Net yield at establishment 8,8 % Key figures
Building area (sq.m.) 3 383
Initial financing Plot, freehold (sq.m) 27 583
Bank loan 18 750 000 Year of construction 1982 / 1995
Deferred facilitation fee 613 000 Parking Approx.
Paid in capital 6 150 000 Tax depreciation rate building 4 %
Project price 25 513 000
Weighted average unexpired lease term 10,5 years
Equity Weighted CPI adjustment 100 %
Initial paid in capital 6 150 000 Occupancy rate 100 %
Uncalled committed capital 1 500 000 Average rent per sq.m. at establishment 698
Average rent per sq.m. 2018 795
Paid in capital per 1% 61 500
Uncalled committed capital per 1% 15 000
Accumulated dividend per 1% 46 000 Business Management Fearnley Business Management AS
Accumulated dividend in % of paid in capital 75 % Property Management Property Management Norge AS
Last traded per 1% 114 000
Last trade date 14.06.2016
CASH FLOW FORECAST BALANCE SHEET FORECASTYear 2018E 2019E 2020E Year 2017A 2018E 2019E 2020E
Gross rental income 2 689 000 2 756 000 2 825 000 Current assets 3 575 000 1 953 000 2 150 000 2 166 000
Owner's costs -226 000 -232 000 -238 000 Property value1
30 560 000 30 560 000 30 560 000 30 560 000
Net rental income 2 463 000 2 524 000 2 587 000 Total assets 34 135 000 32 513 000 32 710 000 32 726 000
Other rental income - - -
Administration expenses -136 000 -139 000 -143 000
Other operating expenses -785 000 - - Short-term liabilities2
592 000 39 000 36 000 32 000
EBITDA 1 542 000 2 385 000 2 444 000 Accrued taxes 65 000 10 000 31 000 34 000
Net financial expenses -349 000 -328 000 -297 000 Long-term liabilities 10 667 000 9 917 000 9 167 000 8 167 000
Estimated tax payable -65 000 -10 000 -31 000 Total Liabilities 11 324 000 9 966 000 9 234 000 8 233 000
Installments -750 000 -750 000 -1 000 000
Investments - - -
Dividends -2 000 000 -1 100 000 -1 100 000 NAV ex. MTM IRS3
22 811 000 22 547 000 23 476 000 24 493 000
Net cash flow -1 622 000 197 000 16 000
Note 1: adjusted for tax discount
Dividend yield (basis NAV) 8,8 % 4,8 % 4,8 % Note 2: deferred document duty due Q1 2017.
Est. cash flow to equity (basis NAV) 4,9 % 9,0 % 9,3 % Note 3: after forecasted dividend payouts
ESTIMATED CASH FLOW TO EQUITY ESTIMATED VALUE AT 31.12.2017Net Yield 7,50 % 7,75 % 8,00 %
Property value 32 800 000 31 800 000 30 800 000
Tax discount 10 % -1 340 000 -1 240 000 -1 140 000
NPV other rental income - - -
Net debt -7 749 000 -7 749 000 -7 749 000
NAV ex. MTM IRS 23 711 000 22 811 000 21 911 000
MTM IRS (0 %) - - -
NAV 23 711 000 22 811 000 21 911 000
NAV per 1% ex. MTM IRS 237 000 228 000 219 000
NAV per 1% 237 000 228 000 219 000
DEBT STRUCTURE AT 31.12.2017 Property value per sq.m. 9 700 9 400 9 100
Balance Interest rate IRS maturity LTV (property value) 33 % 34 % 35 %
Tranche 1 10 667 000 3,32 % Floating LTV incl. Tax discount & MTM IRS 34 % 35 % 36 %
Long-term liabilities 10 667 000 3,32 %
IRR since establishment ex./incl. MTM IRS 37% / 37% 36% / 36% 35% / 35%
Total return ex./incl. MTM IRS 368% / 368% 354% / 354% 339% / 339%
Est. cash flow to equity (avg. next 3 years) 7,4 % 7,7 % 8,0 %
COMMENT
Warehouse 31.12.2017
(+47) 22 93 63 35 (+47) 22 93 64 39
MNOK 32 7,75 % 228 000 10,5 yrs
(+47) 22 93 63 46
The property is located in Sognshøy industrial park, approximately 10 km from Moss city
centre. There are several businesses within warehousing/logistics/industry located in the
area. The industrial park is strategically located in close proximity to the main road E6
which connects the property to Oslo and Gothenburg. Ipoa AS has an option to purchase
the property at a net purchase price of MNOK 30. The option can be exercised between
01.01.2020 and 30.06.2021.
Project Broker Business Manager Secondhand trade
Lars Torgerson Øygard Monica Staff Axel Bendvold
RYGGE EIENDOMSINVEST KS
4,9 %
9,0 % 9,3 %
-2 000 000
-1 500 000
-1 000 000
-500 000
0
500 000
1 000 000
1 500 000
2 000 000
2 500 000
3 000 000
2018 2019 2020
Reduction MTM IRS
Net cash
Dividends
Installments

42 Market Report 2018
Property value Yield NAV per 1% WAULT Segment Date of analysis
PROJECT & COMPANY INFORMATION PROPERTY INFORMATIONEstablished 16.10.2012 Location Bråsetveien 3, Røyken
Currency NOK Segment Retail
Initial property value 85 000 000 Tenant(s) NorgesGruppen Buskerud AS, Nille AS, Røyken Apotek AS et al.
Initial property value per sq.m. 12 389
Net yield at establishment 7,6 % Key figures
Building area (sq.m.) 4 253
Initial financing Plot, freehold (sq.m) 7 834
Bank loan 68 000 000 Year of construction 2009
Paid in capital 19 200 000 Parking Approx. 55
Project price 87 200 000 Tax depreciation rate building 2 %
Weighted average unexpired lease term 2,1 years
Equity Weighted CPI adjustment 83 %
Initial paid in capital 19 200 000 Occupancy rate 78 %
Uncalled committed capital 15 000 000 Average rent per sq.m. at establishment 1 107
Average rent per sq.m. 2018 1 228
Paid in capital per 1% 192 000
Uncalled committed capital per 1% 150 000
Accumulated dividend per 1% 8 000 Business Management Fearnley Business Management AS
Accumulated dividend in % of paid in capital 4 % Property Management Property Management Norge AS
Last traded per 1% 200 000
Last trade date 22.12.2017
CASH FLOW FORECAST BALANCE SHEET FORECASTYear 2018E 2019E 2020E Year 2017A 2018E 2019E 2020E
Gross rental income 4 064 000 4 145 000 4 228 000 Current assets 621 000 1 492 000 2 859 000 4 599 000
Market rent free space1
338 000 769 000 788 000 Property value1
44 666 000 44 666 000 44 666 000 44 666 000
Owner's costs -468 000 -478 000 -487 000 Total assets 45 287 000 46 158 000 47 525 000 49 265 000
Net rental income 3 934 000 4 436 000 4 529 000
Other rental income 162 000 -769 000 -788 000
Administration expenses -594 000 -618 000 -633 000 Short-term liabilities 243 000 243 000 237 000 155 000
Other operating expenses -1 443 000 332 000 337 000 Accrued taxes - - - -
EBITDA 2 059 000 3 381 000 3 445 000 Long-term liabilities 21 000 000 21 000 000 20 160 000 19 320 000
Net financial expenses -1 188 000 -1 174 000 -865 000 Total Liabilities 21 243 000 21 243 000 20 397 000 19 475 000
Estimated tax payable - - -
Installments - -840 000 -840 000
Investments - - - NAV ex. MTM IRS2
24 044 000 24 915 000 27 128 000 29 790 000
Dividends - - -
Net cash flow 871 000 1 367 000 1 740 000
Note 1: Assumed market rent
Dividend yield (basis NAV) 0,0 % 0,0 % 0,0 % Note 1: adjusted for tax discount
Est. cash flow to equity (basis NAV) 5,4 % 11,1 % 11,2 % Note 2: after forecasted dividend payouts
ESTIMATED CASH FLOW TO EQUITY ESTIMATED VALUE AT 31.12.2017Net Yield 8,25 % 8,75 % 9,25 %
Property value 47 700 000 45 000 000 42 500 000
Tax discount 10 % -604 000 -334 000 -84 000
NPV other rental income - - -
Net debt -20 622 000 -20 622 000 -20 622 000
NAV ex. MTM IRS 26 474 000 24 044 000 21 794 000
MTM IRS (100 %) -777 000 -777 000 -777 000
NAV 25 697 000 23 267 000 21 017 000
NAV per 1% ex. MTM IRS 265 000 240 000 218 000
NAV per 1% 257 000 233 000 210 000
DEBT STRUCTURE AT 31.12.2017 Property value per sq.m. 11 200 10 600 10 000
Balance Interest rate IRS maturity LTV (property value) 44 % 47 % 49 %
Tranche 1 21 000 000 5,56 % 15.01.2020 LTV incl. Tax discount & MTM IRS 46 % 49 % 51 %
Long-term liabilities 21 000 000 5,56 %
IRR since establishment ex./incl. MTM IRS 7% / 6% 5% / 4% 3% / 2%
Total return ex./incl. MTM IRS 42% / 38% 29% / 26% 18% / 14%
Est. cash flow to equity (avg. next 3 years) 8,3 % 9,2 % 10,2 %
COMMENT
Retail 31.12.2017
(+47) 22 93 64 54 (+47) 22 93 64 42
MNOK 45 8,75 % 233 000 2,1 yrs
(+47) 22 93 63 46
The project originally consisted of two buildings, an office building and a shopping centre.
The office building was sold in 2015.
Project Broker Business Manager Secondhand trade
Jens Bøvre Odd-Eirik Olsen Axel Bendvold
RØYKEN NÆRINGSEIENDOM KS
5,4 %
11,1 % 11,2 %
0
500 000
1 000 000
1 500 000
2 000 000
2 500 000
3 000 000
2018 2019 2020
Reduction MTM IRS
Net cash
Dividends
Installments
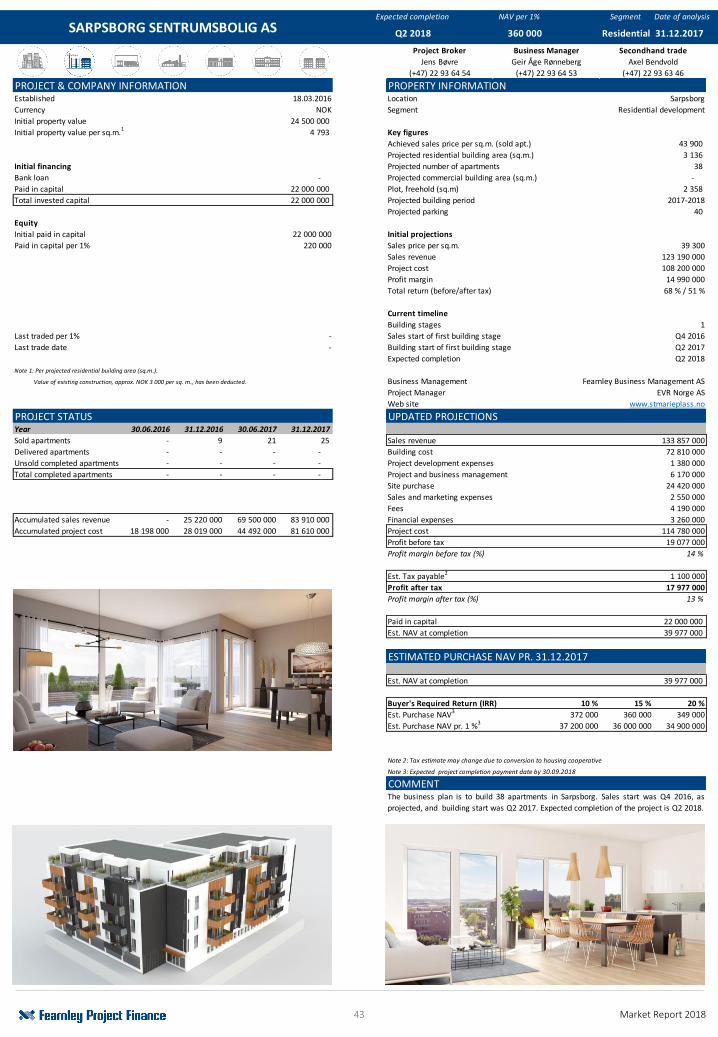
43 Market Report 2018
Expected completion NAV per 1% Segment Date of analysis
PROJECT & COMPANY INFORMATION PROPERTY INFORMATIONEstablished 18.03.2016 Location Sarpsborg
Currency NOK Segment Residential development
Initial property value 24 500 000
Initial property value per sq.m.1 4 793 Key figures
Achieved sales price per sq.m. (sold apt.) 43 900
Projected residential building area (sq.m.) 3 136
Initial financing Projected number of apartments 38
Bank loan - Projected commercial building area (sq.m.) -
Paid in capital 22 000 000 Plot, freehold (sq.m) 2 358
Total invested capital 22 000 000 Projected building period 2017-2018
Projected parking 40
Equity
Initial paid in capital 22 000 000 Initial projections
Paid in capital per 1% 220 000 Sales price per sq.m. 39 300
Sales revenue 123 190 000
Project cost 108 200 000
Profit margin 14 990 000
Total return (before/after tax) 68 % / 51 %
Current timeline
Building stages 1
Last traded per 1% - Sales start of first building stage Q4 2016
Last trade date - Building start of first building stage Q2 2017
Expected completion Q2 2018
Note 1: Per projected residential building area (sq.m.).
Value of existing construction, approx. NOK 3 000 per sq. m., has been deducted. Business Management Fearnley Business Management AS
Project Manager EVR Norge AS
Web site www.stmarieplass.no
PROJECT STATUS UPDATED PROJECTIONSYear 30.06.2016 31.12.2016 30.06.2017 31.12.2017
Sold apartments - 9 21 25 Sales revenue 133 857 000
Delivered apartments - - - - Building cost 72 810 000
Unsold completed apartments - - - - Project development expenses 1 380 000
Total completed apartments - - - - Project and business management 6 170 000
Site purchase 24 420 000
Sales price per sq.m. sold - 46 730 Sales and marketing expenses 2 550 000
Fees 4 190 000
Accumulated sales revenue - 25 220 000 69 500 000 83 910 000 Financial expenses 3 260 000
Accumulated project cost 18 198 000 28 019 000 44 492 000 81 610 000 Project cost 114 780 000
Profit before tax 19 077 000
Profit margin before tax (%) 14 %
Est. Tax payable2 1 100 000
Profit after tax 17 977 000
Profit margin after tax (%) 13 %
Paid in capital 22 000 000
Est. NAV at completion 39 977 000
ESTIMATED PURCHASE NAV PR. 31.12.2017
Est. NAV at completion 39 977 000
Buyer's Required Return (IRR) 10 % 15 % 20 %
Est. Purchase NAV3 372 000 360 000 349 000
Est. Purchase NAV pr. 1 %3
37 200 000 36 000 000 34 900 000
Note 2: Tax estimate may change due to conversion to housing cooperative
Note 3: Expected project completion payment date by 30.09.2018
COMMENTThe business plan is to build 38 apartments in Sarpsborg. Sales start was Q4 2016, as
projected, and building start was Q2 2017. Expected completion of the project is Q2 2018.
(+47) 22 93 63 46
Secondhand trade
Axel Bendvold
ResidentialSARPSBORG SENTRUMSBOLIG AS 31.12.2017
(+47) 22 93 64 54 (+47) 22 93 64 53
Project Broker Business Manager
Jens Bøvre Geir Åge Rønneberg
Q2 2018 360 000
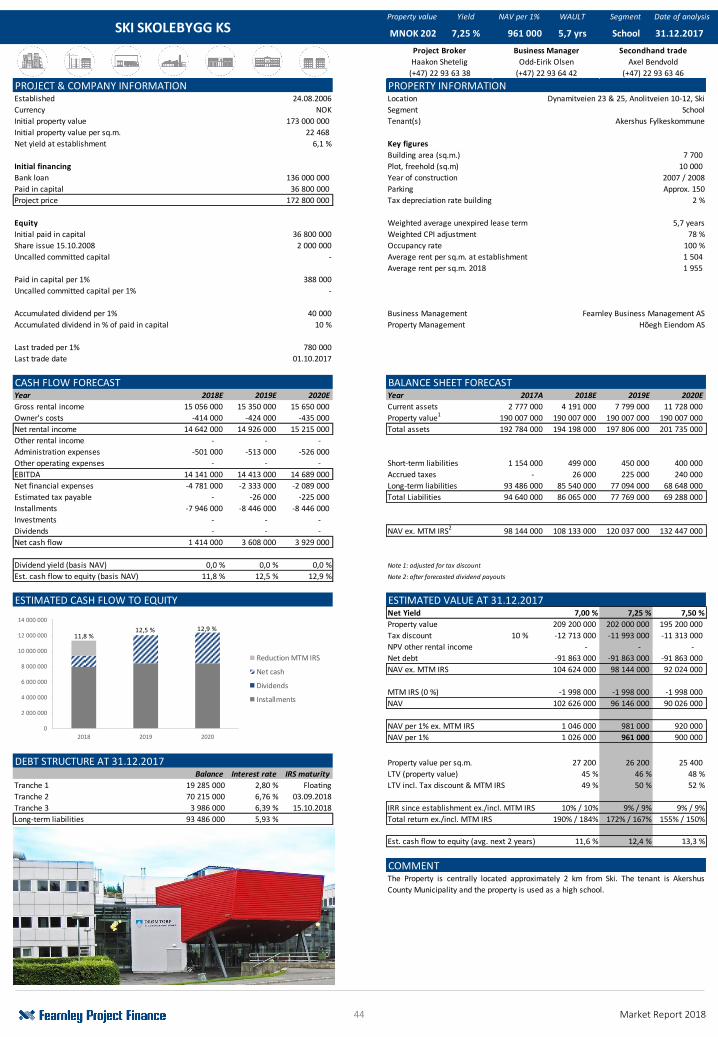
44 Market Report 2018
Property value Yield NAV per 1% WAULT Segment Date of analysis
PROJECT & COMPANY INFORMATION PROPERTY INFORMATIONEstablished 24.08.2006 Location Dynamitveien 23 & 25, Anolitveien 10-12, Ski
Currency NOK Segment School
Initial property value 173 000 000 Tenant(s) Akershus Fylkeskommune
Initial property value per sq.m. 22 468
Net yield at establishment 6,1 % Key figures
Building area (sq.m.) 7 700
Initial financing Plot, freehold (sq.m) 10 000
Bank loan 136 000 000 Year of construction 2007 / 2008
Paid in capital 36 800 000 Parking Approx. 150
Project price 172 800 000 Tax depreciation rate building 2 %
Equity Weighted average unexpired lease term 5,7 years
Initial paid in capital 36 800 000 Weighted CPI adjustment 78 %
Share issue 15.10.2008 2 000 000 Occupancy rate 100 %
Uncalled committed capital - Average rent per sq.m. at establishment 1 504
Average rent per sq.m. 2018 1 955
Paid in capital per 1% 388 000
Uncalled committed capital per 1% -
Accumulated dividend per 1% 40 000 Business Management Fearnley Business Management AS
Accumulated dividend in % of paid in capital 10 % Property Management Hõegh Eiendom AS
Last traded per 1% 780 000
Last trade date 01.10.2017
CASH FLOW FORECAST BALANCE SHEET FORECASTYear 2018E 2019E 2020E Year 2017A 2018E 2019E 2020E
Gross rental income 15 056 000 15 350 000 15 650 000 Current assets 2 777 000 4 191 000 7 799 000 11 728 000
Owner's costs -414 000 -424 000 -435 000 Property value1
190 007 000 190 007 000 190 007 000 190 007 000
Net rental income 14 642 000 14 926 000 15 215 000 Total assets 192 784 000 194 198 000 197 806 000 201 735 000
Other rental income - - -
Administration expenses -501 000 -513 000 -526 000
Other operating expenses - - - Short-term liabilities 1 154 000 499 000 450 000 400 000
EBITDA 14 141 000 14 413 000 14 689 000 Accrued taxes - 26 000 225 000 240 000
Net financial expenses -4 781 000 -2 333 000 -2 089 000 Long-term liabilities 93 486 000 85 540 000 77 094 000 68 648 000
Estimated tax payable - -26 000 -225 000 Total Liabilities 94 640 000 86 065 000 77 769 000 69 288 000
Installments -7 946 000 -8 446 000 -8 446 000
Investments - - -
Dividends - - - NAV ex. MTM IRS2
98 144 000 108 133 000 120 037 000 132 447 000
Net cash flow 1 414 000 3 608 000 3 929 000
Dividend yield (basis NAV) 0,0 % 0,0 % 0,0 % Note 1: adjusted for tax discount
Est. cash flow to equity (basis NAV) 11,8 % 12,5 % 12,9 % Note 2: after forecasted dividend payouts
ESTIMATED CASH FLOW TO EQUITY ESTIMATED VALUE AT 31.12.2017Net Yield 7,00 % 7,25 % 7,50 %
Property value 209 200 000 202 000 000 195 200 000
Tax discount 10 % -12 713 000 -11 993 000 -11 313 000
NPV other rental income - - -
Net debt -91 863 000 -91 863 000 -91 863 000
NAV ex. MTM IRS 104 624 000 98 144 000 92 024 000
MTM IRS (0 %) -1 998 000 -1 998 000 -1 998 000
NAV 102 626 000 96 146 000 90 026 000
NAV per 1% ex. MTM IRS 1 046 000 981 000 920 000
NAV per 1% 1 026 000 961 000 900 000
DEBT STRUCTURE AT 31.12.2017 Property value per sq.m. 27 200 26 200 25 400
Balance Interest rate IRS maturity LTV (property value) 45 % 46 % 48 %
Tranche 1 19 285 000 2,80 % Floating LTV incl. Tax discount & MTM IRS 49 % 50 % 52 %
Tranche 2 70 215 000 6,76 % 03.09.2018
Tranche 3 3 986 000 6,39 % 15.10.2018 IRR since establishment ex./incl. MTM IRS 10% / 10% 9% / 9% 9% / 9%
Long-term liabilities 93 486 000 5,93 % Total return ex./incl. MTM IRS 190% / 184% 172% / 167% 155% / 150%
Est. cash flow to equity (avg. next 2 years) 11,6 % 12,4 % 13,3 %
COMMENT
School 31.12.2017
(+47) 22 93 63 38 (+47) 22 93 64 42
MNOK 202 7,25 % 961 000 5,7 yrs
(+47) 22 93 63 46
The Property is centrally located approximately 2 km from Ski. The tenant is Akershus
County Municipality and the property is used as a high school.
Project Broker Business Manager Secondhand trade
Haakon Shetelig Odd-Eirik Olsen Axel Bendvold
SKI SKOLEBYGG KS
11,8 %12,5 % 12,9 %
0
2 000 000
4 000 000
6 000 000
8 000 000
10 000 000
12 000 000
14 000 000
2018 2019 2020
Reduction MTM IRS
Net cash
Dividends
Installments
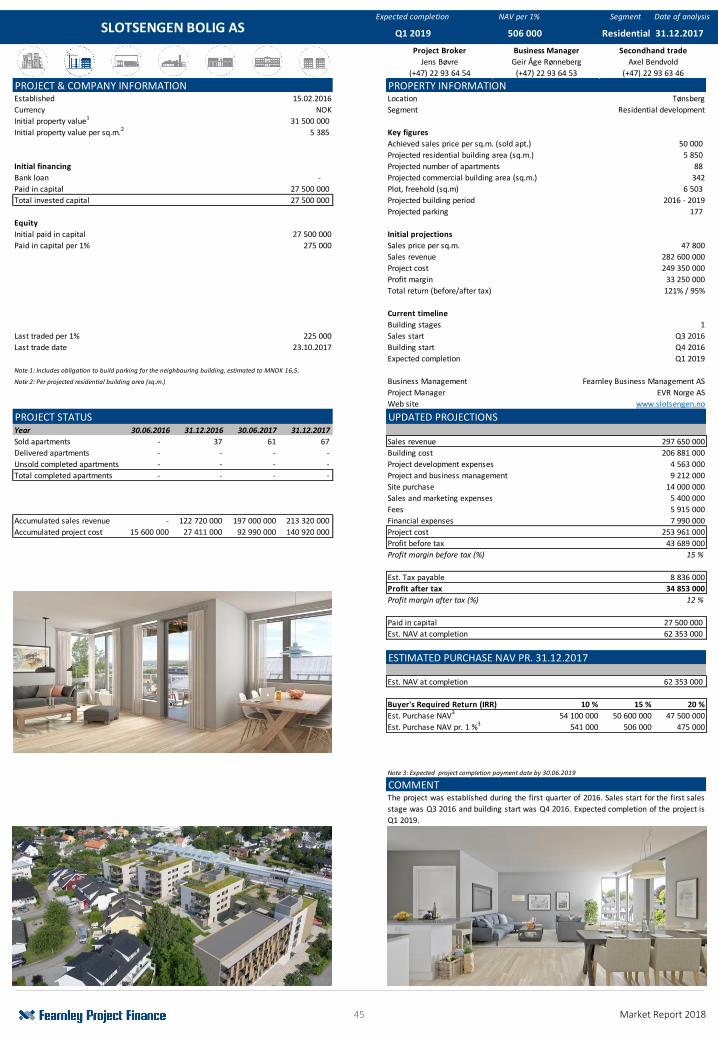
45 Market Report 2018
Expected completion NAV per 1% Segment Date of analysis
PROJECT & COMPANY INFORMATION PROPERTY INFORMATIONEstablished 15.02.2016 Location Tønsberg
Currency NOK Segment Residential development
Initial property value1 31 500 000
Initial property value per sq.m.2
5 385 Key figures
Achieved sales price per sq.m. (sold apt.) 50 000
Projected residential building area (sq.m.) 5 850
Initial financing Projected number of apartments 88
Bank loan - Projected commercial building area (sq.m.) 342
Paid in capital 27 500 000 Plot, freehold (sq.m) 6 503
Total invested capital 27 500 000 Projected building period 2016 - 2019
Projected parking 177
Equity
Initial paid in capital 27 500 000 Initial projections
Paid in capital per 1% 275 000 Sales price per sq.m. 47 800
Sales revenue 282 600 000
Project cost 249 350 000
Profit margin 33 250 000
Total return (before/after tax) 121% / 95%
Current timeline
Building stages 1
Last traded per 1% 225 000 Sales start Q3 2016
Last trade date 23.10.2017 Building start Q4 2016
Expected completion Q1 2019
Note 1: Includes obligation to build parking for the neighbouring building, estimated to MNOK 16,5.
Note 2: Per projected residential building area (sq.m.) Business Management Fearnley Business Management AS
Project Manager EVR Norge AS
Web site www.slotsengen.no
PROJECT STATUS UPDATED PROJECTIONSYear 30.06.2016 31.12.2016 30.06.2017 31.12.2017
Sold apartments - 37 61 67 Sales revenue 297 650 000
Delivered apartments - - - - Building cost 206 881 000
Unsold completed apartments - - - - Project development expenses 4 563 000
Total completed apartments - - - - Project and business management 9 212 000
Site purchase 14 000 000
Sales price per sq.m. sold - 51 332 Sales and marketing expenses 5 400 000
Fees 5 915 000
Accumulated sales revenue - 122 720 000 197 000 000 213 320 000 Financial expenses 7 990 000
Accumulated project cost 15 600 000 27 411 000 92 990 000 140 920 000 Project cost 253 961 000
Profit before tax 43 689 000
Profit margin before tax (%) 15 %
Est. Tax payable 8 836 000
Profit after tax 34 853 000
Profit margin after tax (%) 12 %
Paid in capital 27 500 000
Est. NAV at completion 62 353 000
ESTIMATED PURCHASE NAV PR. 31.12.2017
Est. NAV at completion 62 353 000
Buyer's Required Return (IRR) 10 % 15 % 20 %
Est. Purchase NAV3 54 100 000 50 600 000 47 500 000
Est. Purchase NAV pr. 1 %3 541 000 506 000 475 000
Note 3: Expected project completion payment date by 30.06.2019
COMMENT
SLOTSENGEN BOLIG AS Q1 2019 506 000 Residential 31.12.2017
The project was established during the first quarter of 2016. Sales start for the first sales
stage was Q3 2016 and building start was Q4 2016. Expected completion of the project is
Q1 2019.
(+47) 22 93 63 46
Project Broker Business Manager Secondhand trade
Jens Bøvre Geir Åge Rønneberg Axel Bendvold
(+47) 22 93 64 54 (+47) 22 93 64 53

46 Market Report 2018
Property value Yield NAV per 1% WAULT Segment Date of analysis
PROJECT & COMPANY INFORMATION PROPERTY INFORMATIONEstablished 04.05.2007 Location Tanke Svilands gate 73, Stavanger
Currency NOK Segment School
Initial property value 247 000 000 Tenant(s) Rogaland Fylkeskommune
Initial property value per sq.m. 13 950
Net yield at establishment 6,3 % Key figures
Building area (sq.m.) 5 490
Initial financing Plot, freehold (sq.m) 5 943
Bank loan 197 600 000 Year of construction 1960 / 2007
Seller´s credit 12 350 000 Parking Approx. 20
Paid in capital 41 600 000 Tax depreciation rate building 2 %
Project price 251 550 000
Weighted average unexpired lease term 3,6 years
Equity Weighted CPI adjustment 70 %
Initial paid in capital 41 600 000 Occupancy rate 100 %
Issue of new shares in May 2017 7 200 000 Average rent per sq.m. at establishment 936
Sum paid in capital 48 800 000 Average rent per sq.m. 2018 1 535
Paid in capital per 1% 488 000
Accumulated dividend per 1% 10 000 Business Management Fearnley Business Management AS
Accumulated dividend in % of paid in capital 2 % Property Management Newsec Basale AS
Last traded per 1% 225 000
Last trade date 11.01.2018
CASH FLOW FORECAST BALANCE SHEET FORECASTYear 2018E 2019E 2020E Year 2017A 2018E 2019E 2020E
Gross rental income 8 427 000 8 596 000 8 722 000 Current assets 2 635 000 3 741 000 5 006 000 6 024 000
Owner's costs -297 000 -304 000 -312 000 Property value1
99 283 000 99 283 000 99 283 000 99 283 000
Net rental income 8 130 000 8 292 000 8 410 000 Total assets 101 918 000 103 024 000 104 289 000 105 307 000
Other rental income - - -
Administration expenses -311 000 -319 000 -327 000
Other operating expenses -200 000 - - Short-term liabilities 617 000 395 000 374 000 353 000
EBITDA 7 619 000 7 973 000 8 083 000 Accrued taxes - 340 000 841 000 926 000
Net financial expenses -2 763 000 -2 618 000 -2 474 000 Long-term liabilities 73 125 000 69 375 000 65 625 000 61 875 000
Estimated tax payable - -340 000 -841 000 Total Liabilities 73 742 000 70 110 000 66 840 000 63 154 000
Installments -3 750 000 -3 750 000 -3 750 000
Investments - - -
Dividends - - - NAV ex. MTM IRS2
28 176 000 32 914 000 37 449 000 42 153 000
Net cash flow 1 106 000 1 265 000 1 018 000
Dividend yield (basis NAV) 0,0 % 0,0 % 0,0 % Note 1: adjusted for tax discount
Est. cash flow to equity (basis NAV) 17,2 % 17,8 % 16,9 % Note 2: after forecasted dividend payouts
ESTIMATED CASH FLOW TO EQUITY ESTIMATED VALUE AT 31.12.2017Net Yield 7,75 % 8,00 % 8,25 %
Property value 104 900 000 101 600 000 98 500 000
Tax discount 10 % -2 647 000 -2 317 000 -2 007 000
NPV other rental income - - -
Net debt -71 107 000 -71 107 000 -71 107 000
NAV ex. MTM IRS 31 146 000 28 176 000 25 386 000
MTM IRS (0 %) - - -
NAV 31 146 000 28 176 000 25 386 000
NAV per 1% ex. MTM IRS 311 000 282 000 254 000
NAV per 1% 311 000 282 000 254 000
DEBT STRUCTURE AT 31.12.2017 Property value per sq.m. 19 100 18 500 17 900
Balance Interest rate IRS maturity LTV (property value) 70 % 72 % 74 %
Tranche 1 73 125 000 4,00 % Floating LTV incl. Tax discount & MTM IRS 72 % 74 % 76 %
Long-term liabilities 73 125 000 4,00 %
IRR since establishment ex./incl. MTM IRS n/a n/a n/a
Total return ex./incl. MTM IRS -40% / -40% -47% / -47% -54% / -54%
Est. cash flow to equity (avg. next 3 years) 15,7 % 17,3 % 19,2 %
COMMENT
School 31.12.2017
(+47) 22 93 64 59 (+47) 22 93 64 52
MNOK 102 8,00 % 282 000 3,6 yrs
(+47) 22 93 63 46
Portfolio originally consisting of 5 properties. 4 properties have been sold. The remaining
property, a school, is let to Rogaland Fylkeskommune. In the long run the property has
residential development potential.
Project Broker Business Manager Secondhand trade
Fredrik Honningsvåg Marianne Fossum Axel Bendvold
STAVANGER PROPERTY INVEST AS
17,2 % 17,8 %16,9 %
0
1 000 000
2 000 000
3 000 000
4 000 000
5 000 000
6 000 000
2018 2019 2020
Reduction MTM IRS
Net cash
Dividends
Installments
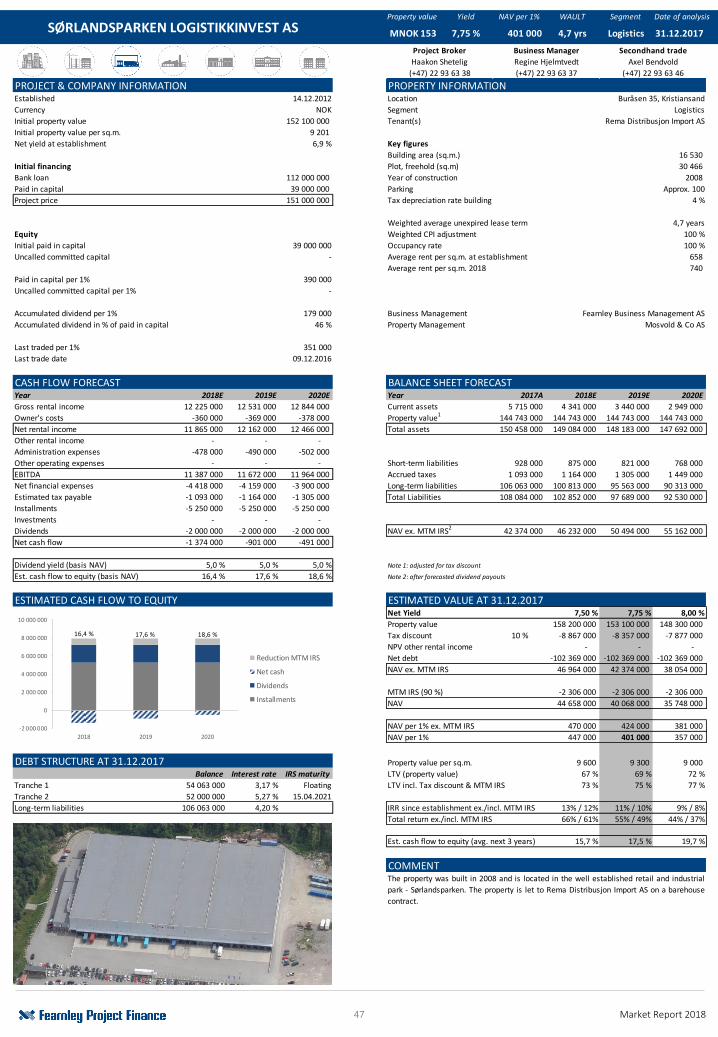
47 Market Report 2018
Property value Yield NAV per 1% WAULT Segment Date of analysis
PROJECT & COMPANY INFORMATION PROPERTY INFORMATIONEstablished 14.12.2012 Location Buråsen 35, Kristiansand
Currency NOK Segment Logistics
Initial property value 152 100 000 Tenant(s) Rema Distribusjon Import AS
Initial property value per sq.m. 9 201
Net yield at establishment 6,9 % Key figures
Building area (sq.m.) 16 530
Initial financing Plot, freehold (sq.m) 30 466
Bank loan 112 000 000 Year of construction 2008
Paid in capital 39 000 000 Parking Approx. 100
Project price 151 000 000 Tax depreciation rate building 4 %
Weighted average unexpired lease term 4,7 years
Equity Weighted CPI adjustment 100 %
Initial paid in capital 39 000 000 Occupancy rate 100 %
Uncalled committed capital - Average rent per sq.m. at establishment 658
Average rent per sq.m. 2018 740
Paid in capital per 1% 390 000
Uncalled committed capital per 1% -
Accumulated dividend per 1% 179 000 Business Management Fearnley Business Management AS
Accumulated dividend in % of paid in capital 46 % Property Management Mosvold & Co AS
Last traded per 1% 351 000
Last trade date 09.12.2016
CASH FLOW FORECAST BALANCE SHEET FORECASTYear 2018E 2019E 2020E Year 2017A 2018E 2019E 2020E
Gross rental income 12 225 000 12 531 000 12 844 000 Current assets 5 715 000 4 341 000 3 440 000 2 949 000
Owner's costs -360 000 -369 000 -378 000 Property value1
144 743 000 144 743 000 144 743 000 144 743 000
Net rental income 11 865 000 12 162 000 12 466 000 Total assets 150 458 000 149 084 000 148 183 000 147 692 000
Other rental income - - -
Administration expenses -478 000 -490 000 -502 000
Other operating expenses - - - Short-term liabilities 928 000 875 000 821 000 768 000
EBITDA 11 387 000 11 672 000 11 964 000 Accrued taxes 1 093 000 1 164 000 1 305 000 1 449 000
Net financial expenses -4 418 000 -4 159 000 -3 900 000 Long-term liabilities 106 063 000 100 813 000 95 563 000 90 313 000
Estimated tax payable -1 093 000 -1 164 000 -1 305 000 Total Liabilities 108 084 000 102 852 000 97 689 000 92 530 000
Installments -5 250 000 -5 250 000 -5 250 000
Investments - - -
Dividends -2 000 000 -2 000 000 -2 000 000 NAV ex. MTM IRS2
42 374 000 46 232 000 50 494 000 55 162 000
Net cash flow -1 374 000 -901 000 -491 000
Dividend yield (basis NAV) 5,0 % 5,0 % 5,0 % Note 1: adjusted for tax discount
Est. cash flow to equity (basis NAV) 16,4 % 17,6 % 18,6 % Note 2: after forecasted dividend payouts
ESTIMATED CASH FLOW TO EQUITY ESTIMATED VALUE AT 31.12.2017Net Yield 7,50 % 7,75 % 8,00 %
Property value 158 200 000 153 100 000 148 300 000
Tax discount 10 % -8 867 000 -8 357 000 -7 877 000
NPV other rental income - - -
Net debt -102 369 000 -102 369 000 -102 369 000
NAV ex. MTM IRS 46 964 000 42 374 000 38 054 000
MTM IRS (90 %) -2 306 000 -2 306 000 -2 306 000
NAV 44 658 000 40 068 000 35 748 000
NAV per 1% ex. MTM IRS 470 000 424 000 381 000
NAV per 1% 447 000 401 000 357 000
DEBT STRUCTURE AT 31.12.2017 Property value per sq.m. 9 600 9 300 9 000
Balance Interest rate IRS maturity LTV (property value) 67 % 69 % 72 %
Tranche 1 54 063 000 3,17 % Floating LTV incl. Tax discount & MTM IRS 73 % 75 % 77 %
Tranche 2 52 000 000 5,27 % 15.04.2021
Long-term liabilities 106 063 000 4,20 % IRR since establishment ex./incl. MTM IRS 13% / 12% 11% / 10% 9% / 8%
Total return ex./incl. MTM IRS 66% / 61% 55% / 49% 44% / 37%
Est. cash flow to equity (avg. next 3 years) 15,7 % 17,5 % 19,7 %
COMMENT
(+47) 22 93 63 46
The property was built in 2008 and is located in the well established retail and industrial
park - Sørlandsparken. The property is let to Rema Distribusjon Import AS on a barehouse
contract.
Project Broker Business Manager Secondhand trade
Haakon Shetelig Regine Hjelmtvedt Axel Bendvold
SØRLANDSPARKEN LOGISTIKKINVEST AS Logistics 31.12.2017
(+47) 22 93 63 38 (+47) 22 93 63 37
MNOK 153 7,75 % 401 000 4,7 yrs
16,4 % 17,6 % 18,6 %
-2 000 000
0
2 000 000
4 000 000
6 000 000
8 000 000
10 000 000
2018 2019 2020
Reduction MTM IRS
Net cash
Dividends
Installments
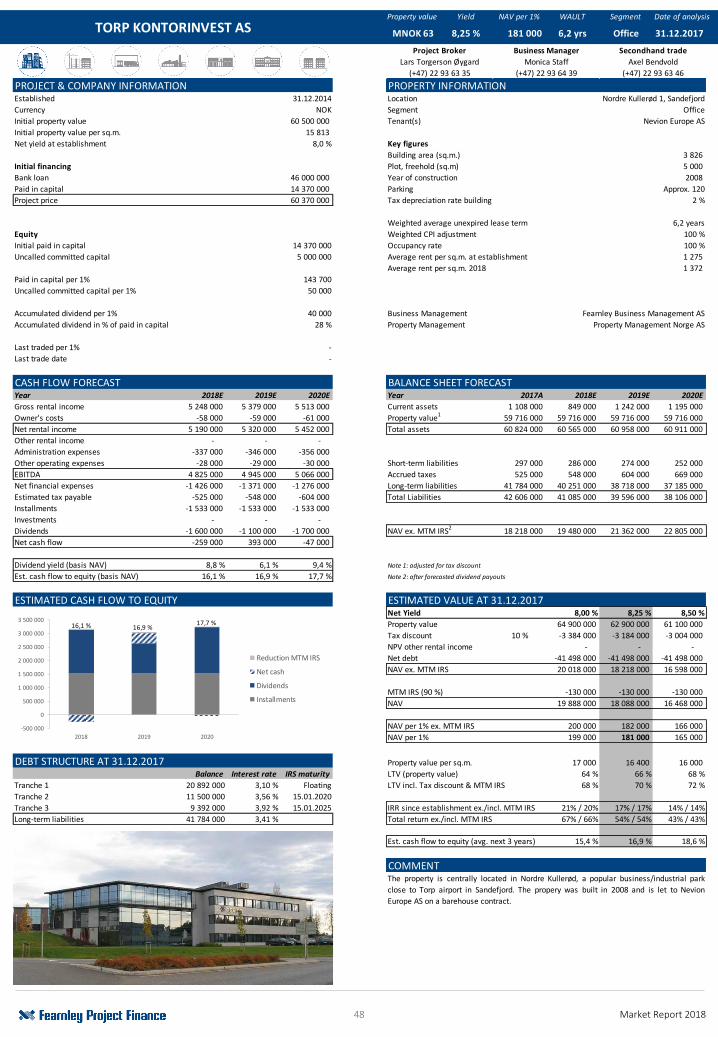
48 Market Report 2018
Property value Yield NAV per 1% WAULT Segment Date of analysis
PROJECT & COMPANY INFORMATION PROPERTY INFORMATIONEstablished 31.12.2014 Location Nordre Kullerød 1, Sandefjord
Currency NOK Segment Office
Initial property value 60 500 000 Tenant(s) Nevion Europe AS
Initial property value per sq.m. 15 813
Net yield at establishment 8,0 % Key figures
Building area (sq.m.) 3 826
Initial financing Plot, freehold (sq.m) 5 000
Bank loan 46 000 000 Year of construction 2008
Paid in capital 14 370 000 Parking Approx. 120
Project price 60 370 000 Tax depreciation rate building 2 %
Weighted average unexpired lease term 6,2 years
Equity Weighted CPI adjustment 100 %
Initial paid in capital 14 370 000 Occupancy rate 100 %
Uncalled committed capital 5 000 000 Average rent per sq.m. at establishment 1 275
Average rent per sq.m. 2018 1 372
Paid in capital per 1% 143 700
Uncalled committed capital per 1% 50 000
Accumulated dividend per 1% 40 000 Business Management Fearnley Business Management AS
Accumulated dividend in % of paid in capital 28 % Property Management Property Management Norge AS
Last traded per 1% -
Last trade date -
CASH FLOW FORECAST BALANCE SHEET FORECASTYear 2018E 2019E 2020E Year 2017A 2018E 2019E 2020E
Gross rental income 5 248 000 5 379 000 5 513 000 Current assets 1 108 000 849 000 1 242 000 1 195 000
Owner's costs -58 000 -59 000 -61 000 Property value1
59 716 000 59 716 000 59 716 000 59 716 000
Net rental income 5 190 000 5 320 000 5 452 000 Total assets 60 824 000 60 565 000 60 958 000 60 911 000
Other rental income - - -
Administration expenses -337 000 -346 000 -356 000
Other operating expenses -28 000 -29 000 -30 000 Short-term liabilities 297 000 286 000 274 000 252 000
EBITDA 4 825 000 4 945 000 5 066 000 Accrued taxes 525 000 548 000 604 000 669 000
Net financial expenses -1 426 000 -1 371 000 -1 276 000 Long-term liabilities 41 784 000 40 251 000 38 718 000 37 185 000
Estimated tax payable -525 000 -548 000 -604 000 Total Liabilities 42 606 000 41 085 000 39 596 000 38 106 000
Installments -1 533 000 -1 533 000 -1 533 000
Investments - - -
Dividends -1 600 000 -1 100 000 -1 700 000 NAV ex. MTM IRS2
18 218 000 19 480 000 21 362 000 22 805 000
Net cash flow -259 000 393 000 -47 000
Dividend yield (basis NAV) 8,8 % 6,1 % 9,4 % Note 1: adjusted for tax discount
Est. cash flow to equity (basis NAV) 16,1 % 16,9 % 17,7 % Note 2: after forecasted dividend payouts
ESTIMATED CASH FLOW TO EQUITY ESTIMATED VALUE AT 31.12.2017Net Yield 8,00 % 8,25 % 8,50 %
Property value 64 900 000 62 900 000 61 100 000
Tax discount 10 % -3 384 000 -3 184 000 -3 004 000
NPV other rental income - - -
Net debt -41 498 000 -41 498 000 -41 498 000
NAV ex. MTM IRS 20 018 000 18 218 000 16 598 000
MTM IRS (90 %) -130 000 -130 000 -130 000
NAV 19 888 000 18 088 000 16 468 000
NAV per 1% ex. MTM IRS 200 000 182 000 166 000
NAV per 1% 199 000 181 000 165 000
DEBT STRUCTURE AT 31.12.2017 Property value per sq.m. 17 000 16 400 16 000
Balance Interest rate IRS maturity LTV (property value) 64 % 66 % 68 %
Tranche 1 20 892 000 3,10 % Floating LTV incl. Tax discount & MTM IRS 68 % 70 % 72 %
Tranche 2 11 500 000 3,56 % 15.01.2020
Tranche 3 9 392 000 3,92 % 15.01.2025 IRR since establishment ex./incl. MTM IRS 21% / 20% 17% / 17% 14% / 14%
Long-term liabilities 41 784 000 3,41 % Total return ex./incl. MTM IRS 67% / 66% 54% / 54% 43% / 43%
Est. cash flow to equity (avg. next 3 years) 15,4 % 16,9 % 18,6 %
COMMENT
(+47) 22 93 63 46
The property is centrally located in Nordre Kullerød, a popular business/industrial park
close to Torp airport in Sandefjord. The propery was built in 2008 and is let to Nevion
Europe AS on a barehouse contract.
Project Broker Business Manager Secondhand trade
Lars Torgerson Øygard Monica Staff Axel Bendvold
TORP KONTORINVEST AS Office 31.12.2017
(+47) 22 93 63 35 (+47) 22 93 64 39
MNOK 63 8,25 % 181 000 6,2 yrs
16,1 % 16,9 %17,7 %
-500 000
0
500 000
1 000 000
1 500 000
2 000 000
2 500 000
3 000 000
3 500 000
2018 2019 2020
Reduction MTM IRS
Net cash
Dividends
Installments
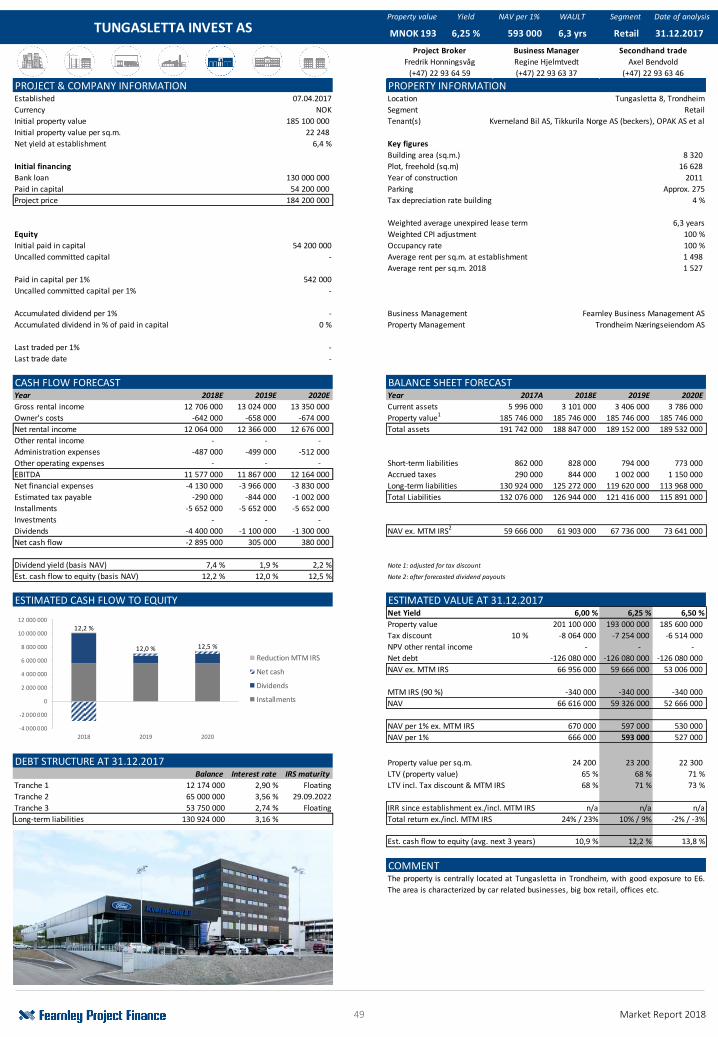
49 Market Report 2018
Property value Yield NAV per 1% WAULT Segment Date of analysis
PROJECT & COMPANY INFORMATION PROPERTY INFORMATIONEstablished 07.04.2017 Location Tungasletta 8, Trondheim
Currency NOK Segment Retail
Initial property value 185 100 000 Tenant(s) Kverneland Bil AS, Tikkurila Norge AS (beckers), OPAK AS et al
Initial property value per sq.m. 22 248
Net yield at establishment 6,4 % Key figures
Building area (sq.m.) 8 320
Initial financing Plot, freehold (sq.m) 16 628
Bank loan 130 000 000 Year of construction 2011
Paid in capital 54 200 000 Parking Approx. 275
Project price 184 200 000 Tax depreciation rate building 4 %
Weighted average unexpired lease term 6,3 years
Equity Weighted CPI adjustment 100 %
Initial paid in capital 54 200 000 Occupancy rate 100 %
Uncalled committed capital - Average rent per sq.m. at establishment 1 498
Average rent per sq.m. 2018 1 527
Paid in capital per 1% 542 000
Uncalled committed capital per 1% -
Accumulated dividend per 1% - Business Management Fearnley Business Management AS
Accumulated dividend in % of paid in capital 0 % Property Management Trondheim Næringseiendom AS
Last traded per 1% -
Last trade date -
CASH FLOW FORECAST BALANCE SHEET FORECASTYear 2018E 2019E 2020E Year 2017A 2018E 2019E 2020E
Gross rental income 12 706 000 13 024 000 13 350 000 Current assets 5 996 000 3 101 000 3 406 000 3 786 000
Owner's costs -642 000 -658 000 -674 000 Property value1
185 746 000 185 746 000 185 746 000 185 746 000
Net rental income 12 064 000 12 366 000 12 676 000 Total assets 191 742 000 188 847 000 189 152 000 189 532 000
Other rental income - - -
Administration expenses -487 000 -499 000 -512 000
Other operating expenses - - - Short-term liabilities 862 000 828 000 794 000 773 000
EBITDA 11 577 000 11 867 000 12 164 000 Accrued taxes 290 000 844 000 1 002 000 1 150 000
Net financial expenses -4 130 000 -3 966 000 -3 830 000 Long-term liabilities 130 924 000 125 272 000 119 620 000 113 968 000
Estimated tax payable -290 000 -844 000 -1 002 000 Total Liabilities 132 076 000 126 944 000 121 416 000 115 891 000
Installments -5 652 000 -5 652 000 -5 652 000
Investments - - -
Dividends -4 400 000 -1 100 000 -1 300 000 NAV ex. MTM IRS2
59 666 000 61 903 000 67 736 000 73 641 000
Net cash flow -2 895 000 305 000 380 000
Dividend yield (basis NAV) 7,4 % 1,9 % 2,2 % Note 1: adjusted for tax discount
Est. cash flow to equity (basis NAV) 12,2 % 12,0 % 12,5 % Note 2: after forecasted dividend payouts
ESTIMATED CASH FLOW TO EQUITY ESTIMATED VALUE AT 31.12.2017Net Yield 6,00 % 6,25 % 6,50 %
Property value 201 100 000 193 000 000 185 600 000
Tax discount 10 % -8 064 000 -7 254 000 -6 514 000
NPV other rental income - - -
Net debt -126 080 000 -126 080 000 -126 080 000
NAV ex. MTM IRS 66 956 000 59 666 000 53 006 000
MTM IRS (90 %) -340 000 -340 000 -340 000
NAV 66 616 000 59 326 000 52 666 000
NAV per 1% ex. MTM IRS 670 000 597 000 530 000
NAV per 1% 666 000 593 000 527 000
DEBT STRUCTURE AT 31.12.2017 Property value per sq.m. 24 200 23 200 22 300
Balance Interest rate IRS maturity LTV (property value) 65 % 68 % 71 %
Tranche 1 12 174 000 2,90 % Floating LTV incl. Tax discount & MTM IRS 68 % 71 % 73 %
Tranche 2 65 000 000 3,56 % 29.09.2022
Tranche 3 53 750 000 2,74 % Floating IRR since establishment ex./incl. MTM IRS n/a n/a n/a
Long-term liabilities 130 924 000 3,16 % Total return ex./incl. MTM IRS 24% / 23% 10% / 9% -2% / -3%
Est. cash flow to equity (avg. next 3 years) 10,9 % 12,2 % 13,8 %
COMMENT
(+47) 22 93 63 46
The property is centrally located at Tungasletta in Trondheim, with good exposure to E6.
The area is characterized by car related businesses, big box retail, offices etc.
Project Broker Business Manager Secondhand trade
Fredrik Honningsvåg Regine Hjelmtvedt Axel Bendvold
TUNGASLETTA INVEST AS Retail 31.12.2017
(+47) 22 93 64 59 (+47) 22 93 63 37
MNOK 193 6,25 % 593 000 6,3 yrs
12,2 %
12,0 % 12,5 %
-4 000 000
-2 000 000
0
2 000 000
4 000 000
6 000 000
8 000 000
10 000 000
12 000 000
2018 2019 2020
Reduction MTM IRS
Net cash
Dividends
Installments
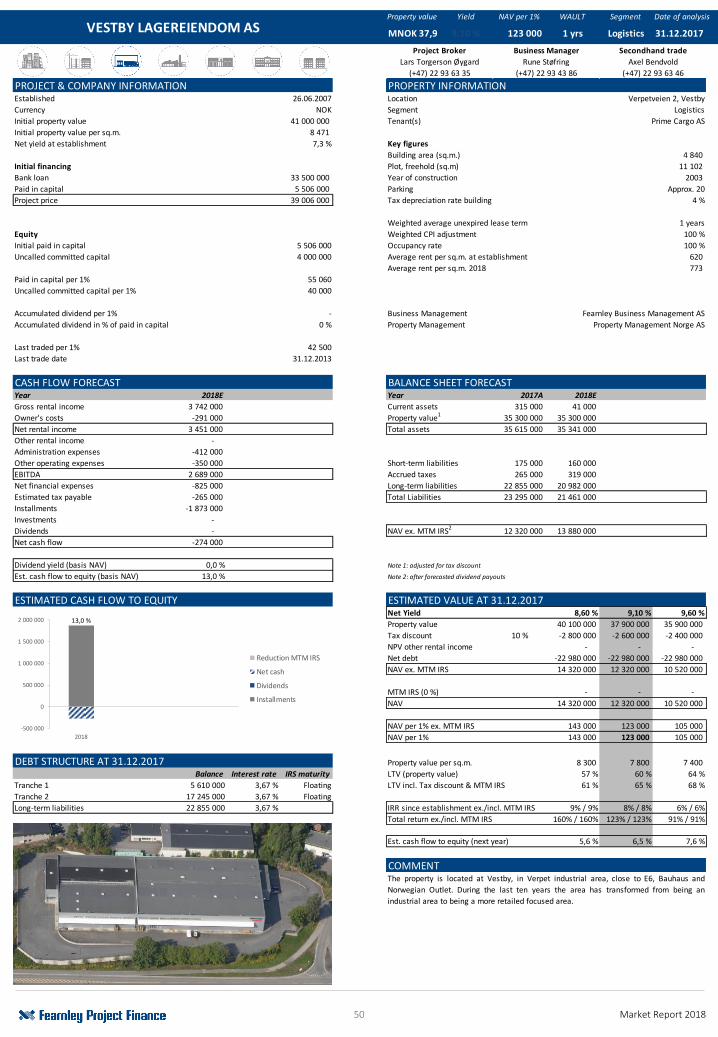
50 Market Report 2018
Property value Yield NAV per 1% WAULT Segment Date of analysis
PROJECT & COMPANY INFORMATION PROPERTY INFORMATIONEstablished 26.06.2007 Location Verpetveien 2, Vestby
Currency NOK Segment Logistics
Initial property value 41 000 000 Tenant(s) Prime Cargo AS
Initial property value per sq.m. 8 471
Net yield at establishment 7,3 % Key figures
Building area (sq.m.) 4 840
Initial financing Plot, freehold (sq.m) 11 102
Bank loan 33 500 000 Year of construction 2003
Paid in capital 5 506 000 Parking Approx. 20
Project price 39 006 000 Tax depreciation rate building 4 %
Weighted average unexpired lease term 1 years
Equity Weighted CPI adjustment 100 %
Initial paid in capital 5 506 000 Occupancy rate 100 %
Uncalled committed capital 4 000 000 Average rent per sq.m. at establishment 620
Average rent per sq.m. 2018 773
Paid in capital per 1% 55 060
Uncalled committed capital per 1% 40 000
Accumulated dividend per 1% - Business Management Fearnley Business Management AS
Accumulated dividend in % of paid in capital 0 % Property Management Property Management Norge AS
Last traded per 1% 42 500
Last trade date 31.12.2013
CASH FLOW FORECAST BALANCE SHEET FORECASTYear 2018E 2019E 2020E Year 2017A 2018E 2019E 2020E
Gross rental income 3 742 000 3 835 000 3 931 000 Current assets 315 000 41 000 455 000 844 000
Owner's costs -291 000 -298 000 -306 000 Property value1
35 300 000 35 300 000 35 300 000 35 300 000
Net rental income 3 451 000 3 537 000 3 625 000 Total assets 35 615 000 35 341 000 35 755 000 36 144 000
Other rental income - - -
Administration expenses -412 000 -176 000 -181 000
Other operating expenses -350 000 - - Short-term liabilities 175 000 160 000 146 000 132 000
EBITDA 2 689 000 3 361 000 3 444 000 Accrued taxes 265 000 319 000 497 000 540 000
Net financial expenses -825 000 -755 000 -685 000 Long-term liabilities 22 855 000 20 982 000 19 109 000 17 236 000
Estimated tax payable -265 000 -319 000 -497 000 Total Liabilities 23 295 000 21 461 000 19 752 000 17 908 000
Installments -1 873 000 -1 873 000 -1 873 000
Investments - - -
Dividends - - - NAV ex. MTM IRS2
12 320 000 13 880 000 16 003 000 18 236 000
Net cash flow -274 000 414 000 389 000
Dividend yield (basis NAV) 0,0 % 0,0 % 0,0 % Note 1: adjusted for tax discount
Est. cash flow to equity (basis NAV) 13,0 % 0,0 % 0,0 % Note 2: after forecasted dividend payouts
ESTIMATED CASH FLOW TO EQUITY ESTIMATED VALUE AT 31.12.2017Net Yield 8,60 % 9,10 % 9,60 %
Property value 40 100 000 37 900 000 35 900 000
Tax discount 10 % -2 800 000 -2 600 000 -2 400 000
NPV other rental income - - -
Net debt -22 980 000 -22 980 000 -22 980 000
NAV ex. MTM IRS 14 320 000 12 320 000 10 520 000
MTM IRS (0 %) - - -
NAV 14 320 000 12 320 000 10 520 000
NAV per 1% ex. MTM IRS 143 000 123 000 105 000
NAV per 1% 143 000 123 000 105 000
DEBT STRUCTURE AT 31.12.2017 Property value per sq.m. 8 300 7 800 7 400
Balance Interest rate IRS maturity LTV (property value) 57 % 60 % 64 %
Tranche 1 5 610 000 3,67 % Floating LTV incl. Tax discount & MTM IRS 61 % 65 % 68 %
Tranche 2 17 245 000 3,67 % Floating
Long-term liabilities 22 855 000 3,67 % IRR since establishment ex./incl. MTM IRS 9% / 9% 8% / 8% 6% / 6%
Total return ex./incl. MTM IRS 160% / 160% 123% / 123% 91% / 91%
Est. cash flow to equity (next year) 5,6 % 6,5 % 7,6 %
COMMENT
(+47) 22 93 63 46
The property is located at Vestby, in Verpet industrial area, close to E6, Bauhaus and
Norwegian Outlet. During the last ten years the area has transformed from being an
industrial area to being a more retailed focused area.
Project Broker Business Manager Secondhand trade
Lars Torgerson Øygard Rune Støfring Axel Bendvold
VESTBY LAGEREIENDOM AS Logistics 31.12.2017
(+47) 22 93 63 35 (+47) 22 93 43 86
MNOK 37,9 9,10 % 123 000 1 yrs
13,0 %
-500 000
0
500 000
1 000 000
1 500 000
2 000 000
2018
Reduction MTM IRS
Net cash
Dividends
Installments
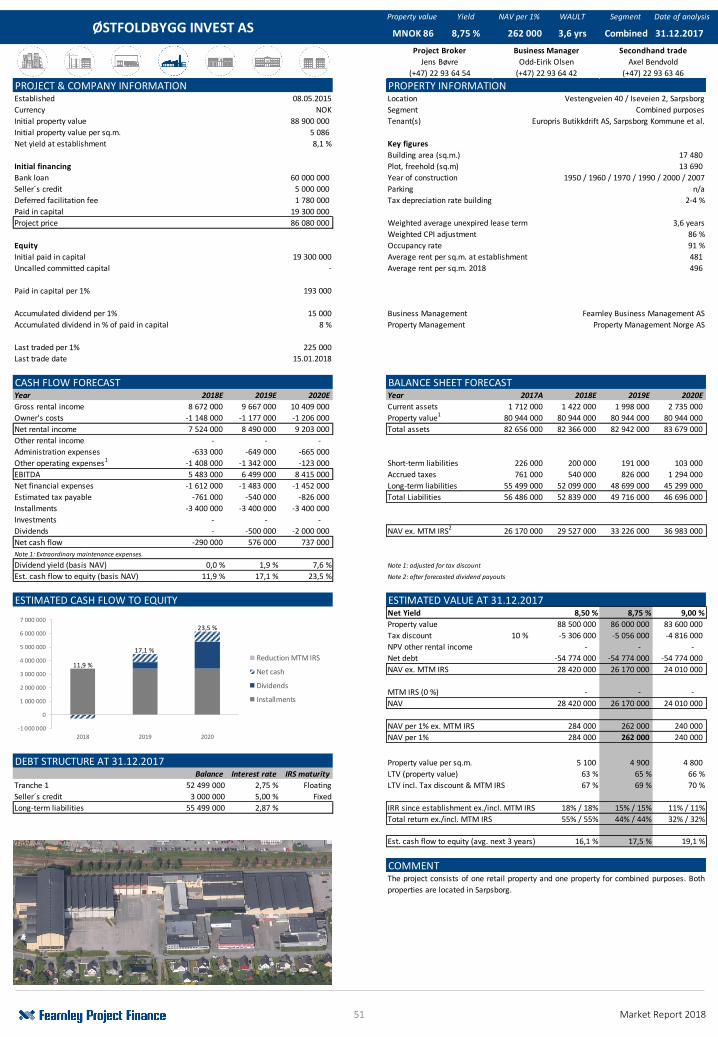
51 Market Report 2018
Property value Yield NAV per 1% WAULT Segment Date of analysis
PROJECT & COMPANY INFORMATION PROPERTY INFORMATIONEstablished 08.05.2015 Location Vestengveien 40 / Iseveien 2, Sarpsborg
Currency NOK Segment Combined purposes
Initial property value 88 900 000 Tenant(s) Europris Butikkdrift AS, Sarpsborg Kommune et al.
Initial property value per sq.m. 5 086
Net yield at establishment 8,1 % Key figures
Building area (sq.m.) 17 480
Initial financing Plot, freehold (sq.m) 13 690
Bank loan 60 000 000 Year of construction 1950 / 1960 / 1970 / 1990 / 2000 / 2007
Seller´s credit 5 000 000 Parking n/a
Deferred facilitation fee 1 780 000 Tax depreciation rate building 2-4 %
Paid in capital 19 300 000
Project price 86 080 000 Weighted average unexpired lease term 3,6 years
Weighted CPI adjustment 86 %
Equity Occupancy rate 91 %
Initial paid in capital 19 300 000 Average rent per sq.m. at establishment 481
Uncalled committed capital - Average rent per sq.m. 2018 496
Paid in capital per 1% 193 000
Accumulated dividend per 1% 15 000 Business Management Fearnley Business Management AS
Accumulated dividend in % of paid in capital 8 % Property Management Property Management Norge AS
Last traded per 1% 225 000
Last trade date 15.01.2018
CASH FLOW FORECAST BALANCE SHEET FORECASTYear 2018E 2019E 2020E Year 2017A 2018E 2019E 2020E
Gross rental income 8 672 000 9 667 000 10 409 000 Current assets 1 712 000 1 422 000 1 998 000 2 735 000
Owner's costs -1 148 000 -1 177 000 -1 206 000 Property value1
80 944 000 80 944 000 80 944 000 80 944 000
Net rental income 7 524 000 8 490 000 9 203 000 Total assets 82 656 000 82 366 000 82 942 000 83 679 000
Other rental income - - -
Administration expenses -633 000 -649 000 -665 000
Other operating expenses1
-1 408 000 -1 342 000 -123 000 Short-term liabilities 226 000 200 000 191 000 103 000
EBITDA 5 483 000 6 499 000 8 415 000 Accrued taxes 761 000 540 000 826 000 1 294 000
Net financial expenses -1 612 000 -1 483 000 -1 452 000 Long-term liabilities 55 499 000 52 099 000 48 699 000 45 299 000
Estimated tax payable -761 000 -540 000 -826 000 Total Liabilities 56 486 000 52 839 000 49 716 000 46 696 000
Installments -3 400 000 -3 400 000 -3 400 000
Investments - - -
Dividends - -500 000 -2 000 000 NAV ex. MTM IRS2
26 170 000 29 527 000 33 226 000 36 983 000
Net cash flow -290 000 576 000 737 000
Note 1: Extraordinary maintenance expenses.
Dividend yield (basis NAV) 0,0 % 1,9 % 7,6 % Note 1: adjusted for tax discount
Est. cash flow to equity (basis NAV) 11,9 % 17,1 % 23,5 % Note 2: after forecasted dividend payouts
ESTIMATED CASH FLOW TO EQUITY ESTIMATED VALUE AT 31.12.2017Net Yield 8,50 % 8,75 % 9,00 %
Property value 88 500 000 86 000 000 83 600 000
Tax discount 10 % -5 306 000 -5 056 000 -4 816 000
NPV other rental income - - -
Net debt -54 774 000 -54 774 000 -54 774 000
NAV ex. MTM IRS 28 420 000 26 170 000 24 010 000
MTM IRS (0 %) - - -
NAV 28 420 000 26 170 000 24 010 000
NAV per 1% ex. MTM IRS 284 000 262 000 240 000
NAV per 1% 284 000 262 000 240 000
DEBT STRUCTURE AT 31.12.2017 Property value per sq.m. 5 100 4 900 4 800
Balance Interest rate IRS maturity LTV (property value) 63 % 65 % 66 %
Tranche 1 52 499 000 2,75 % Floating LTV incl. Tax discount & MTM IRS 67 % 69 % 70 %
Seller´s credit 3 000 000 5,00 % Fixed
Long-term liabilities 55 499 000 2,87 % IRR since establishment ex./incl. MTM IRS 18% / 18% 15% / 15% 11% / 11%
Total return ex./incl. MTM IRS 55% / 55% 44% / 44% 32% / 32%
Est. cash flow to equity (avg. next 3 years) 16,1 % 17,5 % 19,1 %
COMMENT
Combined 31.12.2017
(+47) 22 93 64 54 (+47) 22 93 64 42
MNOK 86 8,75 % 262 000 3,6 yrs
(+47) 22 93 63 46
The project consists of one retail property and one property for combined purposes. Both
properties are located in Sarpsborg.
Project Broker Business Manager Secondhand trade
Jens Bøvre Odd-Eirik Olsen Axel Bendvold
ØSTFOLDBYGG INVEST AS
11,9 %
17,1 %
23,5 %
-1 000 000
0
1 000 000
2 000 000
3 000 000
4 000 000
5 000 000
6 000 000
7 000 000
2018 2019 2020
Reduction MTM IRS
Net cash
Dividends
Installments

SHIPPING & OFFSHORE
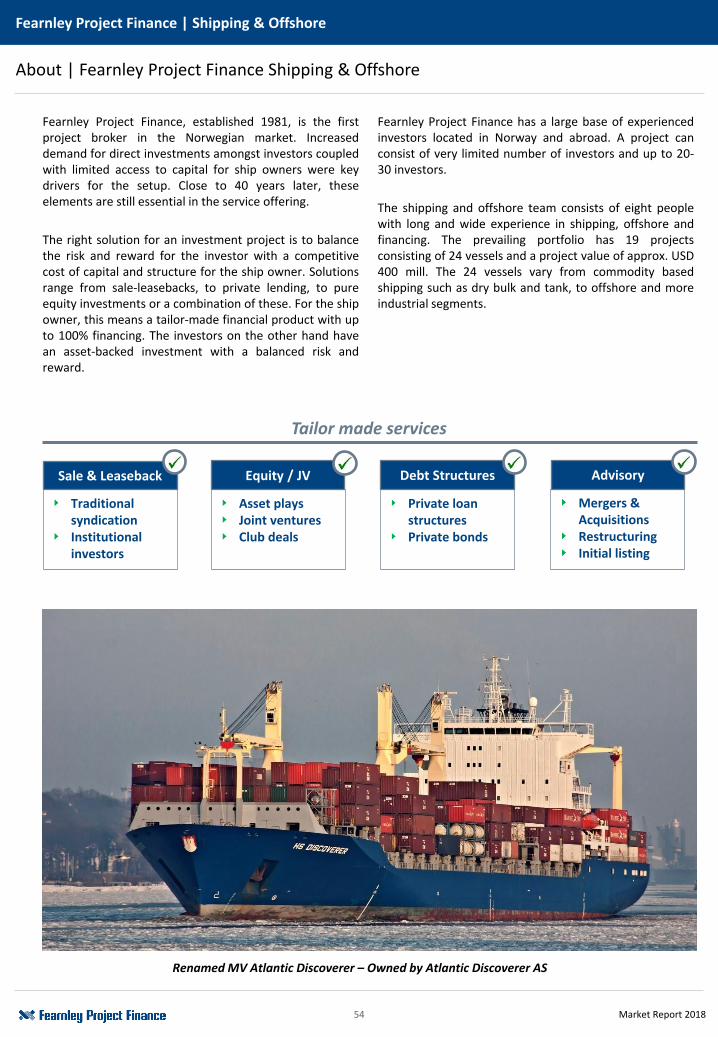
54 Market Report 2018
About | Fearnley Project Finance Shipping & Offshore
Fearnley Project Finance | Shipping & Offshore
Fearnley Project Finance, established 1981, is the firstproject broker in the Norwegian market. Increaseddemand for direct investments amongst investors coupledwith limited access to capital for ship owners were keydrivers for the setup. Close to 40 years later, theseelements are still essential in the service offering.
The right solution for an investment project is to balancethe risk and reward for the investor with a competitivecost of capital and structure for the ship owner. Solutionsrange from sale-leasebacks, to private lending, to pureequity investments or a combination of these. For the shipowner, this means a tailor-made financial product with upto 100% financing. The investors on the other hand havean asset-backed investment with a balanced risk andreward.
Fearnley Project Finance has a large base of experiencedinvestors located in Norway and abroad. A project canconsist of very limited number of investors and up to 20-30 investors.
The shipping and offshore team consists of eight peoplewith long and wide experience in shipping, offshore andfinancing. The prevailing portfolio has 19 projectsconsisting of 24 vessels and a project value of approx. USD400 mill. The 24 vessels vary from commodity basedshipping such as dry bulk and tank, to offshore and moreindustrial segments.
Renamed MV Atlantic Discoverer – Owned by Atlantic Discoverer AS
Tailor made services
Traditional syndicationInstitutional investors
Sale & Leaseback
Private loan structuresPrivate bonds
Debt Structures
Asset playsJoint venturesClub deals
Equity / JV
Mergers & AcquisitionsRestructuringInitial listing
Advisory
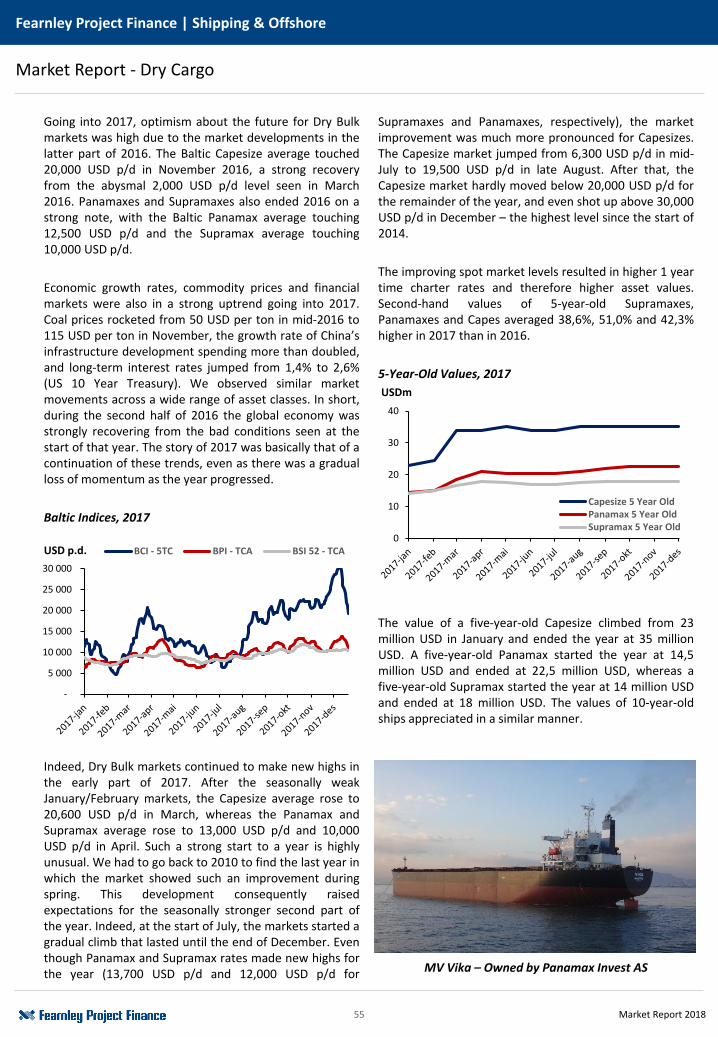
55 Market Report 2018
Fearnley Project Finance | Shipping & Offshore
Market Report - Dry Cargo
Going into 2017, optimism about the future for Dry Bulkmarkets was high due to the market developments in thelatter part of 2016. The Baltic Capesize average touched20,000 USD p/d in November 2016, a strong recoveryfrom the abysmal 2,000 USD p/d level seen in March2016. Panamaxes and Supramaxes also ended 2016 on astrong note, with the Baltic Panamax average touching12,500 USD p/d and the Supramax average touching10,000 USD p/d.
Economic growth rates, commodity prices and financialmarkets were also in a strong uptrend going into 2017.Coal prices rocketed from 50 USD per ton in mid-2016 to115 USD per ton in November, the growth rate of China’sinfrastructure development spending more than doubled,and long-term interest rates jumped from 1,4% to 2,6%(US 10 Year Treasury). We observed similar marketmovements across a wide range of asset classes. In short,during the second half of 2016 the global economy wasstrongly recovering from the bad conditions seen at thestart of that year. The story of 2017 was basically that of acontinuation of these trends, even as there was a gradualloss of momentum as the year progressed.
Baltic Indices, 2017
Indeed, Dry Bulk markets continued to make new highs inthe early part of 2017. After the seasonally weakJanuary/February markets, the Capesize average rose to20,600 USD p/d in March, whereas the Panamax andSupramax average rose to 13,000 USD p/d and 10,000USD p/d in April. Such a strong start to a year is highlyunusual. We had to go back to 2010 to find the last year inwhich the market showed such an improvement duringspring. This development consequently raisedexpectations for the seasonally stronger second part ofthe year. Indeed, at the start of July, the markets started agradual climb that lasted until the end of December. Eventhough Panamax and Supramax rates made new highs forthe year (13,700 USD p/d and 12,000 USD p/d for
Supramaxes and Panamaxes, respectively), the marketimprovement was much more pronounced for Capesizes.The Capesize market jumped from 6,300 USD p/d in mid-July to 19,500 USD p/d in late August. After that, theCapesize market hardly moved below 20,000 USD p/d forthe remainder of the year, and even shot up above 30,000USD p/d in December – the highest level since the start of2014.
The improving spot market levels resulted in higher 1 yeartime charter rates and therefore higher asset values.Second-hand values of 5-year-old Supramaxes,Panamaxes and Capes averaged 38,6%, 51,0% and 42,3%higher in 2017 than in 2016.
5-Year-Old Values, 2017
The value of a five-year-old Capesize climbed from 23million USD in January and ended the year at 35 millionUSD. A five-year-old Panamax started the year at 14,5million USD and ended at 22,5 million USD, whereas afive-year-old Supramax started the year at 14 million USDand ended at 18 million USD. The values of 10-year-oldships appreciated in a similar manner.
MV Vika – Owned by Panamax Invest AS
-
5 000
10 000
15 000
20 000
25 000
30 000
USD p.d. BCI - 5TC BPI - TCA BSI 52 - TCA0
10
20
30
40
USDm
Capesize 5 Year OldPanamax 5 Year OldSupramax 5 Year Old
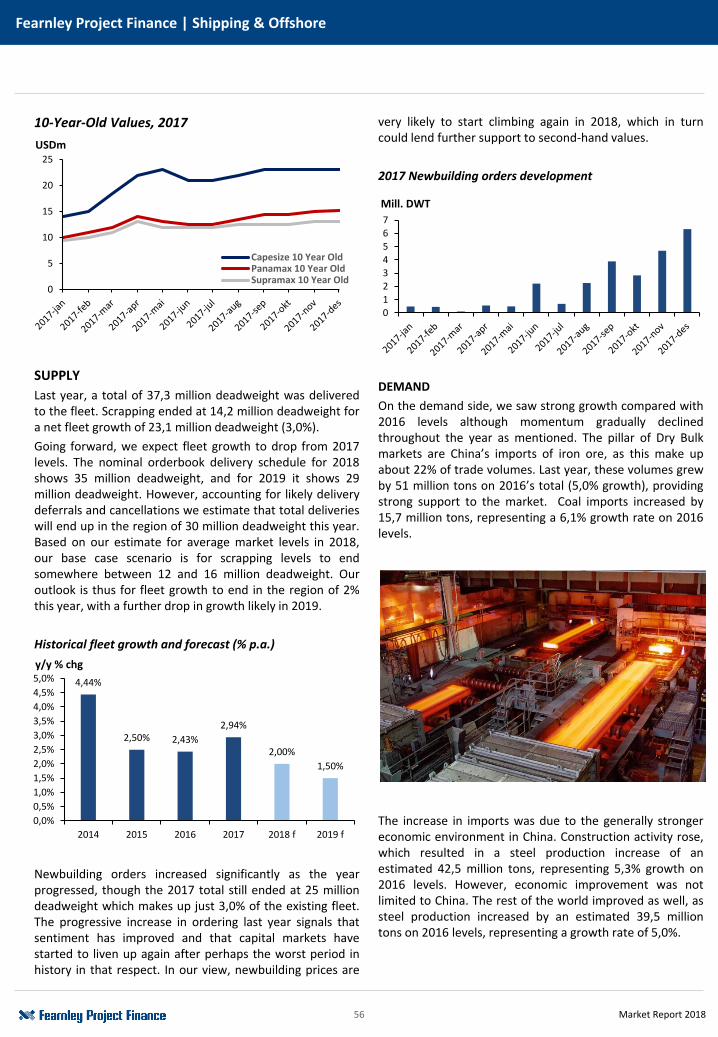
56 Market Report 2018
Fearnley Project Finance | Shipping & Offshore
10-Year-Old Values, 2017
SUPPLY
Last year, a total of 37,3 million deadweight was deliveredto the fleet. Scrapping ended at 14,2 million deadweight fora net fleet growth of 23,1 million deadweight (3,0%).
Going forward, we expect fleet growth to drop from 2017levels. The nominal orderbook delivery schedule for 2018shows 35 million deadweight, and for 2019 it shows 29million deadweight. However, accounting for likely deliverydeferrals and cancellations we estimate that total deliverieswill end up in the region of 30 million deadweight this year.Based on our estimate for average market levels in 2018,our base case scenario is for scrapping levels to endsomewhere between 12 and 16 million deadweight. Ouroutlook is thus for fleet growth to end in the region of 2%this year, with a further drop in growth likely in 2019.
Historical fleet growth and forecast (% p.a.)
Newbuilding orders increased significantly as the yearprogressed, though the 2017 total still ended at 25 milliondeadweight which makes up just 3,0% of the existing fleet.The progressive increase in ordering last year signals thatsentiment has improved and that capital markets havestarted to liven up again after perhaps the worst period inhistory in that respect. In our view, newbuilding prices are
very likely to start climbing again in 2018, which in turncould lend further support to second-hand values.
2017 Newbuilding orders development
DEMAND
On the demand side, we saw strong growth compared with2016 levels although momentum gradually declinedthroughout the year as mentioned. The pillar of Dry Bulkmarkets are China’s imports of iron ore, as this make upabout 22% of trade volumes. Last year, these volumes grewby 51 million tons on 2016’s total (5,0% growth), providingstrong support to the market. Coal imports increased by15,7 million tons, representing a 6,1% growth rate on 2016levels.
The increase in imports was due to the generally strongereconomic environment in China. Construction activity rose,which resulted in a steel production increase of anestimated 42,5 million tons, representing 5,3% growth on2016 levels. However, economic improvement was notlimited to China. The rest of the world improved as well, assteel production increased by an estimated 39,5 milliontons on 2016 levels, representing a growth rate of 5,0%.
4,44%
2,50% 2,43%
2,94%
2,00%
1,50%
0,0%
0,5%
1,0%
1,5%
2,0%
2,5%
3,0%
3,5%
4,0%
4,5%
5,0%
2014 2015 2016 2017 2018 f 2019 f
y/y % chg
0
12
34
56
7
Mill. DWT
0
5
10
15
20
25
USDm
Capesize 10 Year OldPanamax 10 Year OldSupramax 10 Year Old
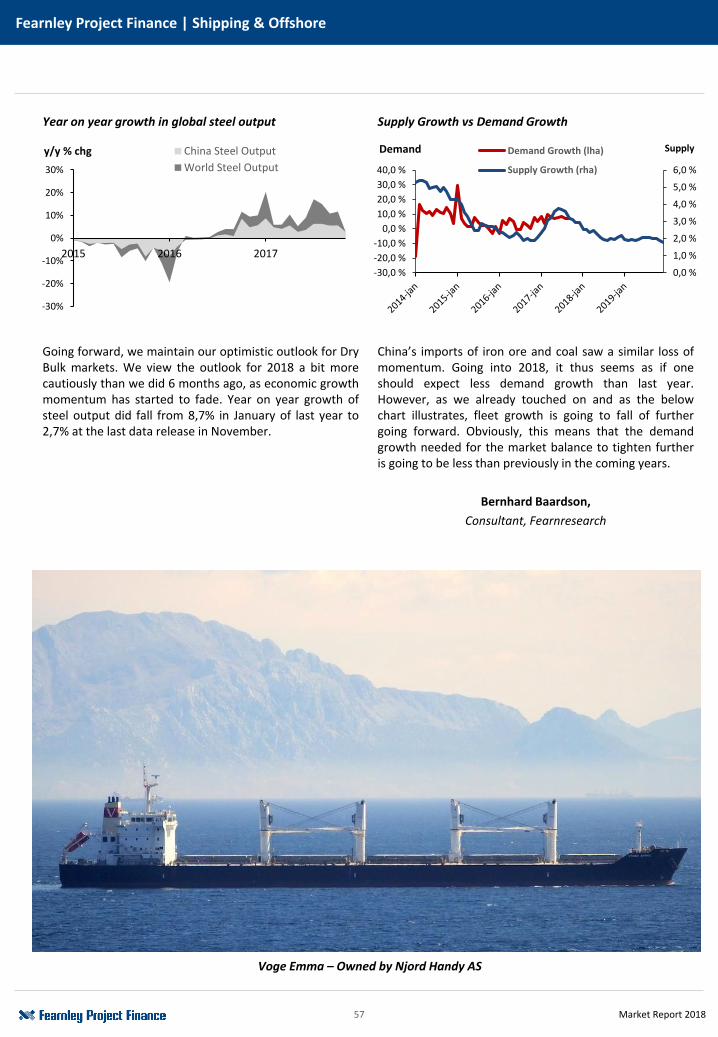
57 Market Report 2018
Fearnley Project Finance | Shipping & Offshore
Year on year growth in global steel output
Going forward, we maintain our optimistic outlook for DryBulk markets. We view the outlook for 2018 a bit morecautiously than we did 6 months ago, as economic growthmomentum has started to fade. Year on year growth ofsteel output did fall from 8,7% in January of last year to2,7% at the last data release in November.
Supply Growth vs Demand Growth
China’s imports of iron ore and coal saw a similar loss ofmomentum. Going into 2018, it thus seems as if oneshould expect less demand growth than last year.However, as we already touched on and as the belowchart illustrates, fleet growth is going to fall of furthergoing forward. Obviously, this means that the demandgrowth needed for the market balance to tighten furtheris going to be less than previously in the coming years.
Bernhard Baardson,
Consultant, Fearnresearch
-30%
-20%
-10%
0%
10%
20%
30%
2015 2016 2017
y/y % chg China Steel Output
World Steel Output
0,0 %
1,0 %
2,0 %
3,0 %
4,0 %
5,0 %
6,0 %
-30,0 %
-20,0 %
-10,0 %
0,0 %
10,0 %
20,0 %
30,0 %
40,0 %
SupplyDemand Demand Growth (lha)
Supply Growth (rha)
Voge Emma – Owned by Njord Handy AS
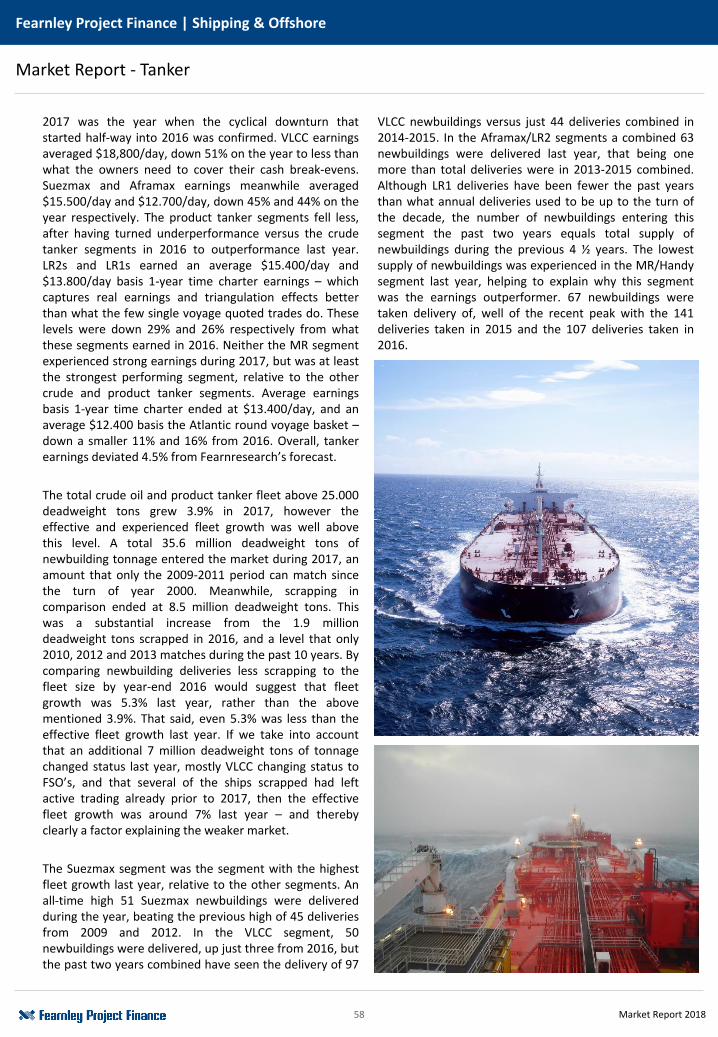
58 Market Report 2018
Market Report - Tanker
Fearnley Project Finance | Shipping & Offshore
2017 was the year when the cyclical downturn thatstarted half-way into 2016 was confirmed. VLCC earningsaveraged $18,800/day, down 51% on the year to less thanwhat the owners need to cover their cash break-evens.Suezmax and Aframax earnings meanwhile averaged$15.500/day and $12.700/day, down 45% and 44% on theyear respectively. The product tanker segments fell less,after having turned underperformance versus the crudetanker segments in 2016 to outperformance last year.LR2s and LR1s earned an average $15.400/day and$13.800/day basis 1-year time charter earnings – whichcaptures real earnings and triangulation effects betterthan what the few single voyage quoted trades do. Theselevels were down 29% and 26% respectively from whatthese segments earned in 2016. Neither the MR segmentexperienced strong earnings during 2017, but was at leastthe strongest performing segment, relative to the othercrude and product tanker segments. Average earningsbasis 1-year time charter ended at $13.400/day, and anaverage $12.400 basis the Atlantic round voyage basket –down a smaller 11% and 16% from 2016. Overall, tankerearnings deviated 4.5% from Fearnresearch’s forecast.
The total crude oil and product tanker fleet above 25.000deadweight tons grew 3.9% in 2017, however theeffective and experienced fleet growth was well abovethis level. A total 35.6 million deadweight tons ofnewbuilding tonnage entered the market during 2017, anamount that only the 2009-2011 period can match sincethe turn of year 2000. Meanwhile, scrapping incomparison ended at 8.5 million deadweight tons. Thiswas a substantial increase from the 1.9 milliondeadweight tons scrapped in 2016, and a level that only2010, 2012 and 2013 matches during the past 10 years. Bycomparing newbuilding deliveries less scrapping to thefleet size by year-end 2016 would suggest that fleetgrowth was 5.3% last year, rather than the abovementioned 3.9%. That said, even 5.3% was less than theeffective fleet growth last year. If we take into accountthat an additional 7 million deadweight tons of tonnagechanged status last year, mostly VLCC changing status toFSO’s, and that several of the ships scrapped had leftactive trading already prior to 2017, then the effectivefleet growth was around 7% last year – and therebyclearly a factor explaining the weaker market.
The Suezmax segment was the segment with the highestfleet growth last year, relative to the other segments. Anall-time high 51 Suezmax newbuildings were deliveredduring the year, beating the previous high of 45 deliveriesfrom 2009 and 2012. In the VLCC segment, 50newbuildings were delivered, up just three from 2016, butthe past two years combined have seen the delivery of 97
VLCC newbuildings versus just 44 deliveries combined in2014-2015. In the Aframax/LR2 segments a combined 63newbuildings were delivered last year, that being onemore than total deliveries were in 2013-2015 combined.Although LR1 deliveries have been fewer the past yearsthan what annual deliveries used to be up to the turn ofthe decade, the number of newbuildings entering thissegment the past two years equals total supply ofnewbuildings during the previous 4 ½ years. The lowestsupply of newbuildings was experienced in the MR/Handysegment last year, helping to explain why this segmentwas the earnings outperformer. 67 newbuildings weretaken delivery of, well of the recent peak with the 141deliveries taken in 2015 and the 107 deliveries taken in2016.

59 Market Report 2018
Fearnley Project Finance | Shipping & Offshore
Although it is too early to conclude on ton-miles anddemand at the time of writing, preliminary data suggestthat demand was less of an issue compared with what oneperhaps would think, given that OPEC showed a gooddiscipline on their production cut that limited oilproduction growth and the flow of crude oils in 2017. Thepreliminary data suggest that crude oil volumes out of theMiddle East were down on the year, caused by less liftedin to the West while showing moderate growth to Asia,but this was more than counterbalanced by a goodgrowth in cargoes lifted the longer route from the Atlanticto Asia, especially from the Caribbean/U.S. Gulf. Despitelack of growth in volumes out of West Africa, wewitnessed that more headed East to Asia, rather than toEurope and U.S. This favoured VLCCs over Suezmaxes andcaused the latter to lose market share to VLCCs last year,and thereby leaving the Suezmaxes with a double-whammy in 2017 as it also suffered from the highest fleetgrowth.
Product tanker demand saw good support from strongrefinery runs during 2017, the latter growing 1.7% on theyear. Gasoil demand appear to have been a key driver,
while weak naphtha demand and exports capped overalldemand – the latter limiting the demand for LRs inparticular. Overall product tanker demand was alsocapped by high regional inventories of most oil products,which limits the number of arbitrages product tankerscould enjoy the demand from.
The past 4 years have developed very much in line withour expectations and although we have expected thatcurrent downturn will last through most of 2018, we mustadmit that the start of the year has been even weakerthan expected. The ongoing rebalancing of the oil marketshould however be done by Q3’18 and a reversal of OPECproduction combined with lower inventories/ morearbitrages should bring demand back on a stronger pathfrom second half of this year. High supply growth willhowever continue to cap the market from recoveringinitially, but we continue to see late 2018 as the likelybeginning of the next recovery, as the supply/demandbalance looks attractive from 2019. A recovery in 2019 islikely to strengthen further into 2020, driven by effects ofthe IMO sulphur cap primarily.
Dag Kilen
Senior Shipping Analyst
Fearnresearch
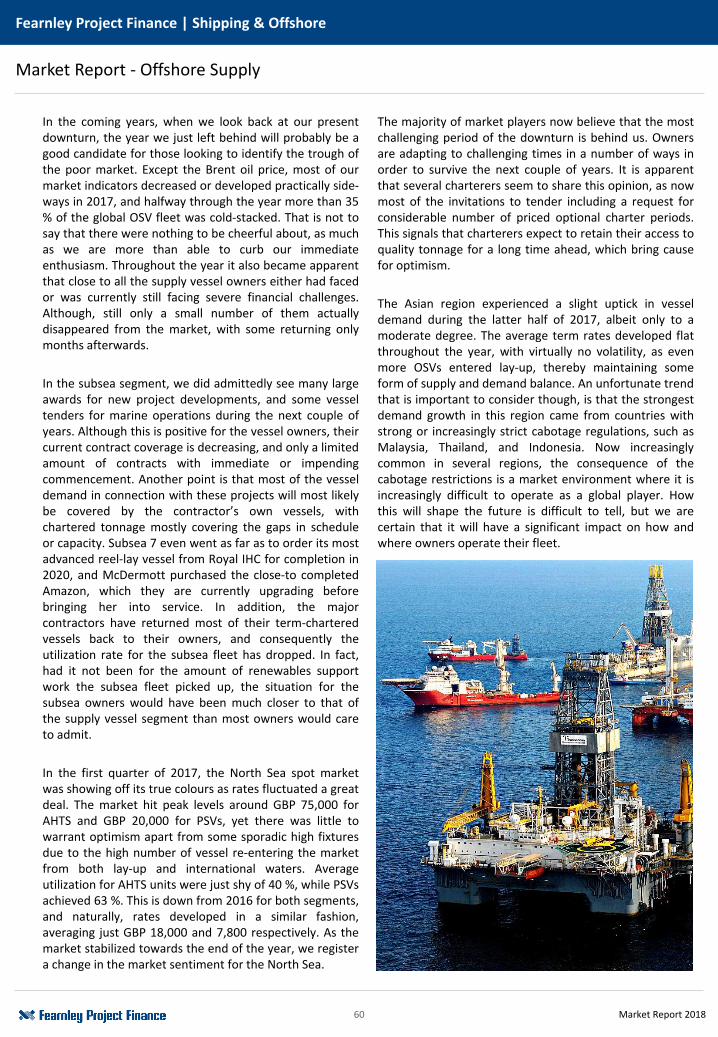
60 Market Report 2018
Fearnley Project Finance | Shipping & Offshore
In the coming years, when we look back at our presentdownturn, the year we just left behind will probably be agood candidate for those looking to identify the trough ofthe poor market. Except the Brent oil price, most of ourmarket indicators decreased or developed practically side-ways in 2017, and halfway through the year more than 35% of the global OSV fleet was cold-stacked. That is not tosay that there were nothing to be cheerful about, as muchas we are more than able to curb our immediateenthusiasm. Throughout the year it also became apparentthat close to all the supply vessel owners either had facedor was currently still facing severe financial challenges.Although, still only a small number of them actuallydisappeared from the market, with some returning onlymonths afterwards.
In the subsea segment, we did admittedly see many largeawards for new project developments, and some vesseltenders for marine operations during the next couple ofyears. Although this is positive for the vessel owners, theircurrent contract coverage is decreasing, and only a limitedamount of contracts with immediate or impendingcommencement. Another point is that most of the vesseldemand in connection with these projects will most likelybe covered by the contractor’s own vessels, withchartered tonnage mostly covering the gaps in scheduleor capacity. Subsea 7 even went as far as to order its mostadvanced reel-lay vessel from Royal IHC for completion in2020, and McDermott purchased the close-to completedAmazon, which they are currently upgrading beforebringing her into service. In addition, the majorcontractors have returned most of their term-charteredvessels back to their owners, and consequently theutilization rate for the subsea fleet has dropped. In fact,had it not been for the amount of renewables supportwork the subsea fleet picked up, the situation for thesubsea owners would have been much closer to that ofthe supply vessel segment than most owners would careto admit.
In the first quarter of 2017, the North Sea spot marketwas showing off its true colours as rates fluctuated a greatdeal. The market hit peak levels around GBP 75,000 forAHTS and GBP 20,000 for PSVs, yet there was little towarrant optimism apart from some sporadic high fixturesdue to the high number of vessel re-entering the marketfrom both lay-up and international waters. Averageutilization for AHTS units were just shy of 40 %, while PSVsachieved 63 %. This is down from 2016 for both segments,and naturally, rates developed in a similar fashion,averaging just GBP 18,000 and 7,800 respectively. As themarket stabilized towards the end of the year, we registera change in the market sentiment for the North Sea.
The majority of market players now believe that the mostchallenging period of the downturn is behind us. Ownersare adapting to challenging times in a number of ways inorder to survive the next couple of years. It is apparentthat several charterers seem to share this opinion, as nowmost of the invitations to tender including a request forconsiderable number of priced optional charter periods.This signals that charterers expect to retain their access toquality tonnage for a long time ahead, which bring causefor optimism.
The Asian region experienced a slight uptick in vesseldemand during the latter half of 2017, albeit only to amoderate degree. The average term rates developed flatthroughout the year, with virtually no volatility, as evenmore OSVs entered lay-up, thereby maintaining someform of supply and demand balance. An unfortunate trendthat is important to consider though, is that the strongestdemand growth in this region came from countries withstrong or increasingly strict cabotage regulations, such asMalaysia, Thailand, and Indonesia. Now increasinglycommon in several regions, the consequence of thecabotage restrictions is a market environment where it isincreasingly difficult to operate as a global player. Howthis will shape the future is difficult to tell, but we arecertain that it will have a significant impact on how andwhere owners operate their fleet.
Market Report - Offshore Supply
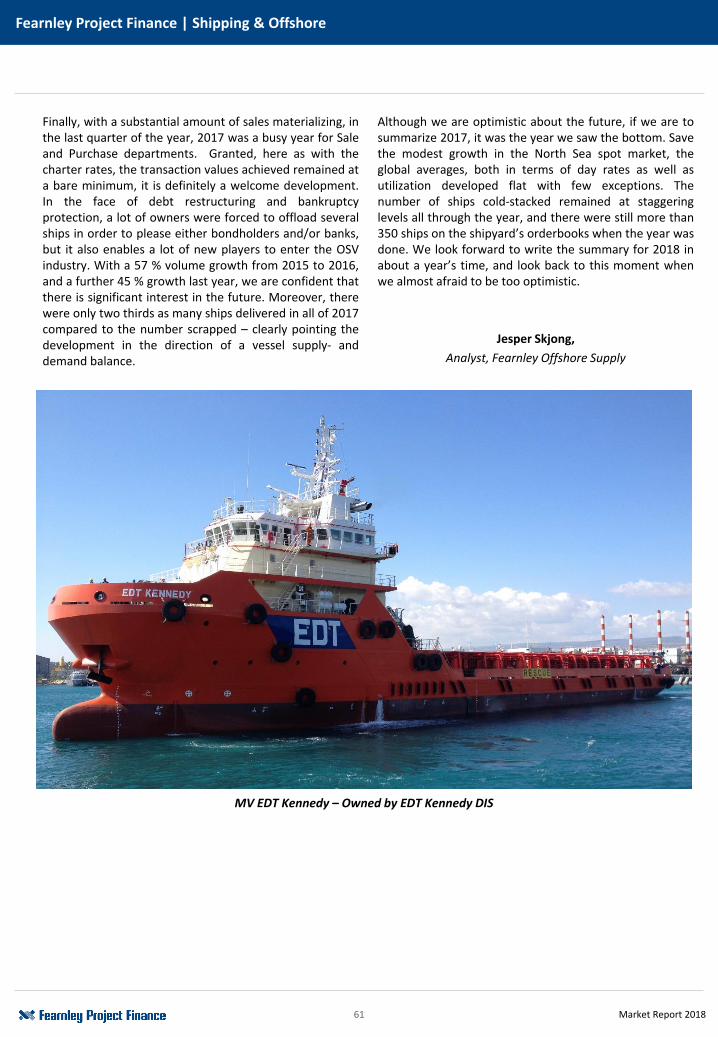
61 Market Report 2018
Fearnley Project Finance | Shipping & Offshore
Finally, with a substantial amount of sales materializing, inthe last quarter of the year, 2017 was a busy year for Saleand Purchase departments. Granted, here as with thecharter rates, the transaction values achieved remained ata bare minimum, it is definitely a welcome development.In the face of debt restructuring and bankruptcyprotection, a lot of owners were forced to offload severalships in order to please either bondholders and/or banks,but it also enables a lot of new players to enter the OSVindustry. With a 57 % volume growth from 2015 to 2016,and a further 45 % growth last year, we are confident thatthere is significant interest in the future. Moreover, therewere only two thirds as many ships delivered in all of 2017compared to the number scrapped – clearly pointing thedevelopment in the direction of a vessel supply- anddemand balance.
Although we are optimistic about the future, if we are tosummarize 2017, it was the year we saw the bottom. Savethe modest growth in the North Sea spot market, theglobal averages, both in terms of day rates as well asutilization developed flat with few exceptions. Thenumber of ships cold-stacked remained at staggeringlevels all through the year, and there were still more than350 ships on the shipyard’s orderbooks when the year wasdone. We look forward to write the summary for 2018 inabout a year’s time, and look back to this moment whenwe almost afraid to be too optimistic.
Jesper Skjong,
Analyst, Fearnley Offshore Supply
MV EDT Kennedy – Owned by EDT Kennedy DIS

62 Market Report 2018
2.0x money multiple on concluded projects arranged by FPF since 2000
Concluded Projects
Dry Cargo Tank Container/RoRo Gas Offshore
31 vessels 12 vessels 22 vessels 11 vessels 21 vessels
22 projects 8 projects 13 projects 2 projects 16 projects
Employment
By #vessels
USD m
Project price USD 475 USD 166 USD 300 USD 244 USD 398
Paid in equity USD 98 USD 52 USD 61 USD 71 USD 105
Acc. dividends USD 164 USD 66 USD 158 USD 136 USD 245
Multiple 1.67 1.27 2.58 1.92 2.33
BB
TC/Pool
BB
TC/Pool
BB
TC/Pool
Spot
BB
Spot
Artic Fjord and Artic Lady – Previously owned by Artic Fjord DIS and Artic Lady DIS – Realised IRR: 29 % and 27 % respectively
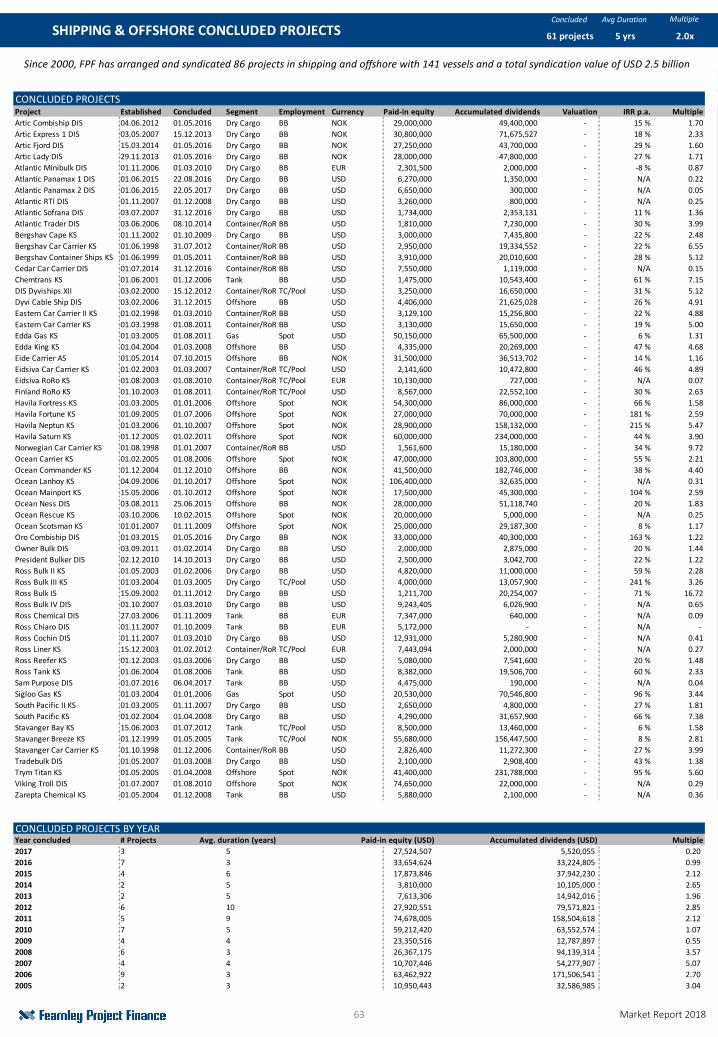
63 Market Report 2018
Concluded Avg Duration
CONCLUDED PROJECTSProject Established Concluded Segment Employment Currency Paid-in equity Accumulated dividends Valuation IRR p.a. Multiple
Artic Combiship DIS 04.06.2012 01.05.2016 Dry Cargo BB NOK 29,000,000 49,400,000 - 15 % 1.70
Artic Express 1 DIS 03.05.2007 15.12.2013 Dry Cargo BB NOK 30,800,000 71,675,527 - 18 % 2.33
Artic Fjord DIS 15.03.2014 01.05.2016 Dry Cargo BB NOK 27,250,000 43,700,000 - 29 % 1.60
Artic Lady DIS 29.11.2013 01.05.2016 Dry Cargo BB NOK 28,000,000 47,800,000 - 27 % 1.71
Atlantic Minibulk DIS 01.11.2006 01.03.2010 Dry Cargo BB EUR 2,301,500 2,000,000 - -8 % 0.87
Atlantic Panamax 1 DIS 01.06.2015 22.08.2016 Dry Cargo BB USD 6,270,000 1,350,000 - N/A 0.22
Atlantic Panamax 2 DIS 01.06.2015 22.05.2017 Dry Cargo BB USD 6,650,000 300,000 - N/A 0.05
Atlantic RTI DIS 01.11.2007 01.12.2008 Dry Cargo BB USD 3,260,000 800,000 - N/A 0.25
Atlantic Sofrana DIS 03.07.2007 31.12.2016 Dry Cargo BB USD 1,734,000 2,353,131 - 11 % 1.36
Atlantic Trader DIS 03.06.2006 08.10.2014 Container/RoRoBB USD 1,810,000 7,230,000 - 30 % 3.99
Bergshav Cape KS 01.11.2002 01.10.2009 Dry Cargo BB USD 3,000,000 7,435,800 - 22 % 2.48
Bergshav Car Carrier KS 01.06.1998 31.07.2012 Container/RoRoBB USD 2,950,000 19,334,552 - 22 % 6.55
Bergshav Container Ships KS 01.06.1999 01.05.2011 Container/RoRoBB USD 3,910,000 20,010,600 - 28 % 5.12
Cedar Car Carrier DIS 01.07.2014 31.12.2016 Container/RoRoBB USD 7,550,000 1,119,000 - N/A 0.15
Chemtrans KS 01.06.2001 01.12.2006 Tank BB USD 1,475,000 10,543,400 - 61 % 7.15
DIS Dyviships XII 03.02.2000 15.12.2012 Container/RoRoTC/Pool USD 3,250,000 16,650,000 - 31 % 5.12
Dyvi Cable Ship DIS 03.02.2006 31.12.2015 Offshore BB USD 4,406,000 21,625,028 - 26 % 4.91
Eastern Car Carrier II KS 01.02.1998 01.03.2010 Container/RoRoBB USD 3,129,100 15,256,800 - 22 % 4.88
Eastern Car Carrier KS 01.03.1998 01.08.2011 Container/RoRoBB USD 3,130,000 15,650,000 - 19 % 5.00
Edda Gas KS 01.03.2005 01.08.2011 Gas Spot USD 50,150,000 65,500,000 - 6 % 1.31
Edda King KS 01.04.2004 01.03.2008 Offshore BB USD 4,335,000 20,269,000 - 47 % 4.68
Eide Carrier AS 01.05.2014 07.10.2015 Offshore BB NOK 31,500,000 36,513,702 - 14 % 1.16
Eidsiva Car Carrier KS 01.02.2003 01.03.2007 Container/RoRoTC/Pool USD 2,141,600 10,472,800 - 46 % 4.89
Eidsiva RoRo KS 01.08.2003 01.08.2010 Container/RoRoTC/Pool EUR 10,130,000 727,000 - N/A 0.07
Finland RoRo KS 01.10.2003 01.08.2011 Container/RoRoTC/Pool USD 8,567,000 22,552,100 - 30 % 2.63
Havila Fortress KS 01.03.2005 01.01.2006 Offshore Spot NOK 54,300,000 86,000,000 - 66 % 1.58
Havila Fortune KS 01.09.2005 01.07.2006 Offshore Spot NOK 27,000,000 70,000,000 - 181 % 2.59
Havila Neptun KS 01.03.2006 01.10.2007 Offshore Spot NOK 28,900,000 158,132,000 - 215 % 5.47
Havila Saturn KS 01.12.2005 01.02.2011 Offshore Spot NOK 60,000,000 234,000,000 - 44 % 3.90
Norwegian Car Carrier KS 01.08.1998 01.01.2007 Container/RoRoBB USD 1,561,600 15,180,000 - 34 % 9.72
Ocean Carrier KS 01.02.2005 01.08.2006 Offshore Spot NOK 47,000,000 103,800,000 - 55 % 2.21
Ocean Commander KS 01.12.2004 01.12.2010 Offshore BB NOK 41,500,000 182,746,000 - 38 % 4.40
Ocean Lanhoy KS 04.09.2006 01.10.2017 Offshore Spot NOK 106,400,000 32,635,000 - N/A 0.31
Ocean Mainport KS 15.05.2006 01.10.2012 Offshore Spot NOK 17,500,000 45,300,000 - 104 % 2.59
Ocean Ness DIS 03.08.2011 25.06.2015 Offshore BB NOK 28,000,000 51,118,740 - 20 % 1.83
Ocean Rescue KS 03.10.2006 10.02.2015 Offshore Spot NOK 20,000,000 5,000,000 - N/A 0.25
Ocean Scotsman KS 01.01.2007 01.11.2009 Offshore Spot NOK 25,000,000 29,187,300 - 8 % 1.17
Oro Combiship DIS 01.03.2015 01.05.2016 Dry Cargo BB NOK 33,000,000 40,300,000 - 163 % 1.22
Owner Bulk DIS 03.09.2011 01.02.2014 Dry Cargo BB USD 2,000,000 2,875,000 - 20 % 1.44
President Bulker DIS 02.12.2010 14.10.2013 Dry Cargo BB USD 2,500,000 3,042,700 - 22 % 1.22
Ross Bulk II KS 01.05.2003 01.02.2006 Dry Cargo BB USD 4,820,000 11,000,000 - 59 % 2.28
Ross Bulk III KS 01.03.2004 01.03.2005 Dry Cargo TC/Pool USD 4,000,000 13,057,900 - 241 % 3.26
Ross Bulk IS 15.09.2002 01.11.2012 Dry Cargo BB USD 1,211,700 20,254,007 - 71 % 16.72
Ross Bulk IV DIS 01.10.2007 01.03.2010 Dry Cargo BB USD 9,243,405 6,026,900 - N/A 0.65
Ross Chemical DIS 27.03.2006 01.11.2009 Tank BB EUR 7,347,000 640,000 - N/A 0.09
Ross Chiaro DIS 01.11.2007 01.10.2009 Tank BB EUR 5,172,000 - - N/A -
Ross Cochin DIS 01.11.2007 01.03.2010 Dry Cargo BB USD 12,931,000 5,280,900 - N/A 0.41
Ross Liner KS 15.12.2003 01.02.2012 Container/RoRoTC/Pool EUR 7,443,094 2,000,000 - N/A 0.27
Ross Reefer KS 01.12.2003 01.03.2006 Dry Cargo BB USD 5,080,000 7,541,600 - 20 % 1.48
Ross Tank KS 01.06.2004 01.08.2006 Tank BB USD 8,382,000 19,506,700 - 60 % 2.33
Sam Purpose DIS 01.07.2016 06.04.2017 Tank BB USD 4,475,000 190,000 - N/A 0.04
Sigloo Gas KS 01.03.2004 01.01.2006 Gas Spot USD 20,530,000 70,546,800 - 96 % 3.44
South Pacific II KS 01.03.2005 01.11.2007 Dry Cargo BB USD 2,650,000 4,800,000 - 27 % 1.81
South Pacific KS 01.02.2004 01.04.2008 Dry Cargo BB USD 4,290,000 31,657,900 - 66 % 7.38
Stavanger Bay KS 15.06.2003 01.07.2012 Tank TC/Pool USD 8,500,000 13,460,000 - 6 % 1.58
Stavanger Breeze KS 01.12.1999 01.05.2005 Tank TC/Pool NOK 55,680,000 156,447,500 - 8 % 2.81
Stavanger Car Carrier KS 01.10.1998 01.12.2006 Container/RoRoBB USD 2,826,400 11,272,300 - 27 % 3.99
Tradebulk DIS 01.05.2007 01.03.2008 Dry Cargo BB USD 2,100,000 2,908,400 - 43 % 1.38
Trym Titan KS 01.05.2005 01.04.2008 Offshore Spot NOK 41,400,000 231,788,000 - 95 % 5.60
Viking Troll DIS 01.07.2007 01.08.2010 Offshore Spot NOK 74,650,000 22,000,000 - N/A 0.29
Zarepta Chemical KS 01.05.2004 01.12.2008 Tank BB USD 5,880,000 2,100,000 - N/A 0.36
CONCLUDED PROJECTS BY YEARYear concluded # Projects Avg. duration (years) Paid-in equity (USD) Accumulated dividends (USD) Multiple
2017 3 5 27,524,507 5,520,055 0.20
2016 7 3 33,654,624 33,224,805 0.99
2015 4 6 17,873,846 37,942,230 2.12
2014 2 5 3,810,000 10,105,000 2.65
2013 2 5 7,613,306 14,942,016 1.96
2012 6 10 27,920,551 79,571,821 2.85
2011 5 9 74,678,005 158,504,618 2.12
2010 7 5 59,212,420 63,552,574 1.07
2009 4 4 23,350,516 12,787,897 0.55
2008 6 3 26,367,175 94,139,314 3.57
2007 4 4 10,707,446 54,277,907 5.07
2006 9 3 63,462,922 171,506,541 2.70
2005 2 3 10,950,443 32,586,985 3.04
Multiple
2.0x5 yrsSHIPPING & OFFSHORE CONCLUDED PROJECTS 61 projects
Since 2000, FPF has arranged and syndicated 86 projects in shipping and offshore with 141 vessels and a total syndication value of USD 2.5 billion
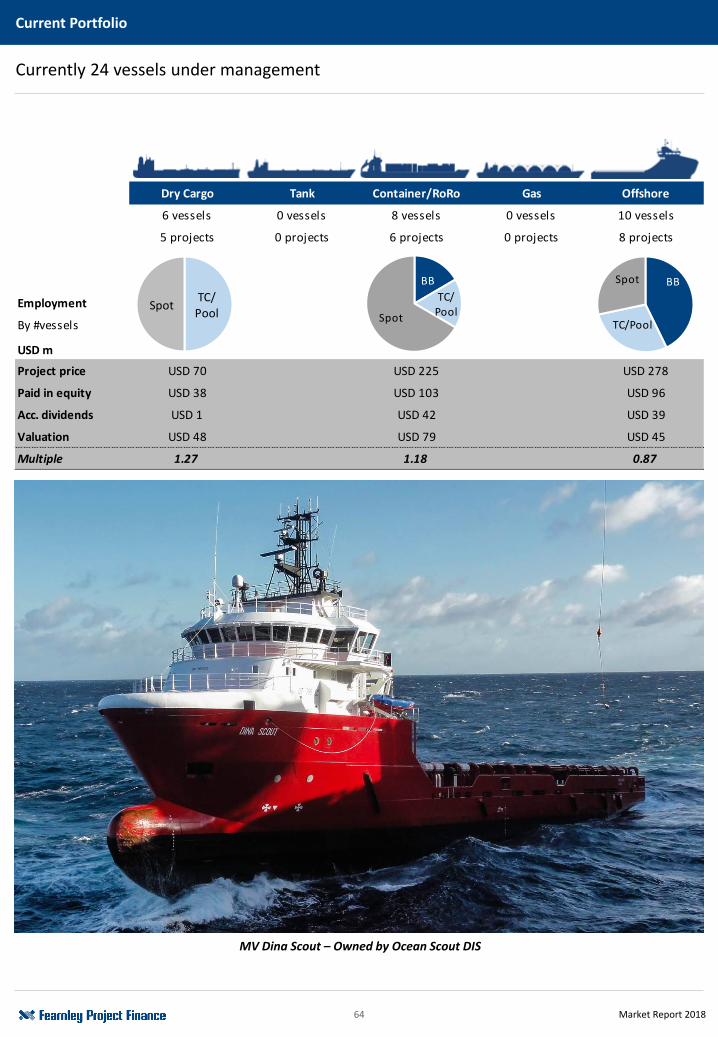
64 Market Report 2018
Currently 24 vessels under management
Current Portfolio
Dry Cargo Tank Container/RoRo Gas Offshore
6 vessels 0 vessels 8 vessels 0 vessels 10 vessels
5 projects 0 projects 6 projects 0 projects 8 projects
Employment
By #vessels
USD m
Project price USD 70 USD 0 USD 225 USD 0 USD 278
Paid in equity USD 38 USD 0 USD 103 USD 0 USD 96
Acc. dividends USD 1 USD 0 USD 42 USD 0 USD 39
Valuation USD 48 USD 0 USD 79 USD 0 USD 45
Multiple 1.27 - 1.18 - 0.87
TC/Pool
Spot
BB
TC/PoolSpot
BB
TC/Pool
Spot
MV Dina Scout – Owned by Ocean Scout DIS
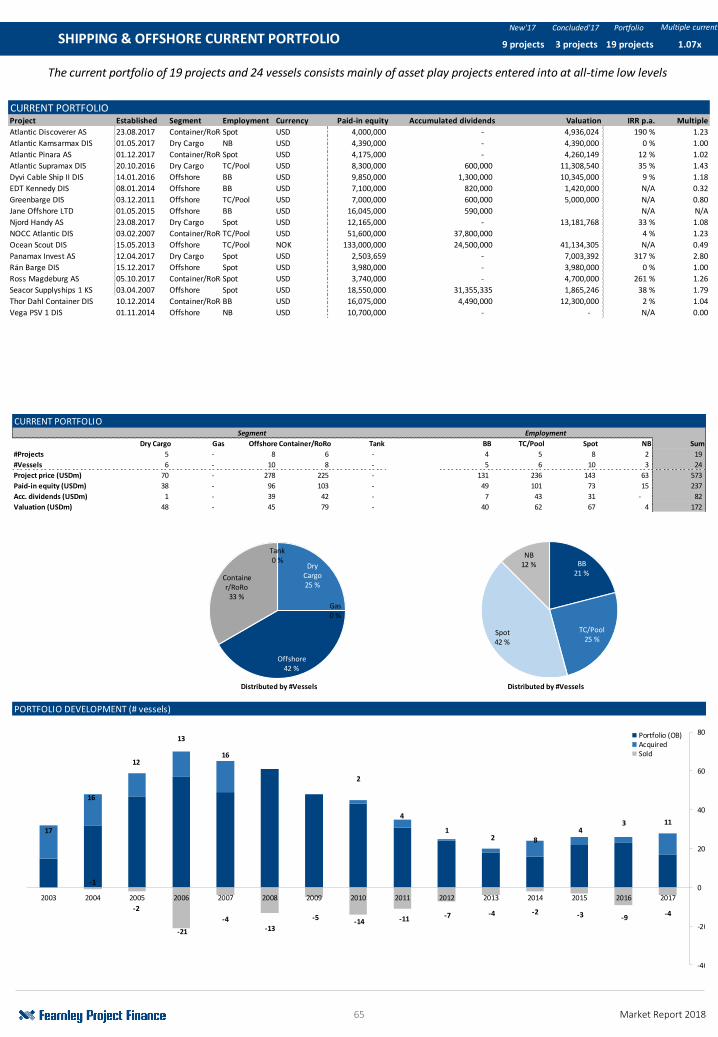
65 Market Report 2018
New'17 Concluded'17 Portfolio
CURRENT PORTFOLIOProject Established Segment Employment Currency Paid-in equity Accumulated dividends Valuation IRR p.a. Multiple
Atlantic Discoverer AS 23.08.2017 Container/RoRoSpot USD 4,000,000 - 4,936,024 190 % 1.23
Atlantic Kamsarmax DIS 01.05.2017 Dry Cargo NB USD 4,390,000 - 4,390,000 0 % 1.00
Atlantic Pinara AS 01.12.2017 Container/RoRoSpot USD 4,175,000 - 4,260,149 12 % 1.02
Atlantic Supramax DIS 20.10.2016 Dry Cargo TC/Pool USD 8,300,000 600,000 11,308,540 35 % 1.43
Dyvi Cable Ship II DIS 14.01.2016 Offshore BB USD 9,850,000 1,300,000 10,345,000 9 % 1.18
EDT Kennedy DIS 08.01.2014 Offshore BB USD 7,100,000 820,000 1,420,000 N/A 0.32
Greenbarge DIS 03.12.2011 Offshore TC/Pool USD 7,000,000 600,000 5,000,000 N/A 0.80
Jane Offshore LTD 01.05.2015 Offshore BB USD 16,045,000 590,000 15,455,000 N/A N/A
Njord Handy AS 23.08.2017 Dry Cargo Spot USD 12,165,000 - 13,181,768 33 % 1.08
NOCC Atlantic DIS 03.02.2007 Container/RoRoTC/Pool USD 51,600,000 37,800,000 25,682,751 4 % 1.23
Ocean Scout DIS 15.05.2013 Offshore TC/Pool NOK 133,000,000 24,500,000 41,134,305 N/A 0.49
Panamax Invest AS 12.04.2017 Dry Cargo Spot USD 2,503,659 - 7,003,392 317 % 2.80
Rán Barge DIS 15.12.2017 Offshore Spot USD 3,980,000 - 3,980,000 0 % 1.00
Ross Magdeburg AS 05.10.2017 Container/RoRoSpot USD 3,740,000 - 4,700,000 261 % 1.26
Seacor Supplyships 1 KS 03.04.2007 Offshore Spot USD 18,550,000 31,355,335 1,865,246 38 % 1.79
Thor Dahl Container DIS 10.12.2014 Container/RoRoBB USD 16,075,000 4,490,000 12,300,000 2 % 1.04
Vega PSV 1 DIS 01.11.2014 Offshore NB USD 10,700,000 - - N/A 0.00
The current portfolio of 19 projects and 24 vessels consists mainly of asset play projects entered into at all-time low levels
Multiple current
1.07x19 projectsSHIPPING & OFFSHORE CURRENT PORTFOLIO 9 projects 3 projects
CURRENT PORTFOLIO
Dry Cargo Gas Offshore Container/RoRo Tank BB TC/Pool Spot NB Sum
#Projects 5 - 8 6 - 4 5 8 2 19
#Vessels 6 - 10 8 - 5 6 10 3 24
Project price (USDm) 70 - 278 225 - 131 236 143 63 573
Paid-in equity (USDm) 38 - 96 103 - 49 101 73 15 237
Acc. dividends (USDm) 1 - 39 42 - 7 43 31 - 82
Valuation (USDm) 48 - 45 79 - 40 62 67 4 172
Avg. nominal return 27 % #N/A -13 % 18 % #N/A -5 % 4 % 35 % -71 % 7 %
Avg. IRR p.a. 96 % #N/A 16 % 94 % #N/A 5 % 20 % 122 % 0 % 75 %
Distributed by #Vessels Distributed by #Vessels
PORTFOLIO DEVELOPMENT (# vessels)
EmploymentSegment
Dry Cargo25 %
Gas0 %
Offshore42 %
Container/RoRo
33 %
Tank0 % BB
21 %
TC/Pool25 %
Spot42 %
NB12 %
1134
821
4
2
16
13
12
16
17
-4-9-3-2-4-7-11-14
-5
-13-4
-21
-2
-1
-40
-20
0
20
40
60
80
201720162015201420132012201120102009200820072006200520042003
Portfolio (OB)AcquiredSold
THE PROJECTS
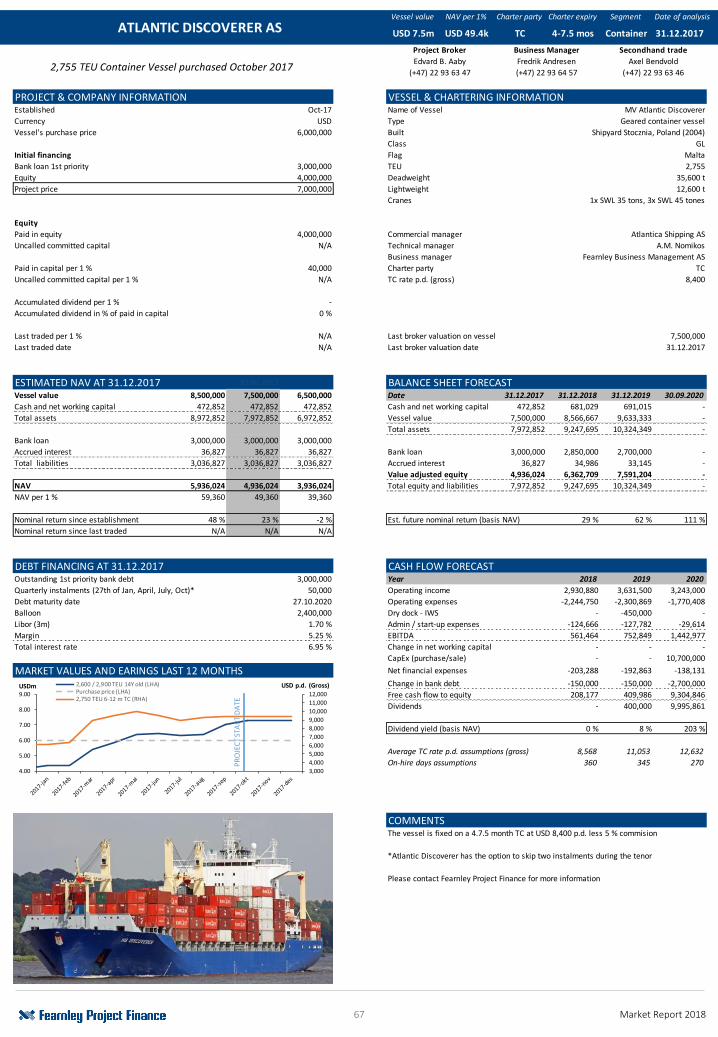
67 Market Report 2018
Vessel value NAV per 1% Charter party Charter expiry Segment Date of analysis
PROJECT & COMPANY INFORMATION VESSEL & CHARTERING INFORMATIONEstablished Oct-17 Name of Vessel MV Atlantic Discoverer
Currency USD Type Geared container vessel
Vessel's purchase price 6,000,000 Built Shipyard Stocznia, Poland (2004)
Class GL
Initial financing Flag Malta
Bank loan 1st priority 3,000,000 TEU 2,755
Equity 4,000,000 Deadweight 35,600 t
Project price 7,000,000 Lightweight 12,600 t
Cranes 1x SWL 35 tons, 3x SWL 45 tones
Equity
Paid in equity 4,000,000 Commercial manager Atlantica Shipping AS
Uncalled committed capital N/A Technical manager A.M. Nomikos
Business manager Fearnley Business Management AS
Paid in capital per 1 % 40,000 Charter party TC
Uncalled committed capital per 1 % N/A TC rate p.d. (gross) 8,400
Accumulated dividend per 1 % -
Accumulated dividend in % of paid in capital 0 %
Last traded per 1 % N/A Last broker valuation on vessel 7,500,000
Last traded date N/A Last broker valuation date 31.12.2017
ESTIMATED NAV AT 31.12.2017 30.09.2017 BALANCE SHEET FORECASTVessel value 8,500,000 7,500,000 6,500,000 Date 31.12.2017 31.12.2018 31.12.2019 30.09.2020
Cash and net working capital 472,852 472,852 472,852 Cash and net working capital 472,852 681,029 691,015 -
Total assets 8,972,852 7,972,852 6,972,852 Vessel value 7,500,000 8,566,667 9,633,333 -
Total assets 7,972,852 9,247,695 10,324,349 -
Bank loan 3,000,000 3,000,000 3,000,000
Accrued interest 36,827 36,827 36,827 Bank loan 3,000,000 2,850,000 2,700,000 -
Total liabilities 3,036,827 3,036,827 3,036,827 Accrued interest 36,827 34,986 33,145 -
Value adjusted equity 4,936,024 6,362,709 7,591,204 -
NAV 5,936,024 4,936,024 3,936,024 Total equity and liabilities 7,972,852 9,247,695 10,324,349 -
NAV per 1 % 59,360 49,360 39,360
Nominal return since establishment 48 % 23 % -2 % Est. future nominal return (basis NAV) 29 % 62 % 111 %
Nominal return since last traded N/A N/A N/A
DEBT FINANCING AT 31.12.2017 CASH FLOW FORECASTOutstanding 1st priority bank debt 3,000,000 Year 2018 2019 2020
Quarterly instalments (27th of Jan, April, July, Oct)* 50,000 Operating income 2,930,880 3,631,500 3,243,000
Debt maturity date 27.10.2020 Operating expenses -2,244,750 -2,300,869 -1,770,408
Balloon 2,400,000 Dry dock - IWS - -450,000 -
Libor (3m) 1.70 % Admin / start-up expenses -124,666 -127,782 -29,614
Margin 5.25 % EBITDA 561,464 752,849 1,442,977
Total interest rate 6.95 % Change in net working capital - - -
CapEx (purchase/sale) - - 10,700,000
MARKET VALUES AND EARINGS LAST 12 MONTHS Net financial expenses -203,288 -192,863 -138,131
Change in bank debt -150,000 -150,000 -2,700,000
Free cash flow to equity 208,177 409,986 9,304,846
Dividends - 400,000 9,995,861
Dividend yield (basis NAV) 0 % 8 % 203 %
Average TC rate p.d. assumptions (gross) 8,568 11,053 12,632
On-hire days assumptions 360 345 270
COMMENTSThe vessel is fixed on a 4.7.5 month TC at USD 8,400 p.d. less 5 % commision
*Atlantic Discoverer has the option to skip two instalments during the tenor
Please contact Fearnley Project Finance for more information
Container
(+47) 22 93 63 46
31.12.2017
Secondhand trade
Edvard B. Aaby Fredrik Andresen Axel Bendvold
(+47) 22 93 63 47 (+47) 22 93 64 57
ATLANTIC DISCOVERER AS USD 7.5m USD 49.4k TC
Project Broker Business Manager
4-7.5 mos
2,755 TEU Container Vessel purchased October 2017
3,000
4,000
5,000
6,000
7,000
8,000
9,000
10,000
11,000
12,000
4.00
5.00
6.00
7.00
8.00
9.00
USD p.d. (Gross)USDm 2,600 / 2,900 TEU 14Y old (LHA)Purchase price (LHA)2,750 TEU 6-12 m TC (RHA)
PR
OJE
CT
STA
RT
DA
TE
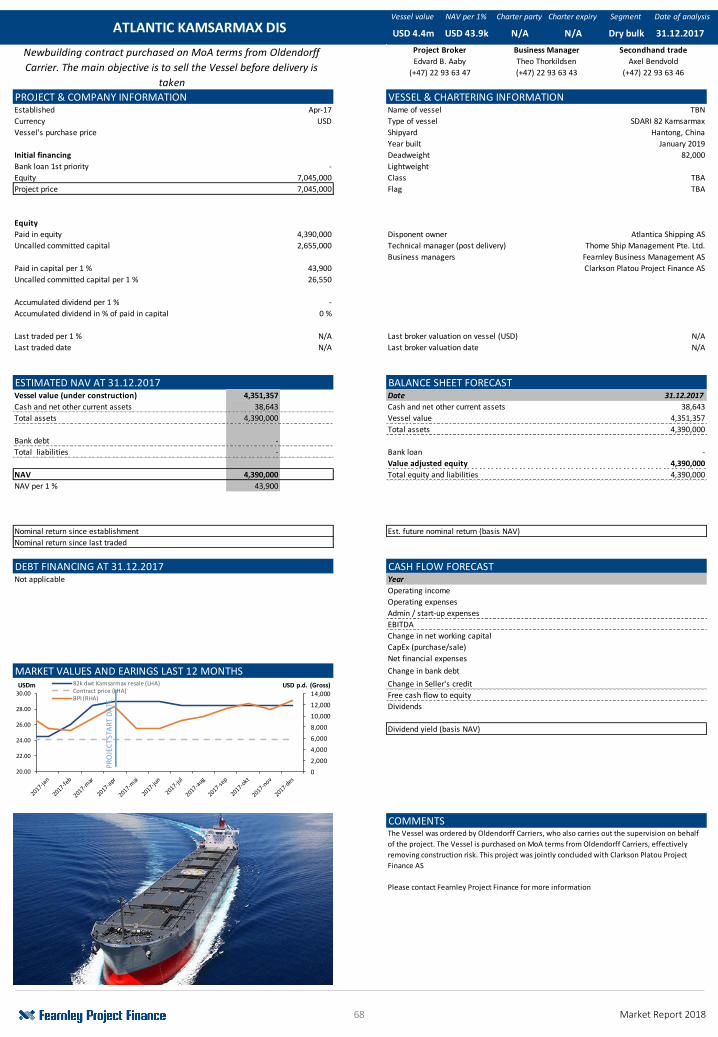
68 Market Report 2018
Vessel value NAV per 1% Charter party Charter expiry Segment Date of analysis
PROJECT & COMPANY INFORMATION VESSEL & CHARTERING INFORMATIONEstablished Apr-17 Name of vessel TBN
Currency USD Type of vessel SDARI 82 Kamsarmax
Vessel's purchase price Shipyard Hantong, China
Year built January 2019
Initial financing Deadweight 82,000
Bank loan 1st priority - Lightweight
Equity 7,045,000 Class TBA
Project price 7,045,000 Flag TBA
Equity
Paid in equity 4,390,000 Disponent owner Atlantica Shipping AS
Uncalled committed capital 2,655,000 Technical manager (post delivery) Thome Ship Management Pte. Ltd.
Business managers Fearnley Business Management AS
Paid in capital per 1 % 43,900 Clarkson Platou Project Finance AS
Uncalled committed capital per 1 % 26,550
Accumulated dividend per 1 % -
Accumulated dividend in % of paid in capital 0 %
Last traded per 1 % N/A Last broker valuation on vessel (USD) N/A
Last traded date N/A Last broker valuation date N/A
ESTIMATED NAV AT 31.12.2017 BALANCE SHEET FORECASTVessel value (under construction) 4,351,357 Date 31.12.2017
Cash and net other current assets 38,643 Cash and net other current assets 38,643
Total assets 4,390,000 Vessel value 4,351,357
Total assets 4,390,000
Bank debt -
Total liabilities - Bank loan -
Value adjusted equity 4,390,000
NAV 4,390,000 Total equity and liabilities 4,390,000
NAV per 1 % 43,900
Nominal return since establishment Est. future nominal return (basis NAV)
Nominal return since last traded
DEBT FINANCING AT 31.12.2017 CASH FLOW FORECASTNot applicable Year
Operating income
Operating expenses
Admin / start-up expenses
EBITDA
Change in net working capital
CapEx (purchase/sale)
Net financial expenses
MARKET VALUES AND EARINGS LAST 12 MONTHS Change in bank debt
Change in Seller's credit
Free cash flow to equity
Dividends
Dividend yield (basis NAV)
COMMENTS
ATLANTIC KAMSARMAX DIS 31.12.2017USD 4.4m USD 43.9k N/A N/A Dry bulk
Business Manager
Theo Thorkildsen
(+47) 22 93 63 43
Newbuilding contract purchased on MoA terms from Oldendorff
Carrier. The main objective is to sell the Vessel before delivery is
taken
The Vessel was ordered by Oldendorff Carriers, who also carries out the supervision on behalf
of the project. The Vessel is purchased on MoA terms from Oldendorff Carriers, effectively
removing construction risk. This project was jointly concluded with Clarkson Platou Project
Finance AS
Please contact Fearnley Project Finance for more information
Secondhand trade
Axel Bendvold
(+47) 22 93 63 46
Project Broker
Edvard B. Aaby
(+47) 22 93 63 47
0
2,000
4,000
6,000
8,000
10,000
12,000
14,000
20.00
22.00
24.00
26.00
28.00
30.00USD p.d. (Gross)USDm 82k dwt Kamsarmax resale (LHA)
Contract price (LHA)BPI (RHA)
PR
OJE
CT
STA
RT
DA
TE
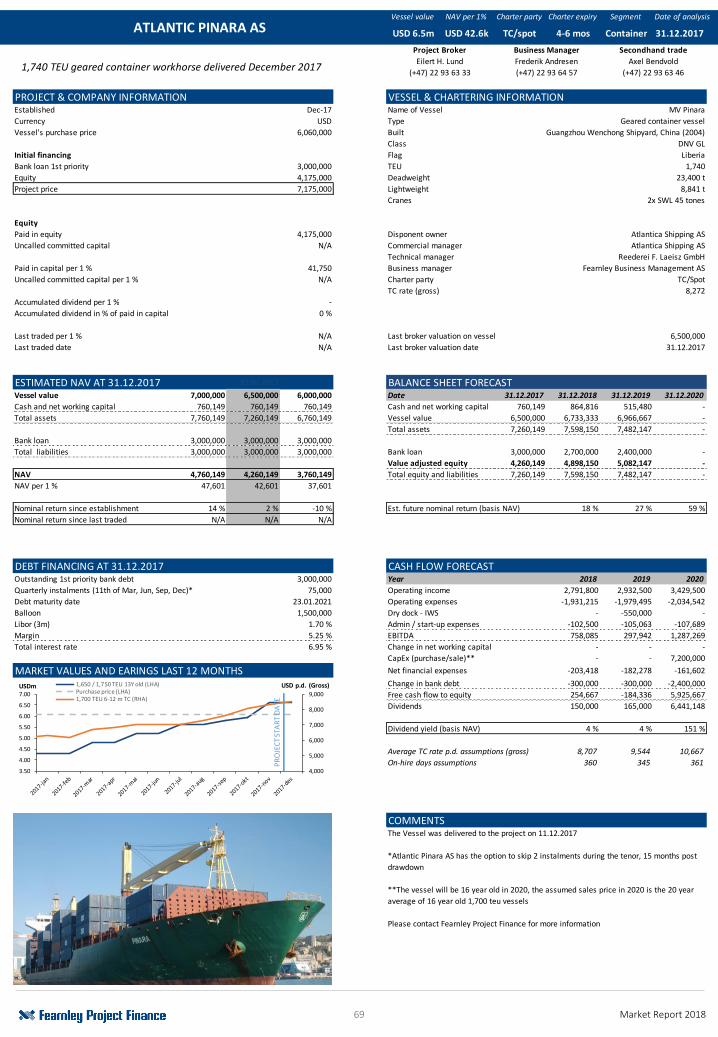
69 Market Report 2018
Vessel value NAV per 1% Charter party Charter expiry Segment Date of analysis
PROJECT & COMPANY INFORMATION VESSEL & CHARTERING INFORMATIONEstablished Dec-17 Name of Vessel MV Pinara
Currency USD Type Geared container vessel
Vessel's purchase price 6,060,000 Built Guangzhou Wenchong Shipyard, China (2004)
Class DNV GL
Initial financing Flag Liberia
Bank loan 1st priority 3,000,000 TEU 1,740
Equity 4,175,000 Deadweight 23,400 t
Project price 7,175,000 Lightweight 8,841 t
Cranes 2x SWL 45 tones
Equity
Paid in equity 4,175,000 Disponent owner Atlantica Shipping AS
Uncalled committed capital N/A Commercial manager Atlantica Shipping AS
Technical manager Reederei F. Laeisz GmbH
Paid in capital per 1 % 41,750 Business manager Fearnley Business Management AS
Uncalled committed capital per 1 % N/A Charter party TC/Spot
TC rate (gross) 8,272
Accumulated dividend per 1 % -
Accumulated dividend in % of paid in capital 0 %
Last traded per 1 % N/A Last broker valuation on vessel 6,500,000
Last traded date N/A Last broker valuation date 31.12.2017
ESTIMATED NAV AT 31.12.2017 30.09.2017 BALANCE SHEET FORECASTVessel value 7,000,000 6,500,000 6,000,000 Date 31.12.2017 31.12.2018 31.12.2019 31.12.2020
Cash and net working capital 760,149 760,149 760,149 Cash and net working capital 760,149 864,816 515,480 -
Total assets 7,760,149 7,260,149 6,760,149 Vessel value 6,500,000 6,733,333 6,966,667 -
Total assets 7,260,149 7,598,150 7,482,147 -
Bank loan 3,000,000 3,000,000 3,000,000
Total liabilities 3,000,000 3,000,000 3,000,000 Bank loan 3,000,000 2,700,000 2,400,000 -
Value adjusted equity 4,260,149 4,898,150 5,082,147 -
NAV 4,760,149 4,260,149 3,760,149 Total equity and liabilities 7,260,149 7,598,150 7,482,147 -
NAV per 1 % 47,601 42,601 37,601
Nominal return since establishment 14 % 2 % -10 % Est. future nominal return (basis NAV) 18 % 27 % 59 %
Nominal return since last traded N/A N/A N/A
DEBT FINANCING AT 31.12.2017 CASH FLOW FORECASTOutstanding 1st priority bank debt 3,000,000 Year 2018 2019 2020
Quarterly instalments (11th of Mar, Jun, Sep, Dec)* 75,000 Operating income 2,791,800 2,932,500 3,429,500
Debt maturity date 23.01.2021 Operating expenses -1,931,215 -1,979,495 -2,034,542
Balloon 1,500,000 Dry dock - IWS - -550,000 -
Libor (3m) 1.70 % Admin / start-up expenses -102,500 -105,063 -107,689
Margin 5.25 % EBITDA 758,085 297,942 1,287,269
Total interest rate 6.95 % Change in net working capital - - -
CapEx (purchase/sale)** - - 7,200,000
MARKET VALUES AND EARINGS LAST 12 MONTHS Net financial expenses -203,418 -182,278 -161,602
Change in bank debt -300,000 -300,000 -2,400,000
Free cash flow to equity 254,667 -184,336 5,925,667
Dividends 150,000 165,000 6,441,148
Dividend yield (basis NAV) 4 % 4 % 151 %
Average TC rate p.d. assumptions (gross) 8,707 9,544 10,667
On-hire days assumptions 360 345 361
COMMENTS
ATLANTIC PINARA AS USD 6.5m USD 42.6k TC/spot
Project Broker Business Manager
4-6 mos
1,740 TEU geared container workhorse delivered December 2017
The Vessel was delivered to the project on 11.12.2017
*Atlantic Pinara AS has the option to skip 2 instalments during the tenor, 15 months post
drawdown
**The vessel will be 16 year old in 2020, the assumed sales price in 2020 is the 20 year
average of 16 year old 1,700 teu vessels
Please contact Fearnley Project Finance for more information
Container
(+47) 22 93 63 46
31.12.2017
Secondhand trade
Eilert H. Lund Frederik Andresen Axel Bendvold
(+47) 22 93 63 33 (+47) 22 93 64 57
4,000
5,000
6,000
7,000
8,000
9,000
3.50
4.00
4.50
5.00
5.50
6.00
6.50
7.00
USD p.d. (Gross)USDm 1,650 / 1,750 TEU 13Y old (LHA)Purchase price (LHA)1,700 TEU 6-12 m TC (RHA)
PR
OJE
CT
STA
RT
DA
TE
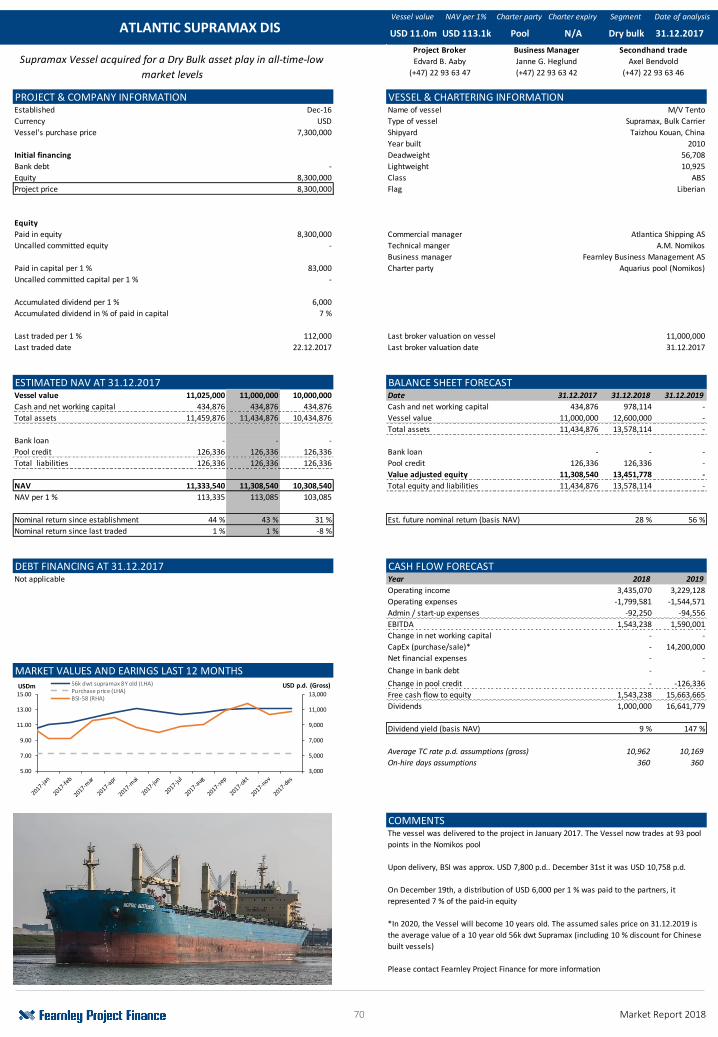
70 Market Report 2018
Vessel value NAV per 1% Charter party Charter expiry Segment Date of analysis
PROJECT & COMPANY INFORMATION VESSEL & CHARTERING INFORMATIONEstablished Dec-16 Name of vessel M/V Tento
Currency USD Type of vessel Supramax, Bulk Carrier
Vessel's purchase price 7,300,000 Shipyard Taizhou Kouan, China
Year built 2010
Initial financing Deadweight 56,708
Bank debt - Lightweight 10,925
Equity 8,300,000 Class ABS
Project price 8,300,000 Flag Liberian
Equity
Paid in equity 8,300,000 Commercial manager Atlantica Shipping AS
Uncalled committed equity - Technical manger A.M. Nomikos
Business manager Fearnley Business Management AS
Paid in capital per 1 % 83,000 Charter party Aquarius pool (Nomikos)
Uncalled committed capital per 1 % -
Accumulated dividend per 1 % 6,000
Accumulated dividend in % of paid in capital 7 %
Last traded per 1 % 112,000 Last broker valuation on vessel 11,000,000
Last traded date 22.12.2017 Last broker valuation date 31.12.2017
ESTIMATED NAV AT 31.12.2017 BALANCE SHEET FORECASTVessel value 11,025,000 11,000,000 10,000,000 Date 31.12.2017 31.12.2018 31.12.2019
Cash and net working capital 434,876 434,876 434,876 Cash and net working capital 434,876 978,114 -
Total assets 11,459,876 11,434,876 10,434,876 Vessel value 11,000,000 12,600,000 -
Total assets 11,434,876 13,578,114 -
Bank loan - - -
Pool credit 126,336 126,336 126,336 Bank loan - - -
Total liabilities 126,336 126,336 126,336 Pool credit 126,336 126,336 -
Value adjusted equity 11,308,540 13,451,778 -
NAV 11,333,540 11,308,540 10,308,540 Total equity and liabilities 11,434,876 13,578,114 -
NAV per 1 % 113,335 113,085 103,085
Nominal return since establishment 44 % 43 % 31 % Est. future nominal return (basis NAV) 28 % 56 %
Nominal return since last traded 1 % 1 % -8 %
DEBT FINANCING AT 31.12.2017 CASH FLOW FORECASTNot applicable Year 2018 2019
Operating income 3,435,070 3,229,128
Operating expenses -1,799,581 -1,544,571
Admin / start-up expenses -92,250 -94,556
EBITDA 1,543,238 1,590,001
Change in net working capital - -
CapEx (purchase/sale)* - 14,200,000
Net financial expenses - -
MARKET VALUES AND EARINGS LAST 12 MONTHS Change in bank debt - -
Change in pool credit - -126,336
Free cash flow to equity 1,543,238 15,663,665
Dividends 1,000,000 16,641,779
Dividend yield (basis NAV) 9 % 147 %
Average TC rate p.d. assumptions (gross) 10,962 10,169
On-hire days assumptions 360 360
COMMENTSThe vessel was delivered to the project in January 2017. The Vessel now trades at 93 pool
points in the Nomikos pool
Upon delivery, BSI was approx. USD 7,800 p.d.. December 31st it was USD 10,758 p.d.
On December 19th, a distribution of USD 6,000 per 1 % was paid to the partners, it
represented 7 % of the paid-in equity
*In 2020, the Vessel will become 10 years old. The assumed sales price on 31.12.2019 is
the average value of a 10 year old 56k dwt Supramax (including 10 % discount for Chinese
built vessels)
Please contact Fearnley Project Finance for more information
ATLANTIC SUPRAMAX DIS 31.12.2017USD 11.0m USD 113.1k Pool N/A Dry bulk
Project Broker Business Manager Secondhand trade
Edvard B. Aaby
(+47) 22 93 63 47
Janne G. Heglund
(+47) 22 93 63 42
Axel Bendvold
(+47) 22 93 63 46
Supramax Vessel acquired for a Dry Bulk asset play in all-time-low
market levels
3,000
5,000
7,000
9,000
11,000
13,000
5.00
7.00
9.00
11.00
13.00
15.00
USD p.d. (Gross)USDm 56k dwt supramax 8Y old (LHA)Purchase price (LHA)BSI-58 (RHA)

71 Market Report 2018
Segment Charter party Charter expiry Valuation Est. IRR p.a. Est. div. p.a.
PROJECT & CHARTER INFORMATION VESSEL INFORMATIONEstablished Jan-16
Currency USD
Business manager Fearnley Business Management AS
Charter party Bareboat
Charterer Global Marine Systems Ltd. (GMLS)
Charter party guarantor Name of vessel C/S Cable Innovator
End user Type of vessel Stern-working cable layer
Charter commencement 01.01.2016 Shipyard Kvarner Masa, Finland
End of charter 31.05.2025 Year built 1995
Charter hire p.d. (up to Q12018) 8,695 Deadweight 7,500 ts
Charter hire p.d. (from Q1 2018 - Q2 2025) 6,900 Class ABS
Flag UK
KEY FIGURES 43100 15,575,650 RETURN SENSITIVITIESValuation (per 1%) 31.12.2017 103,450
Uncalled capital (NOK, per 1%) 30,000
Estimated future return (IRR p.a.) 15.0 %
Estimated future average dividend yield p.a. 22.8 %
Estimated future total return 1,69x
Next estimated dividend (per 1%) 30.06.2018 7,000
Last traded (per 1%) 19.06.2017 90,000
Last broker valuation on vessel 07.11.2017 19,500,000
Broker valuation implied net asset value (per 1%) 142,693
Paid-in capital (per 1%) 98,500
Accumulated distributions (per 1%) 13,000
Realized return (IRR p.a.) 9.1 %
Realized total return 18.2 %
CASH FLOW FORECAST 31.12.2016 31.12.2017 31.12.2018 31.12.2019 31.12.2020 31.12.2021 31.12.2022 31.12.2023 31.12.2024 31.05.2025
Year 2018 2019 2020 2021 2022 2023 2024 2025
Operating income 2,656,820 2,518,500 2,525,400 2,518,500 2,518,500 2,518,500 2,518,500 1,048,800
Operating expenses 0 0 0 0 0 0 0 0
Admin expenses -97,498 -99,935 -102,434 -104,995 -107,620 -110,310 -114,481 -77,263
Net operating cash flow 2,559,322 2,418,565 2,422,966 2,413,505 2,410,880 2,408,190 2,404,019 971,537
Financial revenues 0 0 0 0 0 0 0 0
Financial expenses -31,850 0 0 0 0 0 0 0
Repayment bank loan -1,400,000 0 0 0 0 0 0 0
Repayment seller's credit 0 0 0 0 0 0 0 -4,750,000
Net financial cash flow -1,431,850 0 0 0 0 0 0 -4,750,000
CapEx (purchase or sale) 0 0 0 0 0 0 0 4,750,000
Net cash flow 1,127,472 2,418,565 2,422,966 2,413,505 2,410,880 2,408,190 2,404,019 971,537
Dividend -1,950,000 -2,400,000 -2,400,000 -2,450,000 -2,400,000 -2,400,000 -2,400,000 -1,096,484
Change in cash balance -822,528 18,565 22,966 -36,495 10,880 8,190 4,019 -124,947
Dividend yield (basis valuation) 19 % 23 % 23 % 24 % 23 % 23 % 23 % 11 %
BALANCE SHEET FORECASTDate 31.12.2017 31.12.2018 31.12.2019 31.12.2020 31.12.2021 31.12.2022 31.12.2023 31.12.2024 31.05.2025
Cash 919,350 96,822 115,386 138,352 101,858 112,738 120,928 124,947 0
Net other current assets 0 0 0 0 0 0 0 0 0
Implied vessel value 15,575,650 14,222,444 12,869,238 11,516,032 10,162,825 8,809,619 7,456,413 6,103,206 0
Total assets 16,495,000 14,319,266 12,984,624 11,654,384 10,264,683 8,922,357 7,577,341 6,228,153 0
Bank loan 1,400,000 0 0 0 0 0 0 0 0
Seller's credit 4,750,000 4,750,000 4,750,000 4,750,000 4,750,000 4,750,000 4,750,000 4,750,000 0
Value adjusted equity 10,345,000 9,569,266 8,234,624 6,904,384 5,514,683 4,172,357 2,827,341 1,478,153 0
Total equity and liabilities 16,495,000 14,319,266 12,984,624 11,654,384 10,264,683 8,922,357 7,577,341 6,228,153 0
ESTIMATED DIVIDEND COMMENTS
high 0.0 8 % 23 %
The purchase option in 2025 of USD 4.75 m is equal to the Sellers' Credit, hence no
physical transfer of cash will take place. Therefore, our base case assumes that the
Chartrerer will honour its purchase obligation
Please contact Fearnley Project Finance for more information
base 4.75 15 % 69 %
Assuming that the charter honours its
purchase obligation in 2025
low 0.0 8 % 23 %
avg. 23%
Residual
value (mill.)
Estimated
IRR p.a.
Estimated
total returnComment
Offshore BB 7.4 yrs USD 103k 15 %
Secondhand trade
Axel Bendvold
(+47) 22 93 63 46
DYVI CABLE SHIP II DIS
Business Manager
Rune Støfring
(+47) 22 93 63 41
Project Broker
Eilert H. Lund
(+47) 22 93 63 33Cable layer on long term bareboat charter to an industrial player
0%
20%
40%
60%
80%
100%
120%
140%
160%
180%
2018 2019 2020 2021 2022 2023 2024 2025
DividendCumulative dividend (previous years)Valuation
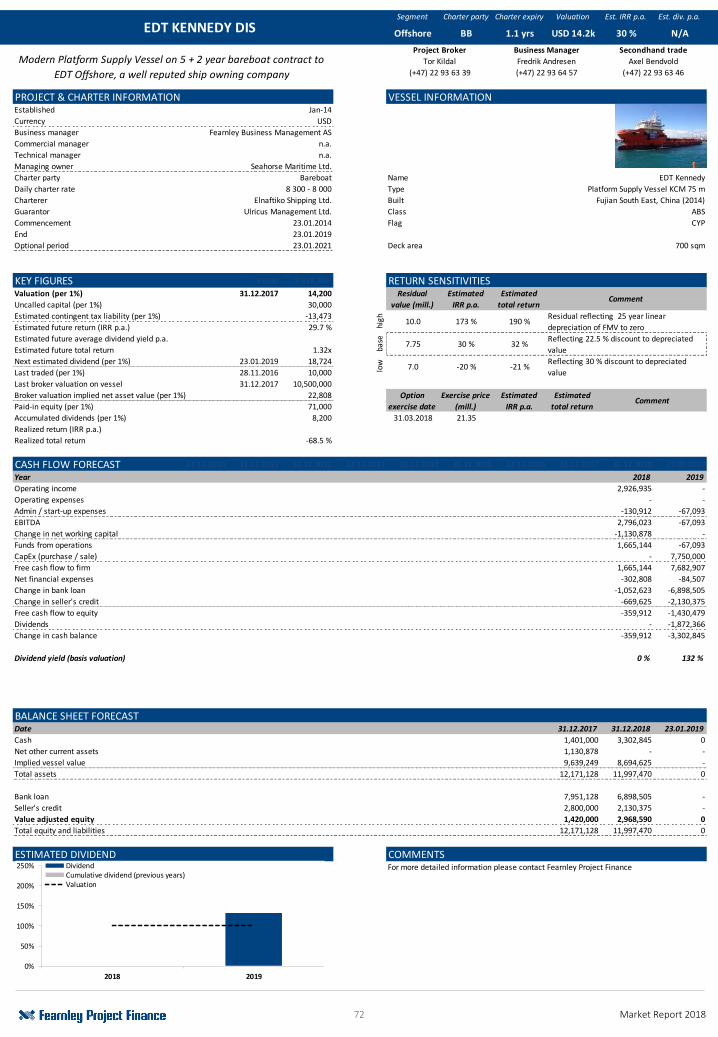
72 Market Report 2018
Segment Charter party Charter expiry Valuation Est. IRR p.a. Est. div. p.a.
PROJECT & CHARTER INFORMATION VESSEL INFORMATIONEstablished Jan-14
Currency USD
Business manager Fearnley Business Management AS
Commercial manager n.a.
Technical manager n.a.
Managing owner Seahorse Maritime Ltd.
Charter party Bareboat Name EDT Kennedy
Daily charter rate 8 300 - 8 000 Type Platform Supply Vessel KCM 75 m
Charterer Elnaftiko Shipping Ltd. Built Fujian South East, China (2014)
Guarantor Ulricus Management Ltd. Class ABS
Commencement 23.01.2014 Flag CYP
End 23.01.2019
Optional period 23.01.2021 Deck area 700 sqm
KEY FIGURES 43100 9,639,249 RETURN SENSITIVITIESValuation (per 1%) 31.12.2017 14,200
Uncalled capital (per 1%) 30,000
Estimated contingent tax liability (per 1%) -13,473
Estimated future return (IRR p.a.) 29.7 %
Estimated future average dividend yield p.a. 214.2 %
Estimated future total return 1.32x
Next estimated dividend (per 1%) 23.01.2019 18,724
Last traded (per 1%) 28.11.2016 10,000
Last broker valuation on vessel 31.12.2017 10,500,000
Broker valuation implied net asset value (per 1%) 22,808
Paid-in equity (per 1%) 71,000
Accumulated dividends (per 1%) 8,200 31.03.2018 21.35 #VALUE! 865 %
Realized return (IRR p.a.) -30.1 %
Realized total return -68.5 %
CASH FLOW FORECAST 31.12.2010 31.12.2011 31.12.2012 31.12.2013 31.12.2014 31.12.2015 31.12.2016 31.12.2017 31.12.2018 23.01.2019
Year 2018 2019
Operating income 2,926,935 -
Operating expenses - -
Admin / start-up expenses -130,912 -67,093
EBITDA 2,796,023 -67,093
Change in net working capital -1,130,878 -
Funds from operations 1,665,144 -67,093
CapEx (purchase / sale) - 7,750,000
Free cash flow to firm 1,665,144 7,682,907
Net financial expenses -302,808 -84,507
Change in bank loan -1,052,623 -6,898,505
Change in seller's credit -669,625 -2,130,375
Free cash flow to equity -359,912 -1,430,479
Dividends - -1,872,366
Change in cash balance -359,912 -3,302,845
Dividend yield (basis valuation) 0 % 132 %
BALANCE SHEET FORECASTDate 31.12.2017 31.12.2018 23.01.2019
Cash 1,401,000 3,302,845 0
Net other current assets 1,130,878 - -
Implied vessel value 9,639,249 8,694,625 -
Total assets 12,171,128 11,997,470 0
Bank loan 7,951,128 6,898,505 -
Seller's credit 2,800,000 2,130,375 -
Value adjusted equity 1,420,000 2,968,590 0
Total equity and liabilities 12,171,128 11,997,470 0
ESTIMATED DIVIDEND COMMENTSFor more detailed information please contact Fearnley Project Finance
Estimated
IRR p.a.
Estimated
total returnComment
Offshore BB 1.1 yrs USD 14.2k 30 %
Secondhand trade
Tor Kildal Fredrik Andresen Axel Bendvold
(+47) 22 93 63 39 (+47) 22 93 64 57 (+47) 22 93 63 46
Reflecting 30 % discount to depreciated
value
EDT KENNEDY DIS
Project Broker Business Manager
base 7.75 30 % 32 %
Reflecting 22.5 % discount to depreciated
value
high 10.0 173 % 190 %
Residual reflecting 25 year linear
depreciation of FMV to zero
N/A
Residual
value (mill.)
Modern Platform Supply Vessel on 5 + 2 year bareboat contract to
EDT Offshore, a well reputed ship owning company
Comment
31.03.2018
Option
exercise date
Exercise price
(mill.)
Estimated
IRR p.a.
Estimated
total return
low 7.0 -20 % -21 %
0%
50%
100%
150%
200%
250%
2018 2019
DividendCumulative dividend (previous years)Valuation
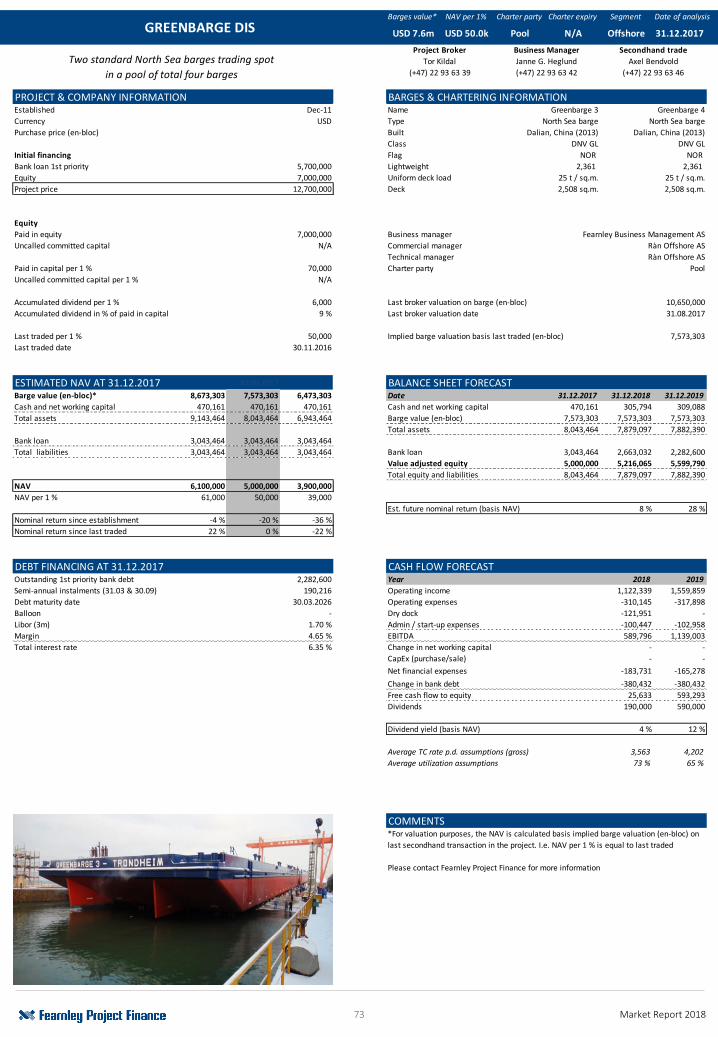
73 Market Report 2018
Barges value* NAV per 1% Charter party Charter expiry Segment Date of analysis
PROJECT & COMPANY INFORMATION BARGES & CHARTERING INFORMATIONEstablished Dec-11 Name Greenbarge 3 Greenbarge 4
Currency USD Type North Sea barge North Sea barge
Purchase price (en-bloc) Built Dalian, China (2013) Dalian, China (2013)
Class DNV GL DNV GL
Initial financing Flag NOR NOR
Bank loan 1st priority 5,700,000 Lightweight 2,361 2,361
Equity 7,000,000 Uniform deck load 25 t / sq.m. 25 t / sq.m.
Project price 12,700,000 Deck 2,508 sq.m. 2,508 sq.m.
Equity
Paid in equity 7,000,000 Business manager Fearnley Business Management AS
Uncalled committed capital N/A Commercial manager Ràn Offshore AS
Technical manager Ràn Offshore AS
Paid in capital per 1 % 70,000 Charter party Pool
Uncalled committed capital per 1 % N/A
Accumulated dividend per 1 % 6,000 Last broker valuation on barge (en-bloc) 10,650,000
Accumulated dividend in % of paid in capital 9 % Last broker valuation date 31.08.2017
Last traded per 1 % 50,000 Implied barge valuation basis last traded (en-bloc) 7,573,303
Last traded date 30.11.2016
ESTIMATED NAV AT 31.12.2017 30.09.2017 BALANCE SHEET FORECASTBarge value (en-bloc)* 8,673,303 7,573,303 6,473,303 Date 31.12.2017 31.12.2018 31.12.2019
Cash and net working capital 470,161 470,161 470,161 Cash and net working capital 470,161 305,794 309,088
Total assets 9,143,464 8,043,464 6,943,464 Barge value (en-bloc) 7,573,303 7,573,303 7,573,303
Total assets 8,043,464 7,879,097 7,882,390
Bank loan 3,043,464 3,043,464 3,043,464
Total liabilities 3,043,464 3,043,464 3,043,464 Bank loan 3,043,464 2,663,032 2,282,600
Value adjusted equity 5,000,000 5,216,065 5,599,790
Total equity and liabilities 8,043,464 7,879,097 7,882,390
NAV 6,100,000 5,000,000 3,900,000
NAV per 1 % 61,000 50,000 39,000
Est. future nominal return (basis NAV) 8 % 28 %
Nominal return since establishment -4 % -20 % -36 %
Nominal return since last traded 22 % 0 % -22 %
DEBT FINANCING AT 31.12.2017 CASH FLOW FORECASTOutstanding 1st priority bank debt 2,282,600 Year 2018 2019
Semi-annual instalments (31.03 & 30.09) 190,216 Operating income 1,122,339 1,559,859
Debt maturity date 30.03.2026 Operating expenses -310,145 -317,898
Balloon - Dry dock -121,951 -
Libor (3m) 1.70 % Admin / start-up expenses -100,447 -102,958
Margin 4.65 % EBITDA 589,796 1,139,003
Total interest rate 6.35 % Change in net working capital - -
CapEx (purchase/sale) - -
Net financial expenses -183,731 -165,278
Change in bank debt -380,432 -380,432
Free cash flow to equity 25,633 593,293
Dividends 190,000 590,000
Dividend yield (basis NAV) 4 % 12 %
Average TC rate p.d. assumptions (gross) 3,563 4,202
Average utilization assumptions 73 % 65 %
COMMENTS
GREENBARGE DIS USD 7.6m USD 50.0k Pool
Project Broker Business Manager
N/A
Two standard North Sea barges trading spot
in a pool of total four barges
*For valuation purposes, the NAV is calculated basis implied barge valuation (en-bloc) on
last secondhand transaction in the project. I.e. NAV per 1 % is equal to last traded
Please contact Fearnley Project Finance for more information
Offshore
(+47) 22 93 63 46
31.12.2017
Secondhand trade
Tor Kildal Janne G. Heglund Axel Bendvold
(+47) 22 93 63 39 (+47) 22 93 63 42
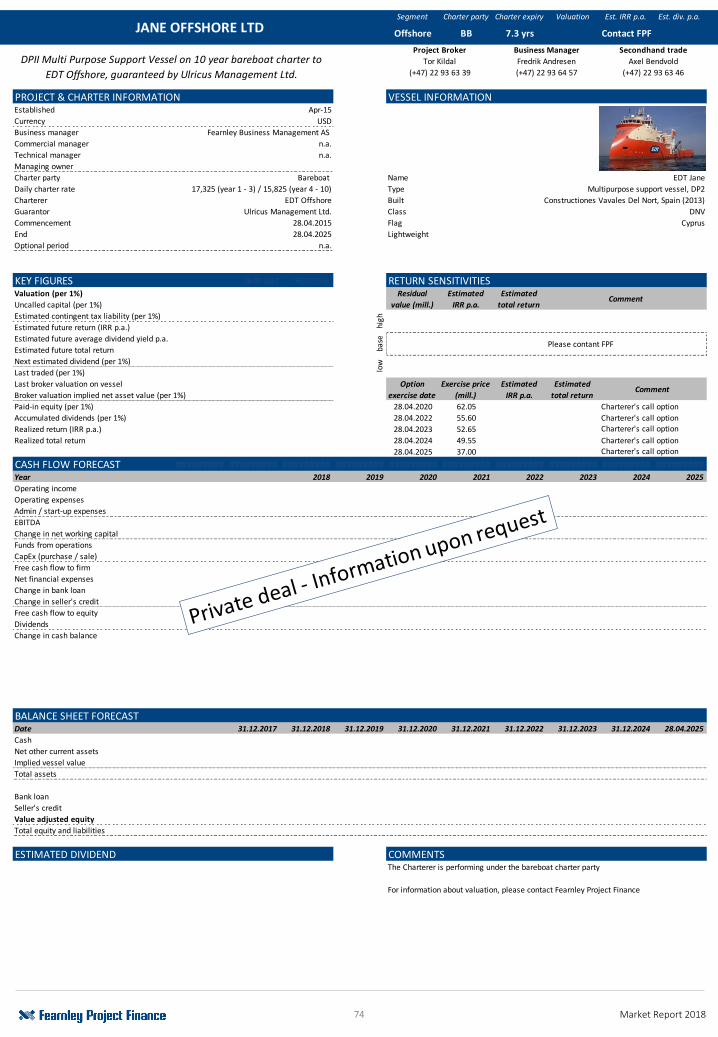
74 Market Report 2018
Segment Charter party Charter expiry Valuation Est. IRR p.a. Est. div. p.a.
PROJECT & CHARTER INFORMATION VESSEL INFORMATIONEstablished Apr-15
Currency USD
Business manager Fearnley Business Management AS
Commercial manager n.a.
Technical manager n.a.
Managing owner
Charter party Bareboat Name EDT Jane
Daily charter rate 17,325 (year 1 - 3) / 15,825 (year 4 - 10) Type Multipurpose support vessel, DP2
Charterer EDT Offshore Built Constructiones Vavales Del Nort, Spain (2013)
Guarantor Ulricus Management Ltd. Class DNV
Commencement 28.04.2015 Flag Cyprus
End 28.04.2025 Lightweight
Optional period n.a.
KEY FIGURES 28.07.2017 55,237,534 RETURN SENSITIVITIESValuation (per 1%)
Uncalled capital (per 1%)
Estimated contingent tax liability (per 1%)
Estimated future return (IRR p.a.)
Estimated future average dividend yield p.a.
Estimated future total return
Next estimated dividend (per 1%)
Last traded (per 1%)
Last broker valuation on vessel
Broker valuation implied net asset value (per 1%)
Paid-in equity (per 1%) 28.04.2020 62.05
Accumulated dividends (per 1%) 28.04.2022 55.60
Realized return (IRR p.a.) 28.04.2023 52.65
Realized total return 28.04.2024 49.55
28.04.2025 37.00
CASH FLOW FORECAST ######### ######### ######### ######### ######### ######### ######### ######### ######### #########Year 2018 2019 2020 2021 2022 2023 2024 2025
Operating income
Operating expenses
Admin / start-up expenses
EBITDA
Change in net working capital
Funds from operations
CapEx (purchase / sale)
Free cash flow to firm
Net financial expenses
Change in bank loan
Change in seller's credit
Free cash flow to equity
Dividends
Change in cash balance
BALANCE SHEET FORECASTDate 31.12.2017 31.12.2018 31.12.2019 31.12.2020 31.12.2021 31.12.2022 31.12.2023 31.12.2024 28.04.2025
Cash
Net other current assets
Implied vessel value
Total assets
Bank loan
Seller's credit
Value adjusted equity
Total equity and liabilities
ESTIMATED DIVIDEND COMMENTS
(+47) 22 93 64 57
7.3 yrs
(+47) 22 93 63 46
The Charterer is performing under the bareboat charter party
For information about valuation, please contact Fearnley Project Finance
Contact FPF
Estimated
total returnComment
Business Manager Secondhand trade
Tor Kildal Fredrik Andresen Axel Bendvold
JANE OFFSHORE LTD Offshore BB
Residual
value (mill.)
Estimated
IRR p.a.
Project Broker
(+47) 22 93 63 39
DPII Multi Purpose Support Vessel on 10 year bareboat charter to
EDT Offshore, guaranteed by Ulricus Management Ltd.
high
Comment
Charterer's call optionCharterer's call option
base Please contant FPF
low
Charterer's call option
Charterer's call option
Charterer's call option
Option
exercise date
Exercise price
(mill.)
Estimated
IRR p.a.
Estimated
total return
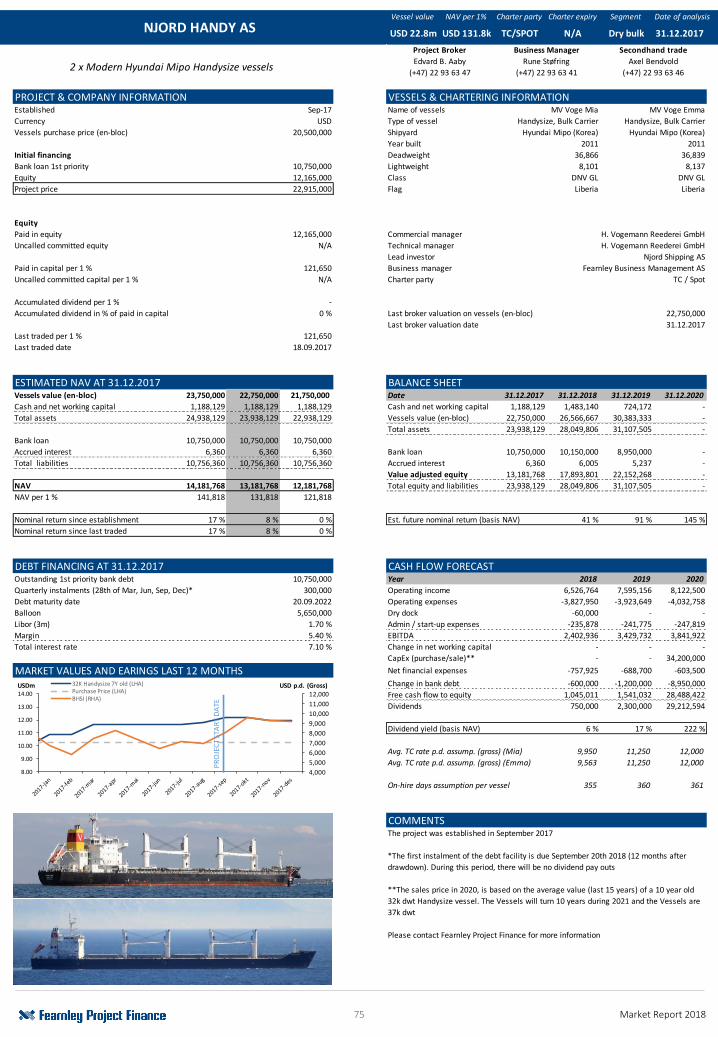
75 Market Report 2018
Vessel value NAV per 1% Charter party Charter expiry Segment Date of analysis
PROJECT & COMPANY INFORMATION VESSELS & CHARTERING INFORMATIONEstablished Sep-17 Name of vessels MV Voge Mia MV Voge Emma
Currency USD Type of vessel Handysize, Bulk Carrier Handysize, Bulk Carrier
Vessels purchase price (en-bloc) 20,500,000 Shipyard Hyundai Mipo (Korea) Hyundai Mipo (Korea)
Year built 2011 2011
Initial financing Deadweight 36,866 36,839
Bank loan 1st priority 10,750,000 Lightweight 8,101 8,137
Equity 12,165,000 Class DNV GL DNV GL
Project price 22,915,000 Flag Liberia Liberia
Equity
Paid in equity 12,165,000 Commercial manager H. Vogemann Reederei GmbH
Uncalled committed equity N/A Technical manager H. Vogemann Reederei GmbH
Lead investor Njord Shipping AS
Paid in capital per 1 % 121,650 Business manager Fearnley Business Management AS
Uncalled committed capital per 1 % N/A Charter party TC / Spot
Accumulated dividend per 1 % -
Accumulated dividend in % of paid in capital 0 % Last broker valuation on vessels (en-bloc) 22,750,000
Last broker valuation date 31.12.2017
Last traded per 1 % 121,650
Last traded date 18.09.2017
ESTIMATED NAV AT 31.12.2017 BALANCE SHEETVessels value (en-bloc) 23,750,000 22,750,000 21,750,000 Date 31.12.2017 31.12.2018 31.12.2019 31.12.2020
Cash and net working capital 1,188,129 1,188,129 1,188,129 Cash and net working capital 1,188,129 1,483,140 724,172 -
Total assets 24,938,129 23,938,129 22,938,129 Vessels value (en-bloc) 22,750,000 26,566,667 30,383,333 -
Total assets 23,938,129 28,049,806 31,107,505 -
Bank loan 10,750,000 10,750,000 10,750,000
Accrued interest 6,360 6,360 6,360 Bank loan 10,750,000 10,150,000 8,950,000 -
Total liabilities 10,756,360 10,756,360 10,756,360 Accrued interest 6,360 6,005 5,237 -
Value adjusted equity 13,181,768 17,893,801 22,152,268 -
NAV 14,181,768 13,181,768 12,181,768 Total equity and liabilities 23,938,129 28,049,806 31,107,505 -
NAV per 1 % 141,818 131,818 121,818
Nominal return since establishment 17 % 8 % 0 % Est. future nominal return (basis NAV) 41 % 91 % 145 %
Nominal return since last traded 17 % 8 % 0 %
DEBT FINANCING AT 31.12.2017 CASH FLOW FORECASTOutstanding 1st priority bank debt 10,750,000 Year 2018 2019 2020
Quarterly instalments (28th of Mar, Jun, Sep, Dec)* 300,000 Operating income 6,526,764 7,595,156 8,122,500
Debt maturity date 20.09.2022 Operating expenses -3,827,950 -3,923,649 -4,032,758
Balloon 5,650,000 Dry dock -60,000 - -
Libor (3m) 1.70 % Admin / start-up expenses -235,878 -241,775 -247,819
Margin 5.40 % EBITDA 2,402,936 3,429,732 3,841,922
Total interest rate 7.10 % Change in net working capital - - -
CapEx (purchase/sale)** - - 34,200,000
MARKET VALUES AND EARINGS LAST 12 MONTHS Net financial expenses -757,925 -688,700 -603,500
Change in bank debt -600,000 -1,200,000 -8,950,000
Free cash flow to equity 1,045,011 1,541,032 28,488,422
Dividends 750,000 2,300,000 29,212,594
Dividend yield (basis NAV) 6 % 17 % 222 %
Avg. TC rate p.d. assump. (gross) (Mia) 9,950 11,250 12,000
Avg. TC rate p.d. assump. (gross) (Emma) 9,563 11,250 12,000
On-hire days assumption per vessel 355 360 361
COMMENTSThe project was established in September 2017
*The first instalment of the debt facility is due September 20th 2018 (12 months after
drawdown). During this period, there will be no dividend pay outs
**The sales price in 2020, is based on the average value (last 15 years) of a 10 year old
32k dwt Handysize vessel. The Vessels will turn 10 years during 2021 and the Vessels are
37k dwt
Please contact Fearnley Project Finance for more information
Secondhand trade
Edvard B. Aaby Rune Støfring Axel Bendvold
(+47) 22 93 63 47 (+47) 22 93 63 41 (+47) 22 93 63 46
NJORD HANDY AS
Project Broker Business Manager
31.12.2017USD 22.8m USD 131.8k TC/SPOT N/A Dry bulk
2 x Modern Hyundai Mipo Handysize vessels
4,000
5,000
6,000
7,000
8,000
9,000
10,000
11,000
12,000
8.00
9.00
10.00
11.00
12.00
13.00
14.00USD p.d. (Gross)USDm 32K Handysize 7Y old (LHA)
Purchase Price (LHA)BHSI (RHA)
PR
OJE
CT
STA
RT
DA
TE
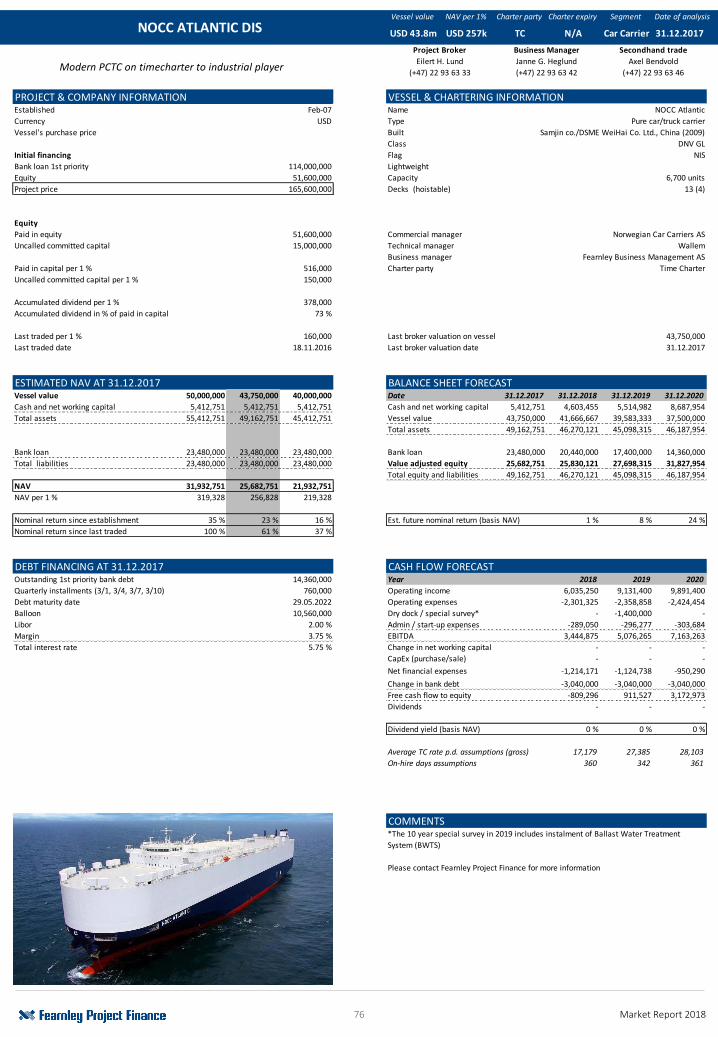
76 Market Report 2018
Vessel value NAV per 1% Charter party Charter expiry Segment Date of analysis
PROJECT & COMPANY INFORMATION VESSEL & CHARTERING INFORMATIONEstablished Feb-07 Name NOCC Atlantic
Currency USD Type Pure car/truck carrier
Vessel's purchase price Built Samjin co./DSME WeiHai Co. Ltd., China (2009)
Class DNV GL
Initial financing Flag NIS
Bank loan 1st priority 114,000,000 Lightweight
Equity 51,600,000 Capacity 6,700 units
Project price 165,600,000 Decks (hoistable) 13 (4)
Equity
Paid in equity 51,600,000 Commercial manager Norwegian Car Carriers AS
Uncalled committed capital 15,000,000 Technical manager Wallem
Business manager Fearnley Business Management AS
Paid in capital per 1 % 516,000 Charter party Time Charter
Uncalled committed capital per 1 % 150,000
Accumulated dividend per 1 % 378,000
Accumulated dividend in % of paid in capital 73 %
Last traded per 1 % 160,000 Last broker valuation on vessel 43,750,000
Last traded date 18.11.2016 Last broker valuation date 31.12.2017
ESTIMATED NAV AT 31.12.2017 BALANCE SHEET FORECASTVessel value 50,000,000 43,750,000 40,000,000 Date 31.12.2017 31.12.2018 31.12.2019 31.12.2020
Cash and net working capital 5,412,751 5,412,751 5,412,751 Cash and net working capital 5,412,751 4,603,455 5,514,982 8,687,954
Total assets 55,412,751 49,162,751 45,412,751 Vessel value 43,750,000 41,666,667 39,583,333 37,500,000
Total assets 49,162,751 46,270,121 45,098,315 46,187,954
Bank loan 23,480,000 23,480,000 23,480,000 Bank loan 23,480,000 20,440,000 17,400,000 14,360,000
Total liabilities 23,480,000 23,480,000 23,480,000 Value adjusted equity 25,682,751 25,830,121 27,698,315 31,827,954
Total equity and liabilities 49,162,751 46,270,121 45,098,315 46,187,954
NAV 31,932,751 25,682,751 21,932,751
NAV per 1 % 319,328 256,828 219,328
Nominal return since establishment 35 % 23 % 16 % Est. future nominal return (basis NAV) 1 % 8 % 24 %
Nominal return since last traded 100 % 61 % 37 %
DEBT FINANCING AT 31.12.2017 CASH FLOW FORECASTOutstanding 1st priority bank debt 14,360,000 Year 2018 2019 2020
Quarterly installments (3/1, 3/4, 3/7, 3/10) 760,000 Operating income 6,035,250 9,131,400 9,891,400
Debt maturity date 29.05.2022 Operating expenses -2,301,325 -2,358,858 -2,424,454
Balloon 10,560,000 Dry dock / special survey* - -1,400,000 -
Libor 2.00 % Admin / start-up expenses -289,050 -296,277 -303,684
Margin 3.75 % EBITDA 3,444,875 5,076,265 7,163,263
Total interest rate 5.75 % Change in net working capital - - -
CapEx (purchase/sale) - - -
Net financial expenses -1,214,171 -1,124,738 -950,290
Change in bank debt -3,040,000 -3,040,000 -3,040,000
Free cash flow to equity -809,296 911,527 3,172,973
Dividends - - -
Dividend yield (basis NAV) 0 % 0 % 0 %
Average TC rate p.d. assumptions (gross) 17,179 27,385 28,103
On-hire days assumptions 360 342 361
COMMENTS
31.12.2017
Secondhand trade
Eilert H. Lund Axel Bendvold
*The 10 year special survey in 2019 includes instalment of Ballast Water Treatment
System (BWTS)
Please contact Fearnley Project Finance for more information
Car Carrier
(+47) 22 93 63 46
NOCC ATLANTIC DIS USD 43.8m USD 257k TC
Project Broker Business Manager
N/A
Janne G. Heglund
(+47) 22 93 63 33 (+47) 22 93 63 42Modern PCTC on timecharter to industrial player
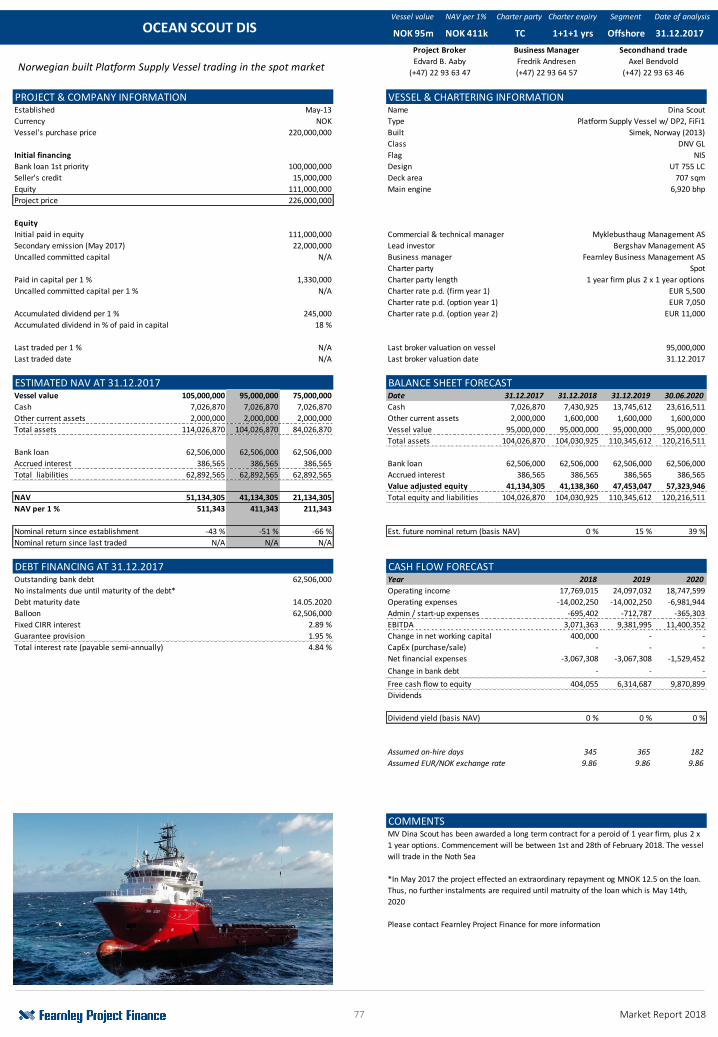
77 Market Report 2018
Vessel value NAV per 1% Charter party Charter expiry Segment Date of analysis
PROJECT & COMPANY INFORMATION VESSEL & CHARTERING INFORMATIONEstablished May-13 Name Dina Scout
Currency NOK Type Platform Supply Vessel w/ DP2, FiFi1
Vessel's purchase price 220,000,000 Built Simek, Norway (2013)
Class DNV GL
Initial financing Flag NIS
Bank loan 1st priority 100,000,000 Design UT 755 LC
Seller's credit 15,000,000 Deck area 707 sqm
Equity 111,000,000 Main engine 6,920 bhp
Project price 226,000,000
Equity
Initial paid in equity 111,000,000 Commercial & technical manager Myklebusthaug Management AS
Secondary emission (May 2017) 22,000,000 Lead investor Bergshav Management AS
Uncalled committed capital N/A Business manager Fearnley Business Management AS
Charter party Spot
Paid in capital per 1 % 1,330,000 Charter party length 1 year firm plus 2 x 1 year options
Uncalled committed capital per 1 % N/A Charter rate p.d. (firm year 1) EUR 5,500
Charter rate p.d. (option year 1) EUR 7,050
Accumulated dividend per 1 % 245,000 Charter rate p.d. (option year 2) EUR 11,000
Accumulated dividend in % of paid in capital 18 %
Last traded per 1 % N/A Last broker valuation on vessel 95,000,000
Last traded date N/A Last broker valuation date 31.12.2017
ESTIMATED NAV AT 31.12.2017 BALANCE SHEET FORECASTVessel value 105,000,000 95,000,000 75,000,000 Date 31.12.2017 31.12.2018 31.12.2019 30.06.2020
Cash 7,026,870 7,026,870 7,026,870 Cash 7,026,870 7,430,925 13,745,612 23,616,511
Other current assets 2,000,000 2,000,000 2,000,000 Other current assets 2,000,000 1,600,000 1,600,000 1,600,000
Total assets 114,026,870 104,026,870 84,026,870 Vessel value 95,000,000 95,000,000 95,000,000 95,000,000
Total assets 104,026,870 104,030,925 110,345,612 120,216,511
Bank loan 62,506,000 62,506,000 62,506,000
Accrued interest 386,565 386,565 386,565 Bank loan 62,506,000 62,506,000 62,506,000 62,506,000
Total liabilities 62,892,565 62,892,565 62,892,565 Accrued interest 386,565 386,565 386,565 386,565
Value adjusted equity 41,134,305 41,138,360 47,453,047 57,323,946
NAV 51,134,305 41,134,305 21,134,305 Total equity and liabilities 104,026,870 104,030,925 110,345,612 120,216,511
NAV per 1 % 511,343 411,343 211,343
Nominal return since establishment -43 % -51 % -66 % Est. future nominal return (basis NAV) 0 % 15 % 39 %
Nominal return since last traded N/A N/A N/A
DEBT FINANCING AT 31.12.2017 CASH FLOW FORECASTOutstanding bank debt 62,506,000 Year 2018 2019 2020
No instalments due until maturity of the debt* Operating income 17,769,015 24,097,032 18,747,599
Debt maturity date 14.05.2020 Operating expenses -14,002,250 -14,002,250 -6,981,944
Balloon 62,506,000 Admin / start-up expenses -695,402 -712,787 -365,303
Fixed CIRR interest 2.89 % EBITDA 3,071,363 9,381,995 11,400,352
Guarantee provision 1.95 % Change in net working capital 400,000 - -
Total interest rate (payable semi-annually) 4.84 % CapEx (purchase/sale) - - -
Net financial expenses -3,067,308 -3,067,308 -1,529,452
Change in bank debt - - -
Free cash flow to equity 404,055 6,314,687 9,870,899
Dividends
Dividend yield (basis NAV) 0 % 0 % 0 %
Assumed on-hire days 345 365 182
Assumed EUR/NOK exchange rate 9.86 9.86 9.86
COMMENTS
OCEAN SCOUT DIS
Project Broker Business Manager Secondhand trade
Edvard B. Aaby Fredrik Andresen Axel BendvoldNorwegian built Platform Supply Vessel trading in the spot market
1+1+1 yrs Offshore
MV Dina Scout has been awarded a long term contract for a peroid of 1 year firm, plus 2 x
1 year options. Commencement will be between 1st and 28th of February 2018. The vessel
will trade in the Noth Sea
*In May 2017 the project effected an extraordinary repayment og MNOK 12.5 on the loan.
Thus, no further instalments are required until matruity of the loan which is May 14th,
2020
Please contact Fearnley Project Finance for more information
(+47) 22 93 63 47 (+47) 22 93 64 57 (+47) 22 93 63 46
31.12.2017NOK 95m NOK 411k TC
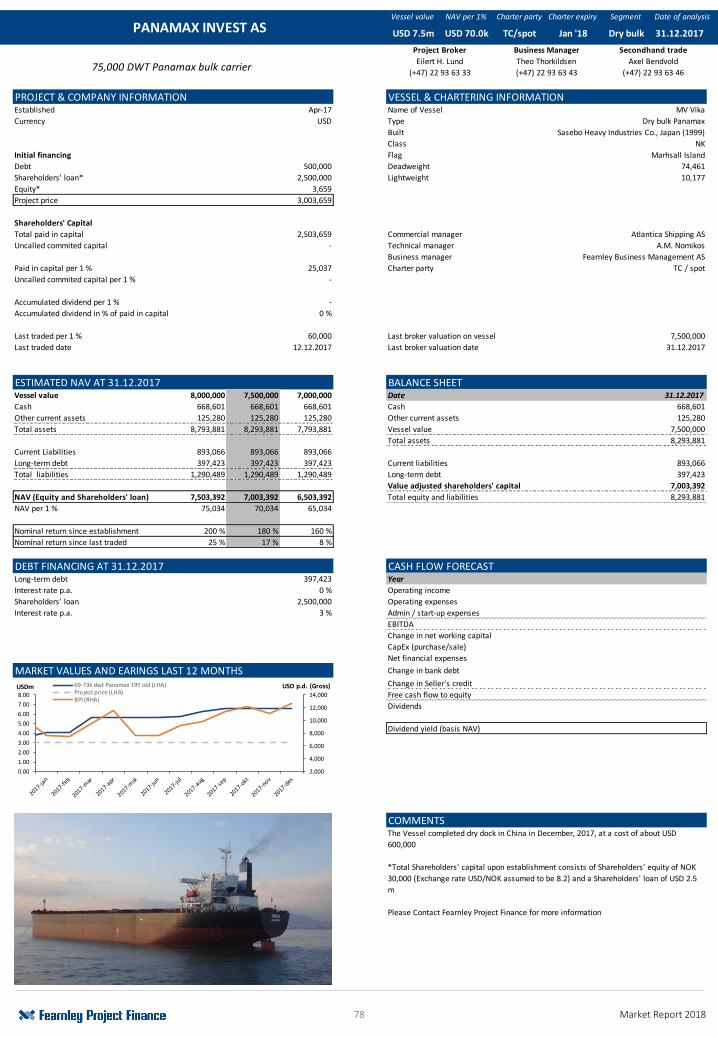
78 Market Report 2018
Vessel value NAV per 1% Charter party Charter expiry Segment Date of analysis
PROJECT & COMPANY INFORMATION VESSEL & CHARTERING INFORMATIONEstablished Apr-17 Name of Vessel MV Vika
Currency USD Type Dry bulk Panamax
Built Sasebo Heavy Industries Co., Japan (1999)
Class NK
Initial financing Flag Marhsall Island
Debt 500,000 Deadweight 74,461
Shareholders' loan* 2,500,000 Lightweight 10,177
Equity* 3,659
Project price 3,003,659
Shareholders' Capital
Total paid in capital 2,503,659 Commercial manager Atlantica Shipping AS
Uncalled commited capital - Technical manager A.M. Nomikos
Business manager Fearnley Business Management AS
Paid in capital per 1 % 25,037 Charter party TC / spot
Uncalled commited capital per 1 % -
Accumulated dividend per 1 % -
Accumulated dividend in % of paid in capital 0 %
Last traded per 1 % 60,000 Last broker valuation on vessel 7,500,000
Last traded date 12.12.2017 Last broker valuation date 31.12.2017
ESTIMATED NAV AT 31.12.2017 BALANCE SHEETVessel value 8,000,000 7,500,000 7,000,000 Date 31.12.2017
Cash 668,601 668,601 668,601 Cash 668,601
Other current assets 125,280 125,280 125,280 Other current assets 125,280
Total assets 8,793,881 8,293,881 7,793,881 Vessel value 7,500,000
Total assets 8,293,881
Current Liabilities 893,066 893,066 893,066
Long-term debt 397,423 397,423 397,423 Current liabilities 893,066
Total liabilities 1,290,489 1,290,489 1,290,489 Long-term debt 397,423
Value adjusted shareholders' capital 7,003,392
NAV (Equity and Shareholders' loan) 7,503,392 7,003,392 6,503,392 Total equity and liabilities 8,293,881
NAV per 1 % 75,034 70,034 65,034
Nominal return since establishment 200 % 180 % 160 %
Nominal return since last traded 25 % 17 % 8 %
DEBT FINANCING AT 31.12.2017 CASH FLOW FORECASTLong-term debt 397,423 Year
Interest rate p.a. 0 % Operating income
Shareholders' loan 2,500,000 Operating expenses
Interest rate p.a. 3 % Admin / start-up expenses
EBITDA
Change in net working capital
CapEx (purchase/sale)
Net financial expenses
MARKET VALUES AND EARINGS LAST 12 MONTHS Change in bank debt
Change in Seller's credit
Free cash flow to equity
Dividends
Dividend yield (basis NAV)
COMMENTS
Jan '18 Dry bulk
(+47) 22 93 63 46
31.12.2017
The Vessel completed dry dock in China in December, 2017, at a cost of about USD
600,000
*Total Shareholders' capital upon establishment consists of Shareholders' equity of NOK
30,000 (Exchange rate USD/NOK assumed to be 8.2) and a Shareholders' loan of USD 2.5
m
Please Contact Fearnley Project Finance for more information
75,000 DWT Panamax bulk carrier
PANAMAX INVEST AS USD 7.5m USD 70.0k TC/spot
Project Broker Business Manager Secondhand trade
Eilert H. Lund Theo Thorkildsen Axel Bendvold
(+47) 22 93 63 33 (+47) 22 93 63 43
2,000
4,000
6,000
8,000
10,000
12,000
14,000
0.00
1.00
2.00
3.00
4.00
5.00
6.00
7.00
8.00
USD p.d. (Gross)USDm 69-73k dwt Panamax 19Y old (LHA)Project price (LHA)BPI (RHA)
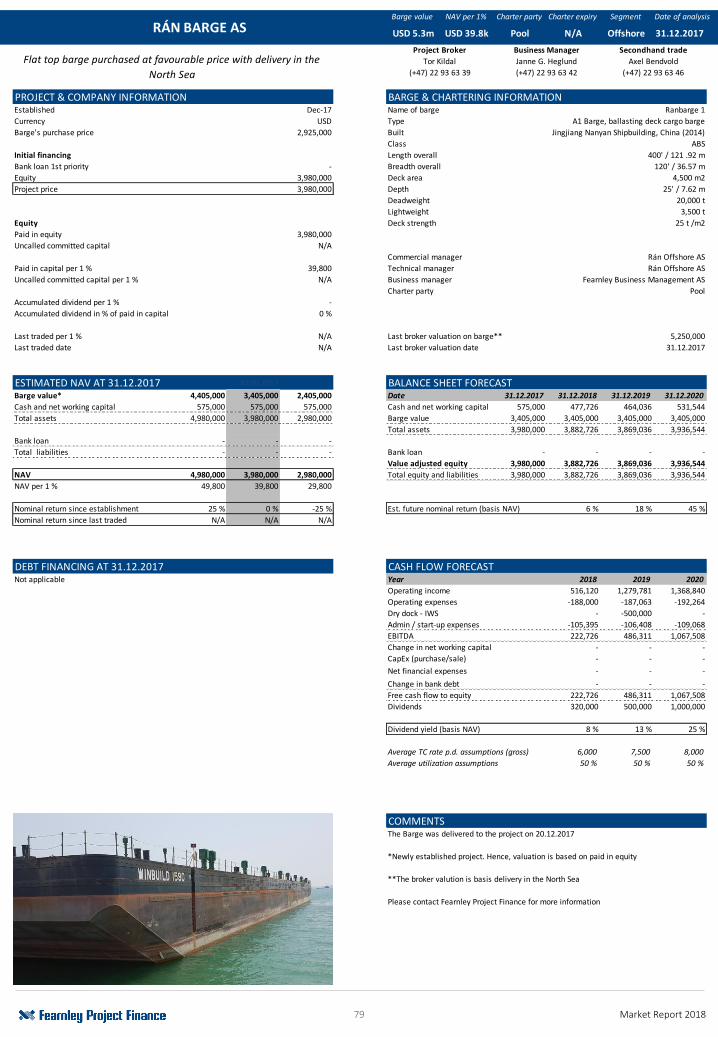
79 Market Report 2018
Barge value NAV per 1% Charter party Charter expiry Segment Date of analysis
PROJECT & COMPANY INFORMATION BARGE & CHARTERING INFORMATIONEstablished Dec-17 Name of barge Ranbarge 1
Currency USD Type A1 Barge, ballasting deck cargo barge
Barge's purchase price 2,925,000 Built Jingjiang Nanyan Shipbuilding, China (2014)
Class ABS
Initial financing Length overall 400' / 121 .92 m
Bank loan 1st priority - Breadth overall 120' / 36.57 m
Equity 3,980,000 Deck area 4,500 m2
Project price 3,980,000 Depth 25' / 7.62 m
Deadweight 20,000 t
Lightweight 3,500 t
Equity Deck strength 25 t /m2
Paid in equity 3,980,000
Uncalled committed capital N/A
Commercial manager Rán Offshore AS
Paid in capital per 1 % 39,800 Technical manager Rán Offshore AS
Uncalled committed capital per 1 % N/A Business manager Fearnley Business Management AS
Charter party Pool
Accumulated dividend per 1 % -
Accumulated dividend in % of paid in capital 0 %
Last traded per 1 % N/A Last broker valuation on barge** 5,250,000
Last traded date N/A Last broker valuation date 31.12.2017
ESTIMATED NAV AT 31.12.2017 30.09.2017 BALANCE SHEET FORECASTBarge value* 4,405,000 3,405,000 2,405,000 Date 31.12.2017 31.12.2018 31.12.2019 31.12.2020
Cash and net working capital 575,000 575,000 575,000 Cash and net working capital 575,000 477,726 464,036 531,544
Total assets 4,980,000 3,980,000 2,980,000 Barge value 3,405,000 3,405,000 3,405,000 3,405,000
Total assets 3,980,000 3,882,726 3,869,036 3,936,544
Bank loan - - -
Total liabilities - - - Bank loan - - - -
Value adjusted equity 3,980,000 3,882,726 3,869,036 3,936,544
NAV 4,980,000 3,980,000 2,980,000 Total equity and liabilities 3,980,000 3,882,726 3,869,036 3,936,544
NAV per 1 % 49,800 39,800 29,800
Nominal return since establishment 25 % 0 % -25 % Est. future nominal return (basis NAV) 6 % 18 % 45 %
Nominal return since last traded N/A N/A N/A
DEBT FINANCING AT 31.12.2017 CASH FLOW FORECASTNot applicable Year 2018 2019 2020
Operating income 516,120 1,279,781 1,368,840
Operating expenses -188,000 -187,063 -192,264
Dry dock - IWS - -500,000 -
Admin / start-up expenses -105,395 -106,408 -109,068
EBITDA 222,726 486,311 1,067,508
Change in net working capital - - -
CapEx (purchase/sale) - - -
Net financial expenses - - -
Change in bank debt - - -
Free cash flow to equity 222,726 486,311 1,067,508
Dividends 320,000 500,000 1,000,000
Dividend yield (basis NAV) 8 % 13 % 25 %
Average TC rate p.d. assumptions (gross) 6,000 7,500 8,000
Average utilization assumptions 50 % 50 % 50 %
COMMENTS
RÁN BARGE AS USD 5.3m USD 39.8k Pool
Project Broker Business Manager
N/A
Flat top barge purchased at favourable price with delivery in the
North Sea
The Barge was delivered to the project on 20.12.2017
*Newly established project. Hence, valuation is based on paid in equity
**The broker valution is basis delivery in the North Sea
Please contact Fearnley Project Finance for more information
Offshore
(+47) 22 93 63 46
31.12.2017
Secondhand trade
Tor Kildal Janne G. Heglund Axel Bendvold
(+47) 22 93 63 39 (+47) 22 93 63 42
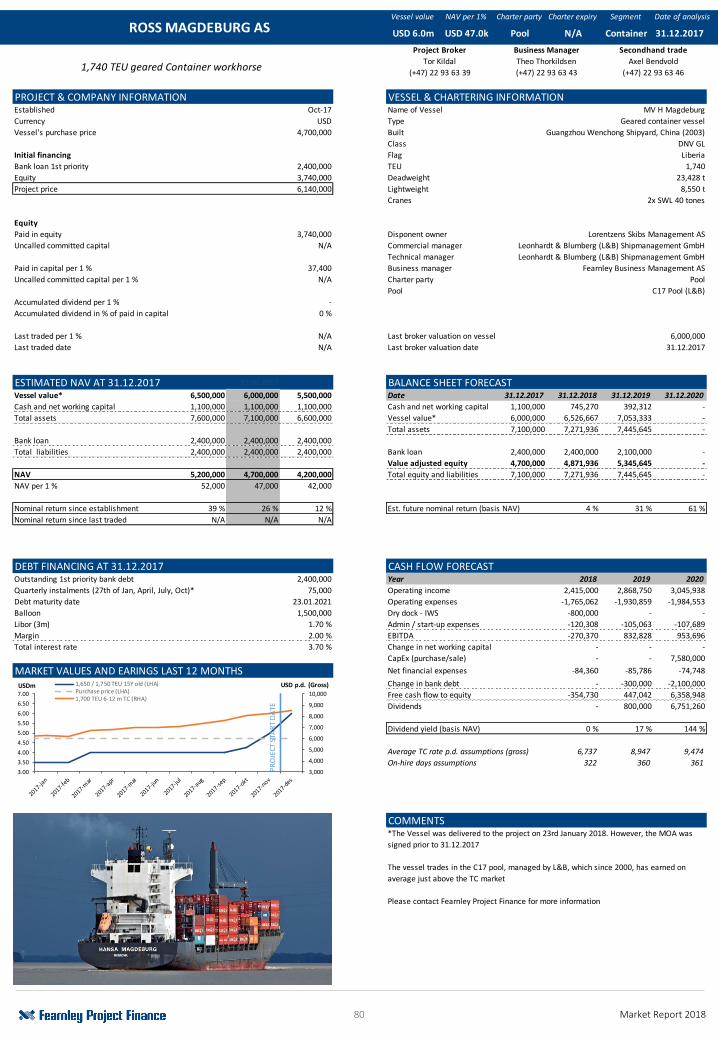
80 Market Report 2018
Vessel value NAV per 1% Charter party Charter expiry Segment Date of analysis
PROJECT & COMPANY INFORMATION VESSEL & CHARTERING INFORMATIONEstablished Oct-17 Name of Vessel MV H Magdeburg
Currency USD Type Geared container vessel
Vessel's purchase price 4,700,000 Built Guangzhou Wenchong Shipyard, China (2003)
Class DNV GL
Initial financing Flag Liberia
Bank loan 1st priority 2,400,000 TEU 1,740
Equity 3,740,000 Deadweight 23,428 t
Project price 6,140,000 Lightweight 8,550 t
Cranes 2x SWL 40 tones
Equity
Paid in equity 3,740,000 Disponent owner Lorentzens Skibs Management AS
Uncalled committed capital N/A Commercial manager Leonhardt & Blumberg (L&B) Shipmanagement GmbH
Technical manager Leonhardt & Blumberg (L&B) Shipmanagement GmbH
Paid in capital per 1 % 37,400 Business manager Fearnley Business Management AS
Uncalled committed capital per 1 % N/A Charter party Pool
Pool C17 Pool (L&B)
Accumulated dividend per 1 % -
Accumulated dividend in % of paid in capital 0 %
Last traded per 1 % N/A Last broker valuation on vessel 6,000,000
Last traded date N/A Last broker valuation date 31.12.2017
ESTIMATED NAV AT 31.12.2017 30.09.2017 BALANCE SHEET FORECASTVessel value* 6,500,000 6,000,000 5,500,000 Date 31.12.2017 31.12.2018 31.12.2019 31.12.2020
Cash and net working capital 1,100,000 1,100,000 1,100,000 Cash and net working capital 1,100,000 745,270 392,312 -
Total assets 7,600,000 7,100,000 6,600,000 Vessel value* 6,000,000 6,526,667 7,053,333 -
Total assets 7,100,000 7,271,936 7,445,645 -
Bank loan 2,400,000 2,400,000 2,400,000
Total liabilities 2,400,000 2,400,000 2,400,000 Bank loan 2,400,000 2,400,000 2,100,000 -
Value adjusted equity 4,700,000 4,871,936 5,345,645 -
NAV 5,200,000 4,700,000 4,200,000 Total equity and liabilities 7,100,000 7,271,936 7,445,645 -
NAV per 1 % 52,000 47,000 42,000
Nominal return since establishment 39 % 26 % 12 % Est. future nominal return (basis NAV) 4 % 31 % 61 %
Nominal return since last traded N/A N/A N/A
DEBT FINANCING AT 31.12.2017 CASH FLOW FORECASTOutstanding 1st priority bank debt 2,400,000 Year 2018 2019 2020
Quarterly instalments (27th of Jan, April, July, Oct)* 75,000 Operating income 2,415,000 2,868,750 3,045,938
Debt maturity date 23.01.2021 Operating expenses -1,765,062 -1,930,859 -1,984,553
Balloon 1,500,000 Dry dock - IWS -800,000 - -
Libor (3m) 1.70 % Admin / start-up expenses -120,308 -105,063 -107,689
Margin 2.00 % EBITDA -270,370 832,828 953,696
Total interest rate 3.70 % Change in net working capital - - -
CapEx (purchase/sale) - - 7,580,000
MARKET VALUES AND EARINGS LAST 12 MONTHS Net financial expenses -84,360 -85,786 -74,748
Change in bank debt - -300,000 -2,100,000
Free cash flow to equity -354,730 447,042 6,358,948
Dividends - 800,000 6,751,260
Dividend yield (basis NAV) 0 % 17 % 144 %
Average TC rate p.d. assumptions (gross) 6,737 8,947 9,474
On-hire days assumptions 322 360 361
COMMENTS*The Vessel was delivered to the project on 23rd January 2018. However, the MOA was
signed prior to 31.12.2017
The vessel trades in the C17 pool, managed by L&B, which since 2000, has earned on
average just above the TC market
Please contact Fearnley Project Finance for more information
Container
(+47) 22 93 63 46
31.12.2017
Secondhand trade
Tor Kildal Theo Thorkildsen Axel Bendvold
(+47) 22 93 63 39 (+47) 22 93 63 43
ROSS MAGDEBURG AS USD 6.0m USD 47.0k Pool
Project Broker Business Manager
N/A
1,740 TEU geared Container workhorse
3,000
4,000
5,000
6,000
7,000
8,000
9,000
10,000
3.00
3.50
4.00
4.50
5.00
5.50
6.00
6.50
7.00
USD p.d. (Gross)USDm 1,650 / 1,750 TEU 15Y old (LHA)Purchase price (LHA)1,700 TEU 6-12 m TC (RHA)
PR
OJE
CT
STA
RT
DA
TE

81 Market Report 2018
Vessel value NAV per 1% Charter party Charter expiry Segment Date of analysis
PROJECT & COMPANY INFORMATION VESSEL & CHARTERING INFORMATIONEstablished Apr-07 Name Seacor Express
Currency USD Type Ancor Handler Tug Supply w/ FiFi 1, DP 1, Tow
Vessel's purchase price 65,900,000 Built Labroy, Indonesia (2006)
Class ABS
Initial financing Flag Marshall Island
Bank loan 1st priority 49,500,000 Main engine 7,179 bhp
Bank loan 2nd priority 3,500,000 Bollard pull 80 t
Equity 16,000,000
Project price 69,000,000
Equity
Paid in equity 18,550,000 Commercial manager Seacor Offshore Dubai LLC
Uncalled committed capital 2,450,000 Technical manager Seacor Offshore Dubai LLC
Business manager Fearnley Business Management AS
Paid in capital per 1 % 185,500 Charter party Spot
Uncalled committed capital per 1 % 24,500
Accumulated dividend per 1 % 313,553
Accumulated dividend in % of paid in capital 169 %
Last traded per 1 % 0 Last broker valuation on vessel (USD) 3,000,000
Last traded date 01.06.2016 Last broker valuation date 31.12.2017
ESTIMATED NAV AT 31.12.2017 30.09.2017 BALANCE SHEET FORECASTVessel value 3,750,000 3,000,000 2,250,000 Date 31.12.2017 31.12.2018 30.09.2019
Cash and net working capital 1,165,246 1,165,246 1,165,246 Cash and net working capital 1,165,246 1,220,322 -
Total assets 4,915,246 4,165,246 3,415,246 Vessel value 3,000,000 3,000,000 -
Total assets 4,165,246 4,220,322 -
Bank loan 2,300,000 2,300,000 2,300,000
Total liabilities 2,300,000 2,300,000 2,300,000 Bank loan 2,300,000 1,200,000 -
Value adjusted equity 1,865,246 3,020,322 -
NAV 2,615,246 1,865,246 1,115,246 Total equity and liabilities 4,165,246 4,220,322 -
NAV per 1 % 26,152 18,652 11,152
Nominal return since establishment 83 % 79 % 75 % Est. future nominal return (basis NAV) -13 % -18 %
Nominal return since last traded N/A N/A N/A
DEBT FINANCING AT 31.12.2017 CASH FLOW FORECASTOutstanding 1st priority bank debt 2,300,000 Year 2018 2019
Semi annual installments (30th of April & October) 550,000 Operating income 1,314,326 1,058,850
Debt maturity date 30.09.2019 Operating expenses -1,354,200 -1,016,700
Balloon 650,000 Admin / start-up expenses -90,050 -92,301
Libor 2.00 % EBITDA -129,924 -50,151
Margin 4.00 % Change in net working capital - -
Total interest rate 6.00 % CapEx (purchase/sale) - 3,000,000
Net financial expenses -115,000 -37,825
Change in bank debt -1,100,000 -1,200,000
Free cash flow to equity -1,344,924 1,712,024
Dividends (call of capital) -1,400,000 2,932,346
Dividend yield (basis NAV) -75 % 157 %
Average TC rate p.d. assumptions (gross) 5,592 6,140
Average utilization assumptions 78 % 79 %
COMMENTSPlease contact Fearnley Project Finance for more information
Rune Støfring Axel Bendvold
(+47) 22 93 63 33 (+47) 22 93 63 41 (+47) 22 93 63 46
Business Manager
31.12.2017USD 3.0m USD 18.7k Spot N/A Offshore
Secondhand trade
SEACOR SUPPLYSHIPS 1 KS
Project Broker
Eilert H. LundAnchor handling tug supply vessel trading in the Middle East
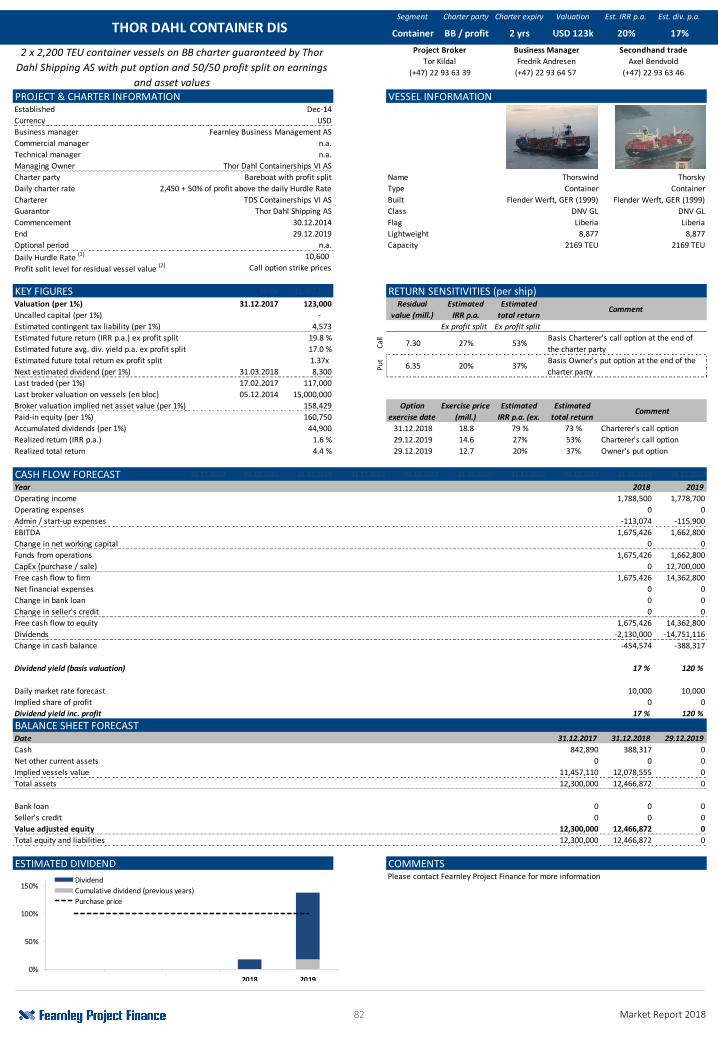
82 Market Report 2018
Segment Charter party Charter expiry Valuation Est. IRR p.a. Est. div. p.a.
PROJECT & CHARTER INFORMATION VESSEL INFORMATIONEstablished Dec-14
Currency USD
Business manager Fearnley Business Management AS
Commercial manager n.a.
Technical manager n.a.
Managing Owner Thor Dahl Containerships VI AS
Charter party Bareboat with profit split Name Thorswind Thorsky
Daily charter rate 2,450 + 50% of profit above the daily Hurdle Rate Type Container Container
Charterer TDS Containerships VI AS Built Flender Werft, GER (1999) Flender Werft, GER (1999)
Guarantor Thor Dahl Shipping AS Class DNV GL DNV GL
Commencement 30.12.2014 Flag Liberia Liberia
End 29.12.2019 Lightweight 8,877 8,877
Optional period n.a. Capacity 2169 TEU 2169 TEU
Daily Hurdle Rate (1) 10,600
Profit split level for residual vessel value (2) Call option strike prices
KEY FIGURES 43100 11,457,110 RETURN SENSITIVITIES (per ship)Valuation (per 1%) 31.12.2017 123,000
Uncalled capital (per 1%) -
Estimated contingent tax liability (per 1%) 4,573 Ex profit split Ex profit split
Estimated future return (IRR p.a.) ex profit split 19.8 %
Estimated future avg. div. yield p.a. ex profit split 17.0 %
Estimated future total return ex profit split 1.37x
Next estimated dividend (per 1%) 31.03.2018 8,300
Last traded (per 1%) 17.02.2017 117,000
Last broker valuation on vessels (en bloc) 05.12.2014 15,000,000
Broker valuation implied net asset value (per 1%) 158,429
Paid-in equity (per 1%) 160,750
Accumulated dividends (per 1%) 44,900 31.12.2018 18.8 79 % 73 %
Realized return (IRR p.a.) 1.6 % 29.12.2019 14.6 27% 53%
Realized total return 4.4 % 29.12.2019 12.7 20% 37%
CASH FLOW FORECAST 31.12.2010 31.12.2011 31.12.2012 31.12.2013 31.12.2014 31.12.2015 31.12.2016 31.12.2017 31.12.2018 29.12.2019
Year 2018 2019
Operating income 1,788,500 1,778,700
Operating expenses 0 0
Admin / start-up expenses -113,074 -115,900
EBITDA 1,675,426 1,662,800
Change in net working capital 0 0
Funds from operations 1,675,426 1,662,800
CapEx (purchase / sale) 0 12,700,000
Free cash flow to firm 1,675,426 14,362,800
Net financial expenses 0 0
Change in bank loan 0 0
Change in seller's credit 0 0
Free cash flow to equity 1,675,426 14,362,800
Dividends -2,130,000 -14,751,116
Change in cash balance -454,574 -388,317
Dividend yield (basis valuation) 17 % 120 %
Daily market rate forecast 10,000 10,000
Implied share of profit 0 0
Dividend yield inc. profit 17 % 120 %
BALANCE SHEET FORECASTDate 31.12.2017 31.12.2018 29.12.2019
Cash 842,890 388,317 0
Net other current assets 0 0 0
Implied vessels value 11,457,110 12,078,555 0
Total assets 12,300,000 12,466,872 0
Bank loan 0 0 0
Seller's credit 0 0 0
Value adjusted equity 12,300,000 12,466,872 0
Total equity and liabilities 12,300,000 12,466,872 0
ESTIMATED DIVIDEND COMMENTSPlease contact Fearnley Project Finance for more information
17%
Residual
value (mill.)
Estimated
IRR p.a.
Estimated
total returnComment
Container BB / profit 2 yrs USD 123k 20%
Comment
Charterer's call option
Charterer's call option
Basis Owner's put option at the end of the
charter party
Owner's put option
Option
exercise date
Exercise price
(mill.)
Estimated
IRR p.a. (ex.
Estimated
total return
Basis Charterer's call option at the end of
the charter partyCal
lP
ut
7.30
6.35 20%
27% 53%
37%
THOR DAHL CONTAINER DIS
Secondhand trade
Axel Bendvold
(+47) 22 93 63 46
Project Broker
Tor Kildal
(+47) 22 93 63 39
Business Manager
Fredrik Andresen
(+47) 22 93 64 57
2 x 2,200 TEU container vessels on BB charter guaranteed by Thor
Dahl Shipping AS with put option and 50/50 profit split on earnings
and asset values
0%
50%
100%
150%
2018 2019
Dividend
Cumulative dividend (previous years)
Purchase price
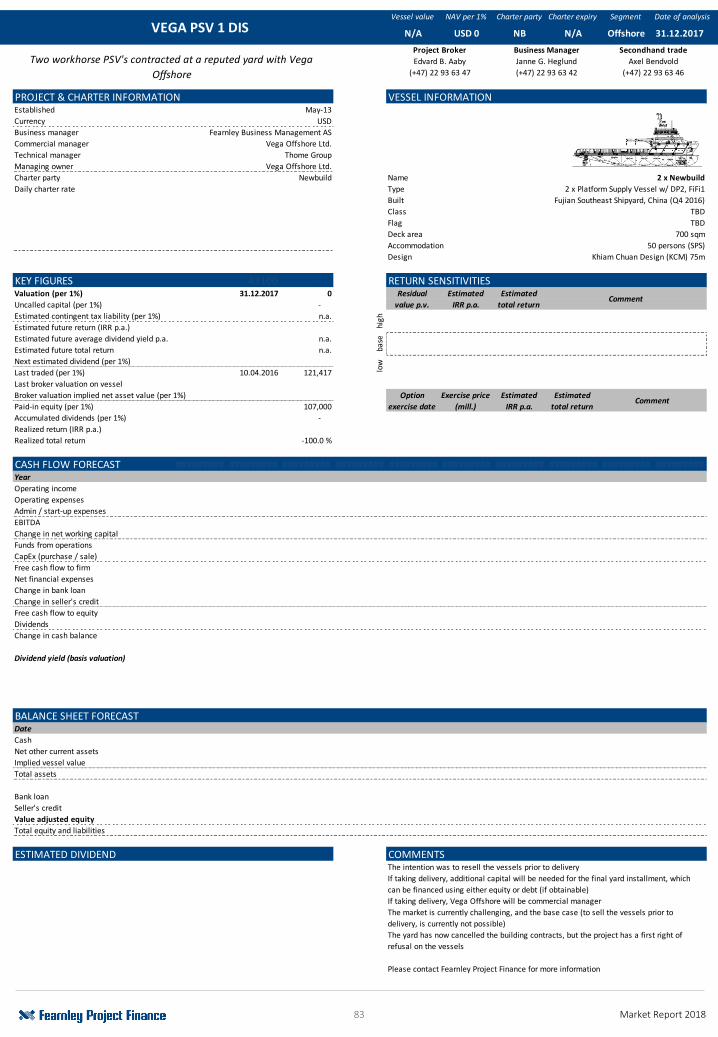
83 Market Report 2018
Vessel value NAV per 1% Charter party Charter expiry Segment Date of analysis
PROJECT & CHARTER INFORMATION VESSEL INFORMATIONEstablished May-13
Currency USD
Business manager Fearnley Business Management AS
Commercial manager Vega Offshore Ltd.
Technical manager Thome Group
Managing owner Vega Offshore Ltd.
Charter party Newbuild Name 2 x Newbuild
Daily charter rate Type 2 x Platform Supply Vessel w/ DP2, FiFi1
Built Fujian Southeast Shipyard, China (Q4 2016)
Class TBD
Flag TBD
Deck area 700 sqm
Accommodation 50 persons (SPS)
Design Khiam Chuan Design (KCM) 75m
KEY FIGURES 43100 - RETURN SENSITIVITIESValuation (per 1%) 31.12.2017 0
Uncalled capital (per 1%) -
Estimated contingent tax liability (per 1%) n.a.
Estimated future return (IRR p.a.)
Estimated future average dividend yield p.a. n.a.
Estimated future total return n.a.
Next estimated dividend (per 1%)
Last traded (per 1%) 10.04.2016 121,417
Last broker valuation on vessel
Broker valuation implied net asset value (per 1%)
Paid-in equity (per 1%) 107,000
Accumulated dividends (per 1%) - 30.09.2022 95.0 #VALUE! #VALUE!
Realized return (IRR p.a.) 30.09.2023 92.0 #VALUE! #VALUE!
Realized total return -100.0 % 28.08.2021 90.0 #VALUE! #VALUE!
CASH FLOW FORECAST ######### ######### ######### ######### ######### ######### ######### ######### ######### #########Year
Operating income
Operating expenses
Admin / start-up expenses
EBITDA
Change in net working capital
Funds from operations
CapEx (purchase / sale)
Free cash flow to firm
Net financial expenses
Change in bank loan
Change in seller's credit
Free cash flow to equity
Dividends
Change in cash balance
Dividend yield (basis valuation)
BALANCE SHEET FORECASTDate 31.12.2017
Cash 0
Net other current assets 0
Implied vessel value #VALUE!
Total assets #VALUE!
Bank loan 0
Seller's credit 0
Value adjusted equity #VALUE!
Total equity and liabilities #VALUE!
ESTIMATED DIVIDEND COMMENTSThe intention was to resell the vessels prior to delivery
If taking delivery, Vega Offshore will be commercial manager
The market is currently challenging, and the base case (to sell the vessels prior to
delivery, is currently not possible)
Please contact Fearnley Project Finance for more information
Two workhorse PSV's contracted at a reputed yard with Vega
Offshore
Option
exercise date
Exercise price
(mill.)
Estimated
IRR p.a.
Estimated
total returnComment
high 21.0 #VALUE! #DIV/0! Residual value reflecting current
Comment
44834
low 17.2 #VALUE! #DIV/0!
Residual value reflecting 15 year linear
depreciation of purchase price to scrapba
se 19.3 #VALUE! #DIV/0!Residual value reflecting 30 year linear
depreciation of purchase price to scrap
USD 0 NB N/A Offshore
If taking delivery, additional capital will be needed for the final yard installment, which
can be financed using either equity or debt (if obtainable)
45199
The yard has now cancelled the building contracts, but the project has a first right of
refusal on the vessels
VEGA PSV 1 DIS
Project Broker Business Manager Secondhand trade
Edvard B. Aaby Janne G. Heglund Axel Bendvold
(+47) 22 93 63 47 (+47) 22 93 63 42 (+47) 22 93 63 46
31.12.2017
Residual
value p.v.
Estimated
IRR p.a.
Estimated
total return
N/A
84 Market Report 2017
Haakon Shetelig | Managing Partner Fredrik Honningsvåg | Project Broker Dir: +47 22 93 63 38 Dir: +47 22 93 64 59Mob: +47 93 22 74 38 Mob: +47 98 62 51 55Mail: [email protected] Mail: [email protected]
Jens Bøvre | Project Broker Lars Øygard| Project AnalystDir: +47 22 93 64 54 Dir: +47 22 93 63 35Mob: +47 93 85 37 53 Mob: +47 47 02 27 20 Mail: [email protected] Mail: [email protected]
Nicolay Staff| Project Analyst Cato Hauge | Asset ManagerDir: +47 22 93 64 58 Dir: +47 22 93 63 48Mob: +47 97 70 80 00 Mob: +47 92 01 21 37Mail: [email protected] Mail: [email protected]
Tor Kildal | Managing Partner Edvard B. Aaby | Partner Dir: +47 22 93 63 39 Dir: +47 22 93 63 47Mob: +47 95 33 95 39 Mob: +47 92 63 36 76Mail: [email protected] Mail: [email protected]
Petter Fredrik Bøe | Partner Eilert H. Lund | PartnerDir: +47 22 93 64 50 Dir: +47 22 93 63 33Mob: +47 98 85 66 25 Mob: +47 92 25 63 33 Mail: [email protected] Mail: [email protected]
Martin Hjemdal | Project Analyst Andreas Thorvildsen | Project AnalystDir: +47 22 93 63 34 Dir: +47 22 93 64 51Mob: +47 48 26 92 25 Mob: +47 92 09 65 60 Mail: [email protected] Mail: [email protected]
Axel Bendvold | Project Sales Sigurd Virik | Project SalesDir: +47 22 93 63 46 Dir: +47 22 93 64 55Mob: +47 40 46 00 04 Mob: +47 90 94 62 64Mail: [email protected] Mail: [email protected]
CONTACT INFORMATION
www.fearnleyprojectfinance.no | An Astrup Fearnley Company
Real Estate
Shipping & Offshore
Project Sales – Real Estate, Shipping & Offshore
FEARNLEY PROJECT FINANCE AS
Grev Wedels Plass 9 Tel: +47 22 93 60 00
Oslo, Norway Fax: +47 22 93 63 40Email: [email protected]
Postal addressP.O. Box 1158 Sentrum Org.nr.: NO 991 097 481 VAT0107, Oslo, Norway www.astrupfearnley.no
www.fearnleyprojectfinance.no

www.fearnleyprojectfinance.no | An Astrup Fearnley Company
Theo Thorkildsen | Head of Department Rune Støfring | Business ManagerDir: +47 22 93 63 43 Dir: +47 22 93 63 41Mob: +47 93 85 40 51 Mob: +47 98 26 43 86Mail: [email protected] Mail: [email protected]
Geir Åge Rønneberg | Business Manager Marianne Fossum| Business ManagerDir: +47 22 93 64 53 Dir: +47 22 93 64 52Mob: +47 97 74 72 85 Mob: +47 95 00 91 12Mail: [email protected] Mail: [email protected]
Monica J. McDougall Staff | Business Manager Janne G. Heglund | Business ManagerDir: +47 22 93 64 39 Dir: +47 22 93 63 42 Mob: +47 92 23 12 89 Mob: +47 95 88 59 57Mail: [email protected] Mail: [email protected]
Fredrik Andresen | Business Manager Regine Hjelmtvedt | Business ManagerDir: +47 22 93 64 57 Dir: +47 22 93 63 37Mob: +47 90 96 01 09 Mob: +47 48 15 86 54Mail: [email protected] Mail: [email protected]
Odd-Eirik Olsen | Business Manager Nine Strøm | AccountantDir: +47 22 93 64 42 Dir: +47 22 93 63 49Mob: +47 90 95 38 61 Mob: +47 47 70 66 22 Mail: [email protected] Mail: [email protected]
Katrine Brekke | Office ManagerDir: +47 22 93 63 44Mob: +47 91 78 43 39Mail: [email protected]
Kjell Aage KummenDir: +47 22 93 63 32Mob: +47 90 55 87 91Mail: [email protected]
FEARNLEY PROJECT FINANCE AS
Grev Wedels Plass 9 Tel: +47 22 93 60 00
Oslo, Norway Fax: +47 22 93 63 40Email: [email protected]
Postal addressP.O. Box 1158 Sentrum Org.nr.: NO 991 097 481 VAT0107, Oslo, Norway www.astrupfearnley.no
www.fearnleyprojectfinance.no
CONTACT INFORMATION
Business Management
Compliance