market report for republic of korea - asia securities forum€¦ · market report for republic of...
TRANSCRIPT

1
Market Report for Republic of Korea
November 2012
Korea Financial Investment Association

2
I. Economic and Financial Background
1. General Economic Development
Real gross domestic product (chained volume measure of GDP) increased 3.6 percent
in the year 2011.Growth in real GDP was mainly due to the continuous strength of
exports, while construction investment slumped and the rates of increase in private
consumption and facilities investment slowed.
Real gross national income (chained volume measure of GNI) increased 1.5 percent
over the previous year, lower than the growth of real GDP due to the deterioration of
the terms of trade.
In 2011, agriculture, forestry & fishing decreased by 2.0 percent, owing mostly to the
influence of severe weather conditions and outbreaks of foot-and-mouth disease.
Manufacturing rose by 7.2 percent, with general machinery, transport equipment and
metal products posting strong output gains. Construction showed negative growth of
4.6 percent, as the sluggishness of residential building construction and civil
engineering continued in addition to the slower growth of non-residential building
construction. Services increased 2.6 percent, as growth picked up in real estate &
renting and information & communication; growth slowed however in other sectors
such as wholesale & retail trade and transport & storage, while the restaurants &
hotels sector saw a downturn.
In 2011, private consumption increased 2.3 percent. While durables and semi-durables
expenditures showed solid growth, expenditures on non-durables and services grew at
a slower pace.
Gross fixed capital formation decreased by 1.1 percent. Construction investment
dropped by 5.0 percent, mainly owing to the contraction of residential construction
and civil engineering investment. In contrast, facilities investment increased by 3.7
percent in response to the rise in machinery investment.
Exports of goods & services grew by 9.5 percent, led by those of automobiles,
machinery and iron & steel products.
In 2011, gross domestic product at current prices (nominal GDP) increased 5.4 percent
to record 1,237.1 trillion won. Per capita GNI grew by US$ 1,927 to US$ 22,489 from
US$ 20,562 in 2010.
3
In 2011, the GDP deflator rose by 1.7 percent, down from 3.6% the previous year, as
the rates of increase in the prices of export and domestic goods fell short of that for
imported goods.
The gross saving ratio decreased by 0.4 of a percentage point from 32.1 percent in
2010 to 31.7 percent in 2011, led downward by the private sector. The gross domestic
investment ratio likewise dropped slightly from 29.6 percent to 29.4 percent.
Inflation languished above 4% in 2011. Surging commodity prices in the first half of
the year and service price hikes in the second half were the main culprits. In particular,
prices of food, transportation and fuel, which account for a large share of household
expenditures of ordinary people, increased relatively sharply, making the lives of low-
income brackets much more difficult
Sluggish domestic consumption dented economic growth. Rising inflation reduced
real income, contracting consumer sentiment and consumption. A slower pace in
export growth and rising uncertainty over the global economy also dampened
investment sentiment, leading to a sharp deceleration of facilities investment.
Moreover, continuous softness in the housing market and less infrastructure spending
crimped investment in civil engineering, which led to a downward spiral in
construction investment in 2011. As a result, in 2011, domestic demand rose only
0.7%, and GDP growth remained at 3.6%, falling short of expectations.
2. Financial Environment
The KOSPI Market started as a bull market in 2011 with expecting the reflection
benefit from the restoration of the Great Eastern Japan Earthquake of March, 2011.
However, for the third quarter of the year, the value of stock market was highly
deteriorated due to the sovereign shock of U.S. and Europe area, and Side Car was
triggered on 9th August to avoid sudden decline in stock price.
In 2011, average daily trading value of KOSPI Market was KRW 6,863 billion which
is 22.1% increase from year earlier. The total market capitalization ended at KRW
1,042 trillion which is 8.7% decrease from the end of 2010.
KOSPI200 futures showed a sharp fall due to the instability of the Middle East and the
Japan Earthquake and recovered to the highest point of the year owing to the sign of
economic recovery. It tumbled down to the lowest point(214.35p) in August by the
downgrade of U.S. sovereign credit ratings and European debt crisis. After then,
KOSPI200 futures fluctuated by favorable and unfavorable factors and closed by
238.60p, a decrease of 12.9% from 2010.
4
Even though the interest rate rose sharply at the beginning of 2011 after raising the
base rate by the Monetary Policy Committee, it continued to decline owing to the
flight to quality following the Great Japan Earthquake. The rate of 3-year KTB was
3.34% at the end of 2011, 0.04%p lower than that of 2010 (3.38%). The rate of
corporate bond also showed the similar downtrend. For the primary market, total issue
amount of 2011 was KRW 541.4 trillion (a decrease of KRW 33.7 trillion from 2010)
and the amount outstanding at the end of 2011 was KRW 1,201.7 trillion, showing an
increase of KRW 84.9 trillion (+7.6%) from a year ago.

5
II. Economic Performance and Prospects
1. GDP Growth
Korea’s real gross domestic product (GDP) expanded by 0.3 percent quarter-on-
quarter and 2.3 percent year-on-year in the second quarter of 2012. The numbers were
revised downward by 0.1 percentage points each from the advanced estimates released
a month ago.
On the production side, manufacturing and construction contracted by 0.2 percent and
2.7 percent, respectively. Services expanded by 0.5 percent, led by finance &
insurance, information & communications, and healthcare & social welfare.
On the expenditure side, private consumption grew by 0.4 percent due to increased
expenditures on durable and semi-durable goods. Facility investment and construction
investment fell by 7.0 percent and 0.4 percent each. Exports fell by 1.4 percent, led by
automobiles and petrochemical products, while imports fell by 1.8 percent due to
lower demand for electronics and general machinery.
The real gross national income (GNI) rose 1.2 percent from the previous quarter,
helped by improving terms of trade. The nominal GNI, however, fell by 0.2 percent.

6
2. Exports and Imports
Exports in 2011 increased 19.0 percent to US$555.21 billion and in the first half of
2011, Korea’s exports totaled US$275.22 billion. Exports in August 2012 turned
negative year-on-year again following July as exports of major items such as mobile
phones (down 34.7%), vessels (down 34.2%), automobiles (down 21.7%), and steel
(down 10.8%) tumbled. In August, when most people go on vacation, average daily
exports typically fall because actual working days decrease.
Imports in 2011 increased 23.3 percent to US$524.41 billion. Imports in August fell
9.8 percent (preliminary) year-on-year to US$40.93 billion. Imports of capital goods
(down 18.2%) including semiconductor equipment, consumer goods (down 11.6%),
and commodities (down 7.8%) all decreased year-on-year.
The current account balance in 2011 recorded a surplus of US $30.80 billion and in
August 2011 it posed a surplus of US$2.04 billion.

7
3. Employment
The number of workers on payroll in 2011 increased by 415,000 from 2010, while the
employment rate (seasonally adjusted) rose by 0.4 percentage points to 59.1 percent.
In July 2012, the number increased by 470,000 from a year earlier, while the
employment rate rose by 0.3 percentage points to 59.4 percents.
The number of unemployed persons in 2011 decreased by 65,000 to 855,000 and the
unemployment rate (seasonally adjusted) decreased by 0.3 percentage points to 3.4
percent The number of unemployed persons decreased by 42,000 year-on-year to
795,000 in July 2012, while the unemployment rate fell 0.2 percentage points year-on-
year to 3.1 percent.
The youth unemployment rate in 2011 and July 2012 was at 7.6 percent and 7.3
percent respectively. Recently the youth unemployment rate declined 0.3 percentage
points year-on-year to 7.3 percent.

8
4. Balance of Payments
Korea’s current account surplus in 2011 narrowed from the previous year’s US$29.39
billion to US$26.51 billion. For the first half of 2012, the amount recorded US$13.7
billion.

9
5. Prices
Consumer prices in August 2012 rose 1.2 percent year-on-year (up 0.4%, m-o-m),
staying stable.
Core consumer prices, which exclude oil and agricultural products, rose 1.3 percent
year-on year and 0.2 percent month-on-month. Core consumer prices based on the
OECD method, which excludes food and energy, rose 1.2 percent year-on-year and
0.2 percent month-on month.Consumer prices for basic necessities, a barometer of
perceived consumer prices, were up 0.6 percent year-on-year (up 0.7%, m-o-m).

10
6. Private Consumption
Private consumption climbed 2.3 percent in 2011 and 1.2 percent year-on year in the
second quarter of 2012.
Retail sales in 2011 climbed 4.3 percent and the second quarter of 2012 showed 0.2
percent increase, helped by an improvement in sales of durable goods including
increased car sales, while sales of semi-durable goods such as gasoline dropped a bit.
For the second quarter of 2012, on a year-on-year basis, sales of durable expanded 1.3
percent, while those of semi-durable goods and non-durable goods declined 0.3
percent and 1.0 percent, respectively .
Retail sales in July 2012 rose 3.4 percent month-on-month due to an increase in the
sale of durable goods, semi-durable goods and non-durable goods. On a yearly basis,
sales increased 2.7 percent. Durable goods sales went up 7.1 percent month-on-month
thanks to a big increase in sales of computer & communication equipment and
automobiles. Semi-durable goods and nondurable goods sales turned positive, rising
2.0 percent and 1.7 percent, respectively.

11
In 2011, sales at department stores, large discounters, specialized retailers and non-
store retailers gained 8.1 percent, 3.9 percent, 3.3 percent and 8.6 percent respectively.
Department stores, large discount stores, specialized retailers and nonstore retailers all
saw their sales increase in July 2012.
7. Service Sector Activity
In 2011, overall service activity index increased 3.3 percent. For the first and second
quarter of 2012, service activity increased 1.0 percent and 0.2 percent respectively.
Service activity in July 2012 rose 0.7 percent from the previous month and 1.5 percent
from a year earlier as wholesale & retail, financial & insurance services and real estate
& renting improved. Wholesale & retail increased 0.7 percent month-on-month,
thanks to a significant increase in retail sales, driving up the whole service activity.
Hotels & restaurants were down by 0.1 percent, as service activity in restaurants and
bars decreased due to the economic slowdown and people taking early vacations.

12

13
8. Housing Market
Nationwide apartment sales prices kept the downward trend in August, falling 0.2%
from the previous month.
Apartment sales prices in the Seoul metropolitan area declined for the tenth
consecutive month (down 0.4%, m-o-m). Apartment sales prices continued to rise in
some areas excluding the Seoul metropolitan area, in particular Daegu (up 0.4%, m-o-
m), South Chungcheong Province (up 0.5%, m-om) and North Gyeongsang Province
(up 0.5%, m-o-m). Apartment prices in five metropolitan cities and other cities stayed
flat.
Ⅱ. Capital Market Performance
1. Stock Market
The Korean stock price index in August rose 1.2 percent to 1,905 points from the
previous month’s 1,882 points.
The KOSPI Composite soared due to net foreign buying in the beginning of the month
spurred by lowering euro zone risks, reaching 1,957.9 points on August 16. However,
the previous gains pared due to weak global markets and profit-taking later in the
month.

14
2. Exchange Rate
The won/dollar exchange rate in August rose by 4.1 won to 1,134.7 won from 1,130.6
won at the end of July.
The won/dollar exchange rate moved up and down between 1,120 won and 1,130 won
in August on expectations that the US Federal Reserve would announce another round
of stimulus, and on easing concern about the eurozone crisis.
The won/100 yen exchange rate rose by 1.17 won as both the won and the yen
depreciated relative to the dollar.

15
3. Bond Market
5-year Treasury bond yields dropped 11 basis points in August to 2.86 percent from
the previous month’s 2.97 percent as foreign investors continued to make net
purchases after US government bond yields fell and Moody’s upgraded Korea’s
sovereign debt rating on August 27.
16
4. Derivatives Market
In 2011, the daily average trading volume of exchange-traded derivatives increased
6.0% year on year. The main reason for this was increasing volatility due to the
nuclear power plant disaster in Japan, the US credit rating downgrade, and the
worsening debt crisis in Europe.
The daily average trading volume of 3-year government bond futures and US dollar
futures rose by 24% and 8.2% year on year, respectively. It is also good to point out
that the investor base has diversified in these markets, and the proportion of foreign
investors has increased, 1.4 percentage points year on year for government bond
futures and 4.3 percentages points year on year for US dollar futures.
This is because there is strong demand for government bond futures and US dollar
futures by foreign investors, hoping to take advantage of exchange rate fluctuations
caused by external risks such as the European debt crisis.
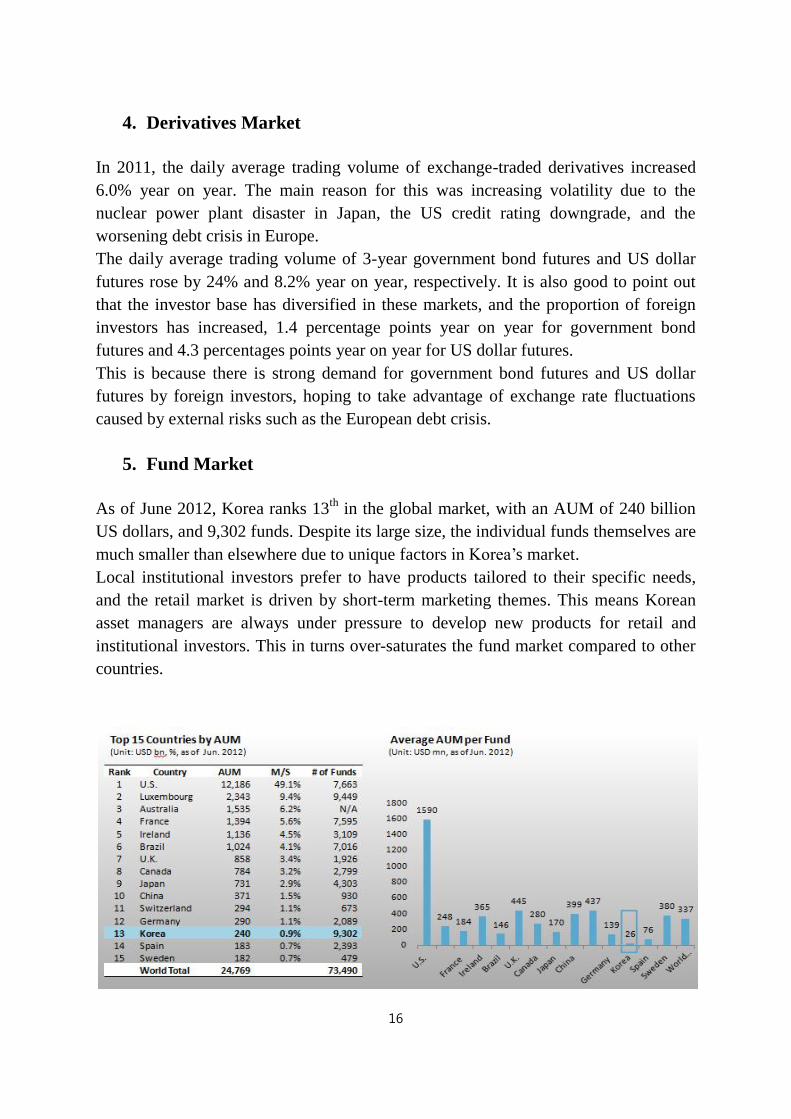
5. Fund Market
As of June 2012, Korea ranks 13th
in the global market, with an AUM of 240 billion
US dollars, and 9,302 funds. Despite its large size, the individual funds themselves are
much smaller than elsewhere due to unique factors in Korea’s market.
Local institutional investors prefer to have products tailored to their specific needs,
and the retail market is driven by short-term marketing themes. This means Korean
asset managers are always under pressure to develop new products for retail and
institutional investors. This in turns over-saturates the fund market compared to other
countries.

17
Ⅲ. Regulatory Development
The Financial Investment Services and Capital Markets Act (“FSCMA”) was
established in 2007 as a comprehensive overhaul of capital markets regulations in
order to promote autonomy and innovation in capital markets.
In June 2012, the Financial Services Commission (FSC) carried out a partial revision
of the Enforcement Decrees of the FSCMA. The major revisions are shown below:
1) Ease up Chinese wall regulations
(1) Financing for non-listed companies and block deals for listed securities are
allowed.
(2) Chinese wall regulations will be applied differently depending the phase of PF
tasks.
(3) Chinese wall regulations will be relaxed between the primary market and the
secondary market with respect to bonds in which QIBs invest and certain CPs.
(4) To facilitate the PB businesses, integrated operation of trust business, advisory
and discretionary investment business, and certain dealing and brokering
businesses are permitted.
2) Introduce reporting requirements for significant short position
To improve the transparency of short selling, the regulators newly introduced
reporting requirements for short sellers holding a net short position that exceed a
given threshold (significant short position).
3) Enhance the autonomy of PEF management
The leverage limit of PEFs through an SPC was raised from 200% to 300% to
enhance the autonomy and flexibility of PEF management.
4) Improve the institutional RP transaction system
(1) For RP transactions between institutional RP counterparties (banks, securities

18
companies, etc.) and investment trading companies, delivery versus payment is
required.
(2) The revised regulations allowed for dealer-type RP brokers with trust business
(securities finance companies) transaction with funds under their management
as an exception.