market report -sept 01 2015
DESCRIPTION
The idea portfolio returned 6.35% last quarter. There have been some changes with some new ideas.TRANSCRIPT

WHYTECLIFF FINANCIAL CORP.
By Bradley Parkes
September 1, 2015
Markets – Trades
Investment ideas for 2015
(Not really my cat, I would never put Skeletor on Battlecat)

Previous Edition Ideas
SHORT IDEAS
OIL (HOD.to)
GOLD (HGD.to)
EUR (EUO.N)
LONG IDEAS
USD (DLR.to)
German DAX (EWG.N)
Japanese Stocks (EWJ.N)
China (FXI.N)
BONUS
Long DOW - With AAPL a new component in the DOW and with capital flows to the US from (Africa, Asia,
Europe...) the S&P500 and DJIA are likely going to peak at a level considered obscene...DJIA = 22,000. This
trade is the break down of European socialism and will violate cheap/expensive market metrics as money
flees to where it seems “safe”. It may not seem rational.
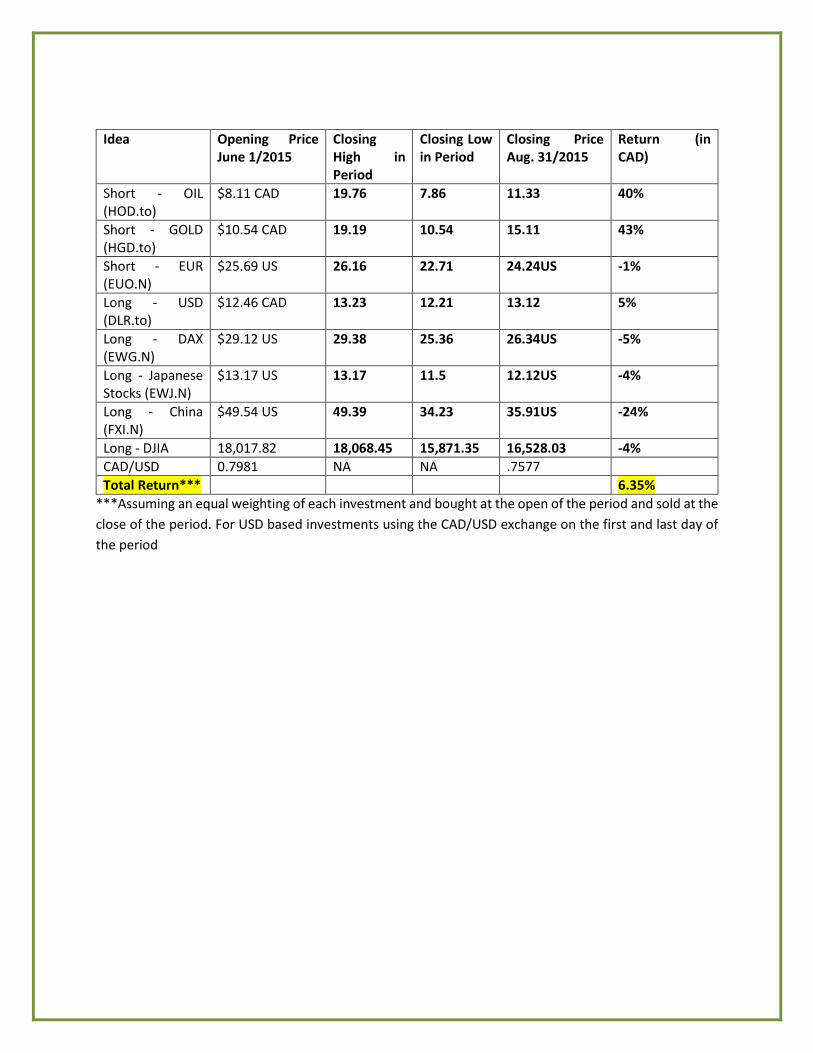
Idea Opening Price June 1/2015
Closing High in Period
Closing Low in Period
Closing Price Aug. 31/2015
Return (in CAD)
Short - OIL (HOD.to)
$8.11 CAD 19.76 7.86 11.33 40%
Short - GOLD (HGD.to)
$10.54 CAD 19.19 10.54 15.11 43%
Short - EUR (EUO.N)
$25.69 US 26.16 22.71 24.24US -1%
Long - USD (DLR.to)
$12.46 CAD 13.23 12.21 13.12 5%
Long - DAX (EWG.N)
$29.12 US 29.38 25.36 26.34US -5%
Long - Japanese Stocks (EWJ.N)
$13.17 US 13.17 11.5 12.12US -4%
Long - China (FXI.N)
$49.54 US 49.39 34.23 35.91US -24%
Long - DJIA 18,017.82 18,068.45 15,871.35 16,528.03 -4%
CAD/USD 0.7981 NA NA .7577
Total Return*** 6.35%
***Assuming an equal weighting of each investment and bought at the open of the period and sold at the
close of the period. For USD based investments using the CAD/USD exchange on the first and last day of
the period

Results
The way I want to do this is we will act as if we closed out each position at the end of the quarter. My
discount broker charges me $9.99/trade so transaction costs should not alter the returns too much. The
reason we close out each quarter is that I never want to be able to claim that “I sold that six weeks ago
before it declined”. Each one of my ideas should be good for at least a quarter and likely longer. Should
the idea still have merit we will re-enter the idea at the beginning of the next quarter. I do not feel like
writing any more frequently than quarterly.
The portfolio returned 6.35% last quarter. If you had hit the highs, you could have returned more, but that
is a fool’s lie. Nobody does that. We are a quarterly hold idea generator. If I were trading this portfolio it
might have been different. There were a few days where HGD would rise with the price of gold, or rise
large on small gold declines, indicating speculative money and that is when the trade would close, but this
is a quarterly portfolio. I do suggest those trading this portfolio to create percentage gain maxes and take
those. Another potential close would have been HOD when oil spiked down to $38 and then the snap
back. That would have protected another day gains. The Canadian Dollar decline really helped the US
positions. The commodity trades worked. The country trades did not. The currency was break even.
Details
We plan on closing the long China which did not perform well. I had thought the bubble had longer to go.
Also exiting the short oil position (see later for a discussion). We will close the long Dollar trade. We will
also close the long Japan, as the flare up between Korea’s, contagion from China may spark further unrest
and uncertainty in Asia and there is no good reason to be long.
The trades we will be entering or re-entering, will be short gold, long DAX, long DJIA and long US Consumer
Discretionary. Please see the charts below for each trade.
New Ideas (in Orange) and Re-entered (in purple) trades:
Idea
Short - GOLD (HGD.to)
Short - EUR (EUO.N)
Long - DAX (EWG.N)
Long - Japanese Stocks (EWJ.N)
Long - DJIA
Long – US Consumer Discretionary (XLY.N)
CAD/USD

1). Short Gold
www.stockcharts.com
The gold chart appears to be making a head and shoulders topping pattern. Until we see sub $1000 and
one gold bug newsletter writer commit suicide and half the TSXV becoming biotech companies gold
cannot bottom. Gold is the effeminate metal, it has emotions and until it cries you cannot buy.

2). Long DAX
www.stockcharts.com
I heard there was a crisis in Europe? Not by this chart. Even with the recent sell off the DAX has stayed in
the channel going back to 2012. Stay long this high quality asset. The world is growing even though the
business news harps on slowdowns. This is being long BMW, MB and Porsche. If you wish it were in the
driveway, it should be in the portfolio. Do you think luxury car sales decline in periods of inequality? Get
long.
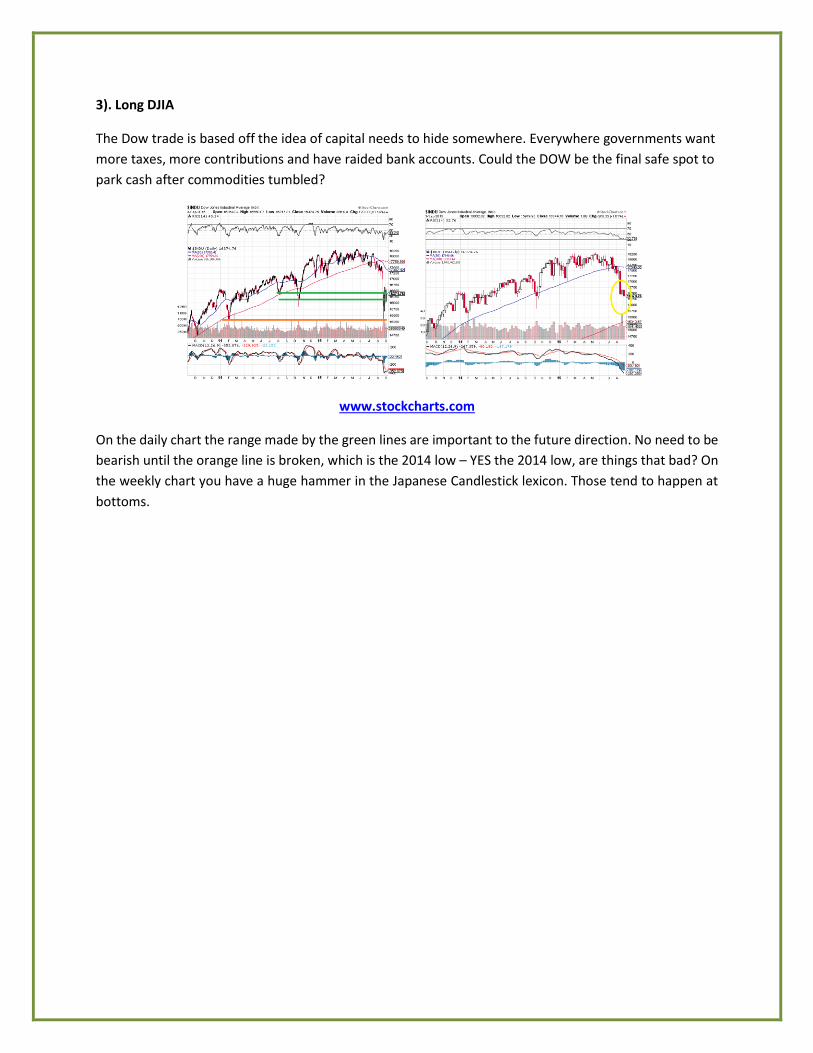
3). Long DJIA
The Dow trade is based off the idea of capital needs to hide somewhere. Everywhere governments want
more taxes, more contributions and have raided bank accounts. Could the DOW be the final safe spot to
park cash after commodities tumbled?
www.stockcharts.com
On the daily chart the range made by the green lines are important to the future direction. No need to be
bearish until the orange line is broken, which is the 2014 low – YES the 2014 low, are things that bad? On
the weekly chart you have a huge hammer in the Japanese Candlestick lexicon. Those tend to happen at
bottoms.
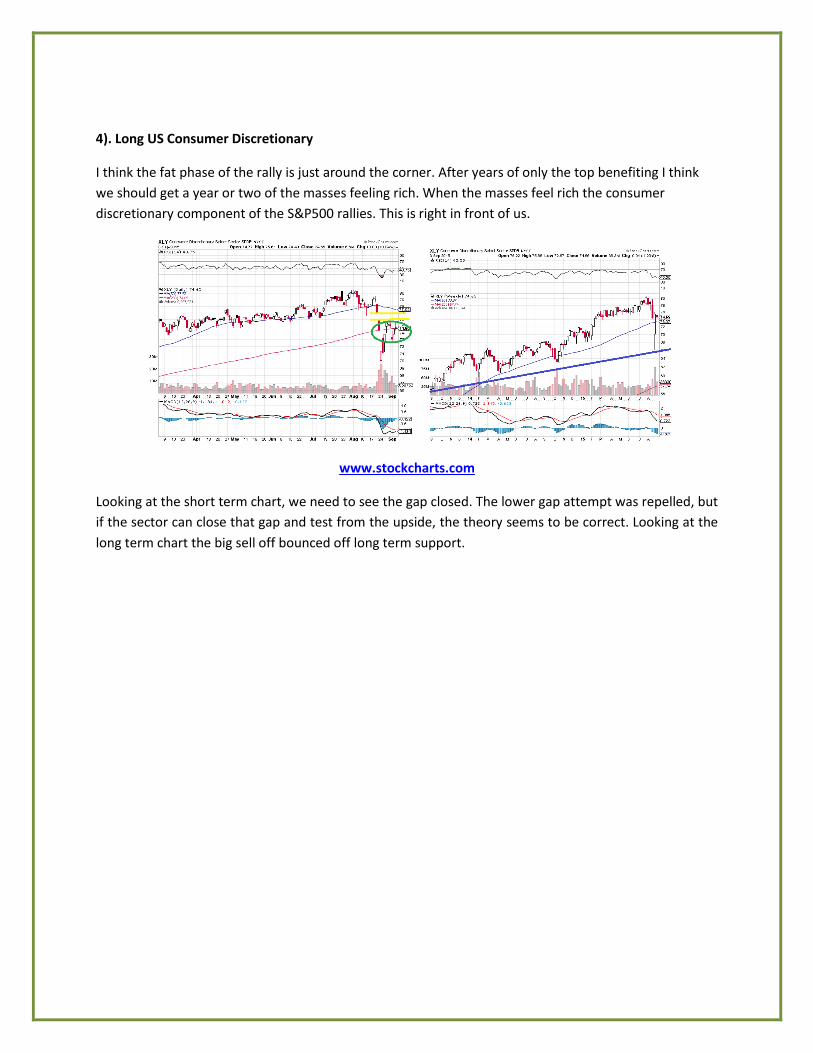
4). Long US Consumer Discretionary
I think the fat phase of the rally is just around the corner. After years of only the top benefiting I think
we should get a year or two of the masses feeling rich. When the masses feel rich the consumer
discretionary component of the S&P500 rallies. This is right in front of us.
www.stockcharts.com
Looking at the short term chart, we need to see the gap closed. The lower gap attempt was repelled, but
if the sector can close that gap and test from the upside, the theory seems to be correct. Looking at the
long term chart the big sell off bounced off long term support.
Economic Discussion
When I first graduated from university it was with a degree in economics. Economics is known as the
dismal science and as I entered the financial industry it was easy to always be bearish on everything. I
entered the financial industry in 2004 and eventually I was correct in 2007, but that is a long time to go
against the trend. When I went back to university I studied geology. To be an exploration geologist one
has to be overly optimistic, otherwise why search for a new deposit? Now I find that my bias leans towards
being positive, yet the economic frame of mind still has me searching for the next top. Looking through
history, stock markets of developed nations spend more time going up than down, so being bearish all
the time, like some commentators, is a waste of mental capital. You might as well enjoy the upside and
try to get out before the downside becomes too severe. Trailing stops, and moving trailing stops as you
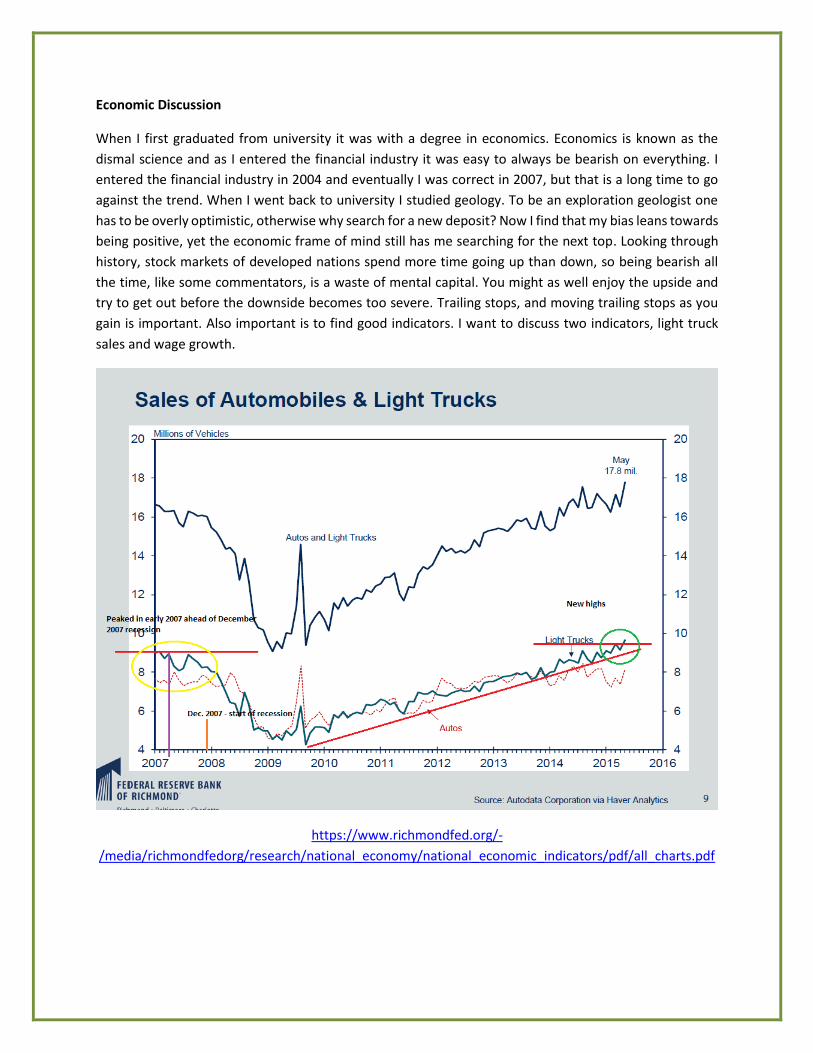
gain is important. Also important is to find good indicators. I want to discuss two indicators, light truck
sales and wage growth.
https://www.richmondfed.org/-
/media/richmondfedorg/research/national_economy/national_economic_indicators/pdf/all_charts.pdf

http://research.stlouisfed.org/fred2/series/ALTSALES
Looking at the two above charts you can see that light truck sales peak before the last three recessions
and bottom near the end of recessions. The reason for this is few people buy pickup trucks for fun. Maybe
in Texas and Alberta people do, but light trucks are bought for work. When work starts to decline or has
peaked, so do truck sales and when the opportunities seem to presenting themselves again people buy a
new truck or expand the fleet. As you can see light truck sales have made new highs. Unless the indicator
is broken this suggests the US economy is not about to contract sharply.
The second indicator is wage growth. We have been overwhelmed with fears of deflation for the past few
years, but finally, wage growth is breaking to new highs. This should be the start of the reflation and soon
suggests we will need to re-evaluate the short gold position and maybe consider a short US bonds
position, but those trends have not broken quite yet.

https://www.richmondfed.org/-
/media/richmondfedorg/research/national_economy/national_economic_indicators/pdf/all_charts.pdf
However there are a number of bearish charts. Let us forget about the volatility, okay that was just a nice
way to say global stock market crash, as the return for the portfolio is based on macro trades and not
stocks.

www.dshort.com
The 3 month moving average of the Empire State Survey is approaching levels where recessions have
begun in the past, however this data series does not have a long existence. A reversal over the next few
months would be a false positive.

https://research.stlouisfed.org/fred2/
US leading indicators have turned down and in the past when they have dropped from around the 2%
level to below 1% a recession has followed. They are currently above 1%. It appears they need to drop
from above 2% to below 1% in a short period and there is nothing significant about those levels on their
own.

https://research.stlouisfed.org/fred2/
Light truck sales were mentioned as a positive indicator above, however, they can also be looked upon as
approaching the area of previous tops.

https://research.stlouisfed.org/fred2/
Oil
Has oil bottomed? Looking at the futures curve versus a previous supply created decline we get a similar
picture. Do I want to call the bottom yet? No, but I am not certain playing this trade from either direction
makes sense at the moment. Long term I am bullish on oil. India added very little to commodity demand
compared to China during the 2000’s, but now it is India’s time. The IMF suggests India may have an
economy larger than China in 2020. Assuming China does not implode to make that easy and stays flat,
we have a little bit of growth coming from India.
India, unlike China, is not a large producer of oil (~1.5MMBBL/d vs ~4.2MMBBL/d) so this this supply
overhang will disappear and with the capex cuts in 2015-2016 we set up for a perfect bull scenario, which
is a new large buyer on the margin and underinvestment.

All data from cmegroup.com
Above is how flat the curve became in 1986 and 1998 when the oil markets had major bottoms. 1986 was
an oversupplied market, like today. The curve looks a little spread but the lines on the y axis are in cents.
If we view what is happening to the current futures curve we can see some intense flattening out. I do not
think it is safe to call bottom until we see a short backwardation. That has not happened, but the curve
has flattened significantly.

www.cmegroup.com
Game Theory – What if Scenario – Just for Fun
I don't think this is a likely scenario but just ponder how quickly things can get out of hand.....
If rates are not raised in September, the next scheduled opportunity is a week before Christmas making that also unlikely. The Fed hates to be a Grinch.
Then the next date would be March of 2016, unless they raise rates on a non-press meeting date, but that may be telegraphed too much. March is starting to get close to the serious part of the election campaign and the Fed traditionally tried to avoid looking political.
Quite possibly Yellen would be against adding further head winds for the first female presidential candidate and one from her party.
In addition, the global economy may have deteriorated enough by then and the dollar too strong, making the Fed want to wait.
Alternatively...
Should they raise rates and push the dollar too high and tip America into a slowdown it plays into the hands of candidate Trump, who will blame career politicians and unelected academics for creating the situation and point out his competitors were all around for both the GFC and this rough patch, "fixing nothing", while increasing the debt and will repeat his mantra of "fixing America" and how an "outsider" is needed and other fear based memes, regardless of their truth. Neither party wants this outcome. It is safe to guess the Fed probably feels the same.

So quite possibly the Fed is trapped.
When markets realize this America accidentally joins the currency war, as the dollar bull is unwound to some degree forcing other nations to devalue and then central banks lose some credibility.
Paul Krugman suggested the way Japan (and other nations) could spark inflation was for central banks to lose credibility or at least threaten to act recklessly and this would be a reckless global policy.
Global currency wars/beggar thy neighbour policies lead to protectionism and as Bastiat mentioned when goods don't cross borders armies do. When global wars break out deflationary headwinds dissipate and debts mount making tight monetary policy unlikely.
I know this is not the most likely scenario and thankfully will most likely not come to fruition but a thought experiment on a simple chain reaction, no less likely than what Ferdinand sparked in Serbia a century ago.
Disclosures:
Investors should carefully consider the investment objectives, risks, charges and expenses of
any investment. The above does not constitute investment advice or recommendations, just
crazy ideas I have when I cannot sleep. There is no guarantee that any investment (or this
investment) will achieve its objectives, goals, generate positive returns, or avoid losses. The
information provided should probably be disregarded and potentially treated as a contrarian
advice, with the expectations that I am 100% wrong on everything. Please consult someone
with a higher level of intelligence than the author with respect to investing money.