market review - 2008 - odu...gsh residential sales corporation joel t. flax goodman & company,...
TRANSCRIPT

Errata:
Page 82: Commercial Versus Residential Heading: 6th line should read: “The commercial real estate industry has….” Page 85: Chart title should read as “US COMMERCIAL PROPERTY SALES”. Page 86: Chart at the top: the purple line (above and to the right of Next 5 Years) should light blue. Page 89: MultiFamily Properties Chart at bottom: Should read “MULTIFAMILY MARKET”. Page 90: 2007 Apartment Sales Chart: 3rd and 4th columns should say Units and $/Unit, respectively.

I N V E S T M E N T • I N D U S T R I A L • O F F I C E • R E S I D E N T I A L • M U L T I - F A M I L YR E T A I L • 2 0 0 8 H A M P TO N R O A D S R E A L E S TAT E M A R K E T R E V I E WI N V E S T M E N T • R E T A I L • I N D U S T R I A L • O F F I C E • R E S I D E N T I A LR E T A I L • I N D U S T R I A L • O F F I C E • R E S I D E N T I A L • M U L T I - F A M I L Y M U L T I - F A M I L Y • R E T A I L • I N D U S T R I A L • O F F I C E • R E S I D E N T I A L
E. V. WILLIAMS CENTER FOR REAL ESTATE
AND ECONOMIC DEVELOPMENT
WWW.ODU.EDU/CREED
ODU-MarketReview2008-FINAL2:ODUMarketReview2005 2/14/08 11:51 AM Page 1

ODU-MarketReview2008-FINAL2:ODUMarketReview2005 2/14/08 11:51 AM Page 2
E. V. Williams Center for Real Estate & Economic
Development
www.odu.edu/creed
Message From The Director
CREED Executive Committee
CREED Advisory Board Members
2008 Hampton Roads Retail Market Survey
2008 Hampton Roads Industrial Market Survey
2008 Hampton Roads Office Market Survey
2008 Hampton Roads Residential Market Survey
2008 Hampton Roads Multi-Family Market Survey
2008 Commercial Real Estate Investment Market Review
ASSOCIATE PUBLISHER
Mike Herron
Inside Business
757.222.3991
SPECIAL PUBLISHINGS MANAGER
Tracy King
GRAPHIC DESIGN
Pico Design & Illustration
www.picodesign.net
757.493.0370
AD DESIGN
Kristie Mathison
DIRECTOR OF SALES
Bill Blake
757.222.3165
ADVERTISING SALES
Robin Simmons
Tracy King
John White
BUSINESS MANAGER
Sylvia Mapp
Inside Business
258 Granby Street
Norfolk, Virginia 23510
757.222.5353
Data for Old Dominion University E.V. Williams Center for Real Estate and Economic Development Market Survey was collected in the fourth quarter — 2007
CONTENTS
5
7
8
11
29
39
57
69
81
ODU-MarketReview2008-FINAL2:ODUMarketReview2005 2/14/08 11:51 AM Page 3

4HAMPTON ROADSReal Estate Market Review 2008
ODU-MarketReview2008-FINAL2:ODUMarketReview2005 2/14/08 11:51 AM Page 4

M E S S A G E F R O M T H E D I R E C T O R
Welcome and thank you for joining us for the 2009 Old Dominion University E. V. Williams Center for RealEstate and Economic Development (CREED) Real Estate Market Review and Forecast. This is our 13th annualmarket report and review and we sincerely appreciate your continued support.
Hampton Roads is officially designated the Virginia Beach – Norfolk – Newport News VA-NC MSA by theOffice of Management and Budget. It encompasses 2,628 square miles, has a population of more than 1.6 millionand a workforce of nearly 800,000. Hampton Roads is the fourth largest MSA in the southeast US, comprisedof 16 cities and counties in Southeastern Virginia and Northeastern North Carolina, and is the largest consumermarket between Washington DC and Atlanta.
According to the Old Dominion University Economic Forecasting Project, our region’s economy will face anumber of challenges in 2008. However, while our economic growth is expected to be lower than that of 2007,the region’s economic growth will be on par with that of the Commonwealth and is even expected to exceednational economic growth. As the enclosed market reviews suggest, the housing market correction felt bymany at the national level, may not be as dramatic for the region’s real estate. The bottom line is that oureconomy continues to expand, which is good news for jobs and good news for the real estate industry.
Tom Dillon of Resource Bank has replaced Joyce Hartman as Chair of the Executive Advisory BoardCommittee. Joyce Hartman has done a wonderful job galvanizing the many committees of the board and suc-cessfully raised the leadership bar of the Advisory Board even higher. Fred Facka, a very involved ODU alum-nus, has replaced Cliff Moore on our Sponsorship Committee. If you are interested in becoming a member,please contact our Membership Chair, Craig Cope of Liberty Property Trust. CREED membership is one of themost cost effective networking organizations you can ever support.
CREED’s web site has received over 33,600 page views. As a reminder, please visit by clicking onwww.odu.edu/creed for the latest information on our region, as well as CREED’s activities, members andresearch. We have a student services section where you can find students who are interested in internships andjob opportunities as well as links to other informative web sites.
There are many people to thank for their contributions to this report and the annual market review. Ourresearch chair, Brian Dundon and his capable committee deserve many thanks for providing all the quality con-trol of our publication. Stephanie Sanker orchestrates the presentation and reception. Of course, a special thankyou to all the volunteers within the real estate and economic development community for providing their expert-ise and sharing their data. None of this is possible without your commitment.
In closing, please note that every effort is made to provide the most accurate information in these reports. If youfind an error or have a suggestion on how to improve upon these reports, please contact me with comments.
Your continued support is truly appreciated.
John R. Lombard, Ph.D.
Associate Professor, Department of Urban Studies and Public Administration
Director, E. V. Williams Center for Real Estate and Economic Development
Old Dominion University
College of Business and Public Administration
Norfolk, VA 23529-0218
Direct line: (757) 683-4809 | Center line: (757) 683-5352
5
ODU-MarketReview2008-FINAL2:ODUMarketReview2005 2/14/08 11:51 AM Page 5

ODU-MarketReview2008-FINAL2:ODUMarketReview2005 2/14/08 11:51 AM Page 6

7
THE 2008 EXECUTIVE COMMITTEE OF THE CREED ADVISORY BOARD
To obtain additional copies of this report, please go to our website: www.odu.edu/creed
Send to:John R. Lombard, Ph.D, Director E. V. Williams Center for Real Estate and Economic DevelopmentOld Dominion University2089 Constant HallNorfolk, VA 23529
The purpose of the Advisory Board is to provide professional expertise in various aspects of real estate and economic
development to make recommendations to the University concerning policy and operations of the CREED as well
as the University's real estate curriculum.
The 2008 officers and members of the Board are as follows:
Executive CommitteeChair .............................................................. Tom DillonExecutive Director ...................................... John LombardVice Chair ..................................................... Brad SanfordProgram Chair............................................. Stephanie SankerResearch Chair ........................................... Brian DundonMembership Chair ..................................... Craig CopeCurriculum Co-Chairs............................... Jon Crunkleton
..................................................................... Brad SanfordSponsorship Chair..................................... Cliff Moore
..................................................................... Fred FackaBy-Laws Chair............................................. Andrew KeeneyPast Chair..................................................... Joyce HartmanAt-Large......................................................... Jonathan Guion
..................................................................... Billy King
..................................................................... Aubrey Layne
Market Review Committee Industrial ........................................................... Billy King
........................................................................ Stephanie SankerOffice................................................................. Don CriggerRetail.................................................................. David MachupaMulti-family ....................................................... Charles Dalton/RealDataResidential ....................................................... Van RoseInvestment........................................................ Stephanie Sanker
Research/Editorial CommitteeBrian DundonBeth HancockJoy LearnSandi PrestridgeMaureen RooksBrad SanfordLane SheaKristi Sutphin
Telephone: E-Mail:(757) 683-4809 [email protected]
ODU-MarketReview2008-FINAL2:ODUMarketReview2005 2/14/08 11:51 AM Page 7
J. Scott AdamsCB Richard Ellis
Tom AthertonMid Eastern Builders, Inc.
Jerry BanaganOffice of Real Estate Assessor
Nancy S. BrookesGlobal Tower Partners
Stewart H. Buckle, IIIThe Morgan Real Estate Group
Rick E. BurnellAtlantic Commercial Real EstateServices, Inc.
M. Albert CarmichaelHarvey Lindsay Commercial Real Estate
Lawrence J. Colorito, Jr., MAIAxial Advisory Group, LLC
Jeff CooperCooper Realty, Inc.
Craig A. CopeLiberty Property Trust
Ann K. CrenshawKaufman & Canoles
Don Crigger, CCIMGVA Advantis Real Estate Services Co.
Jon R. CrunkletonOld Dominion University
Kim S. CurtisSouthern Trust Mortgage Company
Cecil V. CutchinsOlympia Development Corporation
William G. DardenHearndon Construction
George C. DavisWest Neck Community Association
Laura B. de GraafCommercial Real Estate Banking, Bank of America
Robert L. DeweyWilcox & Savage, P.C.
Tom M. DillonResource Bank
Michael DivarisDivaris Real Estate, Inc.
Helen DragasThe Dragas Companies
Brian DundonDundon & Associates
Frederick D. FackaSmith Barney
Sandra W. FerebeeGSH Residential Sales Corporation
Joel T. FlaxGoodman & Company, LLP
Howard E. GordonWilliams Mullen Hofheimer Nusbaum, P.C.
Dennis W. GruelleAppraisal Consultation Group
Jonathan S. Guion, SIORSperry Van Ness
Elizabeth HancockOffice of the Real Estate Assessor
Russell G. Hanson, Jr.Atlantic Mortgage & Investment Co.
Carl HardeeLawson Realty Corporation
Warren D. HarrisVirginia Beach Economic Development
John C. HarryJohn C. Harry, Inc.
Joyce HartmanSouthside Building Services
Dorcas T. Helfant-BrowningDTH Properties, LLC
Virginia P. Henderson, MAICommercial First Appraisers, LLC
Cherie JamesWall, Einhorn, & Chernitzer
Terry JohnsonAbbitt Realty
Maria KattmannCity of Suffolk
E. Andrew KeeneyKaufman & Canoles
R. I. King, IIThalhimer/Cushman & Wakefield
William E. King, SIORHarvey Lindsay
April KoleszarKoleszar Properties, Inc.
Barry M. KornblauSummit Realty Group, Inc.
Aubrey L. Layne, Jr.Great Atlantic Management, LLC
Tyler H. LeinbachMeredith Construction Co., Inc.
John R. Lewis, IIECS Mid-Atlantic, LLC
8HAMPTON ROADSReal Estate Market Review 2008
C R E E D A D V I S O R Y B O A R D M E M B E R S
ODU-MarketReview2008-FINAL2:ODUMarketReview2005 2/14/08 11:51 AM Page 8

Harvey L. Lindsay, Jr.Harvey Lindsay
Susan Long-MolnarManaging CommunicationsConsulting
Mike MaustellerAdvantis Real Estate Services Co.
Michael W. McCabeHarvey Lindsay
Michael D. McOsker, CCIMThalhimer/Cushman & Wakefield
Michael A. NiceGeorge Nice & Sons, Inc.
Thomas A. O'GradyCity of Suffolk, EconomicDevelopment
James N. Owens, CCIMHarvey Lindsay Commercial RealEstate
Robert L. Phillips, Jr.Thalhimer/Cushman & Wakefield
Victor L. PickettGrandbridge Real Estate Capital LLC
Sandra PrestridgeCity of Norfolk, EconomicDevelopment
Chris ReadCB Richard Ellis
F. Craig ReadRead Commerical
John C. Richards, Jr.CB Richard Ellis/Melody & Co.
Thomas E. RobinsonRobinson Development Group
Maureen G. RooksThalhimer/Cushman & Wakefield
Jim V. RoseRose & Womble Realty Co.,LLC
Robert J. RuhlCity of Va Beach, EconomicDevelopment
Bradley R. Sanford, MAIDominion Realty Advisors, Inc.
Stephanie SankerGVA Advantis
Paula J. ShendowFirst American Title InsuranceCompany
Ted M. ShermanContinental Properties Corp.
Kenneth Sisk, P.E.The Vision Group
Anthony W. SmithRobinson Development Group
Robert M. StantonStanton Partners, Inc.
Jeremy R. StarkeyMonarch Capital LLC
Deborah StearnsGVA Advantis
Daniel R. StegallDaniel Richard Stegall, A Professional Law Corporation
Kristine R. SutphinCity of Portsmouth Dept. of Econ. Dev.
Leo SuttonHistoric Ventures, LLC
Michael SykesBank of America - Real EstateBanking Group
Robert M. Thornton, CRE, CCIM, SIORThalhimer/Cushman & Wakefield
Richard B. ThurmondWilliam E. Wood & Associates
Stewart Tyler, ASARight of Way Acquisitions andAppraisals, Inc.
George D. Vick, IIIHarvey Lindsay
Edward W. WareNorfolk Redevelopment and Housing Authority
H. Mac Weaver, IIWells Fargo Real Estate Group
Edward M. WilliamsWilliam E. Wood & Associates
Julia L. WilsonG. L. Wilson Building Co.
F. Blair WimbushNorfolk Southern Corporation
Peter E. Winters, Jr.SunTrust Bank
Roderick S. WoolardCity of Norfolk, EconomicDevelopment
9
ODU-MarketReview2008-FINAL2:ODUMarketReview2005 2/14/08 11:51 AM Page 9

ODU-MarketReview2008-FINAL2:ODUMarketReview2005 2/14/08 11:51 AM Page 10

11
AuthorDavid MachupaThalhimer/Cushman & Wakefield
Data Analysis/LayoutDavid ChapmanOld Dominion University
Financial SupportThe E. V. Williams Center for Real Estate for RealEstate and Economic Development (CREED) functionsand reports are funded by donations from individuals, organizations and the CREED Advisory Board.
Disclosure The data used for this report was provided by agentsand owners of the surveyed properties. The data isdeemed reliable; however, neither Old DominionUniversity, the E. V. Williams Center for Real Estate forReal Estate and Economic Development, nor Thalhimer/Cushman & Wakefield makes any representation orwarranty as to its accuracy.
Acknowledgements
2 0 0 8 H A M P TO N R O A D S R E A L E S TAT E M A R K E T R E V I E W
R E T A I L
ODU-MarketReview2008-FINAL2:ODUMarketReview2005 2/14/08 11:51 AM Page 11

12
2 0 0 8 R E TA I L
HAMPTON ROADSReal Estate Market Review 2008
This survey gathered information about strip shopping centers and regional malls located inthe MSA that were generally 30,000 square feet in size or larger. Additionally, information onretail-oriented freestanding buildings at least 23,000 square feet and freestanding buildings thatcontained furniture stores, discounters, grocery stores or category killer retailers that met theestablished size criteria were included in the survey. Automotive uses and buildings containing“downtown storefronts” were not included. Although available retail space in many submarkets(e.g., Ghent) is best described as a collection of small specialty shops, storefronts or freestandingbuildings, practical limitations dictated that the focus of the survey be on larger product types.
The survey data was collected between October 2007 and January 2008. Questionnaires weremailed to owners, leasing agents and property managers responsible for retail properties meet-ing the selection criteria. Direct contact was utilized as a follow-up to the mailing to encourageparticipation. Information on square footage for freestanding buildings was obtained from build-ing owners, tax records, store managers and retail real estate representatives. Sales informationwas obtained from property owners, real estate agents, appraisers, and real estate assessors.
his report analyzes the 2007 retail real estate conditions
within the Virginia Beach– Norfolk–Newport News,
Virginia Metropolitan Statistical Area (the “MSA”),
which is commonly known as Hampton Roads. It provides sup-
ply, vacancy, construction, absorption and rent data for the MSA
to provide a comparison of the data for Southside and Peninsula
areas of Hampton Roads for specific submarkets and product
types. The survey includes properties from the Southside of Hampton Roads located in the cities
of Chesapeake, Norfolk, Portsmouth, Smithfield, Suffolk and Virginia Beach. Properties are also
included from the Peninsula of Hampton Roads in Gloucester, Hampton, Newport News,
Poquoson, Williamsburg and York County.
This survey is believed to be the most comprehensive analysis of retail real estate trends in the
MSA. The report includes information on all retail product types including regional malls, free-
standing buildings and strip centers of various classifications. The scope of the report also
includes a summary of new retail construction, an analysis of absorption, and a review of retail
investment sales that have occurred in the region.
METHODOLOGY
Real Estate Market Review 2008
General Overview
T
ODU-MarketReview2008-FINAL2:ODUMarketReview2005 2/14/08 11:51 AM Page 12
13
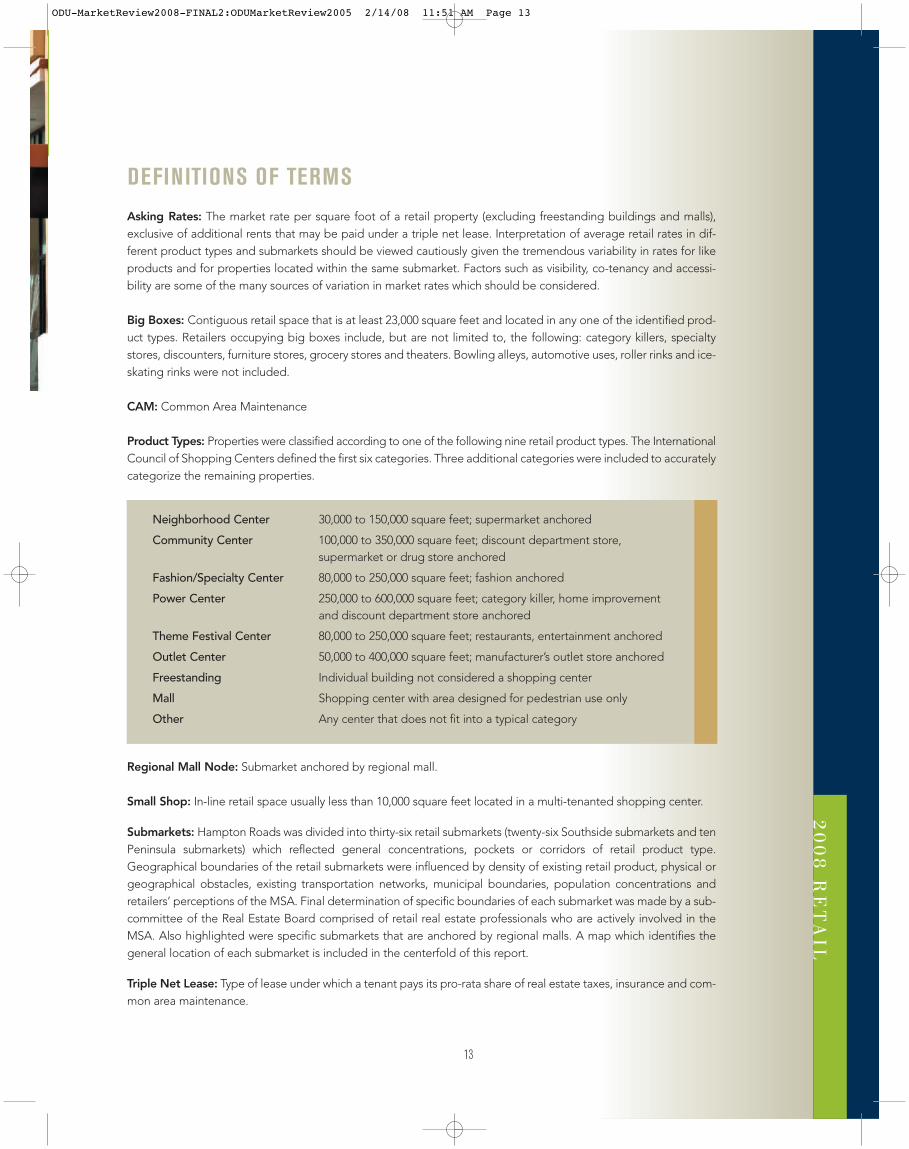
Asking Rates: The market rate per square foot of a retail property (excluding freestanding buildings and malls),exclusive of additional rents that may be paid under a triple net lease. Interpretation of average retail rates in dif-ferent product types and submarkets should be viewed cautiously given the tremendous variability in rates for likeproducts and for properties located within the same submarket. Factors such as visibility, co-tenancy and accessi-bility are some of the many sources of variation in market rates which should be considered.
Big Boxes: Contiguous retail space that is at least 23,000 square feet and located in any one of the identified prod-uct types. Retailers occupying big boxes include, but are not limited to, the following: category killers, specialtystores, discounters, furniture stores, grocery stores and theaters. Bowling alleys, automotive uses, roller rinks and ice-skating rinks were not included.
CAM: Common Area Maintenance
Product Types: Properties were classified according to one of the following nine retail product types. The InternationalCouncil of Shopping Centers defined the first six categories. Three additional categories were included to accuratelycategorize the remaining properties.
Neighborhood Center 30,000 to 150,000 square feet; supermarket anchored
Community Center 100,000 to 350,000 square feet; discount department store, supermarket or drug store anchored
Fashion/Specialty Center 80,000 to 250,000 square feet; fashion anchored
Power Center 250,000 to 600,000 square feet; category killer, home improvement and discount department store anchored
Theme Festival Center 80,000 to 250,000 square feet; restaurants, entertainment anchored
Outlet Center 50,000 to 400,000 square feet; manufacturer’s outlet store anchored
Freestanding Individual building not considered a shopping center
Mall Shopping center with area designed for pedestrian use only
Other Any center that does not fit into a typical category
Regional Mall Node: Submarket anchored by regional mall.
Small Shop: In-line retail space usually less than 10,000 square feet located in a multi-tenanted shopping center.
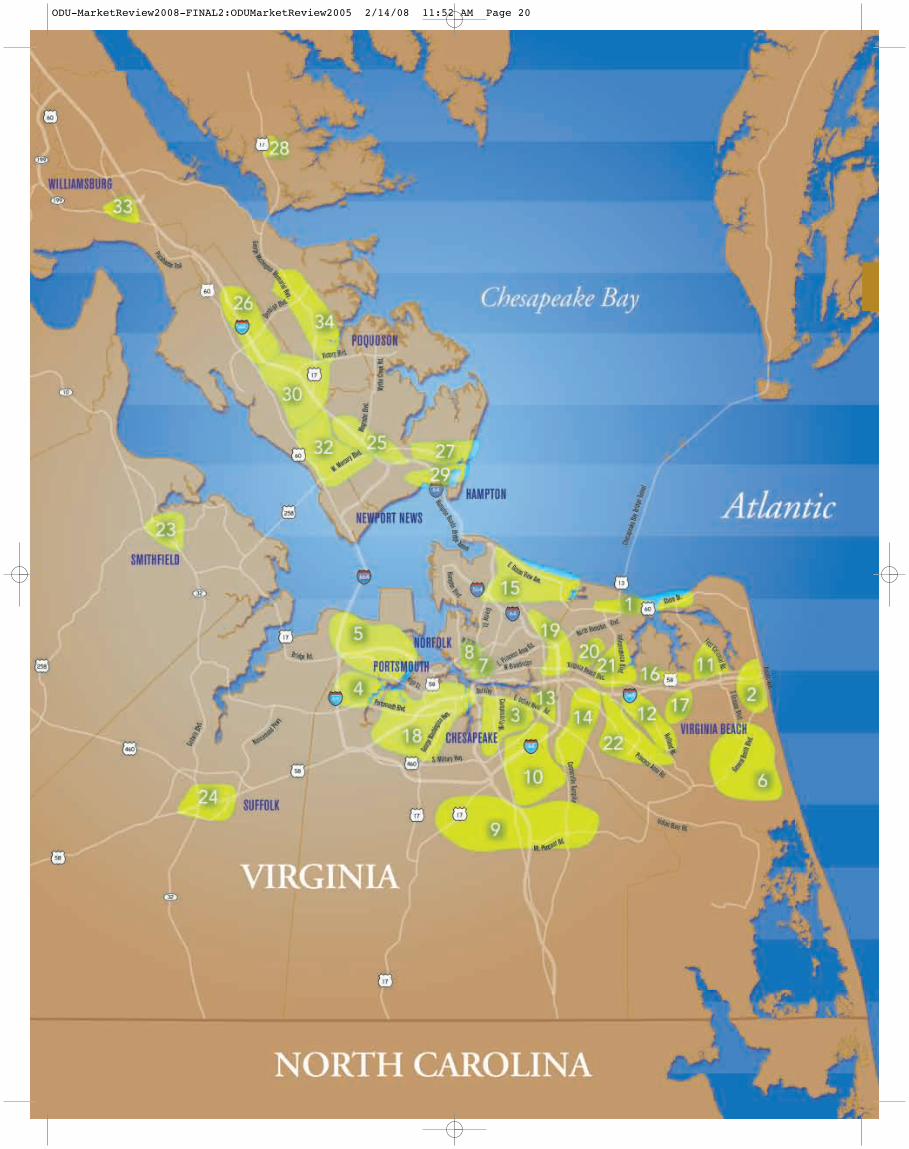
Submarkets: Hampton Roads was divided into thirty-six retail submarkets (twenty-six Southside submarkets and tenPeninsula submarkets) which reflected general concentrations, pockets or corridors of retail product type.Geographical boundaries of the retail submarkets were influenced by density of existing retail product, physical orgeographical obstacles, existing transportation networks, municipal boundaries, population concentrations andretailers’ perceptions of the MSA. Final determination of specific boundaries of each submarket was made by a sub-committee of the Real Estate Board comprised of retail real estate professionals who are actively involved in theMSA. Also highlighted were specific submarkets that are anchored by regional malls. A map which identifies thegeneral location of each submarket is included in the centerfold of this report.
Triple Net Lease: Type of lease under which a tenant pays its pro-rata share of real estate taxes, insurance and com-mon area maintenance.
DEFINITIONS OF TERMS
20
08
RE
TA
IL
ODU-MarketReview2008-FINAL2:ODUMarketReview2005 2/14/08 11:51 AM Page 13

14
During 2006, vacancy rates hit the lowest levels since the inception of the CREED market sur-vey while small shop rental rates reached the highest levels in the market. In 2007, theHampton Roads retail market reached another milestone: for the first time in CREED historythe retail market surpassed 50 million square feet of product all the while witnessing stronggrowth, a slight increase in the vacancy rates and increase in the average rental rate. Newand existing retailers searched for locations within established markets and followed the res-idential growth pattern creating hotbeds of activity in submarkets such as Northern Suffolk,Williamsburg and Southern Chesapeake.
Several large retail development projects opened in 2007, including Landstown Commons inVirginia Beach, The Marquis in Williamsburg, Bennett’s Creek in Suffolk, and CahoonCommons in Chesapeake.
Mixed use projects consisting of retail, office and residential continueto attract Tenants. The Virginia Beach Town Center saw the WestinHotel and the Sandler Center for the Performing Arts open in late2007 as well as retailers Johnston & Murphy and McCormick andSchmick. The City Center at Oyster Point in Newport News addedBanana Republic; The Towne Place in Greenbrier opened with Chicosand Jos A. Banks; Settlers Market in Williamsburg began clearing thesite and thus far is anchored by Trader Joes, Books A Million, Michaelsand Home Goods. All that remains of Coliseum Mall is Macy’s. Thesite has been scrapped and a new J C Penny’s has been built and willbe joined by Target and other retailers. These new retailers and thenew residential units will reemerge as The Peninsula Towne Center.
Grocery Stores continued to expand in Hampton Roads. Farm Fresh opened a new gour-met concept in downtown Norfolk called the Marketplace at Harbor Heights, as well as a tra-ditional store at Bennett’s Creek in Suffolk. Food Lion converted 8 stores to its higher endBloom concept and 10 stores to the value focused Bottom Dollar and continue to look foropportunities to grow all three banners. In Portsmouth, Food Lion relocated from TriangleShopping Center to a larger unit at Williams Court and is in the process of doing the samewith Airline Center. Wal-Mart has entered Hampton Roads with its Neighborhood Marketconcept and is under construction with its first store in Norfolk. Harris Teeter anchored thenew Indian Lakes Crossing and will also anchor the planned developments of BrennamanFarms in Virginia Beach and Harbourview Marketplace in Suffolk. Trader Joes has signed alease at Settlers Market in Williamsburg and Farm Fresh is opening the Marketplace concepton High Street in Williamsburg. Additional higher end grocers continue to explore theHampton Roads market for opportunities.
The Big Boxes continued expansion in Hampton Roads. Target led the way at Red MillWalk in Virginia Beach. Lowes purchased the former Giant Square shopping center and willblade the site for a new freestanding unit. Kohl’s opened in Landstown Commons inVirginia Beach and is under construction in Harborview East in Suffolk. Best Buy also
2 0 0 8 R E TA I L
YEAR IN REVIEW
HAMPTON ROADSReal Estate Market Review 2008
In 2007, the Hampton Roads retail market reached
another milestone: for the first time in CREED history the
retail market surpassed 50 million square feet of product
all the while witnessing strong growth, a slight increase in
the vacancy rates and increase in the average rental rate.
ODU-MarketReview2008-FINAL2:ODUMarketReview2005 2/14/08 11:51 AM Page 14

15
20
08
RE
TA
IL
The Hampton Roads retail market contained approximately 50,219,239 square feet of gross leasable area (“GLA”)in 396 properties. The US Census Bureau indicates the population of Hampton Roads is approximately 1.7 Millionresulting in a 29.5 square feet of retail supply per person. Certain methodological differences (e.g., the inclusionof freestanding buildings and malls in this survey) make it difficult to compare per capita supply in the MSA to anational average statistic.
Hampton Roads consists of two markets, the Southside and Peninsula. The Southside market has approximately33,086,160 square feet, roughly 66% of the total square footage in the market, in 263 properties. The average ask-ing rent for small shop space increased by $.58 over 2006 to $16.68 triple net. In 2007, there was an increase in thevacancy rate by .91% to 6.70% as new construction added 1,038,291 square feet to the Southside market.
The Peninsula also experienced some exciting changes this past year. The 133 properties on the Peninsula thatwere surveyed combined for 17,133,079 square feet of product. The average asking price of small shop spaceincreased $.24 to $15.41 per square foot triple net. The vacancy rate also slightly increased by .68% to 9.44 % with1,009,000 square feet of new construction added to the Peninsula market.
Overall both markets performed well. The average rental rate for small shop space in Hampton Roads hasincreased to $16.05 triple net. While the market saw an increase in the overall vacancy rate, some of that can beattributed to the new projects that came on line in the 4th quarter rather than excessive turnover of small shop ten-ants as anchor tenants continue to look for opportunities in the market.
HAMPTON ROADS MARKET SURVEY
opened at Landstown and signed a lease at Marquis in Williamsburg. J C Penny opened at the PeninsulaTowne Center, Circuit City rolled out a new prototype at Janaf in Norfolk with their former location being backfilled by Petco. Bed, Bath and Beyond opened at Landstown and is under construction at Harborview East.Gold’s Gym opened in the Ghent section of Norfolk and Barnes and Noble opened a multi-level location with-in MacArthur Center.
ODU-MarketReview2008-FINAL2:ODUMarketReview2005 2/14/08 11:51 AM Page 15

MARKET OVERVIEW
16
NEWNUMBER OF CONSTRUCTION OCCUPIED ABSORPTIONPROPERTIES GLA IN SF VACANT SF % VACANT IN SF IN SF IN SF
2008Southside 263 33,086,160 2,215,479 6.70% 1,038,291 30,870,681 339,596
Peninsula 133 17,133,079 1,617,705 9.44% 1,009,000 15,515,374 100,485
Total 396 50,219,239 3,833,184 7.63% 2,047,291 46,386,055 440,081
2007Southside 259 32,407,761 1,876,676 5.79% 1,552,392 30,531,085 1,741,962
Peninsula 131 16,895,155 1,480,266 8.76% 1,042,451 15,414,889 576,788
Total 390 49,302,916 3,356,942 6.81% 2,594,843 45,945,974 2,318,750
2006Southside 246 30,852,210 2,063,087 6.69% 593,520 28,789,123 1,280,869
Peninsula 129 16,337,458 1,499,357 9.18% 618,179 14,838,101 687,097
Total 375 47,189,668 3,562,444 7.55% 1,211,699 43,627,224 1,967,966
2005Southside 243 30,184,395 2,676,141 8.87% 271,610 27,508,254 341,736
Peninsula 125 15,799,778 1,648,774 10.44% 185,000 14,151,004 496,338
Total 368 45,984,173 4,324,915 9.41% 456,610 41,659,258 838,074
2004Southside 243 30,336,266 3,169,748 10.45% 419,458 27,166,518 419,138
Peninsula 127 16,094,161 2,027,477 12.60% 330,000 14,066,684 412,018
Total 370 46,430,427 5,197,225 11.19% 749,458 41,233,202 831,156
2003Southside 245 30,180,691 3,433,311 11.38% 574,400 26,747,380 535,167
Peninsula 126 15,546,085 1,891,419 12.17% 676,000 13,654,666 932,008
Total 371 45,726,776 5,324,730 11.64% 1,250,400 40,402,046 1,467,175
2002Southside 239 29,760,443 3,548,230 11.92% 828,800 26,212,213 1,185,818
Peninsula 123 14,906,530 2,183,872 14.65% 202,750 12,722,658 242,563
Total 362 44,666,973 5,732,102 12.83% 1,031,550 38,934,871 1,428,381
2001Southside 230 29,436,515 3,760,087 12.77% 918,100 25,676,428 (158,181)
Peninsula 121 14,477,970 1,997,875 13.80% 212,229 12,480,095 147,115
Total 351 43,914,485 5,757,962 13.11% 1,130,329 38,156,523 (11,066)
2000Southside 220 28,816,383 2,933,294 10.18% 2,064,727 25,883,089 1,344,209
Peninsula 118 15,249,617 2,012,637 13.20% 758,370 13,236,980 292,785
Total 338 44,066,000 4,945,931 11.22% 2,823,097 39,120,069 1,636,994
1999Southside 208 27,089,939 2,551,059 9.42% 1,414,805 24,538,880 1,961,927
Peninsula 112 14,548,482 1,604,287 11.03% 1,253,342 12,944,195 1,592,805
Total 320 41,638,421 4,155,346 9.98% 2,668,147 37,483,075 3,554,732
1998Southside 195 25,463,588 2,886,635 11.34% No Data 22,576,953 No Data
Peninsula 102 12,952,845 1,601,455 12.36% No Data 11,351,390 No Data
Total 297 38,416,433 4,488,090 11.68% No Data 33,928,343 No Data
HAMPTON ROADSReal Estate Market Review 2008
2 0 0 8 R E TA I L
ODU-MarketReview2008-FINAL2:ODUMarketReview2005 2/14/08 11:51 AM Page 16

17
SOUTHSIDE BY SUBMARKET
20
08
RE
TA
IL
SOUTHSIDE SUBMARKETS
There were 26 retail submarkets on the Southside this year. The average size of the submarkets was 1,272,544square feet. The largest Southside markets were Greenbrier and Military Highway with combined square footageof 7,462,699 square feet. The Southside has six regional mall nodes totaling 15,424,221 square feet.
The range of vacancy rates in the Southside submarkets can be seen in the table below. New construction on theSouthside totaled 1,038,291 square feet.
RETAIL SUBMARKETS
AVERAGE NUMBER OF SMALL SHOPPROPERTIES GLA IN SF VACANT SF % VACANT RATE PSF
Bay Front 4 213,821 15,404 7.20% $18.33
Birdneck/Oceanfront 4 191,655 886 0.46% $11.50
Campostella 6 332,904 78,400 23.55% $13.56
Chesapeake Square 9 2,137,552 103,178 4.83% $15.67
Churchland-Portsmouth/Harborview 14 1,034,680 86,996 8.41% $13.92
Dam Neck 8 1,367,212 263,460 19.27% $21.63
Downtown 3 1,281,338 35,375 2.76% $13.75
Ghent 9 406,857 79,609 19.57% $16.79
Great Bridge 18 1,355,948 94,811 6.99% $17.69
Greenbrier/Battlefield Boulevard 23 4,140,568 122,398 2.96% $20.00
Hilltop/Great Neck 12 1,534,848 9,544 0.62% $21.36
Holland/Green Run 9 1,027,904 28,758 2.80% $14.69
Indian River/College Park (Including Chesapeake) 4 482,309 50,425 10.45% $13.25
Kempsville 11 1,183,576 33,757 2.85% $16.80
Little Creek Road /Wards Corner/Ocean View 18 1,903,974 225,268 11.83% $14.27
Little Neck 10 1,375,957 134,,500 9.78% $17.57
Lynnhaven Road 1 12,692 2362 18.61% $12.00
Lynnhaven Road (Virginia Beach Boulevard To Holland Road) 7 1,807,532 153,460 8.49% $21.50
Middle Portsmouth 14 1,549,231 67,634 4.37% $14.14
Military Highway/Janaf 16 3,322,131 102,324 3.08% $14.49
Newtown 9 480,420 79,624 16.57% $13.00
ODU 1 36,500 1,255 3.44% $22.00
Pembroke 24 2,735,100 256,755 9.39% $16.92
Princess Anne Road (From Kempsville Road To Holland Road) 13 1,876,539 117,381 6.26% $18.41
Smithfield 4 256,764 6,550 2.55% $15.67
Suffolk 12 1,038,148 65,365 6.30% $17.56
Total 263 33,086,160 2,215,479 6.70% $16.68
ODU-MarketReview2008-FINAL2:ODUMarketReview2005 2/14/08 11:52 AM Page 17

18
2 0 0 8 R E TA I L
HAMPTON ROADSReal Estate Market Review 2008
PENINSULA SUBMARKETS
There were 10 retail submarkets on Peninsula with an average size of 1,713,307 square feet. The two largest Peninsula submarketsare now Patrick Henry and Williamsburg. While the Patrick Henry submarket is anchored by a regional mall, Williamsburg has noregional mall and we are seeing a variety of mixed use projects in this submarket.
The Peninsula welcomed 1,009,000 square feet of new construction in 2007. Vacancy rates fluctuated in the various submarketswhile overall average rental rates rose on the Peninsula.
PENINSULA BY SUBMARKET
AVERAGE NUMBER OF SMALL SHOPPROPERTIES GLA IN SF VACANT SF % VACANT RATE PSF
Coliseum Central 14 2,510,870 195,854 7.80% $16.75
Denbigh 14 1,458,959 279,889 19.18% $13.83
Foxhill/Buckroe/East Mercury 7 717,555 43,093 6.01% $13.80
Gloucester 9 1,069,924 253,921 23.73% $13.50
Hampton Misc 2 118,972 19,470 16.37% $10.75
Newmarket/Main 13 1,408,292 215,287 15.29% $10.37
Patrick Henry/Oyster Point/Kiln Creek 32 4,464,102 143,805 3.22% $17.81
Poquoson 2 108,521 12,150 11.20% $15.00
Williamsburg 30 4,386,657 405,004 9.23% $19.18
York County 10 889,227 49,232 5.54% $13.28
Total 133 17,133,079 1,617,705 9.44% $15.41
SOUTHSIDE SUBMARKETS
The Neighborhood Center remains the predominant product type with 148 properties with over 11 million square feet of GLA. TheCommunity centers comprised over 10 million square feet with both product types showing increases in the average rental rate. Thehighest rents in non-mall properties were achieved in the Fashion / Specialty centers which also had the highest CAM Charges.
RETAIL PRODUCT TYPE
ODU-MarketReview2008-FINAL2:ODUMarketReview2005 2/14/08 11:52 AM Page 18

19
20
08
RE
TA
IL
TOTAL RETAIL PRODUCT BY TYPE
NEW AVERAGENUMBER OF CONSTRUCTION SMALL SHOP AVERAGE PROPERTIES GLA IN SF IN SF VACANT SF % VACANT RATE PSF CAM PSF
Neighborhood Center 148 11,337,741 102,280 949,339 8.37% $15.25 $2.32
Community Center 56 10,077,659 240,000 1,255,415 12.46% $16.41 $2.26
Fashion/Specialty Center 10 1,351,972 123,318 79,724 5.90% $23.38 $3.93
Power Center 29 10,385,808 1,581,693 821,749 7.91% $21.65 $2.89
Theme Festival Center 1 100,000 0 0 0.00% No data No data
Outlet Center 1 349,927 0 0 0.00% No data No data
Other 65 2,393,390 0 181,945 7.60% $16.04 $2.70
Freestanding 77 7,839,745 0 290,237 3.70% $7.63 $1.69
Mall 9 6,382,997 0 254,775 3.99% $15.00 No data
Total 396 50,219,239 2,047,291 3,833,184 7.63% $16.27 $2.47
SOUTHSIDE BY TYPE
NEW AVERAGENUMBER OF CONSTRUCTION SMALL SHOP AVERAGE PROPERTIES GLA IN SF IN SF VACANT SF % VACANT RATE PSF CAM PSF
Neighborhood Center 103 8,008,694 102,280 624,031 7.79% $15.56 $2.41
Community Center 37 6,316,996 240,000 756,955 11.98% $16.40 $2.33
Fashion/Specialty Center 8 952,121 123,318 38,484 4.04% $23.38 $3.93
Power Center 19 6,083,625 572,693 307,817 5.06% $22.23 $3.14
Theme Festival Center 1 100,000 0 0 0.00% No data No data
Other 44 1,534,306 0 91,417 5.96% $16.54 $2.85
Freestanding 44 4,531,421 0 145,000 3.20% $6.00 $2.50
Mall 7 5,558,997 0 251,775 4.53% $15.00 No data
Total 263 33,086,160 1,038,291 2,215,479 6.70% $16.68 $2.61
PENINSULA BY TYPE
NEW AVERAGENUMBER OF CONSTRUCTION SMALL SHOP AVERAGE PROPERTIES GLA IN SF IN SF VACANT SF % VACANT RATE PSF CAM PSF
Neighborhood Center 45 3,329,047 0 325,308 9.77% $14.55 $2.11
Community Center 19 3,760,663 0 498,460 13.25% $16.42 $2.12
Fashion/Specialty Center 2 399,851 0 41,240 10.31% No data No data
Power Center 10 4,302,183 1,009,000 513,932 11.95% $20.67 $2.49
Outlet Center 1 349,927 0 0 0.00% No data No data
Other 21 859,084 0 90,528 10.54% $15.10 $2.41
Freestanding 33 3,308,324 0 145,237 4.39% $8.17 $1.42
Mall 2 824,000 0 3,000 0.36% No data No data
Total 133 17,133,079 1,009,000 1,617,705 9.44% $15.41 $2.19
ODU-MarketReview2008-FINAL2:ODUMarketReview2005 2/14/08 11:52 AM Page 19
ODU-MarketReview2008-FINAL2:ODUMarketReview2005 2/14/08 11:52 AM Page 20

21
Southside
1 Bayfront
2 Birdneck/Oceanfront
3 Campostella
4 Chesapeake Square
5 Churchland/Harbourview
6 Dam Neck
7 Downtown Norfolk
8 Ghent
9 Great Bridge
10 Greenbrier/Battlefield Boulevard
11 Hilltop/Great Neck
12 Holland/Green Run
13 Indian River/College Park
14 Kempsville
15 Little Creek Road/Wards Corner
16 Little Neck
17 Lynnhaven
18 Middle Portsmouth
19 Military Highway/Janaf
20 Newtown
21 Pembroke
22 Princess Anne
23 Smithfield
24 Suffolk
Peninsula
25 Coliseum Central
26 Denbigh
27 Foxhill/Buckroe
28 Gloucester
29 Hampton Miscellaneous
30 Patrick Henry
31 Poquoson
32 Newmarket/Main
33 Williamsburg
34 York County
RETAIL SUBMARKETS
20
08
RE
TA
IL
ODU-MarketReview2008-FINAL2:ODUMarketReview2005 2/14/08 11:52 AM Page 21
VACANCY BY SUBMARKET
BIG BOX VACANCY
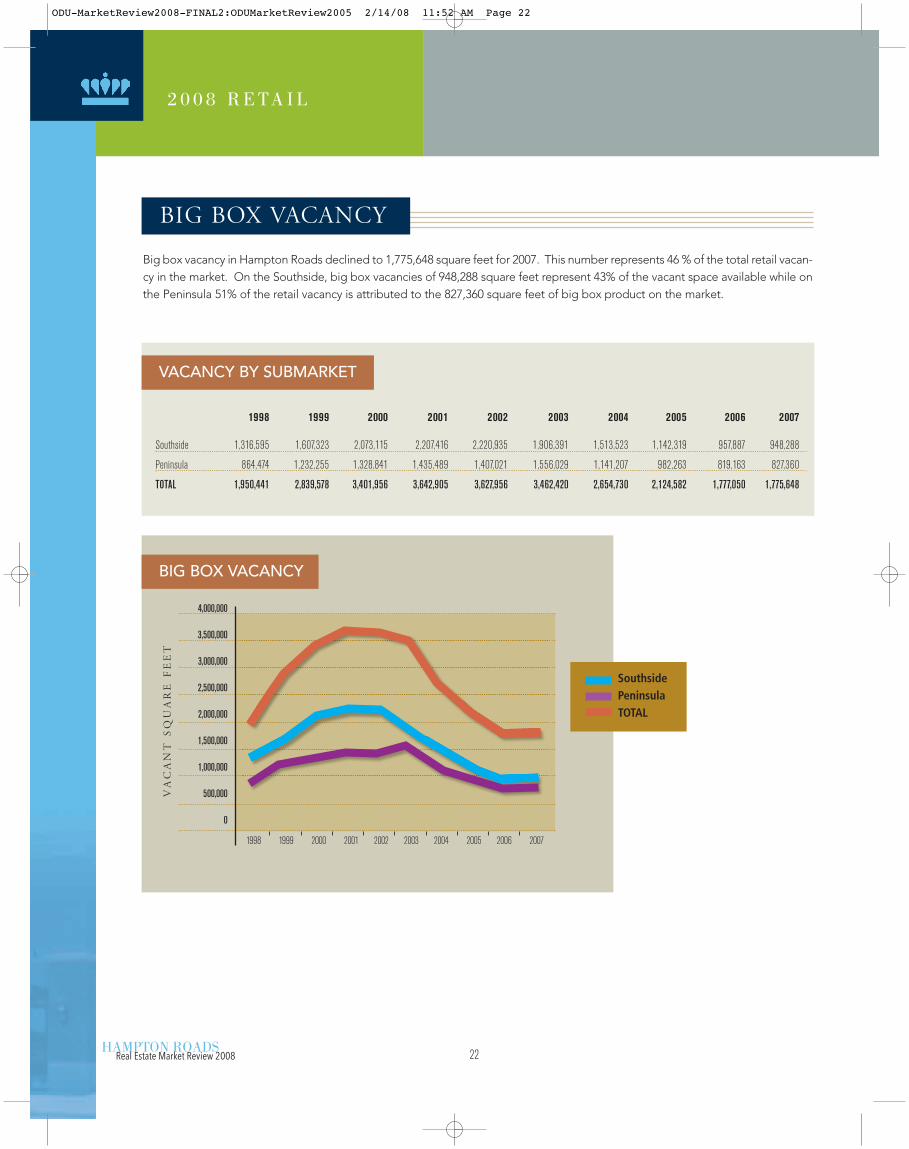
22
Big box vacancy in Hampton Roads declined to 1,775,648 square feet for 2007. This number represents 46 % of the total retail vacan-cy in the market. On the Southside, big box vacancies of 948,288 square feet represent 43% of the vacant space available while onthe Peninsula 51% of the retail vacancy is attributed to the 827,360 square feet of big box product on the market.
BIG BOX VACANCY
HAMPTON ROADSReal Estate Market Review 2008
1998 1999 2000 2001 2002 2003 2004 2005 2006 2007
Southside 1,316,595 1,607,323 2,073,115 2,207,416 2,220,935 1,906,391 1,513,523 1,142,319 957,887 948,288
Peninsula 864,474 1,232,255 1,328,841 1,435,489 1,407,021 1,556,029 1,141,207 982,263 819,163 827,360
TOTAL 1,950,441 2,839,578 3,401,956 3,642,905 3,627,956 3,462,420 2,654,730 2,124,582 1,777,050 1,775,648
4,000,000
3,500,000
3,000,000
2,500,000
2,000,000
1,500,000
1,000,000
500,000
0
SouthsidePeninsulaTOTAL
1998 1999 2000 2001 2002 2003 2004 2005 2006 2007
Va
ca
nt
S
qu
ar
e F
ee
t
2 0 0 8 R E TA I L
ODU-MarketReview2008-FINAL2:ODUMarketReview2005 2/14/08 11:52 AM Page 22

23
20
08
RE
TA
IL
Hampton Roads continued to expand in 2007 with a fair amount of growth and redevelopment taking place on the Peninsula. Asampling of the change Hampton Roads witnessed this year is as follows:
Chesapeake1. Cahoon Commons Crescent Development (Complete)2. Country Club Shops John Wood (Complete)3. The Shops at Chesapeake Square Stanton Partners (Planned)
Hampton 1. The Peninsula Town Center Mall Properties (Under Construction)
Newport News1. The Village of Stoney Run The Breeden Company (Complete)2. The Marketplace S.L. Nusbaum Realty Co (Planned)
Suffolk1. Harbourview East Landonomics (Under Construction)2. The Marketplace at Harbourview Hemisphere Development (Planned)3. Bennett’s Creek Stanton Partners / RDG (Complete)4. Obici Place RDG (Planned)5. The Shops at Godwin Marketplace S.L. Nusbaum/ Brinkley (Planned)6. Nansemond Crossing Spectrum Development (Planned)
Virginia Beach 1. Redmill Walk Ellis Gibson Development (Under Construction)2. Landstown Commons The Goodman Company (Complete)3. Indian Lakes Crossing Armada Hoffler (Complete)4. The Shops at Town Center S.L. Nusbaum (Planned)
Williamsburg1. Settlers Market AIG (Under Construction)2. High Street Rossland (Under Construction)3. Quarterpath Crossing S.L. Nusbaum (Planned)4. Marquis Premier ( Phase 1 Open)
NEW DEVELOPMENT
ODU-MarketReview2008-FINAL2:ODUMarketReview2005 2/14/08 11:52 AM Page 23

24
2 0 0 8 R E TA I L
HAMPTON ROADS
SOUTHSIDE
BAY FRONTBayside I & II A 79,397
Cape Henry Plaza A 58,424
Kroger H 47,000
Marina Shores G 29,000
BIRDNECK / OCEANFRONTBirdneck SC A 65,460
Farm Fresh H 29,296
Harris Teeter H 48,000
Linkhorn Shops A 48,899
CAMPOSTELLA Atlantic Commons A 63,393
Bainbridge Marketplace A 46,444
Campostella Corner A 43,375
George Washington Commons A 44,942
Holly Point SC A 65,321
Southgate Plaza A 69,429
CHESAPEAKE SQUAREBJ's H 115,660
Chesapeake Center B 296,832
Chesapeake Square Mall I 800,000
Crossroads @ Chesp. Sq. D 225,000
Food Lion @ Chesp. Sq. H 45,000
Home Depot H 130,060
Lowes H 115,000
Taylor Road Plaza A 60,000
Wal-Mart Supercenter / Sam's Club H 350,000
CHURCHLAND / PORTSMOUTH / HARBOURVIEWAcademy Crossing G 45,483
Churchland Blvd SC (Formerly Farmco Plaza) G 52,966
Churchland Place G 21,000
Churchland SC A 149,741
Churchland Square A 64,989
Grand H 30,000
Harbourview Station East D 217,308
Harbourview Station West D 83,007
Marketcenter at Harbourview A 65,750
Marketplace Square G 12,461
Poplar Hill Plaza B 102,326
Sterling Commons A 75,660
Towne Point Square A 58,989
Western Branch CrossingLowes (Churchland) H 55,000
DAM NECKCourthouse Walk A 21,600
Dam Neck Crossing B 138,571
Dam Neck Square A 67,917
General Booth Plaza A 73,320
Red Mill Commons D 586,575
Red Mill Walk B 240,000
Sandbridge SC A 66,800
Strawbridge Marketplace A 172,429
DOWNTOWNChurch Street Crossing A 51,000
MacArthur Center Mall I 1,100,000
Waterside Festival Marketplace I 130,338
GHENT21st Street Pavilion G 21,000
Center Shops A 129,966
Colley Village A 44,585
Farm Fresh H 40,000
Ghent Place G 13,000
Harris Teeter H 27,000
Palace Shops I, II C 71,794
Palace Station G 38,000
The Corner Shops G 21,512
GREAT BRIDGE Cahoon Commons D 215,000
Cedar Lakes Center A 35,396
Centerville Crossing A 55,000
Crossings at Deep Creek A 68,970
Dominion Marketplace A 73,103
Dominion Plaza SC A 63,733
Former Winn Dixie H 50,000
Glenwood Square A 73,859
Great Bridge SC A 158,000
Hanbury Village A 100,560
Harbor Watch Shoppes G 21,505
Las Gaviotas A 82,000
Millwood Plaza G 16,969
Mt. Pleasant Shopping Center A 100,000
Mt. Pleasant Village A 39,970
Wilson Village A 52,500
Woodford Shoppes B 9,760
Woodford Square B 139,623
GREENBRIER / BATTLEFIELD BOULEVARD Battlefield Marketplace G 30,000
Chesapeake Crossing B 287,679
Crossways Center I & Eden Way Shops D 438,725
Crossways II D 152,686
Edinburgh Commons North D 195,111
Edinburgh East D 133,000
Gainsborough Square A 88,862
Greenbrier Mall I 809,017
Greenbrier Market Center D 487,580
Greenbrier South SC A 97,500
Home Depot H 130,060
K-Mart / OfficeMax H 165,000
Knell's Ridge Square G 40,000
Lowes H 114,000
Orchard Square A 88,910
Parkview @ Greenbrier A 83,711
Regal Cinemas H 60,763
The Shoppes at Greenbrier G 40,000
Townplace at Greenbrier C 127,109
Village Square G 15,000
Volvo Parkway SC G 41,874
Walmart Way Crossing G 80,160
Wal-Mart / Sam's Club / Kohl's D 433,821
HILLTOP / GREAT NECK Great Neck Square A 93,887
Great Neck Village A 73,836
Hilltop East C 100,000
Hilltop North B 202,511
Hilltop Plaza B 152,025
Hilltop Square B 270,093
Hilltop West G 60,000
La Promenade C 63,280
Marketplace at Hilltop C 113,000
Regency Hilltop B 236,549
Renaissance Place G 47,667
Target H 122,000
HOLLAND / GREEN RUNAuburn Place A 44,846
Chimney Hill B 207,175
Green Run Square A 60,000
Holland Plaza SC A 165,867
Holland Windsor Crossing (Super K-Mart) B 237,000
The following is a list of the properties included in this year’ssurvey listed by submarket with a code representing the type ofproperty. The GLA of the property is also listed.
A Neighborhood Center F Outlet CenterB Community Center G OtherC Fashion/Specialty Center H FreestandingD Power Center I MallE Theme Festival
Real Estate Market Review 2008
ODU-MarketReview2008-FINAL2:ODUMarketReview2005 2/14/08 11:52 AM Page 24

25
Lowes H 125,323
Lynnhaven Green A 50,838
Shipps Corner A 63,355
Timberlake SC A 73,500
INDIAN RIVER / COLLEGE PARKCollege Park I & II B 181,902
Indian River Plaza B 126,017
Indian River SC A 123,752
Tidewater Plaza A 50,638
KEMPSVILLE Arrowhead Plaza A 97,006
Fairfield SC B 239,763
Kemps Corner Shoppes G 25,929
Kemps River Center A 62,507
Kemps River Crossing B 245,268
Kempsville Crossing A 111,394
Kempsville Plaza A 60,778
Parkway Marketplace A 26,602
Providence Square SC A 135,915
University Shoppes A 26,100
Woods Corner A 152,314
LITTLE CREEK ROAD / WARDS CORNER / OCEAN VIEWAmes / Kroger B 140,568
Dollar Tree Shopping Center A 51,415
East Beach Shoppes A 63,000
Farm Fresh - Little Creek H 66,000
Glenwood Shoppes A 53,255
Little Creek East SC B 202,338
Little Creek Square A 82,300
Meadowbrook S C G 27,260
Mid-Town SC A 75,768
Mid-Way SC G 31,000
Ocean View SC A 73,658
Roosevelt Gardens SC A 109,175
Southern SC B 258,035
Suburban Park B 127,450
Super Walmart H 225,000
Tidewater I & II SC B 126,212
Wards Corner Strip A 61,540
Wedgewood SC A 130,000
LITTLE NECK Ames Plaza B 177,549
Birchwood SC A 358,635
Home Depot H 130,060
Kroger H 45,000
London Bridge Plaza B 120,000
Lowes H 160,000
Lynnhaven Convenience G 36,100
Lynnhaven Shopping Center B 140,000
Princess Anne Plaza West C 77,558
Regatta Bay Shops G 60,000
Sam's Club Plaza D 248,604
LYNNHAVEN ROAD Lynnhaven Crossing G 55,550
Lynnhaven East B 97,303
Lynnhaven Mall I 1,293,100
Lynnhaven North B 176,254
Lynnshores Shopping Center G 12,692
Lynnway Place G 30,213
Parkway Plaza G 42,000
Walmart H 113,112
MIDDLE PORTSMOUTHAfton SC A 106,500
Airline Center A 69,000
Airline Plaza A 99,549
Elmhurst Square A 45,842
Gilmerton Square G 43,236
Manor Commerce Center G 67,060
Manor Village G 14,573
Olde Towne Market Place A 38,200
Rodman SC A 45,000
Super Walmart H 200,000
Triangle SC G 82,430
Victory Crossing D 445,758
Victory West Shopping Center A 167,102
Williams Court B 214,739
MILITARY HIGHWAY / JANAFBest Square B 140,030
Broad Creek SC D 205,417
Bromley SC A 55,330
CostCo H 110,000
Dump / Mega Office G 115,854
Farm Fresh H 60,000
Food Lion #170 H 41,000
Grand Outlet H 35,000
Janaf D 878,381
Lowes H 115,000
Military Crossing D 195,003
Military Triangle G 10,061
Northampton Business Center
(former 5760 North Hampton Blvd.) G 80,000
Super K-Mart & Shoppes B 200,000
Super Walmart H 224,513
The Gallery @ Military Circle I 856,542
NEWTOWNCypress Plaza SC A 59,012
Cypress Point A 117,958
Diamond Springs Shoppes G 24,000
Newpointe SC A 92,978
Newtown Baker Crossing A 91,687
Newtown Center G 19,876
Newtown Convenience Center G 19,800
Thomas Corner SC G 23,557
Weblin Square G 31,552
ODUUniversity Village G 36,500
PEMBROKEAragona SC A 69,700
Best Buy H 45,000
Bloom Brothers Furniture H 58,000
Circuit City H 38,414
Collins Square A 111,370
Columbus Village East A 63,000
Columbus Village Entertainment Center E 100,000
Dean Plaza (Former HQ) D 140,000
Giant Square B 150,000
Goodwill H 34,000
Haverty's H 55,000
Haygood SC B 160,129
Haynes H 228,000
Hunter's Mill Shoppes G 22,827
Loehmann's Plaza C 139,380
Northern Super Center G 36,588
Pembroke East B 27,200
Pembroke Mall I 570,000
Pembroke Meadows SC A 81,592
Pembroke Place B 165,000
Pembroke Plaza G 34,900
Roomstore H 50,000
The Town Center of Virginia Beach C 260,000
Value City H 95,000
PRINCESS ANNE ROADCourthouse Marketplace A 122,000
Home Depot H 260,000
Kempsville Marketplace A 71,460
Landstown Commons D 500,000
Lynnhaven Square S C G 22,933
Parkway SC A 64,820
Pleasant Valley Marketplace A 86,107
Princess Anne Marketplace B 209,500
Princess One SC A 84,725
Salem Crossing D 392,407
Salem Lakes SC A 37,087
Woodtide SC A 25,500
SMITHFIELDCypress Run SC G 25,000
Eagle Harbor A 77,400
Smithfield Plaza B 89,120
Smithfield Square A 65,244
ODU-MarketReview2008-FINAL2:ODUMarketReview2005 2/14/08 11:52 AM Page 25

SUFFOLKBennett’s Creek Crossing A 114,300
Bennett’s Creek Food Lion A 64,544
Holland Plaza A 69,345
Kensington Square A 60,000
Lowes H 150,000
Oak Ridge A 38,700
Suffolk Plaza B 174,221
Suffolk Plaza West A 60,000
Suffolk SC B 85,803
Suffolk Specialty Shops G 15,200
Suffolk Village SC G 11,875
Walmart Super Center H 194,160
PENINSULA
COLISEUM CENTRALColiseum Corner A 49,267
Coliseum Crossing B 221,004
Coliseum Marketplace A 86,681
Coliseum Specialty Shops G 15,026
Coliseum Square G 45,041
Hampton Towne Centre D 376,100
Hampton Woods A 89,092
Home Depot H 130,060
Riverdale Plaza D 280,133
Sports Authority H 40,000
Target H 122,000
The Power Plant D 621,150
Todd Center & Todd Lane Shops B 242,000
Walmart Super Center H 193,316
DENBIGHBeaconsdale SC A 28,000
Denbigh Crossing A 145,000
Denbigh Speciality Shops G 24,504
Denbigh Village Centre B 334,299
Ferguson Center G 118,000
Former Hills Denbigh H 86,589
Kmart H 115,854
Lee Hall Plaza A 36,000
Newport Crossing B 200,088
Richneck Shopping Center A 63,925
Stoneybrook Shopping Center A 75,000
Turnberry Crossing A 53,775
Village Square A 40,000
Warwick Denbigh SC B 137,925
FOXHILL / BUCKROE / EAST MERCURYBuckroe SC A 89,594
Farm Fresh Phoebus H 39,000
Kmart H 94,500
Langley Square A 146,434
Marketplace @ Nickerson A 70,450
Nickerson Plaza A 83,849
Willow Oaks Village Square S.C. B 193,728
GLOUCESTER6513 Market Drive H 92,273
Food Lion H 40,000
Hayes Plaza SC A 52,651
Hayes SC A 100,000
Home Depot H 100,000
Lowe's H 125,000
Walmart Super Center H 220,000
Winn Dixie Marketplace B 165,000
York River Crossing B 175,000
HAMPTON MISCELLANEOUSKecoughtan SC A 64,237
The Shops at Hampton Harbor G 54,645
NEWMARKET / MAIN4113 W Mercury Blvd. H 49,770
4205 W. Mercury Blvd. H 28,080
Brentwood SC A 53,600
Dresden SC G 35,000
Forest Park Square B 150,000
Francisco Village A 55,865
Hampton Plaza B 173,199
Hilton SC A 74,000
Midway Shopping Center G 58,780
Newmarket South D 387,221
Plaza @ Newmarket B 117,377
Warwick Center A 150,000
Warwick Village A 75,400
PATRICK HENRY / OYSTER POINT / KILN CREEK Bayberry Village A 60,147
Best Buy Building H 135,000
City Center C 149,851
Commonweatlh Center G 30,279
Fairway Plaza G 37,950
Glendale SC G 30,000
Grand Furniture H 35,000
Harris Teeter H 52,334
Haverty's H 45,000
Haynes H 170,000
Hidenwood SC A 108,000
Jefferson Commons D 400,000
Jefferson Greene G 57,430
Jefferson Plaza D 178,200
Kroger H 55,000
Lowes H 120,000
Market Place @ Oyster Point A 69,660
Newport Marketplace D 450,000
Newport Square B 184,126
Office Depot H 30,122
Oyster Point Plaza A 73,197
Oyster Point Square A 83,089
Patrick Henry Mall I 644,000
Patrick Henry Place A 96,391
Sam's Club H 133,880
The Shoppes at Oyster Point G 30,000
Victory Center @ Kiln Creek A 61,000
Village Square @ Kiln Creek B 263,000
Villages of Kiln Creek G 45,300
Walmart Super Center H 201,146
Yoder Plaza SC D 435,000
POQUOSONPoquoson SC A 57,458
Wythe Creek SC A 51,063
WILLIAMSBURGColony Square A 66,806
Ewell Station A 68,048
Festival Marketplace G 16,216
Gallery Shops G 18,187
Governor's Green SC A 100,000
Home Depot H 130,000
James York Plaza B 138,677
Kingsgate Green B 138,348
Lowes H 163,000
Marketplace Shoppes G 26,626
Marketplace Shopping Center G 30,000
Monticello Marketplace B 300,000
Monticello SC A 82,000
Newtown C 250,000
Norge Crossing H 52,000
Olde Towne SC G 30,000
Prime Outlets F 349,927
Staples H 37,400
The Marquis (Phase I) D 1,000,000
Village Shops at Kingsmill G 82,200
Wal-Mart SuperCenter H 210,000
Williamsburg Crossing A 149,933
Williamsburg Farm Fresh A 79,188
Williamsburg Marketcenter B 120,920
Williamsburg Outlet Mall I 180,000
Williamsburg Pavillion Shops G 50,000
Williamsburg SC I & II B 251,000
Williamsburg Towne and Cnty A 49,802
WindsorMeade Marketplace D 174,379
Yankee Candle H 42,000
YORK COUNTYGrafton SC A 32,000
Heritage Square A 86,000
Kiln Creek Center A 45,700
Marketplace @ Yorktown A 73,050
Patriots Square A 47,231
Shady Banks SC A 57,654
Wal-Mart SuperCenter H 220,000
Washington Square & Shops B 254,972
York Square A 48,720
Yorkshire Downs G 23,900
2 0 0 8 R E TA I L
26HAMPTON ROADSReal Estate Market Review 2008
ODU-MarketReview2008-FINAL2:ODUMarketReview2005 2/14/08 11:52 AM Page 26

27
ODU-MarketReview2008-FINAL2:ODUMarketReview2005 2/14/08 11:52 AM Page 27

28HAMPTON ROADSReal Estate Market Review 2008
ODU-MarketReview2008-FINAL2:ODUMarketReview2005 2/14/08 12:32 PM Page 28

AuthorBilly King, SIOR
Data PreparationStephanie Sanker, CCIM
Survey CoordinationClay Culbreth, CCIM, SIOR
ReportersGreenbrier Ron Biesecker
& Christine KaempfeBainbridge/S. Elizabeth River Area Chip WorleyCavalier Industrial Park Pat Mumey
& Scott WermersNorfolk Commerce Park &
Central Norfolk Area Worth RemickNorfolk Industrial Park Charles DickinsonWest Side/Midtown Norfolk Area Billy KingLynnhaven Brian BakerGreenwich/Cleveland Streets Area Bobby BeasleyAirport Industrial Park Bobby BeasleyPortsmouth Abe EllisSuffolk Bill ThroneIsle of Wight Billy KingCopeland/Lower Peninsula Clay CulbrethOyster Point/Middle Peninsula Area Bobby PhillipsOakland/Upper Peninsula Area Trip FergusonWilliamsburg Extended Area Bobby Phillips
Acknowledgements
2 0 0 8 H A M P TO N R O A D S R E A L E S TAT E M A R K E T R E V I E W
INDUSTRIAL
29
ODU-MarketReview2008-FINAL2:ODUMarketReview2005 2/14/08 11:53 AM Page 29

30
This survey includes the following types of properties:
• Office-warehouse, industrial and shop facilities of 5,000 square feet or greater, although somefacilities of less than 5,000 square feet may be included.
• Properties must have less than 80% office space to be included in the ODU survey.
• Both owner-occupied and leased properties are included. Owner-occupied is defined as a proper-ty that is 100% occupied by a business that is the same as or is related to the owner of the building.
• All properties that are available and are listed for sale or lease regardless of whether they areoccupied, unless they are strictly available for sale as an investment property. For example, aproperty that is available for sale and is currently occupied on a short-term lease is included.
• All properties that have commenced construction (foundations installed minimum).
The survey excludes the following types of properties:
• Land
• Warehouse or shop facilities on shipyard properties
• Warehouse or other industrial facilities on federal government property (e.g., military installations)
• Industrial facilities on government property (e.g. Norfolk International Terminal or Newport NewsMarine Terminal)
Functional submarket delineations are determined with some regard to city boundaries but bound-aries are not determinative. The entire market is divided into 16 submarkets defined by industrialbuilding concentrations, the transportation network, and pertinent physical features. The area mapincluded in this report provides a location key for reference.
The E. V. Williams Center for Real Estate and Economic Development (CREED) at Old DominionUniversity has been tracking the inventory of the Hampton Roads industrial market since 1995. Theresults of this year’s survey (collected during the 4th quarter of 2007) indicate that the Hampton Roadsindustrial market currently encompasses 103,794,954 total square feet of space located in 2,743 build-
2 0 0 8 I N D U S T R I A L
HAMPTON ROADSReal Estate Market Review 2008
his report analyzes the 2007 industrial real
estate conditions within the Virginia Beach-
Norfolk-Newport News, VA-NC Metropolitan
Statistical Area (the “MSA”) that is also known as
Hampton Roads. It provides inventory, vacancy, rent, sale and other data for the MSA. The survey
includes properties in the cities of Chesapeake, Hampton, Newport News, Norfolk, Poquoson,
Portsmouth, Suffolk, Virginia Beach, and Williamsburg, plus the counties of Gloucester, James City,
York and Isle of Wight.
General Overview
T
METHODOLOGY
ODU-MarketReview2008-FINAL2:ODUMarketReview2005 2/14/08 11:53 AM Page 30

31
20
08
IND
US
TR
IAL
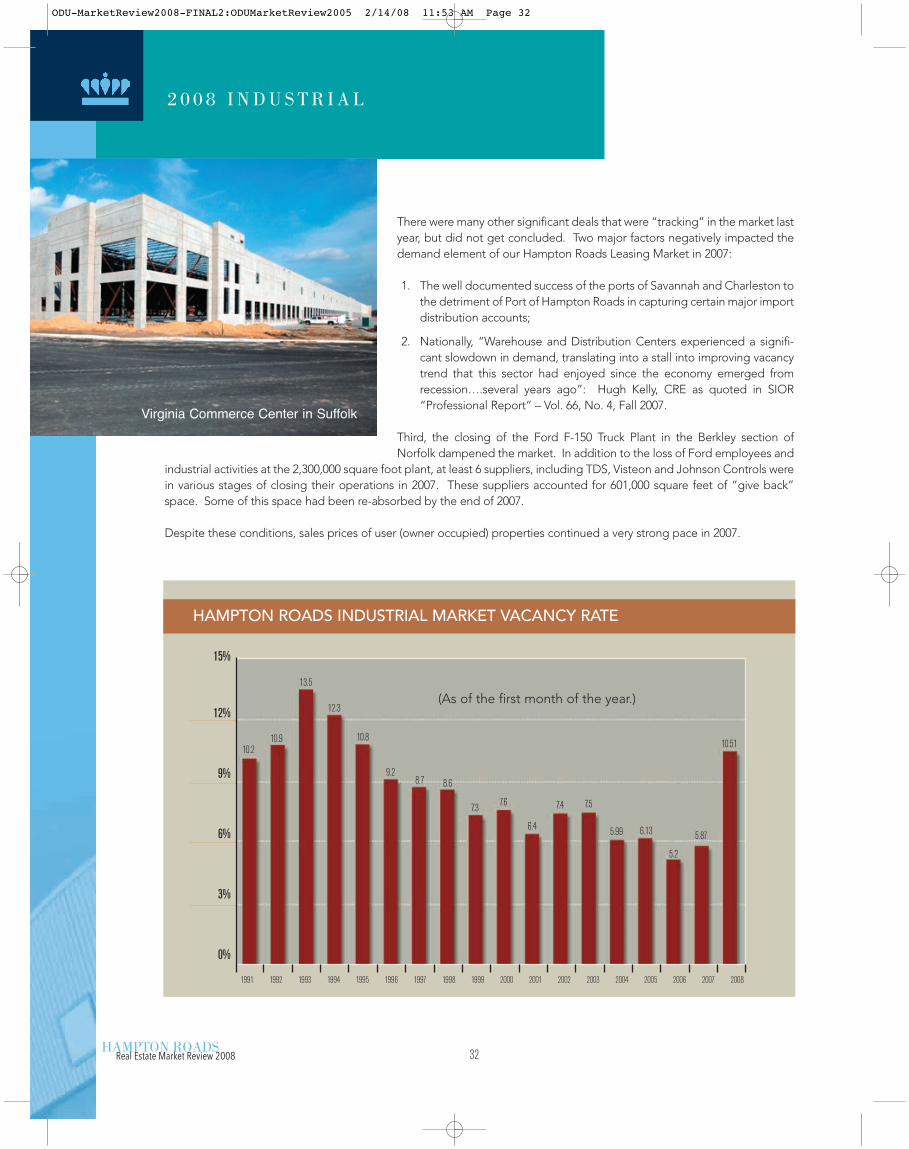
This year, Hampton Roads’ vacancy rate increased to 10.51% from 5.87% in last year’s survey. The vacancy rate, as measuredin the beginning of 2007, was the lowest rate that has been recorded for the area since the survey started in 1995. This year'sreported vacancy rate of 10.51% is 79% higher than last year’s rate, and is historically a high rate for our market. The vacancyrate was up in 14 out of 16 submarkets covered. Total Hampton Roads market absorption this year was a negative 1.85% or-1,745,376 square feet, as compared with a positive 2.80% (2,566,823 square feet) in 2006. Absorption was negative on boththe Peninsula (-332,455 square feet) and Southside (-1,412,910 square feet).
Last year’s report termed 2006 a “com-mitment year” for the Hampton RoadsIndustrial Market because of 1) thestart up and substantial completion ofseven major speculative distributionprojects and 2) the continuing escala-tion of lease rates in the vast majorityof the market that was adequatelyserved by its existing space. The stud-ied market year of 2007, might betermed an “impact” year for theMarket. First, eight additional newprojects commenced or finished and,thus, became available inventory in ourmarket. These projects are as follows:
Second, as a backdrop to all this additional space being available to our market, there were few new large lease deals thatwere concluded in 2007. Samples of these are as follows:
• Guardian Moving and Storage - 138,000 s.f. in the Gateway Manufacturing building, Hampton
• Tire Centers – 31,500 s.f. in Bridgeway III, Suffolk
• Northrop Grumman – 240,000 s.f. in Enterchange II, Hampton
• Lockheed Martin – 30,000 s.f. at 1408 Stephanie Way, Chesapeake
HAMPTON ROADS OVERVIEW
ings throughout the region. This is an increase of 3,557,444 square feet, or 3.55% from last year’s survey. The increase is pri-marily due to expansions of existing buildings and new construction started in the marketplace. As a counter to these increas-es there was an elimination of eight (8) buildings (in the Westside Norfolk submarket) that were demolished or converted toalternative uses (multi-family, mini-storage and retail).
Square Footage
1. Logistics America (NYK) by ProLogis 130,00
2. West Park Two by Taurus/High Street Equity Advisors 180,000
3. Bay Warehouse Addition by First Potomac 100,000
4. Virginia Regional Commerce Center by The Regional Companies 400,000
5. Agiao Phase II (Oceana South) 90,000
6. Virginia Commerce Center by MacDonald Development 385,320
7. Oceana South One by Commonwealth Development 81,400
8. Enterchange Two by Devon Group/Schneider National 470,200
Total New Projects Commenced or Completed in 2007 1,836,920
Seven new projects listed in 2006 survey 1,723,100
Total new projects last 2 years 3,560,020
Bridgeway III
ODU-MarketReview2008-FINAL2:ODUMarketReview2005 2/14/08 11:53 AM Page 31
32
2 0 0 8 I N D U S T R I A L
HAMPTON ROADSReal Estate Market Review 2008
There were many other significant deals that were “tracking” in the market lastyear, but did not get concluded. Two major factors negatively impacted thedemand element of our Hampton Roads Leasing Market in 2007:
1. The well documented success of the ports of Savannah and Charleston tothe detriment of Port of Hampton Roads in capturing certain major importdistribution accounts;
2. Nationally, “Warehouse and Distribution Centers experienced a signifi-cant slowdown in demand, translating into a stall into improving vacancytrend that this sector had enjoyed since the economy emerged fromrecession….several years ago”: Hugh Kelly, CRE as quoted in SIOR“Professional Report” – Vol. 66, No. 4, Fall 2007.
Third, the closing of the Ford F-150 Truck Plant in the Berkley section ofNorfolk dampened the market. In addition to the loss of Ford employees and
industrial activities at the 2,300,000 square foot plant, at least 6 suppliers, including TDS, Visteon and Johnson Controls werein various stages of closing their operations in 2007. These suppliers accounted for 601,000 square feet of “give back”space. Some of this space had been re-absorbed by the end of 2007.
Despite these conditions, sales prices of user (owner occupied) properties continued a very strong pace in 2007.
10.210.9
13.5
12.3
10.8
9.28.7 8.6
7.37.6
6.4
7.4 7.5
5.99 6.13
5.2
5.87
10.51
1991 1992 1993 1994 1995 1996 1997 1998 1999 2000 2001 2002 2003 2004 2005 2006 2007 2008
15%
12%
9%
6%
3%
0%
HAMPTON ROADS INDUSTRIAL MARKET VACANCY RATE
(As of the first month of the year.)
Virginia Commerce Center in Suffolk
ODU-MarketReview2008-FINAL2:ODUMarketReview2005 2/14/08 11:53 AM Page 32

33
20
08
IND
US
TR
IAL
The market continued to show elevated prices even as compared to strong years in 2005 and 2006. Industrial building salesprices predominated in the $40 per square feet (p.s.f.) to $70 p.s.f. range. There were several sales that were finalized in thehigher $100 - $140 p.s.f. range, as a result of either high-end or park locations, developed yard or surplus land area.Available modern industrial buildings for purchase remained very difficult to find in 2007 in all size ranges.
SALES OVERVIEW
REPRESENTATIVE BUILDING SALES TRANSACTIONS
2007 ODU HAMPTON ROADS INDUSTRIAL SURVEY
Date Location Sq. Ft. Price $/SF Acres
3/07 Truck Enterprises – Cavalier 12,750 $3,200,000 $250.98 7
7/07 Blackhawk Industries 47,378 $3,250,000 $69.00 4.6
7/07 Cavalier Marine Supply 39,500 $1,300,000 $32.91 1.453
7/07 Ethan Allen 13,950 $1,650,000 $118.28 1.5
11/07 Lee’s Tires 50,582 $1,850,000 $36.38 2.99
12/07 Johnson Controls 69,018 6,825,000 $98.89 12.07
SUBMARKET TOTALSBldgs
Submarket City Surveyed Total s.f. Vacancy s.f. Vacancy %
Greenbrier Area Chesapeake 274 8,342,696 308,286 3.70%
Bainbridge/S. Elizabeth River Area Chesapeake 133 5,464,312 385,783 7.06%
Cavalier Industrial Park Area Chesapeake 179 5,959,713 596,380 10.01%
Norfolk Commerce Park/Central Norfolk Area Norfolk 142 7,076,668 2,609,090 36.87%
Norfolk Industrial Park Area Norfolk 339 10,196,798 655,962 6.43%
West Side/Midtown Norfolk Area Norfolk 261 6,441,519 290,845 4.52%
Lynnhaven Area Virginia Beach 253 7,449,758 730,961 9.81%
Greenwich/Cleveland Streets Area Virginia Beach 127 3,141,006 60,102 1.91%
Airport Industrial Park Area Virginia Beach 70 3,684,329 330,881 8.98%
City of Portsmouth Portsmouth 154 4,004,464 297,805 7.44%
City of Suffolk Suffolk 115 11,535,116 1,477,357 12.81%
Isle of Wight Isle of Wight 27 2,788,716 355,766 12.76%
Southside Totals 2,074 76,085,095 8,099,218 10.64%
Copeland/Lower Peninsula Area Peninsula 363 9,983,484 2,103,397 21.07%
Oyster Point/Middle Peninsula Area Peninsula 149 4,109,297 67,657 1.65%
Oakland/Upper Peninsula Area Peninsula 97 4,611,983 254,733 5.52%
Williamsburg Extended Area Peninsula 60 9,005,095 381,602 4.24%
Peninsula Totals 669 27,709,859 2,807,389 10.13%
Totals 2,743 103,794,954 10,906,607 10.51%
ODU-MarketReview2008-FINAL2:ODUMarketReview2005 2/14/08 11:53 AM Page 33

34
Industrial Leasing Highlights and Comparable Leases for 2007 included the following:
• Noland Company HVAC Division lease of 818 Blue Crab Road, Newport News – 17,000 square feet for 120 months at$7.25 p.s.f., NNN (Oyster Point Park).
• Guardian Moving and Storage Co. lease at former Gateway Manufacturing facility, Hampton – 134,589 square feet ona 95 month lease (cancellable based on contract) at $4.35 p.s.f., NNN.
• Northrop Grumman (Newport News Ship) anchor tenant lease of Enterchange Hampton II – 240,000 square feet at$4.90 p.s.f. for 180 months.
• City Electric Company lease of 7,500 square feet at 5875 Adderly Street, Norfolk - $6.25 p.s.f., Modified Net for 60months.
• Loomis Fargo and Co. lease of 13,750 square feet at Woodlake Distribution Center – Chesapeake - $7.00 p.s.f., NNNfor 120 months.
LEASING OVERVIEW
2 0 0 8 I N D U S T R I A L
HAMPTON ROADSReal Estate Market Review 2008
RENTS FOR AVAILABLE SPACES BY SIZE RANGE
Begin Size (s.f.) 2001 2002 2003 2004 2005 2006 2007
> 5,000 $6.34 $7.16 $6.95 $7.30 $7.75 $7.85 $7.90
5,000 - 20,000 $4.46 $5.80 $5.89 $6.20 $6.50 $6.75 $6.95
20,000 - 40,000 $4.35 $4.99 $5.21 $5.45 $5.75 $5.85 $5.90
40,000 - 60,000 $4.15 $4.13 $4.44 $4.75 $4.95 $5.00 $4.75
> 60,000 $3.24 $3.43 $3.15 $4.00 $4.30 $4.35 $4.25
PERCENTAGE OF AVAILABLE SPACES BY SIZE RANGE
Begin Size (s.f.) 2001 2002 2003 2004 2005 2006 2007
> 5,000 30% 15% 32% 25% 30% 25% 20%
5,000 - 20,000 40% 52% 44% 40% 42% 30% 15%
20,000 - 40,000 15% 18% 12% 15% 13% 15% 20%
40,000 - 60,000 9% 8% 7% 8% 6% 10% 20%
> 60,000 6% 7% 5% 12% 9% 20% 25%
ODU-MarketReview2008-FINAL2:ODUMarketReview2005 2/14/08 11:53 AM Page 34

35
20
08
IND
US
TR
IAL
Average market asking rents for small and medium size spaces (less than 30,000 square feet) continued to rise during 2007.Rates for larger spaces continued to be higher than other outside markets, but the rates for larger spaces have been mod-erated this year by the availability of the aforementioned new, high bay projects. This trend and the negative rent impact onlarger spaces should continue in 2008 and, perhaps, 2009, depending on how demand develops. The variance between ask-ing lease rates and final negotiated rates, which are highly dependent on the age and location of a particular building, con-tinued to be between 0% and 15% in 2007 with the wider ranges applying to the larger, new facilities. Five new projects wereannounced to begin in 2008 but whether they, in fact, start depend largely on market demand.
Industrial land sale highlights for 2007 included:
• 22 acres in Greenmount Industrial Park (James City County) sold to user for $45,454 per acre.
• 6 acres to Earthcore Industries in Cavalier Industrial Park from the City of Chesapeake at $107,500 per acre ($645,000).
• Chesapeake Deep Water Terminal – 81 acres (useable) to International Bio-Energy – Virginia Real Estate, LLC for intend-ed development of Ethanol plant - $6,075,000 ($75,000 per acre).
• 240 acre Britt site on Route 58 in Suffolk sold to McDonald Development for $8,100,000 ($33,750/acre).
LAND SALES
Overall, 2007 was a very active year for industrial investment sales, as compared with the quieter 2006 year. Among the invest-ment projects trading hands were the following:
• MB Handy property - a 60,000 square foot, 2 tenant property including General Electric Supply in the Norfolk IndustrialPark, sold to Helmsman Properties;
• The 62,000 square foot Greenbrier Distribution Center (Jamad II), in Greenbrier sold to a local investor;
• The 146,000 square foot Airport Industrial Center II property, anchored by Federal Express, sold by Krieder-Schockey toCambridge-Hanover.
• The 41,500 square foot Carrier-Mid Atlantic property in Norfolk Industrial Park, sold to a local investor.
INVESTMENT SALES
Our forecast for 2008, based on the above, is as follows:
1. Continued strong investor and prospect interest in Hampton Roads because of its diversified industrial base, includingdefense, port-related distribution and industrial supplies.
2. Strength in all market areas, with the exception of the larger, high-bay warehouse segment, which will experience intensecompetition for quality tenants and, thus, lower than expected rental rates for new space and the potential flattening ofrates for older, less modern space.
FORECAST
ODU-MarketReview2008-FINAL2:ODUMarketReview2005 2/14/08 11:53 AM Page 35

ODU-MarketReview2008-FINAL2:ODUMarketReview2005 2/14/08 11:53 AM Page 36

37
SouthsideSuffolk
Portsmouth
West Norfolk
Central Norfolk
Cavalier
Bainbridge
Norfolk Industrial Park
Airport Industrial Park
Greenbrier
Cleveland
Lynnhaven
PeninsulaCopeland
Oakland
Oyster Point
Williamsburg Extended
INDUSTRIAL SUBMARKETS
20
08
IND
US
TR
IAL
ODU-MarketReview2008-FINAL2:ODUMarketReview2005 2/14/08 11:53 AM Page 37

38HAMPTON ROADSReal Estate Market Review 2008
ODU-MarketReview2008-FINAL2:ODUMarketReview2005 2/14/08 11:53 AM Page 38

39
AuthorDonald R. Crigger, CCIM Senior Director, Office PropertiesGVA Advantis – Norfolk, VA
Christopher Bendit – Director, Office PropertiesGVA Advantis – Newport News, VA
Financial SupportThe E. V. Williams Center for Real Estate andEconomic Development (CREED) functions and reports are funded by donations from individuals,organizations and the CREED advisory board.
Acknowledgements
2 0 0 8 H A M P TO N R O A D S R E A L E S TAT E M A R K E T R E V I E W
OFFICE
ODU-MarketReview2008-FINAL2:ODUMarketReview2005 2/14/08 11:53 AM Page 39

40
n 2007, the Hampton Roads Office Market paralleled the statistical performance of the
overall national market which continued a modest growth pattern. While stable, this
growth curve flattened last year compared with previous years as net absorption was only
slightly positive. Historically, 500,000 square feet (s.f.) has been the market average net absorp-
tion in the Hampton Roads market and our region managed barely more than 100,000 s.f. last
year on the heels of a below average 300,000 square foot in 2006.
With nearly 600,000 s.f. of new office product delivering during 2007, this minimal absorp-
tion led to a nearly 2% increase in overall market vacancy. While still healthy in the 10%
range, it marks the end of several consecutive years of
decreasing vacancy. This trend of increasing vacancy is
likely to continue into 2008 as speculative projects under
construction are more prevalent than in previous years.
Fortunately, these projects are spread across the region
and should be appropriately sized to meet the demand in
selected submarkets.
In a region bounded by water, land scarcity is continuing
to drive prices of the choicest remaining property sites even
higher. Combining this with higher construc-
tion costs is leading to unprecedented asking
rental rates for new projects both in the suburbs
and downtown. In most cases, new construc-
tion rents are more than 20% higher than rates
in existing class “A” buildings.
2 0 0 8 O F F I C E
General Overview
I
This trend of increasing vacancy is likely to continue into
2008 as speculative projects under construction are more
prevalent than in previous years. Fortunately, these projects
are spread across the region and should be appropriately
sized to meet the demand in selected submarkets.
HAMPTON ROADSReal Estate Market Review 2008
ODU-MarketReview2008-FINAL2:ODUMarketReview2005 2/14/08 11:53 AM Page 40

20
08
OF
FIC
E
41
BUILDING CLASSES
CLASS A: Most prestigious buildings competing forpremium office users with rents above the average forthe area. Buildings have high quality standard finishes,state of the art systems, exceptional accessibility and adefinite market presence. In addition, Class A Buildingsin this survey:
1. Command rents at the highest level.2. Were generally constructed since 1996 if low rise or since 1980 if high rise.3. Have interior appointments and standards representative of the top of the market.4. Are multi-story buildings with high quality exterior materials and landscaping.5. Are professionally managed and maintained.6. Are in an excellent location within the submarket.7. Offer building amenities such as food service, conference room, fitness center.
CLASS B: Buildings competing for a wide range of users with rents in the average range for the area. Building fin-ishes are fair to good for the area and systems are adequate, but the building does not compete with Class A at thesame price. In addition, Class B buildings in this survey:
1. Achieve rents generally $2-$3 below Class A buildings.2. Are primarily low-rise and flex-type properties, except in Downtown locations.3. Were generally constructed prior to 1996.4. Have good quality interior appointments and standards.5. Are professionally managed and maintained.6. Have good quality exterior materials.
CLASS C: Buildings competing for tenants requiring functional space at rents below the average for the area. Inaddition, Class C buildings in this survey:
1. Have rents at the lowest range of competitive office space; generally $4-5 below Class A buildings.2. Were constructed prior to 1986 and modestly maintained.3. Have systems and interior appointments that are dated.4. May not provide handicap access or meet other current building core requirements due to “grandfather” code
provisions.
REGION
Hampton Roads: The Hampton Roads region comprises the cities of Chesapeake, Norfolk, Portsmouth, Suffolk,Virginia Beach, and Isle of Wight County to the South; the cities of Hampton, Newport News, Poquoson, andWilliamsburg and the counties of Gloucester, James City, Mathews, and York to the north on the Virginia Peninsula;and Currituck County, North Carolina. Office properties in Chesapeake, Norfolk, Portsmouth, Suffolk, Virginia Beach,Hampton, Newport News, James City County, and York County are included in this report.
DEFINITIONS OF TERMS
Blackhawk building in Norfolk
ODU-MarketReview2008-FINAL2:ODUMarketReview2005 2/14/08 11:53 AM Page 41

42
2 0 0 8 O F F I C E
HAMPTON ROADSReal Estate Market Review 2008
MULTI-TENANT CLASS A, B, AND C
DOWNTOWN NORFOLK – By Class CLASS A CLASS B CLASS CAVG AVG AVG
NLA % Vac. RENT NLA % VAC RENT NLA % VAC RENT
Downtown Norfolk 1,690,129 5.83% $22.76 1,507,543 8.10% $17.91 96,552 0.00% $11.40
SOUTHSIDE – By Class CLASS A CLASS B CLASS C AVG AVG AVG
NLA % Vac. RENT NLA % VAC RENT NLA % VAC RENT
Airport/Northampton 176,000 1.45% $23.00 160,322 41.79% $15.11 22,020 0.00% $11.00
Central Norfolk N/A N/A N/A 877,352 21.17% $12.96 109,151 5.81% $11.84
Chesapeake/Greenbrier 997,478 8.76% $18.98 2,036,812 13.33% $14.68 42,423 0.00% $11.50
Corporate Landing N/A N/A N/A 69,756 8.57% $15.93 N/A N/A N/A
Hilltop/Oceanfront 132,677 4.47% $23.90 322,199 11.89% $15.51 10,360 0.00% $9.00
Kempsville 122,000 9.56% $19.00 320,000 3.56% $13.05 N/A N/A N/A
Little Neck N/A N/A N/A 502,436 4.92% $14.03 28,280 0.00% $11.76
Lynnhaven 865,599 11.02% $19.00 895,341 12.14% $13.78 N/A N/A N/A
Military Circle 216,531 6.00% $19.83 200,868 11.23% $16.24 66,129 18.34% $10.85
Newtown/Witchduck 1,089,399 6.33% $19.24 996,303 13.01% $14.80 18,000 0.00% $10.00
Pembroke/
Central Business District 984,975 4.46% $24.78 1,204,065 6.68% $15.55 35,592 0.00% $10.33
Portsmouth 88,327 22.74% $15.80 455,499 14.04% $14.90 20,340 0.00% $11.00
Suffolk 408,365 0.00% $11.00 517,449 6.89% $16.65 N/A N/A N/A
PENINSULA – By Class CLASS A CLASS B CLASS CAVG AVG AVG
NLA % Vac. RENT NLA % VAC RENT NLA % VAC RENT
Coliseum Central 211,664 12.02% $16.87 366,012 5.45% $10.64 N/A N/A N/A
Downtown Hampton 158,855 10.43% $18.00 47,738 10.16% $11.05 12,132 0.00% $10.00
Downtown Newport News N/A N/A N/A 135,864 22.08% $14.00 N/A N/A N/A
Hampton Roads Center 557,722 10.17% $18.40 503,268 12.37% $15.93 35,833 100.00% $9.81
Newmarket N/A N/A N/A 670,433 22.58% $15.66 150,000 0.00% $13.50
Oyster Point 1,477,085 12.56% $19.23 1,135,111 6.79% $13.11 80,650 10.16% $14.13
Suburban Newport News N/A N/A N/A 236,276 11.53% $12.28 48,000 0.00% $7.43
Williamsburg/James City/
York County 262,667 12.49% $19.77 355,221 5.16% $14.05 N/A N/A N/A
Table I
ODU-MarketReview2008-FINAL2:ODUMarketReview2005 2/14/08 11:53 AM Page 42

43
20
08
OF
FIC
E
CLASS A & B ONLY
DOWNTOWN NORFOLK - Class A & B YE 2006 YE 2007
AVG AVGSUBMARKET NLA % VAC RENT NLA % VAC RENT
Downtown Norfolk 3,217,672 7.74% $18.57 3,197,672 6.90% $20.33
SOUTHSIDE - Class A & B YE 2006 YE 2007AVG AVG
SUBMARKET NLA % VAC RENT NLA % VAC RENT
Airport/Northampton 298,287 12.91% $16.57 336,322 20.68% $19.24
Central Norfolk 875,352 15.86% $13.23 877,352 21.17% $12.96
Chesapeake/Greenbrier 2,931,412 10.54% $16.42 3,034,290 11.82% $16.83
Corporate Landing 69,756 0.00% $12.93 69,756 8.57% $15.93
Hilltop/Oceanfront 436,636 3.79% $18.79 454,876 9.72% $19.95
Kempsville 442,000 6.21% $15.82 442,000 5.22% $16.03
Little Neck 502,436 3.17% $13.96 502,436 4.92% $14.03
Lynnhaven 1,760,940 8.87% $16.15 1,760,940 12.14% $16.39
Military Circle 270,868 2.13% $16.48 417,399 13.92% $16.63
Newtown/Witchduck 2,092,452 7.20% $16.87 2,085,702 9.52% $17.12
Pembroke/Central Business District 2,288,040 3.94% $19.83 2,189,040 5.68% $19.70
Portsmouth 467,926 15.75% $15.35 543,926 15.45% $15.35
Suffolk 817,054 5.54% $13.87 925,814 3.90% $13.82
PENINSULA - Class A & B YE 2006 YE 2007
AVG AVGSUBMARKET NLA % VAC RENT NLA % VAC RENT
Coliseum Central 515,676 9.96% $13.44 577,676 7.85% $12.93
Downtown Hampton 206,593 9.47% $14.02 206,593 10.37% $16.40
Downtown Newport News 153,442 29.56% $14.00 135,864 22.08% $14.00
Hampton Roads Center 1,041,990 6.96% $16.62 1,060,990 7.05% $17.23
Newmarket 670,433 22.58% $15.78 670,433 22.58% $15.66
Oyster Point 2,578,584 4.83% $15.58 2,612,196 5.79% $16.68
Suburban Newport News 236,276 13.06% $11.70 236,276 11.53% $12.28
Williamsburg/James City/York County 533,221 3.16% $16.01 617,888 8.28% $16.48
Table II
ODU-MarketReview2008-FINAL2:ODUMarketReview2005 2/14/08 11:53 AM Page 43

44
Continued stability remained Downtown Norfolk’s trademark even though the numerical results were less than spectacular.The secret to Downtown’s success is that companies rarely leave once becoming accustomed to the pedestrian environmentwith amenities galore. This retention rate has led building owners to reinvest in their assets, renewing finishes and infra-structure with the promise of higher rents as vacancies remained low.
While the proposed mixed-use Wachovia Center is still more than two and a half years from delivering, its planned 22-storyoffice tower is already having its effect. With proposed rental rates above $30 per square foot (p.s.f), the new building willset a new high water mark for rents in the region and existing Downtown buildings are increasing rates to reflect this newfound “headroom.” For example, existing class “A” buildings 150 West Main, Dominion Tower and World Trade Center allincreased asking rates significantly in 2007, while class “B” buildings also increased rates.
Net absorption Downtown was flat in 2007, however leasing activity increased during the second half of the year. We areforecasting conditions to remain stable in 2008 with vacancy dropping further into the single digits.
HAMPTON ROADSReal Estate Market Review 2008
* weighted averages
Downtown Norfolk Market
2008 O F F I C E
DOWNTOWN NORFOLK MARKET OVERVIEW
NET LEASABLE % OF DOWNTOWNAREA (SQ. FT.) NORFOLK INVENTORY
Class A Multi-Tenant 1,690,129 40.6%
Class B Multi-Tenant 1,507,543 36.2%
Class C Multi-Tenant 96,552 2.3%
Subtotal Multi-Tenant 3,294,224 79.1%
Owner Occupied 869,950 20.9%
Total 4,164,174 100.0%
YE 2006* YE 2007*
AVG. RENT % VACANT AVG. RENT % VACANT
Class A $21.42 7.12% $22.76 5.83%
Class B $16.55 8.36% $17.91 8.10%
Class C $11.78 5.18% $11.40 0.00%
Total $18.33 7.63% $17.34 6.70%
A & B Only $18.57 7.70% $20.33 6.60%
The reported overall vacancy rate and average rents for the Downtown Norfolk by building class are as follows:
ODU-MarketReview2008-FINAL2:ODUMarketReview2005 2/14/08 11:53 AM Page 44

45
20
08
OF
FIC
E
Suburban vacancy increased in 2007 for the second consecutive year to just above 10% as new construction deliveries out-paced market demand. The few speculative projects delivering in 2007 captured the modest demand and achieved stabi-lized occupancy. Most noteworthy among these was the Convergence Center III (99,000 s.f.) in the Pembroke/CBD sub-market which reached 90% occupancy upon opening in the 4th quarter.
Among other significant new deliveries were the MAST One Building (60,000 s.f.) in the Tri-Cities area, the Gallery II (30,000 s.f.) in the Newtown/Witchduck submarket and the Circle South Building (32,000 s.f.) at Military Circle. Fortunately,2008 promises to be a more robust year in terms of new construction with a number of class “A” projects already in motionduring the first quarter.
While 2007 was a modest year in terms of net absorption, most of the growth was attributable to the Southside Suburbanlocations. As in recent years, however, activity was not evenly spread as gains in certain submarkets were offset by lossesin others. Chesapeake/Greenbrier remained a steady performing area buoyed by the largest lease transaction of the yearas American Funds (50,000 s.f. expansion) continued to grow in the Liberty Executive Park.
* weighted averages
Southside Suburban Market
SOUTHSIDE MARKET OVERVIEW
NET LEASABLE % OF SOUTHSIDEAREA (SQ. FT.) INVENTORY
Class A Multi-Tenant 5,081,351 32.7%
Class B Multi-Tenant 8,558,402 55.1%
Class C Multi-Tenant 352,295 2.3%
Subtotal Multi-Tenant 13,992,048 90.1%
Owner Occupied 1,533,325 9.9%
Total 15,525,373 100.0%
YE 2006* YE 2007*
AVG. RENT % VACANT AVG. RENT % VACANT
Class A $19.16 4.90% $19.77 7.48%
Class B $14.49 10.12% $14.66 13.02%
Class C $11.14 4.10% $11.14 2.68%
Total $16.08 8.07% $15.20 7.73%
A & B Only $16.22 8.18% $16.79 10.25%
The reported overall vacancy rate and average rents for the Southside by building class are as follows:
ODU-MarketReview2008-FINAL2:ODUMarketReview2005 2/14/08 11:53 AM Page 45
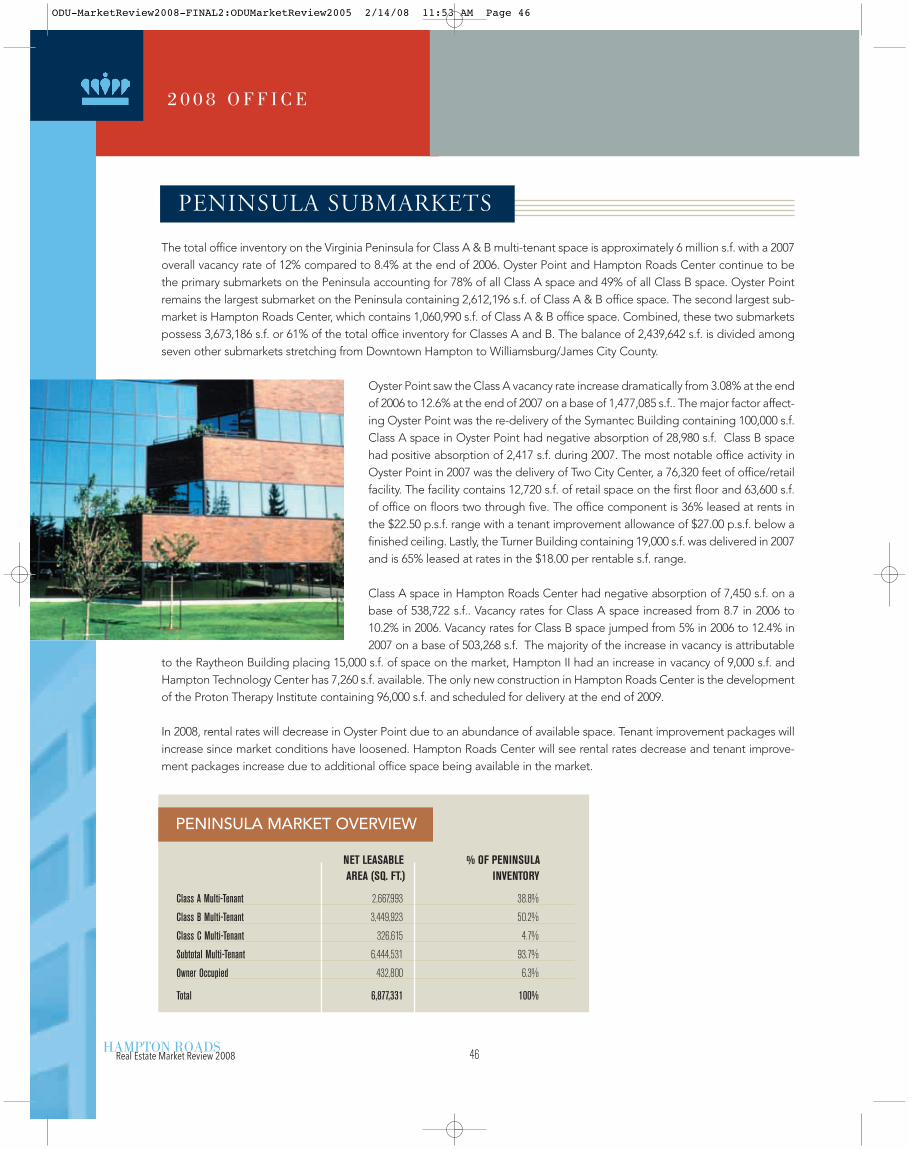
46
The total office inventory on the Virginia Peninsula for Class A & B multi-tenant space is approximately 6 million s.f. with a 2007overall vacancy rate of 12% compared to 8.4% at the end of 2006. Oyster Point and Hampton Roads Center continue to bethe primary submarkets on the Peninsula accounting for 78% of all Class A space and 49% of all Class B space. Oyster Pointremains the largest submarket on the Peninsula containing 2,612,196 s.f. of Class A & B office space. The second largest sub-market is Hampton Roads Center, which contains 1,060,990 s.f. of Class A & B office space. Combined, these two submarketspossess 3,673,186 s.f. or 61% of the total office inventory for Classes A and B. The balance of 2,439,642 s.f. is divided amongseven other submarkets stretching from Downtown Hampton to Williamsburg/James City County.
Oyster Point saw the Class A vacancy rate increase dramatically from 3.08% at the endof 2006 to 12.6% at the end of 2007 on a base of 1,477,085 s.f.. The major factor affect-ing Oyster Point was the re-delivery of the Symantec Building containing 100,000 s.f.Class A space in Oyster Point had negative absorption of 28,980 s.f. Class B spacehad positive absorption of 2,417 s.f. during 2007. The most notable office activity inOyster Point in 2007 was the delivery of Two City Center, a 76,320 feet of office/retailfacility. The facility contains 12,720 s.f. of retail space on the first floor and 63,600 s.f.of office on floors two through five. The office component is 36% leased at rents inthe $22.50 p.s.f. range with a tenant improvement allowance of $27.00 p.s.f. below afinished ceiling. Lastly, the Turner Building containing 19,000 s.f. was delivered in 2007and is 65% leased at rates in the $18.00 per rentable s.f. range.
Class A space in Hampton Roads Center had negative absorption of 7,450 s.f. on abase of 538,722 s.f.. Vacancy rates for Class A space increased from 8.7 in 2006 to10.2% in 2006. Vacancy rates for Class B space jumped from 5% in 2006 to 12.4% in2007 on a base of 503,268 s.f. The majority of the increase in vacancy is attributable
to the Raytheon Building placing 15,000 s.f. of space on the market, Hampton II had an increase in vacancy of 9,000 s.f. andHampton Technology Center has 7,260 s.f. available. The only new construction in Hampton Roads Center is the developmentof the Proton Therapy Institute containing 96,000 s.f. and scheduled for delivery at the end of 2009.
In 2008, rental rates will decrease in Oyster Point due to an abundance of available space. Tenant improvement packages willincrease since market conditions have loosened. Hampton Roads Center will see rental rates decrease and tenant improve-ment packages increase due to additional office space being available in the market.
HAMPTON ROADSReal Estate Market Review 2008
Peninsula Submarkets
2 0 0 8 O F F I C E
PENINSULA MARKET OVERVIEW
NET LEASABLE % OF PENINSULAAREA (SQ. FT.) INVENTORY
Class A Multi-Tenant 2,667,993 38.8%
Class B Multi-Tenant 3,449,923 50.2%
Class C Multi-Tenant 326,615 4.7%
Subtotal Multi-Tenant 6,444,531 93.7%
Owner Occupied 432,800 6.3%
Total 6,877,331 100%
ODU-MarketReview2008-FINAL2:ODUMarketReview2005 2/14/08 11:53 AM Page 46

47
2008O
FF
ICE
YE 2006* YE 2007*
AVG. RENT % VACANT AVG. RENT % VACANT
Class A $18.26 5.40% $18.85 11.53%
Class B $13.43 7.17% $13.80 12.02%
Class C $11.22 10.97% $12.23 22.03%
Total $15.24 6.64% $15.81 12.32%
A & B Only $15.46 6.40% $16.05 11.94%
The reported overall vacancy rate and average rents for the Peninsula by building class are as follows:
* weighted averages
ABSORPTION 2007
SUBMARKET # SF LEASABLE # SF LEASABLE SF VACANT SPACE VACANT SPACE VAC ABSORBTIONSPACE YE 2006 SPACE YE 2007 CHANGE YE 2006 YE 2007 CHANGE YE 07
Downtown Norfolk 3,314,224 3,294,224 20,000 252,991 220,598 32,393 12,393
Airport/Northampton 320,307 358,342 (38,035) 33,311 69,546 (36,235) 1,800
Central Norfolk 984,503 986,503 (2,000) 143,033 192,035 (49,002) (47,002)
Chesapeake/Greenbrier 2,973,835 3,076,713 (102,878) 308,978 358,753 (49,775) 53,103
Hilltop/Oceanfront 446,996 465,236 (18,240) 20,039 44,231 (24,192) (5,952)
Corporate Landing 69,756 69,756 0 0 5,978 (5,978) (5,978)
Kempsville 442,000 442,000 0 29,220 23,060 6,160 6,160
Lynnhaven 1,760,940 1,760,940 0 156,229 213,826 (57,597) (57,597)
Little Neck 530,716 530,716 0 15,939 24,731 (8,792) (8,792)
Military Circle 336,997 483,528 (146,531) 29,065 46,808 (17,743) 128,788
Newtown/Witchduck 2,110,452 2,103,702 6,750 266,309 328,235 (61,926) (68,676)
Pembroke/Central Business District 2,224,632 2,224,632 0 86,340 124,424 (38,084) (38,084)
Portsmouth 488,266 564,266 (76,000) 64,924 84,041 (19,117) 56,883
Suffolk 817,054 858,314 (41,260) 52,800 35,661 17,139 58,399
Downtown Hampton 218,725 218,725 0 22,565 21,415 1,150 1,150
Downtown Newport News 153,442 135,864 17,578 45,353 30,000 15,353 (2,225)
Hampton Roads Center 1,077,823 1,096,823 (19,000) 110,609 154,798 (44,189) (25,189)
Coliseum Central 515,676 577,676 (62,000) 52,921 45,376 7,545 69,545
Newmarket 820,433 820,433 0 151,400 151,400 0 -
Oyster Point 2,659,234 2,692,846 (33,612) 157,323 270,862 (113,539) (79,927)
Suburban Newport News 284,276 284,276 0 30,850 27,243 3,607 3,607
Williamsburg/James City/York County 533,221 617,888 (84,667) 16,834 51,166 (34,332) 50,335
Total 23,083,508 23,663,403 2,047,033 2,524,187 (477,154) 102,741
ODU-MarketReview2008-FINAL2:ODUMarketReview2005 2/14/08 11:53 AM Page 47

ODU-MarketReview2008-FINAL2:ODUMarketReview2005 2/14/08 11:53 AM Page 48

49
Southside
1 Airport/Northampton
2 Chesapeake/Greenbrier
3 Downtown Norfolk
4 Central Norfolk
5 Hilltop/Oceanfront
6 Corporate Landing
7 Kempsville
8 Little Neck
9 Lynnhaven
10 Military Circle
11 Newtown/Witchduck
12 N. Suffolk
13 Pembroke
14 Portsmouth
Peninsula
15 Downtown Hampton
16 Hampton Roads Center
17 Coliseum Central
18 Downtown Newport News
19 Newmarket
20 Oyster Point
21 Suburban Newport News
22 Williamsburg/James City Co./
York County
OFFICE SUBMARKETS
2008O
FF
ICE
ODU-MarketReview2008-FINAL2:ODUMarketReview2005 2/14/08 11:53 AM Page 49

50
2008 O F F I C E
HAMPTON ROADSReal Estate Market Review 2008
DOWNTOWN NORFOLK
CLASS A150 West Main Street . . . . . . . . . . . . . . . . . .226,183
Crown Center . . . . . . . . . . . . . . . . . . . . . . . . .62,000
Dominion Tower . . . . . . . . . . . . . . . . . . . . . . .403,276
Main Street Tower . . . . . . . . . . . . . . . . . . . . .200,000
Norfolk Southern Tower . . . . . . . . . . . . . . . . .301,463
Town Point Center . . . . . . . . . . . . . . . . . . . . .130,266
World Trade Center . . . . . . . . . . . . . . . . . . . .366,941
CLASS B101 Granby Street . . . . . . . . . . . . . . . . . . . . . .22,000
201 Granby Mall Building . . . . . . . . . . . . . . . . .76,071
345 W. Freemason . . . . . . . . . . . . . . . . . . . . .11,000
500 E. Main St. (Former SunTrust) . . . . . . . . .230,000
500 Plume Street . . . . . . . . . . . . . . . . . . . . . .60,000
Anders Williams Building . . . . . . . . . . . . . . . . .14,000
Bank of America . . . . . . . . . . . . . . . . . . . . . .339,892
City Centre . . . . . . . . . . . . . . . . . . . . . . . . . . .54,138
Duke Grace Building . . . . . . . . . . . . . . . . . . . . .26,417
Ghent-Olney Building . . . . . . . . . . . . . . . . . . . .24,000
Lonsdale Building . . . . . . . . . . . . . . . . . . . . . . .18,000
Monticello Arcade . . . . . . . . . . . . . . . . . . . . . .44,500
Monticello Office Building . . . . . . . . . . . . . . . . .70,000
Plume Center West . . . . . . . . . . . . . . . . . . . . .82,375
RBC Centura Tower . . . . . . . . . . . . . . . . . . . .111,600
Seaboard Center . . . . . . . . . . . . . . . . . . . . . . .30,000
St. Paul Building . . . . . . . . . . . . . . . . . . . . . . .47,308
Tazewell Building . . . . . . . . . . . . . . . . . . . . . . .38,000
The Helena Building . . . . . . . . . . . . . . . . . . . . .20,100
Towne Bank Building (109 E. Main St.) . . . . . . .52,698
Wainwright Building . . . . . . . . . . . . . . . . . . . . .83,151
York Street Center . . . . . . . . . . . . . . . . . . . . . .52,293
CLASS C220 West Freemason Street . . . . . . . . . . . . . . .10,775
255 Granby Street . . . . . . . . . . . . . . . . . . . . . .30,000
700 Boush Street . . . . . . . . . . . . . . . . . . . . . . .16,825
700 Monticello Avenue . . . . . . . . . . . . . . . . . . .22,760
Norfolk Community Services . . . . . . . . . . . . . . .16,192
OWNER OCCUPIEDAAA Headquarters . . . . . . . . . . . . . . . . . . .10,000
AT&T . . . . . . . . . . . . . . . . . . . . . . . . . . . .200,000
Atlantic Building . . . . . . . . . . . . . . . . . . . .14,000
Decker Building . . . . . . . . . . . . . . . . . . . . .10,000
Dominion Enterprises . . . . . . . . . . . . . . . . .220,000
Landmark Communications . . . . . . . . . . . .66,500
Norfolk Telcom Center . . . . . . . . . . . . . . . .60,000
Peta25,000
Standard Forms . . . . . . . . . . . . . . . . . . . . .30,000
Two Commercial Place . . . . . . . . . . . . . . .234,450
AIRPORT/
NORTHAMPTON
CLASS ATwin Oaks I . . . . . . . . . . . . . . . . . . . . . . . . . . .88,000
Twin Oaks II . . . . . . . . . . . . . . . . . . . . . . . . . .88,000
Circle South . . . . . . . . . . . . . . . . . . . . . . . . . . . .48,000
CLASS BAirport Executive Center . . . . . . . . . . . . . . . . . .70,609
HRSA-ILA Bldg (Longshoremen’s) . . . . . . . . . . .21,678
Northhampton Executive Center . . . . . . . . . . . .68,035
CLASS CElectrical Workers Corporation Office . . . . . . . . .22,020
OWNER OCCUPIEDCMA/CGM (USA) . . . . . . . . . . . . . . . . . . . .90,000
USAA Building . . . . . . . . . . . . . . . . . . . . .325,000
Zim-American Israeli Shipping . . . . . . . . . .30,000
CENTRAL NORFOLK
CLASS B5360 Robin Hood Road . . . . . . . . . . . . . . . . . .42,000
Almeda Business Center (flex) . . . . . . . . . . . . .84,000
Commerce Park Place(flex) . . . . . . . . . . . . . . .58,783
Gateway II(flex) . . . . . . . . . . . . . . . . . . . . . . . .45,000
Lafayette Executive Center . . . . . . . . . . . . . . . .18,641
Lawson Building . . . . . . . . . . . . . . . . . . . . . . .20,022
Norfolk Business Center (flex) . . . . . . . . . . . . .89,000
Norfolk Business Center II (flex) . . . . . . . . . . .126,926
Norfolk Commerce Center I(flex) . . . . . . . . . . . .73,000
Norfolk Commerce Center III(flex) . . . . . . . . . .168,000
Norfolk Commerce Center IV(flex) . . . . . . . . . . .79,980
Norfolk Commerce Center V(flex) . . . . . . . . . . .72,000
CLASS C4100 Building . . . . . . . . . . . . . . . . . . . . . . . . .20,614
Atlas Building . . . . . . . . . . . . . . . . . . . . . . . . .30,476
Blair Building . . . . . . . . . . . . . . . . . . . . . . . . . .15,000
Southern Office Building . . . . . . . . . . . . . . . . .11,061
Time Building . . . . . . . . . . . . . . . . . . . . . . . . .32,000
OWNER OCCUPIEDAmerican Funds Building . . . . . . . . . . . . . .107,000
CHESAPEAKE/
GREENBRIER
CLASS A1403 Greenbrier Parkway
(Gateway Bank) . . . . . . . . . . . . . . . . . . . .75,000
1434 Crossways Blvd . . . . . . . . . . . . . . . . . .111,000
BECO Corp HQ (609 Independence) . . . . . . . . .22,400
CHKD Health Center (Volvo Park VI) . . . . . . . . .25,000
Chubb Building . . . . . . . . . . . . . . . . . . . . . . . .97,500
Crossways Center . . . . . . . . . . . . . . . . . . . . . .52,702
Dendrite One . . . . . . . . . . . . . . . . . . . . . . . . . .50,000
Dendrite Two . . . . . . . . . . . . . . . . . . . . . . . . . .50,000
Greenbrier Tower I . . . . . . . . . . . . . . . . . . . . . .87,900
Greenbrier Tower II . . . . . . . . . . . . . . . . . . . . .86,976
HR Realtors Association Bldg
(638 Independence) . . . . . . . . . . . . . . . . .40,000
Lake Center I . . . . . . . . . . . . . . . . . . . . . . . . .60,000
Lake Center II . . . . . . . . . . . . . . . . . . . . . . . . .64,000
Liberty One . . . . . . . . . . . . . . . . . . . . . . . . . . .50,000
The following is a list of the properties included in this year’s survey.
ODU-MarketReview2008-FINAL2:ODUMarketReview2005 2/14/08 11:53 AM Page 50

51
Liberty Three . . . . . . . . . . . . . . . . . . . . . . . . . .75,000
Liberty Two . . . . . . . . . . . . . . . . . . . . . . . . . . .50,000
CLASS B1580 Crossways Blvd . . . . . . . . . . . . . . . . . . .10,800
737 Volvo Parkway . . . . . . . . . . . . . . . . . . . . .36,000
Atlantic Business Center . . . . . . . . . . . . . . . . .60,000
Battlefield Corporate Center . . . . . . . . . . . . . . .98,000
Battlefield Lakes Tech Center I . . . . . . . . . . . . .38,500
Battlefield Lakes Tech Center II . . . . . . . . . . . .29,000
Battlefield Lakes Tech Center III . . . . . . . . . . . .18,000
Battlefield Technology Center . . . . . . . . . . . . . .51,578
Battlefield Technology Center I . . . . . . . . . . . . .97,000
Battlefield Technology Center II (MCI) . . . . . . . .81,478
Branch Executive Quarter-Hamilton . . . . . . . . . .11,600
Branch Executive Quarter-Jefferson . . . . . . . . .23,838
Branch Executive Quarter-Madison . . . . . . . . . .16,788
Chelsea Commons WCMB . . . . . . . . . . . . . . . .12,400
Crossways Commerce Center I
(Office Annex) . . . . . . . . . . . . . . . . . . . . . . .45,000
Crossways Commerce Center II . . . . . . . . . . .145,300
Crossways I . . . . . . . . . . . . . . . . . . . . . . . . .137,007
Crossways II (flex) . . . . . . . . . . . . . . . . . . . . . .84,751
Crossways III . . . . . . . . . . . . . . . . . . . . . . . . .61,992
Eden North Center . . . . . . . . . . . . . . . . . . . . . .18,700
Greenbrier Business Center . . . . . . . . . . . . . . .50,000
Greenbrier Business Centre (flex) . . . . . . . . . . .91,561
Greenbrier Circle Corporate Center . . . . . . . . .233,138
Greenbrier I & II . . . . . . . . . . . . . . . . . . . . . . .58,276
Greenbrier Square . . . . . . . . . . . . . . . . . . . . . .26,250
Greenbrier Tech Center One (flex) . . . . . . . . . . .95,414
Greenbrier Tech Center Two (Flex) . . . . . . . . . .82,340
Heritage Bank Building . . . . . . . . . . . . . . . . . . .12,654
Independence Technology Center I . . . . . . . . . .98,000
Knells Ridge Plaza . . . . . . . . . . . . . . . . . . . . . .15,500
Knells Ridge Square . . . . . . . . . . . . . . . . . . . .30,000
Old Greenbrier Village . . . . . . . . . . . . . . . . . . . .34,015
Riverwalk Professional Bldg . . . . . . . . . . . . . . .10,000
Rose and Womble Business Center . . . . . . . . . .13,432
SunTrust Bank Building . . . . . . . . . . . . . . . . . .33,500
Volvo Park (Progressive Drive) . . . . . . . . . . . . .52,000
Volvo VII . . . . . . . . . . . . . . . . . . . . . . . . . . . . .13,000
Woodbrier Terrace . . . . . . . . . . . . . . . . . . . . . .10,000
CLASS C
2125 Smith Avenue . . . . . . . . . . . . . . . . . . . . .42,423
OWNER OCCUPIED
Cox Communications . . . . . . . . . . . . . . . .150,000
First Data . . . . . . . . . . . . . . . . . . . . . . . . . .42,557
Household Finance . . . . . . . . . . . . . . . . . . .60,000
Panasonic Call Center . . . . . . . . . . . . . . . . .55,000
Towers Perrin . . . . . . . . . . . . . . . . . . . . . .104,000
Volvo Penta . . . . . . . . . . . . . . . . . . . . . . . .25,000
HILLTOP/OCEANFRONT
CLASS APavilion Center (Towne Bank) . . . . . . . . . . . . . .85,177
Potter Professional Center . . . . . . . . . . . . . . . . .27,500
William E. Wood Building . . . . . . . . . . . . . . . . .20,000
CLASS B1092 Laskin Road . . . . . . . . . . . . . . . . . . . . . .18,240
1206 Laskin Road Executive Center . . . . . . . . .33,000
Beach Tower . . . . . . . . . . . . . . . . . . . . . . . . . .23,000
Birdneck Office Park . . . . . . . . . . . . . . . . . . . .10,182
Birdneck Square . . . . . . . . . . . . . . . . . . . . . . . .17,285
Colonial Mill Professional Center . . . . . . . . . . . .23,555
Damalas Centre . . . . . . . . . . . . . . . . . . . . . . . .16,900
First Colonial Office Park . . . . . . . . . . . . . . . . .18,000
General Booth Professional Center . . . . . . . . . .11,000
Gibson Pavilion . . . . . . . . . . . . . . . . . . . . . . . .30,000
Great Neck Professional Bldg. . . . . . . . . . . . . . .20,000
Heritage Commons . . . . . . . . . . . . . . . . . . . . .11,000
Hilltop West Executive Center . . . . . . . . . . . . . .23,000
Mill Dam Crossing . . . . . . . . . . . . . . . . . . . . . .22,037
Rudd Building . . . . . . . . . . . . . . . . . . . . . . . . .13,000
Sandpiper Key Associates Bldg. . . . . . . . . . . . .32,000
CLASS COceana East . . . . . . . . . . . . . . . . . . . . . . . . . .10,360
CORPORATE LANDING
CLASS BPrincess Anne Executive Park . . . . . . . . . . . . .59,756
Verizon Building . . . . . . . . . . . . . . . . . . . . . . . .10,000
OWNER OCCUPIEDAl-Anon . . . . . . . . . . . . . . . . . . . . . . . . . . .30,000
Approved Financial . . . . . . . . . . . . . . . . . . .30,000
GEICO . . . . . . . . . . . . . . . . . . . . . . . . . . .250,000
KEMPSVILLE
CLASS AChadwick Building . . . . . . . . . . . . . . . . . . . . . .80,000
Grayson Building . . . . . . . . . . . . . . . . . . . . . . .42,000
CLASS B1201 Lake James Office . . . . . . . . . . . . . . . . .12,000
3386 Holland Road . . . . . . . . . . . . . . . . . . . . .20,000
5301 Providence Road (Providence South) . . . .12,000
Arrowhead Office Court . . . . . . . . . . . . . . . . . .10,000
Atrium of College Park Square . . . . . . . . . . . . .36,379
Central Park I (552 Central Dr) . . . . . . . . . . . . .18,000
Central Park II (544 Central) . . . . . . . . . . . . . .43,000
College Park Square III . . . . . . . . . . . . . . . . . .30,150
Courtyard at Providence . . . . . . . . . . . . . . . . . .17,879
Fairfield Square . . . . . . . . . . . . . . . . . . . . . . . .12,933
Holland South . . . . . . . . . . . . . . . . . . . . . . . . .14,843
Holland/Taft Professional Center . . . . . . . . . . . .11,850
Kempsville Office Park . . . . . . . . . . . . . . . . . . .30,722
Oxford Square . . . . . . . . . . . . . . . . . . . . . . . . .13,544
Woolpert Building . . . . . . . . . . . . . . . . . . . . . .36,700
LYNNHAVEN
CLASS AAMSEC Park West . . . . . . . . . . . . . . . . . . . . . .66,180
Lynnhaven Commons (office bldg) . . . . . . . . . .26,000
Lynnhaven Commons Complex . . . . . . . . . . . . .25,000
Lynnwood Plaza . . . . . . . . . . . . . . . . . . . . . . . .87,157
2008O
FF
ICE
ODU-MarketReview2008-FINAL2:ODUMarketReview2005 2/14/08 11:53 AM Page 51

52
2008 O F F I C E
HAMPTON ROADSReal Estate Market Review 2008
Marsh Landing . . . . . . . . . . . . . . . . . . . . . . . . .62,117
Oceana Center One . . . . . . . . . . . . . . . . . . . . .39,928
Oceana Place . . . . . . . . . . . . . . . . . . . . . . . . .75,369
Pinehurst Centre . . . . . . . . . . . . . . . . . . . . . .103,000
Reflections I . . . . . . . . . . . . . . . . . . . . . . . . . .62,924
Reflections II . . . . . . . . . . . . . . . . . . . . . . . . . .73,676
Reflections III . . . . . . . . . . . . . . . . . . . . . . . . . .67,000
Reflections IV . . . . . . . . . . . . . . . . . . . . . . . . .80,000
Viking Building . . . . . . . . . . . . . . . . . . . . . . . .18,900
Windwood Center . . . . . . . . . . . . . . . . . . . . . .78,348
CLASS B2700 Internation Parkway . . . . . . . . . . . . . . . . .53,000
596 Lynnhaven Pkwy. . . . . . . . . . . . . . . . . . . .31,910
Advanced Technology Building . . . . . . . . . . . . .32,000
Basgier Bldg. I . . . . . . . . . . . . . . . . . . . . . . . . .18,200
Basgier Bldg. II . . . . . . . . . . . . . . . . . . . . . . . .20,000
Bennett Office Building
(120 S. Lynnhaven) . . . . . . . . . . . . . . . . . .10,522
Commercial Place . . . . . . . . . . . . . . . . . . . . . .36,400
Gateway Bank Building (641 Lynnhaven) . . . . . .18,000
Lynnhaven Corporate Center I . . . . . . . . . . . . . .36,046
Lynnhaven Corporate Center II . . . . . . . . . . . . .40,300
Lynnhaven Executive Center . . . . . . . . . . . . . . .18,000
Lynnhaven Five . . . . . . . . . . . . . . . . . . . . . . . .24,549
Lynnhaven North . . . . . . . . . . . . . . . . . . . . . . .10,000
Lynnhaven Professional Center . . . . . . . . . . . . .12,000
Lynnhaven Station . . . . . . . . . . . . . . . . . . . . . .26,226
Parkway Center 3 and 4 . . . . . . . . . . . . . . . . .64,567
Parkway Center I & II . . . . . . . . . . . . . . . . . . .32,112
Parkway III (Unisys) . . . . . . . . . . . . . . . . . . . .50,428
Parkway West (flex) . . . . . . . . . . . . . . . . . . . .41,563
RBM Building . . . . . . . . . . . . . . . . . . . . . . . . . .14,170
Sabre Street I . . . . . . . . . . . . . . . . . . . . . . . . .68,000
Sabre Street II . . . . . . . . . . . . . . . . . . . . . . . .60,000
Sabre Street III . . . . . . . . . . . . . . . . . . . . . . . .40,000
Sabre Street IV . . . . . . . . . . . . . . . . . . . . . . . .40,000
South Lynnhaven Business Park . . . . . . . . . . . .40,000
U.S. Commerce Center
(Tidewater Tech) . . . . . . . . . . . . . . . . . . . .26,819
Yorktown Commerce Center
(228 N. Lynnhaven) . . . . . . . . . . . . . . . . .30,529
OWNER OCCUPIEDCenit Bank Bldg . . . . . . . . . . . . . . . . . . . .40,000
Eastern . . . . . . . . . . . . . . . . . . . . . . . . . .32,000
Global Technical Systems . . . . . . . . . . . . .46,000
Hall Automotive . . . . . . . . . . . . . . . . . . . .29,865
SAIC . . . . . . . . . . . . . . . . . . . . . . . . . . . .60,000
LITTLE NECK
CLASS B101 North Lynnhaven (Lynnhaven Station) . . . . .28,000
3300 Building (Virginia Beach Blvd.) . . . . . . . . .11,000
King’s Grant Office Building . . . . . . . . . . . . . . .13,000
Little Neck Office Park (3300 Bldg) . . . . . . . . .33,000
Little Neck Office Park (3300 South) . . . . . . . .50,000
Little Neck Office Park (3400 Bldg) . . . . . . . . .22,000
Little Neck Towers . . . . . . . . . . . . . . . . . . . . . .48,860
NEXCOM Building . . . . . . . . . . . . . . . . . . . . . .75,000
NEXCOM Expansion . . . . . . . . . . . . . . . . . . . . .18,000
Plaza Trail Office Building . . . . . . . . . . . . . . . . .15,975
Rose Hall Commons . . . . . . . . . . . . . . . . . . . .12,266
Rose Hall Professional Center . . . . . . . . . . . . . .20,000
Rosemont Interstate Center I . . . . . . . . . . . . . .41,400
Rosemont Interstate Center II . . . . . . . . . . . . . .51,835
Rosemont Interstate Center III* . . . . . . . . . . . .38,000
Sun Building . . . . . . . . . . . . . . . . . . . . . . . . . .11,600
Transouth Building (3615 VB Blvd) . . . . . . . . . .12,500
CLASS CBirchwood Office Park . . . . . . . . . . . . . . . . . . .11,688
Byler Building . . . . . . . . . . . . . . . . . . . . . . . . .16,592
OWNER OCCUPIEDTAF Group . . . . . . . . . . . . . . . . . . . . . . .24,000
MILITARY CIRCLE
CLASS APortfolio Recovery Bldg (140 Corporate Blvd) . . . . 25,002
Riverside Commerce Center (120 Corporate Blvd.)70,000
Riverside Corporate Center . . . . . . . . . . . . . . . . .86,682
Riverside Crossing (130 Corporate Blvd) . . . . . . .34,847
CLASS BCentura Bank Building . . . . . . . . . . . . . . . . . . .40,442
Circle East . . . . . . . . . . . . . . . . . . . . . . . . . . . .41,047
College Park Executive Center . . . . . . . . . . . . .20,000
I.T.T. Building . . . . . . . . . . . . . . . . . . . . . . . . . .49,379
FBI Building . . . . . . . . . . . . . . . . . . . . . . . . . .50,000
CLASS CExecutive Office - Janaf . . . . . . . . . . . . . . . . . .28,800
Janaf Office Building . . . . . . . . . . . . . . . . . . . .37,329
OWNER OCCUPIEDSentara . . . . . . . . . . . . . . . . . . . . . . . . . . .45,000
Union Mission (former VA Natural Gas) . . . .75,403
NEWTOWN/WITCHDUCK
CLASS AAAA Headquarters . . . . . . . . . . . . . . . . . . . . . .47,045
Amelia Building . . . . . . . . . . . . . . . . . . . . . . . .64,660
Amerigroup Building I . . . . . . . . . . . . . . . . . .106,000
Amerigroup Building II . . . . . . . . . . . . . . . . . .106,000
BB&T Building . . . . . . . . . . . . . . . . . . . . . . . . .30,000
Expressway Corporate Center . . . . . . . . . . . . . .85,658
Gallery I . . . . . . . . . . . . . . . . . . . . . . . . . . . . .30,000
Greenwich Center . . . . . . . . . . . . . . . . . . . . . .56,000
Greenwich Commons . . . . . . . . . . . . . . . . . . . .55,000
Greenwich Station . . . . . . . . . . . . . . . . . . . . . .29,000
Halifax Building . . . . . . . . . . . . . . . . . . . . . . . .71,100
Mass Mutual Building . . . . . . . . . . . . . . . . . . .45,500
Smithfield Building . . . . . . . . . . . . . . . . . . . . .145,000
Verizon Center . . . . . . . . . . . . . . . . . . . . . . . .135,000
Westmoreland Building . . . . . . . . . . . . . . . . . .83,436
CLASS B144 Business Park Drive . . . . . . . . . . . . . . . . . .17,000
168 Business Park Drive . . . . . . . . . . . . . . . . .19,300
ODU-MarketReview2008-FINAL2:ODUMarketReview2005 2/14/08 11:53 AM Page 52

53
2008O
FF
ICE
184 Business Park Drive . . . . . . . . . . . . . . . . . .27,784
209 Business Park Drive . . . . . . . . . . . . . . . . .11,250
232 Business Park Drive . . . . . . . . . . . . . . . . .14,000
396 Witchduck Road . . . . . . . . . . . . . . . . . . . .12,000
6330 Newtown Road . . . . . . . . . . . . . . . . . . . .55,181
American Teleservices Building . . . . . . . . . . . . .12,232
Azalea Village . . . . . . . . . . . . . . . . . . . . . . . . .20,000
BCF Building . . . . . . . . . . . . . . . . . . . . . . . . . .24,000
BPC Building . . . . . . . . . . . . . . . . . . . . . . . . . .29,074
Colonial Corporate Center . . . . . . . . . . . . . . . . .41,772
Commerce Centre (200-259 Expressway Ct) . . .35,500
Commonwealth Building . . . . . . . . . . . . . . . . . .10,000
Executive Cove . . . . . . . . . . . . . . . . . . . . . . . .61,000
Interstate Corporate Center . . . . . . . . . . . . . . .430,000
Parliament Drive Professional Bldg . . . . . . . . . .10,000
TRC Center I . . . . . . . . . . . . . . . . . . . . . . . . . .62,000
TRC Center II . . . . . . . . . . . . . . . . . . . . . . . . .36,884
TRC Center III . . . . . . . . . . . . . . . . . . . . . . . . .52,000
Witchduck Crossing . . . . . . . . . . . . . . . . . . . . .15,326
CLASS CWitchduck Office Court . . . . . . . . . . . . . . . . . .18,000
OWNER OCCUPIEDCopy Data (Ikon) . . . . . . . . . . . . . . . . . . . . .20,000
Cox Cable Building . . . . . . . . . . . . . . . . . . .45,000
Cox Expansion . . . . . . . . . . . . . . . . . . . . . .25,000
Lendman . . . . . . . . . . . . . . . . . . . . . . . . . .10,000
Newtown Square . . . . . . . . . . . . . . . . . . . . .78,000
PEMBROKE/
CENTRAL BUSINESS
DISTRICT
CLASS A249 Central Park Avenue . . . . . . . . . . . . . . . . .59,000
Convergence Center . . . . . . . . . . . . . . . . . . . . .85,000
Convergence Center II . . . . . . . . . . . . . . . . . . .85,000
Five Columbus Center . . . . . . . . . . . . . . . . . . .20,000
One Columbus Center . . . . . . . . . . . . . . . . . .134,000
Pembroke Commercial Bldg.
(4425 Corporation Lane) . . . . . . . . . . . . . .70,760
Resource Bank Plaza . . . . . . . . . . . . . . . . . . . .90,315
Six Columbus Center . . . . . . . . . . . . . . . . . . . .36,000
Southport Center . . . . . . . . . . . . . . . . . . . . . . .65,000
Ticketmaster . . . . . . . . . . . . . . . . . . . . . . . . . .30,000
Town Center (222 Central Park) . . . . . . . . . . .256,900
Town Center North Tower . . . . . . . . . . . . . . . . .53,000
CLASS BVST Building . . . . . . . . . . . . . . . . . . . . . . . . .25,000
4224 Holland Road . . . . . . . . . . . . . . . . . . . . .10,104
4701 Columbus . . . . . . . . . . . . . . . . . . . . . . . .32,000
4705 Columbus St . . . . . . . . . . . . . . . . . . . . . .33,000
4801 Columbus St . . . . . . . . . . . . . . . . . . . . .40,000
Corporate Center I . . . . . . . . . . . . . . . . . . . . . .51,000
Corporate Center II . . . . . . . . . . . . . . . . . . . . . .52,475
Corporate Center III . . . . . . . . . . . . . . . . . . . . .51,000
Corporate Center IV . . . . . . . . . . . . . . . . . . . . .76,012
Dragas Office Park . . . . . . . . . . . . . . . . . . . . .30,896
Haygood Executive Park . . . . . . . . . . . . . . . . . .36,472
Holland Commerce Center . . . . . . . . . . . . . . . .30,000
Holland Office Park . . . . . . . . . . . . . . . . . . . . .32,000
Holland Plaza Office Building . . . . . . . . . . . . . .14,513
Independence Business Center . . . . . . . . . . . . .62,000
Independence Technology Center -
Technocenter I . . . . . . . . . . . . . . . . . . . . .50,000
Independent Plaza . . . . . . . . . . . . . . . . . . . . . .36,655
Larkspur Village . . . . . . . . . . . . . . . . . . . . . . . .16,184
Old Donation Executive Park . . . . . . . . . . . . . . .20,347
Pembroke Office Park . . . . . . . . . . . . . . . . . .294,000
Pocahontas Center . . . . . . . . . . . . . . . . . . . . . .17,800
Prism Plaza . . . . . . . . . . . . . . . . . . . . . . . . . . .32,000
Southgate Centre . . . . . . . . . . . . . . . . . . . . . . .43,200
Southport Business Center(flex)
(Baskin Bldg) . . . . . . . . . . . . . . . . . . . . . .20,683
Southport Trade Center(flex) . . . . . . . . . . . . . . .30,883
Thalia One . . . . . . . . . . . . . . . . . . . . . . . . . . . .18,408
Thalia Professional Center . . . . . . . . . . . . . . . . .15,000
The Meadows . . . . . . . . . . . . . . . . . . . . . . . . .32,433
CLASS CBeacon Building (VA Pilot) . . . . . . . . . . . . . . . .13,200
Haygood Buildings . . . . . . . . . . . . . . . . . . . . . .22,392
OWNER OCCUPIEDAlantec Financial Fed Credit Union . . . . . . .12,000
AVIS . . . . . . . . . . . . . . . . . . . . . . . . . . . .168,000
Coastal Training Technologies . . . . . . . . . . .60,000
Commonwealth College . . . . . . . . . . . . . . .30,000
Electronic Systems Building . . . . . . . . . . . .10,000
ISC 40,000
QED Building . . . . . . . . . . . . . . . . . . . . . . .30,000
REIN Building . . . . . . . . . . . . . . . . . . . . . .24,500
PORTSMOUTH
CLASS ABB&T Building (500 Crawford) . . . . . . . . . . . . .35,327
Harbourfront Corporate Center (801 Water St) . .53,000
CLASS B307 County Street . . . . . . . . . . . . . . . . . . . . . .13,475
355 Crawford Street Building . . . . . . . . . . . . . .79,367
600 Crawford Street . . . . . . . . . . . . . . . . . . . . .16,171
Boyette Professional Center . . . . . . . . . . . . . . .13,000
Bristol Square . . . . . . . . . . . . . . . . . . . . . . . . .10,800
JJH Building . . . . . . . . . . . . . . . . . . . . . . . . . .17,563
New Kirn Building . . . . . . . . . . . . . . . . . . . . . .44,000
Port Trade Center . . . . . . . . . . . . . . . . . . . . . . .14,223
PortCentre I (flex) . . . . . . . . . . . . . . . . . . . . .100,000
The Seaboard Building . . . . . . . . . . . . . . . . . . . .65,000
Towne Bank Building (200 High St) . . . . . . . . .34,000
Wachovia Bank . . . . . . . . . . . . . . . . . . . . . . . .48,000
CLASS CCrawford Executive Center . . . . . . . . . . . . . . . .20,340
SUFFOLK
CLASS AJTASC Building . . . . . . . . . . . . . . . . . . . . . . .408,365
CLASS BBridgeway Technology Center I . . . . . . . . . . . .125,000
Bridgeway Technology Center II . . . . . . . . . . . . .67,500
ODU-MarketReview2008-FINAL2:ODUMarketReview2005 2/14/08 11:53 AM Page 53

54
2 0 0 8 O F F I C E
HAMPTON ROADSReal Estate Market Review 2008
Bridgeway Technology Center III . . . . . . . . . . . .72,384
Brinkley Building . . . . . . . . . . . . . . . . . . . . . . .20,500
Brinkley Building II . . . . . . . . . . . . . . . . . . . . . . .21,000
Harbor View Professional Center
(1033 & 1035) . . . . . . . . . . . . . . . . . . . . . .23,000
Harbour Breeze Professional Center . . . . . . . . .52,265
Lake View Technology GSA Center . . . . . . . . .110,000
Main Street Center . . . . . . . . . . . . . . . . . . . . .13,800
Washington Street Center . . . . . . . . . . . . . . . . .12,000
OWNER OCCUPIEDLockheed Martin . . . . . . . . . . . . . . . . . . . .50,000
Overton Building . . . . . . . . . . . . . . . . . . . . .12,940
Rose & Womble Building . . . . . . . . . . . . . .15,000
Towne Bank Center . . . . . . . . . . . . . . . . . .50,000
DOWNTOWN HAMPTON
CLASS AHarbour Centre . . . . . . . . . . . . . . . . . . . . . . .158,855
CLASS B10-16 W. Queens Way . . . . . . . . . . . . . . . . . .11,238
47 W. Queens Way . . . . . . . . . . . . . . . . . . . . .12,500
Mill Point Center . . . . . . . . . . . . . . . . . . . . . . .10,000
One Mallory Street . . . . . . . . . . . . . . . . . . . . . .14,000
CLASS C55 W. Queens Way . . . . . . . . . . . . . . . . . . . . .12,132
DOWNTOWN
NEWPORT NEWS
CLASS B2600 Building . . . . . . . . . . . . . . . . . . . . . . . .118,018
Wachovia Bank Building . . . . . . . . . . . . . . . . . .17,846
OWNER OCCUPIEDNewport News Shipbuilding,
Bldg 520-521 . . . . . . . . . . . . . . . . . . . .50,000
HAMPTON ROADS
CENTER
CLASS A1001 N Campus Parkway . . . . . . . . . . . . . . . . .19,000
6 Manhattan Square . . . . . . . . . . . . . . . . . . . .30,106
Allstate Building . . . . . . . . . . . . . . . . . . . . . . . .17,000
HealthNet Building . . . . . . . . . . . . . . . . . . . . . .60,482
Lakefront Plaza I . . . . . . . . . . . . . . . . . . . . . . .77,442
Morgan Marrow Building . . . . . . . . . . . . . . . . .12,000
Olympia Place . . . . . . . . . . . . . . . . . . . . . . . . .72,395
Oxford Plaza . . . . . . . . . . . . . . . . . . . . . . . . . .64,297
Parkway Executive Center . . . . . . . . . . . . . . . .45,000
Research Quad - Building One . . . . . . . . . . . . .60,000
Research Quad - Building Three . . . . . . . . . . .100,000
CLASS B400 Butler Farm Road . . . . . . . . . . . . . . . . . . .96,446
404 Butler Farm Road . . . . . . . . . . . . . . . . . . .54,715
Hampton I . . . . . . . . . . . . . . . . . . . . . . . . . . . .68,532
Hampton II . . . . . . . . . . . . . . . . . . . . . . . . . . .67,000
Hampton III . . . . . . . . . . . . . . . . . . . . . . . . . . .45,000
Hampton Technology Center I . . . . . . . . . . . . . .56,575
NDS Building . . . . . . . . . . . . . . . . . . . . . . . . .35,000
Raytheon . . . . . . . . . . . . . . . . . . . . . . . . . . . .50,000
Research Office Building . . . . . . . . . . . . . . . . .30,000
CLASS C3217 Armistead Avenue . . . . . . . . . . . . . . . . . .24,043
NASA Langley Research Center . . . . . . . . . . . .11,790
COLISEUM CENTRAL
CLASS AExecutive Tower . . . . . . . . . . . . . . . . . . . . . . .134,164
Pinewood Plaza . . . . . . . . . . . . . . . . . . . . . . . .77,500
CLASS B2115 Executive Drive . . . . . . . . . . . . . . . . . . . . .62,000
2310 Tower Place . . . . . . . . . . . . . . . . . . . . . .10,500
Bank of America Building . . . . . . . . . . . . . . . . .14,434
Colony Square of Hampton . . . . . . . . . . . . . . .30,050
Riverdale Complex . . . . . . . . . . . . . . . . . . . . .168,000
Sheraton Office Bldg. . . . . . . . . . . . . . . . . . . . .12,673
Todds Lane Professional Center . . . . . . . . . . . .12,500
West Telemarketing . . . . . . . . . . . . . . . . . . . . .55,855
OWNER OCCUPIEDLangley Federal Credit Union . . . . . . . . . . . .72,800
NEWMARKET
CLASS BNetCenter . . . . . . . . . . . . . . . . . . . . . . . . . . .546,171
Newmarket Building . . . . . . . . . . . . . . . . . . . . .21,262
UPS Call Center . . . . . . . . . . . . . . . . . . . . . . .103,000
CLASS CRouse Tower . . . . . . . . . . . . . . . . . . . . . . . . .150,000
OWNER OCCUPIEDNN Shipbuilding Employee Credit Union . . . . . .15,000
OYSTER POINT
CLASS A601 Thimble Shoals Boulevard . . . . . . . . . . . . .30,000
Atrium At Oyster Point . . . . . . . . . . . . . . . . . .62,971
Cedar One . . . . . . . . . . . . . . . . . . . . . . . . . . . .15,467
Contemporary Cybernetics . . . . . . . . . . . . . . . .60,000
Ferguson Corporate Center II . . . . . . . . . . . . .150,000
Fountain Plaza One . . . . . . . . . . . . . . . . . . . .100,000
Fountain Plaza Three . . . . . . . . . . . . . . . . . . . .80,000
Fountain Plaza Two . . . . . . . . . . . . . . . . . . . . .80,000
Langley Federal Centre . . . . . . . . . . . . . . . . . .51,982
Merchants Walk . . . . . . . . . . . . . . . . . . . . . . . .28,000
One City Center . . . . . . . . . . . . . . . . . . . . . . . .70,000
One Oyster Point . . . . . . . . . . . . . . . . . . . . . . .36,226
Oyster Point Interstate Center . . . . . . . . . . . . . .64,000
Patrick Henry Corporate Center . . . . . . . . . . . .98,883
Peninsula Professional Building . . . . . . . . . . . .30,800
Rock Landing Corporate Center II . . . . . . . . . . .33,476
SunTrust Building . . . . . . . . . . . . . . . . . . . . . .100,955
ODU-MarketReview2008-FINAL2:ODUMarketReview2005 2/14/08 11:53 AM Page 54

55
20
08
OF
FIC
E
Disclaimer: The information in this report is deemed reliable. Old Dominion University Real Estate Center makes no representationor warranty as to its accuracy.
BOLD indicates change/addition from last year
Symantec Corp. Building . . . . . . . . . . . . . . . .100,000
Tower Park (733 &735 Thimble Shoals) . . . . . .31,667
TowneBank Center . . . . . . . . . . . . . . . . . . . . . .60,000
Turner Bldg (1060 Loftis) . . . . . . . . . . . . . . . . . .21,000
Two City Center . . . . . . . . . . . . . . . . . . . . . . . . .63,600
Two Oyster Point . . . . . . . . . . . . . . . . . . . . . . .39,137
Wachovia Building . . . . . . . . . . . . . . . . . . . . . .42,921
William E Wood Building (1030 Loftis) . . . . . . .26,000
CLASS B11790 Jefferson Avenue . . . . . . . . . . . . . . . . . .20,662
745 Bluecrab (flex) . . . . . . . . . . . . . . . . . . . . .16,000
BB&T Plaza (603 Pilot House) . . . . . . . . . . . . .37,348
Cale Colony 17 . . . . . . . . . . . . . . . . . . . . . . . . .17,000
Canon Place . . . . . . . . . . . . . . . . . . . . . . . . . .26,000
Comb-Bay Park . . . . . . . . . . . . . . . . . . . . . . . .32,000
Dunwoody Place . . . . . . . . . . . . . . . . . . . . . . .19,798
Executive Center . . . . . . . . . . . . . . . . . . . . . . .95,399
Fishing Point Complex(flex) . . . . . . . . . . . . . . .50,000
International Distribution Center . . . . . . . . . . . .36,000
McCale Professional Park . . . . . . . . . . . . . . . . .40,000
Middle Ground Business Center . . . . . . . . . . . .62,000
Oyster Point Business Center . . . . . . . . . . . . . .25,000
Oyster Point Center . . . . . . . . . . . . . . . . . . . . .44,000
Oyster Point Place (flex) . . . . . . . . . . . . . . . . .38,000
Oyster Point West . . . . . . . . . . . . . . . . . . . . .176,560
Park Central Executive Center . . . . . . . . . . . . . .54,425
Park Place (751 & 753 Thimble Shoals) . . . . . .25,000
Peninsula Business Center I (flex) . . . . . . . . . . .21,817
Peninsula Business Centre II (flex) . . . . . . . . . .40,475
Peninsula Business Centre III (flex) . . . . . . . . .60,000
Rock Landing Corporate Center IV . . . . . . . . . . .18,125
Rock Landing Corporate Center V . . . . . . . . . . .18,125
Technology Center (flex) . . . . . . . . . . . . . . . . .81,000
Thimble Shoals Business Center (flex) . . . . . . . .55,377
Thimble Shores Lakefront . . . . . . . . . . . . . . . . .25,000
CLASS C714-716-718 J.Clyde Morris Blvd. . . . . . . . . . . .15,000
Drucker & Falk Building . . . . . . . . . . . . . . . . . .30,000
Pilgrim Landing . . . . . . . . . . . . . . . . . . . . . . . .10,650
Regent Park . . . . . . . . . . . . . . . . . . . . . . . . . .25,000
OWNER OCCUPIEDApplied Research Center . . . . . . . . . . . . . .121,000
Fountain Plaza Two . . . . . . . . . . . . . . . . . .80,000
Muller Martini Building . . . . . . . . . . . . . . . .24,000
Peninsula Retail Credit . . . . . . . . . . . . . . . .30,000
SUBURBAN
NEWPORT NEWS
CLASS BBay Savings Bank Building . . . . . . . . . . . . . . . .18,000
Colony Square of Denbigh II . . . . . . . . . . . . . . .26,100
Denbigh Professional Park . . . . . . . . . . . . . . . .40,598
Ferguson Enterprises . . . . . . . . . . . . . . . . . . . .75,800
MCI Building . . . . . . . . . . . . . . . . . . . . . . . . . .60,000
Tidewater Tech (616 Denbigh Blvd) . . . . . . . . . .15,778
CLASS CMariner Building . . . . . . . . . . . . . . . . . . . . . . .26,000
Teagle Building . . . . . . . . . . . . . . . . . . . . . . . .22,000
OWNER OCCUPIED
CNU Building . . . . . . . . . . . . . . . . . . . . . . .40,000
WILLIAMSBURG/
JAMES CITY/
YORK COUNTY
CLASS A263 McLaws Circle . . . . . . . . . . . . . . . . . . . . . . .26,967
Atrium Building . . . . . . . . . . . . . . . . . . . . . . . .24,000
Casey New Town - SunTrust . . . . . . . . . . . . . . .60,000
Courthouse Green Office Park II . . . . . . . . . . . .10,000
Design Center (4350 New Town Ave) . . . . . . . . .13,700
First Union Center . . . . . . . . . . . . . . . . . . . . . .32,000
Langley Federal Credit Union . . . . . . . . . . . . . .20,000
Patriot Park Business Center . . . . . . . . . . . . . . . .24,000
William E. Wood Building . . . . . . . . . . . . . . . . . . .20,000
Williamsburg Commerce Center . . . . . . . . . . . .32,000
CLASS B104 Bypass Road . . . . . . . . . . . . . . . . . . . . . . .11,100
7601 George Washington Memorial Highway . . .10,000
Chartertowne Professional Center . . . . . . . . . . .12,800
Greens Springs Office Park . . . . . . . . . . . . . . . .37,000
Kristinsand Office Park . . . . . . . . . . . . . . . . . . .15,221
Packets Executive Center . . . . . . . . . . . . . . . . .23,000
Quarterland Commons Office Condos . . . . . . .120,000
Rivergate Center . . . . . . . . . . . . . . . . . . . . . . .36,000
Wachovia Bank . . . . . . . . . . . . . . . . . . . . . . . .10,500
Williamsburg Office Park . . . . . . . . . . . . . . . . .79,600
ODU-MarketReview2008-FINAL2:ODUMarketReview2005 2/14/08 11:53 AM Page 55

56HAMPTON ROADSReal Estate Market Review 2008
ODU-MarketReview2008-FINAL2:ODUMarketReview2005 2/14/08 11:53 AM Page 56

57
AuthorBea HopkinsDirectorResidential DataBank
Data Analysis/LayoutBea HopkinsResidential DataBank
Blair HardestyResidential DataBank
Financial SupportThe E. V. Williams Center for Real Estate for RealEstate and Economic Development (CREED) functionsand reports are funded by donations from individuals, organizations and the CREED Advisory Board.
Disclosure Data collection from December 2006 - November 2007
Acknowledgements
2 0 0 8 H A M P TO N R O A D S R E A L E S TAT E M A R K E T R E V I E W
RESIDENTIAL
ODU-MarketReview2008-FINAL2:ODUMarketReview2005 2/14/08 11:53 AM Page 57

58
The Hampton Roads Housing Market during the year of 2007 was a year of challenge for someand opportunity for others. The recent housing boom that occurred between 2003 and 2005 wasfueled by low interest rates and a tight supply of homes for sale. The fast sales pace of both newconstruction and existing homes fueled activity by an inordinate number of investors, specula-tors, first time home owners, and move up buyers. When the interest rates started to climb, the
market began to slow. Corrections and adjustments that began in 2006continued through the year of 2007. Residential building permits weredown during the first quarter by 39.2%, and the second and third quar-ters were down by 5.0% and 11.0% when compared to the prior year.The twelve months ending in November 2007 show a final loss in per-mit activity of 31.0% with a total of 5,150 building permits issued. As adirect result of the housing downswing, builders have pulled back onproduction until sales improve rather than overextend for additionalprojects. The smaller losses in permit activity during the second andthird quarters indicate that excess inventory is shrinking and the mar-ket in Hampton Roads is absorbing the majority of standing product.
Looking at closings for the year, the new construction market is down16.0% with a total of 4,189 closings. The price points with the greatest
number of sales for single-family detached homes were in a range from $300K to $499K. Thehighest number of attached new construction unit sales occurred in the price points that wereless than $300K. High-end single-family detached homes priced above $500K continue to show
The Hampton Roads Residential Market statistics
covered in this report analyze the new home build-
ing industry and the existing home sales activity
for a twelve month period beginning with December 2006
through November 2007. Data from the prior twelve
months is used for comparison. Included are the cities of
Chesapeake, Hampton, Newport News, Norfolk,
Poquoson, Portsmouth, Suffolk, Virginia Beach, and Williamsburg, and the counties of Isle of
Wight, James City, Southampton, and York. New this year is Gloucester and the numbers have
been recalculated to include Gloucester during the prior year. The new construction data contained
in this report was gathered from the actual deeds recorded and from the building permits issued
by each city or county. The existing home closings data was gathered from the Real Estate
Information Network. National numbers were provided by the National Association of Realtors.
2 0 0 8 R E S I D E N T I A L
General Overview
T
The Year in Review
HAMPTON ROADSReal Estate Market Review 2008
The price points with the greatest number of sales for
single-family detached homes were in a range from
$300K to $499K. The highest number of attached new
construction unit sales occurred in the price points that
were less than $300K.
ODU-MarketReview2008-FINAL2:ODUMarketReview2005 2/14/08 11:54 AM Page 58

59
the biggest loss in closing activity. At the end of November the existing home market ended the twelve month periodwith a loss of 14.8%. A total of 19,006 resale homes closed for a drop of 3,309 closings. For six straight years the exist-ing home market in Hampton Roads experienced significant increases year after year. Unable to sustain this growth asthe market slowed, in 2006 the resale market began to correct. The number of closings for the past twelve monthsreflect a market very similar to the years of 2000 and 2001, when the market was not just stable, but thriving.
The majority, or 66% of all sales for existing single-family detached homes during the year fell in the price ranges below$300K. Sales of attached existing homes were concentrated in the price points below $200K with 91.0% of all sales.
20
08
RE
SID
EN
TIA
L
ALL PRODUCT TYPES 2006 2007 % 2006 2007 % PERMITS PERMITS DIFFERENCE CLOSINGS CLOSINGS DIFFERENCE
Chesapeake 959 942 -20.1% 926 643 -30.6%
Gloucester 274 354 29.2% 102 110 7.8%
Hampton 351 237 -32.5% 181 134 -26.0%
Isle of Wight County 443 264 -40.4% 342 222 -35.1%
James City County 1,203 669 -44.4% 770 534 -30.6%
Newport News 323 301 -6.8% 177 208 17.5%
Norfolk 608 350 -42.4% 405 384 -5.2%
Portsmouth 208 223 7.2% 115 56 -51.3%
Southampton County 132 115 -12.9% 37 42 13.5%
Suffolk 742 627 -15.5% 610 457 -25.1%
Virginia Beach 1,815 942 -48.1% 1,028 1,127 9.6%
Williamsburg 17 27 58.8% 13 5 -61.5%
York County 387 275 -28.9% 280 267 -4.6%
TOTALS 7,462 5,150 -31.0% 4,986 4,189 -16.0%
NEW CONSTRUCTION PERMIT AND CLOSING ACTIVITY(December 2005 through November 2006 compared to December 2006 Through November 2007)
Table I
Virginia Beach Ridgley Manor 145
James City County Colonial Heritage 130
Suffolk Remington Park 100
James City County Fords Colony 76
James City County Eagle Harbor 75
James City County Windsormeade 74
Virginia Beach Woodbridge Pointe 73
Newport News Patrick Henry Place 64
James City County Stonehouse 59
Virginia Beach Studio 56 56
TOP 10 SUBDIVISIONS BY PERMITSTHROUGH NOVEMBER
Table II
ODU-MarketReview2008-FINAL2:ODUMarketReview2005 2/14/08 11:54 AM Page 59

60
The average price for a new construction single-family detached home in Hampton Roads is now $437,315, down a slight0.4% compared to the same twelve month time period last year. The area with the highest average price for a new con-struction single-family detached home is Virginia Beach with $529,432. Condominium prices have increased 0.01%, from$336,498 to $336,688, and townhome units now carry an average price of $388,737, down 10.6% from last year. The
Hampton Roads combined average price for all types of new constructionis $388,737, a small decrease of 1.8%.
More than 60% of all areas in Hampton Roads carry an average pricegreater than $400,000 for single-family detached homes.
Existing home average prices show increases for all types of units. Single-family detached existing homes are now $282,538, up 4.6%. Condominium
units have an average price of $219,785, up 0.01%, and townhomes units have an average price of $185,546, up 4.4%.
The average closing price in Hampton Roads for all types of housing is $260,545, up 4.4% from the same time last year.
AVERAGE PRICES
Total existing home sales were up 0.4% from October 2007 with 5,000,000 for the month of November. However, this num-ber is 20.0% below the 6,250,000 sales level reported in November 2006. The inventory of existing homes for sale inNovember stands at 10.3 months, down from 10.7 months in October 2007. From the peak in the market during 2006,housing prices nationwide have declined 3.4% through the 3rd quarter of 2007, according to the Shiller Real Housing PriceIndex. In November, the nationwide median price for an existing home was $210,200.
Nationally, new construction sales are off by 25% from year ago numbers and at the end of November, there was a 9.3month supply. The median sales price for a new single-family detached home during the month of November was$239,100, with a twelve month average of $242,617. Single-family housing starts are down by 24.6% from November 2006and nearly 50% from the record high at the beginning of last year.
Adding stress to the market, investors/specu-lators have been unloading new constructionhomes bought during the market boom, ontothe existing homes market. Additionally, tightmortgage market conditions have increasedhome sale cancellations according to DavidSeiders, the chief economist for the NationalAssociation of Home Builders. In addition, thetight credit conditions in the home mortgagemarket are creating tightening conditions inthe financial markets for land acquisition, landdevelopment and construction loans.
THE NATIONAL HOUSING MARKET
2 0 0 8 R E S I D E N T I A L
HAMPTON ROADSReal Estate Market Review 2008
The Hampton Roads combined average price for all
types of new construction is $388,737, a small
decrease of 1.8%.
ODU-MarketReview2008-FINAL2:ODUMarketReview2005 2/14/08 11:54 AM Page 60
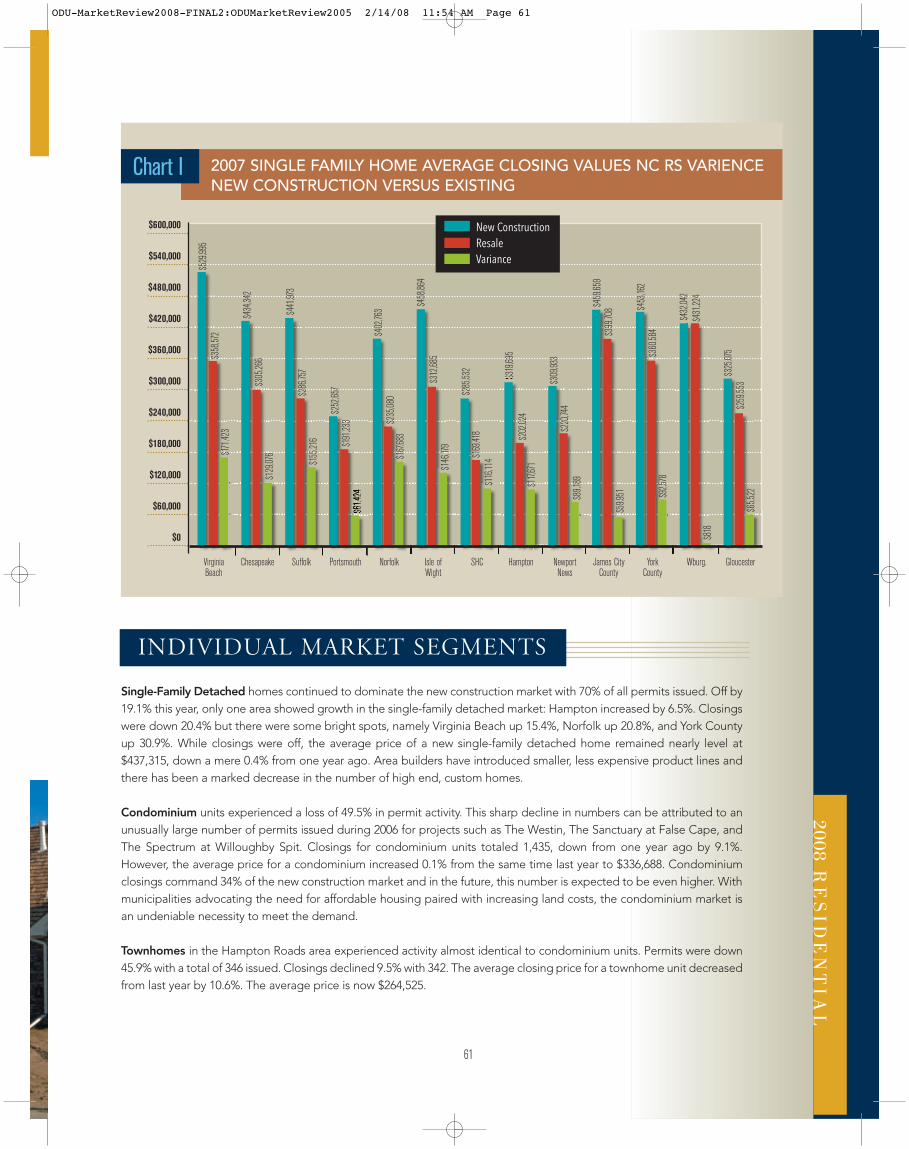
61
2008R
ES
IDE
NT
IAL
Single-Family Detached homes continued to dominate the new construction market with 70% of all permits issued. Off by19.1% this year, only one area showed growth in the single-family detached market: Hampton increased by 6.5%. Closingswere down 20.4% but there were some bright spots, namely Virginia Beach up 15.4%, Norfolk up 20.8%, and York Countyup 30.9%. While closings were off, the average price of a new single-family detached home remained nearly level at$437,315, down a mere 0.4% from one year ago. Area builders have introduced smaller, less expensive product lines andthere has been a marked decrease in the number of high end, custom homes.
Condominium units experienced a loss of 49.5% in permit activity. This sharp decline in numbers can be attributed to anunusually large number of permits issued during 2006 for projects such as The Westin, The Sanctuary at False Cape, andThe Spectrum at Willoughby Spit. Closings for condominium units totaled 1,435, down from one year ago by 9.1%.However, the average price for a condominium increased 0.1% from the same time last year to $336,688. Condominiumclosings command 34% of the new construction market and in the future, this number is expected to be even higher. Withmunicipalities advocating the need for affordable housing paired with increasing land costs, the condominium market isan undeniable necessity to meet the demand.
Townhomes in the Hampton Roads area experienced activity almost identical to condominium units. Permits were down45.9% with a total of 346 issued. Closings declined 9.5% with 342. The average closing price for a townhome unit decreasedfrom last year by 10.6%. The average price is now $264,525.
INDIVIDUAL MARKET SEGMENTS
$61,
424
$319
,695
$600,000
$540,000
$480,000
$420,000
$360,000
$300,000
$240,000
$180,000
$120,000
$60,000
$0
2007 SINGLE FAMILY HOME AVERAGE CLOSING VALUES NC RS VARIENCENEW CONSTRUCTION VERSUS EXISTING
Chart I
VirginiaBeach
Chesapeake Suffolk Portsmouth Norfolk Isle ofWight
SHC Hampton NewportNews
James CityCounty
YorkCounty
Wburg. Gloucester
New ConstructionResaleVariance
$529
,995
$358
,572
$171
,423
$434
,342
$305
,266
$129
,076
$441
,973
$286
,757
$155
,216
$252
,657
$191
,233
$402
,763
$235
,080
$167
,683
$458
,864
$312
,685
$146
,179
$285
,532
$169
,418
$116
,114
$202
,024
$117
,671
$309
,933
$220
,744
$89,
189
$459
,659
$399
,708
$59,
951
$453
,162
$360
,584
$92,
578
$432
,042
$431
,224
$818
$325
,075
$259
,553
$65,
522
ODU-MarketReview2008-FINAL2:ODUMarketReview2005 2/14/08 11:54 AM Page 61

62
2 0 0 8 R E S I D E N T I A L
HAMPTON ROADSReal Estate Market Review 2008
Hampton Roads ended the twelve month period of December 2006 through November 2007 with a total of 23,195 clos-ings for both new construction and existing homes. This number represents a loss in market activity of 15.0% comparedto year ago numbers. The average combined price for a home in the area has increased to $288,692, a gain of 4.6%.
THE TOTAL MARKET
It has been said many times recently that all housing markets are local. What this means is that conditions within each mar-ket determine the strength or weakness of that market and the buying and selling of homes is dependent on several fac-tors. Job growth, the supply of homes, mortgage interest rates, and the quantity of available mortgage products are allkey segments. When some or all of these factors are favorable, demand is created. Hampton Roads is unique in many ways.The economic picture is significantly influenced by the presence of the military and the various Department of Defensecontractors. A second area of employment and economic strength is centered on the shipyards and the various shippingports found in Norfolk, Portsmouth, and Newport News. Ranked number seven in the nation for tonnage, the HamptonRoads ports have advanced the local economy and created auxiliary enterprises in the areas of trucking, warehousing, dis-tribution, and storage.
Because of the unique, fairly stable economic base found in this area, Hampton Roads is usually sheltered from the manyfluctuations of the National economy. The housing market in this area is also relatively quite stable. Without the draw of asizeable amount of heavy industry in the area, growth in the housing market is largely the result of military movements, thenational defense budget, job growth, and the normal cycles of life.
2008
AVERAGE MARKET TIME FOR EXISTING HOMES1993 TO 2007
Graph II
90
80
70
60
50
40
30
20
1993 1994 1995 1996 1997 1998 1999 2000 2001 2002 2003 2004 2005 2006 2007
DAYS
ON
MAR
KET
ODU-MarketReview2008-FINAL2:ODUMarketReview2005 2/14/08 11:54 AM Page 62
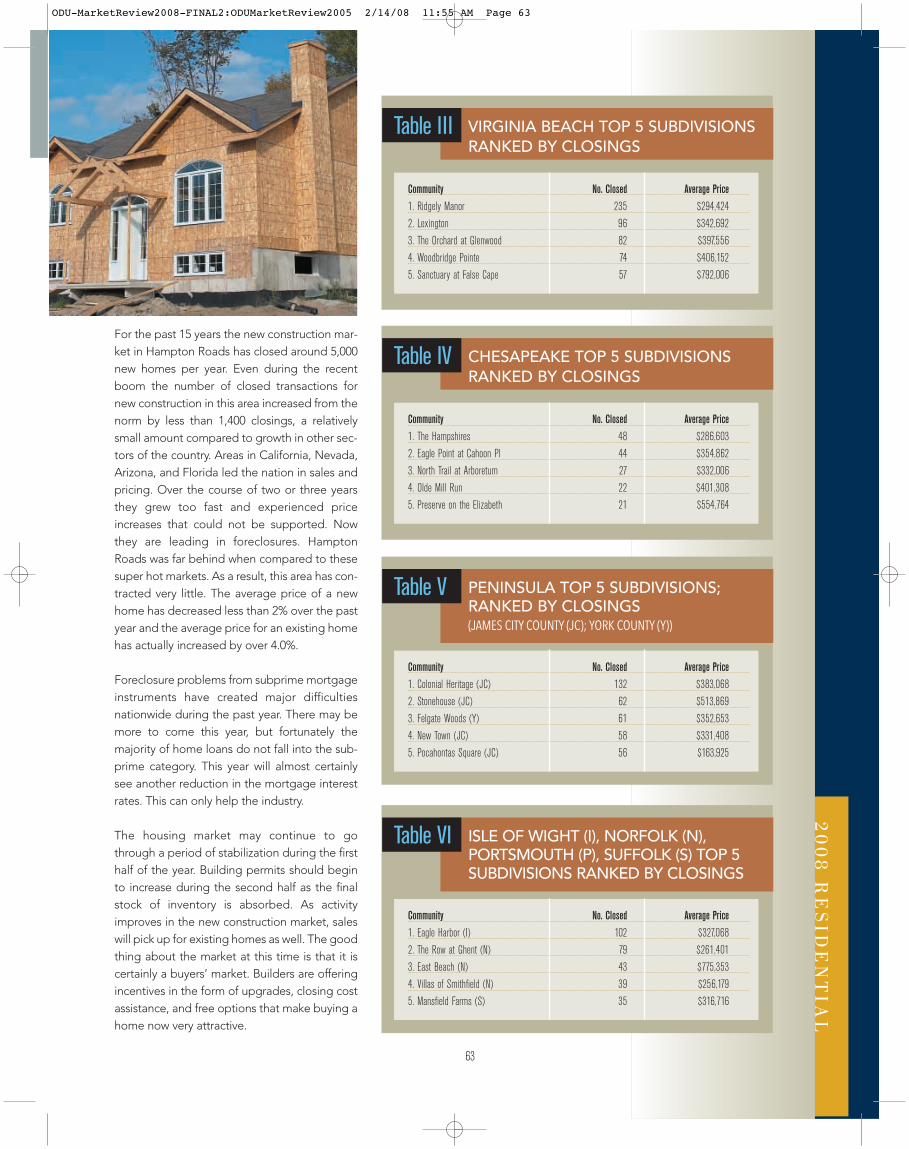
63
20
08
RE
SID
EN
TIA
L
For the past 15 years the new construction mar-ket in Hampton Roads has closed around 5,000new homes per year. Even during the recentboom the number of closed transactions fornew construction in this area increased from thenorm by less than 1,400 closings, a relativelysmall amount compared to growth in other sec-tors of the country. Areas in California, Nevada,Arizona, and Florida led the nation in sales andpricing. Over the course of two or three yearsthey grew too fast and experienced priceincreases that could not be supported. Nowthey are leading in foreclosures. HamptonRoads was far behind when compared to thesesuper hot markets. As a result, this area has con-tracted very little. The average price of a newhome has decreased less than 2% over the pastyear and the average price for an existing homehas actually increased by over 4.0%.
Foreclosure problems from subprime mortgageinstruments have created major difficultiesnationwide during the past year. There may bemore to come this year, but fortunately themajority of home loans do not fall into the sub-prime category. This year will almost certainlysee another reduction in the mortgage interestrates. This can only help the industry.
The housing market may continue to gothrough a period of stabilization during the firsthalf of the year. Building permits should beginto increase during the second half as the finalstock of inventory is absorbed. As activityimproves in the new construction market, saleswill pick up for existing homes as well. The goodthing about the market at this time is that it iscertainly a buyers’ market. Builders are offeringincentives in the form of upgrades, closing costassistance, and free options that make buying ahome now very attractive.
Community No. Closed Average Price1. Ridgely Manor 235 $294,424
2. Lexington 96 $342,692
3. The Orchard at Glenwood 82 $397,556
4. Woodbridge Pointe 74 $406,152
5. Sanctuary at False Cape 57 $792,006
VIRGINIA BEACH TOP 5 SUBDIVISIONSRANKED BY CLOSINGS
Table III
Community No. Closed Average Price1. The Hampshires 48 $286,603
2. Eagle Point at Cahoon Pl 44 $354,862
3. North Trail at Arboretum 27 $332,006
4. Olde Mill Run 22 $401,308
5. Preserve on the Elizabeth 21 $554,764
CHESAPEAKE TOP 5 SUBDIVISIONSRANKED BY CLOSINGS
Table IV
Community No. Closed Average Price1. Colonial Heritage (JC) 132 $383,068
2. Stonehouse (JC) 62 $513,869
3. Felgate Woods (Y) 61 $352,653
4. New Town (JC) 58 $331,408
5. Pocahontas Square (JC) 56 $163,925
PENINSULA TOP 5 SUBDIVISIONS;RANKED BY CLOSINGS (JAMES CITY COUNTY (JC); YORK COUNTY (Y))
Table V
Community No. Closed Average Price1. Eagle Harbor (I) 102 $327,068
2. The Row at Ghent (N) 79 $261,401
3. East Beach (N) 43 $775,353
4. Villas of Smithfield (N) 39 $256,179
5. Mansfield Farms (S) 35 $316,716
ISLE OF WIGHT (I), NORFOLK (N),PORTSMOUTH (P), SUFFOLK (S) TOP 5SUBDIVISIONS RANKED BY CLOSINGS
Table VI
ODU-MarketReview2008-FINAL2:ODUMarketReview2005 2/14/08 11:55 AM Page 63

ODU-MarketReview2008-FINAL2:ODUMarketReview2005 2/14/08 11:55 AM Page 64

65
SouthsideSuffolk
Portsmouth
Norfolk
Chesapeake
Isle of Wight Co.
Franklin/So. Hampton
Virginia Beach
PeninsulaNewport News
Hampton
James City County
York County
RESIDENTIAL SUBMARKETS
20
08
RE
SID
EN
TIA
L
ODU-MarketReview2008-FINAL2:ODUMarketReview2005 2/14/08 11:55 AM Page 65

66HAMPTON ROADS
15 YEAR CLOSING HISTORYGraph III
2 0 0 8 R E S I D E N T I A L
25000
20000
15000
10000
5000
0
1992 1993 1994 1995 1996 1997 1998 1999 2000 2001 2002 2003 2004 2005 2006 Nov. 2007 2007Proj
RESA LE
NEW CONSTRUCTION
Real Estate Market Review 2008
National Hampton RoadsMedian Price¹ $210,200 $215,000
% Change -3.30% -0.46%
YTD Closings² 63,260,000 17,529
% Change -11.96% -14.39%
Inventory 10.3 months 6.6 months
EXISTING HOMESTable VII
National Hampton RoadsMedian Price³ $217,800 $369,149
% Change -8.64% 4.06%
YTD Sales² 8,679,000 4,503
% Change -25.01% -8.18%
Inventory 9.3 months 10.1 months
NEW HOMESTable VIII
¹ November 2007 2 January to November 3 October 2007
ODU-MarketReview2008-FINAL2:ODUMarketReview2005 2/14/08 11:55 AM Page 66

67
TOP 25 HAMPTON ROADS BUILDERS BY PERMITS AND CLOSINGSTable IX
20
08
RE
SID
EN
TIA
L
PERMITS ISSUED CLOSINGS
# OF CLOSINGS TOTAL REVENUE
BUILDER PERMITS ISSUED BUILDER PERMITS ISSUED BUILDER PERMITS ISSUED
1 Chesapeake Homes 375 1 Dragas Associates 360 1 Dragas Associates 102,760,071
2 Centex Homes 270 2 Chesapeake Homes 287 2 Centex Homes 102,230,302
3 Dragas Associates 183 3 Centex Homes 259 3 Chesapeake Homes 91,401,433
4 Lennar Corp 130 4 Franciscus Co Inc 172 4 Lennar Corp 50,934,982
5 Franciscus Co Inc 99 5 Lennar Corp 133 5 The Futura Group Llc 49,740,148
6 K B S Inc 77 6 L L Bldg Corp 94 6 Franciscus Co Inc 42,468,143
7 Mcq Bldrs & Dev Inc 72 7 Terry/Peterson Res 75 7 L L Bldg Corp 30,352,955
8 L L Bldg Corp 67 8 The Futura Group Llc 69 8 Ainslie-Widener Inc 25,960,749
9 Hearndon Constr Corp 65 9 Atlantic Homes Corp 64 9 Terry/Peterson Residen 24,431,150
10 Beco Construction Inc 64 10 Health E Community Ent 64 10 Virginia Ent Inc 23,725,570
11 Atlantic Homes Corp 62 11 Bristol Development 63 11 Lifestyle Homes Llc 21,625,151
12 Lifestyle Homes Llc 61 12 Virginia Ent Inc 57 12 Atlantic Homes Corp 20,421,206
13 Associated Contr Svc Inc 60 13 Ainslie-Widener Inc 53 13 Ryan Homes 19,612,134
14 Ryan Homes 59 14 Eagle Construction 48 14 Solid Concepts Inc 18,907,961
15 Armada Hoffler 56 15 Mcq Bldrs & Dev Inc 48 15 Hearndon Constr Corp 18,348,626
16 W M Jordan Co Inc 54 16 Pace Constr & Dev Corp 48 16 Bishard Development Co 18,179,943
17 Bush Constr Corp 54 17 Lifestyle Homes Llc 47 17 Eagle Construction 17,859,850
18 Solid Concepts Inc 46 18 Hearndon Constr Corp 47 18 Wayne Harbin Bldr Inc 17,595,470
19 Hhhunt Homes 46 19 Lynnhaven Homes Inc 47 19 Beco Construction Inc 17,543,783
20 Home Associates Of Va 42 20 Villa Development 46 20 S B Ballard Inc 17,426,634
21 Regent Ent Inc 40 21 Bishard Dev Corp 45 21 Sadler Bldg Corp 17,220,883
22 Ashdon Builders Inc 36 22 Collins Ent Inc 45 22 Mcq Bldrs & Dev Inc 16,365,060
23 R & R Constr Corp 34 23 Beco Construction Inc 43 23 Bristol Development 16,231,601
24 Stephen Alexander Homes 33 24 Home Associates Of Va 41 24 Home Associates Of Va 16,086,084
25 Virginia Ent Inc 30 25 Ryan Homes 38 25 Collins Ent Inc 14,598,780
ODU-MarketReview2008-FINAL2:ODUMarketReview2005 2/14/08 11:55 AM Page 67

68HAMPTON ROADSReal Estate Market Review 2008
ODU-MarketReview2008-FINAL2:ODUMarketReview2005 2/14/08 11:55 AM Page 68

69
AuthorCharles Dalton
Data Analysis/LayoutReal Data
Financial SupportOld Dominion University E.V. Williams Center for RealEstate and Economic Development (CREED) reports arefunded by donations from individuals, organizations andthe CREED Advisory Board.
Acknowledgements
2 0 0 8 H A M P TO N R O A D S R E A L E S TAT E M A R K E T R E V I E W
MULTI-FAMILY
ODU-MarketReview2008-FINAL2:ODUMarketReview2005 2/14/08 11:55 AM Page 69

he Virginia Beach-Norfolk-Newport News Multi-Family Report,
published by Real Data, is a detailed analysis of the rental market
within conventional apartment communities in the Hampton
Roads region. The area has been divided into nine submarkets:
Chesapeake, Hampton, Newport News, Norfolk, Portsmouth, Suffolk,
Virginia Beach, Williamsburg and York County. Combined, these areas
contain a survey base of over 80,000 units within conventional apartment
communities of 50 or more units each.
The Virginia Beach-Norfolk-Newport News market is divided into two portions by the James
River. The Peninsula area is north of the James River and contains Hampton, Newport News,
Williamsburg and York County. The Tidewater area is south of the James River and contains
Chesapeake, Norfolk, Portsmouth, Suffolk and Virginia Beach. The submarket with the
highest concentration of units is Virginia Beach, which accounts for one-quarter of the regions
apartment units.
The occupancy rate in the Hampton Roads region is consistently one of the highest in the
southeast. As of October 2007, the average occupancy rate was 94.9%. There was an upswing in
development activity in 2007 with 1,169 new units started compared to only 640 units in
2006. As of October 2007, there were over 1,112 units under construction, and an additional
1,800 units were proposed.
The average quoted rental rate is $862,
with one-bedroom rents averaging $770
per month, two-bedroom units with an
average rental rate of $869, and three-
bedroom units reporting an average quot-
ed rental rate of $1,015. Rental rates from
existing inventory increased $34 in the
last twelve months.
Chesapeake
11%
Hampton
12%
Norfolk
15%
Portsmouth
8%
Virginia Beach
25%
York County
2%Williamsburg
4%Suffolk
1%
Newport
News
22%
Submarket Percentages
T
2 0 0 8 M U LT I - FA M I LY
General Overview
HAMPTON ROADSReal Estate Market Review 2008
ODU-MarketReview2008-FINAL2:ODUMarketReview2005 2/14/08 11:55 AM Page 70

71
20
08
MU
LT
I-FA
MIL
Y
Virginia Beach-Norfolk-Newport News
A total of 83,876 units were surveyed for this report. Development of apartment units in this market peaked duringtwo time periods, the early 1970s and the late 1980s. Development during the 1990s and so far in the 2000s is minorcompared to past development. Approximately 18% of the apartment units in this region were built after 1990.
Historical Apartment Development
HISTORICAL APARTMENT DEVELOPMENTTable I
25,000
20,000
15,000
10,000
5,000
0
Pre-‘64 ‘65-‘69 ‘70-‘74 ‘75-‘79 ‘80-‘84 ‘85-‘89 ‘90-‘94 ‘95-‘99 ‘00-‘04 ‘05-
NU
MB
ER
O
F
UN
IT
S
ODU-MarketReview2008-FINAL2:ODUMarketReview2005 2/14/08 11:55 AM Page 71

72
Historical Multi-Family Building Permits Virginia Beach-Norfolk-Newport News
Overall housing development in the region was at its peak from 2002-2006 with more than 10,000 permits issuedannually for single and multi-family housing. With the slow down in the overall housing market, residential permitsissued fell to 7,689 in 2006 which was a 32% decrease compared to the peak of activity in 2005. Based on year todate numbers for 2007, overall housing permits in 2007 will be below the 2006 levels.
Multi-family permit activity, which includes rental and for-sale units, was strongest in 2005. Much of the permitactivity has not been rental apartments, but instead for-sale condominiums and townhouses, especially in recentyears when a decline in interest rates made it easier for many people to get into the for-sale arena. Multifamilypermits have continued to slow in the last twelve months with the number of permits issued in the last six monthsat only one-third the prior period.
HAMPTON ROADS
2 0 0 8 M U LT I - FA M I LY
Real Estate Market Review 2008
Multi-Family Permit Activity
ANNUAL MULTI-FAMILY PERMIT ACTIVITYTable II
3,200
3,000
2,800
2,600
2,400
2,200
2,000
1,800
1,600
1,400
1,200
1,000
800
600
400
200
0
PE
RM
IT
S
IS
SU
ED
1,42
1
1,10
2 1,21
6
1,38
4
684
1,51
9
2,35
5
2,29
2
2,33
9
3,08
5
1,15
9
1996 1997 1998 1999 2000 2001 2002 2003 2004 2005 2006
ODU-MarketReview2008-FINAL2:ODUMarketReview2005 2/14/08 11:55 AM Page 72

73
2008M
UL
TI-F
AM
ILY
As of October, there were over 1,100 apartment units under construction within seven communities in the VirginiaBeach-Norfolk-Newport News market. There are an additional 3,300 apartment units in the planning stage.
Apartment Development Activity
MULTI-FAMILY PERMITS ISSUED – PAST 12 MONTHSTable III
500
400
300
200
100
0
NU
MB
ER
O
F
P
ER
MI
TS
74
188
380
270
72 72
55
24
198
31
16
0
NOV. 2006
DEC. 2006
JAN. 2007
FEB. 2007
MAR. 2007
APR. 2007
MAY 2007
JUN. 2007
JUL. 2007
AUG. 2007
SEP. 2007
OCT. 2007
APARTMENT DEVELOPMENT ACTIVITY (OCTOBER 2007)Table IV
1,000
900
800
700
600
500
400
300
200
100
0
NU
MB
ER
O
F
U
NI
TS
Chesapeake Hampton Newport News Norfolk Portsmouth Suffolk Virginia Beach Williamsburg York
ODU-MarketReview2008-FINAL2:ODUMarketReview2005 2/14/08 11:55 AM Page 73

ODU-MarketReview2008-FINAL2:ODUMarketReview2005 2/14/08 11:55 AM Page 74

SouthsideSuffolk
Portsmouth
Norfolk
Chesapeake
Isle of Wight Co.
Franklin/So. Hampton
Virginia Beach
PeninsulaNewport News
Hampton
James City County
York County
MULTI-FAMILY SUBMARKETS
20
08
MU
LT
I-FA
MIL
Y
ODU-MarketReview2008-FINAL2:ODUMarketReview2005 2/14/08 11:55 AM Page 75

76
Demand for housing can be measured by calculating the number of housing units absorbed within a given time frame.Absorption is defined as the net change in occupied units. Therefore, positive absorption occurs when previouslyvacant or newly built dwellings become occupied. Based on the current state of the economy and historical per-formance, the Virginia Beach-Norfolk-Newport News area is expected to absorb between 600 and 900 units annually.The 828 units absorbed over the past year falls within the expected absorption levels.
The Hampton submarket, which reported the most new units coming on-line, had the highest level of absorption inthe last year. Although Portsmouth reported the weakest demand with the loss of (-214) renters, this was due in largepart to the closing of one community in anticipation of redeveloping the site.
Absorption
HAMPTON ROADSReal Estate Market Review 2008
2 0 0 8 M U LT I - FA M I LY
ABSORPTIONTable V
1,400
1,300
1,200
1,100
1,000
900
800
700
600
500
400
300
200
100
0
-100
-200
-300
NU
MB
ER
O
F
U
NI
TS
1998 1999 2000 2001 2002 2003 2004 2005 2006 2007
ODU-MarketReview2008-FINAL2:ODUMarketReview2005 2/14/08 11:56 AM Page 76

77
The overall vacancy rate for the Virginia Beach-Norfolk-Newport News market as of October 2007 was 5.1%. Whilethis is the highest the vacancy rate has been in nearly 10 years, the market is still very healthy. Based on the currentdevelopment pipeline, vacancy rates are expected to rise slightly but should remain at or below 6%.
Vacancy
2008M
UL
TI-F
AM
ILY
SUBMARKET ABSORPTION – OCTOBER 2007Table VI
500
400
300
200
100
0
-100
-200
-300AB
SO
RP
TI
ON
(
AN
NU
AL
)
Chesapeake Hampton Newport News Norfolk Portsmouth Suffolk Virginia Beach Williamsburg York
OVERALL VACANCYTable VII
5.0
4.5
4.0
3.5
3.0
2.5
2.0
1.5
1.0
.5
0
VA
CA
NC
Y
RA
TE
1997 1998 1999 2000 2001 2002 2003 2004 2005 2006 2007
Every area saw an increase in vacancy rate over the past six months with the exception of Virginia Beach and NewportNews. The most significant increase in vacancy was in Hampton and Williamsburg which was the result of recent newdevelopments coming on line in those submarkets.
ODU-MarketReview2008-FINAL2:ODUMarketReview2005 2/14/08 11:56 AM Page 77

78Real Estate Market Review 2008
As of October, the average rental rate in Virginia Beach-Norfolk-Newport News was $862. Although rent growth remainshealthy at more than 4% in the last year, the rate of growth has been shrinking since peaking at nearly 6% in 2004.
Rental Rates
2008 M U L T I - F A M I LY
HAMPTON ROADS
SUBMARKET VACANCY RATESTable VIII
7%
6%
5%
4%
3%
2%
1%
0%NU
MB
ER
O
F
U
NI
TS
Chesapeake Hampton Newport News Norfolk Portsmouth Virginia Beach Williamsburg York Overall
October 2006October 2007
AVERAGE RENTAL RATESTable IX
$900
$800
$700
$600
$500
$400
$300
$200
$100
$0
AV
ER
AG
E R
EN
TA
L R
AT
E
1997 1998 1999 2000 2001 2002 2003 2004 2005 2006 2007
Average overall rents ranged from a low of $768 in Newport News to a high of $957 in Virginia Beach. NewportNews, Portsmouth, Norfolk, Williamsburg, and Hampton all reported rents lower than the average rent of $862,while Suffolk, Chesapeake, York and Virginia Beach all reported rents higher than the average overall rent.
Average Rents
ODU-MarketReview2008-FINAL2:ODUMarketReview2005 2/14/08 11:56 AM Page 78

79
2008M
UL
TI-F
AM
ILY
There were nearly 450 conventional apartment communities with more than 50 units surveyed in the HamptonRoads region in October. Out of more than 80,000 apartment units surveyed, the top fifteen management firmsmanage close to 70% of these units in the Virginia Beach-Norfolk-Newport News apartment market. The top fivemanagement firms manage 35% of the surveyed market.
Management
RichmondOccupancy rates have steadily risen over the last several years in Richmond and are 95% as of August 2007. Newdevelopment activity in the area has been limited and demand has been strong. Rent growth has been in the 3-4% annually and is expected to remain healthy as occupancy rates remain at or near 95%. Development activity isconcentrated in the downtown area with conversions of older industrial buildings into new residential units.Developers are also active in Chesterfield County along Highway 288 and we would expect to see more develop-ment in Petersburg area in anticipation of the expansion at Fort Lee.
RoanokeOccupancy rates and rental rates are improving in Roanoke with occupancies reaching 94% as of April 2007 andrental rates increasing nearly 4% for the year. There have been no new apartment developments of any significantsize in Roanoke in the last few years.
REGIONAL TRENDS
AVERAGE RENT BY SUBMARKET – OCTOBER 2007Table X$1,000
$900
$800
$700
$600
$500
$400
$300
$200
$100
$0AV
ER
AG
E R
EN
TA
L R
AT
E
Newport News Portsmouth Norfolk Williamsburg Hampton Overall Suffolk Chesapeake York County Virginia Beach
TOP 10 MANAGEMENT COMPANIESTable XIS.L. Nusbaum
Great Atlantic
Drucker & Falk
Lawson Companies
AIMCO
WMCI
Perrel Management
Breeden Management
Ripley-Heatwole
Kotarides Companies
MA
RK
ET
S
HA
RE
0% 1% 2% 3% 4% 5% 6% 7% 8% 9% 10%
ODU-MarketReview2008-FINAL2:ODUMarketReview2005 2/14/08 11:57 AM Page 79

80HAMPTON ROADSReal Estate Market Review 2008
The Prerequisite for doingbusiness in Hampton Roads
ODU-MarketReview2008-FINAL2:ODUMarketReview2005 2/14/08 11:57 AM Page 80
81
AuthorJ. Scott Adams, CCIMPresident - Mid-South RegionCB Richard Ellis
Acknowledgements
2 0 0 8 H A M P TO N R O A D S R E A L E S TAT E M A R K E T R E V I E W
INVESTMENT
ODU-MarketReview2008-FINAL2:ODUMarketReview2005 2/14/08 11:57 AM Page 81

82
While the "spin-doctors" of commercial real estate began to say during 2007 that there was min-imal to no connection between the falling residential markets and the healthy commercial mar-kets, no experts are saying that in 2008. With that said, the severe change in the residential mar-
ket is not expected in the commercial market. Dennis Yes key, nationaldirector of Deloitte & Touche LLP's Real Estate Capital Markets Group,recently noted that "The commercial real estate industry as caught acold from all the coughing and sneezing of the housing market, whichis deathly ill." The differing levels of sickness can best be explained bythree key differentiators.
The first key differentiator between the commercial and residentialmarkets is the amount of new supply over the last 7 years. While new
residential construction doubled nationally from 2001 through 2006, new commercial real estateconstruction was minimal and flat from 2001 to 2004 still largely recovering from the last slow-down of commercial real estate started in the late 1990's. Since 2004, commercial real estate con-struction has picked up but still arguably at controlled levels which can be absorbed without sig-nificant market correction. The severe slowdown in the residential market nationally has impact-ed the Hampton Roads area also although not the same extent of other markets where over-building was even more rampant over the last 5 to 7 years. The following chart shows the con-trolled new commercial real estate construction nationally as compared to the residential con-struction boom.
he real estate story making all of the
national headlines at this time is in the
residential market, not the commercial
real estate market. But this overview will discuss
how the nationwide slowdown in housing does
actually impact our commercial market through
the capital markets. But even with this correlation,
commercial real estate should continue to perform
strongly as an investment class nationally. And
within that context, Hampton Roads should con-
tinue to perform well as a market area overall and within each of the four core product types
(office, industrial, retail, and multifamily).
General Overview
T
2008 I N V E S T M E N T
COMMERCIAL VERSUS RESIDENTIAL
Since 2004, commercial real estate construction has
picked up but still arguably at controlled levels which
can be absorbed without significant market correction.
HAMPTON ROADSReal Estate Market Review 2008
ODU-MarketReview2008-FINAL2:ODUMarketReview2005 2/14/08 11:57 AM Page 82

83
The second key differentiator between the commercial and residential markets is the disappearance of a large sec-tor of the buyer pool for residential properties. Speculative investors with no intent to occupy the properties or ownthem long term were a substantial percentage of residential buyers, particularly in the highly publicized condo-minium market. The demand for commercial property has been far more diverse and driven by solid fundamentalsas a core asset class which will be discussed to a greater extent in a section below.
The third key differentiator between the commercial and residential markets was the aggressiveness of the lendingcommunity during the boom of 2001 to 2006. As aggressive as lending and underwriting was for commercial prop-erty during that time period, most commercial lenders continued to require minimum equity of 0% to 20% while res-idential investors could buy with 0% to 5% equity. With the fall off in demand for residential properties after a peri-od of massive new supply, prices have begun to fall and foreclosures have begun to be prevalent. By contrast, com-mercial investors have more substantial equity at risk and are in a better position to weather potential declines inpricing. And with that said, the lack of new construction and high cost of any potential further new construction hasbeen a buffer for commercial prices.
The massive over-leverage in residential real estate is the key driver for the changes in the capital markets we arenow experiencing. The soaring housing and mortgage finance markets with low interest rates and high originationvolume are now a thing of the past. Recent estimates project the losses stemming from the sub-prime residentialmortgage meltdown to be as high as $400 billion. While this story will continue to make national headlines and fur-ther erode national consumer confidence, it should be noted that the $400 billion in losses represent only 3% of U.S.gross domestic product which is currently $13 trillion. This perspective allows more sophisticated investors to putthis market correction actually in favorable contrast to previous financial crises such as the S&L crisis of the 1990's.
CAPITAL MARKETS
CONSTRUCTION ACTIVITY
$700
$650
$600
$550
$500
$450
$400
$350
$300
$250
$200
BI
LL
IO
N
‘01 ‘02 ‘03 ‘04 ‘05 ‘06 ‘07
2008R
ET
AIL
CREHOUSING
ODU-MarketReview2008-FINAL2:ODUMarketReview2005 2/14/08 11:57 AM Page 83
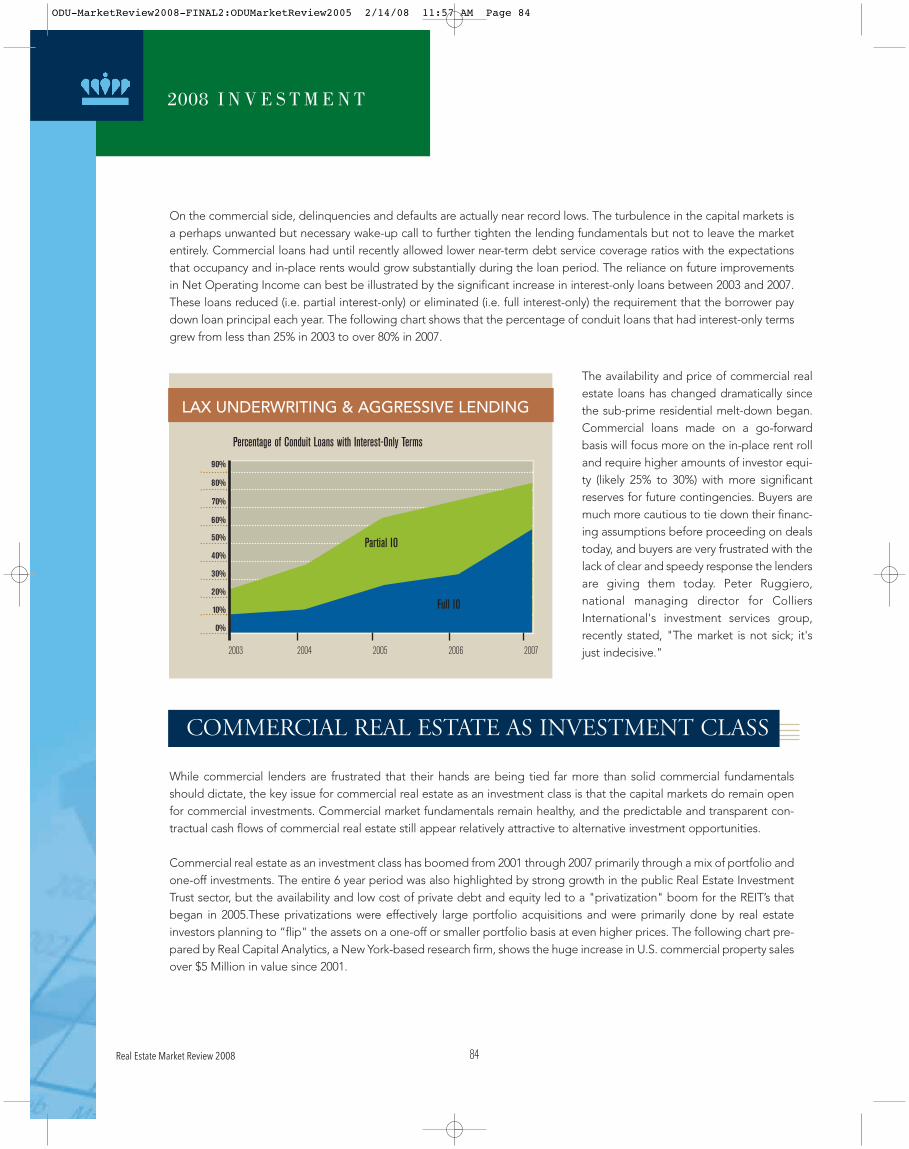
84
On the commercial side, delinquencies and defaults are actually near record lows. The turbulence in the capital markets isa perhaps unwanted but necessary wake-up call to further tighten the lending fundamentals but not to leave the marketentirely. Commercial loans had until recently allowed lower near-term debt service coverage ratios with the expectationsthat occupancy and in-place rents would grow substantially during the loan period. The reliance on future improvementsin Net Operating Income can best be illustrated by the significant increase in interest-only loans between 2003 and 2007.These loans reduced (i.e. partial interest-only) or eliminated (i.e. full interest-only) the requirement that the borrower paydown loan principal each year. The following chart shows that the percentage of conduit loans that had interest-only termsgrew from less than 25% in 2003 to over 80% in 2007.
While commercial lenders are frustrated that their hands are being tied far more than solid commercial fundamentalsshould dictate, the key issue for commercial real estate as an investment class is that the capital markets do remain openfor commercial investments. Commercial market fundamentals remain healthy, and the predictable and transparent con-tractual cash flows of commercial real estate still appear relatively attractive to alternative investment opportunities.
Commercial real estate as an investment class has boomed from 2001 through 2007 primarily through a mix of portfolio andone-off investments. The entire 6 year period was also highlighted by strong growth in the public Real Estate InvestmentTrust sector, but the availability and low cost of private debt and equity led to a "privatization" boom for the REIT’s thatbegan in 2005.These privatizations were effectively large portfolio acquisitions and were primarily done by real estateinvestors planning to “flip" the assets on a one-off or smaller portfolio basis at even higher prices. The following chart pre-pared by Real Capital Analytics, a New York-based research firm, shows the huge increase in U.S. commercial property salesover $5 Million in value since 2001.
COMMERCIAL REAL ESTATE AS INVESTMENT CLASS
HAMPTON ROADSReal Estate Market Review 2008
2008 I N V E S T M E N T
LAX UNDERWRITING & AGGRESSIVE LENDING
2003 2004 2005 2006 2007
90%
80%
70%
60%
50%
40%
30%
20%
10%
0%
Percentage of Conduit Loans with Interest-Only Terms
Partial IO
Full IO
The availability and price of commercial realestate loans has changed dramatically sincethe sub-prime residential melt-down began.Commercial loans made on a go-forwardbasis will focus more on the in-place rent rolland require higher amounts of investor equi-ty (likely 25% to 30%) with more significantreserves for future contingencies. Buyers aremuch more cautious to tie down their financ-ing assumptions before proceeding on dealstoday, and buyers are very frustrated with thelack of clear and speedy response the lendersare giving them today. Peter Ruggiero,national managing director for ColliersInternational's investment services group,recently stated, "The market is not sick; it'sjust indecisive."
ODU-MarketReview2008-FINAL2:ODUMarketReview2005 2/14/08 11:57 AM Page 84

85
The run-up in commercial real estate investment was fueled in part by a massive wall of liquidity looking for a home. In theUnited States during 2006, for instance, for every dollar that was spent on buying commercial real estate, there were twomore dollars that did not get placed. Commercial real estate has been viewed very favorably relative to other asset class-es, and investors viewed the available returns as perfectly acceptableeven as cop rates and expected yields declined during the boomperiod. Capital supply and demand fundamentals gave sellers theupper hand during this period, and that trend is expected to belargely over although the supply of investors will continue to be plen-tiful. With average yield rates on commercial real estate investmentsstill expected to be higher than those for many other investmentalternatives, commercial real estate likely will continue to be a pre-ferred investment class from a risk-adjusted basis.
A recent National Real Estate Investor survey of more than 1,000 private and institutional real estate investors shows that amajority still want to invest more funds in the sector while only 7 percent plan to decrease their investments in real estateover the next 12 months. This survey was conducted after the first national recognition of the slowdown in the U.S. econo-my as evidenced by anemic job growth figures. As investors aim to move forward in this period of uncertainty, the key ques-tion for each potential transaction is what is fair market pricing.
At the current time, most commercial owners are still optimistic that strong fundamentals will keep sales prices on par withrecent records if not continuing to climb, while most buyers believe that a market correction will lead to better purchaseopportunities in the coming months. Accordingly, most buyers and sellers aren't seeing eye-to-eye, and each side appearsto be waiting for the other side to blink.
Within this overall pricing gap environment, disparities are accentuated in lesser quality assets. The quality of assets can bereviewed in this regard in terms of geographic area and submarket within that area as well as the physical condition, ten-ancy, and other relevant features. Assets in marginal locations or with significant deferred maintenance or downside risk willbe most negatively impacted, as investors flock to quality and security in times of uncertainty.
2008IN
VE
ST
ME
NT
US COMMERCIAL PROPTERTY SALES
$450
$400
$350
$300
$250
$200
$150
$100
$50
0
BI
LL
IO
N
2001 2002 2003 2004 2005 2006 2007
$18
$63
$23
$79
$23
$99
$37
$149
$56
$7
$215
$63$26
$234
$119
$81
$210
PRIVATIZATION
PORTFOLIO
ONE-OFF
Since 2004, commercial real estate construction has
picked up but still arguably at controlled levels which
can be absorbed without significant market correction.
ODU-MarketReview2008-FINAL2:ODUMarketReview2005 2/14/08 11:57 AM Page 85

86HAMPTON ROADS
Real Estate Market Review 2008
2008 I N V E S T M E N T
A large part of the rise in commercial pricing in recent years has been from investors' willingness to accept lower returns ratherthan real growth in asset operating performance. Going forward, commercial real estate investors will have to work harder toachieve above-market returns. With the combination of less generous capital market pricing and slowing economic growth, thequestion is not whether cap rates will rise, but rather the timing and magnitude of the increases. A recent Torto Wheaton analy-sis highlighted that declining capitalization rates were the largest positive contributor to total returns over the last 5 years butcertainly are not expected to be over the next 5 years.
During the last 5 years, commercial real estateinvestment in office properties has increaseddramatically in terms of volume while also see-ing cap rates decline dramatically. The follow-ing chart using data gathered by Real CapitalAnalytics, a New York-based research firm,shows the evolution in the office investmentmarket from 2003 to 2007.
During this 5 year period, office landlords haveenjoyed falling vacancies and rising rents withlimited new construction adding supply to themarket. While office fundamental remainsound, the softening U.S. economy will lead toslower growth in rents and lower spaceabsorption levels.
OFFICE PROPERTIES
OFFICE MARKET
ANALYSIS OF INVESTMENT RETURNS LAST 5 YEARS VS. NEXT 5 YEARS
2003 2004 2005 2006 2007
Last 5 Years Next 5 Years
$250
$200
$150
$100
$50
$0
9.0%
8.0%
7.0%
6.0%
5.0%
4.0%
3.0%
Aver
age
Cap.
Rat
e
TO
TA
L P
RI
CE
(
IN
B
IL
LI
ON
S)
Source: Real Capital Analytics
16
14
12
10
8
6
4
2
0
-2
5Y
EA
R H
OL
D, %
R
ET
UR
N
TOTAL RETURN
YIELD
NOI GROWTH
CAP RATE CONTRIBUTION
ODU-MarketReview2008-FINAL2:ODUMarketReview2005 2/14/08 11:57 AM Page 86

87
2008IN
VE
ST
ME
NT
During the last 5 years, commercial real estateinvestment in industrial properties has alsoincreased dramatically in terms of volumewhile also seeing cap rates decline dramatical-ly. The following chart using data gathered byReal Capital Analytics, a New York-basedresearch firm, shows the evolution in the indus-trial investment market from 2003 to 2007.
During this 5 year period, industrial landlordshave enjoyed robust absorption levels buthave also seen significant amounts of new con-struction and less robust growth in rents. Thenational slowdown in consumer demand,industrial production, and the overall economywill negatively impact absorption and rentalrates as well. One remaining positive factor isthat global exports have been particularlybuoyed by the weak U.S. dollar.
INDUSTRIAL PROPERTIES
INDUSTRIAL/WAREHOUSE MARKET
2003 2004 2005 2006 2007
$40
$35
$30
$25
$20
$15
$10
$5
$0
9.0%
8.0%
7.0%
6.0%
5.0%
4.0%
3.0%
Av
er
ag
e C
ap
. R
at
e
TO
TA
L P
RI
CE
(
IN
B
IL
LI
ON
S)
Source: Real Capital Analytics
While these factors will impact the Hampton Roads market also, the area has clearly benefited from the nationally favorabletrends. CB Richard Ellis market research tracked 7 office investment sales of $15 Million or more during 2007. These sales includ-ed the largest downtown and largest suburban office sales in our market's history.
2007 OFFICE SALES OF $15 MILLION OR MORE
Property Name Purchase Price s.f. $/s.f. Seller Purchaser
Gee’s Group Portfolio $61,100,000 337,335 $181 Gee’s Group Guardian Realty Investors
150 West Main $56,000,000 226,450 $247 St. Joe Commercial EOLA Capital
Greenbrier Office/Flex Portfolio $36,000,000 325,106 $110 Brookfield Real Estate First Potomac Realty Investment LP
Starmount Portfolio $32,379,116 268,086 $121 Starmount Company CBL & Associates
500 E. Main St. $29,820,511 228,541 $130 Harbor Group International NPV/Direct Invest
Patrick Henry Corporate Center $18,575,000 98,883 $188 Carr Properties/JP Morgan KBS REIT
Patrick Henry Corporate Center $16,378,700 98,883 $166 Columbia Equity Trust Carr Properties/JP Morgan
ODU-MarketReview2008-FINAL2:ODUMarketReview2005 2/14/08 11:57 AM Page 87

88
During the last 5 years, commercial real estateinvestment in retail properties has alsoincreased dramatically in terms of volume whilealso seeing cap rates decline dramatically. Thefollowing chart using data gathered by RealCapital Analytics, a New York-based researchfirm, shows the evolution in the retail invest-ment market from 2003 to 2007.
RETAIL PROPERTIES
HAMPTON ROADSReal Estate Market Review 2008
RETAIL MARKET
2003 2004 2005 2006 2007
9.0%
8.0%
7.0%
6.0%
5.0%
4.0%
3.0%Av
erag
e Ca
p. R
ate
TO
TA
L P
RI
CE
(
IN
B
IL
LI
ON
S)
Source: Real Capital Analytics
$80
$70
$60
$50
$40
$30
$20
$10
$0
2008 I N V E S T M E N T
2007 INDUSTRIAL SALES OF $15 MILLION OR MORE
Property Name Purchase Price s.f. $/s.f. Seller Purchaser
Commonwealth Storage Portfolio $36,000,000 652,780 $55.15 Commonwealth Storage, Inc. Not Disclosed
Stock Building Supply $16,450,000 285,600 $57.60 Kempsville Building Materials Marc Realty, LLC
The Hampton Roads market should continue to be a national leader in the warehouse market with the positive trends in glob-al trade and the excellent infrastructure of the Ports of Virginia. While CB Richard Ellis market research tracked only 2 indus-trial investment sales of $15 Million or more during 2007, there were another 5 industrial sales transactions under $15 Millionbut over $5 Million.
ODU-MarketReview2008-FINAL2:ODUMarketReview2005 2/14/08 11:58 AM Page 88

89
During this 5 year period, retail landlords have enjoyed robust absorption levels and rent growth while consumers defied econ-omists' expectations and kept raising their level of spending despite rising energy prices. But with employment growth slow-ing and the appreciation in home values clearly on a reverse course, retail vacancy is up and rents are likely to decrease. Onetrend that is clearly a result of the worsening economy is that shopping center landlords expect bankruptcy filings to increaseand are becoming more proactive with struggling retailers.
The Hampton Roads market should continue to have strong retail market fundamentals, and national investors continue to lookfor opportunities to invest in Hampton Roads. Our CB Richard Ellis market research tracked 5 retail investment sales of $15Million or more during 2007 including major properties both in South Hampton Roads and on the Peninsula.
2007 RETAIL SALES OF $15 MILLION OR MORE
Property Name Purchase Price s.f. $/s.f. Seller Purchaser
Denbigh Village $35,951,662 318,287 $113 Developers Diversified Inland Real Estate Corp.
Lynnhaven North $32,000,000 173,191 $185 North Mall Associates Steven D. Bell & Co.
Cypress Point $23,748,850 117,958 $201 Edens & Avant DLC Management Corp.
Best Buy - Jefferson Ave $21,100,000 110,017 $192 Townsend, LLC IM Properties
Crossroads at Chesapeake Square $19,180,000 119,985 $160 Crossroads at Chesapeake Square, LLC Inland Real Estate Corp.
2008IN
VE
ST
ME
NT
During the period of 2003 to 2005, commercialreal estate investment in multifamily (apart-ment) properties also increased dramatically interms of volume while also seeing cap ratesdecline dramatically. Since 2005, multifamilyinvestment volume and cap rates have beenconsistently strong. The -following chart usingdata gathered by Real Capital Analytics, aNew York-based research firm, shows the evo-lution in the multifamily investment marketfrom 2003 to 2007.
MULTIFAMILY PROPERTIES
RETAIL MARKET
2003 2004 2005 2006 2007
9.0%
8.0%
7.0%
6.0%
5.0%
4.0%
3.0%
Aver
age
Cap.
Rat
e
TO
TA
L P
RI
CE
(
IN
B
IL
LI
ON
S)
Source: Real Capital Analytics
$120
$100
$80
$60
$40
$20
$0
ODU-MarketReview2008-FINAL2:ODUMarketReview2005 2/14/08 11:58 AM Page 89

90HAMPTON ROADS
Real Estate Market Review 2008
2008 I N V E S T M E N T
2007 APARTMENT SALES OF $15 MILLION OR MORE
Property Name Purchase Price s.f. $/s.f. Seller Purchaser
Marina Shores $80,750,000 392 $205,995 BNP Residential Properties Babcock & Brown
Bristol at Ghent $48,300,000 268 $180,224 Bristol Development Group Associated Estates Realty
Latitudes $45,906,542 448 $102,470 BNP Residential Properties Babcock & Brown
Myrtles at Olde Towne $33,091,371 246 $134,518 Prudential/Roseland Triple Net Properties
Mayflower Seaside Towers $33,000,000 265 $124,528 Colonial Properties Trust Fairfield Residential
Watermans Crossing $24,686,681 260 $94,949 America First Investors Sentinel Real Estate
Jefferson Point $24,100,000 208 $115,865 Harbor Group International AEW Capital
Heights at Olde Towne $19,908,629 148 $134,518 Prudential/Roseland Triple Net Properties
Dockside $18,500,000 190 $97,368 Bluestone Realty Urdang/Breeden
Oyster Point Place $15,801,159 278 $56,839 Praedium Group National Commercial Ventures
Heritage at Freemason Harbour $15,600,000 184 $84,783 Collins Enterprises ING Clarion Partners
During this 5 year period, multifamily landlords have enjoyed strong occupancy and rental rate growth, particularly in areas withhigh barriers to entry in terms of new supply and areas with above-average economic growth. Going forward, the slowdown inthe housing market features both good news and bad news for the multifamily market. The good news is that when the hous-ing market falters, the apartment market typically benefits from higher demand as more people are forced to rent rather thanpursue home ownership. The bad news is that when the housing market falters, more homeowners decide to place their hous-es or condominiums that they would prefer to sell on the rental market. This unplanned supply of potential rental competitioneffectively serves as "shadow competition" and may impact multifamily absorption and changes in rental rates.
The Hampton Roads market should continue to have strong multifamily market fundamentals including low current vacanciesand very limited amounts of new construction. CB Richard Ellis market research tracked 11 multifamily investment sales of $15Million or more during 2007 including major properties both in South Hampton Roads and on the Peninsula.
ODU-MarketReview2008-FINAL2:ODUMarketReview2005 2/14/08 11:58 AM Page 90

ODU-MarketReview2008-FINAL2:ODUMarketReview2005 2/14/08 11:58 AM Page 91

ODU-MarketReview2008-FINAL2:ODUMarketReview2005 2/14/08 11:58 AM Page 92