market risk evaluation using monte carlo...
TRANSCRIPT

1
1
Market Risk Evaluation using Monte Carlo Simulation
Methodology and Features
Dr. Anatoliy Antonov
1. Introduction
Market Risk involves the uncertainty of future earnings resulting from changes of various independent underlying assets in market environment (prices of assets, interest rates, FX rates, Spreads, etc.) for a certain future time point (risk horizon). The market risk of a position or of a portfolio is measured by a single value, called market Value at Risk (VaR). Market VaR represents unexpected loses at adverse move and is a measure of risk based on a probability of loss and a specific time horizon in which this loss can be expected to occur. Bank regulators use VaR to set capital requirements for bank trading accounts because VaR models can be used to estimate the loss of capital due to market risk.
PMS include three methods to calculate Market Risk: parametric VaR/CoVaR, historic simulation and structured Monte Carlo simulation that are the most powerful one.
Chart 1. Monte Carlo Simulation an VaR of a short Swaption
A structured Monte Carlo simulation engine in PMS produces price distribution of a single financial position or of a portfolio aggregate by applying numerical calculation procedures on a
Confidence VaR Mean

2
2
X
Correlation
Matrix (R)
Covariance
Matrix (C)
Volatility
Vector (V)
Value at
Risk Asset
Vector(A)
large set of possible market scenarios derived from statistic data for market moves from historic series. The structured Monte Carlo simulation produces better VaR results for non-linear instruments such as options, long-term cash flow assets and pay off of structured products retaining the non-linear nature of the assets (s. Chart. 1.).
2. Structured Monte Carlo Simulation
2.1 Evaluation Methodology
The Monte Carlo module (s. Chart 2.) for market risk is based on following methodology:
Chart 2. Structured Monte Carlo Simulation
1. Volatility vector (V) and correlation matrix (R) for a set of market risk drivers such as interest rates, FX rates, prices and spreads are produced from statistics of own historic series in the PMS data base or imported from JPMorgan standard risk data sets.
2. The covariance matrix (C) is obtained by matrix multiplication of the volatility vector (V) by the correlation matrix (R).
3. The Cholesky matrix S is constructed from the covariance matrix (C), so that
S x S' = C, where S' is the transposed matrix.
Matrix Perturbation is used to adjust the covariance matrix to be positive definite in case the original matrix is not positive definite as a result from dependencies of the risk drivers.
4. A random generator produces independent samples for each market driver using standard
normal distribution SND(0,1) stored into deviation vectors (D). A SVD correction and normal form correction applied to random vectors ensures normal distribution with mean = 0, standard deviation = 1, skewness = 0, kurtosis = 0 as correlation between factors = 0. The
Random series
corrections Random
Generator
S
Cholesky Transformation
Matrix Perturbation
X
Own Risk
Data JPMorgan
Risk Data +
Price
Dsirtibut. Pricing
Tree
Cholesky
Matrix (S)
Scenario
Vectors (E) Delta
Vectors (B)
Deviation
Vectors (D)
Instrument
or portfolio
valuation

3
3
c c c a a a
high quality of the random series reduces the number of Monte Carlo runs, 5.000 to 10.000 runs are usually enough to obtain good results.
5. The deviation vectors (D) is multiplied by the Cholesky matrix (S) to take the covariance between every risk driver pair into account. This produces delta vectors (B) of normal distributed and correlated deviations.
6. The vectors (B) are applied on the actual risk driver values (interest rates, FX rates, spreads,
etc.) in the asset vectors (A) and this produces scenario vectors (E) for the Monte Carlo runs that compute the pricing expression value using pricing trees to represent instruments and portfolios supplied by a Pricing Tree Generator. The pricing trees are specialized data structures ensuring high performance of the simulation.
7. Steps 6 is repeated a number of times (5000…10000). The large scenario set causes the calculation of price distributions of pricing expression. The resulted price distribution is constructed by counting the appearance of the values within many adjacent small ranges and there after the Value at Risk is calculated by numerical integration of the distribution density using a confidence percentage, for example 1%, for the upper limit of the price distribution.
2.2 Monte Carlo Simulation Mathematics
The Monte Carlo simulation steps from above use a set of well-known mathematical operations:
2.2.1 Calculation the covariance matrix
Ci , j Ri , j *Vi *Vj
, i = 1...n (matrix width), j<= i (triangle matrix),
where Cij - Element from covariance matrix
Rij - Element from correlation matrix (Rii =1) Vi, Vj - Element from volatility vector
2.2.2 Construction the Cholesky matrix S
S x S' = C, where S' is the transposed matrix, aij – elements of the matrix S
For matrix width = 3 we receive for example following matrix operation:
c11 c12 c13 a11 0 0 a11 a21 a31 C
c c c
a a 0
0 a a
21 22 23 21 22 22 32
31 32 33
31 32 33
0 0 a33
The matrix multiplication involves formulas for calculation the elements of the Cholesky matrix:

4
4
2 log(S)
S 2 log(S)
S
i 1
1/2
a c a 2
ii
ii ik
k 1
1 i 1 aij cij aik a jk
j i 1, i 2,..., N
a jj k 1
2.2.3 Matrix Perturbation
This is a method for transforming a non-positive definite matrix into a positive definite one. A matrix is said to be symmetric if A = A‘, where A‘ is the transpose of A. Therefore, covariance and correlation matrices are real and symmetric. A real symmetric matrix A is said to be positive definite if x‘Ax for every vector x different from 0. Given this definition, one can prove that a real symmetric matrix is positive definite if and only if all its eigenvalues are greater than zero.
The question is: “How do the eigenvalues of a matrix A change if it is subject to a perturbation A A+E?” Because the eigenvalues are continuous functions of the entries of A, it is natural to think that if the perturbation matrix E is small enough, then the eigenvalues should not change too much. It would be undesirable for our purposes to drastically change a matrix in order to turn it into a proper covariance matrix.
The Monte Carlo engine of PMS use the following perturbation:
AA+e(I-A) = B, where e is a scalar and I is the identity matrix. If e = 0 , then AA ; and if e = 1, then AI, which is clearly a positive definite matrix. Therefore, since the eigenvalues of a matrix are continuous functions of its entries, there are an infinite number of scalars e in the interval [0, 1] such that given by equation above is a positive definite matrix. The task is to obtain the min of e, which is calculated from min of the eigenvalues.
2.2.4 Generation of standard normal distribution SND(0,1) vector
V 2 Rnd 1 V 2 Rnd 1 S V 2 V
2
1 1 2 2 1 2
for S 0:
SND V SND V
1 1 2 2
where Rnd1, Rnd2 - two adjacent random numbers (0..1)
SND1, SND2 - two adjacent random numbers with standard normal distribution.
2.2.5 Correction of random series
2.2.5.1 SVD Correction of expected value, standard deviation and correlation
The first correction of expected value, standard deviation and correlation is made by a common post-processing. The approach is based on calculating the statistical figures of the random numbers and application of the differences to the ideal case for the correction.
Formal Task
Given the matrix X(n,k), which n lines contains the generated k-dimensional normally distributed random samples. The statistical parameters of these sample can be calculated: m(k) vector of

5
5
yi S x r, i
mean values and K(k,k) covariance matrix. The distribution caused by the Matrix X is
represented follows the normal distribution N(k)
(m, K). It also requires that the sample distribution
of the target N(k)
(v, C) should have specific parameters, in our particular case, v = (0, 0, ..., 0) and the matrix C should be the unit matrix (overall 0 and everywhere on the main diagonal = 1). There are two formal challenges:
The task of shifting the statistical means of the point m to point v;
The task of transforming the statistical structure, represented by the covariance matrix K, to the target matrix, represented by C.
Solution of the tasks
The first challenge is easily resolved by shift the statistical means by the difference vector r.
The second challenge requires the conversion of the statistical sample X in a new Y, which owns the target parameter. The solution is in the form of a linear operator with the conversion matrix S sought. Every vector Yi is determined the following manner:
T i 1, n
The statistical parameters of the sample Y are calculated as follows:
The vector of mean values:
E{yi } v i
E{S T x r} r E{S
T x }
i i
i i
r S T E{x } r S
T m
i i
The difference vector r can be determined from the above expression:
r v S T m
The elements of the covariance matrix are:
E{( yi i
v) ( yi v)T } C
E{(S T x
i r v) (S
T x r v)
T }
E{[S T x
i i
r (r S T m)] [S
T x r (r S
T m)]
T
E{[S T (x
i i
m)] [S T (x m)]
T }
S T E{(x
i i
S T K S
m) (xi m)T } S
For the existence of the matrix S is necessary and sufficient, that the matrices K and C are commutative. This condition is fulfilled, because the covariance matrices are symmetrical. The correction implemented for random series uses a SVD algorithm (Singular Value Decomposition) in determining the conversion matrix S.
2.2.5.2 Correction for normal distribution form The purpose of the form correction is to correct figures of the second order (Kurtosis = 0, Skewness = 0, i.e. the distribution form of the ideal normal distribution should to reached, but the results of the first correction should be retained.
i i
i
i
6
6
The following are important aspects in the implementation of this correction:
known is the inverse function of a standard normal distribution SND(0.1) a strict linear function, i.e. a synthetic linear numerical series could produce after converting an ideal standard normal distribution.
The necessary correlation = 0 between random series is given by the sequence of random numbers and through their mutual order in the random series. The sequence of each random number in a random order with regard to the sequence of all the other random numbers in the other random series should be preserved.
From the above follows an approach to the implementation of the correction, using following steps:
Each time series is converted by the inverse function.
The converted random numbers should be equal distributed, because of origin standard normal distribution. Of course, this is not the case because of random generator, and the task of correcting the form to ideal equal distribution.
The random numbers are then sorted, with their original order is saved. The new order should follow a linear function. Again, this is not the case, the numbers vary somewhat within the linear function.
The figures are then overwritten by a synthetic linear function (from 0 to 1) and converted back again to normal distribution, thus arise random series with a very good quality.
As a final step, the original order is restored, to reconstruct the initial series correlation.
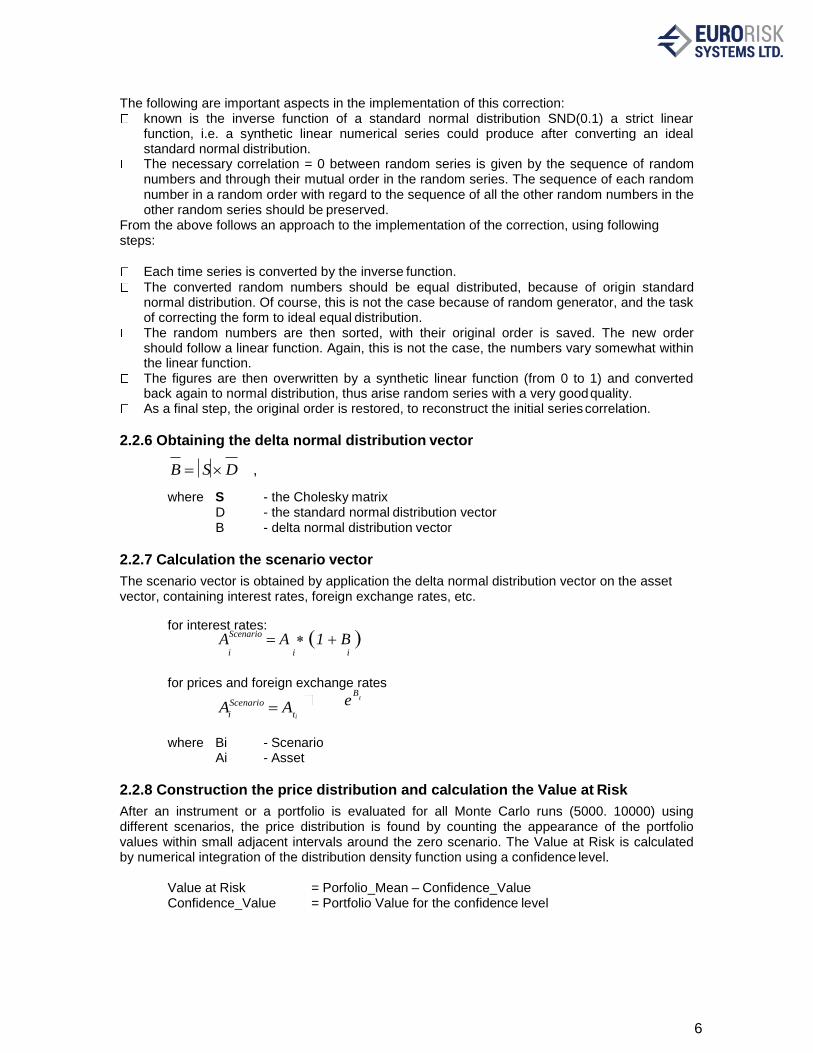
2.2.6 Obtaining the delta normal distribution vector
B S D ,
where S - the Cholesky matrix D - the standard normal distribution vector B - delta normal distribution vector
2.2.7 Calculation the scenario vector
The scenario vector is obtained by application the delta normal distribution vector on the asset vector, containing interest rates, foreign exchange rates, etc.
for interest rates:
AScenario
A 1 B i i i
for prices and foreign exchange rates
AScenario A eB
ti ti
where Bi - Scenario Ai - Asset
2.2.8 Construction the price distribution and calculation the Value at Risk
After an instrument or a portfolio is evaluated for all Monte Carlo runs (5000. 10000) using different scenarios, the price distribution is found by counting the appearance of the portfolio values within small adjacent intervals around the zero scenario. The Value at Risk is calculated by numerical integration of the distribution density function using a confidence level.
Value at Risk = Porfolio_Mean – Confidence_Value Confidence_Value = Portfolio Value for the confidence level
7
7
2.3 Instrument Representation by Pricing Expressions
Large number of instruments having closed pricing formulas such as Loan, Bond, Interest Rate Swap, Cross Currency Swap, Interest Rate Future, FRA, Bond Future, Floating Rate Note (FRN), etc. can be represented by cash flow series including payments in different currencies. The prices of these series can be expressed symbolically by pricing expressions having straight representation on pricing trees. The aim is to obtain fast simulation tree structures for the pricing formulas to achieve high performance of the subsequent simulation runs.
2.3.1 Syntax of Pricing Expressions
Pricing expressions are represented by standard arithmetic expression using a set of simple syntax rules.
expression ==> ( term ('+' | '-') expression ) | term term ==> ( factor ('*' | '/') term ) | factor factor ==> '(' expression ')'
==> 'df’'(' currency ',' [ market ',' ] period [ ',' number ] ')' ==> 'fx''(' currency ')' ==> 'ei''(' currency ')' ==> number
currency ==> 'usd' | 'eur' | ‘gbp’ | .... market ==> 'b' | 's' period ==> number
The meaning of the stochastic factors is following:
df(gbp, s, 4m, 2500) - price (discount factor) of 4 month 2500 gbp cash flow (swap market)
df(usd, b, 1.5y) - price 18 months 1 usd cash flow (bond market) fx(eur) - foreign exchange rate leading currency for 1 eur ei(eur) - equity index for eur b or s - bond or swap market
2.3.2 Pricing Formula Examples
Below are given pricing formula examples, which can be used as templates for other instruments. Each example is commented using some abbreviations:
Fr - frequency; Ma - maturity; Ir - interest rate; Po - position; Cu - currency; Na - notional amount; Fp - future price; Fx - FX rate
1.Government Bond: Fr=12m, Ma=2y, Ir=6.4%, Na=10000, Po=long, Cu=eur
FixedCF(DEM) = 10000*(0.064*(DF(eur,b,12m)+DF(eur,b,24m))+DF(eur,b,2y))
simplified to: DF(eur,b,360,640) + DF(eur,b,720,10640)
2.Float cash flow: Fr=1y, Ma=2y, Ir=float, Na=1000, Po=long, Cu=usd
FloatCF(USD) = ((df(usd, s, 0y)/df(usd, s, 1y)-1)*df(usd, s,1y)+ (df(usd, s, 1y)/df(usd, s, 2y)-1)*df(usd, s, 2y)+df(usd, s, 2y))*1000
simplified to: df(usd,0y,1000) --> i.e. risk free value of 1000

8
8
3.Profit&Loss of 7x3m FRA: Ma=7m, Na=1000, Po=short, Cu=gbp, Ir=0.06
P&L-FRA(GBP) = 8000*(0.06/4-df(gbp,7m)/df(gbp,10m)-1))*df(gbp,10m)
simplified to: df(gbp,10m,8012)-df(gbp,7m,8000)
4.Representation of a simple instrument with two payments IR(t+1) and IR(t+2)
The payments are in a foreign currency. The discount factors are split on standard zero curve vertices. The pricing expression is as follows:
Price IRt 1 DFt 1 IRt 2 DFt 2 FX Nominal
The corresponding pricing tree is shown on chart 3.
Chart 3. Pricing Tree Example
2.3.3 Semantic of Pricing Expressions
2.3.3.1 Forward Pricing
The evaluation of pay off requires forward pricing for various future evaluate dates, that is the pricing formulas should be able to express forward prices and discount factors:
forward_df(te, Ti) = df(t0,Ti) / df(t0,te)
2.3.3.2 Forward Interest Rates
The forward interest rates should be expressed by discount factors from zero curves for the desired currency using the arithmetic operators:
forward_interest_rate(Ti-1, Ti) = (df(t0,Ti-1) / df(t0,Ti) – 1) / Period
2.3.3.3 FX Rate Representation The representation of FX rates should follow a straight approach based on a leading currency, that is the base currency of the used FX-Table connected with volatility and correlation data of all FX rates related to this leading currency. Using the notation:
Cashflow Mapping, Volatility und Korrelationsmatrix
Market risk pricing tree
VaR
+ +
/
* *
*
DF(t+1) DF(t+2)
Fx
0 IR(t+1) IR(t+2) Nominal

9
9
fx( Cu1, Cu2 ) = foreign exchange rate Cu1 -> Cu2 (how many units of Cu1 costs one unit of Cu2 ),
we can express all needed rates, for example assuming USD as leading currency:
fx( USD, Cu2 ) = fx(Cu2) fx( Cu1, USD ) = 1/fx(Cu1) fx( Cu1, Cu2 ) = fx(Cu2)/ fx(Cu1)
2.3.4. Representation of Instruments
Two concepts: cash flows (or pay off) and option rights are enough to explain the nature of most financial instruments by closed formulas that can be simulated on a pricing tree.
2.3.4.1 Interest rate and FX instruments
Redemption payments on future dates are specified according to an amortizing schedule, the final redemption payment zeroes the initial debt. Fix or float interest rate payments on the remaining debt are defined according to future interest rate periods. Linear combinations (portfolio) of this basic schema are used to express much more complex instruments such as interest rate swap, reverse floater, etc. or such as the cross currency swap involving two currencies. All instrument payments can be seen as one or more cash flow series in one or more currencies or as a portfolio of single payments in one or in more currencies. So the theoretical price of this instrument group is given by a linear sum of discounted payments grouped by currency and aggregated to a consolidation currency using spot foreign exchange.
j i
Price fx j npvi , where npvi cfi dfi
All cash flow payments cfi are split and cumulated on standard zero curve vertices. This
increases the performance of Monte Carlo dramatically because the number of simulated cash flow prices is reduced to number of standard zero curve vertices, e.g. 1000 of bonds are represented on small set of vertices, for example 1, 3, 6, 12 months and 2, 3, 5, 7, 10, 30 years. Three basis nodes are derivable from above:
fix cash flow: fix(currency, market_id, time, value) float cash flow: float(currency, market_id, time1, time2, value) foreign exchange: fx(currency, market_id, time, value)
2.3.4.2 Stock instruments
Shares inclusive dividends can be treated as cash flow according to current market share price and future dividend payments. Abstract assets such as the stock index used as underlying of options or of futures can be seen as payments too because there is a fixed price for every stock index point. Share volatility is usually linked to stock index volatility by Beta factors, but shares can be treated separately too..
2.3.4.3 Future instruments:
The future contracts involve symmetric right and obligation to buy or to sell an asset on a future date for a predefined asset price. This deal type can be expressed by a linear combination (portfolio) of two lending/borrowing transactions: one on the today date and one on the future date, so futures can be explained fully by these two transactions. Interest rate futures including FRA consist of lending/borrowing on two different future dates while foreign exchange futures and outright deals with future exchange of two currencies. Futures incomes (Profit & Loss) can be represented using the same way as for the interest rate asset instruments, i.e. by a linear sum of discounted payments in one or in two currencies.

10
10
T T
2.3.4.4 Option instruments
The representation of options is more complex and depends on contract conditions and option right period. Current version of market risk engine in PMS values only European options on generalized Black & Scholes node. Complex path dependent multi-option rights are valued by linearization based on key rate values.
Generalized Black&Scholes Valuation
A basis node included into pricing trees (s. Chart 4.) to represent general European options including many exotics such as digital option is defined as follows:
max (asset1 , asset2 , exer_date, volume)
Exercise right
Date, Grid T Period
Option
max
S1 S2
Asset Object: - Incomes
+ Outcomes
Asset 1
Asset 2
Chart 4. Option Valuation within generalized Black&Scholes Node
Price, annual volatility or implied term structure construct, currency, asset incomes and outcomes and market_id for linking to market data sources are properties of the underlying assets and not of the option self, i.e. they should be supplied by the underlying asset or through an underlying asset object (a more complex asset).
3. Dimensions and Risk Measures of Monte Carlo Simulation
3.1 Risk Drivers
Following risk drivers are recognized for every currency and market and are fully correlated (s. Chart 5):
Interest rate curves represented by standard vertices in money and capital market segments.
FX rates.
Shares and stock indexes.
Spread curves to simulate credit risk based on CDS Spreads.
Spread indices, e.g. ITRAX, to simulate credit risk based on CDS spread for Index basket.
Data Sources – Prices, Curves, Volatility, Correlation
Price
11
11
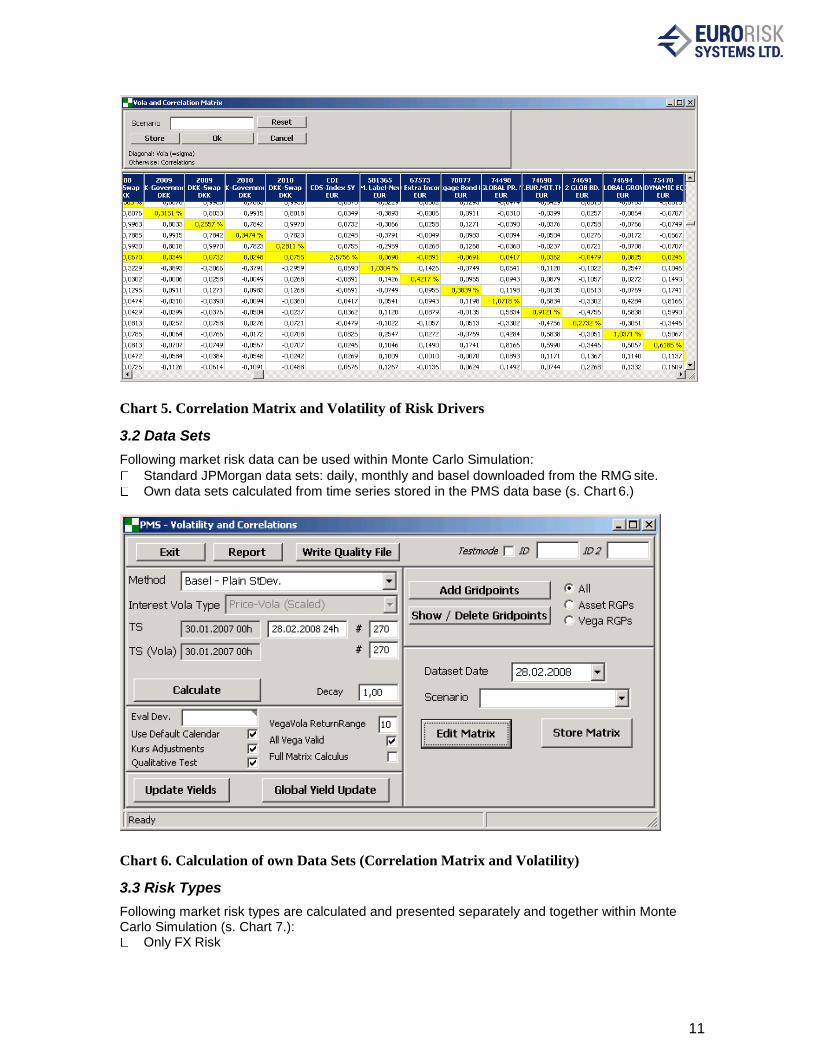
Chart 5. Correlation Matrix and Volatility of Risk Drivers
3.2 Data Sets
Following market risk data can be used within Monte Carlo Simulation:
Standard JPMorgan data sets: daily, monthly and basel downloaded from the RMG site.
Own data sets calculated from time series stored in the PMS data base (s. Chart 6.)
Chart 6. Calculation of own Data Sets (Correlation Matrix and Volatility)
3.3 Risk Types
Following market risk types are calculated and presented separately and together within Monte Carlo Simulation (s. Chart 7.):
Only FX Risk

12
12
Only Share and Stock Index Risk
Only Interest Rate Risk
Only Spread and spread Index Risk
Total Risk
Incremental Risk
Marginal Risk
VaR Standard and Expected Shortfall at Confidence
Incremental VaR The Incremental VaR (IVaR) of a position with respect to a portfolio can be thought of as the amount of risk that the position is adding to the portfolio (s. Chart 8). In other words, Incremental VaR tells us how the VaR of our portfolio would change if we sold a specific position. Incremental VaR can be formally defined as the difference between the VaR of the total portfolio and the VaR of the portfolio without the position:
Marginal VaR The Marginal VaR (MVaR) exposes the potential effect that buying or selling a relatively small portion of a position, for example 1 %, would have on the overall risk (s. Chart 8). For example, in the process of rebalancing a portfolio, we often wish to decrease our holdings by a small amount rather than liquidate the entire position. Marginal VaR (MVaR) is a statistic that provides information regarding the sensitivity of VaR to changes in the portfolio holdings.
Expected Shortfall Expected Shortfall (VaR-ES) is a subadditive risk statistic that describes how large losses are on average when they exceed the VaR level, and hence it provides further information about the tail of the P&L distribution. Mathematically, we can define Expected Shortfall as the conditional expectation of the portfolio losses given that they are greater than VaR. Expected Shortfall is useful statistic that provides valuable additional information and is important to measure flat tailed distributions.

13
13
Chart 7. Market Risk Evaluation Dialog
Ser Num Action Include
(Mark)
Not Amount Coupon Instrument Type
Curr Total VaR Incremental VaR
Marginal VaR
209896 Long * 1 000 000,00 4,00% Bond EUR 7 056,10 7 056,10 -70,56
A0AHHM Long 1 000 000,00 5,50% Bond EUR
Porfolio 7 056,10
209896 Long 1 000 000,00 4,00% Bond EUR
A0AHHM Long * 1 000 000,00 5,50% Bond EUR 12 584,33 12 584,33 -125,84
Porfolio 12 584,33
209896 Long * 1 000 000,00 4,00% Bond EUR 6 929,04 5 860,17 -79,16
A0AHHM Long * 1 000 000,00 5,50% Bond EUR 12 647,90 11 515,89 -105,28
Porfolio 18 444,50
Chart 8. Excel Export of Total Marginal and Incremental VaR
14
14
3.3 Simulation Parameters
Following main market simulation parameters are used to control the Monte Carlo Simulation (s. Chart 7.):
Number of Monte Carlo runs: usually 4.000, but larger number of runs is possible.
Horizon days: holding period, default 1 day, can be set for example to 10 days.
Valuation Date and Date of Correlation Matrix in the data base.
Confidence Level, for example 99% and corresponding multiplier for standard deviation
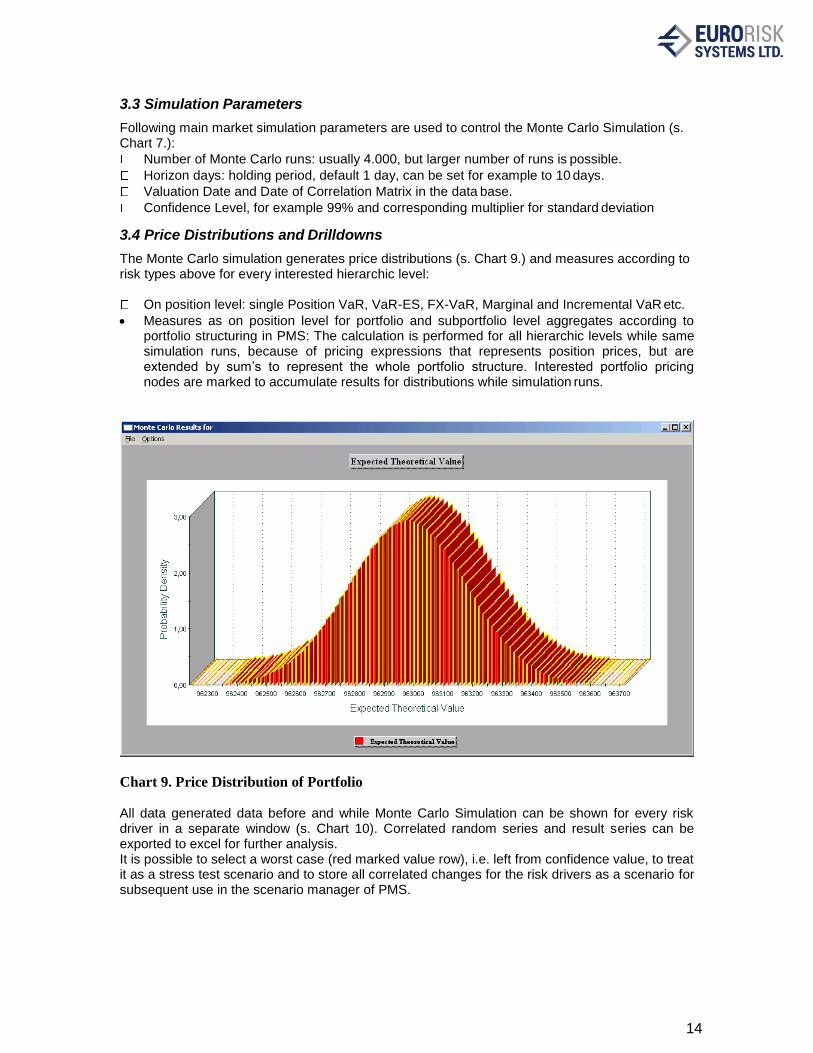
3.4 Price Distributions and Drilldowns
The Monte Carlo simulation generates price distributions (s. Chart 9.) and measures according to risk types above for every interested hierarchic level:
On position level: single Position VaR, VaR-ES, FX-VaR, Marginal and Incremental VaR etc.
• Measures as on position level for portfolio and subportfolio level aggregates according to portfolio structuring in PMS: The calculation is performed for all hierarchic levels while same simulation runs, because of pricing expressions that represents position prices, but are extended by sum’s to represent the whole portfolio structure. Interested portfolio pricing nodes are marked to accumulate results for distributions while simulation runs.
Chart 9. Price Distribution of Portfolio
All data generated data before and while Monte Carlo Simulation can be shown for every risk driver in a separate window (s. Chart 10). Correlated random series and result series can be exported to excel for further analysis. It is possible to select a worst case (red marked value row), i.e. left from confidence value, to treat it as a stress test scenario and to store all correlated changes for the risk drivers as a scenario for subsequent use in the scenario manager of PMS.

15
15
Chart 10. Show Monte Carlo Series and Prices

16
16
4. Detailed Example of VaR Calculation using Monte Carlo Simulation
4.1 General Remarks to Monte Carlo Simulation
The calculation of market VaR for financial instruments using Monte Carlo Simulation is based on a set of approaches and assumptions:
• The market VaR of a position in a financial instrument is a probable negative move of the price value of the position as result of negative correlated move of the underlying market factors such as interest rates, foreign exchange rates or spreads which influence the price value.
• The negative move of the price value is accounted for given risk horizon, for example 1 day or 20 days from valuation date and for a selected confidence level, for example 95% or 99%.
• Te price value of the position at the valuation date is known, but for the risk horizon the price value can be estimated by a distribution of the price value having expected value and confidence value (i.e. a value left from distribution corresponding to confidence level). The VaR of the position (or of a portfolio) is then given by:
VaR = expected value – confidence value
• Monte Carlo simulation is used to generate the distribution of the price values on risk horizon calculating different price values for a large set, for example 5000, of correlated scenarios of the underlying market factors. These 5000 price values represent the needed price distribution.
• The first step in running the Monte Carlo simulation on a position (or on a portfolio) is the representation of pricing model (formulas to calculate the price value) in a effective way so that this model can be calculated 5000 times at different market conditions effectively.
• An effective representation of the pricing formulas is an arithmetic expression tree including arithmetic operators such as -, +, /, *, stochastic variables for the market factors, constants and option elements to represent option rights.
• The second step includes the generation of correlation matrix and volatility vector for all needed market factors from historic series for these factors. The matrix and the vector are then used to create large set of synthetic scenarios for the market factors.
• These scenarios for the market factors are the used to simulate the pricing model where a set of small correlated changes (the scenarios) is applied on the market factors within the tree representation for every Monte Carlo run.
• The result from pricing model is the stored for every Monte Carlo run and is used then to represent the price distribution and as basis to calculate the expected value and the VaR.
This section describes in detail the presentation and the simulation of an example swaption instrument showing the swaption conditions, the pricing model, the pricing expression tree and the simulation and VaR results.
4.2 Example Instrument: Swaption
4.2.1 Contractual Agreement for Swaptions
A swaption is an swap option granting its owner the right but not the obligation to enter into an underlying swap on the option exercise date. The term "swaption" typically refers to options on interest rate swaps. There are two types of swaption contracts:
• A payer swaption gives the owner of the swaption the right to enter into a swap where they pay the fixed leg and receive the floating leg.
17
17
• A receiver swaption gives the owner of the swaption the right to enter into a swap where
they will receive the fixed leg, and pay the floating leg. The buyer and seller of the swaption agree on:
• the premium (price) of the swaption
• the strike rate (equal to the fixed rate of the underlying swap)
• length of the option period (which usually ends two business days prior to the start date of the underlying swap),
• the term of the underlying swap,
• the currency of Swaption and underlying swap
• notional amount,
• amortization, if any
• frequency of settlement of payments on the underlying swap
Swaptions can be viewed as options on the "fixed" side of a swap. This follows from the theoretical assumption of a liquid market on which it is possible at any time without additional cost to enter into a swap with fixed coupon equal to the forward swap rate.
4.2.2 Pricing Approach for Swaptions
Swaptions can be priced using Black-model based on following assumptions:
• In a liquid market, it is possible at any time T to enter the "fair" payer or receiver swap at the forward swap rate. By definition F is the (Foward) swap rate, those recruited from today's perspective the underlying swap as fair (swap price is zero). In other words, the forward values of the fixed and of the variable swap sides are equal.
• This results then the payoff function depending on the forward swap rate F and on the the strike rate S (equal to the fixed rate of the underlying swap) of a receiver swaption, as follows.
PayoffReceiver (F) = cash-flow payment of the fixed swap side is the max (S-F, 0) The swaption holder could go down for any realization of the swap rate F at time T at no-costs a payer forward swap on the basis of the forward swap rate. Payments from the variable site from the receiver swaption and the corresponding income from the payer swap cancel each other out. Remaining are negative payments from the Payer Swap (-F) and the revenues from the receiver swap (S). Since this structure is optional, the option holder will choose this construct only if S> F, in the other case he don’t exercise the option and contract the underlying swap.
With the usual assumptions of the Black-model (the Volatility of F is log-normally distributed with
) the price of the swaption can be calculated as the expected value of the payoff function discounted to the valuation date:
PreisRecSwaption (F) Nominal * PriceFact or * (S*N(-d2 ) F*N(-d1 ) ),
where Nominal the nominal value of the swaption (and of the underlying swap)
PriceFactor Sum(DF(ti)) * / Number of Payments per Year DF(ti) discount factor for cash flow date of Cashflow(i)
period length of the fixed side of the swap N (.) The standard normal distribution function
d1 = ln ((F / S) + 2
T / 2) / ( sqrt (T)) and
d2 = d1 - sqrt (T)

18
18
T duration of the swaption S strike rate of the swaption (coupon of the fixed side of the swap) F forward rate of the swap
Volatility of F p.a.
Analog the price for a payer swaption is given by:
PreisPaySwaption (F) Nominal * PriceFact or * (F N(d1 ) S N(d2 ) )
Calculation of the forward rate F of the swap is based on the fair condition:
PV(Float Side) = PV(Fix Side), i.e.
iEnd
DF(tStart ) DF(tEnd )
DF(tStart ) DF(tEnd ) F dt(ti1 ,ti ) DF(ti ) iStart1
F iEnd
dt(ti1 ,ti
) DF(ti )
where
DF(ti) discount factor for time point i ti end date of period i dt(i-1, i) period length between i-1 and i tStart, tEnd start and end date of the swap
iStart1
The above pricing model includes following elements into pricing formulas:
1. Stochastic elements: Discount Factor nodes DF(i) for the Price Factor and for the forward rate F
Black-Model node using S, F and (for the duration T it is sqrt (T)) 2. Non-stochastic elements:
Constant nodes (period length, Nominal, strike S, duration T in years) Arithmetic operators nodes (+, -, /, *)
4.2.3 Data of an example Swaption
Chart 11. shows the data and static results of an example swaption used to explain the simulation approach. Following contract data are important with respect to the pricing model:
• Nominal Amount = 1 000 000 in EUR
• Exercise Swap Rate S = 2.9%, Forward Swap Rate F = 2.9164%
• The Market Volatility of Forward Swap Rate F is 28.01%
• Position is Long, i.e. we should pay the Option Value
• The underlying swap is a payer left side swap (the fix side) = payer swaption
• The market factors are the zero discount factors of the evaluation curve EUR-Swap.
• The life of the Swaption is exactly 1 year, the life of the swap is exactly 3 years, so the relevant market factors are the discount factors on the points 1, 2, 3 and 4 years
The contractual conditions of the swaption and of the underlying swap are simplified (equal frequencies, 1 year periods, Day count = 30/360) for better understanding of the simulation approach. Charts 12, 13 and 14 show the data of the underlying swap.

19
19
Chart 11. Definition of example Swaption
Chart 12. Underlying Swap

20
20
Chart 13. Left fixed side of the swap
Chart 14. Right floater side of the swap

21
21
4.2.4 Representation of the example Swaption on Piricng Tree
The pricing model from above can be rewritten for the example swap as follows:
PaySwaptionValue(EUR) = Nominal(EUR) * PiceFactor * BlackCallOption(F, S, (T))
PiceFactor = DF(EUR-Swap, 2Y) + DF(EUR-Swap, 3Y) + DF(EUR-Swap, 4Y)
F = (DF(EUR-Swap, 1Y) - DF(EUR-Swap, 4Y)) / PiceFactor
Here = 1 period length of the fixed side of the swap n = 3 number of swap periods (from year 1 to year 4) T = 1 duration of the swaption
(T) = sqrt (T) = Volatiluity of forward swap rate
After replacing example swaption data into formulas above we receive formulas that can be represented by fast pricing tree used for the Monte Carlo simulation:
PaySwaptionValue(EUR) = 1 000 000 * PiceFactor * BlackCallOption(F, 0.029, 0,2801)
PiceFactor = DF(EUR-Swap, 2Y) + DF(EUR-Swap, 3Y) + DF(EUR-Swap, 4Y)
F = (DF(EUR-Swap, 1Y) - DF(EUR-Swap, 4Y)) / PiceFactor
The corresponding pricing tree is shown on chart 15.
.
Chart 15. Pricing Tree Example
22
22
The Price Factor is a sum of discount factor nodes, the Forward Swap Rate F make use of the Price Factor as divisor. The Black Call Option is applied on the Forward Swap Rate F against the Strike and assumes the volatility of the Forward Swap Rate F. The Option Price is then multiplied by the Nominal and by the Price Factor. Except for the Option node the tree representation is based only on two-operand arithmetic operators which are elements of the pricing formula.
4.3 Simulation der Swaption
The Simulation is based on Monte Carlo simulation scenarios for a large set of runs, for example 4000. The Monte Carlo scenarios are obtained from Correlation Matrix and Volatility Vector for market factors obtained by historic statistic over their time series as shown in Section 2. The correlation matrix and volatility vector for the example swaption are given below. The volatility was calculated on daily basis. The example VaR simulation was performed without including the Vola risk factor assuming zero volatility of the implied volatility and for this reason the Vega part of the swaption risk will be ignored. In case of including the Vega risk, we should have historic time series for the implied volatility and include corresponding volatility and correlation into missing row and column of tables below.
Correlation Matrix for Swaption Simulation
EUR-Swap 1 Year
EUR-Swap 2 Years
EUR-Swap 3 Years
EUR-Swap 4 Years
Implied Volatility
EUR-Swap 1 Year 1 0.2215 0.2564 0.1266 … EUR-Swap 2 Years 0.2215 1 0.8202 0.7799 … EUR-Swap 3 Years 0.2564 0.8202 1 0.9135 … EUR-Swap 4 Years 0.1266 0.7799 0.9135 1 … Implied Volatility … … … … 1
Volatility Vector for Swaption Simulation
Market Factor Matrix Risk Grid Point Volatility EUR-Swap 1 Year Money 42 0.00029899 EUR-Swap 2 Years Swap 182 0.00132174 EUR-Swap 3 Years Swap 183 0.00198575 EUR-Swap 4 Years Swap 184 0.00264766 Implied Volatility … …
The simulation is performed using following steps:
• Set up the simulation parameters on Chart 16. (in the example simulation to 4000 runs, Confidence level = 99%, Horizon of risk = 1 day). The simulation process is started with the Recalc button
• The correlation and volatility for needed risk factors of the swaption are extracted from large correlation matrix on 31.03.2008. The correlation matrix and volatility vector are calculated in advance based on the historic time series.
• The market factors are not the market rates, the corresponding discount factors are used as market factors which simplifies the simulation. The discount factors are calculated from market rates using curve bootstrapping before running the statistic and the calculation of the correlation and the volatility of the discount factor daily performance.

23
23
• A set of 4000 normal distributed and correlated scenarios are calculated before
simulation for all risk factors, this is in fact a matrix of 4000 x 4 of normal distributed and correlated random samples with mean 0 and volatility 1. A lot of corrections of the random samples are performed (s. 2.2.5 above).
• The pricing tree for the swaption according to chart 15. is constructed in the memory. This is in fact a representation of the pricing formula for the swaption that will be simulated, i.e. the pricing formula is calculated 4000 times. The tree representation allows for very fast calculation because the interpreting pricing routine is small and it can be hold in the processor cache memory.
Chart 16. Monte Carlo Simulation of the example Swaption
• Before the simulation the static actual values of the market factors are applied on the
market factors of the tree (in the example this are the discont factors on 1, 2, 3 and 4 years, and eventually the implied volatility)

24
24
Chart 17. Simulation Distribution of the Swpation price series
• For every Monte Carlo run the module obtains the next set (row) of normal distributed
and correlated samples, multiplies this vector with the volatility vector and applies exponentially the small changes as scenarios on the static actual values. The whole tree is then calculated by recursive procedure which obtains the price on the top node of the tree. This price is stored, so after 4000 runs the price series of swaption prices can be used to give the resulting distribution and statistics.
• The distribution mean and VaR are then obtained from swaption price series (s. Chart 17.) The distribution is skewed and not normal, it should be close to log-normal because of the used Balck-model.
• The distribution mean (the expected value) is 9348.39 and it is close to static calculation of 9294,16 (Theoretical Value on Chart 11.). The VaR is calculated from distribution to 2982.01. The calculation of the confidence value is simple, 1% (100% - 99%) of 4000 prices is 40 prices. The price series is sorted into ascending order, so the 40-en price is the confidence value and VaR is then: confidence value – expected value.
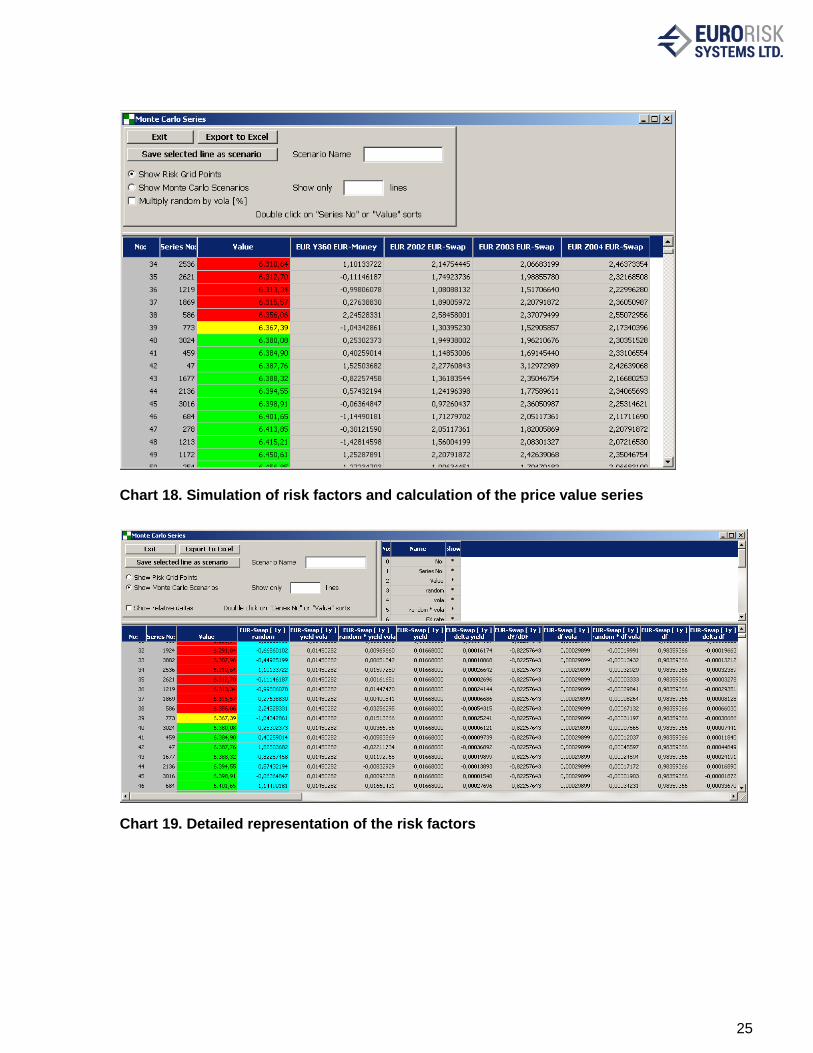
• The price values according to scenarios are represented on Chart 18., for every set of correlated samples of the 4 factors a new price value is calculated. The confidence value (the yellow row on Chart 18.) is obtained after ordering the price value series.
• Cahrt 19. Show detailed representation of primary risk factor series (market interest rates) and of secondary risk factors sereis (discount factors obtained after bootstrapping every historic market curve within the historic period, ussually 1 year).
25
25
Chart 18. Simulation of risk factors and calculation of the price value series
Chart 19. Detailed representation of the risk factors

26
26
5. Spread VaR Calculation using Monte Carlo Simulation
5.1 Further Remarks to Monte Carlo Simulation
The calculation of market VaR for financial instruments using Monte Carlo Simulation is based on a set of approaches and assumptions given in 4.1 General Remarks to Monte Carlo Simulation. Following further remarks are outlined additionally below:
The pricing formula implemented as closed formula on the simulation tree can be different from pricing model at static price calculation within portfolio for many reasons:
• Only a small set of RGP (Risk Grid Points) represents the interest rate risks, i.e. 1 Mo, 3 Mo, .. , 1Y, 2Y, .. . For these RGPs there are volatility and correlation in the market risk matrix. So all intermediate cash flows are mapped on the existing grid points using splitting on the left and on the right GRP. This splitting is neutral related to volatility and PV of the original cash flow, but at skewed Monte Carlo distributions the expected value achieves not exactly the static PV.
• Only a small set of RGP (Risk Grid Points) represents the credit spread risks. Similar splitting as for interest rates is used for intermediate future time points, where cumulated default probabilities, i.e. PDs along the time axis, are needed
• Options are represented by Black-Nodes, so no other option types, i.e. exotic or path dependent, etc., can be simulated. These options are mapped to Black-Options.
• Instruments that use a numeric pricing model, like HW, can’t be simulated on the simulation tree because of performance and missing closed pricing formulas. These instruments are approximated by key rate sensitivities and restricted Taylor expansion.
This section describes the presentation and the simulation of an example asset instrument which embeds credit risk involved by CDS spread curve connected to the instrument. The pricing model for the expected loss, the pricing expression tree, the simulation and the VaR results are shown.
5.2 Pricing Approach for Spread Risk
The spread risk calculation for assets is based on the calculation of expected loss and uses following approaches:
• Spread risk is a credit risk measured with the premium changes for credit default swaps on the CDS market.
• It is a risk that by deterioration in the creditworthiness of the Reference Entity while the CDS will increase premiums and thus the hedging costs, respectively the risk of losses are also increasing, so the spread risk as unexpected loss is the risk of the expected loss.
• Fair Value (asset) = risk free value (asset) – Expected Loss (asset), where
Risk free value (asset) is calculated with the risk free curve Expected Loss (asset) is calculated on the spread curve
• On the CDS market the fair-price of CDS = 0 fixes the fair premium for each maturity.
• Reference entities are countries, firms, concerns, CDS indices (CDX: iTraxx ® Europe).
27
27
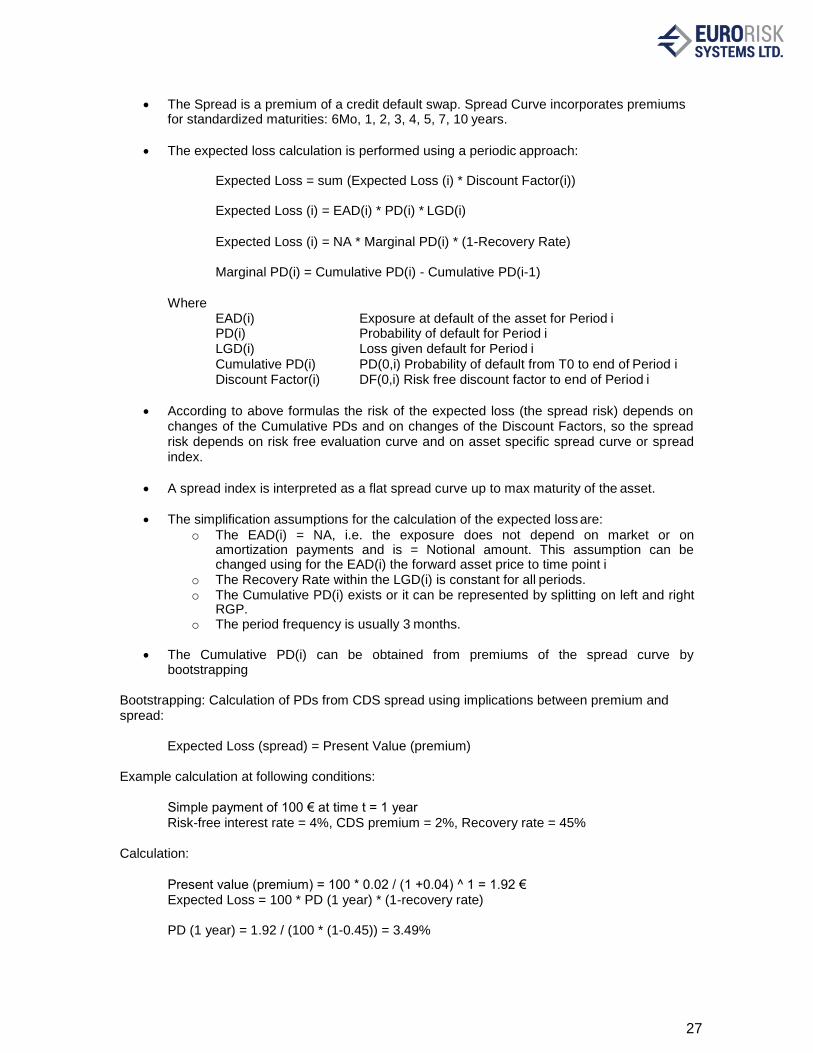
• The Spread is a premium of a credit default swap. Spread Curve incorporates premiums
for standardized maturities: 6Mo, 1, 2, 3, 4, 5, 7, 10 years.
• The expected loss calculation is performed using a periodic approach:
Expected Loss = sum (Expected Loss (i) * Discount Factor(i))
Expected Loss (i) = EAD(i) * PD(i) * LGD(i)
Expected Loss (i) = NA * Marginal PD(i) * (1-Recovery Rate)
Marginal PD(i) = Cumulative PD(i) - Cumulative PD(i-1)
Where EAD(i) Exposure at default of the asset for Period i PD(i) Probability of default for Period i LGD(i) Loss given default for Period i Cumulative PD(i) PD(0,i) Probability of default from T0 to end of Period i Discount Factor(i) DF(0,i) Risk free discount factor to end of Period i
• According to above formulas the risk of the expected loss (the spread risk) depends on changes of the Cumulative PDs and on changes of the Discount Factors, so the spread risk depends on risk free evaluation curve and on asset specific spread curve or spread index.
• A spread index is interpreted as a flat spread curve up to max maturity of the asset.
• The simplification assumptions for the calculation of the expected loss are:
o The EAD(i) = NA, i.e. the exposure does not depend on market or on amortization payments and is = Notional amount. This assumption can be changed using for the EAD(i) the forward asset price to time point i
o The Recovery Rate within the LGD(i) is constant for all periods. o The Cumulative PD(i) exists or it can be represented by splitting on left and right
RGP. o The period frequency is usually 3 months.
• The Cumulative PD(i) can be obtained from premiums of the spread curve by bootstrapping
Bootstrapping: Calculation of PDs from CDS spread using implications between premium and spread:
Expected Loss (spread) = Present Value (premium)
Example calculation at following conditions:
Simple payment of 100 € at time t = 1 year Risk-free interest rate = 4%, CDS premium = 2%, Recovery rate = 45%
Calculation:
Present value (premium) = 100 * 0.02 / (1 +0.04) ^ 1 = 1.92 € Expected Loss = 100 * PD (1 year) * (1-recovery rate)
PD (1 year) = 1.92 / (100 * (1-0.45)) = 3.49%

28
28
Risk-free present value = 100 / (1 +0.04) ^ 1 = € 96.15
Risk present value = 96.15 - 1.92 = € 94.23
Implied yield spread (spread on the evaluation of curve):
Risk present value = 100 / (1 +0.04 + Yield Spread) ^ 1 = € 94.23
Yield Spread = 100 / 94.23 - (1 + 0.04) = 2.12% An extended description of calculation of the expected loss and of the bootstrapping method is given in the document Spread Calculator description v3.doc.
5.3 Monte Carlo Simulation to obtain Spread VaR
The representation of the VaR distribution with and without included spread risk is given on Chart 20. The simulation of spread VaR involves a set of steps:
Chart 20. Representation of distributions with and without spread risk
• Inserting of the CDS curves factors as risk grid points into risk grid points list.
• Calculation of the market risk volatility and correlation matrix bootstrapping the historical spreads of curve vertices into cumulative PDs per maturity.
• Construction of an expected loss simulation tree based on formulas for calculation of the expected loss above or from document Spread Calculator description v3.doc before simulation.
Expected valaue
without spread risks
Probability
0 Asset value
Expected valaue with spread risks
Interest + Spread VaR simulation distribution PMS
Monte Carlo
PMS Monte Carlo
Bad rating
Interest + Spread VaR Interest VaR Spread Expected Loss

29
29
• Subtract this tree from simulation tree of the credit risk free asset according to formula:
Fair Value (asset) = risk free value (asset) – Expected Loss (asset)
• Simulation of the asset together with all other assets within portfolio and create the Monte Carlo distribution for risky asset, i.e. including expected loss risk.
• Obtain the VaR results:
Interest rate VaR, spread VaR, total VaR, Incremental and Marginal VaR, etc.
• The spread VaR is calculated separately using blocking of all other RGPs except the RGPs (Cumulative PDs) from bootstrapped spread curve.
The subtraction of the expected loss tree from simulation tree of an asset involves two effects:
• The common distribution is moved to the left by the expected value of expected loss
• The distribution becomes additional volatility because of volatility of expected loss, i.e. the distribution includes correlated effects of interest rate and spread volatility.
The bad issuer rating causes higher CDS premiums and therefore higher cumulative PDs. Thus, the expected loss and the volatility of expected loss become higher, so the distribution moves to the left as shown on Chart 20.
5.4 Spread VaR Simulation Example
Chart 21. Single fix bond in a portfolio
The calculation of spread VaR on Monte Carlo simulation tree will be shown for a simple asset example. The analysis portoflio from Chart 21. includes only one fix bond position. The currency of the bond and of portoflio os EUR. The calculation is performed on 31.03.2009.
The bond exposes two payments according to panel parameters:

30
30
• 500 000 EUR on 31.03.2010 as interest rate payment
• 10 500 000 EUR on 31.03.2011 final redemption of the notinal amount of 10 000 000 EUR + 500 000 EUR interest rate payment
Chart 22. Bond data details
This cash flow structure will produce very simple simulation tree consisting of two nodes for discount factor on 1 year and on 2 years which coincide to RGPs of the EUR-Swap market curve assumimg it is credit risk free.
A spread risk calculation is included for the bond as a result of selection of a CDS spread curve in the Field Credit Risk Curve on Chart 23. Current premiums per maturity from spread curve are given in the Spreads and PD browser. Cumulated PDs and marginal PDs are obtained by bottstrapping from the CDS premium. The ISDA Standard CDS bootstrapping method is used for the bootstrapping.
The expected loss is the calculated to be 307 910,13 EUR using a periodic approach and 3 months periods. The calculation of the expected loss is shown on Chart 24. Periodic expected loss calculation for the example bond.

31
31
Chart 23. Expected loss calculation: bootstrapped CDS Curve
Chart 24. Periodic expected loss calculation for the example bond
The RGPs of the spread curve are included into market risk correlation matrix together with the RGPs of evaluation curve and all other market risk factors. However, the example bond needs interest risk RGPs only till 2 years and only 2 RGPs from spread curve. The Monte Carlo simulation module extracts from large correlation matrix only 6 RGPs given in table below. They are 4 interest rate RGPS and 2 spread curve RGPs.

32
32
Risk Grid Points within market risk matrix for the example bond
Global Monte Carlo matrix: Risk Grid Points: 6 Volatility
0 1 2 3 4 5
0 1 0,5228 0,1195 0,3833 0,0497 0,1217 [EUR Y090 EUR Money] 0,0007%
1 0,5228 1 0,037 0,8427 0,0668 0,1676 [EUR Y180 EUR Money] 0,0022%
2 0,1195 0,037 1 0,0205 0,6456 0,0705 [EUR Z001 BASF-AEUR-MMCM] 12,5450%
3 0,3833 0,8427 0,0205 1 0,0349 0,1705 [EUR Z001 EUR Swap] 0,0083%
4 0,0497 0,0668 0,6456 0,0349 1 -0,0016 [EUR Z002 BASF-AEUR-MMCM] 8,1285%
5 0,1217 0,1676 0,0705 0,1705 -0,0016 1 [EUR Z002 EUR Swap] 0,1426%
Chart 25. Spread risk simulation tree: bond tree – expected loss tree
The simulation tree of the total risk (bond + expected loss) is given on Chart 25. The simulation tree follows exactly the pricing formula of bond including expected loss. The bond pricing tree is shown on the left and it consists of two discount factor nodes for 1 year and for 2 years. The expected loss part realizes the formula:
Sum ((Cumulative PD(i) - Cumulative PD(i-1)) * Discount Factor(i)) * NA* (1-Recovery Rate)
There are totally 8 summands in the sum corresponding to 3 months periods within 2 years maturity of the bond. Every summand includes the term: Marginal PD(t) * Discount Factor(t). The marginal PD(t) is represented as difference of Cumulative PDs at period begin and at period end and by splitting on the left and right spread RGP. The same splitting is done for the discount factor too. The sum is the subtracted from bond tree, the result after the subtraction is then multiplied by NA of 10 Mios and by the 1-Recovery Rate = 0,6. The representation of the simulation tree assumes fixed EAD = NA. The simulation structure should be changed if the development of the EAD along the time axis should be recognized according to forward bond calculation. The price distribution is obtained by price calculation on the tree for every Monte Carlo scenario starting on the VaR node and using recursive procedure along the simulation tree.
Simulation: Volatility Vector and Correlation Matrix
Spread risk simulation tree Recov. Rate
1-0.4
*
+ 1
+ 2 6
Expected
Loss VaR
0 +
Bond
Price
-
*
+ + * -
Marginal
PD
0.05 1.05 x 1-x y 1-y
DF(1Y) DF(2Y) DF(1Y) DF(2Y) CPD(2Y) CPD(1Y) Nominal
10 000 000

33
33
Chart 26. VaR results in PMS
The simulation results are presented on chart 26. A spread VaR of 58 491,28 is calculated on the tree by blocking the scenarios on the interest rate nodes, i.e. only the CPD nodes are simulated in this case, all other nodes remain static for all simulaton runs.
Chart 27. Monte Carlo simulation series for the 5 RGPs

34
34
Chart 28. Monte Carlo simulation distribution for total VaR
Charts 27. and 28. show the simulation scenarios and the resulting distribution for total VaR.