market segmentation study
DESCRIPTION
Market Segmentation Study. Phase 1Top Five Broad Segments Top Three Segments. Overview. Project Approach Macro Environment Climate and Environment Counties and Provinces Demographics Employment Income Education Economy Political Structure Technological Infrastructure - PowerPoint PPT PresentationTRANSCRIPT

1
Market Segmentation StudyPhase 1 Top Five Broad Segments
Top Three Segments

2
Overview• Project Approach• Macro Environment
– Climate and Environment– Counties and Provinces– Demographics– Employment– Income– Education– Economy– Political Structure– Technological Infrastructure
• Energy Demand– Fuel Use– Cooking Fuel
• Energy Stacking• Factors Influencing Energy Demand
– Biomass– Kerosene– LPG– Electricity
• Cook Stove Industry– Cook Stove Industry by Region

3
Overview• Cook stove Consumer• Net Socio Economic Benefits of ICS
– Improved Fuel Wood Stoves– Improved Charcoal Stoves– Improved Kerosene Stoves– Improved LPG stoves– Improves Electric Stoves
• ICS – Upfront Costs• Fuel Costs • Barriers to Improved Cook Stoves adoption• ICS Market Needs• Factors Influencing ICS adoption – Market Drivers• Segments of Energy and Cook Stove Consumers
– Broad Segments– Top Three Segments
4
AcronymsAGOL Africa Gas and Oil Limited
CBO Community Based Organization
ICS Improved Cook Stoves
KUSCCO Kenyan Union of Savings and Credit Co-operatives
KRC Kenya Railway Corporation
LPG Liquefied Petroleum Gas
MOU Memorandum of Understanding
MF Microfinance
MFI Microfinance Institution
NGO Non Governmental Organization
SACCO Saving and Credit Co-operative Society

5
Introduction• co2balance, in partnership with the Global Alliance for Clean Cookstoves, have identified the main
consumer segments in Kenya and closely examined those with the greatest potential to reach large scale improved cook stove and fuel adoption.
• The objective of this study was to assess the viability and successful uptake of improved cook stoves and fuels in different segments in Kenya at the local level. The information obtained will be used to enhance current efforts of improved cook stove adoption and determine where additional resources should be applied in order to have the greatest impact on the cook stove market.
• There were two parts of this study: Literature review of determinants for fuel use and improved cook stove purchase in Kenya – The
analysis considered 12 variables as a determinant of adoption. These variables influence purchase; age, gender, head of household, home ownership, family size, geographic location, fuel used in cooking, employment (Income Quintiles), fuel access, education level, fuel cost and willingness to pay.• We found that improved cook stove adoption and fuel choices are significantly influenced by socio-economic status and
demographic profile of households, energy choices and uses, energy cost and expenditure.
Survey Analysis - Segments across the Central, Coastal and Western regions were examined using these variables. • Surveys were conducted in the field to determine fuel and cook stove use and potential uptake of large scale improved
cook stove projects in the regions.

6
Project ApproachEnergy
Demand
Cook stove Consumer
Cook stove Industry
Macro-environment Market
barriers
Market needs Market
drivers
Strategy Development
Segments of Energy and Cook stove
Consumers
Top Three segments of Energy and Cook Stove
Consumers
Survey Analysis
Literature Review

7
Macro Environment – Climate and Environment
• Kenya is located on the East African coast, bordering the Indian Ocean, between Somalia and Tanzania. Border countries include Ethiopia (861 km), Somalia (682 km), South Sudan (232 km), Tanzania (769 km) and Uganda (933 km). The total area of the country is 580,370 sq km; land 569,140 sq km and water 11,227 sq km.
• The climate varies from tropical along coast to arid in interior. The climate is influenced by the inter-tropical convergence zone and relief and ranges from permanent snow above 4 600 metres on Mt. Kenya to true desert type in the Chalbi desert in the Marsabit district in the north of the country. About 80 percent of the country is arid and semiarid, while 17 percent is considered to be high potential agricultural land, sustaining 75 percent of the population. The forest cover is about 3 percent of the total land area.
• The average annual rainfall is 630 mm with a variation from less than 200 mm in Northern Kenya to over 1 800 mm on the slopes of Mt. Kenya. The rainfall distribution pattern is bimodal with long rains falling from March to June and short rains from October to November, for most parts of the country.
• Natural resources include limestone, soda ash, salt, gemstones, fluorspar, zinc, diatomite, gypsum, wildlife and hydropower. Agricultural land covers approximately 33% of the country. Land use includes arable land (9.48%), permanent crops (1.12%), other (89.4%). Recurring droughts and flooding during rainy seasons are the most significant hazards affecting Kenya.
• Kenya depends on its biodiversity and natural resources for much of its economy. Kenyans highly depend on the nation’s forests, rivers, lakes and soil for sustainable living. Environment issues include water pollution from urban and industrial wastes; degradation of water quality from increased use of pesticides and fertilizers; water hyacinth infestation in Lake Victoria; deforestation; soil erosion; desertification and poaching.
Source: CIA World fact book

8
Macro Environment - Counties and Provinces
Region Counties
Central - 11a-Nyandarua, 1b-Nyeri, 1c-Kirinyaga, 1d-Murang'a, 1e-Kiambu
Coastal - 22a-Mombasa (city), 2b-Kwale, 2c-Kilifi, 2d-Tana River, 2e-Lamu, 2f-Taita-Taveta
Eastern - 3
3a-Marsabit, 3b-Isiolo, 3c-Meru, 3d-Tharaka-Nithi, 3e-Embu, 3f-Kitui, 3g-Machakos, 3h-Makueni
Nairobi - 4 4a-Nairobi City
North Eastern - 5 5a-Garissa, 5b-Wajir, 5c-Mandera
Nyanza - 66a-Siaya, 6b-Kisumu, 6c-Homa Bay, 6d-Migori, 6e-Kisii, 6f-Nyamira
Rift Valley - 7
7a-Turkana, 7b-West Pokot, 7c-Samburu, 7d-Trans Nzoia, 7e-Uasin Gishu, 7f-Elgeyo-Marakwet, 7g-Nandi, 7h-Baringo, 7i-Laikipia, 7j-Nakuru, 7k-Narok, 7l-Kajiado, 7m-Kericho, 7n-Bomet
Western - 88a-Kakamega, 8b-Vihiga, 8c-Bungoma, 8d-Busia
Kenya is divided into 47 counties. These counties make up the former “Province” areas of Central, Coastal, Eastern, Nairobi, North Eastern, Nyanza, Rift Valley and Western regions.
For the purpose of this study, statistical data from the former 8 Provinces were used to find segments at the regional and local level.

9
Macro Environment - Demographics
Currently, Kenya's population is estimated to be 44,037,656
77.80% of the population lives in rural areas whilst 22.80% resides in urban areas. The current rate of urbanization is at 22%
Population growth rate – 2.444%
Main religious bodies - Christian 82.5% (Protestant 47.4%, Catholic 23.3%, other 11.8%), Muslim 11.1%, Traditionalists 1.6%, other 1.7%, none 2.4%, unspecified 0.7% .
Main Languages - English (official), Kiswahili (official), numerous indigenous languages.
Life expectancy at birth - 63.07 years Males - 61.62 years Females - 64.55 years
Main ethnic groups - Kikuyu 22%, Luhya 14%, Luo 13%, Kalenjin 12%, Kamba 11%, Kisii 6%, Meru 6%, other African 15%, non-African (Asian, European, and Arab) 1%
Source: CIA World fact book

10
Macro Environment - Employment
Nairobi
Centra
lCoast
Easter
n
North Ea
stern
Nyanza
Rift Valley
Western
0
10
20
30
40
50
60
70
80
0
10
20
30
40
50
60
70
Spatial distribution of 15-64 employment sector
Working Not Working Female Male
Perc
enta
ge (%
)
Perc
enta
ge (%
)
Unemployment is very high in Kenya. Unemployment increased to 40% in 2011 from 12.70% in 2006. The unemployment rate measures the number of people actively looking for a job as a percentage of the labor force. Kenya also manifests considerable regional disparities in employment and human development. Consistent with the regional trends in wage employment, Nairobi has the highest number of informal sector employment while North Eastern has the lowest.
Women make up 47% of the labor force whilst males account for 53%.
Sources : Nyaga R.K., (2010), Omolo. J., (2012)

11
Income QuintilesIncome Bracket CategoryIncome Quintile 1 Households living below the urban poverty line Kshs. 2913 per month
Households living below the rural poverty line Kshs. 1562 per month
Rural households in extreme poverty Kshs. 988
Income Quintile 2 Households living above the urban poverty line Kshs. 2913 per month
Households living above the rural poverty line Kshs. 1562 per month
Ideal income level between Kshs. 6120 and Kshs. 9319
Income Quintile 3 Income levels between Kshs. 9320 and Kshs. 13015
Income Quintile 4 Income levels between Kshs. 13016 and Kshs. 20408
Income Quintile 5 Income levels above Kshs. 20409
Sources: KNBS (2007), KIPPRA (2010)

12
Macro Environment - Education
• Access to pre-school and primary education in Kenya is high; 70%. The gender parity at pre-primary and primary education stands at 51.2% and 48.8% (pre-school) and 51.3% and 48.7% (primary education) for boys and girls respectively. The parity deteriorates as they progress; at University level, it widens to 58% and 42% for boys and girls respectively.
• The expenditure on education is at 6.7 % of the total GDP. Adult literacy rates are higher in men than women; including urban and rural regions . Nairobi and Central regions have the highest literacy rates for women; 84.20% and 75.80% respectively. The North Eastern region has the lowest literacy rates for both men and women; 37.50% and 11.60% respectively.
Source: World bank

13
Macro Environment - Economy
GDP (purchasing power parity) $76.07 billion (2012 est.) $72.37 billion (2011 est.) $69.33 billion (2010 est.)
Exports - commodities Tea, horticultural products, coffee, petroleum products, fish, cement
GDP (official exchange rate) $41.84 billion (2012 est.) Exports - partners Uganda 9.9%, Tanzania 9.6%, Netherlands 8.4%, UK 8.1%, US 6.2%, Egypt 4.9%, Democratic Republic of the Congo 4.2% (2011)
GDP - real growth rate 5.1% (2012 est.) 4.4% (2011 est.) 5.8% (2010 est.)
Imports Machinery and transportation equipment, petroleum products, motor vehicles, iron and steel, resins and plastics
GDP - per capita (PPP) $1,800 (2012 est.) $1,800 (2011 est.) $1,700 (2010 est.)
Imports - partners China 15.3%, India 13.8%, UAE 10.5%, Saudi Arabia 7.3%, South Africa 5.5%, Japan 4% (2011)
GDP - composition by sector agriculture: 24.2% industry: 14.8% services: 61% (2012 est.)
Kenya’s economy is relatively strong, however, it has been plagued by corruption and by reliance upon several primary goods whose prices have remained relatively low. As a result of high food and fuel import prices, Kenya has experienced chronic budget deficits, inflationary pressures, and sharp currency depreciation. The discovery of oil in March 2012 has provided an opportunity for Kenya to balance its growing trade deficit if the deposits are found to be commercially viable and Kenya is able to develop a port and pipeline to export its oil. Following the elections held on March 4th, Kenyan economic performance in 2013 is now proving to be highly dependent on the capacity of the country to attract foreign investment and tourism.
Source: CIA World fact book

14
Economic Indicators – Food ItemsRegion Kenya Rural UrbanFood 1754 1453 2642
Cereals 359 360 355
Bread 72 43 156
Tubers 106 108 99
Poultry 38 33 53
Meat 158 110 301
Fish 39 28 72
Milk, Eggs 196 163 291
Oils 71 62 97
Fruits 89 68 150
Vegetables 160 130 249
Pulses 103 108 85
Sugar 111 106 125
Non-alcoholic beverages 68 47 130
Alcohol 58 37 120
Restaurants 113 37 335
Spices and condiments 15 12 22
Average food consumption per adult / month in Kshs.
Source: KNBS (2007)

15
Economic Indicators – Non Food ItemsRegion Kenya Rural Urban
Total Non- Food 1678 878 4032
Tobacco 28 24 40
Water 33 17 82
Fuels 177 113 366
Refuse, Sewage 2 0 6
Clothing & Footwear 304 232 517
Household, Personal 191 117 407
Furnishings & Maintenance 23 17 40
Domestic Services 45 22 112
Transportation 232 108 596
Communication 99 39 275
Recreation 56 16 174
House rent 238 - 937
Education 224 152 435
Health 27 22 43
Average non food consumption per adult / month in Kshs.
Source: KNBS (2007)

16
Macro Environment – Political Structure• Kenya has 47 counties. The country has a mixed legal system of English common law, Islamic law,
and customary law; judicial review in a new Supreme Court established pursuant to the new constitution.
• The Chief of state is President Uhuru KENYATTA (since 9 April 2013); Deputy President William RUTO (since 9 April 2013); the president is both the chief of state and head of government
• The head of government is President Uhuru KENYATTA (since 9 April 2013); Deputy William RUTO (since 9 April 2013); according to the 2008 power sharing agreement the role of prime minister was created though not well defined, following the new constitution the position was abolished after the March 2013 elections.
• The bicameral parliament consists of a Senate (67 seats) and a National Assembly (349 seats); members to serve five-year terms. Elections were last held on 4 March 2013 (next to be held in 2018). The President is elected by popular vote for a five-year term (eligible for a second term); in addition to receiving a simple majority of votes, the presidential candidate must also win 25% or more of the vote in at least five of Kenya's seven provinces and one area to avoid a runoff.
Source: CIA World fact book
17
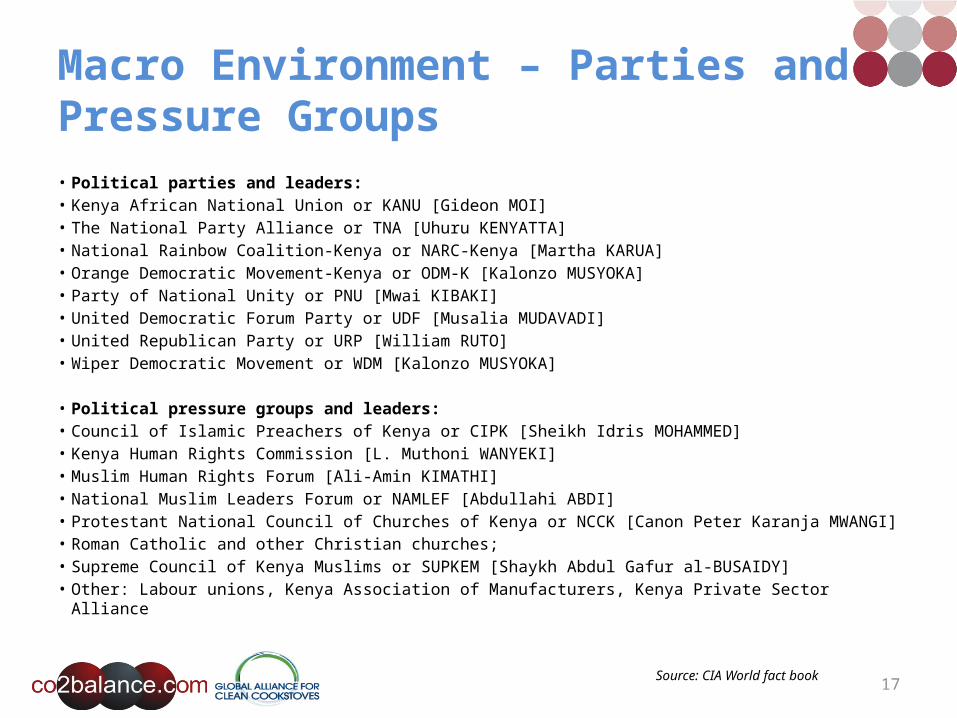
Macro Environment – Parties and Pressure Groups • Political parties and leaders:• Kenya African National Union or KANU [Gideon MOI]• The National Party Alliance or TNA [Uhuru KENYATTA]• National Rainbow Coalition-Kenya or NARC-Kenya [Martha KARUA]• Orange Democratic Movement-Kenya or ODM-K [Kalonzo MUSYOKA]• Party of National Unity or PNU [Mwai KIBAKI]• United Democratic Forum Party or UDF [Musalia MUDAVADI]• United Republican Party or URP [William RUTO]• Wiper Democratic Movement or WDM [Kalonzo MUSYOKA]
• Political pressure groups and leaders:• Council of Islamic Preachers of Kenya or CIPK [Sheikh Idris MOHAMMED]• Kenya Human Rights Commission [L. Muthoni WANYEKI]• Muslim Human Rights Forum [Ali-Amin KIMATHI]• National Muslim Leaders Forum or NAMLEF [Abdullahi ABDI]• Protestant National Council of Churches of Kenya or NCCK [Canon Peter Karanja MWANGI]• Roman Catholic and other Christian churches;• Supreme Council of Kenya Muslims or SUPKEM [Shaykh Abdul Gafur al-BUSAIDY]• Other: Labour unions, Kenya Association of Manufacturers, Kenya Private Sector Alliance
Source: CIA World fact book
18
Macro-environment – Technological Infrastructure
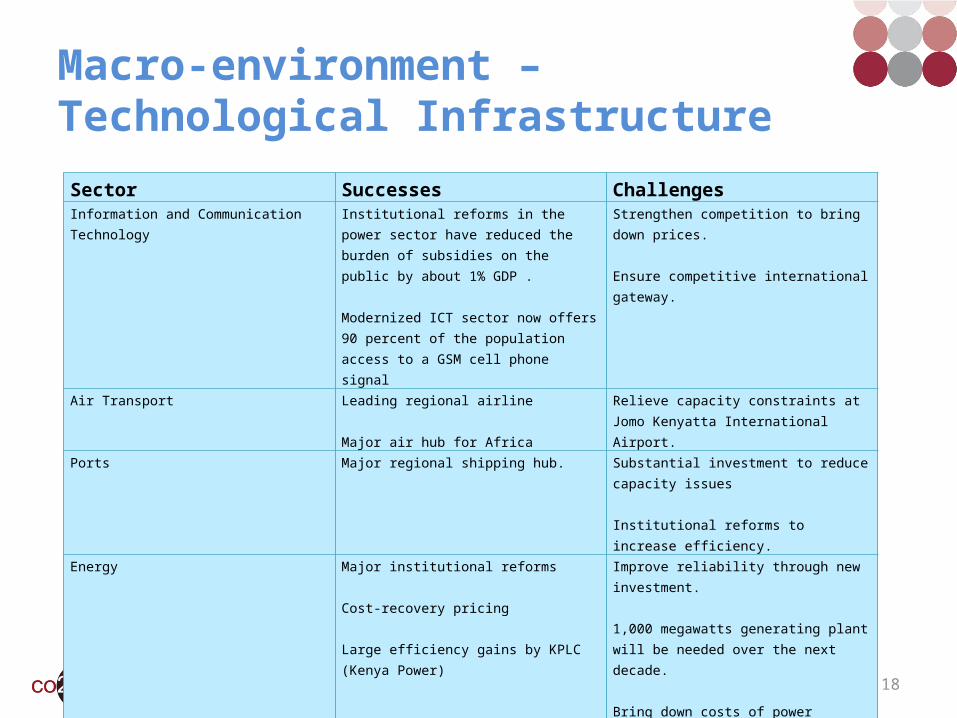
Sector Successes ChallengesInformation and Communication Technology Institutional reforms in the power sector have
reduced the burden of subsidies on the public by about 1% GDP .
Modernized ICT sector now offers 90 percent of the population access to a GSM cell phone signal
Strengthen competition to bring down prices.
Ensure competitive international gateway.
Air Transport Leading regional airline
Major air hub for Africa
Relieve capacity constraints at Jomo Kenyatta International Airport.
Ports Major regional shipping hub. Substantial investment to reduce capacity issues
Institutional reforms to increase efficiency.
Energy Major institutional reforms
Cost-recovery pricing
Large efficiency gains by KPLC (Kenya Power)
Improve reliability through new investment.
1,000 megawatts generating plant will be needed over the next decade.
Bring down costs of power supply.
Railways Strategic regional rail corridor Revisit design of rail concession

19
Macro-environment – Technological Infrastructure
Sector Successes ChallengesRoads Sound road fund in place Major rehabilitation backlog
Improve quality of public investment
Urban infrastructure Low levels of access to services
High rates of tenancy and insecure tenure
Water Resources Water-resources-managementauthority in place.
Improved drinking water sourceUrban – 82% of populationRural – 52% of population
Increase water storage capacity
Increase irrigated area by 50%
Strengthen water resources management and river-basin institutions
Water and Sanitation Major institutional reforms
Improved Sanitation facility access;Urban – 32% of populationRural – 32% of population
Address under pricing of water
Cut distribution losses
Rural access
Source: Africa Infrastructure Country Diagnostic Country Report (2010)

20
Energy Demand• Firewood: Approximately 89% of rural and 7% of urban households regularly use firewood, giving a national average of about
70% of all households. The average annual per capita consumption is approximately 741 kg and 691 kg for rural and urban households, respectively.
• Charcoal: Use of charcoal is about 47% at the national level with use of over 82% and 34% of urban and rural households, respectively. Per capita consumption is 156 kg in urban areas and 152 kg in rural areas.
• Farm Residues: Farm residue is used as a source of cooking and lighting fuel in areas where energy demand exceeds supply and in certain seasons when wood supply is limited. The quantities of residues will depend on yields of a particular crop and are usually proportional to the area planted. Overall, about 21% of households use farm residues, but their use is mainly in rural areas with 29% households as compared to 0.5% in urban households.
• Wood Waste: There are two major sources of wood waste. Logging sites where branches and tops remain after felling, supply about 35% of fuel wood. The other source is sawmilling sites where sawdust, bark and small off-cuts are available for fuel wood. Only 2.5% of households use wood waste. Use is mainly in urban areas by 3.7% of households as compared to 2.1% in the rural areas.
• Kerosene: Kerosene is often regarded as a “poor man’s” fuel and is used by approximately 92% of all households (rural; 94% and urban; 89%). Kerosene is exempted from some taxes in comparison with other fuel products.
• LPG: Only 7.8% of the population (23% urban and 1.8% rural) use LPG. Average per capita consumption is only 3.6 kg and 9.7 kg for rural and urban areas respectively. LPG is used (cooking 3.5%) along with firewood in rural areas while in urban areas; it is used as a supplement for electricity.
• Electricity: Electricity in Kenya is expensive for the majority of the households, and only 46% of urban and 3.8% of rural households have access to electricity. Nationally, this translates to only 15% households with access to electricity.
• Biogas: There are over 6748 biogas plants in Kenya, however only about a quarter of these plants are believed to be operating by design. The Kenya National Domestic Biogas Program (KENDBIP) is currently funded through the Ministry of Energy and the Dutch Ministry of Foreign Affairs, has a goal of constructing 12,000 high quality, functioning plants by 2014.
Sources: SCODE, Kenya National Energy Policy (2012),

21
Percentage Use of Cooking Fuel- Urban/Rural Areas
Source: Ministry of Health (2007)
FirewoodCharcoalKerosene Gas Electricity Other Not Stated0
10
20
30
40
50
60
70
80
90
100
0
10
20
30
40
50
60
70
RuralUrban Total Kenya
Fuel Used
Perc
enta
ge u
sed
in co
okin
g (%
)
Perc
enta
ge u
sed
in co
okin
g Ke
nya
(%)

22
Nairobi
Central
Coast
Eastern
North Eastern
Nyanza
Rift Valley
Western
Urban
Rural
0% 10% 20% 30% 40% 50% 60% 70% 80% 90% 100%
Fuel wood
Charcoal
Kerosene
LPG
Electricity
Other
Biomass: Over 70% of the consumers in Kenya use biomass while 30% use other fuels. Biomass provides over 65% of energy requirements.
Rural households tend to use firewood for cooking ~86%, whilst the majority of urban households consume charcoal ~82%
Percentage Distribution of Cooking Fuel by Region
Source: Ministry of Health (2007)
23
Energy Stacking
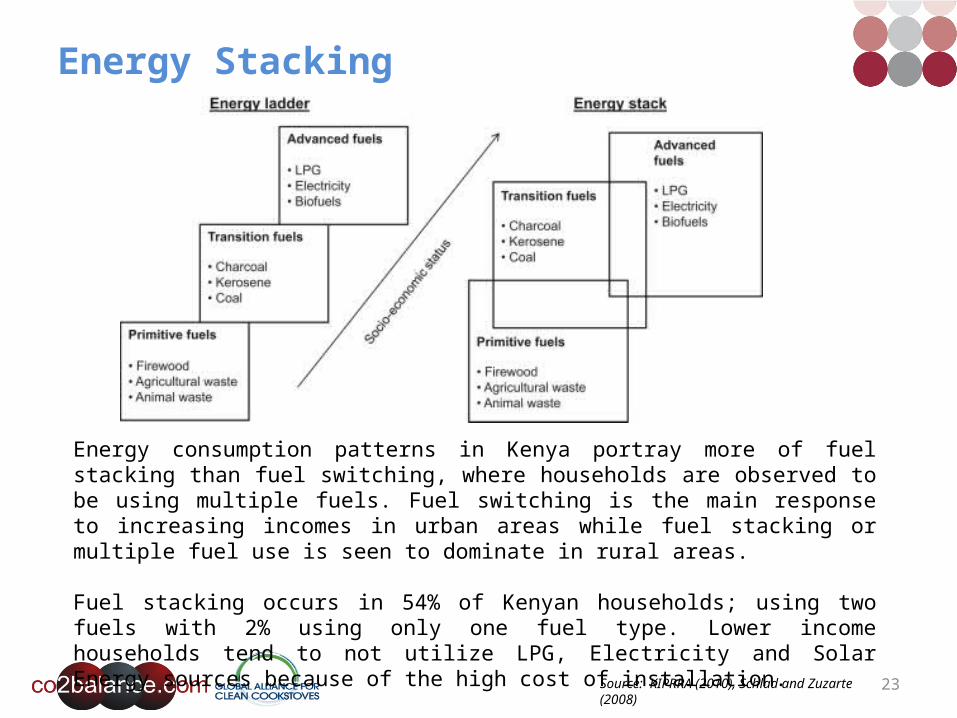
Energy consumption patterns in Kenya portray more of fuel stacking than fuel switching, where households are observed to be using multiple fuels. Fuel switching is the main response to increasing incomes in urban areas while fuel stacking or multiple fuel use is seen to dominate in rural areas.
Fuel stacking occurs in 54% of Kenyan households; using two fuels with 2% using only one fuel type. Lower income households tend to not utilize LPG, Electricity and Solar Energy sources because of the high cost of installation.
Source: KIPRRA (2010), Schlad and Zuzarte (2008)

24
Factors Influencing Energy Demand – Biomass (Fuel Wood and Charcoal)• In rural areas, the lowest income households depend on firewood the most. This is in line with
previously documented consumption patterns for the country. Approximately 76% of households in Kenya obtain all their firewood for free through collection, 17% of households regularly purchase it while 7% supplement their free collection by purchasing some firewood. Firewood is mainly used for cooking and space heating.
• Firewood has the highest energy budget share on average for both rural (11.6%) and urban (9.34%) compared to other fuels.
• The budget share for charcoal is driven by factors such as socioeconomic status, prices, education and location of household.
• Key Determinants: Demand for charcoal is inversely related to its own price (as the price increases, less of it is demanded). Other important factors in the demand for charcoal includes, household size, price of LPG, as well as primary education which is inversely related to demand. Households in urban areas are more likely to use charcoal than those in rural areas; Eastern, Rift Valley and Western Provinces have a negative influence on demand for charcoal. Households in these regions experience reduction in budget share of charcoal due to certain climatic characteristics unique to these regions. There is a high use of kerosene in these regionsHousehold energy demand in Kenya: An application of the linear approximate almost ideal demand system
Sources: Sustainable Community and Development Services (2010), KIPPR (2010), Ngui. D., et al (2011)

25
Kerosene
• Urban households use around 90 litres of kerosene per year, rural at 41 litres per year. On average Kerosene prices ranges from Kshs. 81.03 – 83.83 per litre. Overall price per year of kerosene for urban households is around Kshs. 7293 – 7545 and rural households Kshs. 3322 – 3437.
• Some dealers have adulterated petroleum products in efforts to make higher profits at the expense of Government taxes. Current retailing practices lead to high mark-up prices (sometime as much as 300%) in remote areas even though tax exemption is aimed at lowering prices.
• Key Determinants: The determinants for kerosene use at the household are occupation, total energy expenditure, household size, fuel wood price, education level and price of LPG. As the household size increases, the budget share on kerosene declines. This could be explained by the fact that as the household size increases, the household switches to other fuel types such as charcoal, fuel wood and even LPG to meet increased demand for energy. This is an indication that most households use multiple fuels as a safety net to cushion themselves against the failure of one source.
Sources: Sustainable Community and Development Services (2010), KIPPR (2010), Ngui. D., et al (2011)

26
Liquefied Petroleum Gas and Electricity• LPG - Key determinants: The share of budget for LPG in Kenya is mainly driven by, total
expenditure on LPG, kerosene prices, fuel wood price and its own price. As the price of charcoal increases, the budget share on LPG increases.
• As the price of LPG increases, the budget share also increases. Also as the price of charcoal increases, the budget share of LPG increases. This could be explained by the household opting to use more of LPG when prices of charcoal increase, since it is cleaner and faster in food preparation compared to the latter. In terms of gender, a household headed by female, is more likely to reduce demand for LPG than that headed by a male.
• Electricity - Connectivity to electricity in Kenya varies across provinces with Nairobi having the highest connection with 53.47 % of total households. Central province is second with 42.4 % and the North Eastern and Western Provinces has the least connection rates of 14.5% and 14.7 % respectively. The national connection rate is estimated to be around 28.9 %.
Sources: Sustainable Community and Development Services (2010), KIPPR (2010), Ngui. D., et al (2011)

27
Cook Stove Industry
Kenya Rural Urban0
20
40
60
80
100
120
60.8%
78%
9.1%
8.4%
10.9%
1%
7.1%
4%
16.6%
6.5%
3.9%
14.3%
Improved Cookstove
Ordinary Stove
Improved Traditional 3 Stone Fire
Traditional 3 Stone Fire
~60% households use traditional three stove fires as primary cook stove. This is higher in rural areas ~75% than urban households ~10%.
KIHBS 2005/2006

28
Cook Stove Industry - Region
Nairobi Coast Eastern North Eastern Nyanza 0
20
40
60
80
100
120
1.5%
53.2%
79.4%89.2%
76%
4.8%
11.2%
4.5%3.2%
7.3%
5.2%
6%
2.9%4.7%
8.8%
65.3%
22.9%
3.6%0.2%
2.9%
19.6%
3% 0.8% 0.9%
OtherElectric CookerGas CookerKerosene StoveImproved CookstovesOrdinary Stove Improved Traditional 3 Stone FireTraditional 3 Stone Fire
Perc
enta
ge (%
)
KIHBS 2005/2006

29
Cook Stove Industry - Region
Central Rift Valley Western0
20
40
60
80
100
120
21.9%
9.6%
34.8%
16.%7 37.4%
10.3%12%
12.8%9.9%
20.7%8.6%
%
17.6%
7% 14.4%
3.4%
3.8%
%
7.7%
20.3%9.1%
OtherElectric CookerGas CookerKerosene StoveCharcoal MetalKenya Ceramic StoveImproved Cookstove (firewood)Traditional 3 Stone Fire
Perc
enta
ge (%
)
Three stone fires have lost its predominant position in three Provinces (Central, Rift Valley and Western).
The vast majority of improved cook stoves are found in rural areas (76%).
Lowest incomes possess the cheapest available improved cook stoves, the Jiko Kisasa one pot (56%).
The medium and better off households possess mainly two pot stoves (62% and 51% respectively). While one third of households have a Rocket Mud Stove two pot.
Poor households do not have expensive models of stoves and they tend to have fewer improved cook stoves than higher income households.
GTZ (2009)

30
Cook Stove Consumer – Purchase and Use
• There is little information on the uptake and use of improved cook stoves, but some empirical evidence suggests that high use cannot be assumed even when stoves are highly subsidized or given free of charge. However, improved cookstove use is directly correlated with socioeconomic benefits to consumers and these benefits are driven by stove type.

31
Net Socioeconomic Benefits of Improved Fuel wood Cook Stoves
For fuel wood stoves, the most important factors influencing the net benefits of the switch to this stove are the use of the stove and its relative time efficiency (compared to the traditional 3 stone fires). These parameters are important because a large proportion of the benefits of this stove come from time savings, but these are only captured if it is used often and efficiently. Inefficient stove use imposes a net time cost on users.
Source: Jeuland. A.M., Pattanayak. S (2012)

32
Net Socioeconomic Benefits of Improved Charcoal Cook Stoves
Source: Jeuland. A.M., Pattanayak. S (2012)

33
Net Socioeconomic Benefits of Improved Charcoal Cook Stoves
For charcoal stoves, the most important drivers tend to be in parameters that affect the relative cost of fuel: the market price of charcoal, and the amount of baseline fuel needed and baseline energy efficiency, which influence the relative gains obtained from the new stove. Also important are the use rates, the market wage (income quintile) and baseline cooking time, the latter two of which determine the value of collection and cooking time savings.
Source: Jeuland. A.M., Pattanayak. S (2012)
34
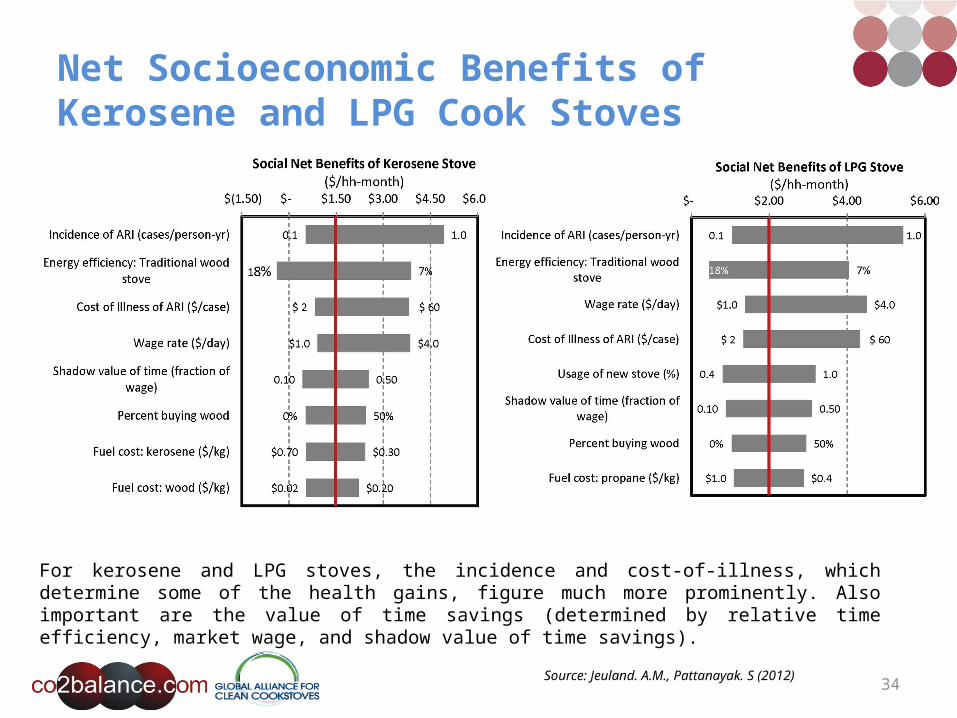
Net Socioeconomic Benefits of Kerosene and LPG Cook Stoves
For kerosene and LPG stoves, the incidence and cost-of-illness, which determine some of the health gains, figure much more prominently. Also important are the value of time savings (determined by relative time efficiency, market wage, and shadow value of time savings).
Source: Jeuland. A.M., Pattanayak. S (2012)

35
Net Socioeconomic Benefits of Electric Cook Stoves
Net benefits of the electric stove are most strongly affected by its relative efficiency and electricity prices.
Source: Jeuland. A.M., Pattanayak. S (2012)

36
ICS Current Market– Upfront Costs
Envir
ofit G-3300 Stove
Philips N
atural D
raft St
ove HD4008
Stove
Tec G
reenfire
Wood Stove
Upesi Porta
ble Stove
KCJ (Ken
ya Ceramic J
iko) S
tandard Stove
Jiko Poa
Jiko Kisa
sa
Kuni Mbili
Brick R
ocket s
tove
kerosene s
tove
LPG St
ove
Save
80
Uhai stove
01020304050607080
31 31
9 9.5 616
410
20
6
20
72
11
Cost - USD
Cost
in U
SD

37
Cook Stove Consumer - Fuel Costs• Urban households use around 90 litres of kerosene per year, rural at 41 litres per year. On average
Kerosene prices ranges from Kshs. 81.03 – 83.83 per litre. Overall price per year of kerosene for urban households is around Kshs. 7293 – 7545 and rural households Kshs. 3322 – 3437.
• Charcoal is a preferred household energy source due to its affordability. It is the cheapest urban household cooking fuel currently costing about Kenya shillings Kshs. 12,000 per household per year. Charcoal is usually purchased in small quantities of 1.5 kilogrammes costing between Kshs. 30-50, hence; low income households and businesses find it affordable to buy charcoal every day in small quantities.
• Average LPG cost per household in Kenya is around Kshs. 31,760 per year. The current (June 2011) price of LPG is Kshs. 2,500 for a 13 kilogramme cylinder or Kshs. 1,000 for a 6 kilogramme cylinder.
• Per capita electricity household consumption averages 844 kwh in urban and 544 kwh in rural areas. Higher income urban households consume the largest amount of electricity (1,352 kwh) compared to 606 kwh by the lowest income group. Average Electricity cost per household in Kenya is around Kshs. 59,200 per year.

38
Cook Stove Consumer - Fuel Costs
Fuel Costs (Kshs)Kerosene price(Kshs/l) 81.03 - 83.83Fuel wood price(Kshs/bundle) 70LPG price(Kshs/kg) 217.27Electricity price(Kshs/Kwh) 11.62Charcoal price(Kshs/4kg tin) 61.4Motor Spirit Premium price(Kshs/l) 119.23Automotive Gas Oil price(Kshs/litre) 66.13Lubricant price(Kshs/ l) 382.657

39
Cook Stove Consumer - Fuel cost per household
Fuel w
ood
Charcoal
Electr
icity
Kerosen
eLP
G
Lubric
ants
Motor Spirit
Premium price
Automotive Gas
Oil pric
eBiogas
0
1000
2000
3000
4000
5000
6000
7001000
4933
277
2647
1254.8
3509.34
2243.52
3000
Total expenditure on fuel (Kshs/month)
Kshs/Month
Fuel
Cost
per
mon
th (K
shs)

40
Cookstove Consumer - Fuel Perception Map
High Price
Low Price
Low ValueHigh Value
KeroseneQuintile 1, 2 and 3Rural, Urban and Peri-Urban
Fuel woodQuintile 1, 2 and 3 Rural and Peri-Urban
CharcoalQuintile 1, 2 and 3Rural, Urban and Peri-Urban
LPGElectricityQuintile 4 and 5Urban and Peri-Urban

41
Barriers to ICS adoptionBarriers
Market Approach Despite the benefits of improved cook stove adoption, several projects have struggled to make an impact over decades of effort . Despite high awareness of improved cook stoves by rural households, adoption rate is quite low. Even though people are aware of ICS technology, they are unaware of its benefits.
Improved cook stove programs are more successful when the cook stove is physically seen by prospective customers. This provides concrete and observable benefits to the implementer and is best done through stakeholder meetings. In urban areas, where fuel is often purchased, users are motivated by stoves that save money . The same can be said about rural areas; people are generally motivated by saving money on fuel efficient stoves
Health - IAP While there is an abundance of literature on improved cook stoves to mitigate household air pollution, results prove to be statistically insignificant in cook stove adoption. The type of fuel used seems to produce a positive correlation with improved health benefits, for example, improved fuel wood stoves substantially reduce exposure however; they give fewer health benefits than improved charcoal stoves, which can reduce exposure to very low levels. Improvement of health through reducing indoor air pollution (usually ranked high by cook stove developers) rarely ranks highly amongst improved cook stove users .
Marketing stoves based on the improved health indicators has so far been ineffective. This is due to lack of proper education and users do not seem to value health benefits highly enough to overcome traditional cooking methods. Research has shown that marketing the value of the stoves as a whole increases uptake, e.g., an improved stove can be seen as contributing to a cleaner kitchen, adding new cooking functionality, or providing a status symbol associated with modernity. Commercial players who are the most innovative in creating observable value for their customers will more than likely increase uptake of improve cook stoves and run a successful project.
Source: Slaski . X and Thurber, M., (2009), Mtsami. P.T., (2012)
42
Barriers to ICS adoption
BarriersGender, Age and Education The use of improved cook stoves is normally associated with a woman’s role in the household ; hence women have a
significant influence on their adoption rate.
In lower income households, males are often the head of the household; however women still have valuable input in financial decisions of the household
Women, who bear the brunt of the costs associated with cooking, can have a significant input in fuel choice. The education level of the wife can influence the adoption rate of improved cook stoves. i.e., higher the education level of the wife in a household the more likely the household will adopt improved cook stove technologies. Education level of the woman works in conjunction with age to fully influence the uptake of improved cook stoves.
Studies have shown that uptake of improved cook stoves are higher in households in the quartile of age 25-54.
Sources: Silk. B.J., et al (2012), P. MO and Fraser GCG., (2006 ), Mtsami. P.T., (2012)
43
Barriers to ICS adoption – Fuel Costs and Affordability
Barriers
Fuel cost and affordability The price competitiveness of fuel is a significant barrier to improved cook stove adoption.
In rural districts where wood fuel is collected for free, households are less inclined to use improved cook stoves. As in the case of Wundanyi, Mwatate and Voi Districts, 79% of rural households who got their fuel wood free of charge were not using improved cook stoves and that 62% of households who bought their fuel wood were using improved cook stoves. In rural areas the implementation of improved cook stoves should target areas where majority of the households buy their fuel. This can help promote adoption rates because such communities are motivated to adopt the new technologies by the fact that they will save on fuel costs. In rural areas where literacy levels are low (below primary level education), implementation of improved cook stoves should work alongside adult education programs targeting women.
Source: Mtsami. P.T., (2012)

44
Barriers to ICS Adoption – Fuel Costs and AffordabilityBarriers
Charcoal and Firewood
Charcoal and firewood costs are generally low and there is a dominance of charcoal stoves in urban regions . The low price of charcoal and firewood results can be attributed to the fact that both are obtained from a natural resource that can be tapped with little or no direct cost to producers or consumers. Charcoal and firewood are the cheapest form of cooking fuel for urban and rural areas respectively.
Charcoal production is still considered an illegal activity in rural Kenya. However, recent legislation has supported the production of sustainable charcoal.
Charcoal is normally considered low cost and affordable. But due to the fact that it is repeatedly bought in small quantities it ends up being more expensive in the long run compared to other energy sources e.g. LPG gas
Kerosene Cost-effective alternatives, like kerosene, have had a massive uptake in Kenya (when compared to traditional fuel) because the Kenyan Government has removed all taxes on kerosene. Though not classified as a clean fuel, it is seen as a general improvement from using wood fuel. Therefore, many consumers in urban areas switched to kerosene, which is now used in a significant majority (over 85%) of urban households .
Given the importance of kerosene in meeting urban poor household energy needs, targeted and time-limited subsidies for kerosene stoves and lamps could expand the kerosene market, widen access among the urban poor, lead to local investment in kerosene stove and lamp manufacture and reduce overall energy costs.
However, the use of kerosene is expected to decrease significantly by 2030. The Government of Kenya has announced plans to phase out the use of kerosene (Kerosene free initiative) for lighting and cooking, and replace it with clean energy products such as solar lighting kits. 1 million solar lighting kits are expected to be disseminated into Kenyan households by 2030. This will have significant impacts on the kerosene cook stove market.
Sources: EEDNA (2008), EAC (2008), World bank (2011)

45
Barriers to ICS adoption - Fuel Costs and AffordabilityBarriers
LPG Policies have retarded a further shift towards clean cooking fuels by maintaining high levels of taxation on some products like LPG. The use of LPG as a household cooking fuel is minimal in rural Kenya.
LPG has a very high upfront cost which is normally beyond the reach of the majority of the urban poor. About 11.9% of urban households cooking using LPG gas compared with rural households where only 0.7% uses it. This is attributed to a number of reasons. Where LPG is marketed by petroleum companies, it is still yet to have a wide coverage in many areas. For many years, the country has had only a small LPG handling facility in Nairobi. The Kenya Pipeline Company plans to build a 2000 tonne storage and cylinder filling facility in Nairobi, as well as storage and distribution facilities in Nakuru, Eldoret, Sagana and Kisumu.
Consumers are also held captive by the few out letting companies through limited out letting and customized cylinders and valves. The Government sought to address this by standardizing cylinders and valves. Another major challenge with LPG is that being a petroleum product, it is vulnerable to the escalating international oil prices. Income levels and cost of other fuels and several factors determine LPG cook stove uptake, these are: availability, reliability of LPG supply, fears about safety, unfamiliarity with cooking with LPG, lack of knowledge about the harm caused by smoke from solid fuels burned in traditional stoves, and cultural preferences.
Sources: EEDNA (2008), EAC (2008), World bank (2011)

46
Barriers to ICS adoption
Barriers
Political Stability Political and institutional risks in Kenya can negatively impact on the enabling environment which can have detrimental impacts on the development and implementation of improved cook stove projects.
The key concern relates to the uncertainty of the regulatory process and the likelihood that it can be affected by political regime changes.
Private and public sector cook stove projects are currently encouraged by the government but certain changes under consideration in Kenya (e.g. taxation on fuels and revenue share on carbon market streams) may result in increased administrative burden and costs, and lower returns for CDM developers and buyers.

47
Barriers to ICS adoption
Barriers
Project developers Project developers face a variety of challenges when implementing ICS projects. The following issues can hinder purchase by end user if not addressed at an early stage in the ICS implementation process;
•Poor feasibility / Lack of technical expertise – ICS projects may fail if the technical expertise is not fully aware of the requirements of a successful project from the onset.•Bad product / Lack of understanding of community needs – product design and functionality does not meet the needs of end user. •Lack of investment. •Lack of ICS maintenance and proper monitoring •Bad reputation – End users knowledge of failed projects in other areas may hinder ICS adoption or purchase.•Lack of understanding from DNAs.
48
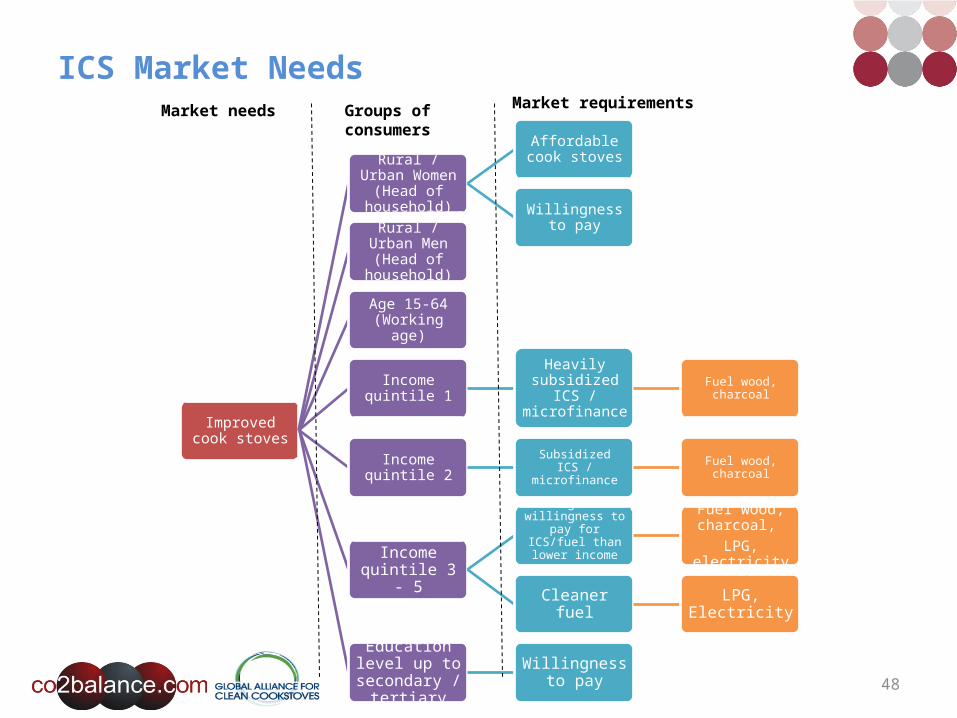
Improved cook stoves
Rural / Urban Women (Head of
household)
Affordable cook stoves
Willingness to payRural / Urban Men
(Head of household)
Age 15-64 (Working age)
Income quintile 1 Heavily subsidized ICS / microfinance Fuel wood, charcoal
Income quintile 2 Subsidized ICS / microfinance Fuel wood, charcoal
Income quintile 3 - 5
Higher willingness to pay for ICS/fuel than lower income groups
Fuel wood, charcoal,
LPG, electricity
Cleaner fuel LPG, Electricity
Education level up to
secondary / tertiary
Willingness to pay
ICS Market NeedsMarket needs Groups of
consumers
Market requirements

49
Factors Influencing ICS adoption – Market Drivers• Age• Gender• Head of household• Home Ownership• Family size• Education level• Geographic Location – including urban and rural• Employment (Income Quintiles)• Fuel Type (used in cooking)• Fuel Availability• Fuel Cost (Affordability)• Willingness to Pay
Source: Jeuland. A.M., Pattanayak. S (2012)
50
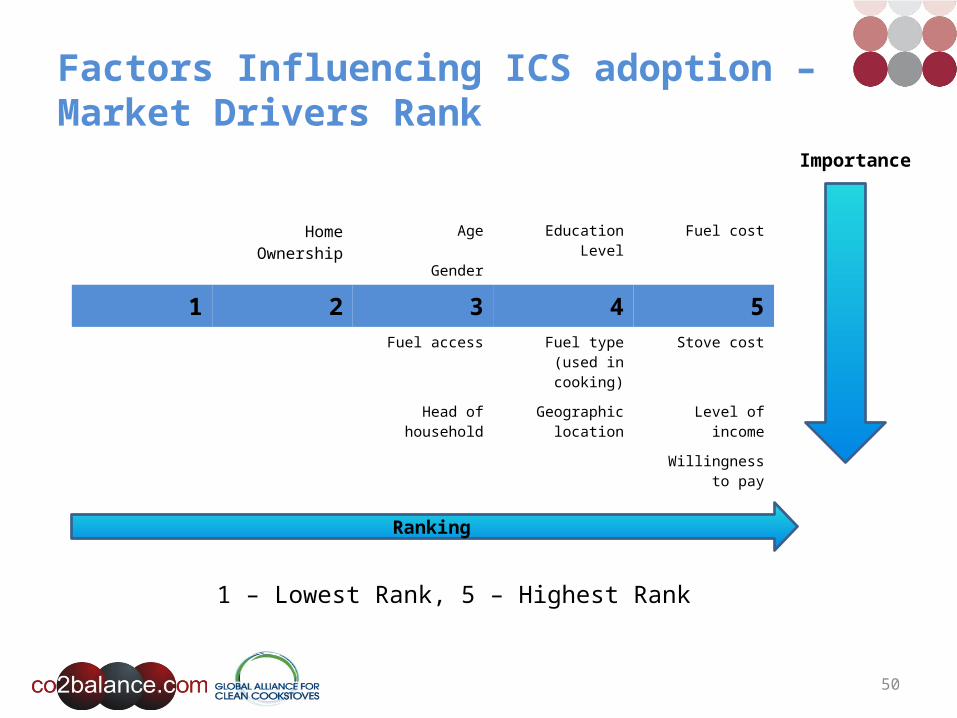
Factors Influencing ICS adoption – Market Drivers Rank
Home Ownership Age
Gender
Education Level Fuel cost
1 2 3 4 5Fuel access Fuel type (used in
cooking)Stove cost
Head of household Geographic location Level of income
Willingness to pay
Importance
Ranking
1 – Lowest Rank, 5 – Highest Rank

51
Segments of Energy and Cook Stove Consumers
Broad Segments
Socio-economic and demographic
profile of the household
Energy Choices and Uses
Energy cost and expenditure

52
Broad Segments
• The combination of ranked market drivers can be grouped into similar broad segments that exhibit similar characteristics. These broad segments are grouped into the following
Socio-economic and demographic profile of the household
Gender, age, head of household, decision making regarding household energy issues, home ownership, family size, highest level of education reached in the household, employment
Energy Choices and Uses Energy sources, energy choice determinants in cooking, problems associated with the use of energy, fuel availability
Energy cost and expenditure Level of income, cost/unit for each of the energy consumed.
Source: Jeuland. A.M., Pattanayak. S (2012)

53
Segment 1 – Low income householdsIncome and Household Characteristics• Households living below the urban poverty line Kshs. 2913 per month• Households living below the rural poverty line Kshs. 1562 per month• Rural households in extreme poverty below Kshs. 988• Households predominantly found in rural areas• Household usually living in temporary structure and there is no ownership of the dwelling unit. • No disposable income and generally do not have money for upfront investment• Luxury goods usually purchased through savings or other subsidized schemesGender• Women primarily users of cook stoves• Men/women makes financial decisions on fuel choice • Men/women makes financial decisions on household appliances Education • Level of education of head of household – up to primary• Awareness of the benefits of improved cook stoves minimal.Fuel Choice and Affordability• Main fuel used is fuel wood and other biomass such as dung, and agricultural wastes• Fuel usually collected for free.Cook Stoves• Usually use traditional 3 stone fire and the cheapest type of stove Jiko Kisasa (one pot)

54
Segment 2 – Low/Middle income households Income and Household Characteristics• Households living above the urban poverty line Kshs. 2913 per month• Households living below the rural poverty line Kshs. 1562 per month• Ideal income level between Kshs. 6120 and Kshs. 9319• Household usually living in temporary structures. • Predominantly found in poor urban areas• Limited disposable income, products need to be subsidized through financial schemes• Moderate willingness to pay for technology without subsidies• Luxury goods usually purchased through savings or other subsidized schemesGender• Women primarily users of cook stoves• Men/women makes financial decisions on fuel choice • Men/women makes financial decisions on household appliances Education• Level of education of head of household – primary• Moderate awareness of the benefits of improved cook stoves.Fuel Choice and Affordability• Typical fuel choices are firewood, charcoal and agricultural residues• Access to electricity in urban households but affordability prohibits adoption rate.• Poor urban households may use urban residues as fuel; such as cardboard residues from building construction.Cook Stoves• Uses three stone fire, cheapest type of stove Jiko Kisasa (one pot) and kerosene wick stoves
55
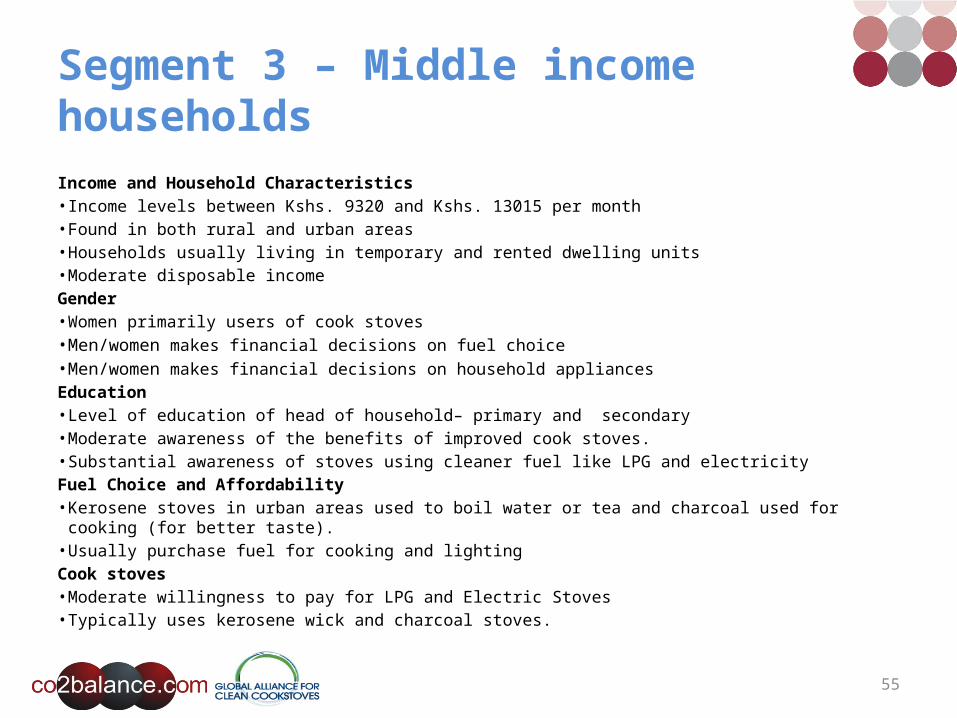
Segment 3 – Middle income householdsIncome and Household Characteristics• Income levels between Kshs. 9320 and Kshs. 13015 per month• Found in both rural and urban areas• Households usually living in temporary and rented dwelling units• Moderate disposable incomeGender• Women primarily users of cook stoves• Men/women makes financial decisions on fuel choice • Men/women makes financial decisions on household appliances Education• Level of education of head of household– primary and secondary• Moderate awareness of the benefits of improved cook stoves.• Substantial awareness of stoves using cleaner fuel like LPG and electricityFuel Choice and Affordability• Kerosene stoves in urban areas used to boil water or tea and charcoal used for cooking (for better taste). • Usually purchase fuel for cooking and lightingCook stoves• Moderate willingness to pay for LPG and Electric Stoves• Typically uses kerosene wick and charcoal stoves.

56
Segment 4 – Middle/High income householdsIncome and Household Characteristics• Income levels between Kshs. 13016 and Kshs. 20408 per month• Household usually living in rented (permanent structures) and owned dwelling units• Found in both rural and urban areas• Exceptional awareness of improved cook stoves• Luxury items usually purchased through savings• Income sources are usually fragmented in rural districtsGender• Women primarily users of cook stoves• Men/women makes financial decisions on fuel choice • Men/women makes financial decisions on household appliances Education• Level of education of head of household – primary; secondary; some tertiary• Moderate awareness of the benefits of improved cook stoves.Fuel Choice and Affordability• Typically uses firewood, charcoal, kerosene and/or LPG stoves. • Easier access to fuels• Fuels in both urban and rural areas are purchased. • Higher willingness to pay for LPG and electric stoves in urban areas than in rural areas; may be hindered due to high taxation
on LPG and constant shifts in gas and tariff prices.• Moderate disposable income

57
Segment 5 - High income householdsIncome and Household Characteristics• Income levels above Kshs. 20409 per month• Predominantly found in rural/urban regions• Household usually living in rented and owned dwelling units. • Luxury items usually purchased through savingsGender• Women primarily users of cook stoves• Men/women makes financial decisions on fuel choice • Men/women makes financial decisions on household appliances Education• Level of education of head of household – primary, secondary and tertiary• Exceptional awareness of improved cook stoves• Moderate awareness of the benefits of improved cook stoves.Fuel Choice and Affordability• Households predominantly use firewood, charcoal, kerosene and LPG stoves.• Higher willingness to pay for LPG and electric stoves in urban areas than in rural areas; may be
hindered due to shifting taxation on LPG and constant shifts in gas and tariff prices.

58
Segment Matrix Segments ranked 0 to 5 with 0 being lowest score and 5 the highest
Age 0 - 14 15-24 25 - 54 55 - 64 65 and over 1 4 5 3 1
Family Size Nairobi Central Coastal Eastern North Eastern Nyanza Rift Valley Western2 4 4 5 5 5 4 5
Fuel type (used in cooking) Nairobi Central Coast Eastern North Eastern Nyanza Rift Valley WesternFirewood 1 5 4 4 4 4 3 5Charcoal 4 4 4 2 2 2 3 3Kerosene 4 2 3 2 1 2 1 1LPG 4 1 1 1 0 0 0 0Electricity 1 0 0 0 0 0 0 0
Nairobi Central Coastal Eastern North Eastern Nyanza Rift Valley WesternHome Ownership 4 4 4 3 2 3 3 4
Segment MatrixThe segment matrix ranks market drivers by region. Market drivers are ranked 0 to 5 with 0 being the least likely option to increase cook stove adoption and 5 the most likely.
Eastern and North Eastern Regions are high risk security areas.
59
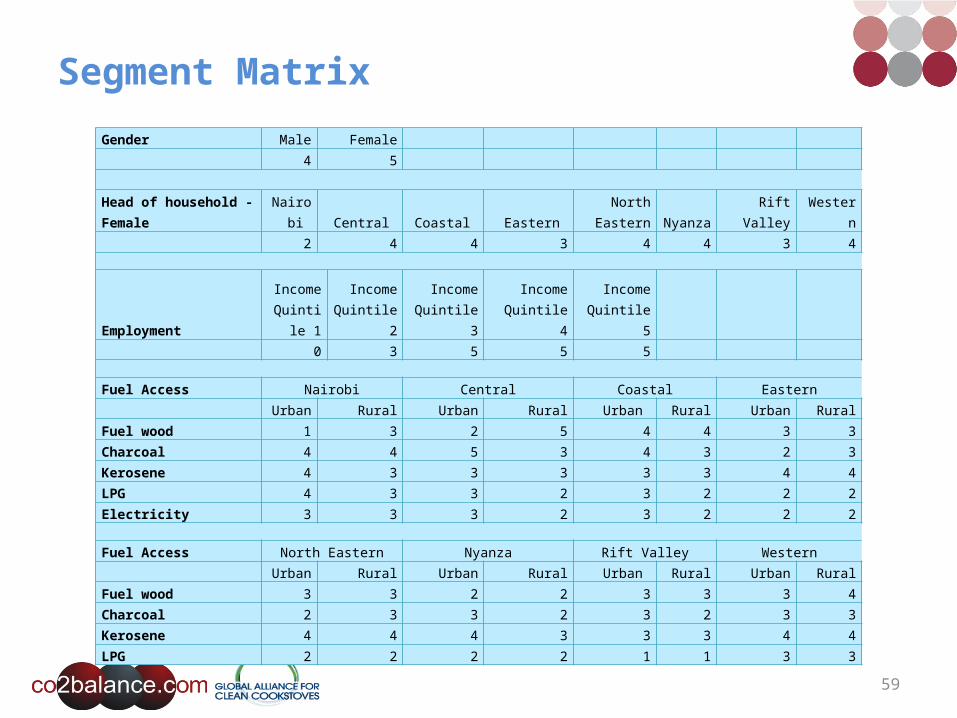
Gender Male Female 4 5
Head of household - Female Nairobi Central Coastal Eastern
North Eastern Nyanza Rift Valley Western
2 4 4 3 4 4 3 4
Employment Income
Quintile 1Income
Quintile 2Income
Quintile 3Income
Quintile 4Income
Quintile 5
0 3 5 5 5
Fuel Access Nairobi Central Coastal EasternUrban Rural Urban Rural Urban Rural Urban Rural
Fuel wood 1 3 2 5 4 4 3 3Charcoal 4 4 5 3 4 3 2 3Kerosene 4 3 3 3 3 3 4 4LPG 4 3 3 2 3 2 2 2Electricity 3 3 3 2 3 2 2 2
Fuel Access North Eastern Nyanza Rift Valley WesternUrban Rural Urban Rural Urban Rural Urban Rural
Fuel wood 3 3 2 2 3 3 3 4Charcoal 2 3 3 2 3 2 3 3Kerosene 4 4 4 3 3 3 4 4LPG 2 2 2 2 1 1 3 3
Segment Matrix

60
Fuel Cost (Affordability) Nairobi Central Coastal Eastern(Appendix III) Urban Rural Urban Rural Urban Rural Urban RuralFuel wood 4* 3 4 4 4 4 3 2Charcoal 4 4 5 4 4 4 3 2Kerosene 4 3 4 4 4 4 3 3LPG 4 3 3 2 3 2 2 2Electricity 4 2 3 2 3 2 2 1
Fuel Cost (Affordability) North Eastern Nyanza Rift Valley Western(Appendix III) Urban Rural Urban Rural Urban Rural Urban RuralFuel wood 3 2 3 2 3 3 4 4Charcoal 3 2 3 2 3 3 3 3Kerosene 3 3 3 3 3 3 3 3LPG 2 2 2 2 2 1 3 2Electricity 2 1 2 1 2 1 2 2
Nairobi Central Coast Eastern North Eastern Nyanza Rift Valley Western
Level of Education (up to secondary - females) 3 5 4 4 3 3 4 4
Willingness to pay Urban Rural
Firewood 1 4 Charcoal 4 3 Kerosene 3 4 LPG 4 3 Electricity 4 2
Segment Matrix

61
Segments• Broad categories of factors that influenced improved cook stove adoption were identified
and several targeted segments were discovered within each category. The targeted segments are based on a collation of drivers from the segment matrix. All scores ranked 4-5 are preferable indicators for a character profile. These character profiles represent the ideal target market for large scale improved cook stove adoption; based on a market profitability approach.
• 12 variables were considered as a determinant of adoption. These were age, gender, head of household, home ownership, family size, geographic location, fuel used in cooking, employment (income quintiles), fuel availability, education level and willingness to pay.
• Improved cook stove adoption and fuel choices are significantly influenced by socio-economic status and demographic profile of households, energy choices and uses, energy cost and expenditure.
• Using the segment matrix, we based the top characteristics on variables that were significant in a review of fuel and improved cook stove adoption. These were age, employment (level of income), gender, level of education, head of the household, household size and geographic location.

62
Segments – Top 3
• Demographic– – Working women; – Women who are the head of the household; age 25 – 54; – Education up to secondary level; – Firewood and Charcoal stove users.
• Economic – – Low income bracket - Kshs 2913 to Kshs 9319 per month; for subsidized stoves– Middle income - bracket Kshs 9320 to Kshs 13015 per month; – High Income - Kshs. 13016 to Kshs. 20408 per month; – High Income - > Kshs. 20409;
• Regional– – Central (Rural household size > 3, Urban household size ~4); – Western (Rural household size ~4);– Coastal (Urban household size ~4).
For upfront purchase

63
Segments - Character ProfilesSegments Education Age Gender /
Head of household
Formal/ Informal
Employment
Income Quintile / month
Household Size
Rural/Urban
Main stove type used in
cooking
District Region Households for adoption
1
Up to Secondary (Primary,
Secondary)25-54
Female Both LowKshs 2913
to Kshs 9319
>3 Rural Fuel wood Murang’a Central
200,000
Female Both High
Kshs. 13016 to
Kshs. 20408;
>Kshs. 20409;
~3 Urban Charcoal Nyeri Central
2
Up to Secondary (Primary,
Secondary)
25-54
Female Both MiddleKshs 9320
to Kshs 13015
~4 Rural Fuel wood Kakamega Western 185,000
3
Up to Secondary (Primary,
Secondary)25-54
Female Both MiddleKshs 9320
to Kshs 13015
~4 Urban Charcoal Kilifi Coastal
135,000Female Both High
Kshs. 13016 to
Kshs. 20408
>Kshs. 20409;
~4 Rural Fuel Wood Kilifi Coastal

64
References• Africa Infrastructure Country Diagnostic Country Report (2010): Kenya’s Infrastructure, A Continental
Perspective• CIA world fact book. Kenya, https://www.cia.gov/library/publications/the-world-factbook/geos/ke.html [Last
Accessed: May 2013]• Energy Environment and Development Network for Africa (2008)• GTZ (2009), Survey on Impacts of the Stove Project in Transmara, Western and Central Cluster of Kenya• Jeuland. A.M., Pattanayak. S., (2012): Benefits and Costs of Improved Cook stoves: Assessing the Implications of
Variability in Health, Forest and Climate Impacts• Kenya National Bureau of Statistics (2007): Basic Report on Well Being• Kenya National Bureau of Statistics (2005/2006): Kenya Integrated Household Budget Survey• Kenya Institute for Public Policy Research and Analysis (2010): A comprehensive study and analysis on Energy
consumption patterns in Kenya• Nyaga. R.K., (2010): Earnings and Employment Sector Choice in Kenya• Omolo. J., (2012): Regional Disparities in Employment and Human Development in Kenya Vol. 1 Issue 1. (pp. 1-
17)• SCODE (2010): Gender, Improved Cook Stoves and Development in Kenya+• Slaski . X and Thurber, M., (2009): Cookstoves and Obstacles to Technology Adoption by the Poor• The East African Community (EAC) Strategy on Scaling-up Access to Modern Energy Services (2008)• Worldbank (2011): The role of liquefied petroleum gas in reducing energy poverty

65
Market Segmentation Study – Survey Analysis
66
Overview• Market Size• Household Purchasing Power• Fuels and Cook Stoves Being Used / Purchased by Segments
– Primary Fuel Used in Cooking– Fuel Collection– Cook Stoves Being Used by Customers– Primary Cooking Devices
• Actions Taken to Purchase ICS / Ongoing Fuel Costs– Current ICS use – Savings and Purchase– Money Spent on Cooking Fuel per Month
• Willingness to Purchase– Reasons for wanting to purchase a new ICS– Reasons for not yet purchasing a new ICS– Willingness to Pay

67
Overview
• Access to Luxury Devices, Motivation and Micro-finance– Interest in Purchasing Luxury Devices– Motivation and Microfinance– Purchasing Schemes
• Active Fuel and Cook Stove Stakeholders in Each Segment• Fuel and Cook stove Value Chains / Distribution Channels– Charcoal Value Chain– Fuel Wood Value Chain– LPG Value Chain– Value Chain – Improved Cook Stoves– Value Chain – Energy Related Products – Current Specs of Market Products

68
AcronymsAGOL Africa Gas and Oil Limited
CBO Community Based Organization
ICS Improved Cook Stoves
KUSCCO Kenyan Union of Savings and Credit Co-operatives
KRC Kenya Railway Corporation
LPG Liquefied Petroleum Gas
MOU Memorandum of Understanding
MF Microfinance
MFI Microfinance Institution
NGO Non Governmental Organization
SACCO Saving and Credit Co-operative Society

69
Market SizeSegments
Region Sample District Female education – up to secondary level
Rural / Urban Stove Type Income
Central Region Murang’a 67,574 Rural Fuel wood Low income
Central Region Nyeri 61,194 Urban Charcoal High Income
Western Region Kakamega 83,461 Rural Firewood Middle Income
Coastal Region Kilifi
15,077
Rural Firewood High Income
Coastal Region Kilifi Urban Charcoal Middle Income
n = 100 unless otherwise stated

70
Market SizeSample district Region Female head of
householdHouseholds for adoption
Sample Size (n)Confidence Level – 95%Confidence Interval - +/-10%
Murang’a
Central 0.3 200,000
100
Nyeri 100
KakamegaWestern 0.2 185,000
100
Kilifi
Coastal 0.2 135,000
100
Kilifi 100
n = 100 unless otherwise stated

71
Households – Purchasing Power Average household size 4.5Household head PercentMale 25%Female 75%
None; 5%
Primary; 36%Secondary;
55%
Tertiary; 4%Education of household head
76.47%
22.35%
1.18%
Factors taken into before purchasing a product
How much item costs
Savings to purchase them
Recommendation from community leader
Other people in the vil-lage using product
Female HH head belonging to women's group n = 60 Yes 88%No 12%
General women's group in areaKopep Women’s groupGaba Women’s GroupKagumoini ChamaUwezo Self help GroupRurie GroupGabo and Gaitho GroupRiato Women’s GroupFaulu KenyaKenya Women ZediKagumoini
Segment 1a - Central region- rural fuel wood cook stove users (Murang’a) – Low income

72
Households – Purchasing Power
Segment 1b – Central region- Urban charcoal cook stove users (Nyeri) – High income
How much the item costs
76%
Savings to purchase the
item28%
Factors taken before purchasing a product
1%
5%
93%
1%
Education of household head
None
Primary
Secondary
University
Household size 4.5Household head PercentMale 55%Female 45%
Female HH head belong to women's group n = 45 Yes 35%No 65%
General women's group in area Metumi Women Group Kenya Women Finance trustSkuta Women group Mungano Women GroupMerry go round Mwendwa GroupWendani Group Young ladies Kangaruu W Group Kingongo Merry Go roundSuper Sales Women S.H Ngumbacho GroupGithima Women Group Pamoja Women GroupNganciarithi Women Group Women FinancePamoja Women Group
73
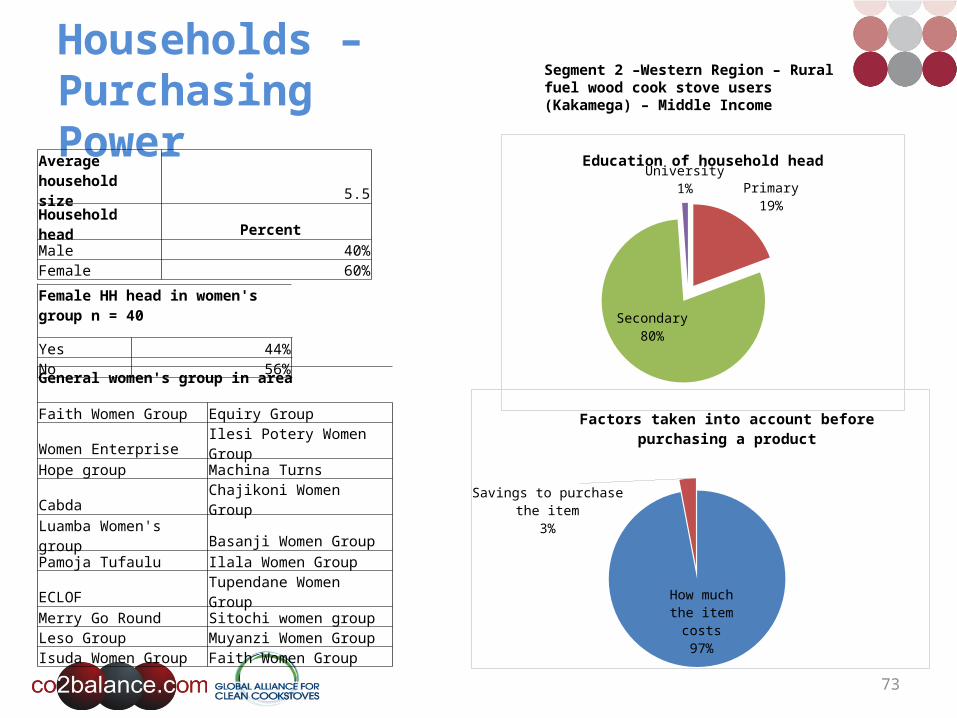
Households – Purchasing Power
Segment 2 –Western Region – Rural fuel wood cook stove users (Kakamega) – Middle Income
Average household size 5.5Household head PercentMale 40%Female 60%
Female HH head in women's group n = 40
Yes 44%No 56%
General women's group in area
Faith Women Group Equiry GroupWomen Enterprise Ilesi Potery Women GroupHope group Machina TurnsCabda Chajikoni Women GroupLuamba Women's group Basanji Women GroupPamoja Tufaulu Ilala Women GroupECLOF Tupendane Women GroupMerry Go Round Sitochi women groupLeso Group Muyanzi Women GroupIsuda Women Group Faith Women Group
Primary19%
Secondary80%
University1%
Education of household head
How much the item costs
97%
Savings to purchase the item3%
Factors taken into account before purchasing a product

74
Households – Purchasing Power
Segment 3a Coastal – Urban charcoal cook stove users (Kilifi)– High Income
How much the item costs
96%
Savings to purchase the item4%
Factors taken into account before purchasing a product
None3%
Primary25%
Secondary65%
Tertiary7%
Education of household head
Average Household size 6Household head Male 26%Female 74%
Female HH head belong to women's group n = 74
Yes 14%No 86%
General Women's GroupsFaraja Women groupTuwezeshe St Matia MulumbaNkonkanyaMerry go round

75
Households – Purchasing Power
Segment 3b Coastal – Urban charcoal cook stove users (Kilifi)– Middle Income
None8%
Primary29%
Secondary52%
Tertiary11%
Education of household head
How much the item costs
71%
Savings to purchase the
item27%
Recommendation from community leader
2%
Factors taken into account before purchasing a product
Average household size 4.7Household head Male 26%Female 74%
Female HH head in women's group n = 74
Yes 40%No 60%
General Women's Group in areaPeacock Merry Go roundKichuku women's group KCBNkonkanya MaremboW.GBig family KWFTSisters with Vision TuunganeTuungane MICROFINANCE GROUPMaendeleo SELF HELP GROUPMudzini MABROCK WOMEN GROUPPeleleza KEDET WOMEN GROUP

76
Purchasing Power – Level of Income
Income Bracket
Segment 1a - Central region- rural fuel wood cook stove users (Murang’a) – Low income
Segment 1b – Central region- Urban charcoal cook stove users (Nyeri) – High income
Segment 2 –Western Region – Rural fuel wood cook stove users (Kakamega) – Middle Income
Segment 3a Coastal– Rural fuel wood cook stove users – High Income
Segment 3b Coastal – Urban charcoal cook stove users (Kilifi)– Middle Income
600 - 1199 5.10% 1% 0.00% 0% 0%
1200 - 2499 13.27% 0% 2.02% 1% 0%
2500 - 3999 26.53% 0% 4.04% 13% 5%
4000-6499 26.53% 3% 3.03% 2% 5%
6500-8999 10.20% 12% 27.27% 3% 13%
9000-11999 7.14% 11% 23.23% 5% 32%
12000-14999 2.04% 19% 20.20% 20% 30%
15000-19999 5.10% 27% 7.07% 30% 7%
20000-24999 1.02% 15% 8.08% 22% 4%
>25000 3.06% 12% 5.05% 4% 4%
Highest income earners. Income in Kilifi is highly fragmented. Many respondents indicated their income were from various sources such as farming, fuel selling and trading

77
Household Occupation and Main Source of Income
Farm
ing
Small S
cale B
usiness
Laborer
Unemploye
d
Manager
Office Worke
r
Other Secre
tary
0%10%20%30%40%50%60%70%80%90%
Segment 1b – Central region- Urban charcoal cook stove users (Nyeri) – High income
Head of household occupation Main source of income
Head
of h
ouse
hold
occ
upati
on (%
)
Total Non agricultural activity - 95%
Farm
ing
Small S
cale B
usiness
Laborer
Unemploye
dOther
Office Worke
r0%
10%20%30%40%50%60%70%80%90%
Segment 1a - Central region- rural fuel wood cook stove users (Murang’a) – Low income
Head of household occupation Main source of income
Head
of h
ouse
hold
occ
upati
on (%
)
Total Non agricultural activity – 23%

78
Household Occupation and Main Source of Income
Farming Small Scale Business Laborer Unemployed0%5%
10%15%20%25%30%35%40%45%50%
Segment 2 –Western Region – Rural fuel wood cook stove users (Kakamega) – Middle Income
Head of household occupation Main source of income
Total non-agricultural activity – 53%

79
Household Occupation and Main Source of Income
Farm
er
Small B
usiness
Owner
Laborer
Other-
Hotel W
orker
Manager
Office Worke
r
Unemploye
d0%
10%
20%
30%
40%
50%
60%
70%
Segment 3a Coastal – Rural charcoal cook stove users (Kilifi)– High Income
Occupation Main source of Income
Head
of h
ouse
hold
occ
upati
on (%
)
Farm
er
Small B
usiness
Owner
Laborer
Manager
Office Worke
r
Other - teach
er0%
10%20%30%40%50%60%
Segment 3b Coastal – Urban charcoal cook stove users (Kilifi)– Middle Income
Occupation Main source of income
Head
of h
ouse
hold
occ
upati
on
Total Non agricultural activity 82%
Total Non agricultural activity 98%

80
Summary• We initially excluded households that were not headed by females. This was to stay true to the original
segments found. Due to time constraints we had to include households that were also headed by males.• Secondary education for all households was over 50%. Kakamega, Nyeri and Rural Kilifi had the highest
levels of secondary education. • Factors taken into account before purchasing an item were generally; savings to purchase the item; the
cost of the item and whether or not it was recommended by a family/friend.• In all segments where there was a male head of household, they indicated that their wife was in charge
of controlling the finances even though the men were the bread winners. There was a distinct level in the division of household roles. The male heads indicated that even though they were the bread winners; wives were the ones who made everyday financial decisions on what is needed in the home or what needs putting money into such as food, clothing, fuel and school fees. Men on the other hand, would make financial decisions on more intensive things like buying land or building/extending the home.
• Polygamous households indicated that the first wife was generally in charge of making financial decisions.
• It was difficult to quantify levels of income. All respondents indicated fragmented and informal sources of income. This was particularly high in Kilifi rural and urban areas. Some of these fragmented sources of income included selling fuel and trading farming produce.

81
Fuels and Cook Stoves being Used / Purchased by Segments

82
Primary Fuel Used in Cooking
0%
20%
40%
60%
80%
100%
85%
2%
85%71%
5%
8%
96%
11%22%
76%
4% 1% 2% 4%13%
3% 1% 2% 3% 6%
KeroseneLPGCharcoalFuel wood

83
Fuel Collection
0%
20%
40%
60%
80%
100%
52.00%
98.00%
45.00%29.00%
97.00%
32.00%
2.00%
48.00%
47.00%
1.00%16.00% 7.00%24.00%
2.00%
Both Collect for Free Purchase

84
Fuel CollectionLocation Average Time to
collect fuel wood / mins
Average Distance to collect fuel wood
Means on transport General sources of fuel
Segment 1a - Central region- rural fuel wood cook stove users (Murang’a) – Low income
30-90 100 m to 1 km On foot Free from nearby woodlandsLocal village vendors
Segment 1b – Central region- Urban charcoal cook stove users (Nyeri) – High income
30-60 100-500m On foot Convenience StoreMarket VendorRoadside vendor
Segment 2 –Western Region – Rural fuel wood cook stove users (Kakamega) – Middle Income
0-30 100m-500m On foot Free from nearby woodlandsLocal village vendorsRoad side vendors

85
Fuel CollectionLocation Average Time to
collect fuel wood / mins
Average Distance to collect fuel wood
Means on transport General sources of fuel
Segment 3a Coastal– Rural fuel wood cook stove users (Kilifi) – High Income.
30-90 500m-1km On foot Free from nearby woodlands/grasslandsRoad side vendors
Segment 3 Coastal – Urban charcoal cook stove users (Kilifi)– Middle Income / Charcoal fuel
0-30 100m-500m On foot/bicycle Convenience StoreMarket Vendor
Segment 3a Coastal – Urban charcoal cook stove users (Kilifi)– Middle Income / LPG Fuel
0-30 1m-3km Car – Respondents indicated long distances required vehicle transport
Bicycle
Convenience storePetrol station
Segment 3b Coastal – Urban charcoal cook stove users (Kilifi)– Middle Income / Kerosene Fuel
0-30 100m – 1km On foot/bicycle Convenience storeRoadside vendorPetrol station

86
Percentage Distribution of Cooking Devices Used in Households
Segment 1a - Central region- rural fuel wood cook stove
users (Murang’a) – Low income
Segment 1b – Central region- Urban
charcoal cook stove users (Nyeri) – High
income
Segment 2 –Western Region – Rural fuel
wood cook stove users (Kakamega) –
Middle Income
Segment 3a Coastal– Rural fuel wood cook stove users (Kilifi) –
High Income.
Segment 3b Coastal – Urban charcoal cook stove users (Kilifi)–
Middle Income Three stone fire 25% 8% 37% 34% 10%Firewood Jiko Kisasa – one pot
10% - 4% 1% 1%Firewood Jiko Kisasa - two pot
1% - 2% 8% -Rocket Mud Stove - one pot
16 % - - - -Rocket Mud Stove - two pots
11% 1% 1 % - -Charcoal stove 7% 50% 21% 20% 57%Upesi Stove 5% 2% 11% 6% -Other ICS 8% 5% 11% -Kerosene wick 14% 26% 14% 12% 16%Kerosene pressure stove - 1% - 4% -LPG stove 3% 12% 4% 4% 15%Electric stove – 2 ring - - 1% - 1%Total 100% 100% 100% 100% 100%
These figures represent cooking devices found in households, they do not reflect primary fuel used for cooking.

87
Percentage of Multiple Stoves Found in Households
Segment 1a - Central region- rural fuel wood
cook stove users (Murang’a) – Low
incomen=47
Segment 1b – Central region- Urban charcoal
cook stove users (Nyeri) – High
incomen = 66
Segment 2 –Western Region – Rural fuel wood
cook stove users (Kakamega) – Middle
Incomen = 70
Segment 3a Coastal– Rural fuel wood cook
stove users (Kilifi) – High Income.
users n = 56
Segment 3 Coastal – Urban charcoal cook stove users (Kilifi)–
Middle Income users n=60
Multiple Stove Use 47% 66% 70% 56% 61%
Reasons for multiple stove use To cook bigger meals 6% 18% 5.71% 17.24% 3.33%To save time in cooking 33% 77% 91.43% 10.34% 33.33%Fuel is cheaper for some stoves 59% 5% 2.86% 68.97% 61.67%Food tastes better 2% 0.00% 0.00% 3.45% 1.67%Less accidents / burns 0.00% 0.00% 0.00% 0.00% 0.00%
Main reasons for multiple stove use.
88
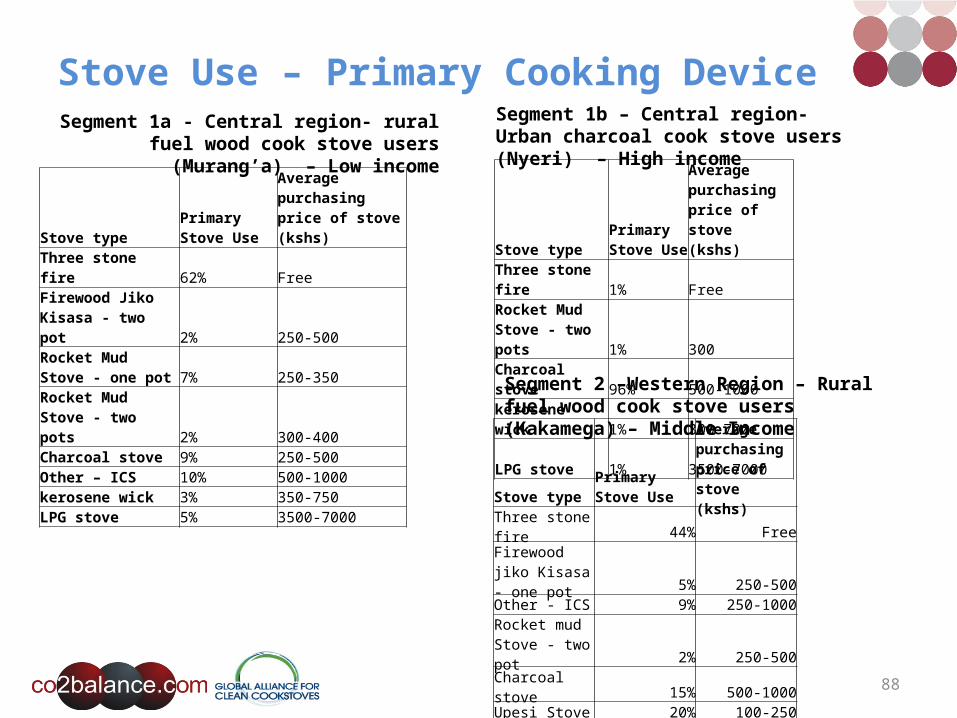
Stove Use – Primary Cooking Device
Stove typePrimary Stove Use
Average purchasing price of stove (kshs)
Three stone fire 62% FreeFirewood Jiko Kisasa - two pot 2% 250-500Rocket Mud Stove - one pot 7% 250-350 Rocket Mud Stove - two pots 2% 300-400Charcoal stove 9% 250-500Other – ICS 10% 500-1000kerosene wick 3% 350-750LPG stove 5% 3500-7000
Stove typePrimary Stove Use
Average purchasing price of stove (kshs)
Three stone fire 1% FreeRocket Mud Stove - two pots 1% 300Charcoal stove 96% 500-1000kerosene wick 1% 300-700
LPG stove 1% 3500-7000
Segment 1a - Central region- rural fuel wood cook stove users (Murang’a) – Low income
Segment 1b – Central region- Urban charcoal cook stove users (Nyeri) – High income
Stove typePrimary Stove Use
Average purchasing price of stove (kshs)
Three stone fire 44% FreeFirewood jiko Kisasa - one pot 5% 250-500Other - ICS 9% 250-1000Rocket mud Stove - two pot 2% 250-500Charcoal stove 15% 500-1000Upesi Stove 20% 100-250Kerosene wick stove 2 % 500-1000LPG stove 3% 3500-7000
Segment 2 –Western Region – Rural fuel wood cook stove users (Kakamega) – Middle Income

89
Stove Use – Primary Cooking Device
Stove typePrimary Stove Use
Average purchasing price of stove (kshs)
Three stone fire 40% FreeFirewood Jiko Kisasa - one pot 4% 250-500Other ICS
23% 250-1000Charcoal stove26% 500-1000kerosene wick 3% 350-700kerosene pressure stove1% 250-600LPG stove 3% 4000-6000
Stove type
Primary Stove Use
Average purchasing price of stove (kshs)
Three stone fire 5% FreeCharcoal stove 60% 500-1000kerosene wick 20% 350-750LPG stove 15% 4000-7000
Segment 3a Coastal– Rural fuel wood cook stove users (Kilifi) – High Income.
Segment 3b Coastal – Urban charcoal cook stove users (Kilifi)– Middle Income

90
Stove Use and Fuel CombinationStove General reasons for use Source of stove / General responses
Three stone fire Fuel more readily availableFood tastes better (when compared against kerosene stove)Cooking large meals are easier
Made by householders
Firewood Jiko Kisasa – one pot
Less smoke in the home if cooking indoors during rainGood for cooking smaller meals.Many respondents indicated that they needed bigger pot plates to cook some meals to they revert to using three stone fires.Good fuel wood savings
Householders make themselves or pay someone to make it for them
Firewood Jiko Kisasa - two pot
Easy to useGood fuel wood savings
Householders make themselves or pay someone to make it for them
Rocket Mud Stove - one pot
Faster cookingEasy to useGood fuel wood savings
Householders make themselves or pay someone to make it for them
Rocket Mud Stove - two pots
Less smoke in the homeFaster cooking
Householders make themselves or pay someone to make it for them
Charcoal stove Charcoal more readily availableFuel is cheap
Purchased from NGO Subsidized vendor or road side vendor

91
Stove Use and Fuel Combination
Stove / type fuel General reasons for use Source of stove
Upesi Stove / fuel wood Stove is easy to useFuel is easy to access / buySaves money and frequent trips to collect/purchase fuel
Purchased from NGO subsidized vendor or householders pay someone to make it for them
Kerosene wick Fuel is cheap to purchase if wood / charcoal runs out – Respondents also indicated that they do not like to use kerosene to cook because they do not like the taste it produces in foods
Purchased from Convenience Store or Local village vendor
Kerosene pressure stove Fuel is cheap to purchase if wood / charcoal runs out Purchased from Convenience Store or Local village vendor
LPG stove Many respondents indicated that LPG was expensive to purchase on a continuous basisFuel lasts longer but only used sparingly
Purchased from Convenience Store or Local village vendor
Electric stove – 2 ring Stove is easy to use Purchased from Convenience Store or Local village vendor

92
Stove Use• A survey on the impacts of stove projects in Transmara, Western and
Central Kenya conducted by GTZ in 2009, indicated that three stone fires had lost it’s predominant position in the Central region, however, in Murang’a district, this is not the case.
• Multiple stove use were common in all households surveyed, however, respondents indicated that some stoves are used only on occasion. Three stone fires were still predominantly used in rural areas; respondents indicated that they didn’t like some of the models being sold in the ICS market. They also indicated that some models were not fitted to their cooking needs, specifically in Western Kenya (Kakamega). For example. respondents indicated that their ICS was not large enough to cook their main food, Ugali, so they reverted to using three stone fires.

93
Actions Taken to Purchase ICS / Ongoing Fuel Costs

94
Current ICS use – Savings and Purchase
The majority of respondents did not want to disclose who they borrowed money from to purchase ICS
0%10%20%30%40%50%60%70%80%90%
100%
8%30%
12%
45%
15%20%
40%54%
50%
70%
72%
30% 44%
5% 15%
Did not answerBought stoves through own savingsBorrowed money to purchase/ install ICS

95
Money spent on cooking fuel per month
<200 Ksh
s
201 - 500 Ksh
s
500-799 Kshs
800-1199 Kshs
1200-1599 Kshs
1600-1999 Kshs
2000 - 2499 Ksh
s
2500 - 2999 Ksh
s
3000 - 3499 Ksh
s
3500 - 4000 Ksh
s
>4000 Ksh
s0%
5%
10%
15%
20%
25%
30%
Segment 1a - Central Region: Rural fuel wood stove users (Murang’a)
Money spent on fuel / month (Kshs)
Resp
onde
nts (
%)
<200 Ksh
s
201 - 500 Ksh
s
500-799 Kshs
800-1199 Kshs
1200-1599 Kshs
1600-1999 Kshs
2000- 2499 Ksh
s
2500 - 2999 Ksh
s
3000 - 3499 Ksh
s
3500 - 4000 Ksh
s
>4000 Ksh
s0%
5%
10%
15%
20%
25%
30%
35%
Segment 1b - Central Region: Urban charcoal stove users (Nyeri)
Money spent on cooking fuel / month (Kshs)
Resp
onde
nts (
%)
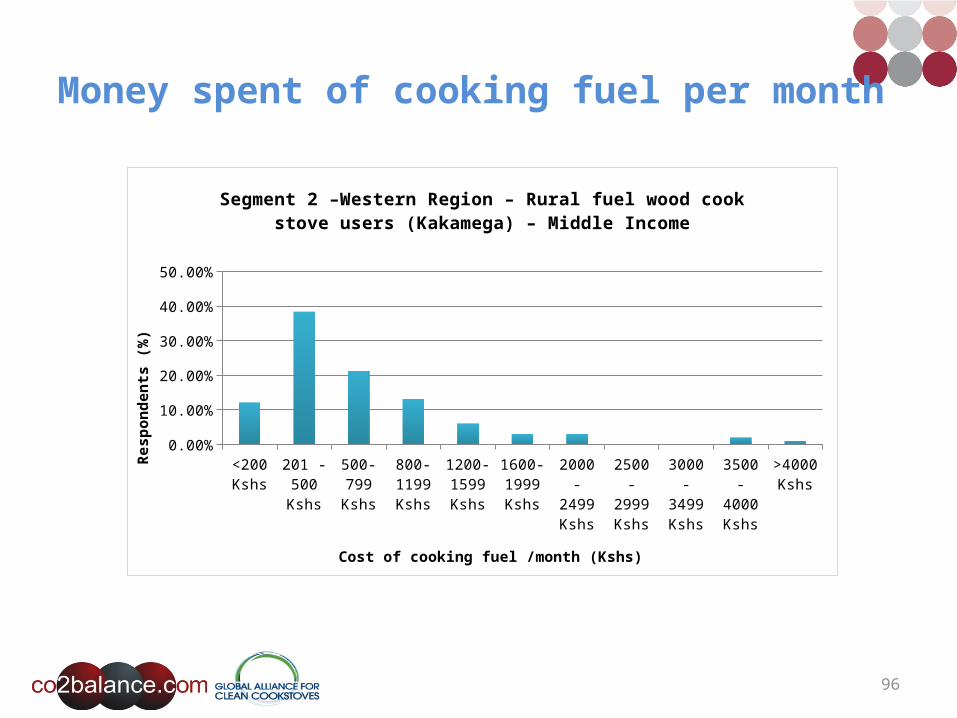
96
Money spent of cooking fuel per month
<200 Kshs
201 - 500 Kshs
500-799 Kshs
800-1199 Kshs
1200-1599 Kshs
1600-1999 Kshs
2000 - 2499 Kshs
2500 - 2999 Kshs
3000 - 3499 Kshs
3500 - 4000 Kshs
>4000 Kshs
0.00%5.00%
10.00%15.00%20.00%25.00%30.00%35.00%40.00%45.00%
Segment 2 –Western Region – Rural fuel wood cook stove users (Kakamega) – Middle Income
Cost of cooking fuel /month (Kshs)
Resp
onde
nts (
%)

97
Money spent of cooking fuel per month
<200 Ksh
s
201 - 500 Ksh
s
500-799 Kshs
800-1199 Kshs
1200-1599 Kshs
1600-1999 Kshs
2000 - 2499 Ksh
s
2500 - 2999 Ksh
s
3000 - 3499 Ksh
s
3500 - 4000 Ksh
s
>4000 Ksh
s0%
5%
10%
15%
20%
25%
Segment 3b Coastal– Urban Charcoal cook stove users (Kilifi) – Middle Income
Money spent on cooking fuel / month (Kshs)
Resp
onde
nts (
%)
<200 Ksh
s
201 - 500 Ksh
s
500-799 Kshs
800-1199 Kshs
1200-1599 Kshs
1600-1999 Kshs
2000 - 2499 Ksh
s
2500 - 2999 Ksh
s
3000 - 3499 Ksh
s
3500 - 4000 Ksh
s
>4000 Ksh
s0%5%
10%15%20%25%30%35%40%
Segment 3a Coastal– Rural fuel wood cook stove users (Kilifi) – High Income
Money spent on fuel / month (Kshs)
Resp
onde
nts (
%)

98
Willingness to Purchase

99
Willingness to Purchase New ICSLocation Willingness to pay
Segment 1a - Central region- rural fuel wood cook stove users (Murang’a) – Low income
98%
Segment 1b – Central region- Urban charcoal cook stove users (Nyeri) – High income
93%
Segment 2 –Western Region – Rural fuel wood cook stove users (Kakamega) – Middle Income
94%
Segment 3a Coastal– Rural fuel wood cook stove users (Kilifi)– High Income
96%
Segment 3b Coastal – Urban charcoal cook stove users (Kilifi)– Middle Income
99%
Even though the majority of households were using more than one cooking device, there was a strong willingness to pay for even more ICS technologies in all segments. Upon further investigation we found that when households were offered an opportunity to purchase a new ICS that could further lower the use of any fuel, they would wanted to purchase the ICS on the strength of the perceived benefit of using far less firewood/fuel.

100
Reasons for Wanting to Purchase New ICS
0%
20%
40%
60%
80%
100%
120%
5% 2% 1%35%
1%5% 18% 28%
1%
14%30%
37%37% 34%
2%
60%43% 34% 30%
83%
To save money spent on fuelTo reduce time collecting fuelIt is an advanced technologyTo reduce smoke in the home
In Kakamega, respondents indicated that their ICS was not large enough to cook their main food, Ugali, so they reverted to using three stone fires.

101
Reasons for not yet Purchasing New ICS
0%
20%
40%
60%
80%
100%
120%
37%7% 7%
29%8%
4%
29% 29%14% 54%
7% 25% 12%28%
13%9%
39% 52%20% 25%
0.43
0.09
Other ICS unavailable in the areaDo not like the models being sold in the areaDo not have the upfront moneyICS is too expensiveCurrently saving to purchase

102
ICS purchase – Willingness to Pay
Willing to pay upfront cost
33%
Willing to pay monthly in-stallments
67%
Purchasing power
0-50 50-100 100-150 150-200 200-250 >2500%5%
10%15%20%25%30%35%40%45%
Willingness to pay per month (Kshs)
Resp
onde
nts (
%)
Segment 1a - Central region- rural fuel wood cook stove users (Murang’a) – Low income

103
ICS purchase – Willingness to Pay
Willing to pay up
font cost59%
Willing to pay monthly in-stallments
41%
Purchasing power
0-50 50-100 100-150 150-200 200-250 >2500%5%
10%15%20%25%30%35%40%
Willingness to pay per month (Kshs)
Resp
onde
nts (
%)
Segment 1b – Central region- Urban charcoal cook stove users (Nyeri) – High income

104
ICS purchase – Willingness to Pay
Willing to pay upfront
cost64%
Willing to pay monthly in-stallments
36%
Purchasing power
0-50 50-100 100-150 150-200 200-250 >2500%
5%
10%
15%
20%
25%
30%
35%
40%
45%
Willingness to pay / month (Kshs)
Resp
onde
nts (
%)
Segment 2 –Western Region – Rural fuel wood cook stove users (Kakamega) – Middle Income

105
ICS purchase – Willingness to Pay
Willing to pay upfront cost
49%
Willing to pay
monthly install-ments51%
Purchasing power
0-50 50-100 100-150 150-200 200-250 >2500%5%
10%15%20%25%30%35%40%45%50%
Willingness to pay / month (Kshs)
Resp
onde
nts (
%)
Segment 3a Coastal– Rural fuel wood cook stove users (Kilifi)– High Income

106
ICS purchase – Willingness to Pay
0-50 50-100 100-150 150-200 200-250 >2500%
10%
20%
30%
40%
50%
60%
70%
Willing to pay / month (Kshs)
Repo
nden
ts (%
)
Willing to pay monthly in-stallments
34%
Willing to pay up-
front cost66%
Purchasing power
Segment 3b Coastal – Urban charcoal cook stove users (Kilifi)– Middle Income

107
Access to Luxury Devices, Motivation and Micro-finance

108
Access to devices
0%10%20%30%40%50%60%70%80%90%
100%
Mobile Phones Television Radio Desktop Computers Laptops

109
Interest in purchasing new products
Devices Segment 1a - Central region- rural fuel wood cook stove users (Murang’a) – Low income
Segment 1b – Central region- Urban charcoal cook stove users (Nyeri) – High income
Segment 2 –Western Region – Rural fuel wood cook stove users (Kakamega) – Middle Income
Interested Not interested
Did not say
Interested Notinterested
Did not say
Interested Not interested
Did not say
Mobile Phones
5% 88% 7% 5% 80% 15% 6% 94% -
Television 39% 48% 13% 20% 50% 30% 20% 80% -
Radio 10% 80% 10% 4% 90% 6% 15% 84% 1%
Desktop Computers
5% 75% 20% 10% 80% 10% 7% 80% -
Laptops 2% 28% 70% 5% 10% 85% 8% 92%

110
Interest in purchasing new products
Devices Segment 3a Coastal– Rural fuel wood cook stove users (Kilifi)– High Income
Segment 3b Coastal – Urban charcoal cook stove users (Kilifi)– Middle Income
Interested Not interested
Did not say Interested Not interested
Did not say
Mobile Phones 35% 30% 35% 4% 96% -
Television 15% 60% 25% 23% 77% -
Radio 3% 97% - 8% 90% 2%
Desktop Computers
17% 83% - 5% 95% -
Laptops 4% 96% - 25% 75% -
111
Motivation and Microfinance• Cooking on improved cook stoves comprises a variety of cultural and lifestyle changes. Some of these
changes include fuel switching, frequency of wood collection (an activity with a strong social component) as well as general cooking (an activity heavily influenced by tradition).
• Changes in lifestyle may bring significant benefits such as the ability to replace wood gathering with productive economic activities; but they are not undertaken lightly.
• Products like improved cook stoves that are more complicated than traditional technologies may require training and ongoing correct use to reap their benefits.
• What has made rural cook stove programs particularly difficult is that they are expensive, imply a significant change in user habits, and, are usually not highly valued by potential users at the offset. For developers to fully succeed in the cook stove market, they will need to be creative in addressing all three of these obstacles, in addition to the difficult challenges of developing cost-effective supply chains to remote rural areas.
• Most important of all are efforts to create compelling perceived value for consumers which goes beyond outsiders’ perceptions of the value that should already exist, such as for health.
• There is a significant lifestyle change presented by a change in cooking methods therefore deep motivation on the part of consumers is required. Skilful design can be a key part of making the stoves as easy to use, robust, and highly valued as possible.
• The extent to which project developers can profitably provide products to those on lower incomes will then depend on how creatively they can apply tools of financing where possible and make subsidies available where necessary through partnerships with governments and NGOs.
Slaski.X., Thurber. M., (2009), FSD 2009
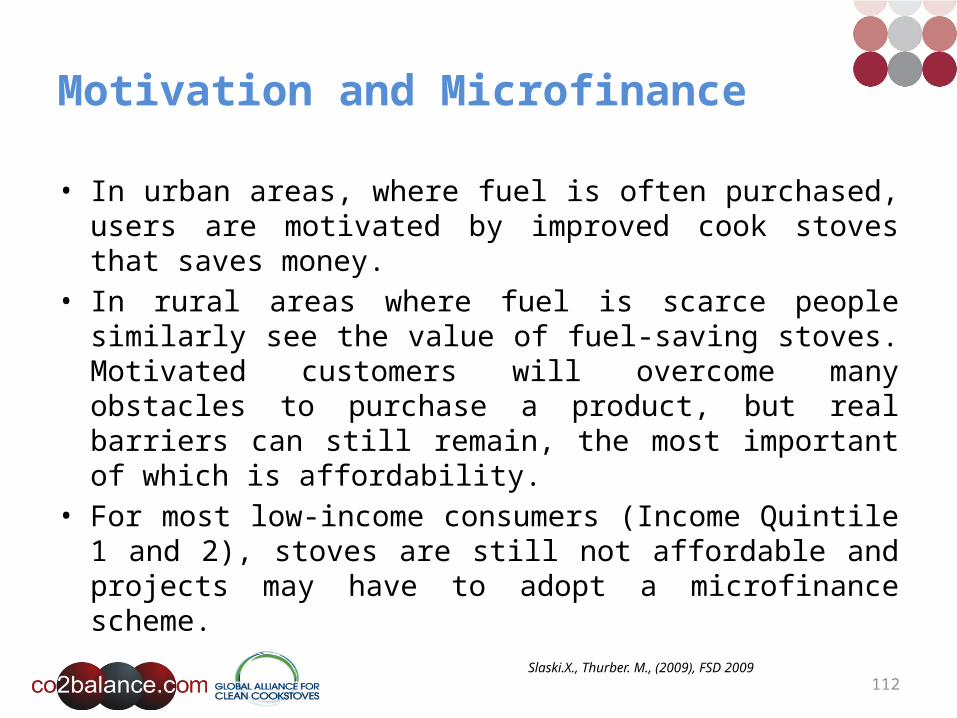
112
Motivation and Microfinance
• In urban areas, where fuel is often purchased, users are motivated by improved cook stoves that saves money.
• In rural areas where fuel is scarce people similarly see the value of fuel-saving stoves. Motivated customers will overcome many obstacles to purchase a product, but real barriers can still remain, the most important of which is affordability.
• For most low-income consumers (Income Quintile 1 and 2), stoves are still not affordable and projects may have to adopt a microfinance scheme.
Slaski.X., Thurber. M., (2009), FSD 2009

113
Microfinance• 33% percent of Kenya has no access of micro financing schemes or financial services, whilst there is a strong business
opportunity to introduce the new technologies under a micro-finance scheme to low-income households and businesses in Kenya, there are a small percentage of people that are unwilling to take out loans for products. The reason was not related to the actual products but purely not wishing to take on any debt.
• Over 40% of Kenyans are unaware of how microfinance works. Education programs, targeting low income families on Income Quintile 1 and 2, especially in rural areas of Nyanza, Eastern, and North Eastern Provinces, can significantly increase the uptake of microfinance projects in Kenya.
• co2balance has conducted household, business and community enterprise surveys in three different locations across Kenya (Kisumu, Aberdares and the Coastal Region). The objective of the surveys was to determine the potential market for clean technologies distributed through a micro-finance scheme in Kenya as a whole.
• The surveys revealed a large potential market for solar lamps, small solar panels, solar light and mobile charging technologies, efficient cook stoves and water filters. Results highlighted a variance in affordability of monthly loan payments, up to a maximum of £3.70 ($5.60). The surveys showed that households are willing and able to pay the highest monthly loan payments for the solar lamps, and the combined lighting and charging devices, suggesting that these products are seen as having the most benefits.
• There is strong interest from community enterprises already experienced with micro-finance to lead small distribution programmes, and MPESA mobile money transfers have been identified as a particularly suitable means to collect payments.

114
Project technologies under micro finance schemes
Project Technologies Market Size / households
Target loan repayment / month
Solar Lamps (one solar lamp)
334,944 £3.70 ($5.60)
Solar Panel 320,988 £0.75-1.10 ($1.10-1.70)
Combined Light and Phone Charger
327,966 £0.75-1.50 ($1.10-2.20).
Efficient Cook Stove – Fuel wood*
- £0.40 ($0.60)
Water Filter 282,609 £0.40 ($0.60)
*In order for the distribution of cook stoves to be viable, the monthly loan payment would have to be higher than the £0.40 ($0.60) households identified as affordable. Alternatively, the cost would have to be supported through the use of carbon finance.

115
Purchasing Schemes – “Merry go round”
• Rural respondents willing to purchase products through financing schemes indicated that they usually do so through women groups.
• The majority of women groups are informal and operate a “merry go round” savings scheme. This works by members making weekly/monthly contributions which are pooled for members to take loans from.
• Alternatively smaller groups pool money and the lump sum is given to a single member of the group each month. The small amounts they contribute when pooled and given to a single member, makes the member have enough money to finance large purchases. For example, if a group has 5 members and each member contributes 1000 every month, then every month a member will have 5,000 to spend.

116
Purchasing Schemes – Hire Purchase
• For formal workers, such as office workers, hotel staff, managers and teachers (SACCO members), hire purchase has become a standard way of paying for household items.
• Most of the hire purchase companies in Kenya are locally owned, with central offices (Nairobi) and rural shops scattered around the country.
• Products sold by Hire Purchase firms include a wide range of household goods ranging from sewing machines to TV’s and stereos to fridges or sofa sets.
• Energy items include cooking appliances and solar home system kits. Goods are sourced centrally on a wholesale basis. Hire purchase contract terms typically last one to two years, and are directly debited from the paycheck of the consumer. The quoted purchase price includes interest on the item, which is often over 40% per annum
References: The Shell Foundation

117
Energy Lending• The Kenyan Union of Savings and Credit Co-operatives (KUSCCO) functions as a national umbrella organization for
Saving and Credit Co-operative Society (SACCO), which account for 40% of Kenya’s national savings.
• KUSCCO is a micro finance institution and has largely focused on the promotion of LPG for cooking purposes. They have also focused on several solar projects.
Energy Lending Model• Market Development: KUSCCO conducts market research to identify needs and feasibility of energy loans. The
energy company develops and markets the technology and trains KUSCCO staff in the technical details of its products.
• Appraisal and Processing SACCOs serve as the primary level micro financing institution to finance energy services through direct loans to clients.
• Disbursement: SACCO loans from KUSCCO for energy on- lending if necessary. KUSCCO issues check to energy companies on behalf of SACCOs to purchase energy equipment
• Installation and Training: For solar loans KUSCCO appoints and trains regional sub-contractors who install the systems as well as arrange basic user training under the supervision of KUSCCO. In case of LPG systems KUSCCO takes up a distribution function where in it collects information on energy needs from the SACCOs and purchases energy systems in bulk directly from the energy companies, distributes them to the SACCOs, which deliver the units to the clients.
• Repayment: SACCO recovers the loans on behalf of KUSCCO and KUSCCO monitors the repayment
118
Active Fuel and Cook Stove Stakeholders in Each Segment

119
Active Cook Stove and Fuel Stakeholders
Client / Partners Scale Marketing ApproachMonitoring Effectiveness of ICS Project Challenges Project Success
Practical Action / GIZ, GVEP, Ministry of Agriculture, Solar Cookers international, Edinburg University, EnDEV
Large Scale
Market mapping for legal charcoal chain.
Focused extensively on women groups to aid in the marketing of alternative fuels and ceramic stoves.
Participatory Market Systems Development.
Participatory Market Mapping.
Working with CBOs and engaging local media (Radios adverts)
Monitoring of IAP
Transportation of ceramic stove products to market is a major constraint
Financing to ensure growth
Competition with substandard products which affects the market negatively
Producer groups trained on production and marketing of ICS (ceramic wood and charcoal burning stoves)
Promoters, retailers and distributor networks established
Scaling up of smoke removal interventions based on IAP monitoring

120
Active Cook Stove and Fuel Stakeholders
Client / Partners Scale Marketing ApproachMonitoring Effectiveness of ICS Project Challenges Project Success
My climate
Large Scale (100,000+ stoves)
Use of women groups to disseminate stoves.
Microfinance scheme through community savings and learning groups.
Sustainable development indicators - Quarterly Monitoring of all indicators
Most effective: Ongoing quarterly surveys to ensure users are happy with stove functionality and use.
Investment for training monitoring and ongoing maintenance
Groups have been trained with installation skills and are marketing stoves as an income generating activity.
Networks and partnerships established to support stove activities.
Setting up microfinance scheme through Kasadimba Women's Group
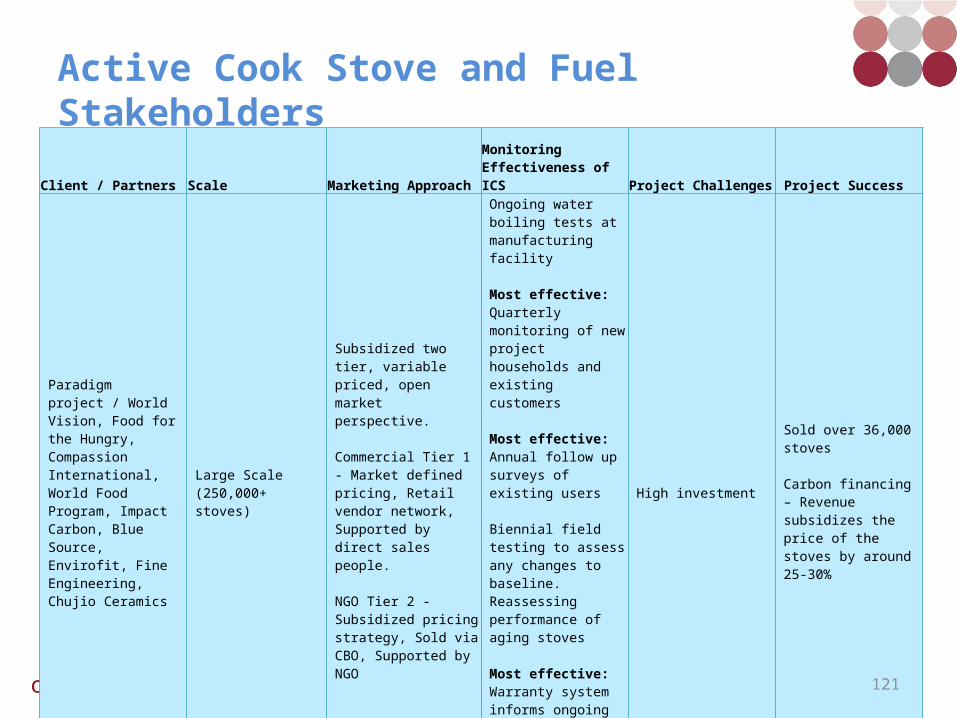
121
Active Cook Stove and Fuel Stakeholders
Client / Partners Scale Marketing ApproachMonitoring Effectiveness of ICS Project Challenges Project Success
Paradigm project / World Vision, Food for the Hungry, Compassion International, World Food Program, Impact Carbon, Blue Source, Envirofit, Fine Engineering, Chujio Ceramics
Large Scale (250,000+ stoves)
Subsidized two tier, variable priced, open market perspective.
Commercial Tier 1 - Market defined pricing, Retail vendor network, Supported by direct sales people.
NGO Tier 2 - Subsidized pricing strategy, Sold via CBO, Supported by NGO
Ongoing water boiling tests at manufacturing facility
Most effective: Quarterly monitoring of new project households and existing customers
Most effective: Annual follow up surveys of existing users
Biennial field testing to assess any changes to baseline. Reassessing performance of aging stoves
Most effective: Warranty system informs ongoing monitoring and allows for real-time response to any stove usage or performance issues.
High investment
Sold over 36,000 stoves
Carbon financing – Revenue subsidizes the price of the stoves by around 25-30%

122
Active Cook Stove and Fuel Stakeholders
Client / Partners Scale Marketing ApproachMonitoring Effectiveness of ICS Project Challenges Project Success
co2balance
Micro scale – 2000+ stoves
Small Scale – 15, 000+ stoves
Large Scale > 15,000+stoves
Stakeholder meeting before product dissemination to engage local communities in the project process.
Trusted community based organisations aid in marketing of stoves.
Most effective: ICS quarterly monitoring - All damaged stoves replaced, stakeholders are interviewed to ensure they are happy with their stove's functionality
Sustainable development indicators - Quarterly Monitoring of all indicators.
Most effective: Biennial monitoring of stove use
Ongoing investment for new projects
Distributing networks established.
Effective monitoring procedure for damaged stoves.
Groups have been trained with installation skills and are marketing stoves as an income generating activity.

123
Active cook stove and fuel stakeholders
Client / Partners Scale Marketing ApproachMonitoring Effectiveness of ICS Project Challenges Project Success
HIVOS / SCODE
Large scale
Awareness campaigns directed at low income target groups to inform them about benefits and availability of ICS and fuel wood production.
Targeting rural women through women's groups to effectively participate in the project both as entrepreneurs and beneficiaries.
Use of gender responsive approach in the implementation, monitoring and evaluating stages along the project
Difficult to develop local fuel wood supply in fuel scarce areas.
Technical support to entrepreneurs in installing ICS and planting trees at buyer’s place.
Training buyers on operation and maintenance of ICS.Training households and institutions on production, management and utilization of trees for fuel wood production.
Sharing information and knowledge on ICS, fuel wood and gender related issues.

124
Active cook stove and fuel stakeholders
Client / Partners Scale Challenges Project Success
Major LPG suppliers
Shifting LPG prices
Rising import costs and weaker domestic currency
Inaccessibility to rural communities
Oryx Energies - Over 150,000 LPG cylinders in Western Kenya
Established distribution networks with local shops and supermarkets
Hashi Gas - Installed two bulk LPG storage tanks at its Nairobi LPG plant
Oryx Energies
Marketed 100,00 + MT hydrocarbons.
Large Scale - Over 150,000 LPG cylinders in Western Kenya
TotalGaz Large Scale - Nationwide
Hashi Gas Large Scale - Nationwide
Total Kenya LtdLPG filling station in Thika Central Kenya
Unknown

125
Fuel and Cook stove Value Chains / Distribution Channels

126
Charcoal Value ChainWood production
Wood harvesting
Charcoal production
Charcoal transport
Large Scale Selling
Small Scale Selling
Charcoal consumption
Women Men Men
Men –
Large scale. Women – Small scale
Men and
Women
Women
Women
and Men
Low Skill
Tree seeding
Tree planting
Tree cutters / loggers
Charcoal packaging
Collectors
Local and national distribution through individual transport or SMEs
Large scale retailers
Small shop owners.
Road side vendors
Town and village vendors
Seasonal
Seasonal / Full
Time
Seasonal / Full time
Full Time
Full Time
Full Time
Full Time
Job split by gender
Job type
Full time / part time
Charcoalers
Kiln construction

127
Charcoal Value Chain
Average Age 39 35 34
Share of Women 16% 14% 57%
Owning business
95% 88% 67%
Formal Education
Primary 58%; Secondary 30%; Tertiary 3.8%
Primary 50%; Secondary 36%Tertiary 4%
Av. gross income per month
Kshs. 4,496 Kshs. 11,298 Kshs. 7,503
Full time business
51% 43% 74%
Wood production/Harvesting
Charcoal transport
Vendors
Source: National Charcoal Survey

128
Charcoal Distribution• Women are primarily involved with tree seedling planting, watering, tending and selling. They
also care for the tree as it grows on the land. Men also partake at this level; however they are much more heavily involved in tree cutting and tree burning.
• Wood harvesting is done by the Tree Cutters/Charcoalers, who cut the wood and stack it systematically in a pile into an earth mound kiln. The kiln is then fired and left for between 7 and 14 days.
• After cooling, the charcoal is offloaded from the kiln and packed into bags which range from 28 to 42 kilograms with 35kg being the average. The charcoaling process generally takes between ten to twenty one days.
• Women and men both take part in charcoal packaging. Packed charcoal is sold to the transporters at the charcoaling site or transported to the roadside, mostly using human labour; awaiting customers who are either transporters to the urban centres or consumers who directly get their charcoal from the charcoalers.
• Transporting the charcoal to markets/end users can be challenging. Pick ups and LGVS are the most commonly used means of transport. Some rural areas still view charcoal production as illegal, even though there has been recent legislation to support sustainable charcoal production. May rural areas still pay bribes to law enforcement along transport routes.
Sources: PISCES (2010), Cologne University of Applied Sciences Institute for Technology and Resources Management in the Tropics and Subtropics (2010)
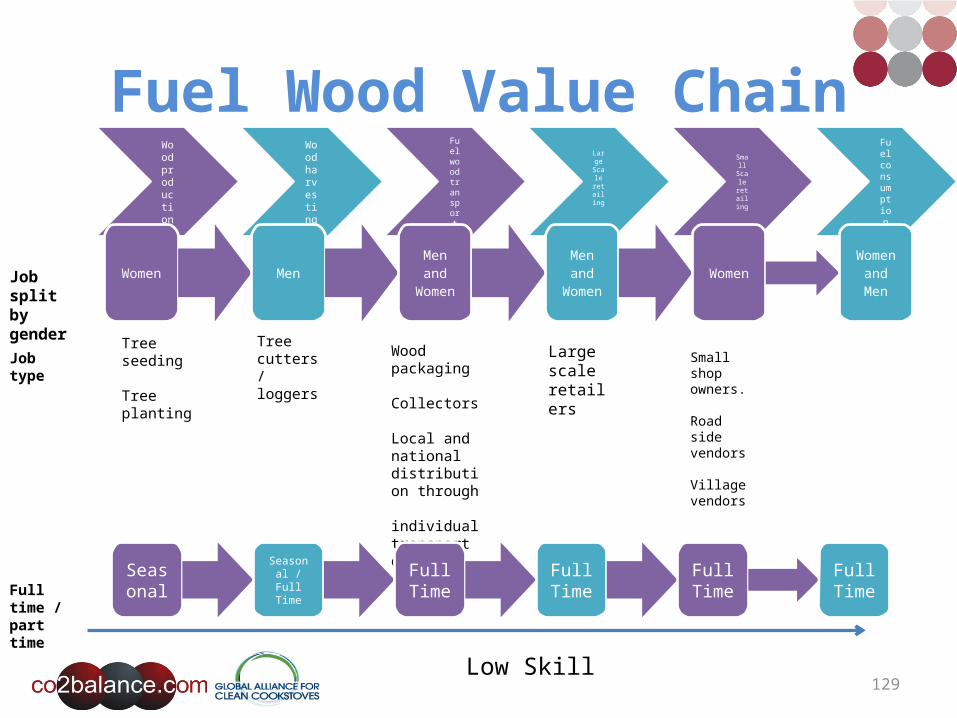
129
Fuel Wood Value ChainWood production
Wood
harvesting
Fuel
wood transport
Large Scale retailing
Small Scale retailing
Fuelconsumption
Women MenMen and
Women
Men and
WomenWomen
Women and Men
Low Skill
Tree seeding
Tree planting
Tree cutters / loggers Wood
packaging
Collectors
Local and national distribution through individual transport or SMEs
Large scale retailers
Small shop owners.
Road side vendors
Village vendors
Seasonal
Seasonal / Full
Time
Full Time
Full Time
Full Time
Full Time
Job split by gender
Job type
Full time / part time

130
Fuel Wood Value Chain• Fuel value chain is characterized by a marked fragmentation
of operators (producers, transporters and retailers) who tend to work in isolation on an individual or informal basis.
• Fuel wood and other biomass resources generate at least 20 times more local employment within the national economy of Kenya than other forms of energy, per unit consumed (UNEP 2012). This is due to the huge amount of manpower (unskilled labor) required for harvesting, processing, transporting and trading of the fuels.
Cologne University of Applied Sciences Institute for Technology and Resources Management in the Tropics and Subtropics (2010)
UNEP The Role and Contribution of Montane Forests and Related Ecosystem Services to the Kenyan Economy (2012)

131
Producti
on Platform
Gas
Processing Plant Refinery
Pri
mary Storage
Bulk transport
Distri
buti
on depot
Consumer
LPG Value Chain
LPG import Import terminal
Highly Skilled
Highly Skilled
Highly Skilled
Low skilled
Low skilled
Skill type

132
LPG Value Chain
There are two state-owned enterprises relevant to the LPG industry in Kenya:• Kenya Petroleum Refineries Limited, a joint venture owned on a 50/50 basis by the state and
Essar Energy Overseas Limited, owns and operates a hydroskimming refinery with a throughput capacity of approximately 4.5 million tonnes per year. There’s an imbalance between refinery production and domestic market requirements for black oils (residual fuels such as heavy fuel oils and industrial diesel). This results in a maximum refinery production yield of LPG in the range of 28,000 to 30,000 tonnes per year. Demand for LPG in Kenya has increased in the last five years from 49,400 tonnes in 2005 to 87,800 tonnes in 2010, an increase of about 78 per cent.
• Kenya Railway Corporation (KRC) transports LPG in rail tankers from the Mombasa storage depots owned by the four LPG supply/distribution companies to their storage and bottling installations in Nairobi. The private industry operators in the LPG supply and distribution business are Caltex, Libya Oil Kenya Limited (branded OiLibya), Shell (a joint venture with BP), TOTAL (TotalFinaElf), Kenol/Kobil and some relatively new participants—Hashi Energy (Hashi Gas), BOC (Handigas) and Hunkar Gas. The National Oil Corporation of Kenya Limited also indicates that it has entered into LPG distribution. Source: Houston International Business Corp
(2011)KNBS (2011)
Production Platform
Gas Processing Plant Refinery
Bulk transport

133
LPG Value Chain
• The LPG companies import in a joint procurement operation. The joint cargoes are normally in the range of 1,200 to 1,300 tonnes each.
• Typical import sources are Aden (Yemen), South Africa (seasonal availability), and from as far away as.
• LPG terminal at Shimanzi in Mombasa has a storage capacity of just 1,400 MT. Tankers carrying 2,500 tonnes of gas have to off-load subject to availability of storage space.
• Africa Gas and Oil Ltd (AGOL) has completed building a bulk import handling and storage terminal at Mombasa to ease the quick offloading of sea tankers ferrying over 5,000 tonnes of LPG from the Middle East. The depot has a storage capacity of 14,000MT
Sources: Houston International Business Corp (2011). Ministry of Energy, KNBS 2011
LPG Import
ImportTerminal
Primary Storage

134
LPG Value Chain – Distribution Depots
• In Kenya, companies have between 75 and 220 service station outlets. Over two thirds of these outlets are located in major urban centres such as Nairobi, Mombasa, Kisumu or Nakuru. Stations are either owned by the company or franchised to local dealers with strict relationship rules.
• Caltex, OiLibya, Shell and TOTAL each have small bottling plants in Mombasa as well as larger plants in Nairobi.
• BOC also has a bottling plant in Nairobi which provides hospitality to Kenol/Kobil. In addition OiLibya has a small plant in Eldoret, which also bottles TOTAL cylinders under a hospitality arrangement.
• Hashi Energy (Hashi Gas), BOC (Handigas) and Hunkar Gas also have filling facilities. • The LPG cylinder sizes have been regulated and harmonized by The Energy (Liquefied Petroleum Gas)
Regulations, 2009, to four allowable sizes for household use: 1 kg, 3 kg, 6 kg and 13 kg. The valves and regulators have also been standardized (unified) to facilitate market competition and ensure safe practices.
• The operators also have larger cylinder sizes such as 22.5 kg, 35 kg and 50 kg to serve commercial and light industrial consumers, as well as bulk distribution operations serving stationary bulk tanks installed at industrial/commercial sites.
Source: Houston International Business Corp (2011)

135
LPG Value Chain – End Users
• The distribution companies in Kenya are owners of their entire cylinder stocks. The end users use them on the basis of having paid an initial deposit and the companies are readily disposed to returning the original deposit to any end-user who wishes to return cylinders belonging to their respective companies.
• The Energy (Liquefied Petroleum Gas) Regulations, 2009 established minimum cylinder ownership provisions of the companies in order to be licensed as well as provisions for an LPG Cylinder Exchange Pool which restricts the filling of cylinders owned by others to members of the Pool.
• The Kenyan government wants to encourage the use of LPG as a measure to counter deforestation, and to this end the government has laid out several policy initiatives that it hopes will reduce the price of LPG for consumers.– One important measure is the standardization of LPG cylinders and valves which allow
consumers to choose their LPG supplier based on the cost alone. This measure will encourage cost competition among the LPG suppliers thus reducing the consumer LPG prices.

136
Value Chain – Improved cook stoves
Artisanal Assemblers
Local Manufacturer / Assemblers
Overseas Manufacturer/ Assemblers
Transport of components/Materials
Intermediary Broker
Stockists, Vendors,
Retail
Organisations Promoting
Stoves
End Users
Onsite Material/
Component Producers
Shipping
Storage / Warehousing
Local Distribution
(CBOs, NGOs)
In bound Logistics
Operations Outbound Logistics
Marketing, Sales, Service

137
Distribution ChannelsValue chain Distribution
Onsite Material/Component Producers
Coastal - Local materials available - New steel sheet, Recycled steel sheet (oil drums etc.), Wire mesh, Bricks, Pottery clay, Stone, Cement.
Central and Western – High availability of potter clay in both regions. Clay required for stove liners is sourced locally . Therefore, all components are sourced, made, and distributed locally.
Raw material collection is generally contracted by large scale distributors or purchased from fragmented sources by small scale contractors.
Myclimate and Practical action Upesi stoves generally produced by locally available material in Central and Western regions.
ChallengesClay as a raw material is in decline following introduction of concrete.Obtaining environmental licence can be vulnerable to corruptionQuality control on materials can increase administrative costs.
Transport of components / raw materials
Usually contracted out to local businesses. Transported by locally/nationally hired LGVs/HGVs.
Dilapidated road networks and seasonality of material supply can cause delays. Access to materials dictated by location (rural areas can be difficult to access).
Road infrastructure in Western Kenya better than Central and Coastal.

138
Value chain Distribution
Overseas manufacturers / Assemblers
High administration costs for overseas manufactures. Raw materials for stove production may not be locally available. Income and general business of small scale local operators can be adversely affected by overseas companies.
Paradigm project imports Envirofit stoves from the USA and distributes them through retail or NGO partners. Envirofit also has a manufacturing plant in Nairobi
Local Manufacturers / Artisanal Assemblers
Done by men/women through NGO/CBO groups. Women are mainly involve in liners production and stove assembly whereas metal work is dominated by men.
Logistics Stoves that are manufactured on site are transported to warehouses via hired HGVs, LGVs.
co2balance’s stoves are manufactured at Coast Clay and transported stoves from the main Mombasa factory to warehouses at the project location.
Storage ICS are stored in warehouses in close proximity to or in project area. This can be up to one week before distribution
co2balance negotiates short term renting contracts with community businesses to generate local employment in project area.
Distribution Channels

139
Value chain Distribution
Local distribution CBOs, NGOs Poor infrastructure and road networks can cause delays. Distribution costs can be high depending on location.
Carbon offset practitioners may choose areas with high baseline consumption (which tends to be areas of lesser need for ICS projects).
Micro finance schemes may be needed in low income rural areas.
Organisations promoting stoves
My climate, Practical Action and Scode work closely with women groups. Radio and news paper adverts most effective in reaching large scale target market.
Vendors/ Retail Groups sell at open markets and to big and small retailers on demand. Most retailers arrange for their own transportation.
Retailers and Govt/ NGOs arrange for their own transportation to pick up the finished products and distribute them appropriately.
GVEP scheduled to work with Women Enterprise Development Institute (WEDI) - fund manager with a portfolio of 800 women’s savings and credit groups operating in the larger Central Province of Kenya.
End Users Purchase ICS from retail or NGO/CBO group; through savings or microfinance scheme.
Purchase liners, raw materials from local small scale businesses to manufacture stoves (Firewood jiko, upesi stove, Rocket mud stoves).
Usually sign carbon transfer forms from project developers in carbon financing projects - subsidized ICS.
Distribution Channels

140
Distribution Channels – Jiko Poa / EnvirofitLocal Production
Jikopoa
Import
Envirofit3rd Party Warehousing
3rd Party Logistics
Distribution and Wholesale
NGO Partner
Consumer
RetailCommunity Based Organisation
Imported from overseas (USA), Manufacture locally (Nairobi)
Sourced from local materials.
Women’s groups / distribution through microfinance schemes
Made locally by fine engineering through mechanised process. Liner made locally in Limuru
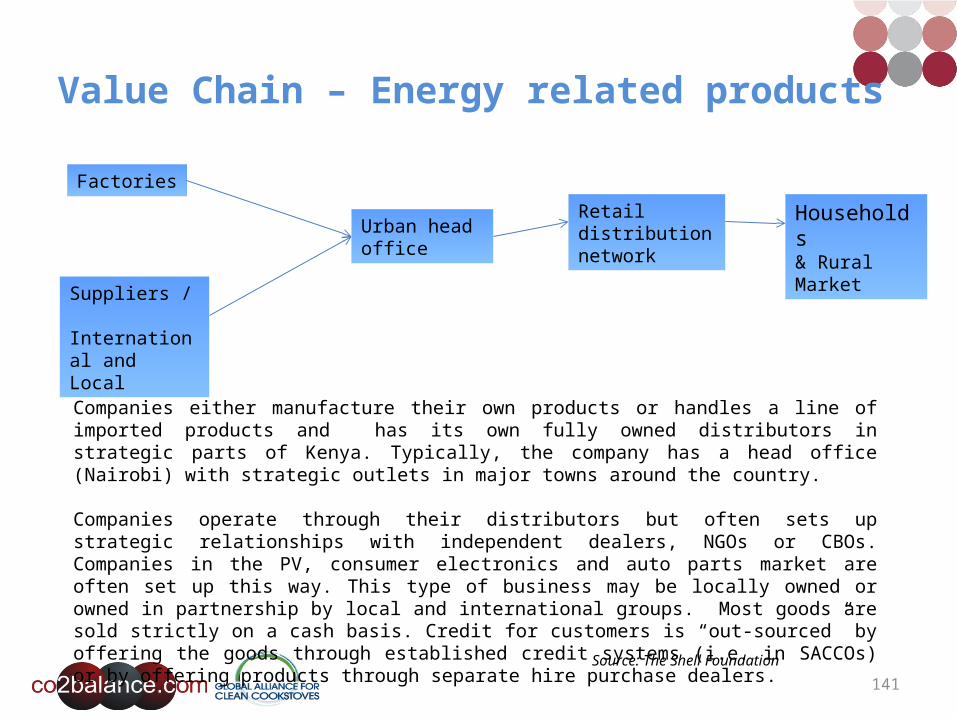
141
Value Chain – Energy related products
Factories
Suppliers / International and Local
Urban head office
Retail distribution network
Households& Rural Market
Companies either manufacture their own products or handles a line of imported products and has its own fully owned distributors in strategic parts of Kenya. Typically, the company has a head office (Nairobi) with strategic outlets in major towns around the country.
Companies operate through their distributors but often sets up strategic relationships with independent dealers, NGOs or CBOs. Companies in the PV, consumer electronics and auto parts market are often set up this way. This type of business may be locally owned or owned in partnership by local and international groups. Most goods are sold strictly on a cash basis. Credit for customers is “out-sourced” by offering the goods through established credit systems (i.e. in SACCOs) or by offering products through separate hire purchase dealers.
Source: The Shell Foundation

142
Distribution Channels – Solar technology
Central DistributorImport/distribute durable and affordable quality productsTrain rural distributorsQuality control and technical backup
Rural distributorProvide financial services to end users.Ensure availability of productProvide after sales services
End users
Main distributors: SNV, ENDEV, GIZ. SNV has partnered with ENDEV through GIZ Kenya in implementing a solar PV Project in ten counties in Kenya; Central and Western regions.
In the current distribution model , SNV has signed partnership MOUs with 7 of the Lighting Africa Associates based in Kenya. SNV collaborates with both Lighting Africa and rural distributors to create awareness about the availability and benefits of using solar technology to replace kerosene lamps.
Awareness creation is done through road shows, media and local stakeholder forums. SNV is also involved in the capacity building of both the rural distributors as well as Last Mile Entrepreneurs who are responsible to develop innovative financing mechanisms. These include check off systems, micro finance and lay away payments.
Visionary Empowerment Programme is a leading rural distributor in Central Province (Thika) and has a successful microcredit programme for over 7,000 of their women groups members.
Source: SNV

143
Current market products in Segments – Specs
Products Design Weight /kilograms Specs: width X height
Envirofit G3300 6 29cm x 29cm
Envirofit CH-5200 Charcoal 3.4 35cm x 16.2
Envirofit CH-2200 2.3 31.3cm x 15.4cm

144
Current market products in Segments – SpecsProducts Design Weight /kilograms Specs: width X height
Envirofit M5000 HH Wood Stove7
4.2 32cm x 28cm
Jikopoa Unskirted HH Wood Stove
- -
LifeStove (EzyCharcoal) / Metalrax HH Charcoal Stove
- -
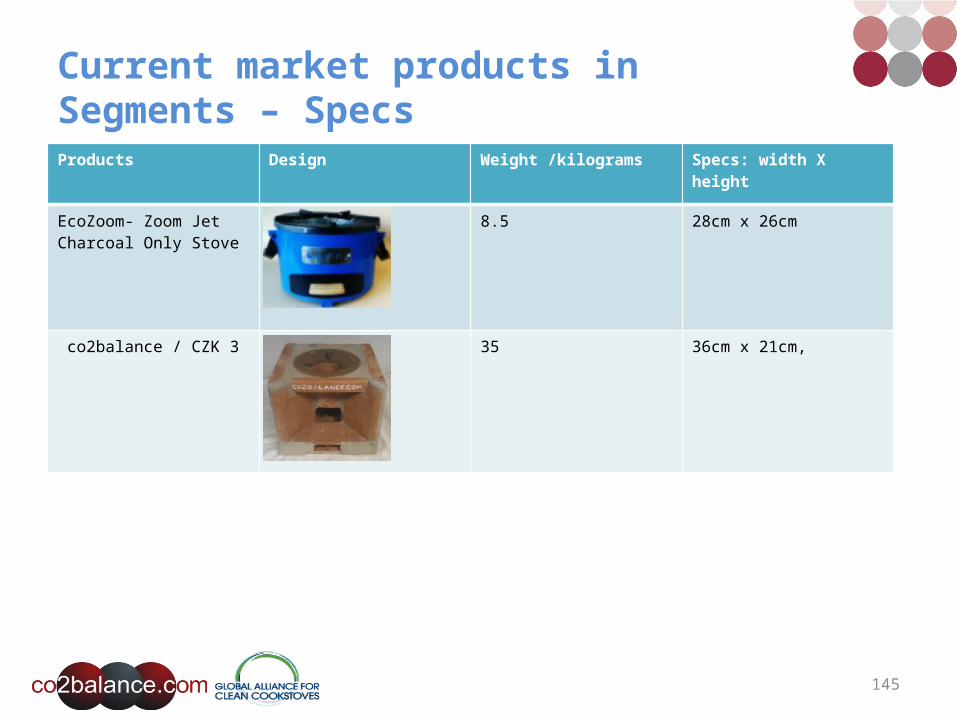
145
Current market products in Segments – SpecsProducts Design Weight /kilograms Specs: width X height
EcoZoom- Zoom Jet Charcoal Only Stove
8.5 28cm x 26cm
co2balance / CZK 3 35 36cm x 21cm,

146
Products Design Weight /kgs Spec width X height
Ezystove 2.8 33 cm x 30.5cm
Fireless cooker 9 – 20 -
ICS - Ceramic liner, Kuni Mbili, Upesi, Rocket stove, Jiko Kisasa
- 25cm X 16cm
Current market products in Segments – Specs

147
Current market products in Segments – Specs
Products Design Weight /kgs Spec width X height
D.light S250 (Solar lanterns – combined lighter and mobile charger)
0.350 (lantern only) 12.7 cm X 13.7cm
D-Light S10 0.3 3.5cm X 7.9cm
LifeStraw Portable Water Filter 0.095 2.9cm X 23.3

148
Current market products in Segments – Specs
Products Design Weight /kgs Spec width X height
Barefoot firefly 12 mobile weight – LED Lamp
0.5 -
Powapack junior 2.5 matrix and Powapack 5w – Solar lantern
1.9 6.5cm x 10.5cm
Trony Solar Sundial TSL-01 – Solar Desk Lamp
0.39 -
Permanet 3.0 – Insect net
-
Insecticide (deltamethrin) 4.0 g/kg
Synergist (PBO) 25 g/kg160x180x150cm190x180x150cm

149
Current market products in Segments – SpecsProducts Design Weight /kgs Spec width X height
Silver lined ceramic water filter 20-30 kgs Ceramic pot ~30cm x 25cm
Safi solutions ceramic water filter
Unknown unknown

150
References• Delahunty-Pike, A., (2012) Gender Equity, Charcoal and the Value Chain
in Western Kenya. Policy Innovation Systems Clean Energy Security Policy• Matthews, W.G., Zeissig, (2010) H.R, Residential Market for LPG: A
Review of Experience of 20 Developing Countries. Houston International Business Corp
• Slaski . X and Thurber, M., (2009) Cookstoves and Obstacles to Technology Adoption by the Poor
• SNV, Solar Energy - Access to Clean and Affordable Off-Grid Lighting Solutions for the BOP http://www.snvworld.org/sites/www.snvworld.org/files/publications/snv_kenya_solar_fact_sheet.pdf [Last Accessed: June 2013]
• The Shell Foundation Sustainable Energy Programme, Kenya Country Report