market size study for electronic commerce
TRANSCRIPT

Market Size Study for ElectronicCommerce
An Estimate of the amount for Internet
Electronic Commerce in Japan
Ministry of International Trade and Industry
Andersen Consulting
June 17,1999
Ministry of International Trade and Industry

1
Objectives and scope of the study
Coverage:
� Transaction amount generated by electronic commerce in Japan,
� By categories of products and services in both business toconsumer (B to C) and business to business (B to B) electroniccommerce
Forecast range:
� 1998a2003 (next five years)
� To estimate the current market size of electronic commerce inJapan
� To Estimate the future market size of electronic commerce inJapan
� To compare Japanese market size with US market size.
� To develop basic estimation model
Objectives
Scope
2
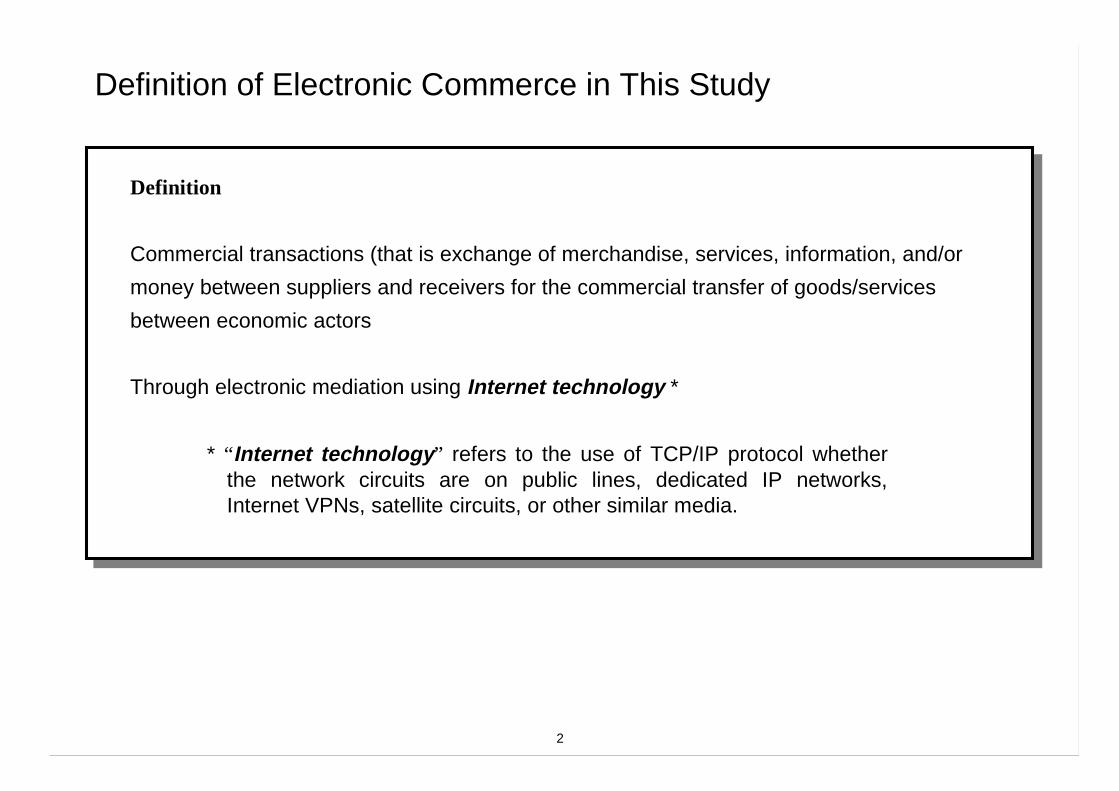
Definition of Electronic Commerce in This Study
Definition
Commercial transactions (that is exchange of merchandise, services, information, and/or
money between suppliers and receivers for the commercial transfer of goods/services
between economic actors
Through electronic mediation using Internet technology *
* “ Internet technology” refers to the use of TCP/IP protocol whetherthe network circuits are on public lines, dedicated IP networks,Internet VPNs, satellite circuits, or other similar media.
3
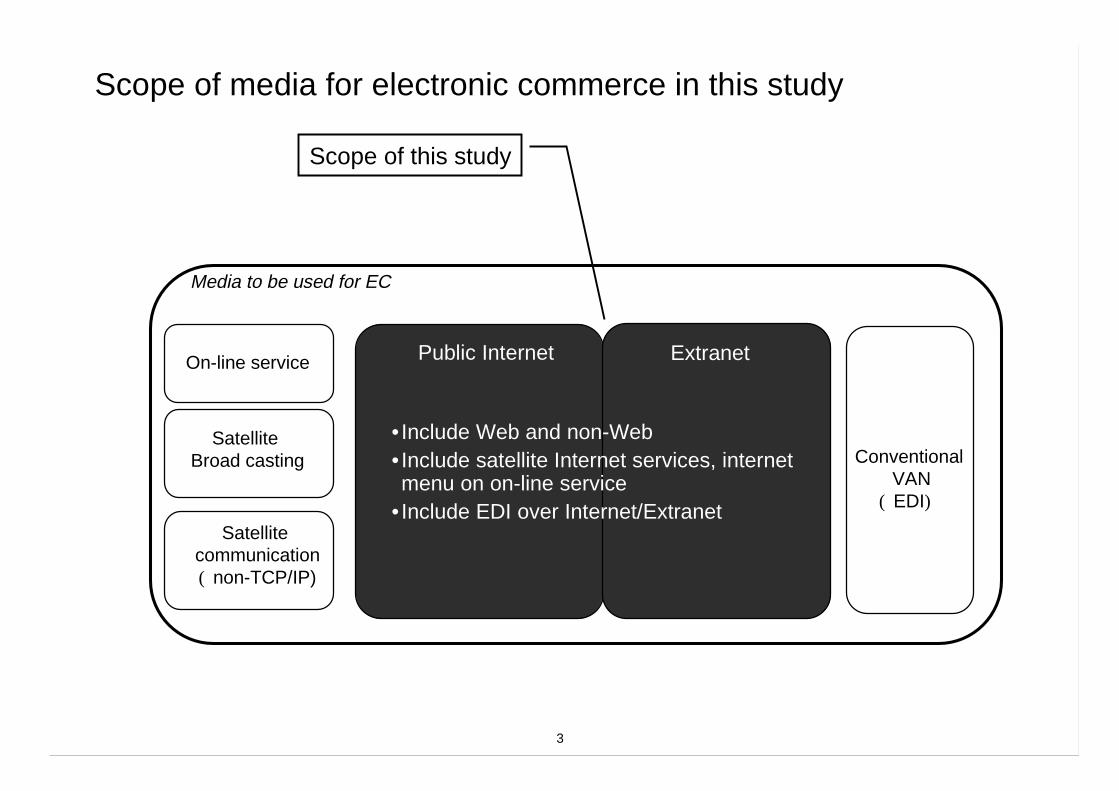
Scope of media for electronic commerce in this study
Public Internet ExtranetOn-line service
Satellite Broad casting
Media to be used for EC
• Include Web and non-Web•Include satellite Internet services, internetmenu on on-line service
• Include EDI over Internet/Extranet
Scope of this study
Conventional VAN
( EDI)
Satellite communication( non-TCP/IP)

4
After ordering
Procurement activities
• Access information• Search for and selectproducts
• Confirm estimates• Negotiate prices and termsetc.
• Finalize specifications• Finalize (customize) contentof orderetc.
• Provide information• Promote sales• Provide estimates• Negotiate prices and�termsetc.
• Issue purchasing order/contract• Indicate specifications andquantities ordered Processordering and contractinginvoices
• Proceed settlementetc.
• Arrange delivery conditionsetc.
• Process delivery andinspection invoices
• Settle etc.
• Finalize specifications(discuss specifications andexchange drawings)
etc.
• Issue orderacceptance/contract
• Ask for payment• Process order-booking andcontracting invoicesetc.
• Finalize delivery conditions• Transport goods and servicesto the purchaser (physically orelectronic)
• Process delivery andinspection invoices
• Receive payment (whenseparate from orderacceptance)����etc.
Development/design activities
Sales/marketing activities
At the time of orderingPrior to ordering
Scope of activities included in electronic commerce in this study
5
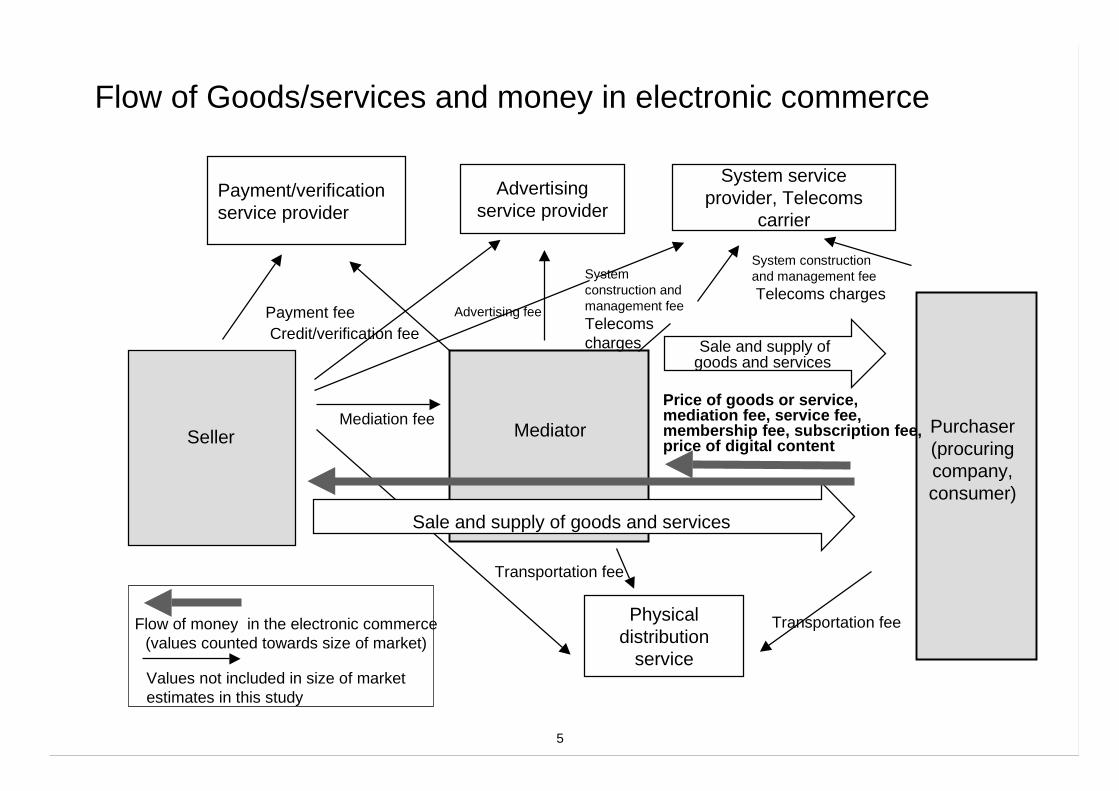
Flow of Goods/services and money in electronic commerce
Seller Mediator Purchaser(procuringcompany,consumer)
Advertising fee
System serviceprovider, Telecoms
carrier
Payment/verificationservice provider
Advertisingservice provider
Mediation fee
Payment fee Credit/verification fee
Physicaldistribution
service
Sale and supply of goods and services
Sale and supply of goods and services
Price of goods or service,mediation fee, service fee,membership fee, subscription fee,price of digital content
Transportation fee
Values not included in size of marketestimates in this study
Flow of money in the electronic commerce(values counted towards size of market)
Transportation fee
System constructionand management fee Telecoms charges
Systemconstruction andmanagement feeTelecomscharges

6
Analyze US forecasts
Analyzedrivers/barriers
Estimate market size by fact base
Computation of sizeof market forecast
Calibrate and fine tune parameters
- Determine a basic model structure and select parameters/
- Analyze and compensate forecasts for electronic commerce in theUS, considering current US situations and differences in definition.
- Select drivers/barriers and analyze them in the view point of thedifferences between Japan and the US for each drivers/barriers .
- Add up current and future market size related variables directly,using results of questionnaire surveys, interviews and publishedinformation.
- Adjust parameters with reference to findings for current size ofmarket and fine-tune parameters with references to futureprojection by fact base.
Description
Identify model parameters
Determine basic model structuresand model parameters
- Identify parameters using integrated US forecast and comparativeanalysis of drivers/barriers.
- Plug estimates for each parameter into the model to compute asize of market forecast.
Step
Method of Approach
7
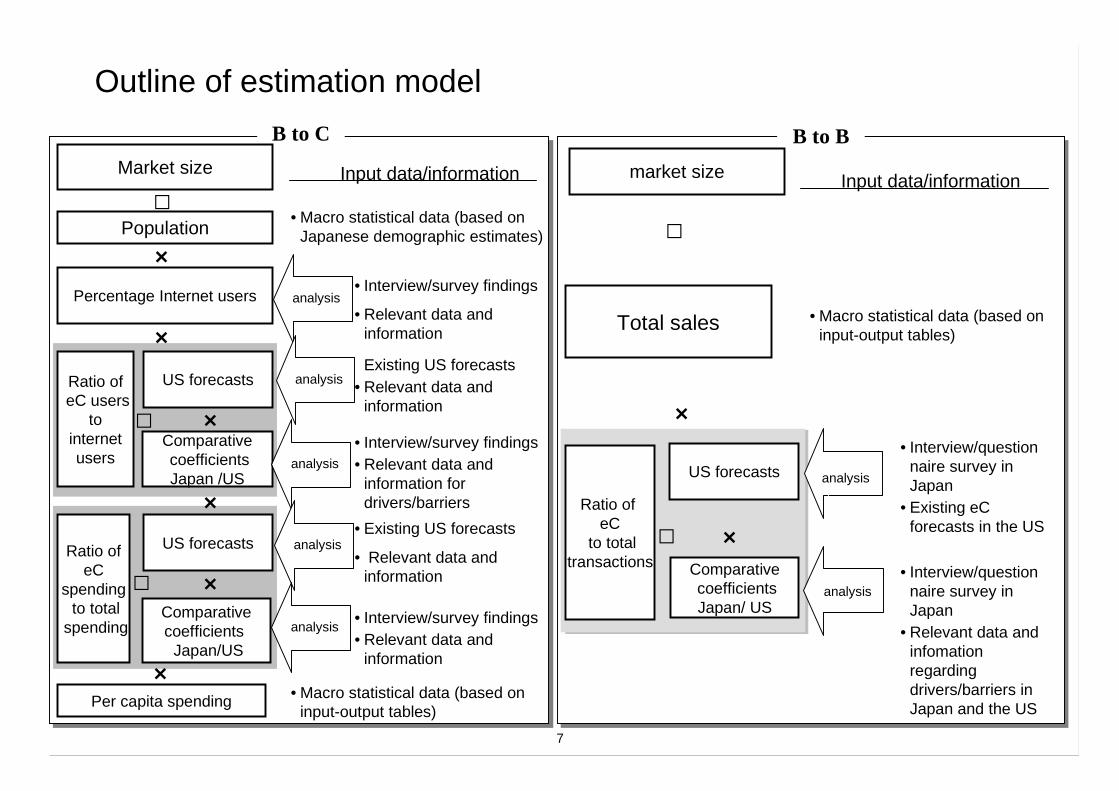
Outline of estimation model
B to C
Input data/information
Population
Percentage Internet users
Ratio of eC users
to internet
users
US forecasts
Comparative coefficientsJapan /US
Per capita spending
î
î
î�
Ratio of eC
spending to total
spending
US forecasts
Comparativecoefficients Japan/US
î�
î
î
• Macro statistical data (based onJapanese demographic estimates)
• Interview/survey findings
• Relevant data andinformation
Existing US forecasts• Relevant data and
information
• Interview/survey findings• Relevant data and
information fordrivers/barriers
• Existing US forecasts
• Relevant data andinformation
• Interview/survey findings• Relevant data and
information
• Macro statistical data (based oninput-output tables)
B to B
Ratio of eC
to totaltransactions
US forecasts
Comparative coefficientsJapan/ US
î�
î
• Macro statistical data (based oninput-output tables)
Total sales
Market size
�
analysis
analysis
analysis
Input data/informationmarket size
�
analysis
analysis
analysis
analysis
• Interview/questionnaire survey inJapan
• Existing eCforecasts in the US
• Interview/questionnaire survey inJapan
• Relevant data andinfomationregardingdrivers/barriers inJapan and the US

8
StatisticalData
qualitativeinformation
Evaluation by analyst
USSituation
Outline of estimation model (continued)US/JP
Gap indicatoron each drivers
through segment(0~1~)
Normalizedweighting
for each driversby segment
(0~1)
ComparativeCoefficientby segment
Gap indicatorcompensation
by segment(~0~)
Japanforecast
Drivers/Barriers
…
…
6
Japan
Situation
StatisticalData
Qualitativeinformation
Evaluation by analyst
…
+
×
+
×
+
×
+
×
+
×…
…
USforecast
×
Japan forecastby segment
Driver/barriers # 1
Calculated by segment
Driver/barriers # 2
Driver/barriers # 4
Driver/barriers # 3
Driver/barriers # x
…
9
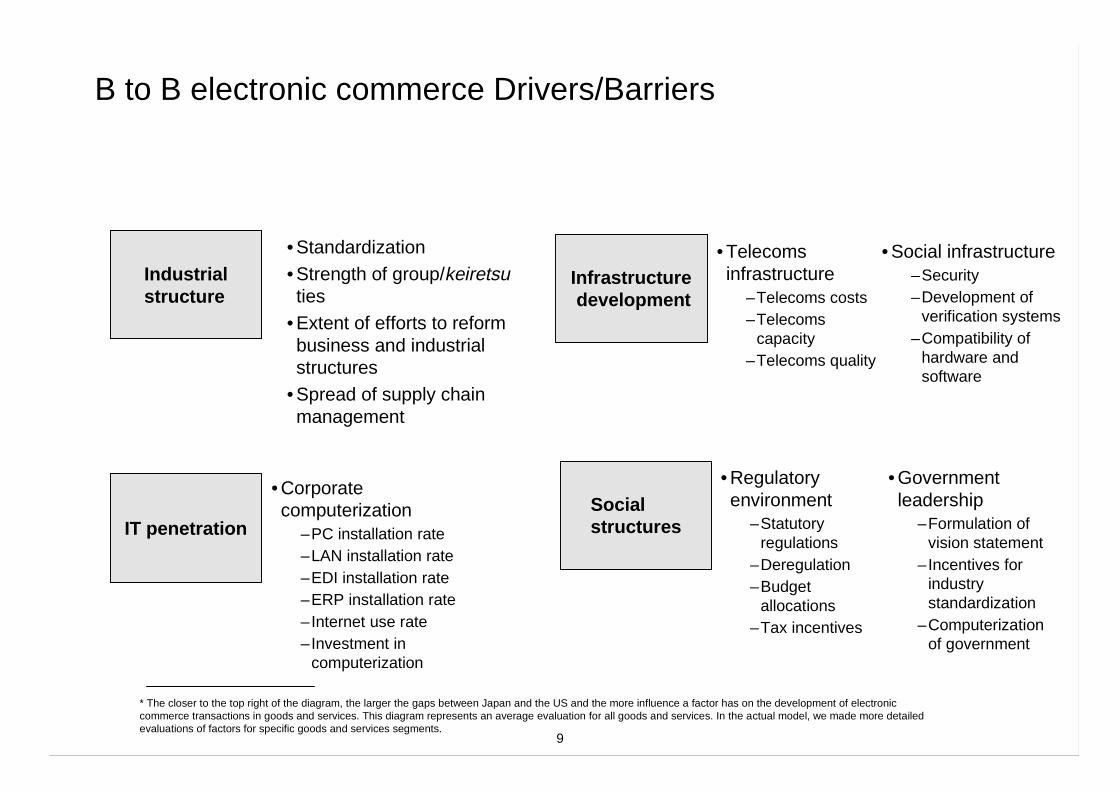
Socialstructures
Infrastructure development
IT penetration
Industrialstructure
• Standardization• Strength of group/keiretsuties
• Extent of efforts to reformbusiness and industrialstructures
• Spread of supply chainmanagement
• Corporatecomputerization
–PC installation rate–LAN installation rate–EDI installation rate–ERP installation rate–Internet use rate–Investment in
computerization
• Telecomsinfrastructure
–Telecoms costs–Telecoms
capacity–Telecoms quality
• Social infrastructure–Security–Development of
verification systems–Compatibility of
hardware andsoftware
• Regulatoryenvironment
–Statutoryregulations
–Deregulation–Budget
allocations–Tax incentives
• Governmentleadership
–Formulation ofvision statement
–Incentives forindustrystandardization
–Computerizationof government
* The closer to the top right of the diagram, the larger the gaps between Japan and the US and the more influence a factor has on the development of electroniccommerce transactions in goods and services. This diagram represents an average evaluation for all goods and services. In the actual model, we made more detailedevaluations of factors for specific goods and services segments.
B to B electronic commerce Drivers/Barriers

10
Gaps between Japan and the United States in 2003
Larg
e
Standardization
Strength ofgroup/keiretsuties Corporate computerization
Telecoms infrastructureSocial infrastructure
Regulatory environment
Government leadership
* The closer to the top right of the diagram, the larger the gaps between Japan and the US and the more influence a factor has on thedevelopment of electronic commerce transactions in goods and services. This diagram represents an average evaluation for all goodsand services. In the actual model, we made more detailed evaluations of factors by specific goods and services segments.
Extent of efforts toreform business andindustrial structures Spread supply chain
management
Drivers/Barriers : Gaps in Japan and the US and degrees ofinfluence
Nor
mal
ized
wei
ght
=D
egre
e of
influ
ence
on
elec
tron
ic c
omm
erce
pro
mot
ion
thro
ugh
segm
ents
Sm
all
Small Large
Most important factors will be: “extentof efforts to reform business andindustrial structures” and “spread ofsupply chain management.”

11
Summary of Forecasts of Electronic Commerce in Japan andUS
�-�
�-�
����
�65 billion ���.���
�
� 8,620 billion
��.���
����
� 3,160 billion
����
� 68,000 billion
���.���
�����
� 2,250 billion
��.���
�19,500 billion
��.���
����
� 21,300 billion
��.���
� 165,300 billion
���.���
� 1) US$1 = "120� Numbers in parentheses ( ) indicate percentage of commercial transactions conducted electronically.
Comparison of scale of electronic commerce in Japan and USA
Japan ��USA
12
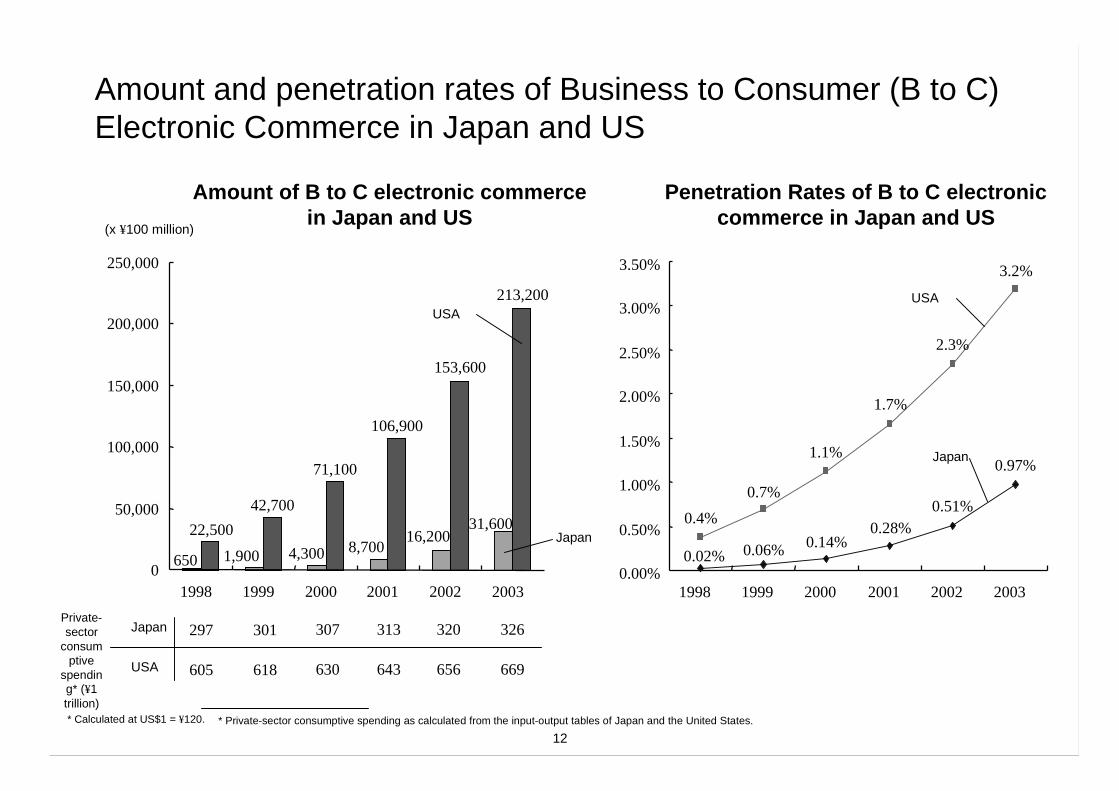
Amount and penetration rates of Business to Consumer (B to C)Electronic Commerce in Japan and US
0
50,000
100,000
150,000
200,000
250,000
1998 1999 2000 2001 2002 2003
Amount of B to C electronic commercein Japan and US
0.00%
0.50%
1.00%
1.50%
2.00%
2.50%
3.00%
3.50%
1998 1999 2000 2001 2002 2003
Penetration Rates of B to C electroniccommerce in Japan and US
650 1,900 4,300 8,70016,200
31,60022,500
42,700
71,100
106,900
153,600
213,200
0.02% 0.06% 0.14%0.28%
0.51%
0.97%
0.4%
0.7%
1.1%
1.7%
2.3%
3.2%
Japan
USA
Japan
USA
* Calculated at US$1 = ¥120.
Private-sector
consumptive
spending* (¥1trillion)
Japan
(x ¥100 million)
USA
297 301 307 313 320 326
605 618 630 643 656 669
* Private-sector consumptive spending as calculated from the input-output tables of Japan and the United States.
13
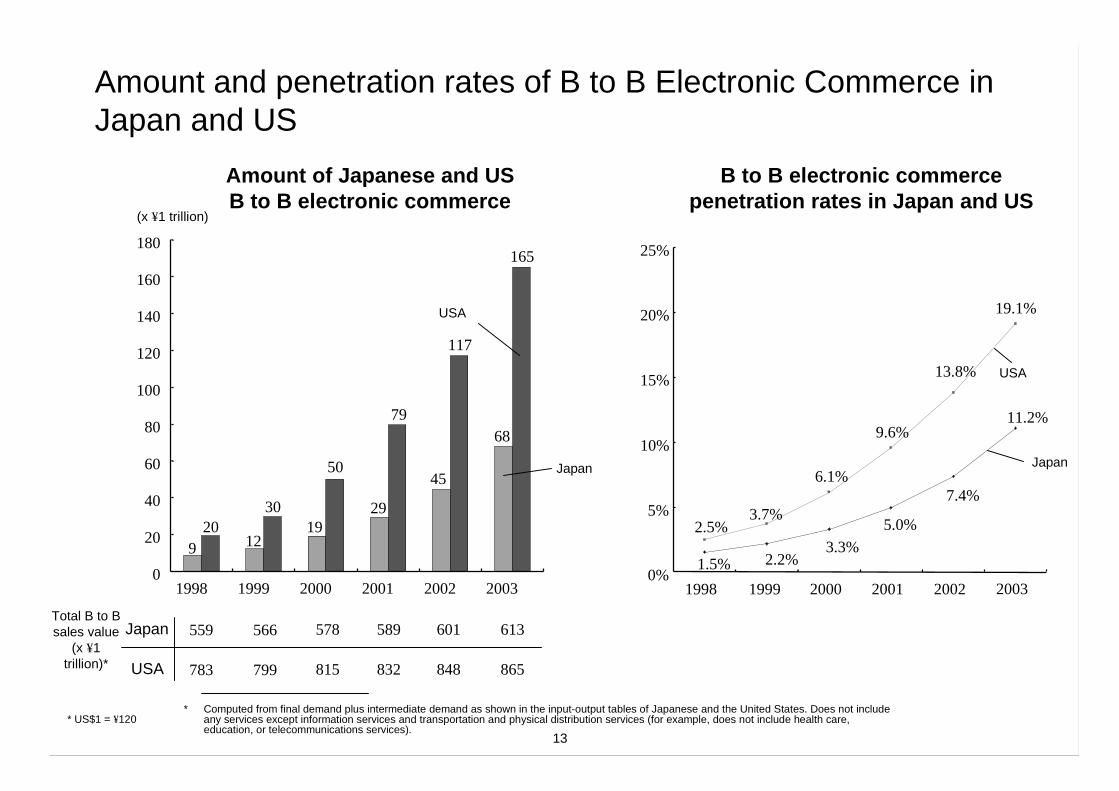
Amount and penetration rates of B to B Electronic Commerce inJapan and US
* US$1 = ¥120
Amount of Japanese and USB to B electronic commerce
B to B electronic commercepenetration rates in Japan and US
0%
5%
10%
15%
20%
25%
1998 1999 2000 2001 2002 2003
Japan
USA
1.5% 2.2%3.3%
5.0%
7.4%
11.2%
2.5%3.7%
6.1%
9.6%
13.8%
19.1%
0
20
40
60
80
100
120
140
160
180
1998 1999 2000 2001 2002 2003
Japan
USA
9 1219
29
45
68
2030
50
79
117
165
(x ¥1 trillion)
Total B to Bsales value
(x ¥1trillion)*
Japan
USA
559 566 578 589 601 613
783 799 815 832 848 865
* Computed from final demand plus intermediate demand as shown in the input-output tables of Japanese and the United States. Does not includeany services except information services and transportation and physical distribution services (for example, does not include health care,education, or telecommunications services).

14
Amount of Business to Business (B to B) Electronic Commerceby segment
0 1 2 3 4 5 6 7 8 9 10
Electronics and information products
Automobiles and autoparts
Chemical products
Utilities
Paper and office products
Transportation and physical distribution
Food
Textiles, consumer electronics, consumergoods
Construction
Industrial equipment
Steel, nonferrous metals, raw materials
Total
(x ¥1 trillion)
amount of electronic commerce by specific B to B product/service segments * 2
4.3
3.3
0.01
0
0.01
0.03
0.4
0.3
0.01
0.06
0.2
8.6
* 1 For this study, services in the B to B market include only information processing and allied services, and transportation and physical distribution services. Other services(health care, education, telecommunications etc.) are not included.
* 2 For the size of the B to B market, we count sales values of merchandise by an industry rather than procurement by an industry.
15
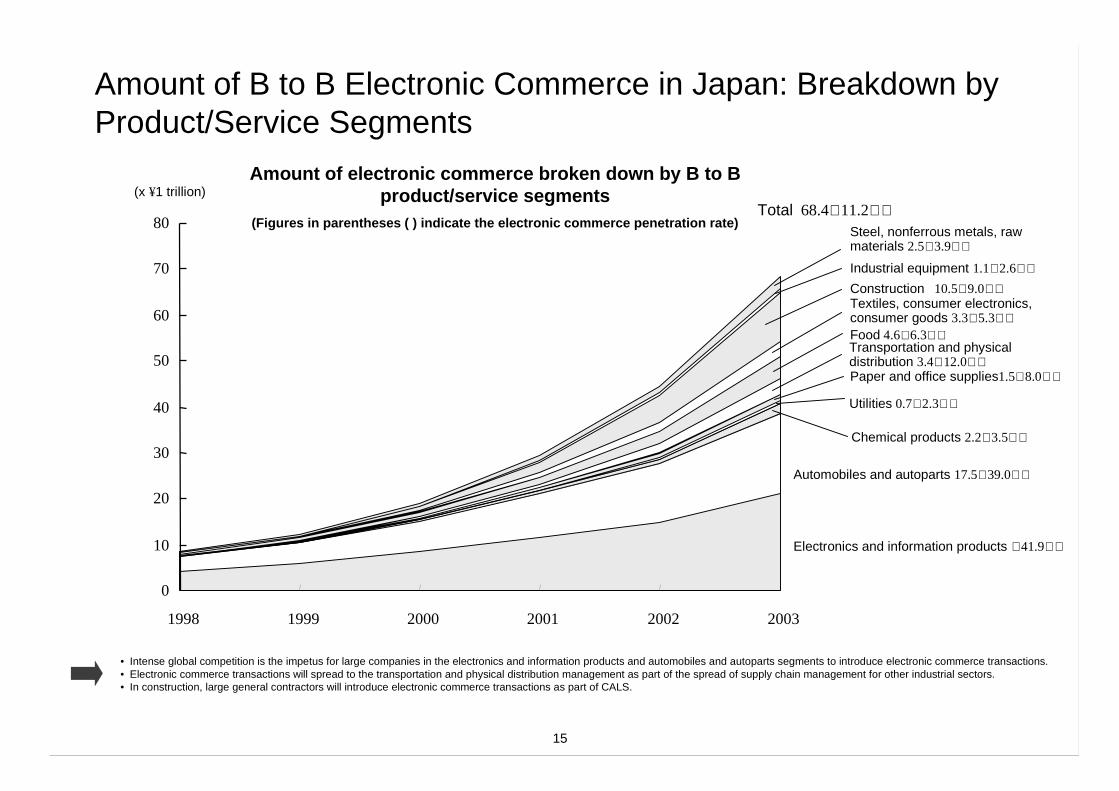
Amount of B to B Electronic Commerce in Japan: Breakdown byProduct/Service Segments
Electronics and information products �41.9��
Automobiles and autoparts 17.5�39.0��
Chemical products 2.2�3.5��
Utilities 0.7�2.3��
Paper and office supplies1.5�8.0��
Transportation and physicaldistribution 3.4�12.0��
Food 4.6�6.3��
Textiles, consumer electronics,consumer goods 3.3�5.3��
Construction 10.5�9.0��
Industrial equipment 1.1�2.6��
Total 68.4�11.2��
• Intense global competition is the impetus for large companies in the electronics and information products and automobiles and autoparts segments to introduce electronic commerce transactions.• Electronic commerce transactions will spread to the transportation and physical distribution management as part of the spread of supply chain management for other industrial sectors.• In construction, large general contractors will introduce electronic commerce transactions as part of CALS.
Steel, nonferrous metals, rawmaterials 2.5�3.9��
0
10
20
30
40
50
60
70
80
1998 1999 2000 2001 2002 2003
Amount of electronic commerce broken down by B to Bproduct/service segments
(Figures in parentheses ( ) indicate the electronic commerce penetration rate)
(x ¥1 trillion)

16
Penetration rates of B to B Electronic Commerce Market in Japan:by Product/Service Segments
Electronic commerce penetration rates for individual product/service segments
Steel, nonferrous metals,raw materials
9%
8%
��
��
0%
1%
1%
��
0%
0%
2%
42%
39%
4%
8%
12%
6%
5%
9%
3%
4%
11%
0% 20% 40% 60% 80% 100%
Electronics andinformation products
Automobiles and autoparts
Chemical products
Utilities
Paper and office supplies
Transportation andphysical distribution
FoodTextiles, consumer
electronics, consumer goods
Construction
Industrial equipment
Total
2003
1998
There is a high need for electronic commerce transactions in construction because of the large amount of drawings that need tobe exchanged and the large number of smaller-sized companies in the industry. For transportation and physical distribution,there will be an acceleration of distribution EDI standardization as manufacturers begin to introduce supply chain management.In both cases, government follow-up—for example, construction CALS and the Outline of General Distribution Policy—would beeffective.
2%��
17
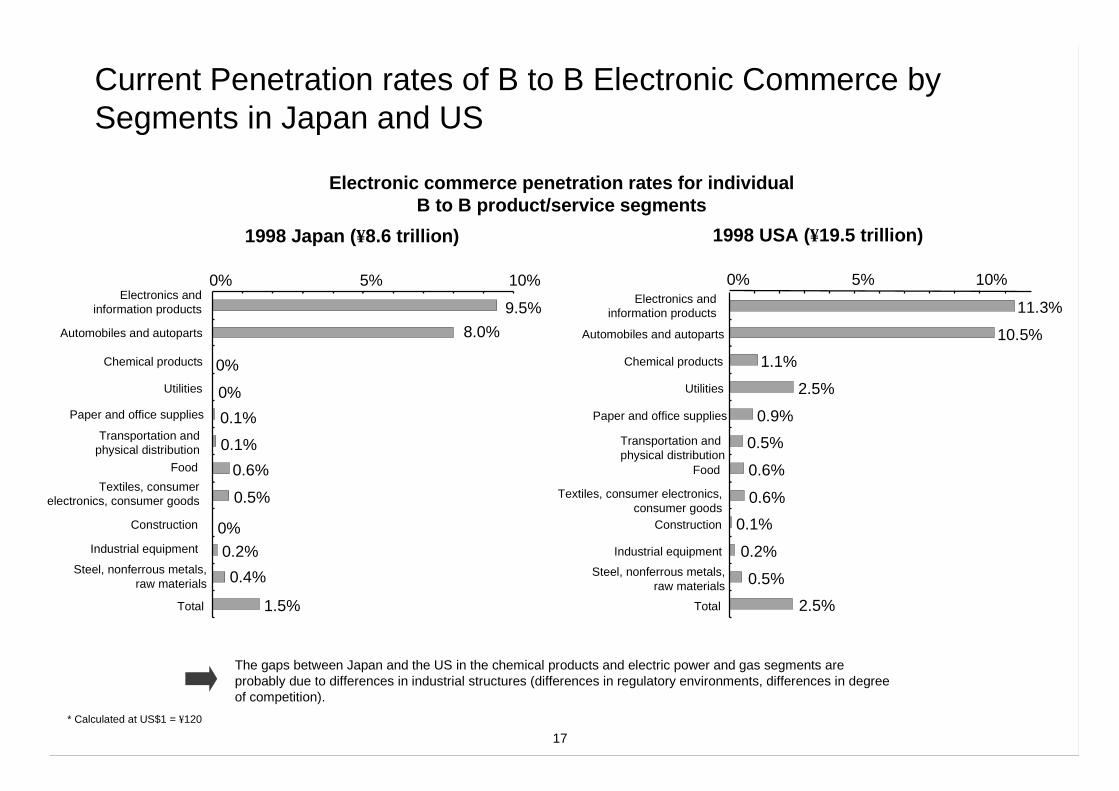
Current Penetration rates of B to B Electronic Commerce bySegments in Japan and US
9.5%
8.0%
0%
0%
0.1%
0.1%
0.6%
0.5%
0%
0.2%
0.4%
1.5%
0% 5% 10%Electronics and
information products
Automobiles and autoparts
Chemical products
Utilities
Paper and office supplies
Transportation andphysical distribution
Food
Textiles, consumerelectronics, consumer goods
Construction
Industrial equipment
Steel, nonferrous metals,raw materials
Total
The gaps between Japan and the US in the chemical products and electric power and gas segments areprobably due to differences in industrial structures (differences in regulatory environments, differences in degreeof competition).
11.3%
10.5%
1.1%
2.5%
0.9%
0.5%
0.6%
0.6%
0.1%
0.2%
0.5%
2.5%
0% 5% 10%
Electronic commerce penetration rates for individualB to B product/service segments
* Calculated at US$1 = ¥120
Electronics andinformation products
Automobiles and autoparts
Chemical products
Utilities
Paper and office supplies
Transportation andphysical distribution
Food
Textiles, consumer electronics,consumer goods
Construction
Industrial equipment
Steel, nonferrous metals,raw materials
Total
1998 Japan (¥8.6 trillion) 1998 USA (¥19.5 trillion)
18
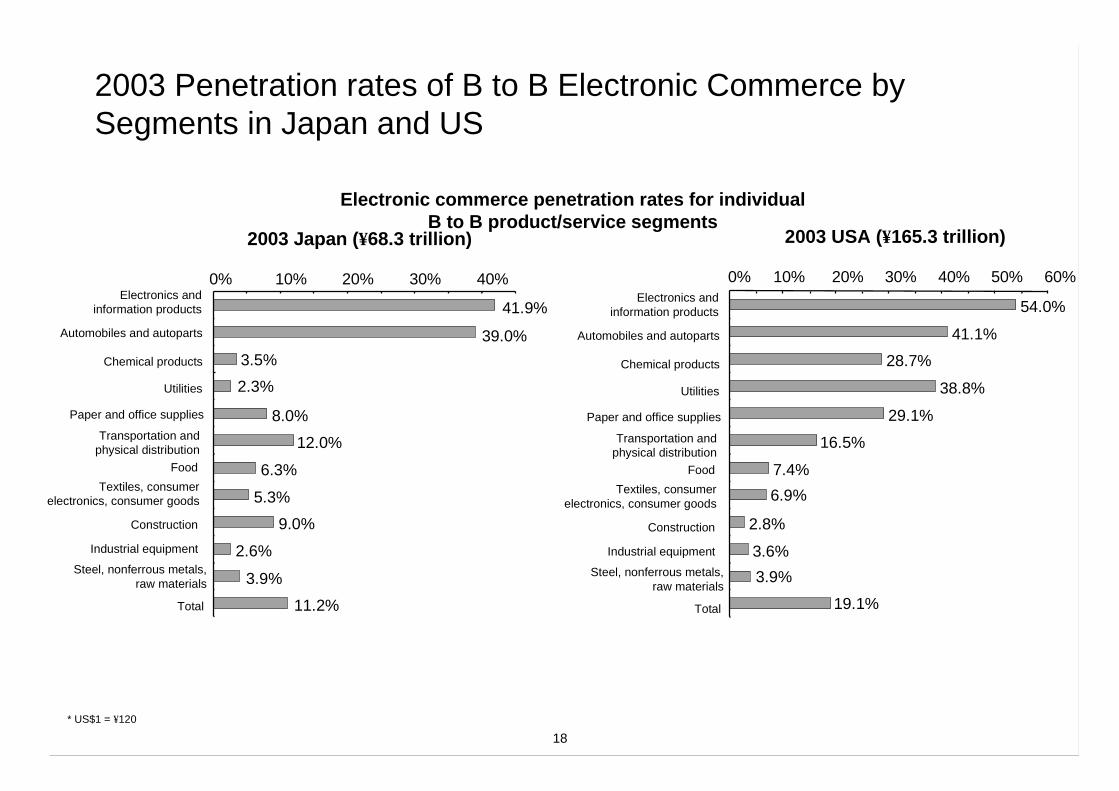
2003 Penetration rates of B to B Electronic Commerce bySegments in Japan and US
* US$1 = ¥120
54.0%
41.1%
28.7%
38.8%
29.1%
16.5%
7.4%
6.9%
2.8%
3.6%
3.9%
19.1%
0% 10% 20% 30% 40% 50% 60%
41.9%
39.0%
3.5%
2.3%
8.0%
12.0%
6.3%
5.3%
9.0%
2.6%
3.9%
11.2%
0% 10% 20% 30% 40%Electronics and
information products
Automobiles and autoparts
Chemical products
Utilities
Paper and office supplies
Transportation andphysical distribution
Food
Textiles, consumerelectronics, consumer goods
Construction
Industrial equipment
Steel, nonferrous metals,raw materials
Total
Electronics andinformation products
Automobiles and autoparts
Chemical products
Utilities
Paper and office supplies
Transportation andphysical distribution
Food
Textiles, consumerelectronics, consumer goods
Construction
Industrial equipment
Steel, nonferrous metals,raw materials
Total
Electronic commerce penetration rates for individualB to B product/service segments
2003 Japan (¥68.3 trillion) 2003 USA (¥165.3 trillion)

19
Grouping of B to B Electronic Commerce Segments
Note: The degree of standardization for goods and services is a conceptual degree based upon representative items in the category.
Category of goods and services
���Commodities Global assemblyproductsUtilities�Electronics and
information products�Steel, nonferrous
metals, rawmaterials �Automobiles and
autoparts����Chemical products
���Domesticmarket products
Paper and office suppliesTransportation and physicaldistributionTextiles, consumer electronics,consumer goods�FoodConstruction
����
���Custom-builtproducts
����Industrial equipment
���Services�
High
Low
Deg
ree
of s
tand
ardi
zatio
n of
goo
ds a
nd s
ervi
ces
Low HighLess than 5% 5�15� 15��
�
Forecast electronic commerce penetration rate in 2003

20
Conclusions
� The B to B electronic commerce market in Japan is currently worth about ¥8.6 trillion;electronic commerce has spread much farther in this market than in the B to C market.The gaps with the US are surprisingly small here: by value, it is about half the US’s size,and about 1 year behind.
� In 2003, the Japanese B to B electronic commerce market will expand about 8-fold toaround ¥68 trillion. The gaps with the US will be at about the same levels as currentlyseen.
� However, there will be differences in the product segments for which electroniccommerce spreads due to differences in the industrial structures of Japan and the US.
� In the future, Japan will need to be concerned with the quality of electronic commerceactivities rather than just the size of the transactions involved. Electronic commercetransactions should be used in a variety of settings—for example, expansion to smallercompanies and integration of transaction infrastructure—to provide impetus to efforts toreform business and industrial structures.