market strategies for offshore wind in europe a...
TRANSCRIPT

Delft University of Technology
Market strategies for offshore wind in Europe
A development and diffusion perspective
Gorenstein Dedecca, Joao; Hakvoort, Rudi; Ortt, Roland
DOI10.1016/j.rser.2016.08.007Publication date2016Document VersionPublisher's PDF, also known as Version of recordPublished inRenewable & Sustainable Energy Reviews
Citation (APA)Dedecca, J. G., Hakvoort, R. A., & Ortt, J. R. (2016). Market strategies for offshore wind in Europe: Adevelopment and diffusion perspective. Renewable & Sustainable Energy Reviews, 66, 286-296. DOI:10.1016/j.rser.2016.08.007
Important noteTo cite this publication, please use the final published version (if applicable).Please check the document version above.
CopyrightOther than for strictly personal use, it is not permitted to download, forward or distribute the text or part of it, without the consentof the author(s) and/or copyright holder(s), unless the work is under an open content license such as Creative Commons.
Takedown policyPlease contact us and provide details if you believe this document breaches copyrights.We will remove access to the work immediately and investigate your claim.
This work is downloaded from Delft University of Technology.For technical reasons the number of authors shown on this cover page is limited to a maximum of 10.

Market strategies for offshore wind in Europe: A development anddiffusion perspective
João Gorenstein Dedecca n, Rudi A. Hakvoort, J. Roland OrttFaculty of Technology, Policy and Management, Delft University of Technology, Jaffalaan 5, 2628BX Delft, The Netherlands
a r t i c l e i n f o
Article history:Received 23 March 2016Received in revised form20 July 2016Accepted 3 August 2016
Keywords:BarriersCooperationDevelopment and diffusionInnovationMarket strategiesOffshore wind
a b s t r a c t
Offshore wind will contribute to the decarbonization of European power systems, but is currently costlierthan many other generation technologies. We assess the adequacy of market strategies available toprivate actors developing offshore wind farms in Europe, by employing the development and diffusionpattern model. The model includes two earlier phases in addition to the large-scale deployment phase ofother diffusion models: the innovation and the market adaptation phases. During its development anddiffusion offshore wind moved from experimentation to a dominant design (monopile foundations and apermanent magnet generator). Simultaneously, wind farms shifted from an experimental to a com-mercial purpose and grew from 10 to 316 MW on average. The turbine and wind farm developmentmarkets kept a high concentration throughout all phases. Also, the wind farm life cycle and supply chainbecame more integrated and drew less from the onshore wind and oil & gas sectors.
This development and diffusion was shaped by the barriers of cost, project risk and complexity, ca-pital requirements, and multi-disciplinarity. Wind farms developers combined three niche strategies toaddress these barriers: the subsidized, the geographic, and the demo, experiment and develop. Thebarriers make these niche strategies more adequate than strategies of mass-market (dominating amarket) or wait-and-see (developing resources but waiting for uncertainty reduction before marketentrance). Nonetheless, the barriers and market strategies changed during the development and diffu-sion pattern. Thus, cost and risk reductions decreased the importance of the subsidized niche, while thegeographic niche becomes less important as offshore wind develops outside of Europe.
The study also identified an increase in cooperation for wind farm development, as developmentbecame more international and with more frequent alliances. Wind farm developers and developmentand diffusion models research must consider how contemporary forms of cooperation improve or hinderthe market strategies.& 2016 The Authors. Published by Elsevier Ltd. This is an open access article under the CC BY license
(http://creativecommons.org/licenses/by/4.0/).
Contents
1. Introduction . . . . . . . . . . . . . . . . . . . . . . . . . . . . . . . . . . . . . . . . . . . . . . . . . . . . . . . . . . . . . . . . . . . . . . . . . . . . . . . . . . . . . . . . . . . . . . . . . . . . . . . . 2871.1. Offshore wind technology and actors . . . . . . . . . . . . . . . . . . . . . . . . . . . . . . . . . . . . . . . . . . . . . . . . . . . . . . . . . . . . . . . . . . . . . . . . . . . . . . 2871.2. The cost of offshore wind power . . . . . . . . . . . . . . . . . . . . . . . . . . . . . . . . . . . . . . . . . . . . . . . . . . . . . . . . . . . . . . . . . . . . . . . . . . . . . . . . . 288
2. Theory and methodology . . . . . . . . . . . . . . . . . . . . . . . . . . . . . . . . . . . . . . . . . . . . . . . . . . . . . . . . . . . . . . . . . . . . . . . . . . . . . . . . . . . . . . . . . . . . . 2892.1. The development and diffusion pattern . . . . . . . . . . . . . . . . . . . . . . . . . . . . . . . . . . . . . . . . . . . . . . . . . . . . . . . . . . . . . . . . . . . . . . . . . . . . 289
2.1.1. The pattern for offshore wind . . . . . . . . . . . . . . . . . . . . . . . . . . . . . . . . . . . . . . . . . . . . . . . . . . . . . . . . . . . . . . . . . . . . . . . . . . . . . 2902.2. Methodology . . . . . . . . . . . . . . . . . . . . . . . . . . . . . . . . . . . . . . . . . . . . . . . . . . . . . . . . . . . . . . . . . . . . . . . . . . . . . . . . . . . . . . . . . . . . . . . . . 290
2.2.1. Market strategies . . . . . . . . . . . . . . . . . . . . . . . . . . . . . . . . . . . . . . . . . . . . . . . . . . . . . . . . . . . . . . . . . . . . . . . . . . . . . . . . . . . . . . . 2913. Results . . . . . . . . . . . . . . . . . . . . . . . . . . . . . . . . . . . . . . . . . . . . . . . . . . . . . . . . . . . . . . . . . . . . . . . . . . . . . . . . . . . . . . . . . . . . . . . . . . . . . . . . . . . . 291
3.1. Development and diffusion pattern and offshore wind barriers . . . . . . . . . . . . . . . . . . . . . . . . . . . . . . . . . . . . . . . . . . . . . . . . . . . . . . . . . 2913.1.1. Innovation phase . . . . . . . . . . . . . . . . . . . . . . . . . . . . . . . . . . . . . . . . . . . . . . . . . . . . . . . . . . . . . . . . . . . . . . . . . . . . . . . . . . . . . . . 292
Contents lists available at ScienceDirect
journal homepage: www.elsevier.com/locate/rser
Renewable and Sustainable Energy Reviews
http://dx.doi.org/10.1016/j.rser.2016.08.0071364-0321/& 2016 The Authors. Published by Elsevier Ltd. This is an open access article under the CC BY license (http://creativecommons.org/licenses/by/4.0/).
Abbreviations: CR2, concentration ratio for the two largest companies in the market; EPCI, Engineer-Procure-Construct-Install; LCoE, levelized cost of energy; MWh,megawatt-hour; O&G, oil & gas; O&M, operation and maintenance; PMG, permanent magnet generator
n Corresponding author.E-mail addresses: [email protected], [email protected] (J.G. Dedecca).
Renewable and Sustainable Energy Reviews 66 (2016) 286–296

3.1.2. Market adaptation phase. . . . . . . . . . . . . . . . . . . . . . . . . . . . . . . . . . . . . . . . . . . . . . . . . . . . . . . . . . . . . . . . . . . . . . . . . . . . . . . . . 2933.1.3. Market stabilization phase . . . . . . . . . . . . . . . . . . . . . . . . . . . . . . . . . . . . . . . . . . . . . . . . . . . . . . . . . . . . . . . . . . . . . . . . . . . . . . . 2933.1.4. Offshore wind barriers and the development and diffusion pattern. . . . . . . . . . . . . . . . . . . . . . . . . . . . . . . . . . . . . . . . . . . . . . . 294
3.2. Market strategies . . . . . . . . . . . . . . . . . . . . . . . . . . . . . . . . . . . . . . . . . . . . . . . . . . . . . . . . . . . . . . . . . . . . . . . . . . . . . . . . . . . . . . . . . . . . . . 2944. Conclusions . . . . . . . . . . . . . . . . . . . . . . . . . . . . . . . . . . . . . . . . . . . . . . . . . . . . . . . . . . . . . . . . . . . . . . . . . . . . . . . . . . . . . . . . . . . . . . . . . . . . . . . . 295Acknowledgments . . . . . . . . . . . . . . . . . . . . . . . . . . . . . . . . . . . . . . . . . . . . . . . . . . . . . . . . . . . . . . . . . . . . . . . . . . . . . . . . . . . . . . . . . . . . . . . . . . . . . . . 295References . . . . . . . . . . . . . . . . . . . . . . . . . . . . . . . . . . . . . . . . . . . . . . . . . . . . . . . . . . . . . . . . . . . . . . . . . . . . . . . . . . . . . . . . . . . . . . . . . . . . . . . . . . . . . 295
1. Introduction
Our paper aims to analyze different market strategies availableto private actors developing offshore wind farms in Europe. Thesemarket strategies are the decisions of when and how to participatein the offshore wind farms. To achieve this goal, we apply thedevelopment and diffusion pattern model to offshore wind for thefirst time. The model analyzes offshore wind considering an er-ratic, non-continuous historical development and diffusion of thetechnology, separated into three different phases [1]. The resultsallow us to define the barriers to offshore wind power technologythat affect the market strategies of private wind farm developers.
The European Union has set ambitious targets for the reductionof greenhouse gases emissions of the power sector: a 40% reduc-tion by 2030 (compared to 1990 levels) and a complete dec-arbonization of the sector by 2050 [2,3]. Offshore wind is a low-carbon technology, and studies consequently predict a significantdeployment which will contribute strongly to the European Un-ion's decarbonization goals [4,5]. However, offshore wind is youngwhen compared to onshore wind or conventional generationtechnologies, as it was only 25 years ago that the first offshorewind turbine in the world was installed in Sweden [6]. In 2015wind power represented 11,4% of the total European power con-sumption, however offshore wind accounted for only 1,5% of thistotal consumption while onshore wind responded for the re-maining 9,9% [7]. Nonetheless, estimates forecast that offshorewind may represent up to 15% of total power consumption by2050 [5]. At the end of 2015 the European cumulative offshorewind installed capacity was 11 GW, or 1% of the total European netgenerating capacity [8,9]. But yet again, offshore capacity mayrange from 42 to 122 GW by 2030 – up to ten times the currentfigure [10]. The current modesty of offshore wind is also reflectedin the annual installations: in 2015 3,4 GW of offshore wind wereinstalled worldwide, only 5,4% of the global (onshore and offshore)wind power installations [11].
Since offshore wind is poised for important future growth, anumber of recent studies target it. These use the viewpoints oftechnological innovation systems [12–14], technical and/or economicanalysis [15–19], market structure [20,21], actor analysis [22], lifecycle analysis [23], or a combination of the above, possibly also ad-dressing regulatory issues [24–27]. However, none of them appliedthe development and diffusion pattern in their analysis. Our meth-odology has three steps: application of the development and diffu-sion pattern, definition of the barriers to offshore wind, and analysisof their impact on the market strategies of project developers. As thefirst application of the development and diffusion pattern to offshorewind, our work complements the aforementioned studies and si-multaneously provides recommendations to project developers.Therefore, it is of interest to developers, companies innovating inoffshore wind, and to policymakers who intend to guide this in-novation. Also, we contribute to case study literature on the devel-opment and diffusion pattern.
This article is structured as follows. First, we conduct a reviewof offshore wind technology and of its cost. Next, the developmentand diffusion pattern is explained in Section 2, followed by the
methodology comprising the offshore wind barriers and marketstrategies. Section 3 presents the results of the offshore windpattern, barriers and market strategies. We then conclude onSection 4 on these three elements.
1.1. Offshore wind technology and actors
To understand the pattern of development and diffusion, wefirst briefly present the advantages and disadvantages of offshorewind, as well as the components, life cycle phases and actors of anoffshore wind farm. Both onshore and offshore wind power areintermittent, meaning they are variable (changing uncontrollablyin time) and uncertain (wind forecasts contain an error compo-nent). Offshore wind also competes with other economic activitiessuch as shipping and fishing, and costs increase with water depthsand distance from shore, as the near-shore potential is exploited[4]. Finally, offshore wind farms face harsher environmental con-ditions than onshore wind, and accessing the turbines for opera-tion & maintenance is also more difficult. On the other hand, theoffshore wind in Northern Europe has higher mean speeds and isless variable than the onshore wind, which results in higher fullload hours (i.e. the equivalent time the wind turbine is generatingat its full capacity) [28]. Also worth noting is that offshore windfarms currently face less socio-environmental barriers, which re-duces design constraints and facilitates their implementation.Moreover, many European offshore projects can be built close toconsumption centers [15,28].
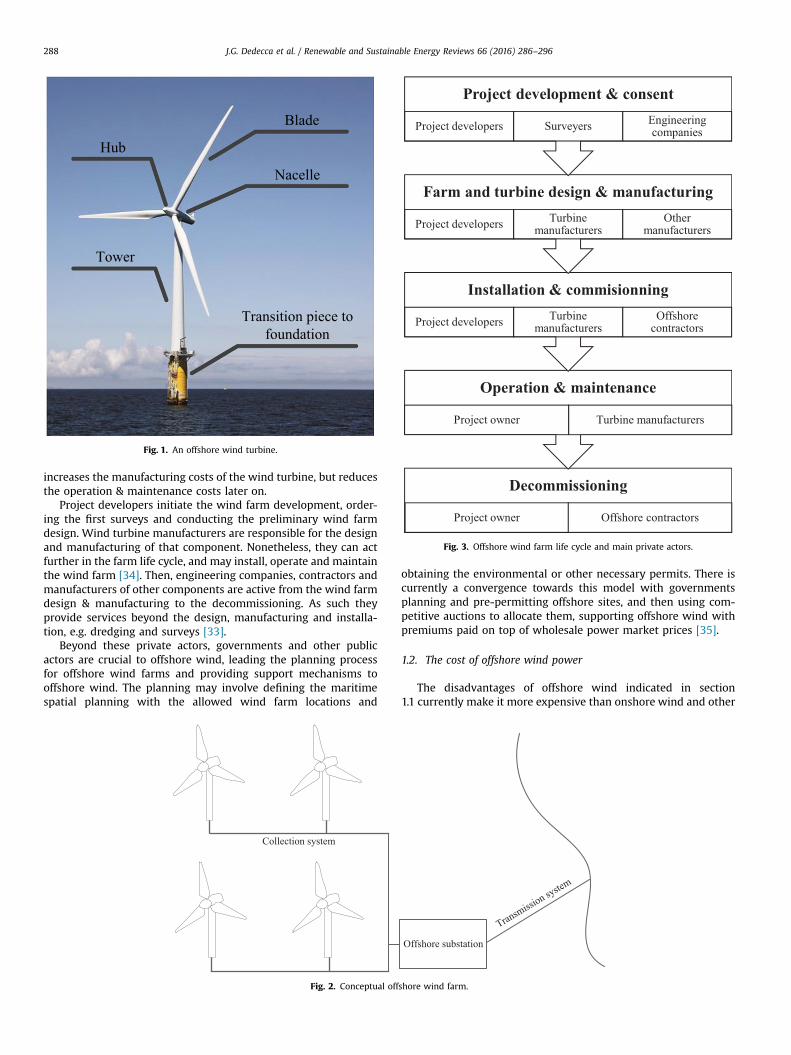
Fig. 1 presents the main components of a horizontal axis off-shore wind turbine. These are the rotor-nacelle assembly, thetower, the transition piece and the support structure. The rotorcomprises the blades, which capture the wind mechanical energy,and the hub, which transmits it to the drive train. The drive train,located in the nacelle, is composed of gearboxes, the generatorgroup, and the power converter, and transforms the mechanicalenergy to electrical energy. The gearbox and/or power converterare optional and depend on the drive train configuration. Thegenerated power is transmitted down the turbine tower. As thename indicates, the support structure fixates the turbine on theseabed through different foundation technologies, and is usuallyconnected to the tower by a transition piece. Other terminologiesthan the one used here can be found, such as in DNV [29].
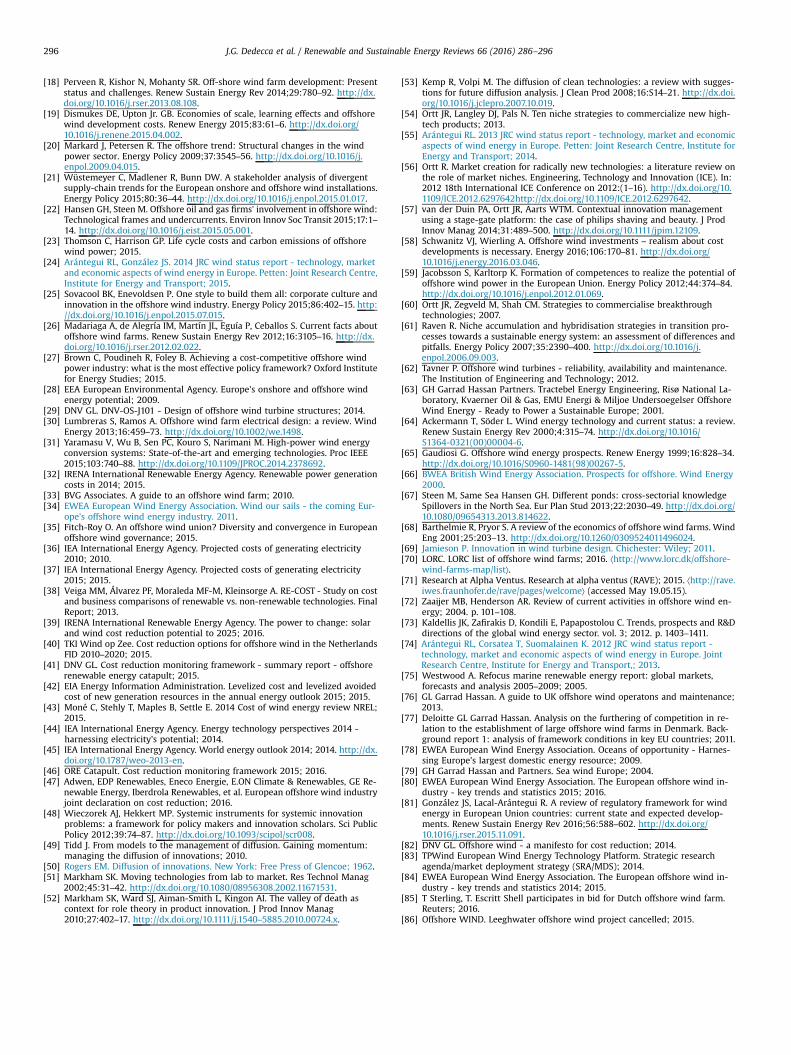
It is then necessary to transmit the power generated onshore. Forthis, the collection system connects all turbines of a wind farm to anoffshore substation. The wind turbines, the collection system and thesubstation constitute the offshore wind farm. The transmission sys-tem then links the offshore substation to the onshore power system(Fig. 2) [30,31]. In an offshore wind farm, items other than the tur-bines can account for 60% of total costs, against 30% for onshorefarms. This is because the foundations and the collection and trans-mission systems are more expensive and complex, as is the farminstallation, operation & maintenance and capital costs [21,32].
The life cycle of an offshore wind farm has several phases asshown in Fig. 3 with the main private actors involved in eachphase [23,33]. Despite the apparent linearity, the different phasesinfluence each other. For example, the use of gearless drive trains
J.G. Dedecca et al. / Renewable and Sustainable Energy Reviews 66 (2016) 286–296 287
increases the manufacturing costs of the wind turbine, but reducesthe operation & maintenance costs later on.
Project developers initiate the wind farm development, order-ing the first surveys and conducting the preliminary wind farmdesign. Wind turbine manufacturers are responsible for the designand manufacturing of that component. Nonetheless, they can actfurther in the farm life cycle, and may install, operate and maintainthe wind farm [34]. Then, engineering companies, contractors andmanufacturers of other components are active from the wind farmdesign & manufacturing to the decommissioning. As such theyprovide services beyond the design, manufacturing and installa-tion, e.g. dredging and surveys [33].
Beyond these private actors, governments and other publicactors are crucial to offshore wind, leading the planning processfor offshore wind farms and providing support mechanisms tooffshore wind. The planning may involve defining the maritimespatial planning with the allowed wind farm locations and
obtaining the environmental or other necessary permits. There iscurrently a convergence towards this model with governmentsplanning and pre-permitting offshore sites, and then using com-petitive auctions to allocate them, supporting offshore wind withpremiums paid on top of wholesale power market prices [35].
1.2. The cost of offshore wind power
The disadvantages of offshore wind indicated in section1.1 currently make it more expensive than onshore wind and other
Blade
Hub
Nacelle
Tower
Transition piece tofoundation
Fig. 1. An offshore wind turbine.
Collection system
Transmission system
Offshore substation
Fig. 2. Conceptual offshore wind farm.
Decommissioning
Project owner Offshore contractors
Operation & maintenance
Project owner Turbine manufacturers
Installation & commisionning
Project developers Turbine manufacturers
Offshore contractors
Farm and turbine design & manufacturing
Project developers Turbine manufacturers
Other manufacturers
Project development & consent
Project developers Surveyers Engineering companies
Fig. 3. Offshore wind farm life cycle and main private actors.
J.G. Dedecca et al. / Renewable and Sustainable Energy Reviews 66 (2016) 286–296288

conventional power generation technologies [20]. As seen, publicactors play a central role by planning, pre-permitting and sup-porting wind farms, thus providing long-term signals to privateactors. These private actors are on their turn the main parties re-sponsible for achieving cost reductions for offshore wind. There-fore, the current costs of offshore wind interact with the signalsprovided by the public actors and the cost-reduction actions un-dertaken by the private actors. As such, the cost of offshore windpower is pivotal for analyzing the technology development anddiffusion, and the implications for the market strategies.
The most widely used indicator to compare electricity costs isthe levelized cost of energy (LCoE), which gives the present aver-age unit cost of electricity for a certain generation technology.While it has disadvantages, such as input uncertainty and the in-consideration of system costs, the LCoE is still one of the mostadequate cost indicators for comparing different generation tech-nologies [36]. Studies analyzing the current and expected levelizedcosts of offshore wind include [23,24,32,37–43]. The current LCoEestimates for offshore wind fluctuates between 120 and 340 US$/MWh as Fig. 4 indicates (Table 1 presents the data). By com-parison, the current range for conventional fossil fuel technologiesof the LCoE studies is 38–140 US$/MWh [32,44]. For 2025 forecastspredict a cost reduction to the 90–203 US$/MWh range. The esti-mates illustrates how inputs and assumptions such as site locationor full load hours of different technologies can cause variations inthe LCoE, as reviewed by Thomson and Harrison [23].
The review of the LCoE forecasts indicates that offshore windwill remain costlier than conventional technologies up to 2030.However, the costs of offshore wind and conventional technolo-gies do overlap in part of the LCoE range. The competitiveness ofoffshore wind varies with local conditions and factors such ascarbon prices and the cost of capital, and hence while on averageoffshore wind will remain more expensive, specific projects maybe competitive with conventional technologies.
Recently a number of supply chain actors committed toachieving significant reductions to the cost of offshore wind. In theUK the offshore wind industry pledged to an LCoE of 156 US$/MWh for projects reaching a final investment decision in 2020[46]. In the Netherlands the commitment is for a 40% reduction inthe same year relative to 2010, which translates to a target of 133US$/MWh [40]. This caused leading private actors in offshore windto affirm that “offshore wind will be fully competitive with newconventional power generation” by 2025 [47]. In the UK the ac-tions with the greatest cost reduction potential are the upscalingof wind turbines rating, increasing competition within the in-dustry for turbine manufacturing, and reducing the cost of equity[41]. These three actions account for 30% of the cost reductionpotential. In the Netherlands the main cost reduction actions
largely agree with the British ones, with the addition of verticalcooperation across the supply chain and reducing the cost of debt,accounting in total for 27,8% of the cost reduction potential [40].Many other actions compose the remaining 70–72% of the iden-tified cost reduction opportunities.
2. Theory and methodology
Studies of offshore wind innovation use different viewpoint toanalyze the technology, as shown in section 1 [12–27]. For ex-ample Sovacool and Enevoldsen [25] present innovation chal-lenges to then analyze intrafirm innovation approaches. Wiec-zorek et al. [13] use the technology innovation systems to studythe offshore wind in four European countries. Also, in a previousarticle some of the authors propose to analyze innovation not onlyaccording to system functions, but also following structural di-mensions [48]. Finally, Jacobsson and Karltorp [12] separate thefunctions of technological innovation systems among strong andweak ones. Despite these various studies, to the best knowledge ofthe authors the development and diffusion pattern of Ortt andSchoormans [1] has not yet been applied to offshore wind. Wehence present the pattern and then the methodology to analyzeoffshore wind barriers and market strategies.
2.1. The development and diffusion pattern
As indicated by Tidd [49], the S-shaped diffusion curve estab-lished by the seminal work of Rogers [50] constitutes the mostfrequently used model for the diffusion of innovations. ThisS-curve indicates the total cumulative number of adopters of agiven innovation over time (Fig. 5).
Subsequently, research on innovation led to alternative in-novation and diffusion models and further development of theS-curve model itself. Ortt and Schoormans [1] present a model forunderstanding patterns of development and diffusion of break-through technologies in the communications sector. The authorsargue that while at first sight the classical S- curve fits the diffu-sion pattern, the innovation and diffusion process actually includesat least two earlier phases. These are referred to as the innovationand the market adaptation phases, which combine with the sub-sequent market stabilization phase (the S-curve). After analyzing50 cases of radically new high-tech products, the authors showthat a similar multi-phase pattern of development and diffusioncan be witnessed in several industries. The model claims that afterinvention it often takes several years before the crude and im-mature principle demonstrated at the time of invention can beintroduced as a product in the market. Furthermore, often after
Fig. 4. Offshore wind LCoE estimates.
J.G. Dedecca et al. / Renewable and Sustainable Energy Reviews 66 (2016) 286–296 289

the introduction of the first product an erratic diffusion patternrather than the smooth diffusion curve can be witnessed prior tothe start of large-scale diffusion. This extended model must beadapted for each case, as is done in the current study. For example,the phases may vary in length, or in some cases the developmentand diffusion of a specific technological system is aborted becauseanother much more promising technological system is developedthat outperforms the previous one.
Fig. 6 presents an overview of the three phases. Here, the in-novation phase “comprises the period from invention of a tech-nology up to the first market introduction of a product in-corporating the technology” [1]. This phase, which can last dec-ades, is characterized by the involvement of research organiza-tions and uncertainty on the product design, performance andmarkets. Although the technological principle is demonstrated inthe invention, the technology might be immature, making im-plementation difficult and leading to postponements of develop-ment projects [51,52]. The following phase, referred to as marketadaptation, starts with the market introduction of the first pro-ducts based on the invention. This phase lasts a decade on averagebetween early niche product introductions and later standard
products diffusing in a mass market. It is characterized by com-peting product designs in different market segments and is thus aperiod of experimentation. In this phase infrastructures are builtup, complementary products and services are created, institutionsare re-arranged, and attempts are made to scale up concepts andbenefit from economies of scale. To arrange this, networks of ac-tors align around alternative concepts and complex forms ofcompetition emerge. This leads to a non-linear development of thetechnology, with the appearance and disappearance of conceptsand actors, promising advances and disappointing setbacks. Fi-nally, market adaptation is followed by the market stabilization,where a dominant design emerges and a mainstream applicationis established. Ortt and Schoormans [1] explain that this dominantdesign still undergoes changes, as actors apply incremental mod-ifications both to the product and its intended markets.
2.1.1. The pattern for offshore windOffshore wind went through a similar development and diffu-
sion pattern, but with three differences. Namely, in the offshoreindustry support policies are necessary, the target market for off-shore wind is more defined, and there is a relatively high actorconcentration. First, S-curves and the pattern methodologiesconsider support policies as exogenous diffusion factors [53,54]. Byanalyzing the support of public actors to offshore wind inside thedevelopment and diffusion pattern we contribute to the need in-dicated by Kemp et al. [53] to consider policies in diffusion models.Second, concerning the target market and actor concentration, theinvestment size of offshore wind farms limits their application tolarge power systems, as opposed to isolated ones. Markard andPetersen [20] observe in the sector a concentration of large firms(confirmed in our study) due to increased risks and capital re-quirements. Thus, for offshore wind there is less uncertainty onapplicable markets than for other technologies studied with thedevelopment and diffusion pattern. This concentration couldcompromise the applicability of the pattern if wind power weredependent only on this handful of actors, but this is not the case.In addition to academia and public actors, many firms are active inall life cycle phases, of which Fig. 3 presents only the main ones[23,33].
2.2. Methodology
The focus of this study is the offshore wind farm with bottom-founded horizontal axis offshore wind turbines, the currentlydominant design for offshore wind [55]. In this way, our focus doesnot include the transmission system. Although relevant, trans-mission systems involve separate technologies with their ownpattern of development and diffusion. Moreover, although in-novation in offshore wind in other regions is discussed, this studyhas a European focus. Europe is expected to remain at the fore-front of offshore wind innovation and installation in the medium
Table 1LCoE studies for offshore wind.a
US$/MWh AránteguiandGonzález
Veigaet al.
Monéet al.
InternationalEnergy Agency(IEA)
TKIWindop Zee
ORECatapult
Energy InformationAdministration(EIA)
InternationalEnergy Agency(IEA)
International Renew-able Energy Agency(IRENA)
ThomsonandHarrison
Reference [24] [38] [43] [37] [40] [46] [42] [44] [32] [39] [23]Location Europe World US World NL UK US World World World UKCurrent Year 2014 2015 2013 2014 2015 2020
Cost 120–200 120–200
193 136�275 150–340 140–250 180 144�219
Future Year 2020 2025 2030Cost 133 156 197 90–180 100�190 120 153�203
a Exchange rates are those of the International Energy Agency (IEA) [45].
Ad o
ptio
nL
evel
TimeFig. 5. The S-curve model of innovation adoption.
Innovation
• Uncertain product design, performance and markets
• Experimentation
Market adaptation
• Market introduction• Competing product
designs• Multiple market
segments• Non-linear
development of technology and actors
Market stabilization
• Dominant design• Mainstream market
Fig. 6. Pattern of development and diffusion.
J.G. Dedecca et al. / Renewable and Sustainable Energy Reviews 66 (2016) 286–296290

term: Arántegui and González [24] forecast that until 2030 Europewill still be responsible for more than 50% of global installations.
Our methodology contains three steps: the application of thedevelopment and diffusion pattern, the identification of offshorewind barriers from this pattern, and the analysis of market stra-tegies for the development of offshore wind farms according toour findings. The methodology iterates between those steps, forthe pattern, the barriers and the market strategies are linked.
To define the development and diffusion pattern for offshorewind, we used a literature review with a semi-structured ap-proach, with search keywords applied to Scopus and Googlescholar. The search applied was (offshore wind) AND (develop-ment OR technology OR history OR technology review OR tech-nology roadmap OR innovation). The search results were com-plemented with the literature already known by the authors. Weanalyze the following aspects for each phase of the pattern: designconcept, wind farms size and purpose, life cycle and supply chain,private actors and support from public actors.
The barriers are characteristics of offshore wind that shape itspattern of development and diffusion. The literature on the pat-tern of development and diffusion does not apply the same char-acteristics for all technologies [54,56,57]. Thus, we derive specificbarriers to offshore wind by analyzing the pattern and the re-viewed literature, such as [25,58,59]. Finally, from the pattern andthe barriers we analyze the adequacy of three market strategies forthe development of offshore wind farms: mass-markets, wait-and-see and niches.
2.2.1. Market strategiesGiven a technology and barriers affecting its innovation, com-
panies may adopt a number of market strategies. Ortt et al. [60]present three main categories of such strategies during the de-velopments and diffusion of breakthrough technologies: mass-market, wait-and-see and niche strategies. Mass-market strategiesdevelop products for fast introduction into large markets (com-panies adopting mass-market strategies rely on network or scaleeffects to build up a large market share). Companies adoptingwait-and-see strategies do not immediately introduce products.They develop and maintain the resources to introduce them, butwait until the market conditions improve and introduction be-comes possible. This strategy reduces product and market un-certainties because it waits for new information and more favor-able conditions.
Finally, niche strategies develop specific product designs fordesignated small markets. Ortt et al. [54] indicate they can beadopted to circumvent or remove existing barriers to productdevelopment, manufacturing or large-scale diffusion. The authorsreview a number of factors that determine the market situation,thereby shaping the adequacy of the possible niche strategies ofTable 2. Moreover, niches can be accumulated in order to increasethe market and further circumvent existing barriers [61].
3. Results
3.1. Development and diffusion pattern and offshore wind barriers
Fig. 7 provides an overview of the development and diffusionpattern for offshore wind. Three characteristics mark the phases ofthe pattern of development and diffusion: the design concept, theproject size and the project purpose. In summary, the innovationphase comprises the first research on the adaptation of onshoreturbines to the offshore environment and the first turbine in-stallations in shallow water. The development of large offshorewind farms with a commercial purpose marks the beginning of themarket adaptation phase. Then, very large commercial wind farmsusing the dominant design of monopile foundations with perma-nent magnet generators (PMG) characterize the market stabiliza-tion phase.
Those are the defining characteristics of offshore wind ac-cording to the development and diffusion pattern model. Beyondthese characteristics, our analysis indicated that the farm life cycleand supply chain distanced itself from the onshore wind and oil &gas sectors which were pivotal in the early phases of the tech-nology, eventually developing dedicated resources such as man-ufacturing facilities and installation vessels. Nonetheless, there arestill important interactions with these sectors. Also, the turbineand farm development markets were concentrated throughout thepattern. Thus the turbine market had a CR2 concentration ratio (i.e.the total market shares of the 2 biggest companies) of 70–99%.Beyond being less concentrated (CR2 of 54–64%), farm develop-ment shifted in the pattern from separate national markets to aEuropean one, with increased cooperation. Finally, the support ofpublic actors remained throughout the period of analysis, but withan increasing exposure of wind farms to power markets and theuse of competitive mechanisms for site allocation.
In this section we present the development and diffusion pat-tern for offshore wind for each phase in detail, with a brief historyand the aspects indicated in Table 3. With the pattern we observethe barriers that shaped the offshore wind development and dif-fusion, namely:
� Comparative high cost: Offshore wind costs were higher thanonshore wind and conventional generation technologies, andinvestment costs have shown even an increase up to 2015[25,58].
� Capital requirements: Due to high costs and the size of windfarms, offshore wind requires high capital investments. In 2015ten wind farms reached final investment decision, with anaverage investment cost of US$ 1,48B (€ 1,33B) [7].
� Project risk: The development of an offshore wind farm involveshigher risks than onshore, due to factors such as uncertain soilconditions, harsh weather and site-specific turbine performance[25,58].
Table 2Niche strategies of Ortt et al. [54].
Niche Strategy Description
Dedicated system or stand-alone Isolated use of the product due to inexistent or insufficient environment (e.g. necessary infrastructure)Demo, experiment and develop Controlled product introduction to manage and improve limited performanceEducate Education of actors such as suppliers and customers to overcome actor barriersExplore multiple markets Product introduction in multiple simultaneous applicationsGeographic Product introduction where barriers are lower (e.g. more favorable regulation or supply chain characteristics)Hybridization or adaptor Combination with complementary products and services, possibly through development of an adaptorLead-user Product development for and in cooperation with early adoptersRedesign Design simplification to overcome performance, cost, supply chain or institutional barriersSubsidized Subsidization of market due to social or group-wide product benefitsTop niche Differentiated product dedicated to high-end market segment users
J.G. Dedecca et al. / Renewable and Sustainable Energy Reviews 66 (2016) 286–296 291

� Multi-disciplinarity: Throughout the life cycle of a wind farmmultiple knowledge fields are involved, such as mechanical,electrical, physics, software and civil engineering. These fieldsneed to be integrated together with additional competencessuch as project management, meteorology and health, en-vironment and safety [59].
� Project complexity: The supply chain, life cycle phases andcomponents of an offshore wind farm are more numerous andintegrated than onshore farms. This results in projects of highcomplexity that require not only the integration of multipleknowledge fields (i.e. the multi-disciplinarity barrier) but also ofthe supply chain and of life cycle phases [58,59].
3.1.1. Innovation phaseTavner [62] presents a brief history of onshore wind technology
since the late 19th century. After advances and setbacks, thesimple Danish turbine design concept became dominant in theeighties, when large onshore wind farms were developed in Ca-lifornia, then Europe, and afterwards in other regions. For offshorewind Sun et al. [16] describe the 1980s as a research stage, whichprovided the foundation for the subsequent development of off-shore wind. This characterizes the 1980s as the invention (pre-innovation) phase of the pattern of development and diffusion.
The first offshore wind turbine would be installed on No-gersund in Sweden in 1990, with a small rating of 200 kW [6].Then, the first offshore wind farm was installed in Vindeby(Denmark) in 1991, with 11 turbines totaling 4,95 MW in capacity[63]. Following this, all new offshore wind farms of the 1990s wereinstalled in Europe. The region had good offshore wind resources,shallow North Seas and climate and energy policies driving re-newable energy sources, while onshore wind faced spatial andnoise restrictions [6,64,65].
Concerning the design concept, in the innovation phase of thepattern (1990–2001) multiple foundation, support structure and
drive train design concepts were tried and abandoned. This trialand error with a lack of a dominant design concept is a centralcharacteristic of innovation phases in the pattern of developmentand diffusion. As to the wind farm purpose, Sun et al. [16] see the1990s as “an experimental testing stage”, and indeed farms built inthe innovation phase had a significant learning aspect. This isexemplified by environmental, social and technical studies at theNogersund turbine and the Vindeby and Lely wind farms [6,66].Hence, wind farms in the innovation phase had more of an ex-perimental purpose than a commercial one. Finally, farms com-missioned up to 2001 had on average only 10 turbines and aninstalled capacity of 10 MW, with the 20 turbines of the 40 MWMiddelgrunden (DK) farm making it by far the largest [63].
The first offshore farms were small, experimental and had nodominant design concept, which characterizes the innovationphase for offshore wind. In this phase we observe two morecharacteristics concerning the life cycle and supply chain aspect: astrong marinization of onshore turbines, and a significant con-tribution of the oil & gas sector [67]. First, all projects in the in-novation phase were implemented in shallow water, some evenbeing called semi-offshore [65,68]. These shallow-water turbineswere marinized versions of onshore designs, with adaptations forcorrosion protection, de-humidification and lifting capabilities[16,69]. The smaller challenges posed by the depth allowed the useof onshore designs, with the experimentation of support structureconcepts. Second, the expertise of the oil & gas sector contributedto designing and experimenting with these support structures,such as jackets and monopiles [63].
Next, we can analyze the private and public actors. The con-centration of turbine manufacturers was high, but the number ofprojects was low (only Vestas installed more than one wind farmin the period). If we discount the Middelgrund farm (which ac-counts for half of the capacity installed in the phase and marks thetransition to the market adaptation), Nordtank led the market
Design experimentationCommercial purposeStart of dedicated supply chain
Innovation Market Adaptation Market Stabilization
Large commercial farms
Trial a
nd error
Dominant design
First offshore turbine
1990 2001 2008
Design experimentationExperimental purposeMarinizationOil & gas participationPolicy experimentation
Dominant designCommercial purposeDedicated 1st tier supply
chain
Very large commercial farms
Inve
ntio
n
Fig. 7. Development and diffusion pattern for offshore wind.
Table 3Development and diffusion pattern aspects.
Innovation Market Adaptation Market Stabilization
Period 1990–2001 2002–2008 2009-presentDesign concepts Experimentation Experimentation Dominant (monopile foundation with PMG)
and incremental innovationWind farm size (average) Small (10 MW) Large (68 MW) Very large (316 MW)Wind farm purpose Experimental Commercial CommercialLife cycle and supply chain Marinization Strong oil & gas
participationReduced marinization Start of dedicatedsupply chain
Integrated design Dedicated 1st tier supplychain
Private actors: Turbine manu-facturers (CR2)
Highly concentrated (70%) but marketstill in formation
Highly concentrated (99%) Highly concentrated (75%)
Private actors: Developers (CR2) Concentrated (64%) but market still information
Concentrated (54%) with inter-nationalization to UK
Concentrated (58%) with alliances
Public actors support Experimentation Experimentation with shift to commercialpurposes
Bottom-up convergence to fosteringcompetition
J.G. Dedecca et al. / Renewable and Sustainable Energy Reviews 66 (2016) 286–296292

with a 28% share, stemming from a single project. This was not yeta fully formed market with established project developers, al-though in the second half of the innovation phase Nuon in theNetherlands and DONG in Denmark would take a more prominentrole, indicating the transition to the market adaptation [63,70].
As for public actors, there was a lack of knowledge about howto effectively support offshore wind during the first phase of thepattern. Indeed, policies for offshore wind and renewable energysources in the 1990s were novel, diverse and could at times becounterproductive [63,65]. As an example, Gaudiosi [65] indicatesthat “up to now applications have been considered not economicby government decision makers even due to limitations in-troduced by the “Electricity Feed Law” affecting particularly theoffshore sector”. And indeed the first German offshore wind farm(Alpha Ventus) would be installed only ten years later [71]. Also,noteworthy is that leading countries or actors in offshore windcould change throughout the phases, as is observed in develop-ment and diffusion pattern studies. For example, although Swedenestablished the world's first wind turbine and one of its first windfarms, offshore wind would not be important locally, despite therole of Swedish private actors in other countries [70].
3.1.2. Market adaptation phaseA major watershed in offshore wind power was the commis-
sioning of the Horns Rev I wind farm in 2002. With its 160 MW oftotal capacity and 80 wind turbines, it was the first farm with acapacity higher than 100 MW [62]. It is described by Zaaijer andHenderson [72] as “a representation of the new era”, and wasfollowed in 2003 by the Rødsand farm with 73 turbines. Tavner[62] and Madariaga [26] present lists of the European offshorewind farms installed or under construction at that time.
The milestone of the market adaptation phase (2002–2008)was the implementation of large wind farms with a commercialpurpose, although a dominant design concept yet had yet toemerge. Hence as in the innovation phase, actors experimentedwith a number of drive train and foundation concepts [73,74]. Anexample is the single suction-bucket foundation at the Frederik-shavn wind farm in Denmark. After presenting a dislocation dur-ing a breaking test, it would take over a decade before the conceptregained the attention of researchers, despite its advantages[55,75]. The adaptation phase was also marked by setbacks andabandonment (permanent or temporary) of supply chain and de-sign concepts. Hence, the EuropeanWind Energy Association (nowWindEurope) [34] observes the use of “a single major constructioncontract under an EPCI (Engineer-Procure-Construct-Install) ar-rangement”, with high competition between contractors. However,due to subsequent losses on these arrangements the industryceased with the EPCI practice, returning to them only in the mid-2010s [34].
The market adaptation phase saw a growth in the number andsize of projects. In the market adaptation phase 19 wind farmswith an average size of 68 MW were commissioned, against eightwind farms averaging 10 MW in the previous phase. Concerningthe project purpose, it shifted from experimental to commercial.Hence, while the 2001 round 1 tender in the UK aimed for “de-monstration scale” projects, round 2 already aimed at commercialprojects [76]. Similarly, Denmark would foster competitive pro-cesses to develop offshore wind in the market adaptation phase[77].
The contributions of onshore wind and the oil & gas sectors tooffshore wind decreased during the market adaptation. There isthus technological development dedicated to the offshore market,with lower marinization. In this way, the European Wind EnergyAssociation [78] indicates a shift to “developing dedicated offshoreturbines from a dedicated supply chain”. Also, turbine installationvessels in the previous innovation phase came from the oil & gas
sector. However, starting in 2002 companies such as Mammoetvan Oord and Mayflower Energy commissioned the first vesselsbuilt for offshore wind specifically [79].
The analysis of the private actors of the adaptation phase in-dicates a concentration, as Tavner [62] shows. Indeed, althoughZaaijer and Henderson [72] list as much as eight offshore turbinemanufacturers, Vestas and Siemens had virtually the whole mar-ket in the adaptation phase [62]. The developer landscape wasmore varied than for turbine manufacturers, but still concentrated– the Danish developers DONG and Elsam accounted for 54% of theoffshore wind installations in the market adaptation [70]. An im-portant trait is the internationalization of the developers, mainlyto the United Kingdom. DONG, Elsam and E.ON were all active inthe UK. As a contrast, only the 4 MW Blyth farm had internationallead developers in the innovation phase [70].
Public actors kept supporting offshore wind in the marketadaptation phase, and policies remained diverse and concentratedat a national level, as the main cases of the UK and Denmark show.Wind farms in the UK where developed through competitivetenders, starting with the 2001 Round 1 [77]. Denmark on its turnstarted with state-owned companies developing offshore windfarms on the government's initiative, switching to parallel com-petitive tenders and an “open-door” system which depended onthe initiative of developers [77].
3.1.3. Market stabilization phaseThe market stabilization phase began in 2009 with an increase
in the total offshore wind capacity installations – in 2009576,9 MW would be installed (53% more than in the previousyear), followed by 882,7 MW in 2010 [80]. The appearance of verylarge commercial wind farms with several hundred megawattsand a dominant design marks the passage from the adaptation tothe stabilization phase. The average annual capacity installed in2009–2015 is 1362 MW/year, against 201 MW/year for the adap-tation phase. Similarly, the average wind farm would have316 MW, against 68 MW previously [80]. As in the adaptationphase, these large scale projects had a commercial purpose, withindividual farms above 100 MW appearing in the UK, Germany,Denmark, Belgium and the Netherlands [81].
Also differently from previous phases, a turbine design conceptbecame dominant in the stabilization phase. Arántegui [55] in-dicates turbines with monopile foundations and permanentmagnet generators became the norm. Monopile foundations arecheaper than the main alternative (jacket foundations), whilePMGs have “increased reliability, higher partial-load efficiency, andmore flexibility of integration with compact gearboxes or powerelectronics” [74].
The development & design of turbines and wind farms pro-gressively considered all life cycle phases and the supply chain.Thus, current guidance for research calls not only for a joint con-sideration of the rotor-nacelle, tower, support structures andfoundation components, but also of the manufacturing, installa-tion, O&M and decommissioning of the wind farms [82,83]. Thesupply chain continued to distinguish itself from the oil & gassector, with integrated solutions, and dedicated resources such asmanufacturing facilities and installation vessels. Thus, the gradualreturn of EPCI contract offerings indicated by the European WindEnergy Association [34] points to a holistic approach in search offurther cost reductions in the stabilization phase. Also, 1st tiersuppliers (i.e. providing the main direct components of a windfarm) developed dedicated manufacturing facilities for offshorewind [34]. E.g., turbine manufacturers invested in manufacturingplants producing exclusively offshore wind turbines, while pre-viously plants produced both onshore and offshore turbines.However, the 2nd and 3rd tier suppliers (i.e. tending the 1st tiersuppliers) remained dedicated to the wind industry (supplying
J.G. Dedecca et al. / Renewable and Sustainable Energy Reviews 66 (2016) 286–296 293

both the onshore and offshore sectors). Finally, bigger purpose-built vessels are and will be more common in offshore wind toinstall future turbines and extra-large monopole foundations[24,83].
Private actors in the stabilization phase remained concentrated.Between 2009 and 2015 S and Senvion (Repower) had 75% of theturbine market, a high concentration ratio but still lower than inthe market adaptation phase. The developer concentration slightlyincreased, to a 58% market share in 2009–2015 for the two maindevelopers, DONG and RWE. A further important trend in thestabilization phase is the greater complexity in project coopera-tion. Indeed, from 2009 on, projects are usually alliances betweentwo and increasingly even more developers [70,80,84].
In the market stabilization phase public actors still developoffshore wind at the national level, although there is a bottom-upconvergence towards more exposure of offshore wind farms topower markets and more competition in the assignment of sites[35]. As indicated, in the stabilization phase the UK, Germany,Belgium, Denmark, and the Netherlands all established very largeoffshore wind farms with capacities above 100 MW [81].
3.1.4. Offshore wind barriers and the development and diffusionpattern
Section 3.1 indicates that the barriers which shaped the de-velopment and diffusion pattern of offshore wind were the com-parative high cost, capital requirements, project risk, multi-dis-ciplinarity and project complexity. Here we analyze how thesebarriers affected the aspects of Table 2: the design concepts, thewind farm size and purpose, the life cycle and supply chain, theprivate actors, and the support from public actors.
Various design concepts were tried in the innovation and mar-ket adaptation phases to address the cost barrier. However, therisk and complexity of offshore wind projects led to difficultiesand to the abandonment of concepts such as the suction-bucket[75]. Slowly the sector moved to a proven concept - the monopile-founded turbine with PMG - to address the cost and risk barriers.However, as a design becomes dominant in the stabilization phase,a product still undergoes changes according to the developmentand diffusion pattern model [1]. The risk and multi-disciplinaritybarriers indicate that the technology will evolve incrementally inthe future. Hence alternative foundation concepts (and evenfloating foundations) may slowly increase their participation inoffshore wind in the future. Efforts are also geared to drive-trainimprovements such as in AC/DC converters and superconductivity,reducing the installation & commissioning costs, and scaling upwind turbines [17,24,40,46,55].
Wind farms continuously increased in size during the devel-opment and diffusion pattern and shifted from an experimenta-tion to a commercial purpose. Nonetheless, the cost and risk bar-riers made the technology dependent on governmental supportthroughout the phases. Moreover, the scaling of wind farms toattain economies of scale intends to address the cost barrier, butincreases the capital requirements and the project complexity, andthus also increases the entry barriers.
As the pattern progressed the offshorewind life cycle and supplychain became more integrated but also more self-contained,drawing less resources and knowledge from the onshore wind andoil & gas sectors. 1st tier suppliers developed dedicated resourcesto offshore wind as risks decreased and the market grew.
The barriers strongly shaped the private actors and their co-operation. Even though the observed private actors’ concentrationdecreased somewhat in the market stabilization phase, the capitalrequirements, multi-disciplinarity and complexity of offshorewind were and remain significant entry barriers to new actors. Wehave demonstrated that the development and diffusion patternwas also marked by a move of project developers to other
European countries, for the entry barriers provide opportunitiesfor incumbent private actors to internationalize. Furthermore, anincreased cooperation in project development was observed in thestabilization phase. This allows to allocate risks in the project andto combine different resources from cooperating actors to addressthe capital requirements, multi-disciplinarity and complexitybarriers.
In the development and diffusion pattern of offshore wind thehigh cost and project risk meant that both experimental andcommercial wind farms were dependent on governmental support.This support remains a constant of the offshore wind sector, andthe pattern was marked by experimentation and a bottom-upconvergence of the support towards more competitive, commer-cially-oriented mechanisms.
3.2. Market strategies
Section 3.1.4 analyzed the effect of the offshore wind barrierson the pattern of development and diffusion. We now analyze howthe same barriers affect the current and future adequacy of themass-market, wait-and-see and niche strategies for the develop-ment of offshore wind farms.
Starting with the mass-market, the barriers of project com-plexity, capital requirements and multi-disciplinarity led to amarket concentration, as demonstrated. Despite causing con-centration, these barriers also impede a mass-market strategywhere a single developer dominates the market. This wouldoverexpose the developer to governmental support and projectrisks (such as schedule overruns), and require capital beyond itscapabilities. Actors cooperating in project development are able toallocate these risks and combine different capabilities and re-sources. So the barriers limit the number of project developers, butalso impedes the dominance of a single one. Hence, actors in theonshore wind and oil & gas sectors will still participate in offshorewind development, as in the cooperation of Shell, the offshorecontractor Van Oord and the energy company Eneco in the first2016 Dutch tender [85].
The wait-and-see strategy is also inadequate, unless the lateentrant can cooperate in a project, bringing its own capabilitiesand resources but also utilizing those of incumbents. This is be-cause the project complexity and multi-disciplinarity are entrybarriers for late entrants in offshore wind, a fact reinforced bySteen and Hansen [67], to whom much of the offshore windknowledge cannot be codified. Thus, a late entrance in the marketwithout cooperating with incumbent companies is infeasible.
Given the inadequacy of the mass-market and wait-and-seestrategies, it is not surprising that project developers followedniche strategies. Namely, they used the subsidized, the geographicand to a lesser extent the demo, experiment and develop niches. Inthe subsidized niche they depended on different support me-chanisms during the innovation and adaptation phases, whichcontinued in the stabilization phase to create very large windfarms. The exclusivity to Northern Europe characterizes the geo-graphic niche, where water depths are lower, synergies exist withthe North Sea oil & gas sector and onshore wind faces public op-position. The demo, experiment and develop niche was used in theexperimental farms of the innovation phase and some few projectslater on, such as Alpha Ventus and Frederikshavn [71]. However,the reduced number of experimental projects in later phases andthe recently modified Leeghwater project in the Netherlands [86]exemplify the difficulties and narrower application of the demo,demonstrate and develop niche. Thus, to face the offshore windbarriers project developers not only used niche strategies, butactually accumulated them. They simultaneously leveraged gov-ernmental support, did so in a specific region (Northern Europe),and experimented in order to address the barriers.
J.G. Dedecca et al. / Renewable and Sustainable Energy Reviews 66 (2016) 286–296294

With the development and diffusion of offshore wind the im-portance of these accumulated niches changes. First, the geo-graphic niche may lose importance as offshore wind finally startsdeveloping and diffusing in Asia and America. By the end of 2016the installed capacity outside of Europe was 1073 MW, the ma-jority located in China [8]. Rodrigues et al. [4] presents the offshorepotential, projects in development and targets of China, Japan andthe United States. Second, the analysis also showed a reduction ofthe subsidized niche importance, as public actors moved to anincreased exposure of wind farms to power markets and compe-titive mechanisms for project allocation, although support is stillrequired. The demo, experiment and develop niche will continueto be relevant so that industry can achieve its cost reductioncommitments, but as seen it is the one niche strategy which hasfaced most difficulties.
In addition to niches, barriers also changed throughout thedevelopment and diffusion pattern. Actors were able to reduce thecost and risk barriers of offshore wind by employing a dominantdesign and scaling up commercial wind farms, and are now im-plementing further incremental innovations to further address theoffshore wind barriers. However, while cost and risk decreased,the size increases that accompanied the market adaptation andstabilization phases increased capital requirements and the projectcomplexity. Therefore, as for niches, the development and diffu-sion of offshore wind affected the barriers unequally.
4. Conclusions
The development and diffusion pattern was applied to offshorewind for the first time, characterizing the innovation, marketadaptation and market stabilization phases. Wind farms grewfrom an average size of 10 MW to 368 MW, and shifted from anexperimental to a commercial purpose through the pattern, whilesimultaneously a dominant design concept for wind turbinesemerged. The innovation phase lasted around 11 years and themarket adaptation phase 8 years, while the market stabilization isstill ongoing. This timeline agrees with other applications of thedevelopment and diffusion pattern, but offshore wind remains aunique case for three reasons. First, although the barriers of costand project risk decreased by the stabilization phase, governmentsupport still remains relevant (and so the subsidized niche strat-egy is still employed). Second, although offshore wind is startingto develop and diffuse in other regions, northern Europe is still asignificant geographic niche. Third, the market for offshore windwas always well-defined, contrary to the standard developmentand diffusion pattern model.
The persistence and even increase of some offshore wind bar-riers has resulted in the inadequacy of the market strategies ofmass-markets and wait-and-see. Throughout the application ofthe development and diffusion pattern one issue stands out: thecooperation of different actors in the offshore wind supply chain.As seen, this supply chain became more self-contained and theprivate actor concentration remained high throughout the period(CR2 concentration ratios of 54–64% for farm developers and 70–99% for turbine manufacturers). Despite this self-containment andconcentration, an increase in integrated cooperation structures canbe observed from the innovation to the market stabilization pha-ses. First, wind farm development became more international andalliances more common. Second, current innovation studies callfor the integrated design of wind turbines, wind farms and thesupply chain. Nonetheless, onshore wind and oil & gas companiesremain active in offshore wind. Wind farm developers must con-sider how contemporary forms of cooperation improve or hindertheir market strategies.
Research on the development and diffusion pattern model does
not address the important issue of cooperation. Thus, the effect ofcooperation on market strategies constitutes a significant area forinvestigation, possibly by differentiating the strategies of incum-bent and entrant companies. Another relevant area for future re-search is the impact of the different phases of the pattern on actorconcentration and on the different strategies. Finally, offshorewind is at earlier stages in other regions such as Asia and America.The application of the development and diffusion pattern at aglobal level could indicate at which phase the technology is ateach location, possibly leading to different barriers and marketstrategies.
Acknowledgments
João Gorenstein Dedecca has been awarded an Erasmus Mun-dus Joint Doctorate Fellowship in Sustainable Energy Technologiesand Strategies (SETS) hosted by the Universidad Pontificia Co-millas, Spain; the Royal Institute of Technology, Sweden; and theDelft University of Technology, The Netherlands. The authorswould like to express their gratitude towards all partner institu-tions within the programme as well as the European Commissionfor their support.
The authors would also like to thank all who proof-read orcommented this work. Especially, we would like to thank TaylorStone, all members from the Policy Analysis peer group, the YoungEnergy Economists and Engineers Seminar (YEEES) reviewersAdela Conchado Rodríguez and Nikolaus Ederer, and the anon-ymous reviewers of the Renewable & Sustainable Energy Reviews.
References
[1] Ortt JR, Schoormans JPL. The pattern of development and diffusion of break-through communication technologies. Eur J Inn. Manag 2004;7:292–302. http://dx.doi.org/10.1108/14601060410565047.
[2] European Commission. Energy roadmap 2050. 2011.[3] European Commission. A policy framework for climate and energy in the
period from 2020 to 2030; 2014.[4] Rodrigues S, Restrepo C, Kontos E, Teixeira Pinto R, Bauer P. Trends of offshore
wind projects. Renew Sustain Energy Rev 2015;49:1114–35. http://dx.doi.org/10.1016/j.rser.2015.04.092.
[5] ECF European Climate Foundation. Roadmap 2050: a practical guide to aprosperous, low-carbon Europe; 2010.
[6] Barthelmie RJ. A brief review of offshore wind energy activity in the 1990's.Wind Eng 1998;22:265–73.
[7] EWEA European Wind Energy Association. Wind in power �2015 Europeanstatistics; 2016.
[8] GWEC Global Wind Energy Council. Global wind report - annual market up-date 2015; 2016.
[9] ENTSO-E European Network of Transmission System Operators for Electricity.Statistical factsheet 2015; 2016.
[10] ENTSO-E European Network of Transmission System Operators for Electricity.Scenario Outlook & Adequacy Forecast (SO&AF) 2014–2030; 2014.
[11] GWEC Global Wind Energy Council. Global wind report - annual market up-date 2014; 2015.
[12] Jacobsson S, Karltorp K. Mechanisms blocking the dynamics of the Europeanoffshore wind energy innovation system – challenges for policy intervention.Energy Policy 2013;63:1182–95. http://dx.doi.org/10.1016/j.enpol.2013.08.077.
[13] Wieczorek AJ, Negro SO, Harmsen R, Heimeriks GJ, Luo L, Hekkert MP. A re-view of the European offshore wind innovation system. Renew Sustain EnergyRev 2013;26:294–306. http://dx.doi.org/10.1016/j.rser.2013.05.045.
[14] Luo L, Lacal-Arantegui R, Wieczorek AJ, Negro SO, Harmsen R, Heimeriks GJ,et al. A systemic assessment of the european offshore wind innovation - in-sights from the Netherlands, Denmark, Germany and the United Kingdom. JRC- Inst Energy Transp 2012.
[15] Kaldellis JK, Kapsali M. Shifting towards offshore wind energy—recent activityand future development. Energy Policy 2013;53:136–48. http://dx.doi.org/10.1016/j.enpol.2012.10.032.
[16] Sun X, Huang D, Wu G. The current state of offshore wind energy technologydevelopment. Energy 2012;41:298–312. http://dx.doi.org/10.1016/j.energy.2012.02.054.
[17] Islam MR, Guo Y, Zhu J. A review of offshore wind turbine nacelle: technicalchallenges, and research and developmental trends. Renew Sustain EnergyRev 2014;33:161–76. http://dx.doi.org/10.1016/j.rser.2014.01.085.
J.G. Dedecca et al. / Renewable and Sustainable Energy Reviews 66 (2016) 286–296 295
[18] Perveen R, Kishor N, Mohanty SR. Off-shore wind farm development: Presentstatus and challenges. Renew Sustain Energy Rev 2014;29:780–92. http://dx.doi.org/10.1016/j.rser.2013.08.108.
[19] Dismukes DE, Upton Jr. GB. Economies of scale, learning effects and offshorewind development costs. Renew Energy 2015;83:61–6. http://dx.doi.org/10.1016/j.renene.2015.04.002.
[20] Markard J, Petersen R. The offshore trend: Structural changes in the windpower sector. Energy Policy 2009;37:3545–56. http://dx.doi.org/10.1016/j.enpol.2009.04.015.
[21] Wüstemeyer C, Madlener R, Bunn DW. A stakeholder analysis of divergentsupply-chain trends for the European onshore and offshore wind installations.Energy Policy 2015;80:36–44. http://dx.doi.org/10.1016/j.enpol.2015.01.017.
[22] Hansen GH, Steen M. Offshore oil and gas firms’ involvement in offshore wind:Technological frames and undercurrents. Environ Innov Soc Transit 2015;17:1–14. http://dx.doi.org/10.1016/j.eist.2015.05.001.
[23] Thomson C, Harrison GP. Life cycle costs and carbon emissions of offshorewind power; 2015.
[24] Arántegui RL, González JS. 2014 JRC wind status report - technology, marketand economic aspects of wind energy in Europe. Petten: Joint Research Centre,Institute for Energy and Transport; 2015.
[25] Sovacool BK, Enevoldsen P. One style to build them all: corporate culture andinnovation in the offshore wind industry. Energy Policy 2015;86:402–15. http://dx.doi.org/10.1016/j.enpol.2015.07.015.
[26] Madariaga A, de Alegría IM, Martín JL, Eguía P, Ceballos S. Current facts aboutoffshore wind farms. Renew Sustain Energy Rev 2012;16:3105–16. http://dx.doi.org/10.1016/j.rser.2012.02.022.
[27] Brown C, Poudineh R, Foley B. Achieving a cost-competitive offshore windpower industry: what is the most effective policy framework? Oxford Institutefor Energy Studies; 2015.
[28] EEA European Environmental Agency. Europe's onshore and offshore windenergy potential; 2009.
[29] DNV GL. DNV-OS-J101 - Design of offshore wind turbine structures; 2014.[30] Lumbreras S, Ramos A. Offshore wind farm electrical design: a review. Wind
Energy 2013;16:459–73. http://dx.doi.org/10.1002/we.1498.[31] Yaramasu V, Wu B, Sen PC, Kouro S, Narimani M. High-power wind energy
conversion systems: State-of-the-art and emerging technologies. Proc IEEE2015;103:740–88. http://dx.doi.org/10.1109/JPROC.2014.2378692.
[32] IRENA International Renewable Energy Agency. Renewable power generationcosts in 2014; 2015.
[33] BVG Associates. A guide to an offshore wind farm; 2010.[34] EWEA European Wind Energy Association. Wind our sails - the coming Eur-
ope's offshore wind energy industry. 2011.[35] Fitch-Roy O. An offshore wind union? Diversity and convergence in European
offshore wind governance; 2015.[36] IEA International Energy Agency. Projected costs of generating electricity
2010; 2010.[37] IEA International Energy Agency. Projected costs of generating electricity
2015; 2015.[38] Veiga MM, Álvarez PF, Moraleda MF-M, Kleinsorge A. RE-COST - Study on cost
and business comparisons of renewable vs. non-renewable technologies. FinalReport; 2013.
[39] IRENA International Renewable Energy Agency. The power to change: solarand wind cost reduction potential to 2025; 2016.
[40] TKI Wind op Zee. Cost reduction options for offshore wind in the NetherlandsFID 2010–2020; 2015.
[41] DNV GL. Cost reduction monitoring framework - summary report - offshorerenewable energy catapult; 2015.
[42] EIA Energy Information Administration. Levelized cost and levelized avoidedcost of new generation resources in the annual energy outlook 2015; 2015.
[43] Moné C, Stehly T, Maples B, Settle E. 2014 Cost of wind energy review NREL;2015.
[44] IEA International Energy Agency. Energy technology perspectives 2014 -harnessing electricity's potential; 2014.
[45] IEA International Energy Agency. World energy outlook 2014; 2014. http://dx.doi.org/10.1787/weo-2013-en.
[46] ORE Catapult. Cost reduction monitoring framework 2015; 2016.[47] Adwen, EDP Renewables, Eneco Energie, E.ON Climate & Renewables, GE Re-
newable Energy, Iberdrola Renewables, et al. European offshore wind industryjoint declaration on cost reduction; 2016.
[48] Wieczorek AJ, Hekkert MP. Systemic instruments for systemic innovationproblems: a framework for policy makers and innovation scholars. Sci PublicPolicy 2012;39:74–87. http://dx.doi.org/10.1093/scipol/scr008.
[49] Tidd J. From models to the management of diffusion. Gaining momentum:managing the diffusion of innovations; 2010.
[50] Rogers EM. Diffusion of innovations. New York: Free Press of Glencoe; 1962.[51] Markham SK. Moving technologies from lab to market. Res Technol Manag
2002;45:31–42. http://dx.doi.org/10.1080/08956308.2002.11671531.[52] Markham SK, Ward SJ, Aiman-Smith L, Kingon AI. The valley of death as
context for role theory in product innovation. J Prod Innov Manag2010;27:402–17. http://dx.doi.org/10.1111/j.1540–5885.2010.00724.x.
[53] Kemp R, Volpi M. The diffusion of clean technologies: a review with sugges-tions for future diffusion analysis. J Clean Prod 2008;16:S14–21. http://dx.doi.org/10.1016/j.jclepro.2007.10.019.
[54] Ortt JR, Langley DJ, Pals N. Ten niche strategies to commercialize new high-tech products; 2013.
[55] Arántegui RL. 2013 JRC wind status report - technology, market and economicaspects of wind energy in Europe. Petten: Joint Research Centre, Institute forEnergy and Transport; 2014.
[56] Ortt R. Market creation for radically new technologies: a literature review onthe role of market niches. Engineering, Technology and Innovation (ICE). In:2012 18th International ICE Conference on 2012:(1–16). http://dx.doi.org/10.1109/ICE.2012.6297642http://dx.doi.org/10.1109/ICE.2012.6297642.
[57] van der Duin PA, Ortt JR, Aarts WTM. Contextual innovation managementusing a stage-gate platform: the case of philips shaving and beauty. J ProdInnov Manag 2014;31:489–500. http://dx.doi.org/10.1111/jpim.12109.
[58] Schwanitz VJ, Wierling A. Offshore wind investments – realism about costdevelopments is necessary. Energy 2016;106:170–81. http://dx.doi.org/10.1016/j.energy.2016.03.046.
[59] Jacobsson S, Karltorp K. Formation of competences to realize the potential ofoffshore wind power in the European Union. Energy Policy 2012;44:374–84.http://dx.doi.org/10.1016/j.enpol.2012.01.069.
[60] Ortt JR, Zegveld M, Shah CM. Strategies to commercialise breakthroughtechnologies; 2007.
[61] Raven R. Niche accumulation and hybridisation strategies in transition pro-cesses towards a sustainable energy system: an assessment of differences andpitfalls. Energy Policy 2007;35:2390–400. http://dx.doi.org/10.1016/j.enpol.2006.09.003.
[62] Tavner P. Offshore wind turbines - reliability, availability and maintenance.The Institution of Engineering and Technology; 2012.
[63] GH Garrad Hassan Partners. Tractebel Energy Engineering, Risø National La-boratory, Kvaerner Oil & Gas, EMU Energi & Miljoe Undersoegelser OffshoreWind Energy - Ready to Power a Sustainable Europe; 2001.
[64] Ackermann T, Söder L. Wind energy technology and current status: a review.Renew Sustain Energy Rev 2000;4:315–74. http://dx.doi.org/10.1016/S1364-0321(00)00004-6.
[65] Gaudiosi G. Offshore wind energy prospects. Renew Energy 1999;16:828–34.http://dx.doi.org/10.1016/S0960-1481(98)00267-5.
[66] BWEA British Wind Energy Association. Prospects for offshore. Wind Energy2000.
[67] Steen M, Same Sea Hansen GH. Different ponds: cross-sectorial knowledgeSpillovers in the North Sea. Eur Plan Stud 2013;22:2030–49. http://dx.doi.org/10.1080/09654313.2013.814622.
[68] Barthelmie R, Pryor S. A review of the economics of offshore wind farms. WindEng 2001;25:203–13. http://dx.doi.org/10.1260/0309524011496024.
[69] Jamieson P. Innovation in wind turbine design. Chichester: Wiley; 2011.[70] LORC. LORC list of offshore wind farms; 2016. ⟨http://www.lorc.dk/offshore-
wind-farms-map/list⟩.[71] Research at Alpha Ventus. Research at alpha ventus (RAVE); 2015. ⟨http://rave.
iwes.fraunhofer.de/rave/pages/welcome⟩ (accessed May 19.05.15).[72] Zaaijer MB, Henderson AR. Review of current activities in offshore wind en-
ergy; 2004. p. 101–108.[73] Kaldellis JK, Zafirakis D, Kondili E, Papapostolou C. Trends, prospects and R&D
directions of the global wind energy sector. vol. 3; 2012. p. 1403–1411.[74] Arántegui RL, Corsatea T, Suomalainen K. 2012 JRC wind status report -
technology, market and economic aspects of wind energy in Europe. JointResearch Centre, Institute for Energy and Transport,; 2013.
[75] Westwood A. Refocus marine renewable energy report: global markets,forecasts and analysis 2005–2009; 2005.
[76] GL Garrad Hassan. A guide to UK offshore wind operatons and maintenance;2013.
[77] Deloitte GL Garrad Hassan. Analysis on the furthering of competition in re-lation to the establishment of large offshore wind farms in Denmark. Back-ground report 1: analysis of framework conditions in key EU countries; 2011.
[78] EWEA European Wind Energy Association. Oceans of opportunity - Harnes-sing Europe's largest domestic energy resource; 2009.
[79] GH Garrad Hassan and Partners. Sea wind Europe; 2004.[80] EWEA European Wind Energy Association. The European offshore wind in-
dustry - key trends and statistics 2015; 2016.[81] González JS, Lacal-Arántegui R. A review of regulatory framework for wind
energy in European Union countries: current state and expected develop-ments. Renew Sustain Energy Rev 2016;56:588–602. http://dx.doi.org/10.1016/j.rser.2015.11.091.
[82] DNV GL. Offshore wind - a manifesto for cost reduction; 2014.[83] TPWind European Wind Energy Technology Platform. Strategic research
agenda/market deployment strategy (SRA/MDS); 2014.[84] EWEA European Wind Energy Association. The European offshore wind in-
dustry - key trends and statistics 2014; 2015.[85] T Sterling, T. Escritt Shell participates in bid for Dutch offshore wind farm.
Reuters; 2016.[86] Offshore WIND. Leeghwater offshore wind project cancelled; 2015.
J.G. Dedecca et al. / Renewable and Sustainable Energy Reviews 66 (2016) 286–296296