market trend and management policy · asia & oceania 42 middle east & africa 810 americas...
TRANSCRIPT

3Market Trend and
Management Policy

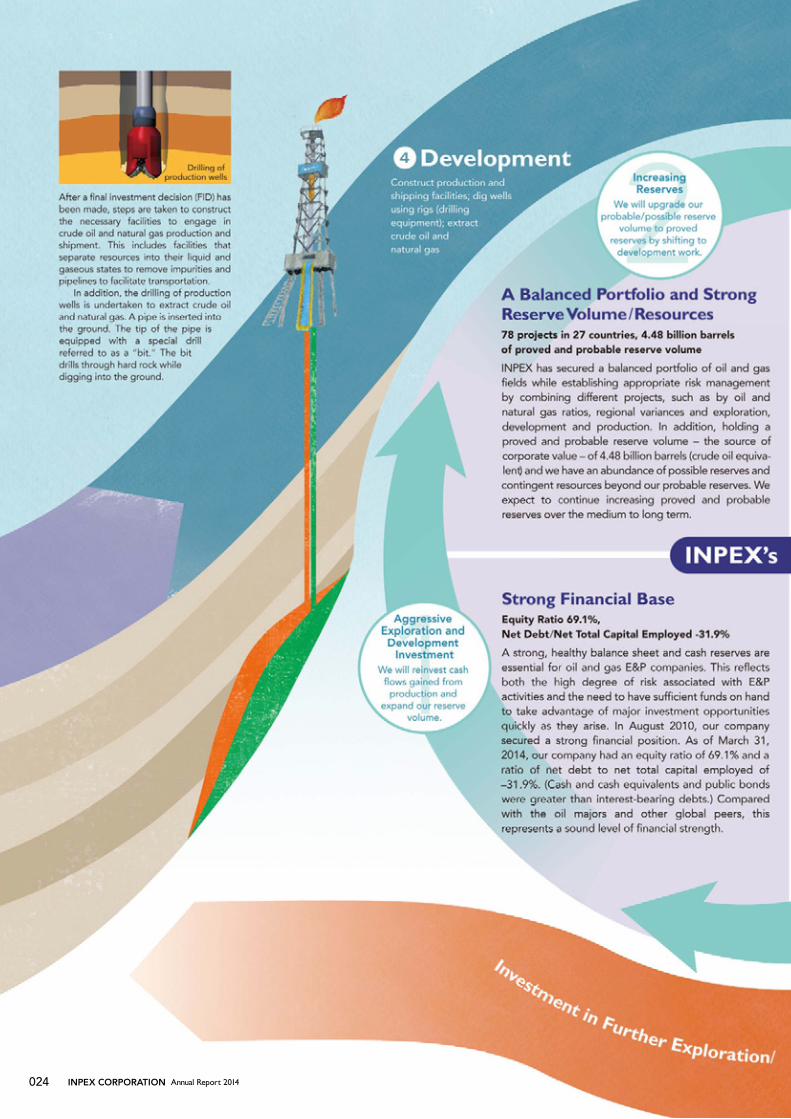
Business Flow in Oil and Gas Development and Our Strengths
The business activities of the oil and gas industry can be envi-sioned as the flow of a river. The upstream consists of explora-tion, development and production of oil and natural gas. The midstream is where products are transported. The downstream refers to refining and sales. Our mainstay business entails han-dling upstream operations including the exploration, drilling, production and sale of crude oil and natural gas. As shown in the business flow at right, upstream business activities can be further classified into 1 acquisition of blocks, 2 exploration, 3 appraisal, 4 development, 5 production and 6 sales.
Signing ceremony of contract
We collect extensive information on legal system and country risks related to areas in which oil and natural gas are expected to exist. We then apply and bid for mining rights and/or exploration and development rights and enter into a contract for explora-tion and development.
Discovered/Preparation for developmentProjects that entail the discovery of resources through exploration and evaluation
Under developmentProjects for which the Company has made a final investment decision and is undertaking development activities with a view to production
ln productionProjects that entail the production and sales of oil and natural gas
Under explorationProjects where exploration and evaluation activities are in progress with resources yet to be discovered
Other projects
The Company’s Oil and Natural Gas Projects
INPEX CORPORATION Annual Report 2014022

In addition to geological surveys, we utilize geophysical surveys conducted through satellite images and seismic waves in order to assess the poten-tial subsurface accumulations of oil and natural gas. Furthermore, we drill exploratory wells in order to confirm the presence of oil and gas.
Geophysical surveys Drilling of appraisal wells
Once the presence of oil and natu-ral gas has been confirmed, we drill appraisal wells to assess the extent of the oil and gas fields and to evaluate the amount of reserves. In addition, we make comprehensive judgments regarding the commercial viability of the fields.
Other
Under exploration
In production
Asia & Oceania
42
Middle East & Africa
10
Americas
18
Eurasia
7
Number of projects by
region34
8
30
Japan
1 1
5
Number of projects by
development stage
Discovered/Preparation for
development Under development
78 projects in 27 countries (As of June 30, 2014)
3
INPEX CORPORATION Annual Report 2014 023
Market Trend and
M
anagement Policy
INPEX CORPORATION Annual Report 2014024
To pipeline
Carbon gasseparator
High pressure separator Refrigeration unit
1 2 3
Christmas tree
Water, oil,sand CO2 WWWater, oil
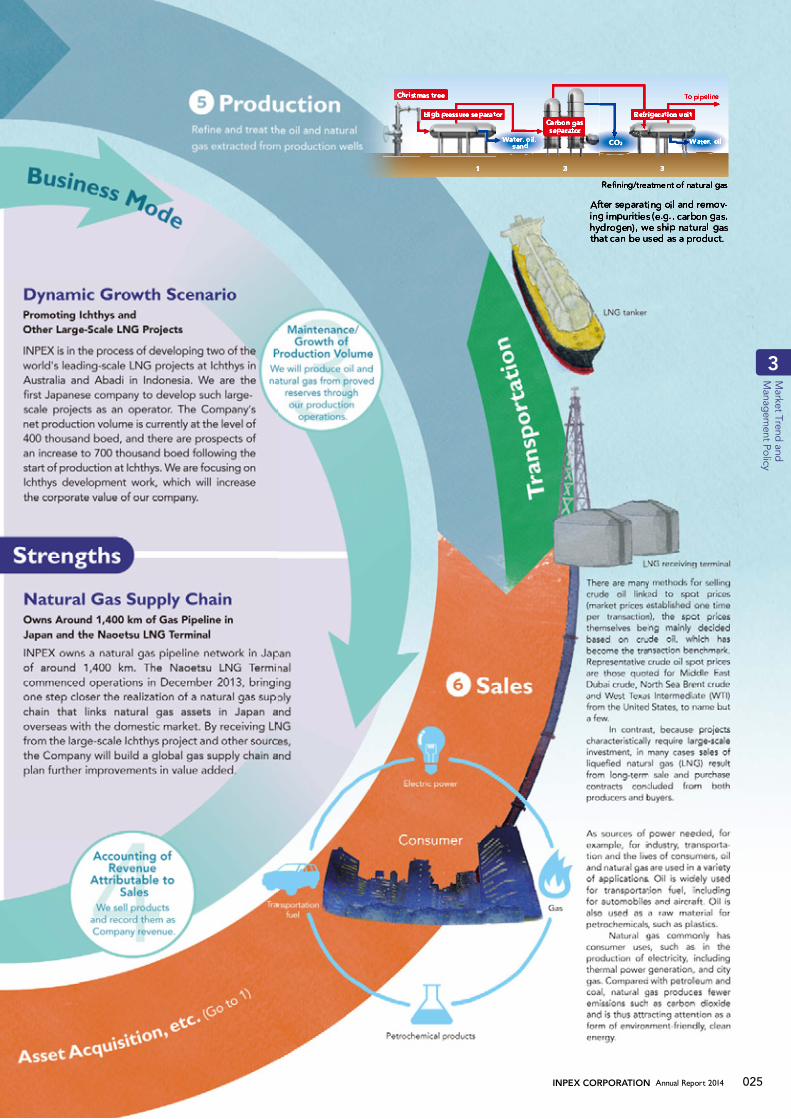
Refining/treatment of natural gas
Aftftf er separating oil and remov-ing impurities (e.g., carbon gas,hydrogen), we ship natural gasthat can be used as a product.
3
INPEX CORPORATION Annual Report 2014 025
Market Trend and
M
anagement Policy

Europe/Eurasia30.5%
Middle East43.2%
North America6.3%
South and Central America4.1%Africa
7.6%Asia/Pacific8.2%
South and Central America19.5%
Middle East47.9%
Africa7.7%
Asia/Pacific 2.5%
Europe/Eurasia8.8%North America13.6%
PR ratio53.3 years
Crude oil1,687.9billion bbl
PR ratio55.1 years
Natural gas 6,557.8trillion cf
Proved Reserves by Region and Reserves-to-Production Ratio (PR ratio) (As of December 31, 2013)
Crude oil production volume1 MMbbl/d
Business Environment in Oil and Gas Development
The forecast is for further expansion of global primary energy demand, including oil and natu-ral gas, to be centered on developing countries, such as China and India. Of that demand, that for natural gas is expected to see a significant increase. Due to such factors as rising resource nationalism, however, the securing of new oil and natural gas interests will continue to be biased toward frontier regions where develop-ment is beset with difficulties.
Representation of main oil and natural gas production areas
Global Proved Reserves and Reserves-to-Production RatioGlobal proved reserves of crude oil and natural gas total approximately 1.7 trillion barrels and 6.6 quadrillion cubic feet, respectively. By region, the Middle East holds the largest reserve volumes of both crude oil and natural gas in existence. There are also extensive proved reserves of crude oil in South and Central America and North America and of natural gas in Europe and Eurasia.
Europe/Eurasia
Africa
Natural gas production volume10 billion cf/d
Crude oil17.28 MMbbl/d
Natural gas99.9 billion cf/d
Source: BP Statistical Review of World Energy 2014
Natural gas55.0 billion cf/d
Asia/Pacific
Crude oil8.23 MMbbl/d
Natural gas47.3 billion cf/d
Middle East
Crude oil28.36 MMbbl/d
Crude oil8.82 MMbbl/d
Natural gas 19.8 billioncf/d
INPEX CORPORATION Annual Report 2014026

There are many countries and regions that produce oil and natural gas, but countries that have large-scale production, have opened their mining areas to foreign oil companies or are capable of exporting LNG are limited to just a few. Due to the rise in resource national-ism, the securing of new oil and natural gas interests by energy development companies has in recent years continued to be biased toward frontier regions where development is beset with difficulties. Among these regions, however, are promising areas where large-scale reserve volumes are to be expected.
Production Volume by Region
Production volume source: BP Statistical Review of World Energy 2014
Global Energy DemandOil and natural gas account for more than half of the amount of global primary energy consump-tion. The main focus is on other forms of energy, such as solar, hydro, biomass and geothermal, as these are renewable within a short time of first use and emit less CO2 during power generation when compared with finite fossil fuels.
North America
South and Central America
Crude oil16.83
MMbbl/d
Crude oil7.29 MMbbl/d
Natural gas17.1 billion cf/d
Natural gas87.0 billion
cf/d
World Primary Energy Consumption (2013)
Hydroelectricity6.7%
Nuclear power4.4%
Renewables2.2%
Oil32.9%
Coal30.1%
Natural gas23.7%
Total
12.73billion toe
2020 203520100
1,000
2,000
3,000
4,000
5,000(Million toe)
World Primary Energy Demand by FuelOil Natural gasCoal
BiomassHydroelectricity
Nuclear power
Other renewable energy
Natural gas to grow 1.6% annually
Source: BP Statistical Review of World Energy 2014 Source: IEA World Energy Outlook 2013 in the New Policies Scenario
OOil and NNatural GasDemand in Japan
Source: Ministry of Finance trade statistics
Demand for LNG is increasing in Japan. This reflects the upswing in LNG use for thermal power generation in the wake of the shutdowns of nuclear power plants.
LNG Import Trend in Japan
0
20
40
60
80
2000 2005 20101995
2013: 87.49 million tons(Million tons/year)
100
Japan’s Primary Energy Supply (2012)Renewables, etc.
1.8%Nuclear power
0.7%
Oil48.3%
Coal23.2%
Natural gas22.8%
3.3%Hydroelectricity
Source: Energy & Economic Statistics in Japan 2013
Although the demand for oil has declined in Japan in recent years, oil that is broadly used as a source of heat and power, as well as in the production of materials, even now accounts for more than 40% of Japan’s primary energy demand.
ggasion
3
INPEX CORPORATION Annual Report 2014 027
Market Trend and
M
anagement Policy

In May 2012, the Company formulated the INPEX Medium- to Long-Term Vision that clarified such aspects as key initiatives up to the fiscal year ending March 2017 toward medium- to long-term growth targets and the achievement of those targets. The Medium- to Long-Term Vision defined three growth targets and three management policies and clearly specified the key initiatives over the following five-year period.
The Medium- to Long-TeTeT rm Vision ofINPEX and Investment Plans
4www.inpex.co.jp/en/vision
For details, please refer to the booklet entitled “MEDIUM- TO LONG-TERM VISION OF INPEX: Ichthys and Our Growth Beyond,” or refer to the following Web site:
MEDIUM- TO LONG-TERMVISION OF INPEX:Ichthys and Our Growth Beyond
Bec
ome a To
p-Class International Oil and Gas E&P Com
pany
Become an Integrated Energy Company with natural gas as the core
1Achieve net productionvolume of 1 million boed
by the early 2020s
Continuous Enhancement ofE&P Activities
We have set three growth targets necessary forsustainable growth and will conduct key initiativesover the next five years to achieve them.
Three Groror wth TaTaT rgets
We are positioning ourselves to become a top-classinternational oil and gas E&P company and areimproving and building our management base toevolve into an integrated energy company.
Three Management Policies
Recruit and utilize personnel in and outside ofJapan to develop global professionals.
Establish an efficient business executionsystem to facilitate decision making.
1 Investment over
five years
Including explorationexpenditures of around
¥300 billion
¥3.5 trillion
From the year ended March 31, 2013,to March 31, 2017
0
5
10
15
20(%)
2011 2012 2013 2014
14.7%
13.2%
14.3%14.0%
Dividend Payout Ratio
From the period in which Ichthys starts produc-tion, we will be aware of our position as a top-class international oil and gas E&P company and will plan appropriate returns for our shareholders.
2Investment for Growth andReturn for Shareholders
Securing/DevelopingHuman Resources and
Building an EfficientOrganizational Structure
INPEX CORPORATION Annual Report 2014028

Bec
ome a To
p-Class International Oil and Gas E&P Com
pany
Become an Integrated Energy Company with natural gas as the core
3Reinforcement ofRenewable Energy Initiatives
Promote efforts to commercializerenewable energies and reinforce R&D activities
2StrengtheningGas Supply Chain
Achieve domestic gas supplyvolume of 2.5 billion m3/3/3 year
by the early 2020s(3.0 billion m³/year in the long term)
reinforce R&D activitiesfor the next generation
Equity Ratio, Net Debt/ Net Total Capital Employed
-40
-30
-20
-10
0
10
20
30
40
50
60
70(%)
69.1%
-31.9%
(As of March 31, 2014)
(As of March 31, 2014)
Equity ratio
Net debt/Net total capital
employed
Target: 50% or higher
Target: 20%
or less
Maintain Financial Strength
Funding Source
3Responsible Managementas a Global Company
Promote continuous improvementsin corporate compliance and HSE initiatives.
Build trust-based working relationshipswith stakeholders through
interactive communications.
■ Lending from JBIC■ Guarantee from JOGMEC■ Project finance
Bank loans
Approximately ¥1.5 trillionof cash available on hand(As of March 31, 2014)
Own funds
Cash flows
Future operating cash flowsobtained per year
3
INPEX CORPORATION Annual Report 2014 029
Market Trend and
M
anagement Policy

(¥ billion)■Development expenditures* ■Exploration expenditures ■Other capital expenditures**
Investment Results and Investment Plan for the Next Three Years
19.0 55.0
30.0
105.0
1,125.0
21.0 91.0
37.2 71.0
854.7
22.6 54.0
576.7
653.3
2017/32015/3 2016/32014/3(Actual)
2013/3(Actual)
682.0
576.0
990.0
650.0
794.0
962.9
* Development expenditures include investment in the Ichthys downstream business ** Mainly investment in the Naoetsu LNG Terminal and the domestic pipeline network, etc.
1Aggressive Exploration and Development Investment
2 Increasing Reserves
To realize its growth targets, the Company will actively pro-mote both exploration investment intended to maintain/expand reserve volume and development investment to produce oil and natural gas from reserve volume holdings.
The scale of investment is planned to be ¥3.5 trillion over the five-year period from the year ended March 2013 to that ending March 2017 (up until the start of produc-tion at Ichthys). Investment in Ichthys will account for more than half of the ¥3.5 trillion. As development operation at Ichthys is progressing smoothly for the most part, invest-ment is being advanced in line with the investment plan. The value of the yen has weakened compared with the for-eign currency exchange rate assumptions adopted at the time investment plans were formulated in May 2012. As a result, the amount of future investment has increased on a yen basis. However, as the Company’s investments are for the most part denominated in U.S. dollars, there has been no change from the initial U.S. dollar–based investment amount of the ¥3.5 trillion.
A principal issue of the oil and gas development business is the ability to put in place a continuous cycle that entails the reinvestment of earnings for sustainable growth. In specific terms, this cycle involves 1 aggressive exploration and development investment; 2 increasing reserves; 3 maintenance/growth of production volume; and 4 accounting of revenue attributable to sales.
Over the five-year period from the year ended March 31, 2013, to the year ending March 31, 2017, INPEX intends to invest a total of ¥3.5 trillion and to continuously enhance its E&P activities. In specific terms, the Com-pany will work diligently to achieve net production volume of 1 million boed by the early 2020s.
Company Management Content in Business Model
605
17.1 years
30.2 years
34.3 years2014/3
2014/3
Reserves-to-Production Ratio
(MMboe)
4,4774,0954,2564,126
5,082
Our Reserves
Reserve Replacement Ratio (3-year average)
■Proved reserves ■Probable reserves
■Possible reserves ■Contingent resources
2011/3
1,308
2,818
2012/3
2,432
1,823
2,188
1,907
2013/3
2,532
1,945
2014/3
282%
25%35%
61%
255%
0
100
200
300
400
2012/32011/32010/32009/3 2013/3 2014/3
370%
(%)
om-
**
ToToTm
At the end of March 2014, the Company’s reserves were proved reserves of 2.5 billion boe, probable reserves of 1.9 billion boe and possible reserves of 600 million boe. If reserve production is shown in terms of how many years reserve volumes will last at the current production vol-ume, proved reserves will last 17.1 years, and 30.2 years if combined with probable reserves. Showing what level of recovery in interim production volume could be pos-sible by increasing the interim reserve volume, the reserve replacement ratio (three-year average) has reached 370%.Also holding a wealth of contingent resource amounts, the Company expects to expand its medium- to long-term proved and probable reserves by launching new projects and improving the recovery rate from its existing oil and gas fields.
INPEX CORPORATION Annual Report 2014030

Middle East & Africa
68%
Japan
14%
Target forthe early 2020s1 million boed
(Thousand boed)
2014/3(Actual)
2015/3 2016/3 2017/3 Early 2020s
■Japan ■Asia & Oceania ■Eurasia ■Middle East & Africa ■Americas
409 411 472
421
Existing
p
rojects
Existing
p
rojects
New
pro
jects
Americas
12%
Asia & Oceania
19%
Asia & Oceania
73%
Japan
1%
Europe & Eurasia
11%
Americas
1%Crude oil245
thousand bbl/d
Natural gas876
million cf/d
409 thousand boed
Around 700 thousand boed fromexisting projects from the commencement of production at the Ichthys LNG Project and other factors
Oil fields in Caspian Sea
Gas fields including the Minami-Nagaoka Oil Field,Niigata Prefecture
Gas fields including the Mahakam Oil Field, Indonesia
Mainly from oil fields in U.A.E.
Net Production (Year ended March 31, 2014)
Medium- to Long-Term Production Volume Targets
3Maintenance/Growth of Production Volume
4Accounting of Revenue Attributable to Sales
(¥ billion)
■Crude oil sales ■Natural gas sales ■Other sales ■Net income
Net Sales (by product), Net Income
1,334.6 1,316.0
178.0194.0 183.7
2011/3 2012/3 2013/3 2015/3(Forecast as of August 2014)
2014/3
356.2
558.0
28.9943.1
128.7
1,186.7
429.1
726.2
31.4
1,216.5
397.8
788.1
30.6
183.0
455.4
858.8
20.4
The Company maintains robust revenue based on the sta-ble production of its revenue sources, crude oil and natural gas. For the year ended March 31, 2014, net sales reached an all-time high due to the effects of the yen’s depreciation.
The Company’s business revenues are greatly affected by changes in crude oil prices and exchange rates (U.S. dollar). The yearly average price of crude oil (ICE Brent) in the year under review was US$107 per bar-rel. On foreign currency exchanges, the yen remained at the ¥100 to the U.S. dollar mark for the year. The chart below shows the Company’s sensitivity with regard to its consolidated net income forecasts for the current year in the event of changes in crude oil prices and exchange rates. A rise in crude oil prices and yen depreciation would have a positive effect on net income.
The Company’s net production volumes for the year ended March 31, 2014, were 245 thousand barrels per day of crude oil, 876 million cubic feet per day of natural gas (164 thousand boed) for a combined oil and natural gas total of 409 thousand boed. We expect to increase that figure to 411 thousand boed for the year ending March 2015.
Concerning our medium- to long-term production vol-ume forecasts, we plan to maintain and expand production volume due to the contributions from production at start-up production projects and existing projects until the start of production at the Ichthys LNG Project. After that, due to such factors as the start of production at Ichthys, we will increase net production volume of existing projects to the 700 thousand boed level and aim to achieve one million boed in the early 2020s by, for example, increasing the pro-duction volume of new projects.
Crude oil price; $1/bbl increase (decrease)*2 +2.5 (-2.5) billion yen
Exchange rate; ¥1 depreciation (appreciation) against the U.S. dollar
+0.8 (-0.8) billion yen
Flow effect on net income from operating activities*3
+2.1 (-2.1) billion yen
Stock effect on net income (valuation for assets and liabilities denominated in U.S. dollar)*4
-1.3 (+1.3) billion yen
Sensitivities of Crude Oil Price and Foreign Exchange Fluctuation on Consolidated Net Income for the Year Ending March 31, 2015*1
*1: The sensitivities represent the impact on net income for the year ending March 31, 2015 against $1/bbl increase (decrease) of Brent crude oil price on annual average and ¥1 depreciation (appreciation) against the U.S. dollar. These are based on the financial situation at the beginning of the fiscal year. These are information purpose only and the actual impact may be subject to change in production volumes, capital expendi-tures and cost recoveries, and may not be constant, depending on crude oil prices and exchange rates.
*2: This is a sensitivity on net income by fluctuation of crude oil price and is subject to the average price of crude oil (Brent) in the fiscal year.
*3: This is a sensitivity on net income from operating activities by fluctuation of the yen against the U.S. dollar and is subject to the average exchange rate in the fiscal year.
*4: This is the impact of foreign exchange differences for foreign currency-denominated assets and liabilities, and is affected by the difference between the exchange rate at the end of the fiscal year and the end of the previous fiscal year. In this fiscal year, as foreign currency-denominated debt is greater than foreign currency-denominated assets due to an increase in foreign currency debt, exchange valuation gains will occur when the yen is appreciated against foreign currency, while exchange valuation losses will occur when the yen becomes weaker against foreign currency. In addition, because of the impact of deferred tax accounting, when the yen is appreciated against the U.S. dollar to a certain extent, the above sensitivities may show different trend.
3
INPEX CORPORATION Annual Report 2014 031
Market Trend and
M
anagement Policy

Ne
t p
rod
uct
ion
volu
me
(Tho
usan
d b
oed
)
Proved and probable reserves (Billion boe)
Proved reserves: 2.53 billion boe Probable reserves: 1.95 billion boe
To achieve 1 MMboed of netproduction by the early 2020sthrough medium- to long-terminvestment
Probable reserves toupgrade to proved through the shift of development
BG (UK)
Woodside (AU)
Anadarko (US)
Apache (US)
Occidental (US)
Santos (AU)
200
100
400
300
600
500
700
800
900
1,000
0 1.0 2.0 3.0 4.00.5 1.5 2.5 3.540
9 t
hou
sand
bo
ed
INPEX
Talisman (CA)
INPPEX
108%
370%
112%
INPEXInternational E&P(Average)
Oil majors(Average)
13.4 years
17.1 years
11.0 years
INPEXInternational E&P(Average)
Oil major(Average)
Comparing net production volumes and reserve volume, INPEX is positioned in the mid-tier of international oil and gas E&P companies that are ranked second to the oil majors. Looking ahead, the Company plans to join the leading group of interna-tional oil and gas E&P companies in the early 2020s through a variety of initiatives including increasing its net production volume and upgrading its reserve volume.
Reserve Replacement Ratio (3-year average)
Reserves-to-Production Ratio Our reserve replacement ratio and reserves-to-production ratio were superior to those of the oil majors and other international oil and gas E&P companies, and they repre-sent our growth potential.
Oil companies that conduct upstream activities can be divided into three categories: 1 national oil companies of governments in oil-producing countries that possess oil and natural gas assets, 2 major international oil companies known as the “oil majors” and 3 companies that special-ize in upstream activities and are second in scale to the oil majors. INPEX is currently positioned in the mid-tier of international oil and gas E&P companies that are second to the oil majors.
Comparison with Global Oil Companies
Proved Reserves, Net Production Volume and the Market Value of the Major International Oil and Gas E&P Players
Reserve Volume Comparison with Global Peers
Proved reserves and production volume indicated in this chart are from documents disclosed by the major E&P companies in fiscal 2013. The size of the circle shows the market value of each company as of March 31, 2014.
Average of majors:BP, Chevron, ConocoPhillips, ENI, ExxonMobil, TOTAL, Shell
Average of E&P that disclose the data: Anadarko, Apache, BG, Occidental, Santos, Statoil, Talisman, Woodside
Seeking to establisha firm position as aninternational oil and gas E&P companyby the early 2020s
2 mize iin th g p j
INPEX CORPORATION Annual Report 2014032