market vectors bank and brokerage etf (rkh) - etfg.com · market vectors bank and brokerage etf...
TRANSCRIPT
Market Vectors Bank and Brokerage ETF (RKH)Tearsheet as of 12:03 pm, April 28, 2014.
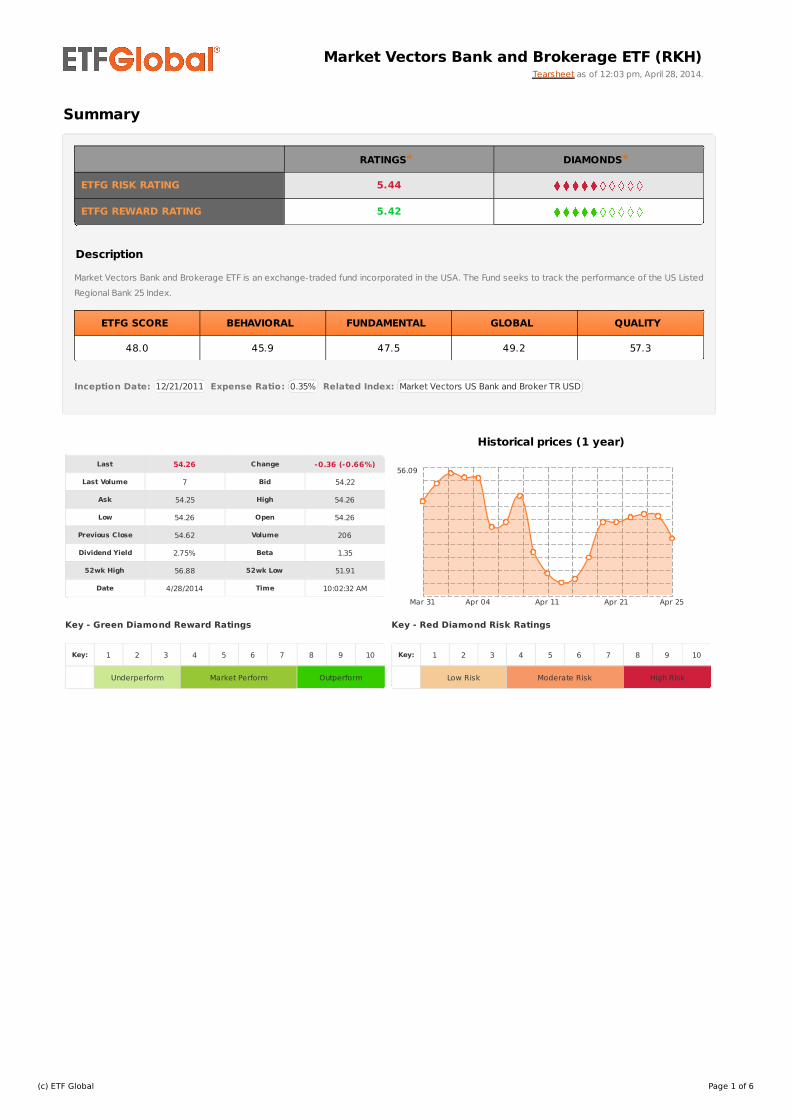
Last 54.26 Change -0.36 (-0.66%)
Last Volume 7 Bid 54.22
Ask 54.25 High 54.26
Low 54.26 Open 54.26
Previous Close 54.62 Volume 206
Dividend Yield 2.75% Beta 1.35
52wk High 56.88 52wk Low 51.91
Date 4/28/2014 Time 10:02:32 AM
Key - Green Diamond Reward Ratings
Key: 1 2 3 4 5 6 7 8 9 10
Underperform Market Perform Outperform
Key - Red Diamond Risk Ratings
Key: 1 2 3 4 5 6 7 8 9 10
Low Risk Moderate Risk High Risk
Summary
RATINGS* DIAMONDS*
ETFG RISK RATING 5.44
ETFG REWARD RATING 5.42
Description
Market Vectors Bank and Brokerage ETF is an exchange-traded fund incorporated in the USA. The Fund seeks to track the performance of the US Listed
Regional Bank 25 Index.
ETFG SCORE BEHAVIORAL FUNDAMENTAL GLOBAL QUALITY
48.0 45.9 47.5 49.2 57.3
Inception Date: 12/21/2011 Expense Ratio: 0.35% Related Index: Market Vectors US Bank and Broker TR USD
Historical prices (1 year)
Apr 25Apr 21Apr 11Apr 04Mar 31
56.09
(c) ETF Global Page 1 of 6
Geographic Exposure Currency Exposure
Sector Exposure Industry Group Exposure
Industry Exposure Sub-Industry Exposure
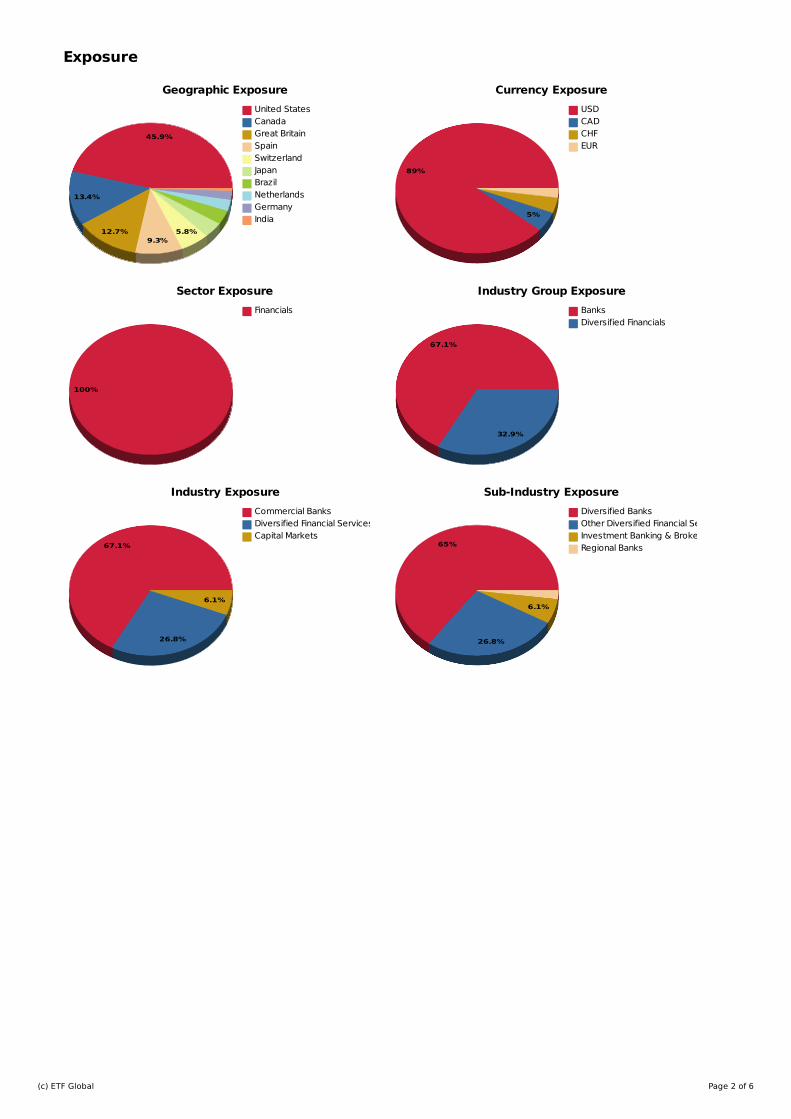
Exposure
45.9%
United States
13.4%
Canada
12.7%
Great Britain
9.3%
Spain
5.8%
SwitzerlandJapanBrazilNetherlandsGermanyIndia
89%
USD
5%
CADCHFEUR
100%
Financials
67.1%
Banks
32.9%
Diversified Financials
67.1%
Commercial Banks
26.8%
Diversified Financial Services
6.1%
Capital Markets65%
Diversified Banks
26.8%
Other Diversified Financial Services
6.1%
Investment Banking & BrokerageRegional Banks
(c) ETF Global Page 2 of 6

Service Providers
Administrator Van Eck Associates Corporation
Advisor Van Eck Associates Corporation
Commodity Pool Operator -
Commodity Trading Advisor -
Custodian The Bank of New York Mellon Corporation
Depositor -
Depository -
Distributor Van Eck Securities Corporation
Futures Commission Merchant -
General Partner -
Marketing Agent -
Pool Manager -
Pool Tax Administrator -
Portfolio Manager Hao-Hung (Peter) Liao, George Cao
Subadvisor -
Trust Processing Agent -
Transfer Agent The Bank of New York Mellon Corporation
Trust Sponsor -
Trustee -
ETFG Index Membership
Index #1 ETFG Global Composite
Index #2 ETFG Global Equity Index
Index #3 ETFG Global Financials Index
Index #4 ETFG G20 Index
Index #5 ETFG G8 Index
Tax Classification
Tax Classification Regulated Investment Company
Expenses
Management Fee .350%
Other Expenses .540%
Total Expenses .890%
Fee Waivers -.530%
Net Expenses .360%
Additional Information
Fiscal Year End September 30
Distribution Frequency Quarterly
Listing Exchange NYSE Arca, Inc.
Creation Unit Size 50,000
Creation Fee $500.00
SEC Series Id S000034407
SEC Class Id C000105865
CTA NAV Symbol RKH.NV
CTA Est Cash Symbol RKH.SO
CTA Total Cash Symbol RKH.TC
CTA IOPV Symbol RKH.IV
Top Holdings
Product Info
Ticker Fund Ticker Constituent Name Country Currency Weight Shares Market Value
1 WFC RKH Wells Fargo & Co USD 10.80% 34K 1.67M
2 JPM RKH JPMorgan Chase & Co USD 9.64% 26K 1.50M
3 HBC RKH HSBC Holdings PLC USD 9.59% 28K 1.49M
4 BAC RKH Bank of America Corp USD 7.94% 75K 1.23M
5 C RKH Citigroup Inc USD 6.68% 21K 1.04M
6 SAN RKH Banco Santander SA USD 5.62% 87K 870.82K
7 RY US RKH Royal Bank of Canada USD 4.54% 11K 704.19K
8 MTU RKH Mitsubishi UFJ Financial Group Inc USD 3.86% 111K 599.06K
9 TD US RKH Toronto-Dominion Bank/The USD 3.84% 13K 595.69K
10 UBSN RKH UBS AG CHF 3.75% 28K 581.65K
11 BBVA RKH Banco Bilbao Vizcaya Argentaria SA USD 3.71% 45K 574.50K
12 USB RKH US Bancorp USD 3.30% 13K 510.89K
13 BNS.TO RKH Bank of Nova Scotia CAD 3.10% 8K 480.67K
14 BCS RKH Barclays PLC USD 3.08% 28K 477.88K
15 GS RKH Goldman Sachs Group Inc/The USD 2.88% 3K 445.72K
16 ING RKH ING Groep NV USD 2.72% 30K 421.64K
17 DB US RKH Deutsche Bank AG EUR 2.16% 8K 334.25K
18 PNC RKH PNC Financial Services Group Inc USD 2.11% 4K 326.76K
19 CS RKH Credit Suisse Group AG USD 2.10% 10K 325.65K
20 ITUB RKH Itau Unibanco Holding SA USD 1.94% 18K 301.23K
(c) ETF Global Page 3 of 6

2010 Performance 2011 Performance 2012 Performance 2013 Performance 2014 Performance
Performance
Year Q1 Q2 Q3 Q4 Total
2010 13.94% -16.02% -0.05% 17.08% 11.97%
2011 1.28% -8.79% -20.96% 13.28% -17.29%
2012 22.70% -13.20% 9.96% 10.19% 29.05%
2013 3.46% 2.68% 7.12% 6.28% 20.95%
2014 0.13% -1.37% - - -1.25%
MTD YTD 1 Year 3 Year 5 Year
-1.37% -1.25% 13.65% 29.80% 85.00%
Peer Group Stats (Equity)
1 Month 3 Month 6 Month 1 Year 3 Year
Peer Ave. Return 1.84% 1.20% 4.68% 11.76% 12.28%
Peer Low -11.95% -22.70% -20.84% -29.02% -98.06%
Peer 25th -0.34% -0.92% 1.92% 0.00% 0.00%
Peer Median 1.55% 1.26% 4.65% 13.21% 0.00%
Peer 75th 3.76% 3.51% 6.72% 22.05% 36.83%
Peer High 45.40% 32.16% 26.49% 70.96% 90.28%
Number of Funds 831 831 831 831 831
Fund Return -1.32% 0.28% 0.94% 13.81% 32.73%
Fund Percentile 27% 43% 25% 55% 71%
Peer Group Stats (Sector)
1 Month 3 Month 6 Month 1 Year 3 Year
Peer Ave. Return 1.22% 0.37% 4.45% 14.94% 16.30%
Peer Low -11.95% -22.70% -16.00% -29.02% -98.06%
Peer 25th -1.52% -1.96% 1.26% 3.28% 0.00%
Peer Median 1.00% 1.06% 4.20% 16.87% 17.22%
Peer 75th 3.83% 3.85% 7.07% 25.54% 40.46%
Peer High 14.73% 16.58% 22.14% 70.96% 90.28%
Number of Funds 257 257 257 257 257
Fund Return -1.32% 0.28% 0.94% 13.81% 32.73%
Fund Percentile 41% 47% 30% 49% 67%
*
22.70%
-20.96%
Q1 Q2 Q3 Q4 Q1 Q2 Q3 Q4 Q1 Q2 Q3 Q4 Q1 Q2 Q3 Q4 Q1 Q2 Q3 Q4
(c) ETF Global Page 4 of 6

Risk & Reward
Peer Group Stats (Financials)
1 Month 3 Month 6 Month 1 Year 3 Year
Peer Ave. Return -0.93% 0.54% 1.87% 14.09% 19.30%
Peer Low -6.75% -6.94% -8.64% -13.21% -35.19%
Peer 25th -3.66% -1.35% -0.69% 5.34% 0.00%
Peer Median -1.61% 0.36% 1.26% 17.77% 20.44%
Peer 75th 0.30% 1.37% 4.23% 23.68% 39.13%
Peer High 14.73% 16.58% 22.14% 38.17% 51.00%
Number of Funds 36 36 36 36 36
Fund Return -1.32% 0.28% 0.94% 13.81% 32.73%
Fund Percentile 64% 56% 58% 42% 58%
- as of 04/25/2014. All return calculations are based off of price only and do not include dividend reinvestment. All returns are cumulative unless stated
otherwise.
Fund Flows
1 Week 2 Week 1 Month 3 Month
$127.82K $241.71K $40.67K $350.57K
Fund Statistics
Risk and Reward Diamond Ratings Dynamics
Return and Risk Statistics
Statistics 1 year 3 year 5 year
Annualized Return 13.65% 9.08% 13.09%
Beta 1.17 1.37 1.44
Standard Deviation 49.58% 37.30% 35.77%
Sharpe Ratio 0.27 0.23 0.35
Treynor Ratio 0.11 0.06 0.09
Sortino Ratio 0.55 0.44 0.67
All return calculations are based off of price only and do not include dividend reinvestment.
Additional Information
Previous One Day Short Sales 197.13K
30 Day Average Short Sales 446.06K
Previous One Day Call Volume 0.00
Previous One Day Put Volume 0.00
*
Apr 25Apr 16Apr 7Mar 26Mar 17
7.05
(c) ETF Global Page 5 of 6

DISCLAIMERS
Assumptions, opinions and estimates constitute our judgment as of the date of this material and are subject to change without notice. ETF Global LLC (“ETFG”) and its affiliates and any
third-party providers, as well as their directors, officers, shareholders, employees or agents (collectively ETFG Parties) do not guarantee the accuracy, completeness, adequacy or
timeliness of any information, including ratings and are not responsible for errors and omissions or for the results obtained from the use of such information and ETFG Parties shall have
no liability for any errors, omissions, or interruptions therein, regardless of the cause, or for the results obtained from the use of such information. ETFG PARTIES DISCLAIM ANY AND ALL
EXPRESS OR IMPLIED WARRANTIES, INCLUDING, BUT NOT LIMITED TO, ANY WARRANTIES OF MERCHANTABILITY, SUITABILITY OR FITNESS FOR A PARTICULAR PURPOSE OR USE. In no event
shall ETFG Parties be liable to any party for any direct, indirect, incidental, exemplary, compensatory, punitive, special or consequential damages, costs, expenses, legal fees, or losses
(including, without limitation, lost income or lost profits and opportunity costs) in connection with any use of the information contained in this document even if advised of the possibility
of such damages. ETFG ratings are statements of opinion as of the date they are expressed and not statements of fact or recommendations to purchase, hold, or sell any securities or
to make any investment decisions. ETFG ratings should not be relied on when making any investment or other business decision. ETFG’s opinions and analyses do not address the
suitability of any security. ETFG does not act as a fiduciary or an investment advisor. While ETFG has obtained information from sources they believe to be reliable, ETFG does not
perform an audit or undertake any duty of due diligence or independent verification of any information it receives. ETFG keeps certain activities of its business units separate from each
other in order to preserve the independence and objectivity of their respective activities. As a result, certain business units of ETFG may have information that is not available to other
ETFG business units. ETFG has established policies and procedures to maintain the confidentiality of certain non-public information received in connection with each analytical process.
ETFG may receive compensation for its ratings and certain analyses. ETFG reserves the right to disseminate its opinions and analyses. ETFG's public ratings and analyses are made
available on its Websites, www.etfg.com (free of charge) and may be distributed through other means, including via ETFG publications and third party redistributors. This material is not
intended as an offer or solicitation for the purchase or sale of any security or other financial instrument. Securities, financial instruments or strategies mentioned herein may not be
suitable for all investors. Any opinions expressed herein are given in good faith, are subject to change without notice, and are only correct as of the stated date of their issue. Prices,
values, or income from any securities or investments mentioned in this report may fall against the interests of the investor and the investor may get back less than the amount invested.
Where an investment is described as being likely to yield income, please note that the amount of income that the investor will receive from such an investment may fluctuate. Where an
investment or security is denominated in a different currency to the investor's currency of reference, changes in rates of exchange may have an adverse effect on the value, price or
income of or from that investment to the investor. The information contained in this report does not constitute advice on the tax consequences of making any particular investment
decision. This material does not take into account your particular investment objectives, financial situations or needs and is not intended as a recommendation of particular securities,
financial instruments or strategies to you nor is it considered to be investment advice. Before acting on any recommendation in this material, you should consider whether it is suitable
for your particular circumstances and, if necessary, seek professional advice.
(c) ETF Global Page 6 of 6