market watch may 2016
TRANSCRIPT

Toronto EmploymentGrowthApril 2016 2.8%
Month May 20161 Year3 Year5 Year
3.14%3.39%4.64%
May 20161 Year3 Year5 Year
------
Market Watch For All TREB Member Inquiries:
(416) 443-8158For All Media/Public Inquiries:
(416) 443-8152
Strong Sales Growth Continues in MayTORONTO, June 3, 2016 – Toronto Real Estate Board President Mark McLean announced that there were 12,870 home sales reported through TREB’s MLS® System in May 2016. This result represented a new record for the month of May and a 10.6 per cent increase over the same period last year. In contrast, the number of new listings was down over the same time frame by 6.4 per cent. The decline in listings was experienced in both the low-rise and condominium apartment market segments.
“Whether we’re talking about existing homeowners or people looking to purchase for the first time, there is no shortage of buyers in the marketplace today. So, while the record number of home sales through the first five months of 2016 is not necessarily surprising, it does sometimes mask the larger story in the GTA: the shortage of listings, which has resulted in strong upward pressure on home prices,” said Mr. McLean.
The MLS® Home Price Index Composite Benchmark was up by 15 per cent year-over-year in May 2016. Similarly, the average selling price for all home types combined was up by 15.7 per cent over the same period. Low-rise home types, which remained in short supply in many GTA neighbourhoods, experienced the strongest price growth.
“Widespread competition between buyers of singles, semis and townhouses across the GTA has underpinned the robust annual rates of price growth experienced so far this year. With this said, however, it is also important to understand that tighter market conditions for condominium apartments have resulted in price growth well above the rate of inflation in this market segment as well,” said Jason Mercer, TREB’s Director of Market Analysis.
TREB MLS® Sales Activity
12,870 11,640
May 2016 May 2015
TREB MLS® Average Price
$751,908
$649,648
May 2016 May 2015
Year-Over-Year Summary2016 2015 % Chg.
SalesNew ListingsActive ListingsAverage PriceAverage DOM
12,870 11,640 10.6%17,412 18,611 -6.4%12,931 18,585 -30.4%
$751,908 $649,648 15.7%15 18 -16.7%
Sources and Notes:
i - Statistics Canada, Quarter-over-quartergrowth, annualized
ii - Statistics Canada, Year-over-yeargrowth for the most recently reportedmonth
iii - Bank of Canada, Rate from mostrecent Bank of Canada announcement
iv - Bank of Canada, Rates for mostrecently completed month
Real GDP GrowthQ1 2016 2.4%
Toronto UnemploymentRateApril 2016 7.5%
Inflation Rate (Yr./Yr. CPIGrowth)April 2016 1.7%
Bank of Canada OvernightRateMay 2016 -- 0.50%
Prime RateMay 2016 -- 2.70%
Economic Indicators
Metrics Sales Average Price416 905 Total 416 905 Total
2016DetachedSemi - DetachedTownhouseCondo Apartment
1,565 4,935 6,500 $1,285,693 $891,870 $986,691406 804 1,210 $834,883 $586,849 $670,074488 1,376 1,864 $626,305 $527,503 $553,370
2,137 919 3,056 $442,520 $347,431 $413,925
Sales & Average Price By Major Home TypeMay 2016
May 2016
i
ii
ii
iii
iv
DetachedSemi - DetachedTownhouseCondo Apartment
15.2% 21.2% 18.9%7.1% 19.0% 11.8%12.9% 17.2% 15.8%5.0% 8.7% 5.9%
DetachedSemi - DetachedTownhouseCondo Apartment
8.9% 12.8% 11.8%-13.8% 0.5% -4.8%1.5% 2.2% 2.0%
21.7% 22.5% 21.9%
1,7
1,7
1,7
1,7
Year-Over-Year Per Cent Change
Mortgage Rates

Toronto Real Estate Board
Market Watch, May 2016
SALES BY PRICE RANGE AND HOUSE TYPE MAY 2016
2
Price Range Detached Semi-Detached Att/Row/Twnhouse Condo Townhouse Condo Apt Link Co-op Apt Det Condo Co-ownership Apt Total
$0 to $99,999$100,000 to $199,999$200,000 to $299,999$300,000 to $399,999$400,000 to $499,999$500,000 to $599,999$600,000 to $699,999$700,000 to $799,999$800,000 to $899,999$900,000 to $999,999$1,000,000 to $1,249,999$1,250,000 to $1,499,999$1,500,000 to $1,749,999$1,750,000 to $1,999,999$2,000,000+
1 0 0 0 11 0 1 0 0 1314 0 0 14 104 0 4 0 0 13650 7 5 85 736 1 1 0 4 889200 61 75 243 1,001 19 0 2 4 1,605425 140 192 245 593 26 0 1 1 1,623676 333 259 150 272 37 1 3 0 1,731891 271 169 75 146 34 0 0 0 1,586867 150 112 30 73 32 0 0 0 1,264740 103 77 21 39 37 0 0 0 1,017442 56 43 5 18 23 0 0 0 587759 52 20 7 27 6 0 0 0 871559 20 17 8 14 2 0 0 0 620342 9 2 5 9 0 0 0 0 367171 6 3 1 2 0 0 0 0 183363 2 1 0 11 0 0 1 0 378
Price Range Detached Semi-Detached Att/Row/Twnhouse Condo Townhouse Condo Apt Link Co-op Apt Det Condo Co-ownership Apt Total
$0 to $99,999$100,000 to $199,999$200,000 to $299,999$300,000 to $399,999$400,000 to $499,999$500,000 to $599,999$600,000 to $699,999$700,000 to $799,999$800,000 to $899,999$900,000 to $999,999$1,000,000 to $1,249,999$1,250,000 to $1,499,999$1,500,000 to $1,749,999$1,750,000 to $1,999,999$2,000,000+
1 0 0 0 42 0 2 0 1 4647 5 4 83 467 0 12 0 5 623256 51 34 379 3,128 3 12 1 15 3,879885 239 328 931 3,852 91 4 4 9 6,343
1,857 757 993 956 2,131 124 5 4 3 6,8302,761 1,286 870 490 1,002 118 2 6 0 6,5353,317 869 615 212 522 115 2 2 0 5,6543,080 523 408 117 264 120 3 0 0 4,5152,396 304 273 63 118 118 2 1 1 3,2761,623 167 98 23 76 58 1 0 0 2,0462,477 152 59 34 103 18 0 1 0 2,8441,770 70 38 20 48 2 0 0 0 1,9481,010 39 7 6 24 0 0 0 0 1,086543 16 8 6 18 0 0 0 0 591
1,168 22 6 1 30 0 0 1 0 1,228
SALES BY PRICE RANGE AND HOUSE TYPE YEAR-TO-DATE, 2016
Total SalesShare of Total SalesAverage Price
6,500 1,210 975 889 3,056 217 7 7 9 12,87050.5% 9.4% 7.6% 6.9% 23.7% 1.7% 0.1% 0.1% 0.1% 100.0%
$986,691 $670,074 $624,852 $474,972 $413,925 $676,885 $204,643 $750,786 $307,056 $751,908
Total SalesShare of Total SalesAverage Price
23,191 4,500 3,741 3,321 11,825 767 45 20 34 47,44448.9% 9.5% 7.9% 7.0% 24.9% 1.6% 0.1% 0.0% 0.1% 100.0%
$941,036 $650,433 $597,587 $456,601 $402,794 $644,544 $350,129 $638,200 $280,238 $712,375
1,7
1,7
Toronto Real Estate Board
Market Watch, May 2016
Number of Sales Dollar Volume Average Price Median Price New Listings SNLR (Trend) Active Listings Mos. Inv. (Trend) Avg. SP / LP Avg. DOMTREB TotalHalton Region
BurlingtonHalton HillsMiltonOakville
Peel RegionBramptonCaledonMississauga
City of TorontoToronto WestToronto CentralToronto East
York RegionAuroraE. GwillimburyGeorginaKingMarkhamNewmarketRichmond HillVaughanWhitchurch-Stouffville
Durham RegionAjaxBrockClaringtonOshawaPickeringScugogUxbridgeWhitby
Dufferin CountyOrangeville
Simcoe CountyAdjala-TosorontioBradford WestGwillimburyEssaInnisfilNew Tecumseth
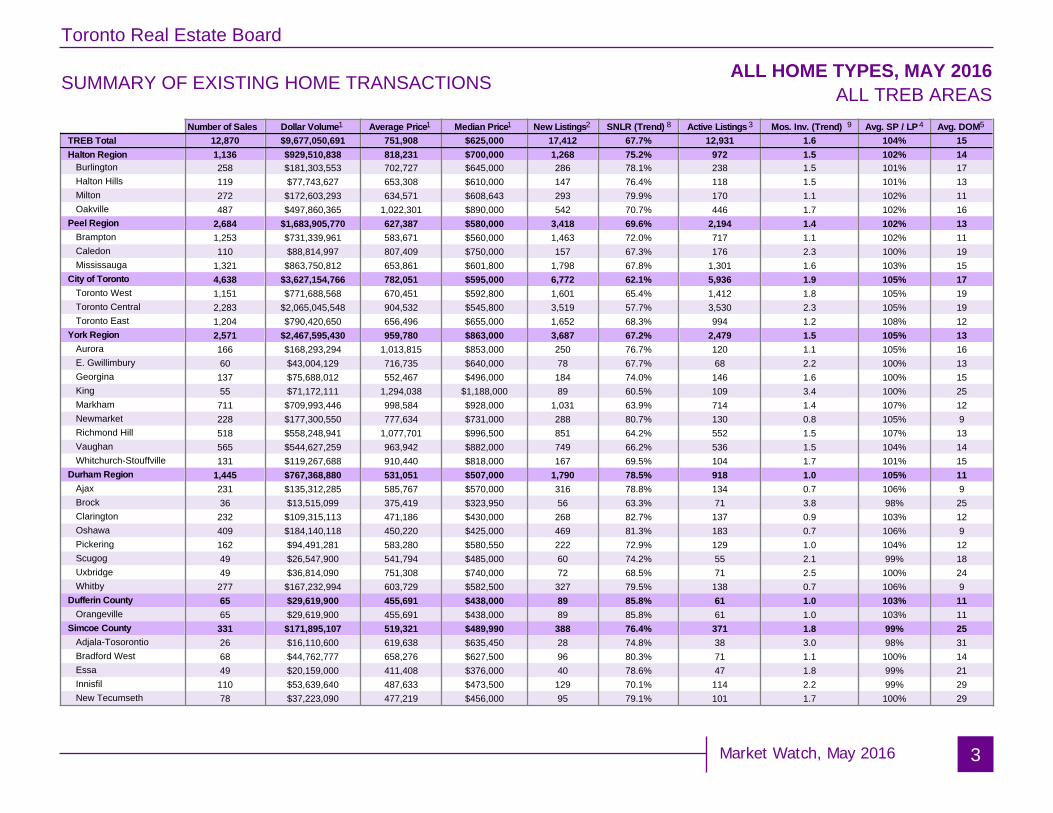
12,870 $9,677,050,691 751,908 $625,000 17,412 67.7% 12,931 1.6 104% 151,136 $929,510,838 818,231 $700,000 1,268 75.2% 972 1.5 102% 14258 $181,303,553 702,727 $645,000 286 78.1% 238 1.5 101% 17119 $77,743,627 653,308 $610,000 147 76.4% 118 1.5 101% 13272 $172,603,293 634,571 $608,643 293 79.9% 170 1.1 102% 11487 $497,860,365 1,022,301 $890,000 542 70.7% 446 1.7 102% 16
2,684 $1,683,905,770 627,387 $580,000 3,418 69.6% 2,194 1.4 102% 131,253 $731,339,961 583,671 $560,000 1,463 72.0% 717 1.1 102% 11110 $88,814,997 807,409 $750,000 157 67.3% 176 2.3 100% 19
1,321 $863,750,812 653,861 $601,800 1,798 67.8% 1,301 1.6 103% 154,638 $3,627,154,766 782,051 $595,000 6,772 62.1% 5,936 1.9 105% 171,151 $771,688,568 670,451 $592,800 1,601 65.4% 1,412 1.8 105% 192,283 $2,065,045,548 904,532 $545,800 3,519 57.7% 3,530 2.3 105% 191,204 $790,420,650 656,496 $655,000 1,652 68.3% 994 1.2 108% 122,571 $2,467,595,430 959,780 $863,000 3,687 67.2% 2,479 1.5 105% 13166 $168,293,294 1,013,815 $853,000 250 76.7% 120 1.1 105% 1660 $43,004,129 716,735 $640,000 78 67.7% 68 2.2 100% 13
137 $75,688,012 552,467 $496,000 184 74.0% 146 1.6 100% 1555 $71,172,111 1,294,038 $1,188,000 89 60.5% 109 3.4 100% 25
711 $709,993,446 998,584 $928,000 1,031 63.9% 714 1.4 107% 12228 $177,300,550 777,634 $731,000 288 80.7% 130 0.8 105% 9518 $558,248,941 1,077,701 $996,500 851 64.2% 552 1.5 107% 13565 $544,627,259 963,942 $882,000 749 66.2% 536 1.5 104% 14131 $119,267,688 910,440 $818,000 167 69.5% 104 1.7 101% 15
1,445 $767,368,880 531,051 $507,000 1,790 78.5% 918 1.0 105% 11231 $135,312,285 585,767 $570,000 316 78.8% 134 0.7 106% 936 $13,515,099 375,419 $323,950 56 63.3% 71 3.8 98% 25
232 $109,315,113 471,186 $430,000 268 82.7% 137 0.9 103% 12409 $184,140,118 450,220 $425,000 469 81.3% 183 0.7 106% 9162 $94,491,281 583,280 $580,550 222 72.9% 129 1.0 104% 1249 $26,547,900 541,794 $485,000 60 74.2% 55 2.1 99% 1849 $36,814,090 751,308 $740,000 72 68.5% 71 2.5 100% 24
277 $167,232,994 603,729 $582,500 327 79.5% 138 0.7 106% 965 $29,619,900 455,691 $438,000 89 85.8% 61 1.0 103% 1165 $29,619,900 455,691 $438,000 89 85.8% 61 1.0 103% 11
331 $171,895,107 519,321 $489,990 388 76.4% 371 1.8 99% 2526 $16,110,600 619,638 $635,450 28 74.8% 38 3.0 98% 3168 $44,762,777 658,276 $627,500 96 80.3% 71 1.1 100% 1449 $20,159,000 411,408 $376,000 40 78.6% 47 1.8 99% 21
110 $53,639,640 487,633 $473,500 129 70.1% 114 2.2 99% 2978 $37,223,090 477,219 $456,000 95 79.1% 101 1.7 100% 29
SUMMARY OF EXISTING HOME TRANSACTIONS ALL HOME TYPES, MAY 2016ALL TREB AREAS
3
1 1 1 2 5498 3

Toronto Real Estate Board
Market Watch, May 2016
SUMMARY OF EXISTING HOME TRANSACTIONS ALL HOME TYPES, MAY 2016CITY OF TORONTO MUNICIPAL BREAKDOWN
4
Number of Sales Dollar Volume Average Price Median Price New Listings SNLR (Trend) Active Listings Mos. Inv. (Trend) Avg. SP / LP Avg. DOMTREB TotalCity of Toronto TotalToronto West
Toronto W01Toronto W02Toronto W03Toronto W04Toronto W05Toronto W06Toronto W07Toronto W08Toronto W09Toronto W10
Toronto CentralToronto C01Toronto C02Toronto C03Toronto C04Toronto C06Toronto C07Toronto C08Toronto C09Toronto C10Toronto C11Toronto C12Toronto C13Toronto C14Toronto C15
Toronto EastToronto E01Toronto E02Toronto E03Toronto E04Toronto E05Toronto E06Toronto E07Toronto E08Toronto E09Toronto E10Toronto E11
12,870 $9,677,050,691 $751,908 $625,000 17,412 67.7% 12,931 1.6 104% 154,638 $3,627,154,766 $782,051 $595,000 6,772 62.1% 5,936 1.9 105% 171,151 $771,688,568 $670,451 $592,800 1,601 65.4% 1,412 1.8 105% 19
79 $61,067,024 $773,000 $555,000 112 62.7% 90 1.9 107% 18108 $93,049,689 $861,571 $806,121 172 72.2% 100 1.1 113% 1292 $56,887,167 $618,339 $585,650 110 70.0% 71 1.3 106% 13
118 $72,018,247 $610,324 $614,750 163 66.2% 140 1.7 106% 19144 $75,611,036 $525,077 $542,250 211 66.6% 210 2.0 102% 21189 $110,900,307 $586,774 $515,000 269 54.2% 307 2.8 102% 2334 $32,861,660 $966,519 $895,000 45 65.1% 33 1.5 107% 14
226 $188,782,789 $835,322 $675,788 296 67.3% 277 1.9 101% 2159 $36,314,300 $615,497 $647,000 77 70.7% 73 1.5 104% 19
102 $44,196,349 $433,298 $379,000 146 70.8% 111 1.5 102% 202,283 $2,065,045,548 $904,532 $545,800 3,519 57.7% 3,530 2.3 105% 19696 $385,936,321 $554,506 $444,950 1,135 54.6% 1,343 2.7 101% 2283 $110,521,722 $1,331,587 $899,900 192 47.1% 223 3.4 101% 1879 $105,385,236 $1,333,990 $950,000 104 59.3% 77 2.2 107% 13
128 $211,658,537 $1,653,582 $1,654,000 195 64.3% 121 1.6 109% 1151 $46,832,707 $918,288 $1,040,000 76 62.5% 51 2.1 114% 17
175 $151,608,300 $866,333 $572,000 264 61.5% 244 2.1 105% 20224 $119,908,495 $535,306 $446,000 336 59.8% 358 2.2 100% 2147 $94,503,500 $2,010,713 $1,675,000 69 61.5% 76 2.1 102% 1585 $70,101,397 $824,722 $581,000 112 60.5% 91 1.7 107% 1851 $60,875,905 $1,193,645 $1,240,000 73 66.9% 53 1.5 110% 1667 $175,523,483 $2,619,753 $2,388,000 100 55.4% 107 3.1 101% 31
112 $115,895,822 $1,034,784 $697,500 144 69.6% 101 1.5 109% 15236 $209,093,808 $885,991 $483,000 355 56.6% 347 2.4 104% 18249 $207,200,315 $832,130 $550,000 364 58.0% 338 2.2 109% 15
1,204 $790,420,650 $656,496 $655,000 1,652 68.3% 994 1.2 108% 1296 $80,634,196 $839,940 $838,050 141 68.4% 78 1.0 111% 1087 $87,056,369 $1,000,648 $847,700 137 68.0% 72 1.1 109% 9
115 $93,442,660 $812,545 $805,000 148 72.6% 54 0.8 112% 7138 $78,922,072 $571,899 $643,250 188 68.7% 114 1.2 107% 13140 $88,830,715 $634,505 $538,250 184 68.2% 124 1.2 108% 1445 $34,757,100 $772,380 $700,000 81 62.1% 40 1.3 108% 10
136 $77,230,064 $567,868 $594,000 176 63.9% 127 1.7 106% 1888 $54,375,584 $617,904 $641,500 111 72.7% 67 1.2 106% 13
155 $78,285,337 $505,067 $558,000 228 69.3% 166 1.4 106% 13107 $68,302,514 $638,341 $672,500 137 63.6% 81 1.5 104% 1397 $48,584,039 $500,866 $520,000 121 71.9% 71 1.1 105% 12
1 1 1 2 8 3 9 4 5

Toronto Real Estate Board
Market Watch, May 2016
SUMMARY OF EXISTING HOME TRANSACTIONS ALL HOME TYPES, YEAR-TO-DATE 2016ALL TREB AREAS
5
Number of Sales Dollar Volume Average Price Median Price New Listings Avg. SP / LP Avg. DOMTREB TotalHalton Region
BurlingtonHalton HillsMiltonOakville
Peel RegionBramptonCaledonMississauga
City of TorontoToronto WestToronto CentralToronto East
York RegionAuroraE. GwillimburyGeorginaKingMarkhamNewmarketRichmond HillVaughanWhitchurch-Stouffville
Durham RegionAjaxBrockClaringtonOshawaPickeringScugogUxbridgeWhitby
Dufferin CountyOrangeville
Simcoe CountyAdjala-TosorontioBradford WestGwillimburyEssaInnisfilNew Tecumseth
47,444 $33,797,907,803 $712,375 $590,000 68,548 103% 184,275 $3,343,471,817 $782,099 $673,000 5,686 100% 17954 $636,389,259 $667,075 $619,950 1,253 100% 20469 $289,103,941 $616,426 $578,000 608 100% 19
1,088 $674,298,527 $619,760 $585,000 1,370 101% 131,764 $1,743,680,090 $988,481 $859,950 2,455 100% 189,970 $5,929,770,603 $594,761 $550,000 13,719 101% 164,641 $2,585,080,231 $557,009 $535,000 6,022 101% 13442 $331,396,582 $749,766 $699,500 678 99% 21
4,887 $3,013,293,790 $616,594 $560,000 7,019 101% 1816,972 $12,492,375,573 $736,058 $565,000 26,604 104% 214,195 $2,647,406,087 $631,086 $562,000 6,375 103% 228,433 $7,113,456,945 $843,526 $520,000 14,212 103% 234,344 $2,731,512,541 $628,801 $626,000 6,017 106% 159,455 $8,635,501,682 $913,326 $818,000 13,840 104% 16590 $548,395,980 $929,485 $829,800 794 104% 15176 $124,011,009 $704,608 $640,000 258 100% 20508 $251,289,193 $494,664 $464,500 703 100% 18197 $230,451,592 $1,169,805 $1,065,000 325 98% 36
2,573 $2,444,987,271 $950,248 $866,000 3,894 106% 16854 $640,029,574 $749,449 $720,000 1,087 104% 11
1,915 $1,997,352,377 $1,043,004 $952,000 2,964 105% 152,203 $2,005,753,921 $910,465 $830,000 3,216 103% 16439 $393,230,765 $895,742 $775,786 599 100% 19
5,274 $2,661,392,936 $504,625 $477,000 6,696 104% 13857 $480,792,338 $561,018 $540,000 1,100 105% 10102 $37,141,699 $364,134 $317,950 169 97% 37886 $393,731,054 $444,392 $420,000 1,090 103% 13
1,399 $587,764,981 $420,132 $400,000 1,701 105% 11680 $391,858,650 $576,263 $545,000 884 103% 15180 $93,607,050 $520,039 $480,500 247 99% 22158 $109,410,784 $692,473 $654,500 236 99% 26
1,012 $567,086,380 $560,362 $540,000 1,269 105% 10290 $125,550,226 $432,932 $415,000 363 101% 16290 $125,550,226 $432,932 $415,000 363 101% 16
1,208 $609,844,966 $504,839 $470,000 1,640 99% 2483 $48,982,922 $590,156 $555,000 109 98% 41
334 $205,924,936 $616,542 $583,750 432 99% 17172 $68,327,500 $397,253 $370,000 226 99% 24333 $155,011,048 $465,499 $435,000 474 98% 24286 $131,598,560 $460,135 $431,000 399 100% 24
1 1 1 2 4 5
Toronto Real Estate Board
Market Watch, May 2016
SUMMARY OF EXISTING HOME TRANSACTIONS ALL HOME TYPES, YEAR-TO-DATE 2016CITY OF TORONTO MUNICIPAL BREAKDOWN
6
Number of Sales Dollar Volume Average Price Median Price New Listings Avg. SP / LP Avg. DOMTREB TotalCity of Toronto TotalToronto West
Toronto W01Toronto W02Toronto W03Toronto W04Toronto W05Toronto W06Toronto W07Toronto W08Toronto W09Toronto W10
Toronto CentralToronto C01Toronto C02Toronto C03Toronto C04Toronto C06Toronto C07Toronto C08Toronto C09Toronto C10Toronto C11Toronto C12Toronto C13Toronto C14Toronto C15
Toronto EastToronto E01Toronto E02Toronto E03Toronto E04Toronto E05Toronto E06Toronto E07Toronto E08Toronto E09Toronto E10Toronto E11
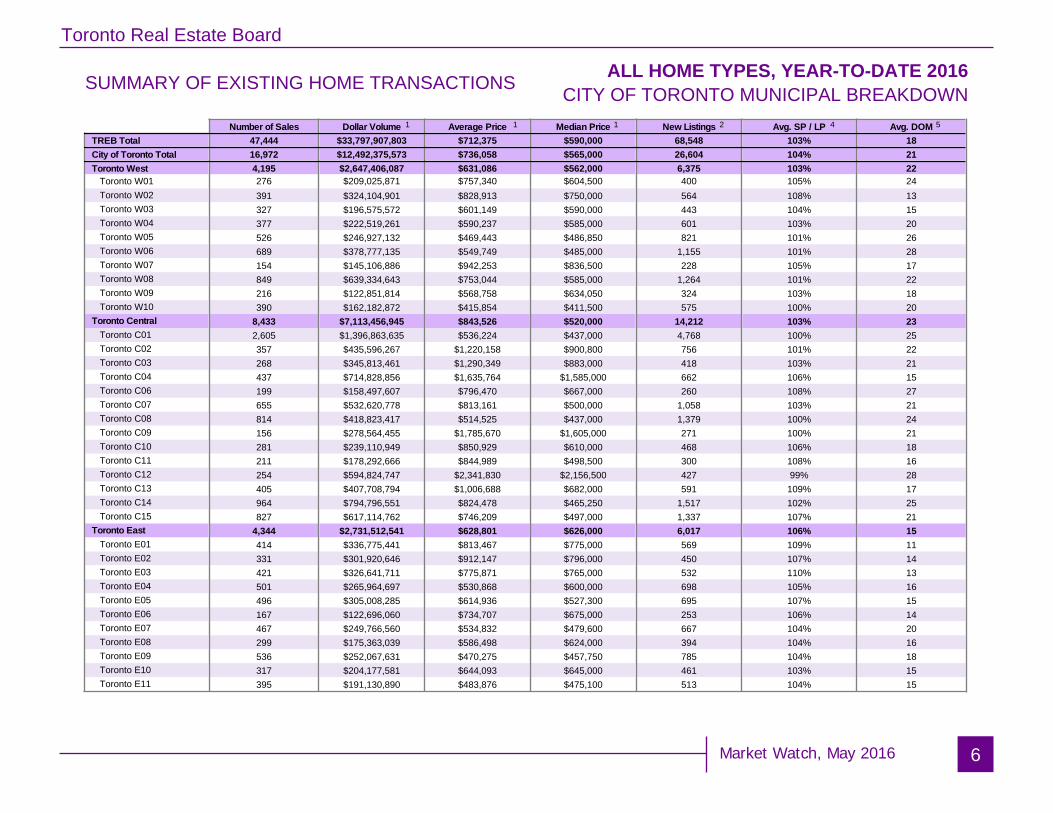
47,444 $33,797,907,803 $712,375 $590,000 68,548 103% 1816,972 $12,492,375,573 $736,058 $565,000 26,604 104% 214,195 $2,647,406,087 $631,086 $562,000 6,375 103% 22276 $209,025,871 $757,340 $604,500 400 105% 24391 $324,104,901 $828,913 $750,000 564 108% 13327 $196,575,572 $601,149 $590,000 443 104% 15377 $222,519,261 $590,237 $585,000 601 103% 20526 $246,927,132 $469,443 $486,850 821 101% 26689 $378,777,135 $549,749 $485,000 1,155 101% 28154 $145,106,886 $942,253 $836,500 228 105% 17849 $639,334,643 $753,044 $585,000 1,264 101% 22216 $122,851,814 $568,758 $634,050 324 103% 18390 $162,182,872 $415,854 $411,500 575 100% 20
8,433 $7,113,456,945 $843,526 $520,000 14,212 103% 232,605 $1,396,863,635 $536,224 $437,000 4,768 100% 25357 $435,596,267 $1,220,158 $900,800 756 101% 22268 $345,813,461 $1,290,349 $883,000 418 103% 21437 $714,828,856 $1,635,764 $1,585,000 662 106% 15199 $158,497,607 $796,470 $667,000 260 108% 27655 $532,620,778 $813,161 $500,000 1,058 103% 21814 $418,823,417 $514,525 $437,000 1,379 100% 24156 $278,564,455 $1,785,670 $1,605,000 271 100% 21281 $239,110,949 $850,929 $610,000 468 106% 18211 $178,292,666 $844,989 $498,500 300 108% 16254 $594,824,747 $2,341,830 $2,156,500 427 99% 28405 $407,708,794 $1,006,688 $682,000 591 109% 17964 $794,796,551 $824,478 $465,250 1,517 102% 25827 $617,114,762 $746,209 $497,000 1,337 107% 21
4,344 $2,731,512,541 $628,801 $626,000 6,017 106% 15414 $336,775,441 $813,467 $775,000 569 109% 11331 $301,920,646 $912,147 $796,000 450 107% 14421 $326,641,711 $775,871 $765,000 532 110% 13501 $265,964,697 $530,868 $600,000 698 105% 16496 $305,008,285 $614,936 $527,300 695 107% 15167 $122,696,060 $734,707 $675,000 253 106% 14467 $249,766,560 $534,832 $479,600 667 104% 20299 $175,363,039 $586,498 $624,000 394 104% 16536 $252,067,631 $470,275 $457,750 785 104% 18317 $204,177,581 $644,093 $645,000 461 103% 15395 $191,130,890 $483,876 $475,100 513 104% 15
1 1 1 2 4 5
Toronto Real Estate Board
Market Watch, May 2016
SUMMARY OF EXISTING HOME TRANSACTIONS DETACHED HOUSES, MAY 2016ALL TREB AREAS
7
Sales Dollar Volume Average Price Median Price New Listings Active Listings Avg. SP / LP Avg. DOMTREB TotalHalton Region
BurlingtonHalton HillsMiltonOakville
Peel RegionBramptonCaledonMississauga
City of TorontoToronto WestToronto CentralToronto East
York RegionAuroraE. GwillimburyGeorginaKingMarkhamNewmarketRichmond HillVaughanWhitchurch-Stouffville
Durham RegionAjaxBrockClaringtonOshawaPickeringScugogUxbridgeWhitby
Dufferin CountyOrangeville
Simcoe CountyAdjala-TosorontioBradford WestGwillimburyEssaInnisfilNew Tecumseth
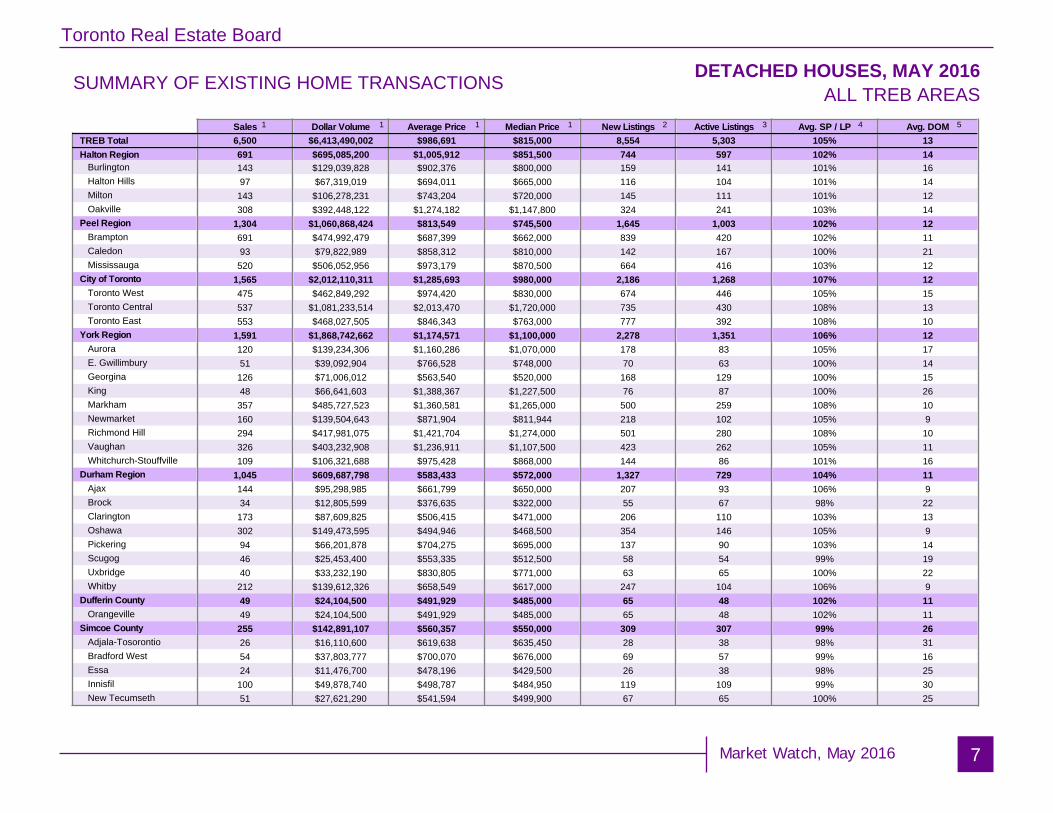
6,500 $6,413,490,002 $986,691 $815,000 8,554 5,303 105% 13691 $695,085,200 $1,005,912 $851,500 744 597 102% 14143 $129,039,828 $902,376 $800,000 159 141 101% 1697 $67,319,019 $694,011 $665,000 116 104 101% 14
143 $106,278,231 $743,204 $720,000 145 111 101% 12308 $392,448,122 $1,274,182 $1,147,800 324 241 103% 14
1,304 $1,060,868,424 $813,549 $745,500 1,645 1,003 102% 12691 $474,992,479 $687,399 $662,000 839 420 102% 1193 $79,822,989 $858,312 $810,000 142 167 100% 21
520 $506,052,956 $973,179 $870,500 664 416 103% 121,565 $2,012,110,311 $1,285,693 $980,000 2,186 1,268 107% 12475 $462,849,292 $974,420 $830,000 674 446 105% 15537 $1,081,233,514 $2,013,470 $1,720,000 735 430 108% 13553 $468,027,505 $846,343 $763,000 777 392 108% 10
1,591 $1,868,742,662 $1,174,571 $1,100,000 2,278 1,351 106% 12120 $139,234,306 $1,160,286 $1,070,000 178 83 105% 1751 $39,092,904 $766,528 $748,000 70 63 100% 14
126 $71,006,012 $563,540 $520,000 168 129 100% 1548 $66,641,603 $1,388,367 $1,227,500 76 87 100% 26
357 $485,727,523 $1,360,581 $1,265,000 500 259 108% 10160 $139,504,643 $871,904 $811,944 218 102 105% 9294 $417,981,075 $1,421,704 $1,274,000 501 280 108% 10326 $403,232,908 $1,236,911 $1,107,500 423 262 105% 11109 $106,321,688 $975,428 $868,000 144 86 101% 16
1,045 $609,687,798 $583,433 $572,000 1,327 729 104% 11144 $95,298,985 $661,799 $650,000 207 93 106% 934 $12,805,599 $376,635 $322,000 55 67 98% 22
173 $87,609,825 $506,415 $471,000 206 110 103% 13302 $149,473,595 $494,946 $468,500 354 146 105% 994 $66,201,878 $704,275 $695,000 137 90 103% 1446 $25,453,400 $553,335 $512,500 58 54 99% 1940 $33,232,190 $830,805 $771,000 63 65 100% 22
212 $139,612,326 $658,549 $617,000 247 104 106% 949 $24,104,500 $491,929 $485,000 65 48 102% 1149 $24,104,500 $491,929 $485,000 65 48 102% 11
255 $142,891,107 $560,357 $550,000 309 307 99% 2626 $16,110,600 $619,638 $635,450 28 38 98% 3154 $37,803,777 $700,070 $676,000 69 57 99% 1624 $11,476,700 $478,196 $429,500 26 38 98% 25
100 $49,878,740 $498,787 $484,950 119 109 99% 3051 $27,621,290 $541,594 $499,900 67 65 100% 25
1 2 3 4 51 1 1
Toronto Real Estate Board
Market Watch, May 2016
SUMMARY OF EXISTING HOME TRANSACTIONS DETACHED HOUSES, MAY 2016CITY OF TORONTO MUNICIPAL BREAKDOWN
8
Sales Dollar Volume Average Price Median Price New Listings Active Listings Avg. SP / LP Avg. DOMTREB TotalCity of Toronto TotalToronto West
Toronto W01Toronto W02Toronto W03Toronto W04Toronto W05Toronto W06Toronto W07Toronto W08Toronto W09Toronto W10
Toronto CentralToronto C01Toronto C02Toronto C03Toronto C04Toronto C06Toronto C07Toronto C08Toronto C09Toronto C10Toronto C11Toronto C12Toronto C13Toronto C14Toronto C15
Toronto EastToronto E01Toronto E02Toronto E03Toronto E04Toronto E05Toronto E06Toronto E07Toronto E08Toronto E09Toronto E10Toronto E11
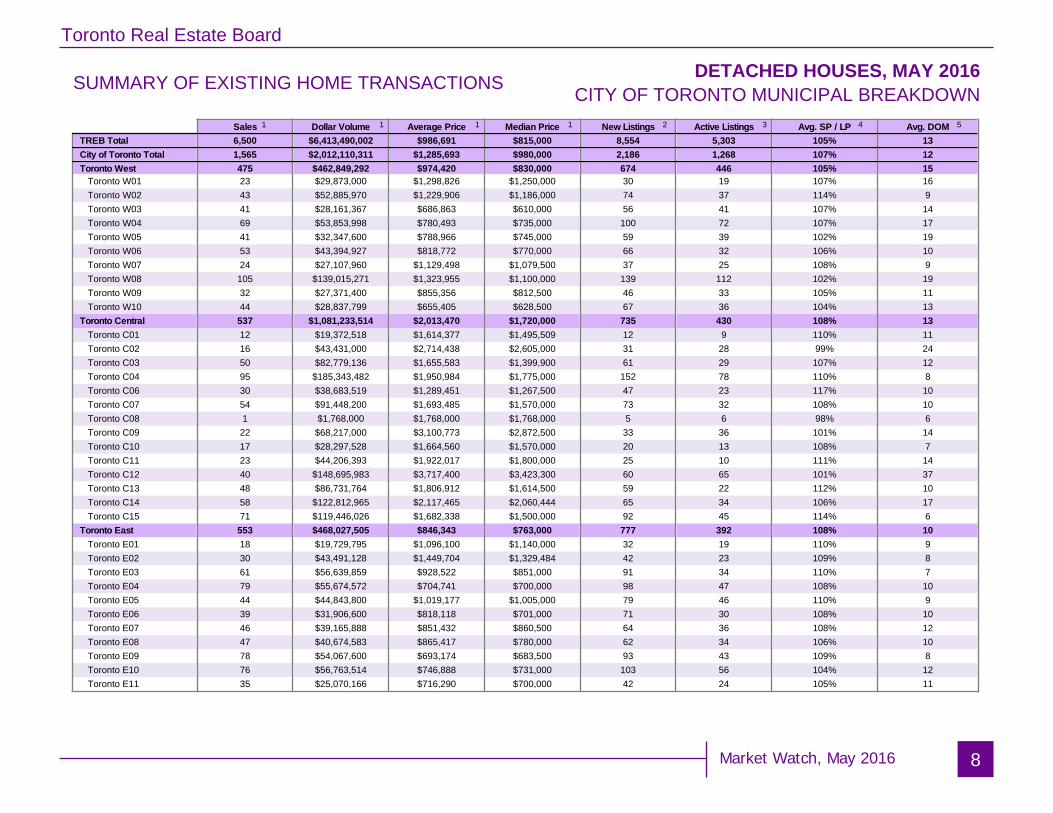
6,500 $6,413,490,002 $986,691 $815,000 8,554 5,303 105% 131,565 $2,012,110,311 $1,285,693 $980,000 2,186 1,268 107% 12475 $462,849,292 $974,420 $830,000 674 446 105% 1523 $29,873,000 $1,298,826 $1,250,000 30 19 107% 1643 $52,885,970 $1,229,906 $1,186,000 74 37 114% 941 $28,161,367 $686,863 $610,000 56 41 107% 1469 $53,853,998 $780,493 $735,000 100 72 107% 1741 $32,347,600 $788,966 $745,000 59 39 102% 1953 $43,394,927 $818,772 $770,000 66 32 106% 1024 $27,107,960 $1,129,498 $1,079,500 37 25 108% 9
105 $139,015,271 $1,323,955 $1,100,000 139 112 102% 1932 $27,371,400 $855,356 $812,500 46 33 105% 1144 $28,837,799 $655,405 $628,500 67 36 104% 13
537 $1,081,233,514 $2,013,470 $1,720,000 735 430 108% 1312 $19,372,518 $1,614,377 $1,495,509 12 9 110% 1116 $43,431,000 $2,714,438 $2,605,000 31 28 99% 2450 $82,779,136 $1,655,583 $1,399,900 61 29 107% 1295 $185,343,482 $1,950,984 $1,775,000 152 78 110% 830 $38,683,519 $1,289,451 $1,267,500 47 23 117% 1054 $91,448,200 $1,693,485 $1,570,000 73 32 108% 101 $1,768,000 $1,768,000 $1,768,000 5 6 98% 622 $68,217,000 $3,100,773 $2,872,500 33 36 101% 1417 $28,297,528 $1,664,560 $1,570,000 20 13 108% 723 $44,206,393 $1,922,017 $1,800,000 25 10 111% 1440 $148,695,983 $3,717,400 $3,423,300 60 65 101% 3748 $86,731,764 $1,806,912 $1,614,500 59 22 112% 1058 $122,812,965 $2,117,465 $2,060,444 65 34 106% 1771 $119,446,026 $1,682,338 $1,500,000 92 45 114% 6
553 $468,027,505 $846,343 $763,000 777 392 108% 1018 $19,729,795 $1,096,100 $1,140,000 32 19 110% 930 $43,491,128 $1,449,704 $1,329,484 42 23 109% 861 $56,639,859 $928,522 $851,000 91 34 110% 779 $55,674,572 $704,741 $700,000 98 47 108% 1044 $44,843,800 $1,019,177 $1,005,000 79 46 110% 939 $31,906,600 $818,118 $701,000 71 30 108% 1046 $39,165,888 $851,432 $860,500 64 36 108% 1247 $40,674,583 $865,417 $780,000 62 34 106% 1078 $54,067,600 $693,174 $683,500 93 43 109% 876 $56,763,514 $746,888 $731,000 103 56 104% 1235 $25,070,166 $716,290 $700,000 42 24 105% 11
1 1 1 1 2 3 4 5
Toronto Real Estate Board
Market Watch, May 2016
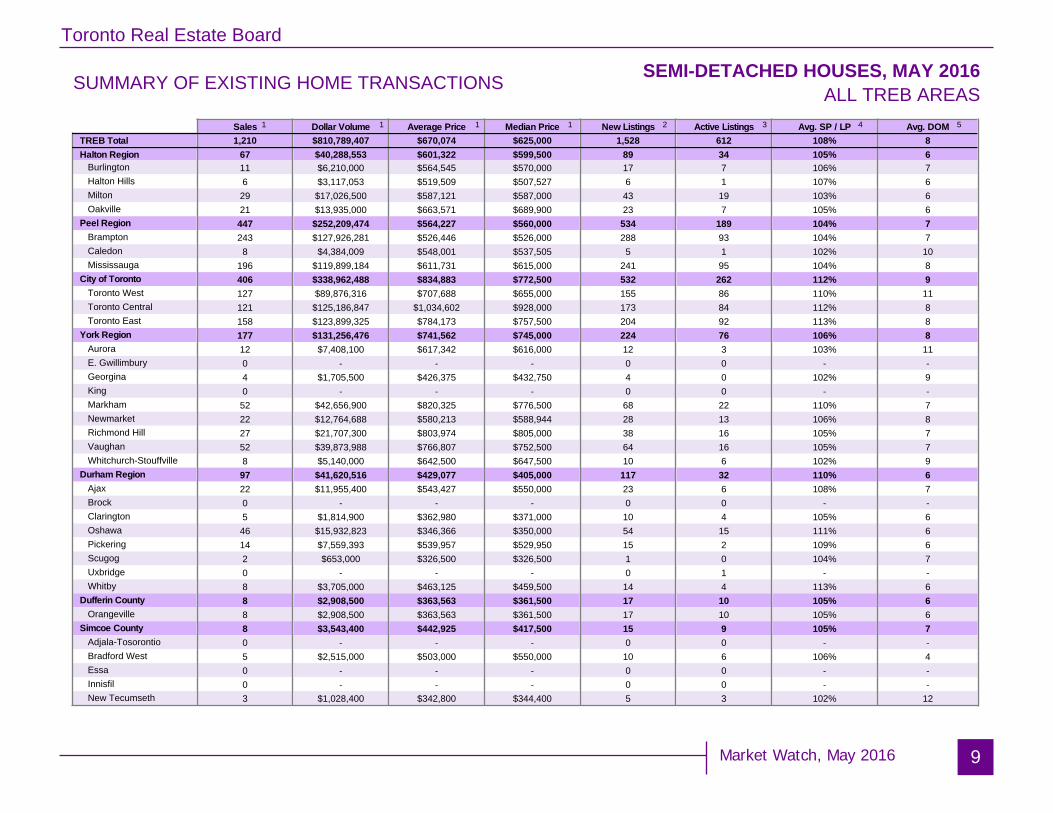
SUMMARY OF EXISTING HOME TRANSACTIONS SEMI-DETACHED HOUSES, MAY 2016ALL TREB AREAS
9
Sales Dollar Volume Average Price Median Price New Listings Active Listings Avg. SP / LP Avg. DOMTREB TotalHalton Region
BurlingtonHalton HillsMiltonOakville
Peel RegionBramptonCaledonMississauga
City of TorontoToronto WestToronto CentralToronto East
York RegionAuroraE. GwillimburyGeorginaKingMarkhamNewmarketRichmond HillVaughanWhitchurch-Stouffville
Durham RegionAjaxBrockClaringtonOshawaPickeringScugogUxbridgeWhitby
Dufferin CountyOrangeville
Simcoe CountyAdjala-TosorontioBradford WestGwillimburyEssaInnisfilNew Tecumseth
1,210 $810,789,407 $670,074 $625,000 1,528 612 108% 867 $40,288,553 $601,322 $599,500 89 34 105% 611 $6,210,000 $564,545 $570,000 17 7 106% 76 $3,117,053 $519,509 $507,527 6 1 107% 629 $17,026,500 $587,121 $587,000 43 19 103% 621 $13,935,000 $663,571 $689,900 23 7 105% 6
447 $252,209,474 $564,227 $560,000 534 189 104% 7243 $127,926,281 $526,446 $526,000 288 93 104% 78 $4,384,009 $548,001 $537,505 5 1 102% 10
196 $119,899,184 $611,731 $615,000 241 95 104% 8406 $338,962,488 $834,883 $772,500 532 262 112% 9127 $89,876,316 $707,688 $655,000 155 86 110% 11121 $125,186,847 $1,034,602 $928,000 173 84 112% 8158 $123,899,325 $784,173 $757,500 204 92 113% 8177 $131,256,476 $741,562 $745,000 224 76 106% 812 $7,408,100 $617,342 $616,000 12 3 103% 110 - - - 0 0 - -4 $1,705,500 $426,375 $432,750 4 0 102% 90 - - - 0 0 - -52 $42,656,900 $820,325 $776,500 68 22 110% 722 $12,764,688 $580,213 $588,944 28 13 106% 827 $21,707,300 $803,974 $805,000 38 16 105% 752 $39,873,988 $766,807 $752,500 64 16 105% 78 $5,140,000 $642,500 $647,500 10 6 102% 997 $41,620,516 $429,077 $405,000 117 32 110% 622 $11,955,400 $543,427 $550,000 23 6 108% 70 - - - 0 0 - -5 $1,814,900 $362,980 $371,000 10 4 105% 646 $15,932,823 $346,366 $350,000 54 15 111% 614 $7,559,393 $539,957 $529,950 15 2 109% 62 $653,000 $326,500 $326,500 1 0 104% 70 - - - 0 1 - -8 $3,705,000 $463,125 $459,500 14 4 113% 68 $2,908,500 $363,563 $361,500 17 10 105% 68 $2,908,500 $363,563 $361,500 17 10 105% 68 $3,543,400 $442,925 $417,500 15 9 105% 70 - - - 0 0 - -5 $2,515,000 $503,000 $550,000 10 6 106% 40 - - - 0 0 - -0 - - - 0 0 - -3 $1,028,400 $342,800 $344,400 5 3 102% 12
1 1 1 1 2 3 4 5

Toronto Real Estate Board
Market Watch, May 2016
SUMMARY OF EXISTING HOME TRANSACTIONS SEMI-DETACHED HOUSES, MAY 2016CITY OF TORONTO MUNICIPAL BREAKDOWN
10
Sales Dollar Volume Average Price Median Price New Listings Active Listings Avg. SP / LP Avg. DOMTREB TotalCity of Toronto TotalToronto West
Toronto W01Toronto W02Toronto W03Toronto W04Toronto W05Toronto W06Toronto W07Toronto W08Toronto W09Toronto W10
Toronto CentralToronto C01Toronto C02Toronto C03Toronto C04Toronto C06Toronto C07Toronto C08Toronto C09Toronto C10Toronto C11Toronto C12Toronto C13Toronto C14Toronto C15
Toronto EastToronto E01Toronto E02Toronto E03Toronto E04Toronto E05Toronto E06Toronto E07Toronto E08Toronto E09Toronto E10Toronto E11
1,210 $810,789,407 $670,074 $625,000 1,528 612 108% 8406 $338,962,488 $834,883 $772,500 532 262 112% 9127 $89,876,316 $707,688 $655,000 155 86 110% 1110 $10,585,999 $1,058,600 $1,082,556 13 5 114% 1023 $19,322,620 $840,114 $815,000 38 19 122% 832 $21,291,600 $665,363 $637,500 36 21 108% 1312 $7,539,499 $628,292 $631,000 8 0 106% 1035 $21,362,136 $610,347 $590,000 43 32 104% 117 $4,968,612 $709,802 $710,000 7 3 107% 230 - - - 0 0 - -3 $2,073,000 $691,000 $695,000 4 3 118% 32 $1,151,000 $575,500 $575,500 2 2 107% 153 $1,581,850 $527,283 $528,000 4 1 101% 6
121 $125,186,847 $1,034,602 $928,000 173 84 112% 824 $26,430,275 $1,101,261 $1,021,408 42 24 113% 916 $21,521,034 $1,345,065 $1,237,500 27 12 106% 910 $7,943,000 $794,300 $765,000 14 10 122% 88 $10,191,000 $1,273,875 $1,225,000 10 3 108% 60 - - - 1 0 - -5 $3,744,500 $748,900 $762,000 8 5 105% 38 $8,195,711 $1,024,464 $960,756 8 5 105% 202 $3,360,000 $1,680,000 $1,680,000 5 4 99% 912 $12,856,527 $1,071,377 $1,049,500 18 7 123% 65 $6,271,450 $1,254,290 $1,266,000 6 1 125% 41 $755,000 $755,000 $755,000 1 0 120% 69 $6,172,150 $685,794 $682,000 8 1 109% 71 $1,060,000 $1,060,000 $1,060,000 0 0 115% 720 $16,686,200 $834,310 $851,900 25 12 111% 8
158 $123,899,325 $784,173 $757,500 204 92 113% 841 $35,556,336 $867,228 $861,000 57 25 116% 838 $30,427,439 $800,722 $786,944 53 20 110% 733 $29,225,762 $885,629 $860,000 41 13 118% 612 $7,240,000 $603,333 $588,000 8 2 107% 79 $6,055,000 $672,778 $656,000 8 7 106% 132 $1,240,000 $620,000 $620,000 1 1 115% 79 $6,299,788 $699,976 $695,000 16 10 108% 101 $595,000 $595,000 $595,000 1 1 103% 93 $1,727,000 $575,667 $563,000 3 2 113% 74 $2,165,000 $541,250 $527,500 6 3 102% 46 $3,368,000 $561,333 $523,500 10 8 104% 16
1 1 1 1 2 3 4 5

Toronto Real Estate Board
Market Watch, May 2016
SUMMARY OF EXISTING HOME TRANSACTIONS CONDOMINIUM TOWNHOUSES, MAY 2016ALL TREB AREAS
11
Sales Dollar Volume Average Price Median Price New Listings Active Listings Avg. SP / LP Avg. DOMTREB TotalHalton Region
BurlingtonHalton HillsMiltonOakville
Peel RegionBramptonCaledonMississauga
City of TorontoToronto WestToronto CentralToronto East
York RegionAuroraE. GwillimburyGeorginaKingMarkhamNewmarketRichmond HillVaughanWhitchurch-Stouffville
Durham RegionAjaxBrockClaringtonOshawaPickeringScugogUxbridgeWhitby
Dufferin CountyOrangeville
Simcoe CountyAdjala-TosorontioBradford WestGwillimburyEssaInnisfilNew Tecumseth
889 $422,249,672 $474,972 $441,000 1,165 784 104% 1579 $34,861,415 $441,284 $401,000 108 82 102% 1636 $15,366,625 $426,851 $407,500 35 19 102% 124 $1,357,000 $339,250 $333,500 11 8 101% 128 $2,936,700 $367,088 $365,450 8 4 104% 1331 $15,201,090 $490,358 $410,000 54 51 101% 22
306 $129,579,826 $423,463 $420,000 357 209 103% 1486 $31,398,400 $365,098 $354,500 94 65 102% 161 $425,000 $425,000 $425,000 0 0 94% 36
219 $97,756,426 $446,376 $450,000 263 144 104% 13341 $182,909,530 $536,392 $480,000 471 349 104% 1589 $40,086,703 $450,412 $414,500 122 92 103% 20
135 $90,738,232 $672,135 $592,000 192 155 104% 14117 $52,084,595 $445,167 $441,500 157 102 107% 1278 $46,450,680 $595,522 $560,000 136 99 102% 1510 $6,225,700 $622,570 $503,000 19 14 103% 150 - - - 0 0 - -0 - - - 0 0 - -0 - - - 0 1 - -28 $17,828,900 $636,746 $624,400 57 45 104% 1512 $6,365,900 $530,492 $512,500 10 3 102% 1417 $10,119,180 $595,246 $565,000 29 19 102% 1510 $5,611,000 $561,100 $533,000 21 17 99% 191 $300,000 $300,000 $300,000 0 0 100% 1780 $27,128,321 $339,104 $349,000 91 44 105% 1513 $4,995,400 $384,262 $378,000 16 5 103% 112 $709,500 $354,750 $354,750 1 4 98% 723 $1,306,000 $435,333 $305,000 5 3 102% 925 $6,487,000 $259,480 $260,000 25 9 107% 1024 $9,256,421 $385,684 $381,750 30 13 105% 120 - - - 0 0 - -3 $1,139,000 $379,667 $449,000 2 3 100% 6710 $3,235,000 $323,500 $340,250 12 7 107% 124 $1,084,900 $271,225 $266,200 1 0 102% 214 $1,084,900 $271,225 $266,200 1 0 102% 211 $235,000 $235,000 $235,000 1 1 112% 350 - - - 0 0 - -0 - - - 0 0 - -0 - - - 0 0 - -0 - - - 0 0 - -1 $235,000 $235,000 $235,000 1 1 112% 35
1 1 1 1 2 3 4 5

Toronto Real Estate Board
Market Watch, May 2016
SUMMARY OF EXISTING HOME TRANSACTIONS CONDOMINIUM TOWNHOUSES, MAY 2016CITY OF TORONTO MUNICIPAL BREAKDOWN
12
Sales Dollar Volume Average Price Median Price New Listings Active Listings Avg. SP / LP Avg. DOMTREB TotalCity of Toronto TotalToronto West
Toronto W01Toronto W02Toronto W03Toronto W04Toronto W05Toronto W06Toronto W07Toronto W08Toronto W09Toronto W10
Toronto CentralToronto C01Toronto C02Toronto C03Toronto C04Toronto C06Toronto C07Toronto C08Toronto C09Toronto C10Toronto C11Toronto C12Toronto C13Toronto C14Toronto C15
Toronto EastToronto E01Toronto E02Toronto E03Toronto E04Toronto E05Toronto E06Toronto E07Toronto E08Toronto E09Toronto E10Toronto E11
889 $422,249,672 $474,972 $441,000 1,165 784 104% 15341 $182,909,530 $536,392 $480,000 471 349 104% 1589 $40,086,703 $450,412 $414,500 122 92 103% 204 $2,494,900 $623,725 $485,000 7 4 104% 3411 $6,446,603 $586,055 $558,103 11 6 104% 104 $1,466,000 $366,500 $344,000 4 1 100% 77 $2,693,500 $384,786 $380,000 5 4 103% 1329 $9,569,200 $329,972 $295,000 38 29 103% 2110 $7,921,400 $792,140 $716,000 18 15 102% 420 - - - 0 0 - -8 $3,941,000 $492,625 $503,000 14 8 107% 94 $1,793,000 $448,250 $436,500 6 8 106% 812 $3,761,100 $313,425 $344,000 19 17 99% 20
135 $90,738,232 $672,135 $592,000 192 155 104% 1423 $14,202,700 $617,509 $551,000 37 39 103% 88 $5,793,500 $724,188 $667,500 6 3 101% 191 $1,700,000 $1,700,000 $1,700,000 3 4 97% 160 - - - 0 4 - -3 $1,739,000 $579,667 $583,000 2 0 104% 3013 $7,554,500 $581,115 $495,000 16 20 104% 236 $4,886,300 $814,383 $670,450 15 11 99% 264 $5,682,500 $1,420,625 $1,505,750 3 1 106% 83 $2,407,000 $802,333 $592,000 5 3 114% 45 $2,895,674 $579,135 $546,000 6 4 102% 239 $7,202,500 $800,278 $800,000 18 17 100% 232 $1,287,058 $643,529 $643,529 3 2 104% 716 $10,196,700 $637,294 $607,656 18 10 103% 1142 $25,190,800 $599,781 $550,000 60 37 105% 10
117 $52,084,595 $445,167 $441,500 157 102 107% 127 $4,897,100 $699,586 $735,000 9 8 104% 222 $1,120,000 $560,000 $560,000 8 6 106% 51 $268,000 $268,000 $268,000 0 0 94% 3010 $4,357,000 $435,700 $470,250 17 10 107% 930 $14,520,215 $484,007 $485,000 37 26 109% 100 - - - 1 1 - -12 $6,281,100 $523,425 $490,300 14 9 110% 148 $3,103,500 $387,938 $419,250 11 5 111% 811 $3,158,500 $287,136 $304,000 17 11 102% 1818 $6,947,000 $385,944 $384,250 17 8 105% 1418 $7,432,180 $412,899 $387,500 26 18 106% 10
1 1 1 1 2 3 4 5

Toronto Real Estate Board
Market Watch, May 2016
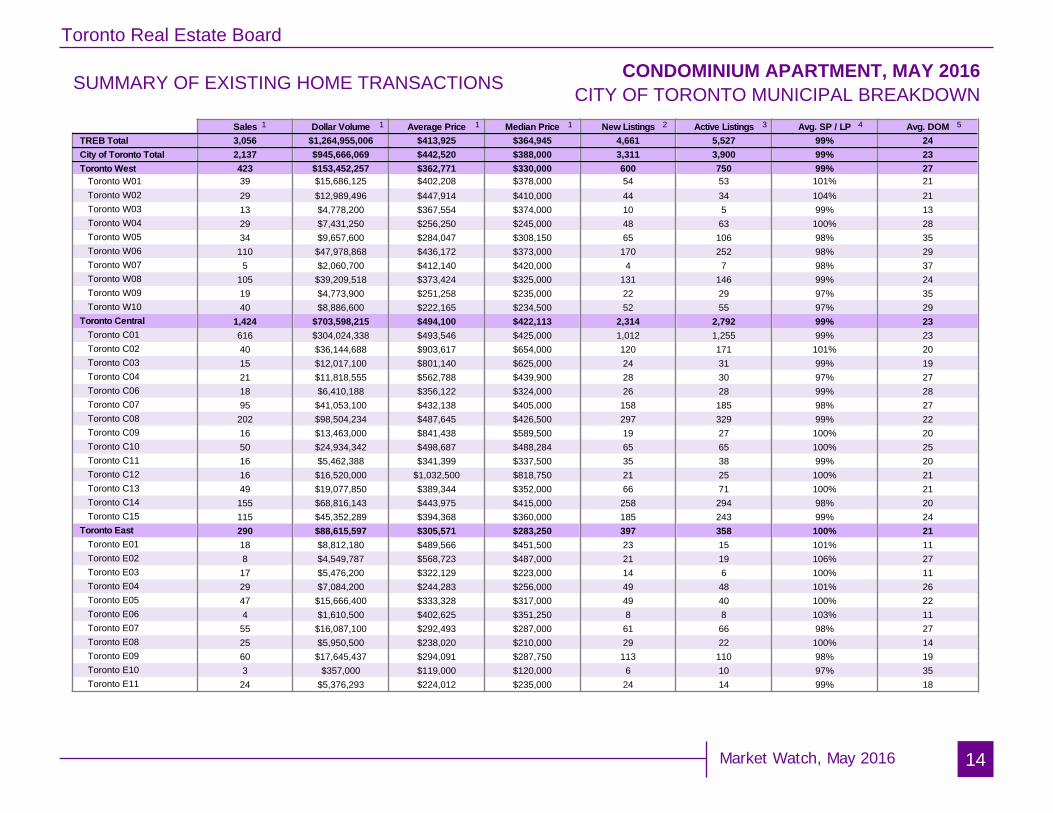
SUMMARY OF EXISTING HOME TRANSACTIONS CONDOMINIUM APARTMENT, MAY 2016ALL TREB AREAS
13
Sales Dollar Volume Average Price Median Price New Listings Active Listings Avg. SP / LP Avg. DOMTREB TotalHalton Region
BurlingtonHalton HillsMiltonOakville
Peel RegionBramptonCaledonMississauga
City of TorontoToronto WestToronto CentralToronto East
York RegionAuroraE. GwillimburyGeorginaKingMarkhamNewmarketRichmond HillVaughanWhitchurch-Stouffville
Durham RegionAjaxBrockClaringtonOshawaPickeringScugogUxbridgeWhitby
Dufferin CountyOrangeville
Simcoe CountyAdjala-TosorontioBradford WestGwillimburyEssaInnisfilNew Tecumseth
3,056 $1,264,955,006 $413,925 $364,945 4,661 5,527 99% 24103 $43,552,750 $422,842 $354,000 119 170 98% 2941 $16,207,300 $395,300 $354,900 47 59 99% 280 - - - 1 2 - -9 $2,959,750 $328,861 $319,000 12 13 99% 2053 $24,385,700 $460,108 $355,000 59 96 98% 31
407 $123,919,316 $304,470 $283,900 621 684 98% 2782 $21,947,300 $267,650 $253,500 73 75 98% 271 $442,000 $442,000 $442,000 2 3 98% 14
324 $101,530,016 $313,364 $286,625 546 606 98% 272,137 $945,666,069 $442,520 $388,000 3,311 3,900 99% 23423 $153,452,257 $362,771 $330,000 600 750 99% 27
1,424 $703,598,215 $494,100 $422,113 2,314 2,792 99% 23290 $88,615,597 $305,571 $283,250 397 358 100% 21337 $131,431,502 $390,004 $361,000 535 717 99% 274 $2,080,000 $520,000 $383,500 10 7 99% 490 - - - 0 0 - -1 $258,000 $258,000 $258,000 3 4 96% 112 $1,002,500 $501,250 $501,250 9 17 97% 20
130 $48,478,009 $372,908 $355,000 215 311 99% 248 $3,131,220 $391,403 $355,000 4 1 100% 1783 $30,306,600 $365,140 $325,000 147 173 98% 25
107 $44,886,173 $419,497 $390,000 146 199 98% 312 $1,289,000 $644,500 $644,500 1 5 100% 1568 $19,312,969 $284,014 $265,000 72 45 103% 1413 $3,669,900 $282,300 $265,000 18 13 104% 130 - - - 0 0 - -10 $2,731,030 $273,103 $247,500 8 11 102% 2511 $2,354,700 $214,064 $215,000 10 4 100% 1718 $5,362,339 $297,908 $283,000 17 9 103% 101 $441,500 $441,500 $441,500 1 1 103% 142 $563,000 $281,500 $281,500 2 0 101% 1513 $4,190,500 $322,346 $311,000 16 7 104% 100 - - - 0 0 - -0 - - - 0 0 - -4 $1,072,400 $268,100 $267,500 3 11 98% 1380 - - - 0 0 - -0 - - - 1 1 - -0 - - - 0 0 - -0 - - - 0 1 - -4 $1,072,400 $268,100 $267,500 2 9 98% 138
1 1 1 1 2 3 4 5
Toronto Real Estate Board
Market Watch, May 2016
SUMMARY OF EXISTING HOME TRANSACTIONS CONDOMINIUM APARTMENT, MAY 2016CITY OF TORONTO MUNICIPAL BREAKDOWN
14
Sales Dollar Volume Average Price Median Price New Listings Active Listings Avg. SP / LP Avg. DOMTREB TotalCity of Toronto TotalToronto West
Toronto W01Toronto W02Toronto W03Toronto W04Toronto W05Toronto W06Toronto W07Toronto W08Toronto W09Toronto W10
Toronto CentralToronto C01Toronto C02Toronto C03Toronto C04Toronto C06Toronto C07Toronto C08Toronto C09Toronto C10Toronto C11Toronto C12Toronto C13Toronto C14Toronto C15
Toronto EastToronto E01Toronto E02Toronto E03Toronto E04Toronto E05Toronto E06Toronto E07Toronto E08Toronto E09Toronto E10Toronto E11
3,056 $1,264,955,006 $413,925 $364,945 4,661 5,527 99% 242,137 $945,666,069 $442,520 $388,000 3,311 3,900 99% 23423 $153,452,257 $362,771 $330,000 600 750 99% 2739 $15,686,125 $402,208 $378,000 54 53 101% 2129 $12,989,496 $447,914 $410,000 44 34 104% 2113 $4,778,200 $367,554 $374,000 10 5 99% 1329 $7,431,250 $256,250 $245,000 48 63 100% 2834 $9,657,600 $284,047 $308,150 65 106 98% 35
110 $47,978,868 $436,172 $373,000 170 252 98% 295 $2,060,700 $412,140 $420,000 4 7 98% 37
105 $39,209,518 $373,424 $325,000 131 146 99% 2419 $4,773,900 $251,258 $235,000 22 29 97% 3540 $8,886,600 $222,165 $234,500 52 55 97% 29
1,424 $703,598,215 $494,100 $422,113 2,314 2,792 99% 23616 $304,024,338 $493,546 $425,000 1,012 1,255 99% 2340 $36,144,688 $903,617 $654,000 120 171 101% 2015 $12,017,100 $801,140 $625,000 24 31 99% 1921 $11,818,555 $562,788 $439,900 28 30 97% 2718 $6,410,188 $356,122 $324,000 26 28 99% 2895 $41,053,100 $432,138 $405,000 158 185 98% 27
202 $98,504,234 $487,645 $426,500 297 329 99% 2216 $13,463,000 $841,438 $589,500 19 27 100% 2050 $24,934,342 $498,687 $488,284 65 65 100% 2516 $5,462,388 $341,399 $337,500 35 38 99% 2016 $16,520,000 $1,032,500 $818,750 21 25 100% 2149 $19,077,850 $389,344 $352,000 66 71 100% 21
155 $68,816,143 $443,975 $415,000 258 294 98% 20115 $45,352,289 $394,368 $360,000 185 243 99% 24290 $88,615,597 $305,571 $283,250 397 358 100% 2118 $8,812,180 $489,566 $451,500 23 15 101% 118 $4,549,787 $568,723 $487,000 21 19 106% 2717 $5,476,200 $322,129 $223,000 14 6 100% 1129 $7,084,200 $244,283 $256,000 49 48 101% 2647 $15,666,400 $333,328 $317,000 49 40 100% 224 $1,610,500 $402,625 $351,250 8 8 103% 1155 $16,087,100 $292,493 $287,000 61 66 98% 2725 $5,950,500 $238,020 $210,000 29 22 100% 1460 $17,645,437 $294,091 $287,750 113 110 98% 193 $357,000 $119,000 $120,000 6 10 97% 3524 $5,376,293 $224,012 $235,000 24 14 99% 18
1 1 1 1 2 3 4 5
Toronto Real Estate Board
Market Watch, May 2016
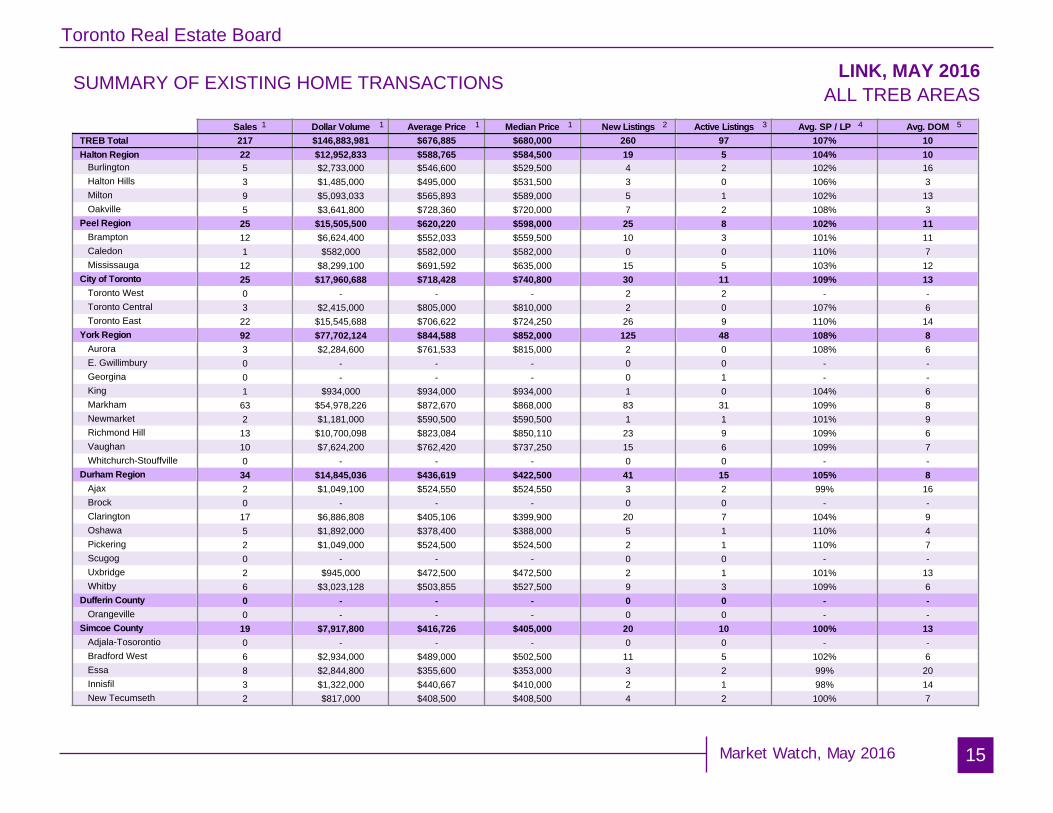
SUMMARY OF EXISTING HOME TRANSACTIONS LINK, MAY 2016ALL TREB AREAS
15
Sales Dollar Volume Average Price Median Price New Listings Active Listings Avg. SP / LP Avg. DOMTREB TotalHalton Region
BurlingtonHalton HillsMiltonOakville
Peel RegionBramptonCaledonMississauga
City of TorontoToronto WestToronto CentralToronto East
York RegionAuroraE. GwillimburyGeorginaKingMarkhamNewmarketRichmond HillVaughanWhitchurch-Stouffville
Durham RegionAjaxBrockClaringtonOshawaPickeringScugogUxbridgeWhitby
Dufferin CountyOrangeville
Simcoe CountyAdjala-TosorontioBradford WestGwillimburyEssaInnisfilNew Tecumseth
217 $146,883,981 $676,885 $680,000 260 97 107% 1022 $12,952,833 $588,765 $584,500 19 5 104% 105 $2,733,000 $546,600 $529,500 4 2 102% 163 $1,485,000 $495,000 $531,500 3 0 106% 39 $5,093,033 $565,893 $589,000 5 1 102% 135 $3,641,800 $728,360 $720,000 7 2 108% 325 $15,505,500 $620,220 $598,000 25 8 102% 1112 $6,624,400 $552,033 $559,500 10 3 101% 111 $582,000 $582,000 $582,000 0 0 110% 712 $8,299,100 $691,592 $635,000 15 5 103% 1225 $17,960,688 $718,428 $740,800 30 11 109% 130 - - - 2 2 - -3 $2,415,000 $805,000 $810,000 2 0 107% 622 $15,545,688 $706,622 $724,250 26 9 110% 1492 $77,702,124 $844,588 $852,000 125 48 108% 83 $2,284,600 $761,533 $815,000 2 0 108% 60 - - - 0 0 - -0 - - - 0 1 - -1 $934,000 $934,000 $934,000 1 0 104% 663 $54,978,226 $872,670 $868,000 83 31 109% 82 $1,181,000 $590,500 $590,500 1 1 101% 913 $10,700,098 $823,084 $850,110 23 9 109% 610 $7,624,200 $762,420 $737,250 15 6 109% 70 - - - 0 0 - -34 $14,845,036 $436,619 $422,500 41 15 105% 82 $1,049,100 $524,550 $524,550 3 2 99% 160 - - - 0 0 - -17 $6,886,808 $405,106 $399,900 20 7 104% 95 $1,892,000 $378,400 $388,000 5 1 110% 42 $1,049,000 $524,500 $524,500 2 1 110% 70 - - - 0 0 - -2 $945,000 $472,500 $472,500 2 1 101% 136 $3,023,128 $503,855 $527,500 9 3 109% 60 - - - 0 0 - -0 - - - 0 0 - -19 $7,917,800 $416,726 $405,000 20 10 100% 130 - - - 0 0 - -6 $2,934,000 $489,000 $502,500 11 5 102% 68 $2,844,800 $355,600 $353,000 3 2 99% 203 $1,322,000 $440,667 $410,000 2 1 98% 142 $817,000 $408,500 $408,500 4 2 100% 7
1 1 1 1 2 3 4 5

Toronto Real Estate Board
Market Watch, May 2016
SUMMARY OF EXISTING HOME TRANSACTIONS LINK, MAY 2016CITY OF TORONTO MUNICIPAL BREAKDOWN
16
Sales Dollar Volume Average Price Median Price New Listings Active Listings Avg. SP / LP Avg. DOMTREB TotalCity of Toronto TotalToronto West
Toronto W01Toronto W02Toronto W03Toronto W04Toronto W05Toronto W06Toronto W07Toronto W08Toronto W09Toronto W10
Toronto CentralToronto C01Toronto C02Toronto C03Toronto C04Toronto C06Toronto C07Toronto C08Toronto C09Toronto C10Toronto C11Toronto C12Toronto C13Toronto C14Toronto C15
Toronto EastToronto E01Toronto E02Toronto E03Toronto E04Toronto E05Toronto E06Toronto E07Toronto E08Toronto E09Toronto E10Toronto E11
217 $146,883,981 $676,885 $680,000 260 97 107% 1025 $17,960,688 $718,428 $740,800 30 11 109% 130 - - - 2 2 - -0 - - - 0 0 - -0 - - - 0 0 - -0 - - - 0 0 - -0 - - - 0 0 - -0 - - - 1 1 - -0 - - - 0 0 - -0 - - - 0 0 - -0 - - - 0 0 - -0 - - - 0 0 - -0 - - - 1 1 - -3 $2,415,000 $805,000 $810,000 2 0 107% 60 - - - 0 0 - -0 - - - 0 0 - -0 - - - 0 0 - -0 - - - 0 0 - -0 - - - 0 0 - -3 $2,415,000 $805,000 $810,000 2 0 107% 60 - - - 0 0 - -0 - - - 0 0 - -0 - - - 0 0 - -0 - - - 0 0 - -0 - - - 0 0 - -0 - - - 0 0 - -0 - - - 0 0 - -0 - - - 0 0 - -22 $15,545,688 $706,622 $724,250 26 9 110% 140 - - - 0 0 - -0 - - - 0 0 - -0 - - - 0 0 - -0 - - - 0 0 - -8 $6,331,500 $791,438 $804,000 6 2 113% 90 - - - 0 0 - -10 $6,971,688 $697,169 $693,000 16 4 108% 92 $1,101,000 $550,500 $550,500 2 1 111% 660 - - - 0 0 - -0 - - - 1 1 - -2 $1,141,500 $570,750 $570,750 1 1 107% 7
1 1 1 1 2 3 4 5
Toronto Real Estate Board
Market Watch, May 2016
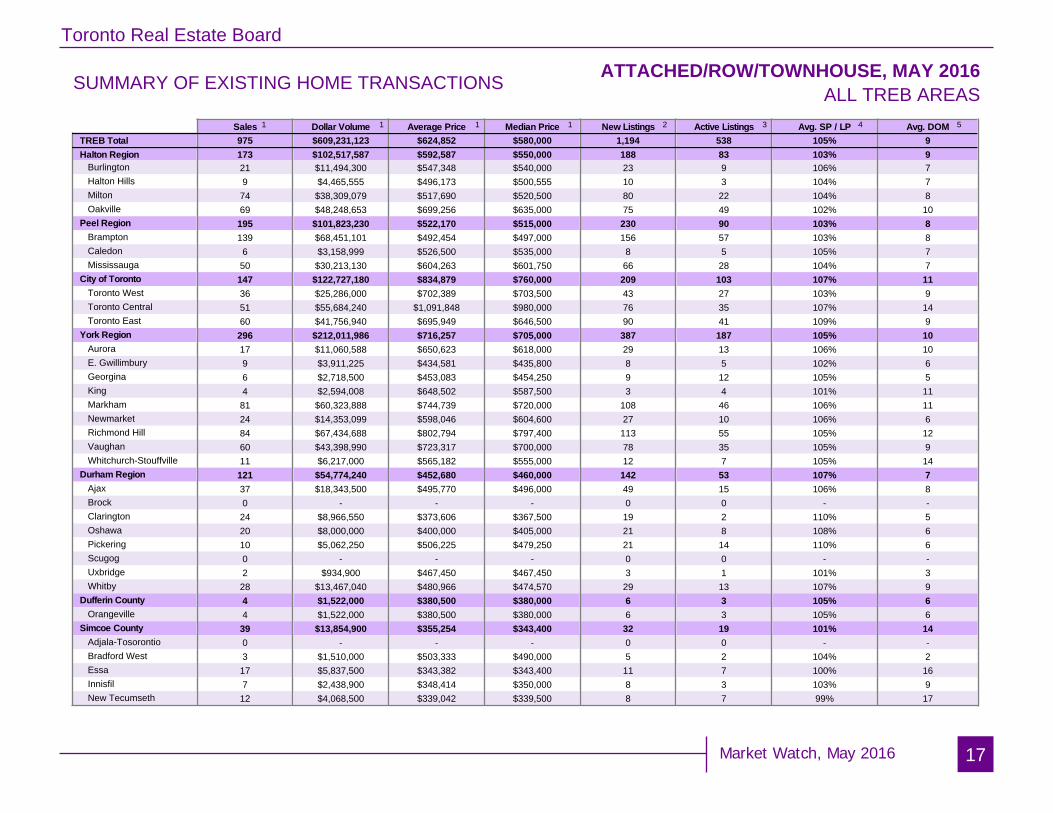
SUMMARY OF EXISTING HOME TRANSACTIONS ATTACHED/ROW/TOWNHOUSE, MAY 2016ALL TREB AREAS
17
Sales Dollar Volume Average Price Median Price New Listings Active Listings Avg. SP / LP Avg. DOMTREB TotalHalton Region
BurlingtonHalton HillsMiltonOakville
Peel RegionBramptonCaledonMississauga
City of TorontoToronto WestToronto CentralToronto East
York RegionAuroraE. GwillimburyGeorginaKingMarkhamNewmarketRichmond HillVaughanWhitchurch-Stouffville
Durham RegionAjaxBrockClaringtonOshawaPickeringScugogUxbridgeWhitby
Dufferin CountyOrangeville
Simcoe CountyAdjala-TosorontioBradford WestGwillimburyEssaInnisfilNew Tecumseth
975 $609,231,123 $624,852 $580,000 1,194 538 105% 9173 $102,517,587 $592,587 $550,000 188 83 103% 921 $11,494,300 $547,348 $540,000 23 9 106% 79 $4,465,555 $496,173 $500,555 10 3 104% 774 $38,309,079 $517,690 $520,500 80 22 104% 869 $48,248,653 $699,256 $635,000 75 49 102% 10
195 $101,823,230 $522,170 $515,000 230 90 103% 8139 $68,451,101 $492,454 $497,000 156 57 103% 86 $3,158,999 $526,500 $535,000 8 5 105% 750 $30,213,130 $604,263 $601,750 66 28 104% 7
147 $122,727,180 $834,879 $760,000 209 103 107% 1136 $25,286,000 $702,389 $703,500 43 27 103% 951 $55,684,240 $1,091,848 $980,000 76 35 107% 1460 $41,756,940 $695,949 $646,500 90 41 109% 9
296 $212,011,986 $716,257 $705,000 387 187 105% 1017 $11,060,588 $650,623 $618,000 29 13 106% 109 $3,911,225 $434,581 $435,800 8 5 102% 66 $2,718,500 $453,083 $454,250 9 12 105% 54 $2,594,008 $648,502 $587,500 3 4 101% 1181 $60,323,888 $744,739 $720,000 108 46 106% 1124 $14,353,099 $598,046 $604,600 27 10 106% 684 $67,434,688 $802,794 $797,400 113 55 105% 1260 $43,398,990 $723,317 $700,000 78 35 105% 911 $6,217,000 $565,182 $555,000 12 7 105% 14
121 $54,774,240 $452,680 $460,000 142 53 107% 737 $18,343,500 $495,770 $496,000 49 15 106% 80 - - - 0 0 - -24 $8,966,550 $373,606 $367,500 19 2 110% 520 $8,000,000 $400,000 $405,000 21 8 108% 610 $5,062,250 $506,225 $479,250 21 14 110% 60 - - - 0 0 - -2 $934,900 $467,450 $467,450 3 1 101% 328 $13,467,040 $480,966 $474,570 29 13 107% 94 $1,522,000 $380,500 $380,000 6 3 105% 64 $1,522,000 $380,500 $380,000 6 3 105% 639 $13,854,900 $355,254 $343,400 32 19 101% 140 - - - 0 0 - -3 $1,510,000 $503,333 $490,000 5 2 104% 217 $5,837,500 $343,382 $343,400 11 7 100% 167 $2,438,900 $348,414 $350,000 8 3 103% 912 $4,068,500 $339,042 $339,500 8 7 99% 17
1 1 1 1 2 3 4 5

Toronto Real Estate Board
Market Watch, May 2016
SUMMARY OF EXISTING HOME TRANSACTIONS ATTACHED/ROW/TOWNHOUSE, MAY 2016CITY OF TORONTO MUNICIPAL BREAKDOWN
18
Sales Dollar Volume Average Price Median Price New Listings Active Listings Avg. SP / LP Avg. DOMTREB TotalCity of Toronto TotalToronto West
Toronto W01Toronto W02Toronto W03Toronto W04Toronto W05Toronto W06Toronto W07Toronto W08Toronto W09Toronto W10
Toronto CentralToronto C01Toronto C02Toronto C03Toronto C04Toronto C06Toronto C07Toronto C08Toronto C09Toronto C10Toronto C11Toronto C12Toronto C13Toronto C14Toronto C15
Toronto EastToronto E01Toronto E02Toronto E03Toronto E04Toronto E05Toronto E06Toronto E07Toronto E08Toronto E09Toronto E10Toronto E11
975 $609,231,123 $624,852 $580,000 1,194 538 105% 9147 $122,727,180 $834,879 $760,000 209 103 107% 1136 $25,286,000 $702,389 $703,500 43 27 103% 93 $2,427,000 $809,000 $745,000 8 9 108% 92 $1,405,000 $702,500 $702,500 5 4 108% 52 $1,190,000 $595,000 $595,000 4 3 98% 101 $500,000 $500,000 $500,000 2 1 100% 75 $2,674,500 $534,900 $540,000 4 2 103% 129 $6,636,500 $737,389 $799,000 8 4 104% 85 $3,693,000 $738,600 $725,000 4 1 103% 145 $4,544,000 $908,800 $808,000 4 2 102% 122 $1,225,000 $612,500 $612,500 1 0 101% 52 $991,000 $495,500 $495,500 3 1 102% 551 $55,684,240 $1,091,848 $980,000 76 35 107% 1421 $21,906,490 $1,043,166 $975,000 29 12 108% 223 $3,631,500 $1,210,500 $882,500 4 3 100% 120 - - - 0 0 - -3 $4,001,000 $1,333,667 $1,690,000 3 1 97% 50 - - - 0 0 - -5 $5,393,000 $1,078,600 $970,000 7 2 110% 106 $6,189,250 $1,031,542 $1,036,000 10 7 106% 82 $3,230,000 $1,615,000 $1,615,000 3 1 116% 81 $921,000 $921,000 $921,000 2 1 106% 62 $2,040,000 $1,020,000 $1,020,000 1 0 100% 100 - - - 0 0 - -3 $2,401,000 $800,333 $830,000 5 2 100% 65 $5,971,000 $1,194,200 $1,195,000 12 6 115% 70 - - - 0 0 - -60 $41,756,940 $695,949 $646,500 90 41 109% 912 $11,638,785 $969,899 $947,500 20 11 112% 89 $7,468,015 $829,779 $800,000 13 4 110% 73 $1,832,839 $610,946 $560,839 2 1 122% 37 $4,444,300 $634,900 $645,000 15 7 106% 52 $1,413,800 $706,900 $706,900 5 3 116% 80 - - - 0 0 - -4 $2,424,500 $606,125 $580,500 5 2 108% 85 $2,951,001 $590,200 $565,000 6 4 104% 183 $1,686,800 $562,267 $553,800 2 0 96% 203 $1,701,000 $567,000 $556,000 4 3 99% 2512 $6,195,900 $516,325 $477,500 18 6 109% 6
1 1 1 1 2 3 4 5

Toronto Real Estate Board
Market Watch, May 2016
SUMMARY OF EXISTING HOME TRANSACTIONS CO-OP APARTMENT, MAY 2016ALL TREB AREAS
19
Sales Dollar Volume Average Price Median Price New Listings Active Listings Avg. SP / LP Average DOMTREB TotalHalton Region
BurlingtonHalton HillsMiltonOakville
Peel RegionBramptonCaledonMississauga
City of TorontoToronto WestToronto CentralToronto East
York RegionAuroraE. GwillimburyGeorginaKingMarkhamNewmarketRichmond HillVaughanWhitchurch-Stouffville
Durham RegionAjaxBrockClaringtonOshawaPickeringScugogUxbridgeWhitby
Dufferin CountyOrangeville
Simcoe CountyAdjala-TosorontioBradford WestGwillimburyEssaInnisfilNew Tecumseth
7 $1,432,500 $204,643 $138,000 21 31 98% 271 $252,500 $252,500 $252,500 0 0 97% 331 $252,500 $252,500 $252,500 0 0 97% 330 - - - 0 0 - -0 - - - 0 0 - -0 - - - 0 0 - -0 - - - 2 4 - -0 - - - 0 0 - -0 - - - 0 0 - -0 - - - 2 4 - -6 $1,180,000 $196,667 $130,000 19 27 98% 261 $138,000 $138,000 $138,000 4 8 92% 771 $551,000 $551,000 $551,000 14 19 99% 144 $491,000 $122,750 $121,000 1 0 99% 160 - - - 0 0 - -0 - - - 0 0 - -0 - - - 0 0 - -0 - - - 0 0 - -0 - - - 0 0 - -0 - - - 0 0 - -0 - - - 0 0 - -0 - - - 0 0 - -0 - - - 0 0 - -0 - - - 0 0 - -0 - - - 0 0 - -0 - - - 0 0 - -0 - - - 0 0 - -0 - - - 0 0 - -0 - - - 0 0 - -0 - - - 0 0 - -0 - - - 0 0 - -0 - - - 0 0 - -0 - - - 0 0 - -0 - - - 0 0 - -0 - - - 0 0 - -0 - - - 0 0 - -0 - - - 0 0 - -0 - - - 0 0 - -0 - - - 0 0 - -0 - - - 0 0 - -0 - - - 0 0 - -
1 1 1 1 2 3 4 5
Toronto Real Estate Board
Market Watch, May 2016
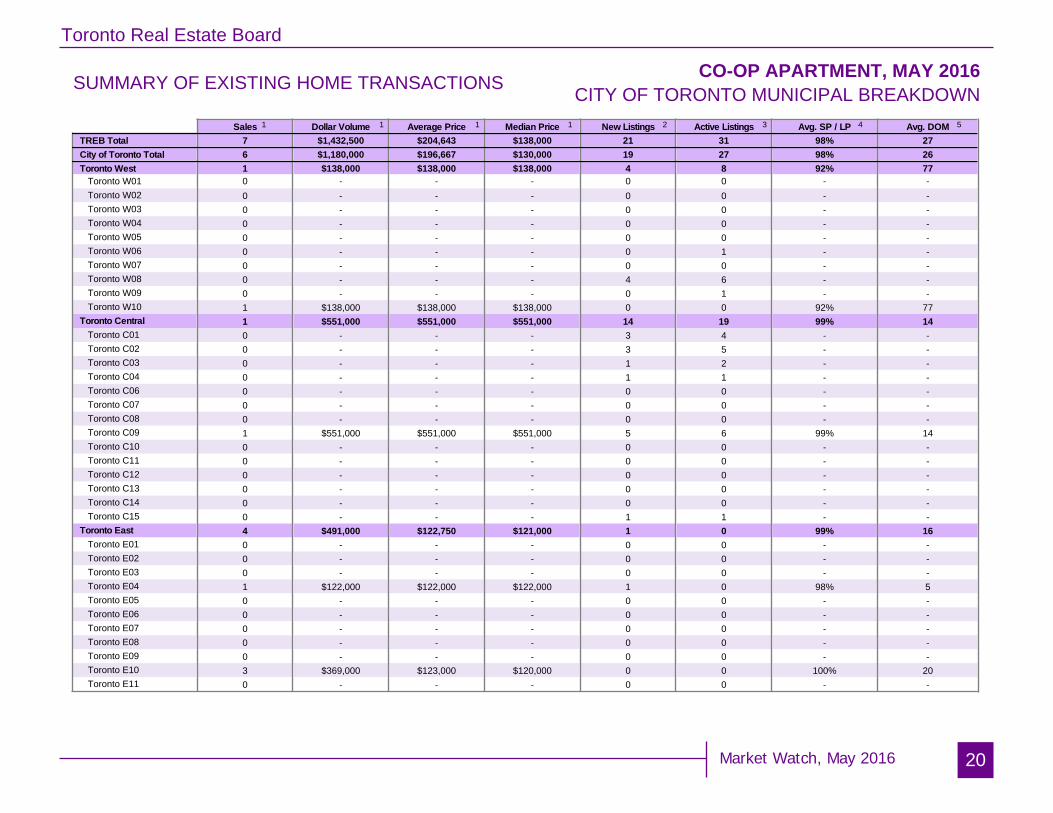
SUMMARY OF EXISTING HOME TRANSACTIONS CO-OP APARTMENT, MAY 2016CITY OF TORONTO MUNICIPAL BREAKDOWN
20
Sales Dollar Volume Average Price Median Price New Listings Active Listings Avg. SP / LP Avg. DOMTREB TotalCity of Toronto TotalToronto West
Toronto W01Toronto W02Toronto W03Toronto W04Toronto W05Toronto W06Toronto W07Toronto W08Toronto W09Toronto W10
Toronto CentralToronto C01Toronto C02Toronto C03Toronto C04Toronto C06Toronto C07Toronto C08Toronto C09Toronto C10Toronto C11Toronto C12Toronto C13Toronto C14Toronto C15
Toronto EastToronto E01Toronto E02Toronto E03Toronto E04Toronto E05Toronto E06Toronto E07Toronto E08Toronto E09Toronto E10Toronto E11
7 $1,432,500 $204,643 $138,000 21 31 98% 276 $1,180,000 $196,667 $130,000 19 27 98% 261 $138,000 $138,000 $138,000 4 8 92% 770 - - - 0 0 - -0 - - - 0 0 - -0 - - - 0 0 - -0 - - - 0 0 - -0 - - - 0 0 - -0 - - - 0 1 - -0 - - - 0 0 - -0 - - - 4 6 - -0 - - - 0 1 - -1 $138,000 $138,000 $138,000 0 0 92% 771 $551,000 $551,000 $551,000 14 19 99% 140 - - - 3 4 - -0 - - - 3 5 - -0 - - - 1 2 - -0 - - - 1 1 - -0 - - - 0 0 - -0 - - - 0 0 - -0 - - - 0 0 - -1 $551,000 $551,000 $551,000 5 6 99% 140 - - - 0 0 - -0 - - - 0 0 - -0 - - - 0 0 - -0 - - - 0 0 - -0 - - - 0 0 - -0 - - - 1 1 - -4 $491,000 $122,750 $121,000 1 0 99% 160 - - - 0 0 - -0 - - - 0 0 - -0 - - - 0 0 - -1 $122,000 $122,000 $122,000 1 0 98% 50 - - - 0 0 - -0 - - - 0 0 - -0 - - - 0 0 - -0 - - - 0 0 - -0 - - - 0 0 - -3 $369,000 $123,000 $120,000 0 0 100% 200 - - - 0 0 - -
1 1 1 1 2 3 4 5
Toronto Real Estate Board
Market Watch, May 2016
SUMMARY OF EXISTING HOME TRANSACTIONS DETACHED CONDOMINIUM, MAY 2016ALL TREB AREAS
21
Sales Dollar Volume Average Price Median Price New Listings Active Listings Avg. SP / LP Avg. DOMTREB TotalHalton Region
BurlingtonHalton HillsMiltonOakville
Peel RegionBramptonCaledonMississauga
City of TorontoToronto WestToronto CentralToronto East
York RegionAuroraE. GwillimburyGeorginaKingMarkhamNewmarketRichmond HillVaughanWhitchurch-Stouffville
Durham RegionAjaxBrockClaringtonOshawaPickeringScugogUxbridgeWhitby
Dufferin CountyOrangeville
Simcoe CountyAdjala-TosorontioBradford WestGwillimburyEssaInnisfilNew Tecumseth
7 $5,255,500 $750,786 $525,000 16 23 98% 250 - - - 1 1 - -0 - - - 1 1 - -0 - - - 0 0 - -0 - - - 0 0 - -0 - - - 0 0 - -0 - - - 4 7 - -0 - - - 3 4 - -0 - - - 0 0 - -0 - - - 1 3 - -2 $2,875,000 $1,437,500 $1,437,500 1 0 99% 200 - - - 0 0 - -2 $2,875,000 $1,437,500 $1,437,500 1 0 99% 200 - - - 0 0 - -0 - - - 2 1 - -0 - - - 0 0 - -0 - - - 0 0 - -0 - - - 0 0 - -0 - - - 0 0 - -0 - - - 0 0 - -0 - - - 0 0 - -0 - - - 0 0 - -0 - - - 2 1 - -0 - - - 0 0 - -0 - - - 0 0 - -0 - - - 0 0 - -0 - - - 0 0 - -0 - - - 0 0 - -0 - - - 0 0 - -0 - - - 0 0 - -0 - - - 0 0 - -0 - - - 0 0 - -0 - - - 0 0 - -0 - - - 0 0 - -0 - - - 0 0 - -5 $2,380,500 $476,100 $468,000 8 14 98% 270 - - - 0 0 - -0 - - - 0 0 - -0 - - - 0 0 - -0 - - - 0 0 - -5 $2,380,500 $476,100 $468,000 8 14 98% 27
1 1 1 1 2 3 4 5

Toronto Real Estate Board
Market Watch, May 2016
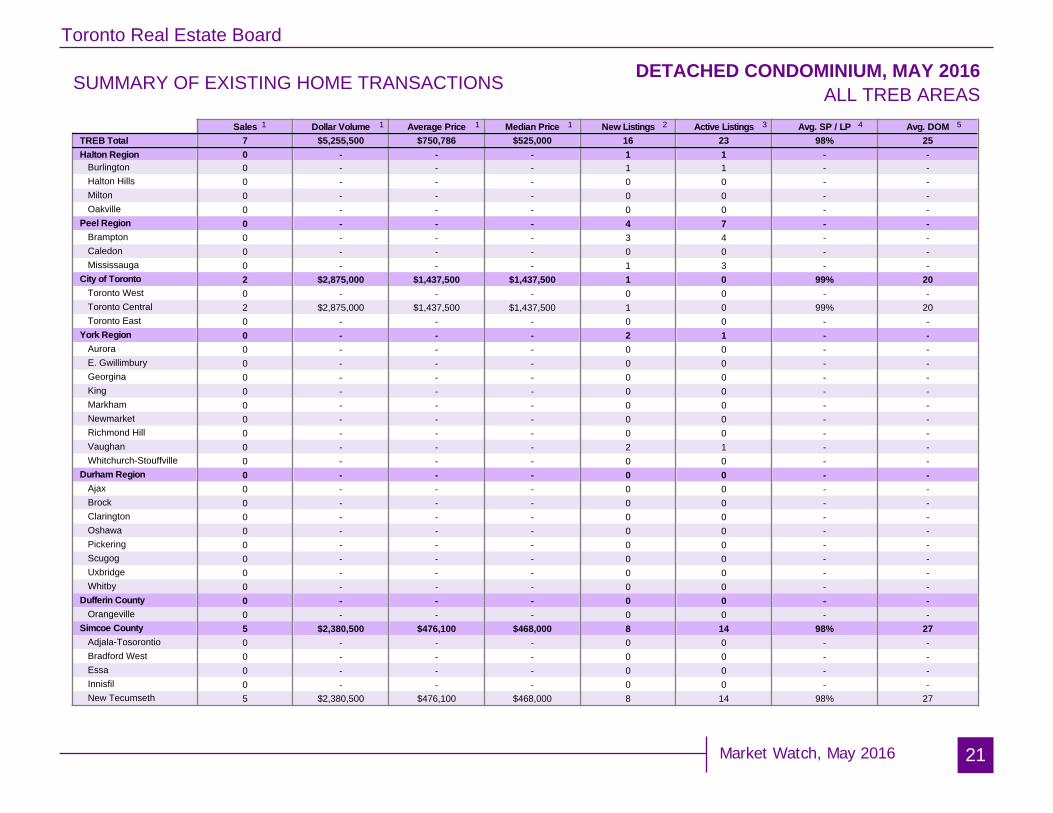
SUMMARY OF EXISTING HOME TRANSACTIONS DETACHED CONDOMINIUM, MAY 2016CITY OF TORONTO MUNICIPAL BREAKDOWN
22
Sales Dollar Volume Average Price Median Price New Listings Active Listings Avg. SP / LP Avg. DOMTREB TotalCity of Toronto TotalToronto West
Toronto W01Toronto W02Toronto W03Toronto W04Toronto W05Toronto W06Toronto W07Toronto W08Toronto W09Toronto W10
Toronto CentralToronto C01Toronto C02Toronto C03Toronto C04Toronto C06Toronto C07Toronto C08Toronto C09Toronto C10Toronto C11Toronto C12Toronto C13Toronto C14Toronto C15
Toronto EastToronto E01Toronto E02Toronto E03Toronto E04Toronto E05Toronto E06Toronto E07Toronto E08Toronto E09Toronto E10Toronto E11
7 $5,255,500 $750,786 $525,000 16 23 98% 252 $2,875,000 $1,437,500 $1,437,500 1 0 99% 200 - - - 0 0 - -0 - - - 0 0 - -0 - - - 0 0 - -0 - - - 0 0 - -0 - - - 0 0 - -0 - - - 0 0 - -0 - - - 0 0 - -0 - - - 0 0 - -0 - - - 0 0 - -0 - - - 0 0 - -0 - - - 0 0 - -2 $2,875,000 $1,437,500 $1,437,500 1 0 99% 200 - - - 0 0 - -0 - - - 0 0 - -0 - - - 0 0 - -0 - - - 0 0 - -0 - - - 0 0 - -0 - - - 0 0 - -0 - - - 0 0 - -0 - - - 0 0 - -0 - - - 0 0 - -0 - - - 0 0 - -1 $2,350,000 $2,350,000 $2,350,000 0 0 100% 200 - - - 0 0 - -0 - - - 0 0 - -1 $525,000 $525,000 $525,000 1 0 94% 200 - - - 0 0 - -0 - - - 0 0 - -0 - - - 0 0 - -0 - - - 0 0 - -0 - - - 0 0 - -0 - - - 0 0 - -0 - - - 0 0 - -0 - - - 0 0 - -0 - - - 0 0 - -0 - - - 0 0 - -0 - - - 0 0 - -0 - - - 0 0 - -
1 1 1 1 2 3 4 5

Toronto Real Estate Board
Market Watch, May 2016
SUMMARY OF EXISTING HOME TRANSACTIONS CO-OWNERSHIP APARTMENT, MAY 2016ALL TREB AREAS
23
Sales Dollar Volume Average Price Median Price New Listings Active Listings Avg. SP / LP Avg. DOMTREB TotalHalton Region
BurlingtonHalton HillsMiltonOakville
Peel RegionBramptonCaledonMississauga
City of TorontoToronto WestToronto CentralToronto East
York RegionAuroraE. GwillimburyGeorginaKingMarkhamNewmarketRichmond HillVaughanWhitchurch-Stouffville
Durham RegionAjaxBrockClaringtonOshawaPickeringScugogUxbridgeWhitby
Dufferin CountyOrangeville
Simcoe CountyAdjala-TosorontioBradford WestGwillimburyEssaInnisfilNew Tecumseth
9 $2,763,500 $307,056 $304,500 13 16 97% 430 - - - 0 0 - -0 - - - 0 0 - -0 - - - 0 0 - -0 - - - 0 0 - -0 - - - 0 0 - -0 - - - 0 0 - -0 - - - 0 0 - -0 - - - 0 0 - -0 - - - 0 0 - -9 $2,763,500 $307,056 $304,500 13 16 97% 430 - - - 1 1 - -9 $2,763,500 $307,056 $304,500 12 15 97% 430 - - - 0 0 - -0 - - - 0 0 - -0 - - - 0 0 - -0 - - - 0 0 - -0 - - - 0 0 - -0 - - - 0 0 - -0 - - - 0 0 - -0 - - - 0 0 - -0 - - - 0 0 - -0 - - - 0 0 - -0 - - - 0 0 - -0 - - - 0 0 - -0 - - - 0 0 - -0 - - - 0 0 - -0 - - - 0 0 - -0 - - - 0 0 - -0 - - - 0 0 - -0 - - - 0 0 - -0 - - - 0 0 - -0 - - - 0 0 - -0 - - - 0 0 - -0 - - - 0 0 - -0 - - - 0 0 - -0 - - - 0 0 - -0 - - - 0 0 - -0 - - - 0 0 - -0 - - - 0 0 - -0 - - - 0 0 - -
1 1 1 1 2 3 4 5

Toronto Real Estate Board
Market Watch, May 2016
SUMMARY OF EXISTING HOME TRANSACTIONS CO-OWNERSHIP APARTMENT, MAY 2016CITY OF TORONTO MUNICIPAL BREAKDOWN
24
Sales Dollar Volume Average Price Median Price New Listings Active Listings Avg. SP / LP Avg. DOMTREB TotalCity of Toronto TotalToronto West
Toronto W01Toronto W02Toronto W03Toronto W04Toronto W05Toronto W06Toronto W07Toronto W08Toronto W09Toronto W10
Toronto CentralToronto C01Toronto C02Toronto C03Toronto C04Toronto C06Toronto C07Toronto C08Toronto C09Toronto C10Toronto C11Toronto C12Toronto C13Toronto C14Toronto C15
Toronto EastToronto E01Toronto E02Toronto E03Toronto E04Toronto E05Toronto E06Toronto E07Toronto E08Toronto E09Toronto E10Toronto E11
9 $2,763,500 $307,056 $304,500 13 16 97% 439 $2,763,500 $307,056 $304,500 13 16 97% 430 - - - 1 1 - -0 - - - 0 0 - -0 - - - 0 0 - -0 - - - 0 0 - -0 - - - 0 0 - -0 - - - 1 1 - -0 - - - 0 0 - -0 - - - 0 0 - -0 - - - 0 0 - -0 - - - 0 0 - -0 - - - 0 0 - -9 $2,763,500 $307,056 $304,500 12 15 97% 430 - - - 0 0 - -0 - - - 1 1 - -3 $946,000 $315,333 $345,000 1 1 100% 171 $304,500 $304,500 $304,500 1 4 94% 890 - - - 0 0 - -0 - - - 0 0 - -1 $365,000 $365,000 $365,000 1 0 100% 110 - - - 1 1 - -2 $685,000 $342,500 $342,500 2 2 93% 320 - - - 0 0 - -0 - - - 0 0 - -1 $226,000 $226,000 $226,000 3 3 99% 821 $237,000 $237,000 $237,000 2 3 95% 890 - - - 0 0 - -0 - - - 0 0 - -0 - - - 0 0 - -0 - - - 0 0 - -0 - - - 0 0 - -0 - - - 0 0 - -0 - - - 0 0 - -0 - - - 0 0 - -0 - - - 0 0 - -0 - - - 0 0 - -0 - - - 0 0 - -0 - - - 0 0 - -0 - - - 0 0 - -
1 1 1 1 2 3 4 5

Toronto Real Estate Board
Market Watch, May 2016
FOCUS ON THE MLS HOME PRICE INDEX INDEX AND BENCHMARK PRICE, MAY 2016ALL TREB AREAS
25
Composite Single-Family Detached Single-Family Attached Townhouse ApartmentIndex Benchmark Yr./Yr. % Chg. Index Benchmark Yr./Yr. % Chg. Index Benchmark Yr./Yr. % Chg. Index Benchmark Yr./Yr. % Chg. Index Benchmark Yr./Yr. % Chg.
TREB TotalHalton RegionBurlingtonHalton HillsMiltonOakvillePeel RegionBramptonCaledonMississaugaCity of TorontoYork RegionAuroraEast GwillimburyGeorginaKingMarkhamNewmarketRichmond HillVaughanWhitchurch-StouffvilleDurham RegionAjaxBrockClaringtonOshawaPickeringScugogUxbridgeWhitbyDufferin CountyOrangevilleSimcoe CountyAdjala-TosorontioBradford WestGwillimburyEssaInnisfilNew Tecumseth
208.3 $635,700 14.96% 217.3 $808,600 17.52% 221.3 $625,600 16.54% 199.2 $435,500 13.96% 173.5 $348,700 7.16%218.4 $714,400 15.49% 216.4 $802,900 16.16% 223.0 $578,600 17.06% 193.7 $382,300 8.15% - - -220.5 $653,100 15.08% 218.2 $768,100 14.54% 220.0 $524,700 14.11% 195.1 $389,600 7.32% - - -197.6 $575,300 13.82% 201.9 $645,900 17.18% 218.1 $537,200 18.40% 179.7 $324,000 6.27% - - -210.2 $580,500 16.20% 199.0 $690,000 17.13% 219.0 $546,700 18.57% 181.7 $333,100 8.41% - - -227.8 $840,000 15.17% 227.2 $941,600 15.80% 230.8 $624,700 15.46% 199.2 $439,900 9.03% - - -196.5 $537,800 14.05% 200.4 $679,200 14.32% 204.6 $521,900 15.27% 198.5 $410,700 13.23% 160.6 $276,700 9.33%194.2 $495,600 16.43% 193.0 $564,500 15.36% 198.2 $467,000 17.07% 186.9 $347,100 17.92% 149.4 $233,800 10.83%180.1 $642,800 13.27% 180.0 $662,200 12.36% 201.3 $497,600 17.86% - - - - - -199.6 $558,500 12.26% 213.1 $795,500 13.47% 212.8 $581,400 13.25% 202.5 $435,000 12.06% 162.6 $285,200 9.05%203.2 $666,300 11.71% 221.7 $961,300 15.29% 224.1 $744,700 13.41% 202.8 $490,200 13.36% 176.2 $364,000 6.92%240.0 $824,200 20.42% 246.2 $968,100 22.61% 246.5 $714,400 20.54% 211.2 $537,100 16.88% 174.1 $377,600 6.74%231.4 $744,900 22.82% 233.1 $866,000 23.66% 235.1 $608,000 21.50% 180.4 $457,000 19.15% 179.4 $371,000 12.48%202.5 $656,300 22.14% 205.5 $677,300 24.02% 219.3 $464,300 25.31% - - - - - -202.2 $419,800 20.79% 212.1 $437,100 21.41% 217.2 $428,100 19.87% - - - - - -212.3 $899,900 22.72% 213.6 $901,400 22.83% 221.0 $517,600 8.65% - - - - - -250.1 $862,600 19.44% 265.0 $1,089,400 22.86% 254.6 $758,200 19.19% 221.8 $552,900 16.43% 172.8 $398,300 4.66%219.4 $647,000 21.08% 222.9 $750,300 24.25% 228.3 $538,300 21.57% 206.5 $416,900 16.47% 185.5 $312,400 13.87%255.7 $927,200 21.99% 275.8 $1,172,400 23.73% 259.0 $785,300 20.97% 195.3 $546,800 15.02% 171.2 $356,600 8.70%232.7 $841,400 19.21% 227.1 $945,400 20.73% 243.5 $741,000 20.84% 223.2 $607,100 17.85% 176.8 $392,300 6.19%239.0 $901,000 20.40% 238.3 $914,400 20.60% 213.8 $587,300 19.64% - - - - - -197.8 $465,400 19.81% 196.2 $511,500 19.78% 208.8 $418,400 20.83% 182.1 $297,600 20.20% 164.5 $295,800 5.52%210.4 $519,900 20.44% 207.2 $554,900 19.63% 218.8 $470,600 19.56% 195.8 $357,900 18.88% 155.6 $264,200 4.99%156.5 $295,800 15.16% 157.3 $297,900 14.73% - - - - - - - - -192.5 $407,300 20.69% 188.5 $453,000 23.85% 205.1 $391,500 25.06% 170.8 $305,700 7.90% 167.5 $237,000 7.99%193.1 $369,800 22.84% 191.4 $407,700 21.60% 205.3 $343,900 23.08% 164.0 $219,400 27.53% 158.6 $214,000 4.62%201.3 $544,300 16.63% 203.5 $635,900 17.70% 211.2 $492,300 17.59% 199.5 $358,100 18.75% 171.5 $335,800 4.96%176.6 $460,700 12.70% 181.2 $469,100 12.48% 176.5 $369,400 17.82% - - - - - -184.3 $563,600 18.44% 184.0 $569,800 17.65% 179.7 $441,000 21.01% - - - - - -199.6 $521,800 18.67% 201.0 $577,500 18.58% 205.0 $451,600 18.91% 183.4 $333,100 19.32% 159.6 $311,400 4.93%192.2 $440,500 18.72% 201.2 $458,500 19.41% 186.6 $349,700 16.99% - - - - - -192.2 $440,500 18.72% 201.2 $458,500 19.41% 186.6 $349,700 16.99% - - - - - -189.9 $404,900 18.54% 184.3 $408,400 18.75% 197.1 $378,200 18.02% - - - - - -154.1 $546,900 10.62% 154.1 $546,900 10.62% - - - - - - - - -218.4 $542,700 24.73% 199.0 $609,500 26.11% 223.0 $463,600 24.93% - - - - - -185.4 $434,200 17.27% 181.3 $458,500 15.55% 182.2 $310,500 14.38% - - - - - -184.8 $341,900 16.81% 185.3 $343,400 17.28% 196.0 $305,000 12.58% - - - - - -170.8 $394,500 15.56% 166.8 $429,700 15.51% 178.5 $340,800 16.29% - - - - - -
Toronto Real Estate Board
Market Watch, May 2016
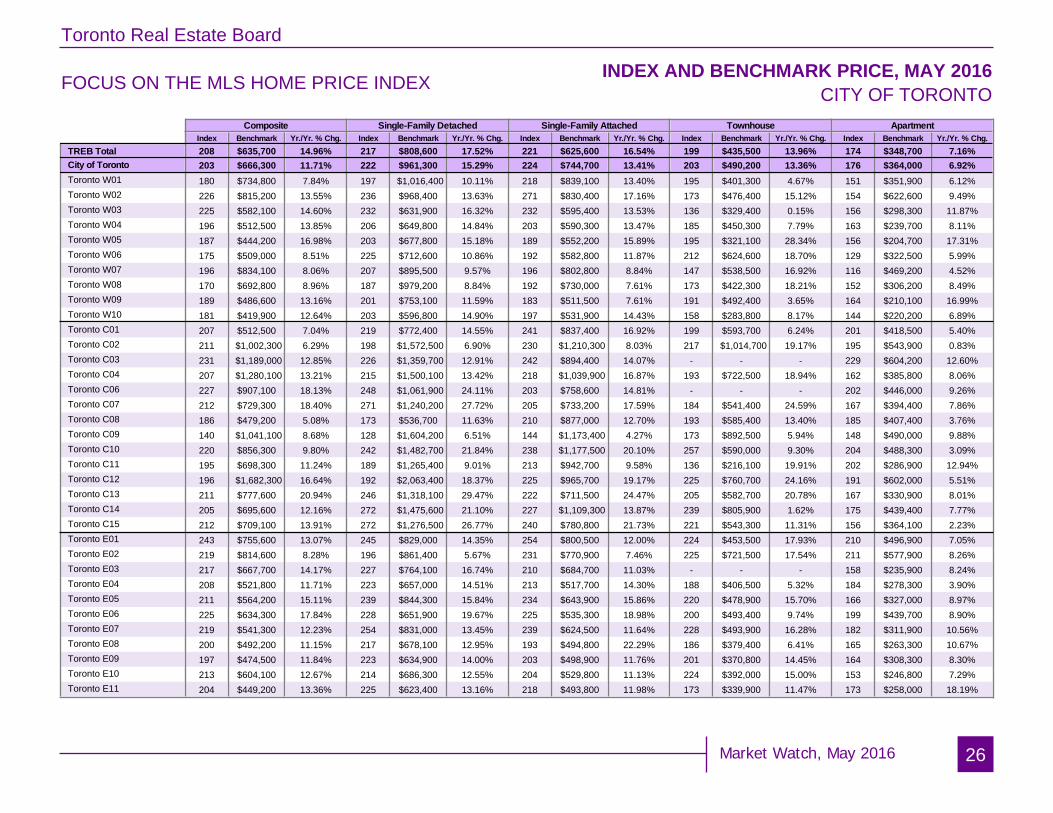
FOCUS ON THE MLS HOME PRICE INDEX INDEX AND BENCHMARK PRICE, MAY 2016CITY OF TORONTO
26
Composite Single-Family Detached Single-Family Attached Townhouse ApartmentIndex Benchmark Yr./Yr. % Chg. Index Benchmark Yr./Yr. % Chg. Index Benchmark Yr./Yr. % Chg. Index Benchmark Yr./Yr. % Chg. Index Benchmark Yr./Yr. % Chg.
TREB TotalCity of TorontoToronto W01Toronto W02Toronto W03Toronto W04Toronto W05Toronto W06Toronto W07Toronto W08Toronto W09Toronto W10Toronto C01Toronto C02Toronto C03Toronto C04Toronto C06Toronto C07Toronto C08Toronto C09Toronto C10Toronto C11Toronto C12Toronto C13Toronto C14Toronto C15Toronto E01Toronto E02Toronto E03Toronto E04Toronto E05Toronto E06Toronto E07Toronto E08Toronto E09Toronto E10Toronto E11
208 $635,700 14.96% 217 $808,600 17.52% 221 $625,600 16.54% 199 $435,500 13.96% 174 $348,700 7.16%203 $666,300 11.71% 222 $961,300 15.29% 224 $744,700 13.41% 203 $490,200 13.36% 176 $364,000 6.92%180 $734,800 7.84% 197 $1,016,400 10.11% 218 $839,100 13.40% 195 $401,300 4.67% 151 $351,900 6.12%226 $815,200 13.55% 236 $968,400 13.63% 271 $830,400 17.16% 173 $476,400 15.12% 154 $622,600 9.49%225 $582,100 14.60% 232 $631,900 16.32% 232 $595,400 13.53% 136 $329,400 0.15% 156 $298,300 11.87%196 $512,500 13.85% 206 $649,800 14.84% 203 $590,300 13.47% 185 $450,300 7.79% 163 $239,700 8.11%187 $444,200 16.98% 203 $677,800 15.18% 189 $552,200 15.89% 195 $321,100 28.34% 156 $204,700 17.31%175 $509,000 8.51% 225 $712,600 10.86% 192 $582,800 11.87% 212 $624,600 18.70% 129 $322,500 5.99%196 $834,100 8.06% 207 $895,500 9.57% 196 $802,800 8.84% 147 $538,500 16.92% 116 $469,200 4.52%170 $692,800 8.96% 187 $979,200 8.84% 192 $730,000 7.61% 173 $422,300 18.21% 152 $306,200 8.49%189 $486,600 13.16% 201 $753,100 11.59% 183 $511,500 7.61% 191 $492,400 3.65% 164 $210,100 16.99%181 $419,900 12.64% 203 $596,800 14.90% 197 $531,900 14.43% 158 $283,800 8.17% 144 $220,200 6.89%207 $512,500 7.04% 219 $772,400 14.55% 241 $837,400 16.92% 199 $593,700 6.24% 201 $418,500 5.40%211 $1,002,300 6.29% 198 $1,572,500 6.90% 230 $1,210,300 8.03% 217 $1,014,700 19.17% 195 $543,900 0.83%231 $1,189,000 12.85% 226 $1,359,700 12.91% 242 $894,400 14.07% - - - 229 $604,200 12.60%207 $1,280,100 13.21% 215 $1,500,100 13.42% 218 $1,039,900 16.87% 193 $722,500 18.94% 162 $385,800 8.06%227 $907,100 18.13% 248 $1,061,900 24.11% 203 $758,600 14.81% - - - 202 $446,000 9.26%212 $729,300 18.40% 271 $1,240,200 27.72% 205 $733,200 17.59% 184 $541,400 24.59% 167 $394,400 7.86%186 $479,200 5.08% 173 $536,700 11.63% 210 $877,000 12.70% 193 $585,400 13.40% 185 $407,400 3.76%140 $1,041,100 8.68% 128 $1,604,200 6.51% 144 $1,173,400 4.27% 173 $892,500 5.94% 148 $490,000 9.88%220 $856,300 9.80% 242 $1,482,700 21.84% 238 $1,177,500 20.10% 257 $590,000 9.30% 204 $488,300 3.09%195 $698,300 11.24% 189 $1,265,400 9.01% 213 $942,700 9.58% 136 $216,100 19.91% 202 $286,900 12.94%196 $1,682,300 16.64% 192 $2,063,400 18.37% 225 $965,700 19.17% 225 $760,700 24.16% 191 $602,000 5.51%211 $777,600 20.94% 246 $1,318,100 29.47% 222 $711,500 24.47% 205 $582,700 20.78% 167 $330,900 8.01%205 $695,600 12.16% 272 $1,475,600 21.10% 227 $1,109,300 13.87% 239 $805,900 1.62% 175 $439,400 7.77%212 $709,100 13.91% 272 $1,276,500 26.77% 240 $780,800 21.73% 221 $543,300 11.31% 156 $364,100 2.23%243 $755,600 13.07% 245 $829,000 14.35% 254 $800,500 12.00% 224 $453,500 17.93% 210 $496,900 7.05%219 $814,600 8.28% 196 $861,400 5.67% 231 $770,900 7.46% 225 $721,500 17.54% 211 $577,900 8.26%217 $667,700 14.17% 227 $764,100 16.74% 210 $684,700 11.03% - - - 158 $235,900 8.24%208 $521,800 11.71% 223 $657,000 14.51% 213 $517,700 14.30% 188 $406,500 5.32% 184 $278,300 3.90%211 $564,200 15.11% 239 $844,300 15.84% 234 $643,900 15.86% 220 $478,900 15.70% 166 $327,000 8.97%225 $634,300 17.84% 228 $651,900 19.67% 225 $535,300 18.98% 200 $493,400 9.74% 199 $439,700 8.90%219 $541,300 12.23% 254 $831,000 13.45% 239 $624,500 11.64% 228 $493,900 16.28% 182 $311,900 10.56%200 $492,200 11.15% 217 $678,100 12.95% 193 $494,800 22.29% 186 $379,400 6.41% 165 $263,300 10.67%197 $474,500 11.84% 223 $634,900 14.00% 203 $498,900 11.76% 201 $370,800 14.45% 164 $308,300 8.30%213 $604,100 12.67% 214 $686,300 12.55% 204 $529,800 11.13% 224 $392,000 15.00% 153 $246,800 7.29%204 $449,200 13.36% 225 $623,400 13.16% 218 $493,800 11.98% 173 $339,900 11.47% 173 $258,000 18.19%

Toronto Real Estate Board
Market Watch, May 2016
HISTORIC ANNUAL STATISTICS
27
Year Sales Average Price20042005200620072008200920102011201220132014
83,501 $315,23184,145 $335,90783,084 $351,94193,193 $376,23674,552 $379,34787,308 $395,46085,545 $431,27689,096 $465,01485,496 $497,13087,049 $522,95892,782 $566,624
2015 MONTHLY STATISTICS
NOTES1 - Sales, dollar volume, average sale prices and median sale prices are based on firm transactions entered into the TREB MLS® system between thefirst and last day of the month/period being reported.2 - New listings entered into the TREB MLS® system between the first and last day of the month/period being reported.3 - Active listings at the end of the last day of the month/period being reported.4 - Ratio of the average selling price to the average listing price for firm transactions entered into the TREB MLS® system between the first and last dayof the month/period being reported.5 - Average number of days on the market for firm transactions entered into the TREB MLS® system between the first and last day of the month/periodbeing reported.6 - Due to past changes to TREB's service area, caution should be exercised when making historical comparisons.7 - Past monthly and year-to-date figures are revised on a monthly basis.8 - SNLR = Sales-to-New Listings Ratio. Calculated using a 12-month moving average (sales/new listings).9 - Mos. Inv. = Months of Inventory. Calculated using a 12-month moving average (active listings/sales).
2016 MONTHLY STATISTICS
*For historic annual sales and average price data over a longer time frame go to:
JanuaryFebruary
MarchAprilMayJuneJuly
AugustSeptember
OctoberNovemberDecember
Year to Date
4,640 $630,1937,587 $685,93510,281 $688,04612,066 $739,16612,870 $751,908
- -- -- -- -- -- -- -
47,444 $699,049
JanuaryFebruaryMarchAprilMayJuneJuly
AugustSeptember
OctoberNovemberDecemberAnnual
4,318 $552,9256,294 $596,3208,886 $613,81811,254 $636,09411,640 $649,64811,905 $639,3099,813 $608,8757,943 $603,5348,149 $627,8188,759 $630,2547,336 $632,8004,916 $608,753
101,213 $622,121
1,6,7
1,7
1,7
http://www.torontorealestateboard.com/market_news/market_watch/historic_stats/pdf/TREB_historic_statistics.pdf
Copyright® 2016 Toronto Real Estate Board
$712,37547,444