market watch npl the italian scenario july 2017 · 5 market watch npl // july 2017 11% 70% 9% 10%...
TRANSCRIPT

MARKET WATCH NPLThe Italian Scenario
July 2017
2
MARKET WATCH NPL // July 2017
Executive Summary.
NPL transactions on the Italian market>> pag 03
o NPL transactions on the market are about to explode in 2017; in addition to the deals already closed (33,1 Bn€), 70,9 Bn€ are expected to be released on the market during 2017
o The most important category is the one with mixed debtors (retail and corporate), also excluding Unicredit FINO deal; a trend that will continue during the whole 2017
o Portfolios with consumer loans represent the largest part (80%) of the retail category. The utility category is gaining a relevant importance
o Among corporate debtors, the trend is focusing on mixed portfolioso In 2017, domestic buyers are starting to show a strong interest for Italian non performing loanso The price levels show different trends for different categories: secured portfolios are experiencing a drop in price levels; on
the contrary, consumer portfolios are gaining higher prices in 2017o International buyers are equipping themselves through the acquisition of servicers’ platforms (from 2015, already 15
platforms bought) to better face the competition
NPL pipeline deep-dive>> pag 16
o 32,4 Bn€ are next to closing, out of the total pipeline volumes of 70,9 Bn€o The mixed-asset portfolios, which are about to be disposed during 2017, show relevant values: the deal of MPS (26 Bn€) will
have the largest impacto Pipeline confirms the buyers’ interest in secured dealso Regulatory variables are expected to shape future development of the NPL market. Especially the ECB guidelines will
positively impact both disposal and internal management strategies: the objective is to choose the optimal mix relative to each portfolio
Italian asset quality overview>> pag 21
o The GDP growth and the bankruptcies reduction as of the end of 2014 lead to a progressive stabilisation of Bad Loanso In Q1 2017, despite a slight increase of Gross Bad Loans, Net Bad Loans show a sharp reduction due to heavy writedownso The distribution analysis of Bad Loans shows how large customers are the main driver of the Bad Loans growth from 2009o The bad loans coverage index is stable on cyclical high values due to the heavy writedowns observed in January. Moreover,
there is still a relevant amount of Unlikely to Pay loans that could turn into Bad Loans in the next months

NPL TRANSACTIONSON THE ITALIANMARKET

4
MARKET WATCH NPL // July 2017
19,1 17,3
33,1
42
50
35
0
10
20
30
40
50
60
-
5.000,00
10.000,00
15.000,00
20.000,00
25.000,00
30.000,00
35.000,00
2015 2016 2017
Value (Bn €) Number of deals
Transactions are expected to grow exponentially reaching the massive amount of 104,0 Bn€.
*Unicredit retains a minority stake: 49% with the best effort to reduce its share // Sources: Banca IFIS NPL Market Database - Press releases and news
HIGHLIGHTS
o In Q2 2017 strong growth of the market with volumes that increased 192% with respect to Q1 2017; in addition Q3 shows the la rge deal (17,7 Bn€) of Unicredit FINO Project*
o In Q2 2017 the most important deals are:o The acquisition of 2,2 bn€ by Atlante II from the three new banks Etruria, Marche and Carichietio The mixed portfolio sold by Intesa Sanpaolo to CRC with a face value of 2,1 bn€o The portfolio sold by Unicredit to Sistemia, Yard and IT Auction mainly constituted of leasing loans
70,9
58
Expected value in H2 2017 Expected deals in H2 2017
104,0

5
MARKET WATCH NPL // July 2017
11%
70%
9%
10%
The growth of mixed-debtor portfolios is a trend that will continue throughout 2017.
*Unicredit retains a minority stake: 49% with the best effort to reduce its share // Sources: Banca IFIS NPL Market Database - Press releases and news
27%
1%
37%
35% 31%
1%45%
23%
UndisclosedRetail Corporate Mixed
Total 2015: 19,1 Bn€ Total 2016: 17,3 Bn€ YTD 2017: 33,1 Bn€ (o/w 17,7 FINO Project*)
HIGHLIGHTS
o In the first months of 2017, the most important category is the one with mixed debtors (retail and corporate) as opposed to 2016 transactions characterized by sole retail and sole corporate portfolios
o The mixed portfolio incidence in 2017 is relevant (33%) also excluding Unicredit FINO Project

6
MARKET WATCH NPL // July 2017
3%
84%
9%4%
2%
70%
28%
1%
Among retail debtors, consumer loan portfolios confirm the high importance in the market; in the meantime, the utility sector overperforms previous years’ volumes.
Sources: Banca IFIS NPL Market Database - Press releases and news
Consumer Banking - UnsecuredUtility Banking
Total 2015: 7,2 Bn€ Total 2016: 7,8 Bn€ YTD 2017: 3,1 Bn€
HIGHLIGHTS
o Portfolios with consumer loans represent the largest part (80%) of the retail category, after the light decrease observed in 2016o Utility portfolios are increasingly important in the market
11%
80%
9%

7
MARKET WATCH NPL // July 2017
19%
59%
1%5%
16%
54%
14%
9%
0%
23%
TOTAL 2015: 5,2 BN€
25%
60%
0% 8%
7%
TOTAL 2016: 5,4 BN€
Among corporate debtors, mixed-asset portfolios are polarizing the volumes in the 2017 market.
Sources: Banca IFIS NPL Market Database - Press releases and news
Total 2015: 5,2 Bn€ Total 2016: 5,4 Bn€ YTD 2017: 3,6 Bn€
HIGHLIGHTS
o In 2017, the trend is shifting again concentrating on mixed portfolios, in contrast to 2015
SecuredMixedUnsecured Secured - CRE Secured - Residential Undisclosed

8
MARKET WATCH NPL // July 2017
5,0
2,5
2,5
2,1
1,5
Fortress; PIMCO
Quaestio Capital ManagementSgr
Banca IFIS
Christofferson Robb; Bayview;Prelios
Sistemia; Yard; IT Auction
In 2017, in contrast to the previous years, domestic buyers are starting to show a strong interest for Italian NPLs.
*Unicredit retains a minority stake: 49% with the best effort to reduce its share // Sources: Banca IFIS NPL Market Database - Press releases and news
3,7
2,4
2,0
1,7
1,3
Banca IFIS
Fortress; Prelios
D.E. Shaw
Deutsche Bank
Banca IFIS; Cerberus
3,0
2,9
2,1
1,2
1,0
Banca IFIS
Anacap
Kruk Group
FBS
Hoist Finance
# 10 deals
# 1 deal
# 1 deal
# 1 deal
# 1 deal
# 13 deals
# 2 deals
# 4 deals
# 1 deal
# 2 deals
# 8 deals
# 2 deals
# 1 deal
# 1 deal
58,1% on the total 59,0% on the total 79,8% on the total
Top 5 buyers 2015 (Bn€) Top 5 buyers 2016 (Bn€) Top 5 buyers 2017 (Bn€)
HIGHLIGHTS
o Despite the huge interest shown by international buyers in 2015 and 2016, in 2017 domestic buyers are showing an increasing commitment to the Italian market: 61% of the deals are in domestic buyers’ portfolios (net of FINO Project)
# 1 deal
17,7*
9
MARKET WATCH NPL // July 2017
4,7
3,0
1,2
0,4
0,4
1,9
0,3
0,8
0,4
0,5
0,4
0,3
0,7
8,2
0,3
1,3
2,2
1,3
2,1
1,5
0,5
Unicredit
Monte dei Paschi di Siena
Gruppo Banco BPM
Nuova Banca Etruria; Nuova Banche Marche; Nuova CariChieti
Gruppo BNP Paribas
Intesa Sanpaolo
Creval
Deutsche Bank
Cassa Centrale Banca
Iccrea Banca
2015 2016 2017
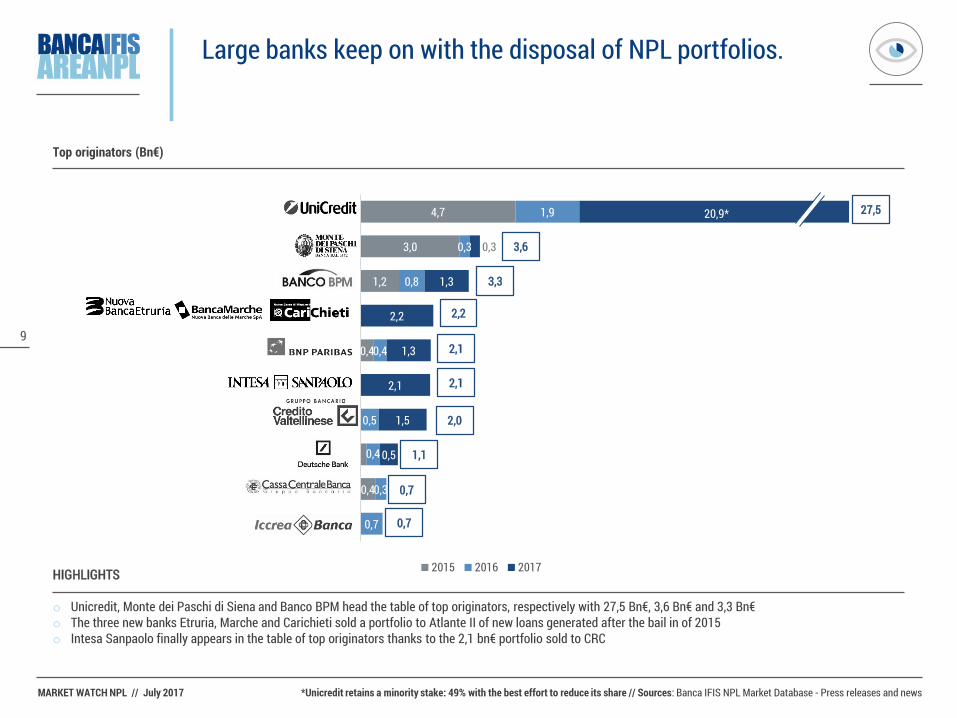
Large banks keep on with the disposal of NPL portfolios.
*Unicredit retains a minority stake: 49% with the best effort to reduce its share // Sources: Banca IFIS NPL Market Database - Press releases and news
27,5
3,6
3,3
2,2
2,1
2,1
2,0
1,1
0,7
Top originators (Bn€)
HIGHLIGHTS
o Unicredit, Monte dei Paschi di Siena and Banco BPM head the table of top originators, respectively with 27,5 Bn€, 3,6 Bn€ and 3,3 Bn€o The three new banks Etruria, Marche and Carichieti sold a portfolio to Atlante II of new loans generated after the bail in of 2015 o Intesa Sanpaolo finally appears in the table of top originators thanks to the 2,1 bn€ portfolio sold to CRC
0,7
20,9*

10
MARKET WATCH NPL // July 2017
Transactions in the NPL market are pushing the securitization trend up.
Sources: Banca d’Italia, last update June 2017
25
30
35
40
45
50
55
60
65
70
75
Q12012
Q22012
Q32012
Q42012
Q12013
Q22013
Q32013
Q42013
Q12014
Q22014
Q32014
Q42014
Q12015
Q22015
Q32015
Q42015
Q12016
Q22016
Q32016
Q42016
Q12017
72,4
31,0
Amounts (Bn€)
HIGHLIGHTS
o The growth of Bad Loan securitization reaches a new peak in Q1 2017: the amount increased by 134% since 2012.
11
MARKET WATCH NPL // July 2017
0%3%5%8%
10%13%15%18%20%23%25%28%30%33%35%38%40%43%45%48%
Q2 16 Q3 16 Q4 16 Q1 17 Q2 17 Q3 17
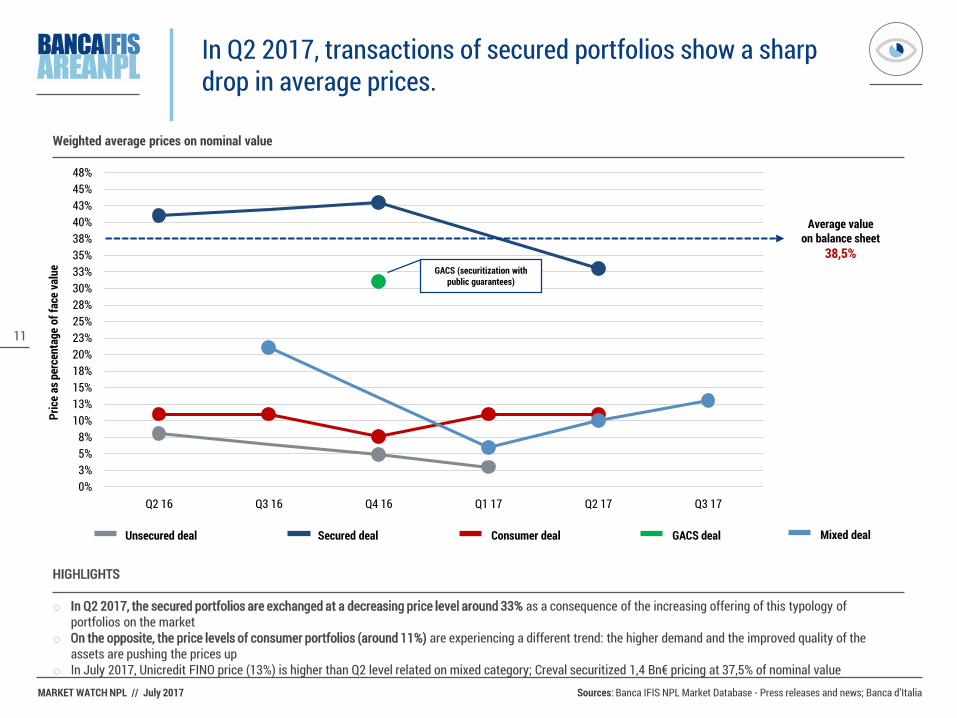
In Q2 2017, transactions of secured portfolios show a sharp drop in average prices.
Sources: Banca IFIS NPL Market Database - Press releases and news; Banca d’Italia
GACS (securitization with public guarantees)
Pric
e as
per
cent
age
of fa
ce v
alue
Average value on balance sheet
38,5%
Consumer dealUnsecured deal Secured deal GACS deal
HIGHLIGHTS
o In Q2 2017, the secured portfolios are exchanged at a decreasing price level around 33% as a consequence of the increasing offering of this typology of portfolios on the market
o On the opposite, the price levels of consumer portfolios (around 11%) are experiencing a different trend: the higher demand and the improved quality of the assets are pushing the prices up
o In July 2017, Unicredit FINO price (13%) is higher than Q2 level related on mixed category; Creval securitized 1,4 Bn€ pricing at 37,5% of nominal value
Mixed deal
Weighted average prices on nominal value

12
MARKET WATCH NPL // July 2017
1,0
0,3
0,3
0,2
0,2
Unicredit
Findomestic Banca
Provis (Intesa Sanpaolo)
Barclays
Santander Consumer…
Originator
1,0
0,8
0,3
0,1
0,1
MBCredit Solution (ex…
Banca IFIS
Credito Fondiario
Kruk Group
LCM Partners
Buyer
Consumer transactions - Stable volumes and increasing price levels; Italian buyers show a strong interest while Unicredit is the top originator in 2017.
Banca IFIS NPL Market Database - Press releases and news
Market trend
Price levels(Primarymarket)
Top buyers and
originatorsin 2017
Size = Number of deals (#)
1217
13
17
,0
2,0
4,0
6,0
8,0
Face
Val
ue (B
n€)
2015 2016 2017 2017 (with pipeline)
4%
10% 11%
2015 2016 2017
Data are in Bn€

13
MARKET WATCH NPL // July 2017
1,0
0,6
BNL BnpParibas
Banco BPM
Originator
1,3
0,6
Banca IFIS
Hoist Finance
Buyer
Banking unsecured transactions – Volumes are expected to increase consistently in 2017 with decreasing price levels.
Banca IFIS NPL Market Database - Press releases and news
Market trend
Price levels(Primarymarket)
Top buyers and
originatorsin 2017
97
3
8
,0
2,0
4,0
6,0
8,0
10,0
Face
Val
ue (B
n€)
2015 2016 2017 2017 (with pipeline)
Size = Number of deals (#)
7%
3%
2015 2016 2017
Data are in Bn€

14
MARKET WATCH NPL // July 2017
2,2
1,5
0,7
0,4
0,2
Nuova Banca Etruria;…
Unicredit
Banco BPM
Banca Mediocredito…
Barclays
Originator 2,2
1,5
0,7
0,4
0,2
Quaestio Capital…
Sistemia; Yard; IT…
Algebris
Bain Capital Credit
Anacap
Buyer
Banking secured transactions – Volumes are expected to soar in 2017 and prices are dropping, as a consequence of the high supply.
Banca IFIS NPL Market Database - Press releases and news
Size = Number of deals (#)
Market trend
Price levels(Primarymarket)
Top buyers and
originatorsin 2017
6
45
11
-2,0
,0
2,0
4,0
6,0
8,0
10,0
Face
Val
ue (B
n€)
2015 2016 2017 2017 (with pipeline)
41% 42%
33%
2015 2016 2017
Data are in Bn€

15
MARKET WATCH NPL // July 2017
International buyers are equipping themselves through the acquisition of servicers’ platforms to better face the competition.
Banca IFIS NPL Market Database - Press releases and news
2016
Acquisition of CrossFactor(AuM 2 Bn€)
Acquisition of NonPerforming Loans SpA
(AuM 1 Bn€)
Acquisition of Centaurus Credit Recovery (AuM 0,7 Bn€)
Acquisition of CS Union (AuM 0,2 Bn€)
Acquisition of Italfondiario(AuM 41,5 Bn€) from
Fortress
Acquisition of SPC Credit Management
Acquisition of Credit Base International
Acquisition of Zenith Service (AuM 14,1 Bn€)
2017
Acquisition of Heta Asset Resolutions (AuM 0,6 Bn€)
Acquisition of 33% of Guber (AuM 12,6 Bn€)
Acquisition of Sistemia(AuM 4,6 Bn€)
Acquisition of Gextra(AuM 0,6 Bn€)
2015
Acquisition of UCCMB (AuM 2,4 Bn€) from
Unicredit
Acquisition of CAF (AuM 7,8 Bn€)
Acquisition of FinanziariaSan Giacomo from CreVal

NPL PIPELINE DEEP-DIVE

17
MARKET WATCH NPL // July 2017
70,9 Bn€ are expected to be released on the market in 2017; 32,4 Bn€ are next to closing.
Sources: Banca IFIS NPL Market Database - Press releases and news
HIGHLIGHTS
o Unicredit has just released on the market 17,7 Bn€: Fortress and PIMCO have acquired 51% of the shares, while Unicredit will keep ownership of the remaining (disclosed the goal to reduce the share)
o Monte dei Paschi di Siena’s sole investor in the securitization of 26 Bn€ will be Atlante II after Fortress withdrew its offer because of the high priceo Rev Gestione Crediti is expected to release the first portfolio of 1 Bn€ with the project Rossini
Status Seller Nominal value (Bn€)Ongoing 32,4
Monte dei Paschi di Siena 26,0 Confidential 3,6
Caricesena; Carim; Carismi 2,8 Announced 20,5
Banca Popolare di Vicenza 5,2 Veneto Banca 5,0
Monte dei Paschi di Siena 2,5 Gruppo Delta 2,0
Intesa Sanpaolo 1,5 Carige 1,2
REV Gestione Crediti 1,0 Hypo Alpe Adria Bank 0,8 Cassa Centrale Banca 0,6
Iccrea Banca 0,5 Banca Popolare di Bari 0,3
On plan 18,0 REV Gestione Crediti 9,3
Unipol 3,7 Unicredit 3,0
Banco BPM 2,0
Grand total 70,9

18
MARKET WATCH NPL // July 2017
The mixed-asset portfolios, which are about to be disposed during 2017, show relevant values.
Sources: Banca IFIS NPL Market Database - Press releases and news
N.a.
28,5 Bn€
20,5%
Securitization of 26 Bn€ with Atlante II acting as sole buyer of mezzanine and junior tranches. An unsecured portfolio of 1,5/2 Bn€ will be disposed by Dec 2017
Seller
Project Name
Nominal Value
Price
Portfolio details
N.a.
10,2 Bn€
N.a.
The total value of NPE (around16 Bn€) will be managed by SGA with the support of the Italian Government
Seller
Project Name
Nominal Value
Price
Portfolio details

19
MARKET WATCH NPL // July 2017
Pipeline confirms the buyers’ interest in secured deals.
Sources: Banca IFIS NPL Market Database - Press releases and news
REP
1,5 Bn€
70
50% Corporate/Residential
REV Gestione Crediti
Rossini
1,0 Bn€
78
35% Residential, 10% Industrial, 8,5% CRE, 8%
Hotels, 38,5% mixed Real estate
Seller
Project Name
Nominal Value
Number of loans
Portfolio details
Seller
Project Name
Nominal Value
Number of loans
Portfolio details
Terzo
750 M€
-
84% Real Estate
Seller
Project Name
Nominal Value
Number of loans
Portfolio details
Buonconsiglio
560 M€
10
85% real estate (mixed CRE and Residential)
Seller
Project Name
Nominal Value
Number of loans
Portfolio details

20
MARKET WATCH NPL // July 2017
Regulatory variables expected to shape the future development of the NPL market
Disposal Internal Management Comments
February 2016: GACS are established (first time used in August 2016)
+ -The possibility of selling NPL portfolio backed by public guarantees is likely to ease the transaction with buyers (e.g. the cases of Banca Monte dei Paschi di Siena and Banca Carige)
April 2016: Atlante I Fund is established + +
Due to the hybrid nature of the Fund (70% in banks recapitalizations, 30% in NPL purchase), sales of NPLs are expected to increase but at the same time banks are empowered to internally manage these exposures because of higher capital endowment. In turn, higher capital availability could allow banks to undertake heavier write-downs to ease NPL disposal
June 2016: the II Reform of the Bankrupcy Law is enacted - + Guarantees expropriation processes are simplified and sped up, thus becoming less risky for banks to internally
manage non performing exposures
August 2016: Atlante II Fund is established + - The Fund was created to invest in financial instruments issued by NPL securitization vehicles
March 2017: ECB Guidelines + +The ECB guidelines implication is dual:• Higher NPL disposal to meet the reduction objectives• Selection of the best recovery strategies tailored to each NPL portfolio categories (both through internal
departments and outsourcing)
June 2017: Reform of the Securitization Law (Article 7.1) + -
The introduction of the new article 7.1 has the objective to ease the disposal of NPLs improving the action of SPV 130, in case of recovery situations or resulting from leasing contracts. The reform operates on several directions: possibility to concede loans; possibility to sign for equity or other instruments in case of recovery or restructuring situations; possibility to set SPV corporations (ReoCo) to purchase and manage assets securing securitized receivables (including assets object of leasing contracts); improved information to be given in case of disposal to an SPV that are not identifiable as a pool (“in blocco”)
July 2017: Ecofin approves a plan to handle bad loans + - Agreement on the creation of national “bad banks” or “asset management companies” in order to push up the prices
End of 2017: Accelerated loan security project + - European Commission launches a public survey in order to ease the development of a secondary market to avoid
negative effects of increasing levels of NPL
January 2018: IFRS 9 +/- +/-
• On the one hand, the adoption of a “forward-looking” approach in the exposures valuation could lead a share of loans previously judged as performing to be considered as non performing in order to anticipate losses at the first signals of deterioration
• On the other hand, the increase of new Bad Loans could be restrained upstream by the impact of the IFRS 9 adoption of banks’ internal processes such as stricter selection of borrowers through the “forward-looking approach”, establishment of Early Warning signals and adoption of pre-collection and collection processes aimed at setting up corrective actions
Sources: PWC, UNIREC, AIFIRM; DLA Piper
ITALIAN ASSET QUALITY OVERVIEW
22
MARKET WATCH NPL // July 2017
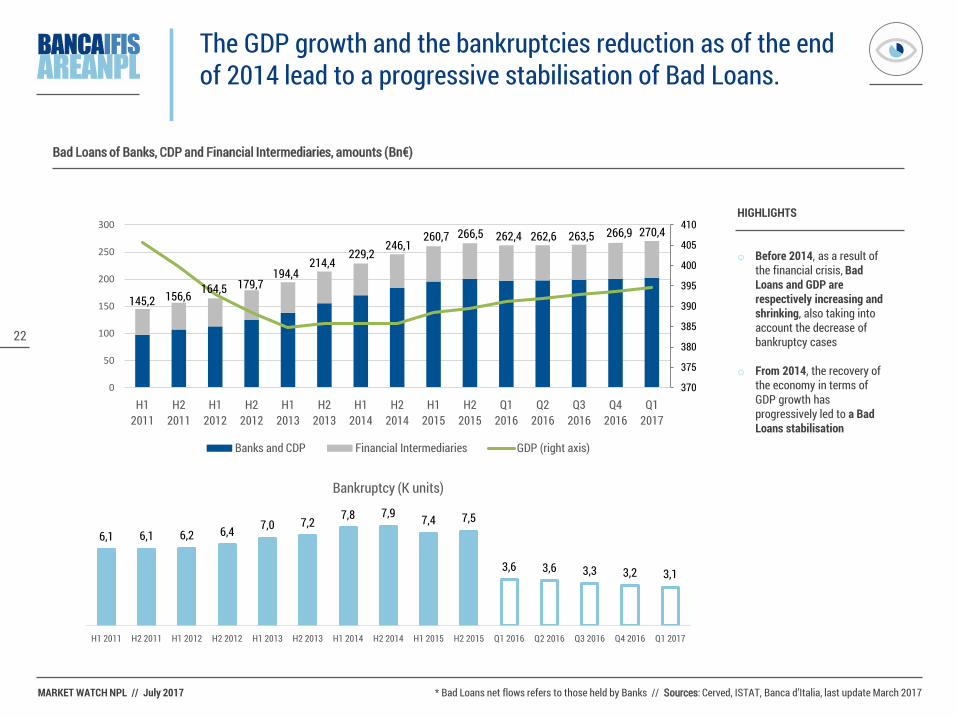
The GDP growth and the bankruptcies reduction as of the end of 2014 lead to a progressive stabilisation of Bad Loans.
* Bad Loans net flows refers to those held by Banks // Sources: Cerved, ISTAT, Banca d’Italia, last update March 2017
370
375
380
385
390
395
400
405
410
0
50
100
150
200
250
300
H12011
H22011
H12012
H22012
H12013
H22013
H12014
H22014
H12015
H22015
Q12016
Q22016
Q32016
Q42016
Q12017
Banks and CDP Financial Intermediaries GDP (right axis)
HIGHLIGHTS
o Before 2014, as a result of the financial crisis, Bad Loans and GDP are respectively increasing and shrinking, also taking into account the decrease of bankruptcy cases
o From 2014, the recovery of the economy in terms of GDP growth has progressively led to a Bad Loans stabilisation
Bad Loans of Banks, CDP and Financial Intermediaries, amounts (Bn€)
6,1 6,1 6,2 6,4 7,0 7,2 7,8 7,9 7,4 7,5
3,6 3,6 3,3 3,2 3,1
H1 2011 H2 2011 H1 2012 H2 2012 H1 2013 H2 2013 H1 2014 H2 2014 H1 2015 H2 2015 Q1 2016 Q2 2016 Q3 2016 Q4 2016 Q1 2017
Bankruptcy (K units)
270,4
145,2 156,6 164,5 179,7194,4
214,4229,2
246,1260,7 266,5 262,4 262,6 263,5 266,9

23
MARKET WATCH NPL // July 2017
In Q1 2017, despite a slight increase of Gross Bad Loans, Net Bad Loans show a sharp reduction due to heavy writedowns.
* Bad Loans net flows refers to those held by Banks // Sources: Banca d’Italia, last update March 2017
0
50
100
150
200
250
H12011
H22011
H12012
H22012
H12013
H22013
H12014
H22014
H12015
H22015
Q12016
Q22016
Q32016
Q42016
Q12017
Gross Bad Loans Net Bad Loans
HIGHLIGHTS
o In the period, Gross Bad Loans have increased by 108%
o The analysis of the ratio between Net Bad Loans and Total Assets shows a drop with a value around 4,3%
o After a constant growth from H1 2011, the weight of Gross Bad Loans on the total assets has settled around 11% from H1 2014
Banks and CDP, amounts (Bn€)
5,0% 5,5% 5,9%6,5%
7,4%8,5%
9,3%10,1% 10,7% 11,0% 10,8% 10,9% 11,0% 11,14% 11,22%
2,3% 2,… 2,8%3,4% 3,8% 4,3% 4,2%
4,6% 4,6% 4,9% 4,6% 4,6% 4,7% 4,8% 4,3%
H1 2011 H2 2011 H1 2012 H2 2012 H1 2013 H2 2013 H1 2014 H2 2013 H1 2014 H2 2015 Q1 2016 Q2 2016 Q3 2016 Q4 2016 Q1 2017
Gross Bad Loans/Total Assets Net Bad Loans/Total Assets
200,8198,9197,9197,0200,7195,8183,7
170,4155,9138,2
125,0113,1107,297,7
202,8
86,885,283,783,188,584,284,577,080,070,664,854,351,744,8
77,8

24
MARKET WATCH NPL // July 2017
The volume of transactions exceeded the new bad loan growth in Q1 2017.
Banca IFIS NPL Market Database - Press releases and news , Banca d’Italia, last update March 2017
Bad Loans held by Banks & Financial Intermediaries, Amount and flows (Bn€)
32,6
8,512,2
3,4
11,5
232,8
2014 Q1 2017
1,3255,5
257,6
2015
253,9
2016
Retail: 3,6 Bn€ (31,3%)Corporate: 4,3 Bn€ (37,7%)
Retail: 4,0 Bn€ (46,7%)Corporate: 2,9 Bn€ (34,0%)
Retail: 0,7 Bn€ (20,6%)Corporate: 0,2 Bn€ (5,9%)
Retail: 40,4 Bn€ (17,3%)
Corporate: 185,3 Bn€ (79,6%)
Retail: 44,6 Bn€ (17,5%)
Corporate: 204,1 Bn€ (79,9%)
Bad loans Transactions New bad loans
25
MARKET WATCH NPL // July 2017
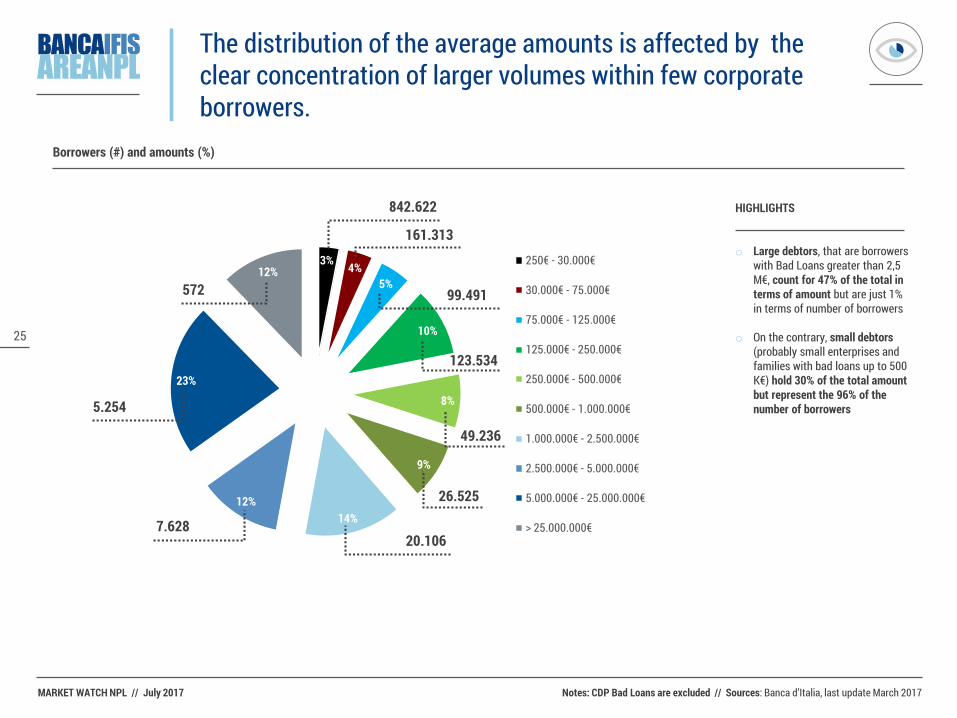
The distribution of the average amounts is affected by the clear concentration of larger volumes within few corporate borrowers.
Notes: CDP Bad Loans are excluded // Sources: Banca d’Italia, last update March 2017
3% 4%5%
10%
8%
9%
14%12%
23%
12%250€ - 30.000€
30.000€ - 75.000€
75.000€ - 125.000€
125.000€ - 250.000€
250.000€ - 500.000€
500.000€ - 1.000.000€
1.000.000€ - 2.500.000€
2.500.000€ - 5.000.000€
5.000.000€ - 25.000.000€
> 25.000.000€
572
5.254
7.62820.106
26.525
49.236
123.534
99.491
161.313
842.622
Borrowers (#) and amounts (%)
HIGHLIGHTS
o Large debtors, that are borrowers with Bad Loans greater than 2,5 M€, count for 47% of the total in terms of amount but are just 1% in terms of number of borrowers
o On the contrary, small debtors (probably small enterprises and families with bad loans up to 500 K€) hold 30% of the total amount but represent the 96% of the number of borrowers

26
MARKET WATCH NPL // July 2017
Large customers are the main driver behind Bad Loans growth from 2009.
Notes: CDP Bad Loans are excluded // Sources: Banca d’Italia, last update March 2017
Size-class (€), amounts (Bn€)
HIGHLIGHTS
o The financial crisis resulted in pronounced differences between higher and lower size-classes
o The «large customers» pushed Bad Loans growth in Italy both in terms of % growth (536%) and in terms of weight on total (+16 percentage points)
Q1 2009 Q4 2013 Q1 2017
More than 2.500.000
From 250.000 to 2.500.000
From 250 to 250.000
Amount: +536%% on total: +16,0pp
Growth % Q1 2009 – Q1 2017
Amount: +263%% on total: -4,6pp
Amount: +175%% on total: -11,4pp
186,4
148,9
44,6
47,0%
31,0%
22,0%
44,5%
30,0%
25,5%
31,0%
35,6%
33,4%
27
MARKET WATCH NPL // July 2017
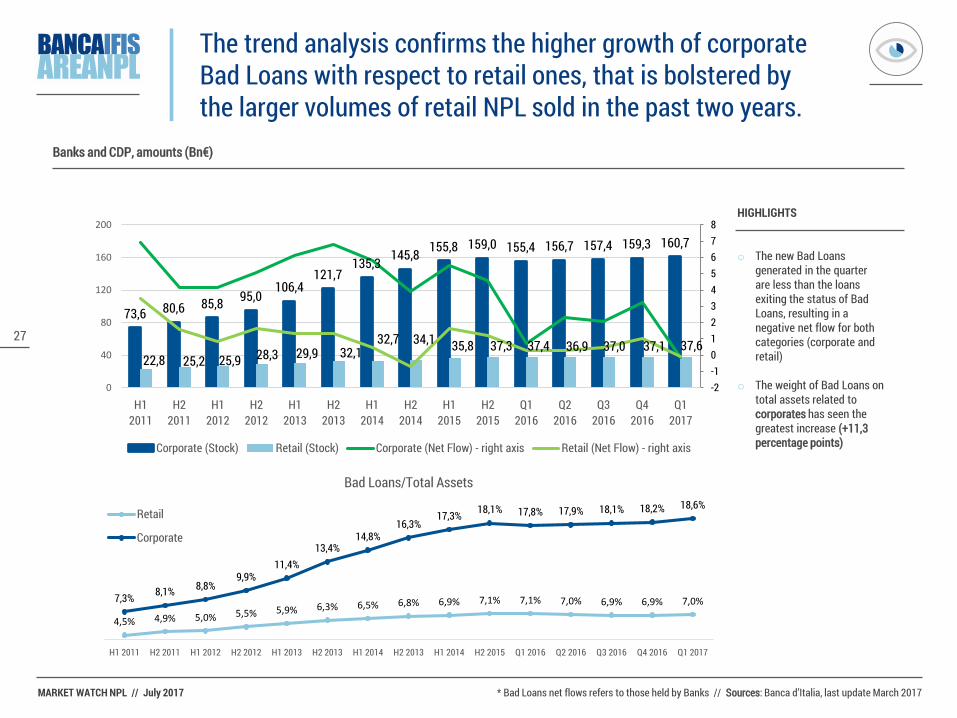
The trend analysis confirms the higher growth of corporate Bad Loans with respect to retail ones, that is bolstered by the larger volumes of retail NPL sold in the past two years.
* Bad Loans net flows refers to those held by Banks // Sources: Banca d’Italia, last update March 2017
HIGHLIGHTS
o The new Bad Loans generated in the quarter are less than the loans exiting the status of Bad Loans, resulting in a negative net flow for both categories (corporate and retail)
o The weight of Bad Loans on total assets related to corporates has seen the greatest increase (+11,3 percentage points)
4,5% 4,9% 5,0% 5,5% 5,9% 6,3% 6,5% 6,8% 6,9% 7,1% 7,1% 7,0% 6,9% 6,9% 7,0%7,3% 8,1% 8,8%9,9%
11,4%13,4%
14,8%16,3%
17,3% 18,1% 17,8% 17,9% 18,1% 18,2% 18,6%
H1 2011 H2 2011 H1 2012 H2 2012 H1 2013 H2 2013 H1 2014 H2 2013 H1 2014 H2 2015 Q1 2016 Q2 2016 Q3 2016 Q4 2016 Q1 2017
Bad Loans/Total Assets
Retail
Corporate
Banks and CDP, amounts (Bn€)
73,6 80,6 85,8 95,0106,4
121,7135,3 145,8 155,8 159,0 155,4 156,7 157,4 159,3 160,7
22,8 25,2 25,9 28,3 29,9 32,132,7 34,1 35,8 37,3 37,4 36,9 37,0 37,1 37,6
-2-1012345678
0
40
80
120
160
200
H12011
H22011
H12012
H22012
H12013
H22013
H12014
H22014
H12015
H22015
Q12016
Q22016
Q32016
Q42016
Q12017
Corporate (Stock) Retail (Stock) Corporate (Net Flow) - right axis Retail (Net Flow) - right axis

28
MARKET WATCH NPL // July 2017
The deep-dive on the industry split highlights the role of the “Construction” sector as the main driver behind Bad Loans growth in the last seven years.
*The Q1 2009 detail of the total assets related to each ATECO code is not available // Sources: Banca d’Italia, last update March 2017
Industry (ATECO Code)
Construction
Manufacturing
Wholesale/retail trade
Real estate
Agriculture
Accomodation and Ho.Re.Ca.
Transportation and storage
Professional and scientific act.
Administrative and support serv.
Information and communication
Q1 2009
Bn€ % on tot. NPL
% on Assets*
6,7 15,0% n.a.
10,7 23,9% n.a.
6,3 14,1% n.a.
2,7 6,1% n.a.
1,8 4,1% n.a.
1,3 3,0% n.a.
1,0 2,2% n.a.
0,7 1,6% n.a.
0,8 1,8% n.a.
0,6 1,3% n.a.
30,7 19,7% 19,2%
30,0 19,2% 14,5%
20,7 13,3% 15,0%
12,4 8,0% 10,4%
4,7 3,0% 10,7%
4,4 2,8% 11,70%
3,4 2,2% 8,5%
2,4 1,5% 5,9%
2,7 1,7% 13,3%
1,7 1,1% 10,5%
42,1 26,2% 31,7%
29,9 18,6% 14,4%
24,9 15,5% 17,3%
24,8 15,4% 21,7%
6,0 3,7% 13,9%
5,7 3,5% 15,7%
3,5 2,2% 10,1%
3,7 2,3% 8,8%
3,5 2,2% 17,2%
1,6 1,0% 9,2%
Q4 2013
Bn€ % on tot. NPL
% on Assets
Q1 2017
Bn€ % on tot. NPL
% on Assets
HIGHLIGHTS
o The top 4 industries (Construction, Manufacturing, Wholesale/Retail Trade, Real Estate) contribute to the 75,7% of the total NPL

29
MARKET WATCH NPL // July 2017
The Bad Loans concentrated in Southern Italy, although low in terms of stock, highlight a heavier credit deterioration when compared with the Region’s total assets.
* Bad Loans net flows refers to those held by Banks // Sources: Banca d’Italia, last update March 2017
HIGHLIGHTS
o The Bad Loans concentrated in Northern Italy grew by 125,3%in the period being reviewed
o Even though the Bad Loans stick to high stock in Northern Italy, in the early 2017 the net flows show negative values
o The ratios between Bad Loans and Assets keep on increasing for all regions
4,3% 4,7% 5,1% 5,6% 6,4%7,3% 8,1% 8,8% 9,4% 9,8% 9,9% 9,9% 10,0% 10,3% 10,9%
4,4% 4,9% 5,1% 5,6% 6,3%7,3% 7,9% 7,9% 8,3% 8,6% 8,0% 8,2% 8,5% 8,6% 8,9%
8,2% 8,9% 9,3%10,4% 11,1%
12,4%13,4% 13,7% 14,3% 15,1% 15,1% 15,2% 15,3% 15,5% 16,3%
H1 2011 H2 2011 H1 2012 H2 2012 H1 2013 H2 2013 H1 2014 H2 2013 H1 2014 H2 2015 Q1 2016 Q2 2016 Q3 2016 Q4 2016 Q1 2017
Bad Loans/Total AssetsNorthern Italy
Central Italy
Southern Italy
Banks, amounts (Bn€)
-2-10123456
0
20
40
60
80
100
120
Northern Italy (Stock) Central Italy (Stock)
Southern Italy and Islands (Stock) Northern Italy (Net Flow) - right axis
Central Italy (Net Flow) - right axis Southern Italy and Islands (Net Flow) - right axis

30
MARKET WATCH NPL // July 2017
Large writedowns on balance sheet and the relevant amount of Unlikely to Pay loans could support the growth of NPL transactions.
Sources: Banca d’Italia, last update March 2017
Bad Loans Coverage (%)
53%
55%
56%
58%
59%
61%
62%
Q12014
Q22014
Q32014
Q42014
Q12015
Q22015
Q32015
Q42015
Jan2016
Feb2016
Mar2016
Apr2016
May2016
Jun2016
Jul2016
Aug2016
Sept2016
Oct2016
Nov2016
Dec2016
Jan2017
Feb2017
Mar2017
61,75%
54,0%
HIGHLIGHTS
o The coverage index, despite a light decrease in March, is stable on cyclical high values after the huge leap observed in January
o The larger writedowns in early 2017 will potentially foster the future development of NPL transactions because of the narrower demand-supply gap
o Although the trend is decreasing, there is still a relevant amount of non performing exposures that could turn into Bad Loans in the next months
o There is wide room for growth suggested by writedownsincrease and size of the amount of Unlikely to Pay loans
0
20
40
60
80
100
120
140
160
H12010
H22010
H12011
H22011
H12012
H22012
H12013
H22013
H12014
H22014
H12015
H22015
Q12016
Q22016
Q32016
Q42016
Q12017
Past Due Unlikely to Pay Watchlist Restructured
Classification of Impaired Loans updated in 2015

31
MARKET WATCH NPL // July 2017 Sources: Banca IFIS NPL Market Database - Press releases and news
General statement
This publication is edited by Banca IFIS.The information contained herein, obtained from sources believed to be reliable by Banca IFIS,
are not necessarily complete, and their accuracy cannot be guaranteed.This publication is provided merely for purposes of illustration and information and
does not in any way represent financial and investment advice.
