*marketing 2012no v - capitec bank · scope and boundary page 6 03 chairman’s letter ... 2012...
TRANSCRIPT


Contents
01Capitec at a glancePage 4
02Scope and boundaryPage 6
03Chairman’s letterPage 8
04PerformancePage 12
05StakeholdersPage 33
06 ClientsPage 34
07EmployeesPage 44
08InvestorsPage 56
09Complianceofficer’s report
Page 62
10 SocietyPage 65
11 SuppliersPage 68
12Informationtechnology
Page 70
13GovernancePage 73
14Annual financialstatements
Page 107

pitec CCCap BankoldingsHolimitedLim
1999/025903/0619
(RSA incorporated)(
(Registered bank controlling company)
Listed on the JSE Limited
in the Banks sector
Summary of governance structure
page 74
Black ownership
10.1% Coral Lagoon20% Batho-Batho Trust
5% Capitec Bank Group Employee Empowerment Trust
31.9% Keabetsoe Holdings (Pty) Ltd
3.5% Koma Trust
5% Lemoshanang Trust
4.7% Mdumo Trust
5% Nozala Investment (Pty) Ltd
18% Regiments Capital (Pty) Ltd
3% Rorisang Badasi Investment Holdings (Pty) Ltd
Others holding less than 3% each
3.5% Thembeka49% Paladin Capital Financial Services (Pty) Ltd
11% PSG Group BEE Employee Trust
5.9% Steinhoff BEE Management Trust
8.4% Tokara BEE Trust
7.2% TSIBA Investment Corporation (Pty) Ltd
5.9% URC Cape Empowerment Trust
3.2% ZL Combi
Others holding less than 3% each
10.5%Limietberg BeleggingsMS du P le Roux Page 80
Board of directors
Page 83Executive management committee3.5%
PSG Group32.6%
8.2%Other director holdings
100%
75%
100%
100%
Keymatrix (Pty) Ltd1999/010617/07 RSA incorporated (Dormant)
Capitec Bank Limited1980/003695/06 RSA incorporated (Retail bank)1 Quantum Street, Techno Park, Stellenbosch 7600www.capitecbank.co.za
Capitec Properties (Pty) Ltd1998/007658/07 RSA incorporated(Property holding company)
Key Distributors (Pty) Ltd2001/000964/07 RSA incorporated (FMCG wholesaler)101 Samuel Evens Drive, Aeroton, Johannesburg 2190
Keynes Rational Corporate Services (Pty) Ltd1999/014817/07 RSA incorporated (Dormant)
Global OneAimed at individuals who insist on simplified, affordable bank products
Money transferin conjunction with various retailers
Affordable employeesalary transfer facility
Mobile bankingbringing Capitec Bank to the workplace
Ask Africa Orange AwardBest service provider overall and Best service provider – banks
Selected as one of the Royal Companies of 2012The leading growth companieslisted on the JSE
Selected as one of South Africa’s Top 100 Companies of 2012
2012 Gold Quill of merit
Fast-movingcustomergoods distributor
Products
Awards received
Employees 7 086 108
Revenue R7.4bn R217.1m
Total capitalisation
Equity R4.8bn R4.4m
Debt R18.8bn R23.0m
Total assets R23.6bn R27.4m
Branches/warehouses 507 4
Increase in branches/warehouses 52 –
Contribution to group earningsafter tax R1.1bn R1.7m
butor
108
R217.1m
R4.4m
R23.0m
Total assets R27.4m
Branches/warehouses 4
Increase in branches/warehouses 52 –
Contribution to group earningsafter tax R1.1bn R1.7m
Capitec Bannk Limited1980/003695/06 RSA incorporated (Retail bank)1 Quantum Street, Techno Park, Stellenbosch 7600www.capitecbank.co.za
Global OneAimed at individuals who insist on simplified, affordable bank products
Money transferin conjunction with various retailers
Affordable employeesalary transfer facility
Mobile bankingbringing Capitec Bank to the workplace
Ask Africa Orange Best service proBest service
Sele
Products
Awards received
Employees
Revenue
To
he
nge Awardprovider overall and
rvice provider – banks
Selected as one of the Royal Companies of 2012The leading growth companieslisted on the JSE
Selected as one of South Africa’s Top 100 Companies of 2012
2012 Gold Quill of merit
7 086
ue R7.4bn
Total capitalisation
Equity R4.8bn
Debt R18.8bn
t R23.6bn
507
ervices (Pty) Ltd
oyee Trust
nagement Trust
rust
vestment Corporation (Pty) Ltd
C Cape Empowerment Trust
ZL Combi
thers holding less than 3% each
01Capitecat aglance

simplicity
personal service
accessibility
affordability
revolutionisedbanking
6 Capitec Bank Holdings Limited Integrated Report 2012 7
The Capitec integrated report for the fi nancial year ended 29 February 2012 details the performance of the Capitec group. Capitec is an investment holding and bank controll ing company. I ts business operation is concentrated in Capitec Bank, its wholly owned banking subsidiary. Capitec Bank is a registered South African bank focusing on serving the smart individual who wants cost-effective, simplifi ed day-to-day money management ability. Capitec Properties holds one property in Techno Park, Stellenbosch, on which a new head office may be constructed in future. Key Distributors is a fast-moving consumer goods wholesale distributor. Its contribution to the Capitec group business is immaterial and as such the main focus of the narrative in the integrated report is on the activities and management processes in Capitec Bank.
This report follows on the 2011 integrated annual report . The 2012 report uses the Global Reporting Initiative (GRI3) reporting guidelines as part of the journey to develop a comprehensive yet simplifi ed report addressing issues considered to be material to stakeholders in the Capitec group. The report describes the fi nancial, social and environmental context in which the company operates, taking into account related sustainability considerations.
Enquiries:The company [email protected] Box 12451, Die Boord, Stellenbosch, 7600. Tel: +27(0)21 809 5900
Understanding the
operating context
The European sovereign debt crisis cont inued to impac t on investor sentiment throughout the past fi nancial year. Consumers continued to show the effects of the 2008 fi nancial crisis and the economic growth outlook has been muted; however, there was a slight increase in consumer confidence towards thefourth quarter of 2011. Infl ation continued to increase above the South African Reserve Bank’s target ceiling in the face of rising food and fuel prices. There has been much talk in the fi nancial media about a potential credit bubble developing in the unsecured market; however, this is due to lack of understanding of what has been driving the growth in unsecured credit. Competition in the unsecured credit market has, however, increased dramatically and has forced Capitec Bank to focus its attention on exceptional service delivery and other differentiating concepts.
Our business objectiveIncrease market share through • A technology-driven banking offer based
on simplicity and outstanding service• A single facility through which the
individual can service all his/her every-day money management needs, i.e. save, have access to credit and transact
• Increased client numbers by facilitating
increased accessibility to our banking offer to all South Africans
• A transparent, affordable price offer
Increase shareholder value by setting in place the infrastructure and building blocks required to ensure continued long-term, real growth in assets and profi tability. Quality book growth and cautious bad debt management are the main building blocks in the design of a healthy bank.
The strategy
Keep to the original building blocks • Affordability • Accessibility • Personal service• Simplicity
Differentiate Capitec Bank by ensuring a unique experience through• Price• Positioning• Service• Product
02Scope and boundary of the 2012 integrated report

simplicity
transparency
innovation
personal support
serviceexcellence
8 Capitec Bank Holdings Limited Integrated Report 2012 9
It is all about clients Acquiring new clients and encouraging existing clients to use more of our products and services is what we do. We’ve acquired 877 000 new active clients for the year.
As the bank has grown to a sizeable business with over 7 000 employees and 507 branches, we retain the focus and discipline of a small organisation. Every new employee, from the most experienced to the person in their first job, must participate in the same client orientation training course. During the year 2 694 employees (including replacements) were appointed and 1 863 jobs were created.
Capitec Bank has changed banking in South Africa. We focus on effectivesystem-driven solutions and centra lised control. We minimise administration and costs for our clients. We innovate and keep banking simple. This approach is attracting more and more high incomeclients that recognise that what we offer is all they need.
Capital and liquidity
In January 2011, when capital was needed to meet the requirements for the 2012 financial year, there was uncertainty surrounding the Basel III criteria for subordinated debt to qualify as capital. For this reason a rights issue, which raised R1.1 billion in ordinary share capital, was undertaken.
A private placement of ordinary share capital took place in November 2011.A total of R787 million in ordinary share capital was raised from domestic and international institutional shareholders at R172.00 per share. The price was at a discount of 7.6% to the volume weighted share price of the previous 30 days. This increased the number of ordinary shares in issue by 4.91%. We consider this placement a success. The sharply higher taxes on dividends and capital gains will increase the cost of capital.
The return on ordinary shareholders’ equity was 29% (2011: 34%) despite the increase in ordinary share capital in January and November 2011.
During the course of the 2012 fi nancial year, as the uncertainty surrounding subordinated debt diminished, we issued R619 million in subordinated debt to fund operational requirements. All the subordinated debt issued by Capitec qualifies for the phase-out in terms of Basel III criteria.
Retail deposits (the total of savings accounts and fixed deposits) have grown to R10 billion, increasing by 66% compared to a year ago. At Capitecsavings attract interest from the fi rst cent. The average retail call savings balance grew by 12% to over R1 800 during the year. Competitive fi xed deposit rates have seen fi xed deposits grow by 73% during the last year to R4 billion.
03Chairman’sletter

10 Capitec Bank Holdings Limited Integrated Report 2012 11
Unsecured creditThe unsecured credit market is showing continued growth. Unsecured credit (excluding credit card facilities) granted during the year to September 2011 grew by 56% according to the statistics published by the National Credit Regulator (“NCR”). The loan sales reported to the NCR by Capitec for the same period grew by 71%. The NCR reports loans disbursed as the total of all new credit, even if such loans are used to repay previous loans. In this report Capitec reports loan sales net of repayments. In other words, when a new loan is used to settle a current loan, we report only the additional money advanced. On this basis loans advanced grew by 35% for the full 2012 financial year to total R19.4 billion.
The term of credit granted has also continued to lengthen. During the 2012 year loans with terms longer than three years advanced by Capitec grew toR8.9 billion and totalled 46% of allloans advanced (2011: 25%).
There is a perception that a credit bubble is developing in the unsecured credit market as a result of continuing growth in the term and value of credit granted. We believe that growth will continue and that there is not a signifi cant threat to the market as long as affordability and client behaviour are considered when granting credit.
When the credit market in South Africa was governed by the Usury Act, credit was only available to prime clients who
Reducing margins,
increasing profi t
Loan revenue grew by 49% to R5.7 billion, but loan revenue to average gross loans and advances decreased to 39% from 46% in 2011. Interest rates on all loan products declined during the year as we continued to make lending more affordable for our clients. The lengthening term of the loan book also contributed to decreasing yields but increased the annuity income from loans and decreased the loan impair-ment expense.
Despite the fact that Capitec did not increase its fees in 2011, transaction fee income grew by 57% to R836 million. The number of clients as well as the number of monthly transactions per client increased during the past year because a growing number of clients are using Capitec for stop orders, debit orders and transfers. We have already announced our new fees for this year, which included no increase on our monthly fee and that the cost of internet and mobile payments (irrespective of the amount involved) will be reduced from R2.75 to R1.50 each.
Board of directorsThe core management team has been with the bank since its inception. They are supported by an informed board. During the year we had to say goodbye to Johnnie Solms who was a director of Capitec Bank since its inception. He made a solid and entrepreneurial contribution, for which we thank him. We are pleased that Jackie Huntley, a lawyer, could join us as a board member. From1 March 2012 our board will also benefi t from the presence of Jock McKenzie, who has been chairman and CEO of Caltex Petroleum Corporation.
Dividends
The directors declared a final dividend of 300 cents per ordinary share forthe year ended 29 February 2012 on1 March 2012, bringing the total dividends for the year to 425 cents per share. The fi nal dividend was paid on 26 March 2012.
The futureThe focus remains on clients, from systems that provide convenience and ease of access, to the support clients require to make decisions in their own best interest.
We shall continue to build our bank platform to deliver this support. New card services, loan products and mobile banking functions are planned for the coming year, as well as less visible improvements to our infrastructure. All of these will make banking easier and more cost-effective for our clients.
We are confi dent that this and the 55 new branches planned for the current year will continue to grow our client base as in the past.
On behalf of the board
Michiel le RouxChairman
could provide security. Interest rates were capped and credit providers sold credit insurance in order to increase their returns. It was difficult for the ordinary South African to get credit. Subsequently, the exemption to the Usury Act for loans underR10 000 with terms shorter than three years, opened the market to microlenders and interest rates increased dramatically.
When Capitec entered the market, our aim was to reduce the cost of credit to the client and make unsecured credit available to a wider market.
The implementation of the National Credit Act in June 2007 capped interest rates and fees but did not restrict the term or the amount of credit that could be granted. This spurred growth in the market.
The impact of the resulting lengthening loan terms and increasing loan values to clients can be measured best by comparing loan instalments to the disposable income of clients.
An analysis of our credit granting for the last quarter of the 2012 financial year compared to the last quarter of the 2009 financial year indicates that average compounded growth in credit granted was 97% while the compounded growth in the average loan instalment was only 9.8%. Disposable income grew by 9.2% per year during the same period, slightly more than wage infl ation.
The percentage of loan instalments on loans with terms longer than 12 months to disposable income in 2012 is 40% compared to 39% in 2009. The client’s disposable income has not been signif-icantly impacted by the changes taking place in the market and according to our analysis our clients are not over-indebted.
The granting of longer-term, higher-value loans did not have a negative impact on the quality of Capitec’s loan book. The gross loan book grew by R7.5 billion during the 2012 fi nancial year to R18.4 billion. Arrears grew by R306 million and arrears to loans and advances was 5.1% compared to 5.7% in 2011 (2010: 6.2%). This is because longer-term loans are granted to our better rated clients with lower credit risk.
The gross loan impairment expense (before recover ies) increased byR692 million (64%). This increase is a result of the growth in the size of our loan book and not as a result of higher risk in the loan book.

simplifiedessentialbanking
pay
save
borrow
12 Capitec Bank Holdings Limited Integrated Report 2012 13
04Performance

14 Capitec Bank Holdings Limited Integrated Report 2012 15
Statement of economic value added For the year ended 29 February 2012
Capitec contributes value to the local economy and creates wealth for its stakeholders as refl ected below
2012 2011R’000 R’000
Direct economic value generated
Interest income 4 346 902 2 808 543
Loan fee income 1 657 018 1 273 574
Transaction fee income 1 360 308 883 040
Dividend income 1 532 571
Net movement in fi nancial instruments held at fair value through profi t or loss 12 070 (210)
Non-banking sales 217 145 219 298
Other income 679 251
Net impairment charge on loans and advances to clients (1 604 190) (988 177)
5 991 464 4 196 890
Economic value distributed
To suppliers in payment of operating expenses 1 708 113 1 236 114
To employees 1 267 326 931 811
Ordinary dividends 317 939 201 882
Preference dividends 19 419 15 754
Interest paid to providers of wholesale funding 555 896 435 487
Interest paid to savings clients 466 478 315 873
To providers of funds 1 359 732 968 996
Normal tax 615 889 297 044
Value added tax 241 777 196 490
Secondary tax on companies 33 584 21 763
Unemployment insurance 6 838 5 012
Skills development levies 12 341 8 662
Property rates and taxes 96 28
To government 910 525 528 999
To the community 1 209 416
5 246 905 3 666 336
Economic value retained for expansion and growth
Retained income 756 982 438 388
Depreciation and amortisation 173 518 126 697
Deferred tax (185 941) (34 531)
744 559 530 554
Headline earnings per share up
49%Final dividend per share
300 centsReturn on equity
29%Clients
3.7 millionEarnings up
68%
Highlights

16 Capitec Bank Holdings Limited Integrated Report 2012 17
Keyperformance indicators
2012 2011 Change % 2010 2009
Profi tability
Income from banking operations Rm 5 646 3 741 51 2 556 1 983
Net loan impairment expense Rm (1 604) (988) 62 (548) (468)
Banking operating expenses Rm (2 486) (1 813) 37 (1 368) (1 065)
Non-banking operations Rm 3 - 2 6
Tax Rm (464) (284) 63 (193) (137)
Preference dividend Rm (19) (16) 19 (14) (19)
Earnings attributable to ordinary shareholders
• Basic Rm 1 075 640 68 435 300
• Headline Rm 1 078 640 68 437 302
Cost-to-income ratio banking activities % 44 48 54 54
Return on ordinary shareholders’ equity % 29 34 32 27
Earnings per share
• Attributable cents 1 122 757 48 525 364
• Headline cents 1 125 757 49 527 366
• Diluted attributable cents 1 096 730 50 509 357
• Diluted headline cents 1 099 730 50 511 359
Dividends per share
• Interim cents 125 85 47 55 30
• Final cents 300 205 46 155 110
• Total cents 425 290 47 210 140
Dividend cover x 2.6 2.6 2.5 2.6
Assets
Net loans and advances R’m 16 863 10 071 67 5 225 2 982
Cash and cash equivalents R’m 4 551 2 842 60 2 567 1 514
Investments R’m 1 199 989 21 1 306 150
Other R’m 1 009 538 88 390 323
Total assets R’m 23 622 14 440 64 9 488 4 969
Liabilities
Deposits R’m 17 692 10 450 69 7 360 3 317
Other R’m 744 539 38 400 246
Total liabilities R’m 18 436 10 989 68 7 760 3 563
Equity
Shareholders’ funds R’m 5 185 3 451 50 1 728 1 406
Capital adequacy ratio % 39 41 37 43
Net asset value per ordinary share cents 4 962 3 418 45 1 896 1 512
Share price cents 18 500 15 901 16 8 200 3 001
Market capitalisation R’m 18 367 14 850 24 6 805 2 485
Number of shares in issue ’000 99 282 93 388 6 82 983 82 798
2012 2011 Change % 2010 2009
Equity (continued)
Share options
• Number outstanding ’000 3 087 4 222 (27) 5 322 5 713
• Number outstanding to shares in issue % 3 5 (40) 6 7
• Average strike price cents 4 358 3 510 24 2 888 2 487
• Average time to maturity months 16 20 (20) 24 25
OperationsBranches 507 455 11 401 363
Employees 7 194 5 331 35 4 154 3 414
Active clients ’000 3 706 2 829 31 2 122 1 545
ATMs Own 550 479 15 417 368
Partnership 1 526 1 182 29 821 571
Capital expenditure R’m 381 235 62 149 133
SalesLoansValue of loans advanced Rm 19 393 14 318 35 8 645 6 273
Number of loans advanced '000 4 648 3 907 19 2 899 2 717
Average loan amount R 4 172 3 665 14 2 982 2 309
Repayments Rm 16 173 12 117 33 8 288 6 744
Gross loans and advances Rm 18 408 10 916 69 5 607 3 238
Loans past due (arrears) Rm 932 626 49 350 326
Arrears to gross loans and advances % 5.1 5.7 6.2 10.1
Provision for doubtful debts Rm 1 545 845 83 382 256
Provision for doubtful debts to gross loans
and advances % 8.4 7.7 6.8 7.9
Arrears coverage ratio % 166 135 109 79
Loan revenue Rm 5 660 3 800 49 2 603 2 032
Loan revenue to average gross loans and advances % 38.6 46.0 58.9 74.8
Gross loan impairment expense Rm 1 780 1 088 64 620 514
Recoveries Rm 176 100 76 72 46
Net loan impairment expense Rm 1 604 988 62 548 468
Net impairment expense to loan revenue % 28.3 26.0 21.1 23.0
Net impairment to average gross loans
and advances % 10.9 12.0 12.4 17.2
DepositsWholesale deposits Rm 7 162 3 954 81 3 669 1 690
Retail call savings Rm 6 348 3 933 61 2 346 1 306
Retail fi xed savings Rm 4 015 2 316 73 1 148 265
Net transaction fee income Rm 836 532 57 295 160

18 Capitec Bank Holdings Limited Integrated Report 2012 19
Results in briefActive clients grew by 31% and Capitec Bank now provides easy money management solutions to 3.7 million clients. The branch network expanded by 52 branches to 507 branches and clients are serviced by 2 076 ATMs.
Capitec’s attractiveness to the funding market continued to grow and funding from a number of sources was available to fund the growth in the loan book and expand the branch network. Total wholesale deposits at the end of February 2012 amounted to R7.2 billion representing growth of 81% since February 2011. Retail call savings grew by 61% to R6.3 billion and the retail fi xedsavings balance grew by 73% to R4.0 billion. The average maturity of retail fi xed savings as at 29 February 2012 was 15 months compared to 13 months at the end ofFebruary 2011.
During the year 4.6 million loans were advanced (2011:3.9 million), increasing the value of loans advanced by 35% to R19.4 billion. Loans advanced are refl ected net of internal loan consolidations. Loans with terms of 12 months and longer contributed 71% of total loan sales. Sales of 60-month loans totalled R6.2 billion and contributed to a 69% increase in the gross loan book to R18.4 billion.
Net loan revenue grew by 49% to R5.7 billion. The growth in loan revenue exceeded growth in loan sales as the annuity income from the lengthening of the term ofthe loan book during the last number of years continued to have an impact.
The net loan impairment expense as a percentage of average loans and advances was 10.9% compared to 12.0% for 2011. The net loan impairment expense of R1.6 billion grew by 62% compared to 2011. The gross loan impairment expense increased by R692 million. The growth in the loan book contributed R731 million to this
increase and the improvement in default rates from 5.7% as at February 2011 to 5.1% decreased the charge by R12 million.
Net transaction fee income (non-lending) grew by 57% to R836 million, refl ecting the growth in client numbers and transaction volumes. This income covered 34% of banking operating expenses compared to 29% in 2011. The target is for this income to cover 40% of operating expenses.
The cost-to-income ratio of banking activities improved from 48% for the 2011 fi nancial year to 44% for the 2012 fi nancial year. Income from banking increased by 51%, while operating expenses increased by 37%, mainly due to growth in the number of branches and employees. Employment costs, including training, comprise 53% of operating expenses compared to 54% for the 2011 fi nancial year.
Headline earnings attributable to ordinary shareholders increased by 68% to R1.1 billion.
The return on ordinary shareholders’ equity decreased from 34% to 29% due to the increase in ordinary share capital of R1.1 billion from the rights issue that took place in January 2011 and R787 million from the private placement in November 2011.
Loans advancedLoans advanced increased by 35% and amountedto R19.4 billion
Loans with terms of 12 months and longer contributed 71% of total loans advanced (2011: 67%) and increased by 45% to R13.8 billion. Sales of loans with terms shorter than 12 months increased by 16% and totalled R5.6 billion.
The maximum loan value increased to R150 000 from R120 000 in the previous fi nancial year and the maximum loan term remained 60 months.
Loans advanced are reflected net of internal loan consolidations. The National Credit Regulator refl ects credit granted gross of internal and external loan consolidations in its statistics. Credit granted by the market is therefore infl ated.
The 60-month loan product, launched during the 2011 fi nancial year, contributed R6.2 billion in sales and totalled 32% of sales. Amendments to credit granting criteria during the 2012 fi nancial year enabled a larger number of clients to qualify for 60-month loans and contributed to the increase in sales of the product. Credit criteria were adjusted, taking the bank’s risk appetite into consideration and ensuring that the indebtedness of clients measured against disposable income remained in line.
The lower pricing of loans as dictated by market forces further contributed to the increase in longer-term loan sales as affordability for clients improved.
The increase in the granting of 60-month loans led toa decrease in sales of the 24- to 48-month loan products as clients qualifi ed for loans with a longer term without increasing instalments.
The one-month loan was the second highest contributor to loan sales amounting to R3.9 billion and 20% of sales.
The ease of access to these loans via cellphone and the ATM network continued to contribute to the increase in sales.
The definition of the number of loans advanced as refl ected in the key performance indicators was amended to count one multiloan per month and not each draw-down on a multiloan as a loan advanced. Statistics for comparative years were restated.
Financialdirector’sreport
VALUE OF LOANS ADVANCED BY PRODUCT R’m
2 7312 496
1 039
2 1181 288
3 1853 943
1 6721 4521 098
836574
777
1 029792
1 3771 107
6 197
1 3 6 12 18 24 36 48 60
(Months)2011 2012

20 Capitec Bank Holdings Limited Integrated Report 2012 21
Loan revenueNet loan revenue increased 49% to R5.7 billion
Net loan revenue consists of interest, origination fees and monthly administration fees net of insurance.
The loan pricing structure was amended during the year to include price differentiation according to the risk profi le of clients. This differentiation will be expanded and refi ned during the 2013 fi nancial year.
Loans advanced are priced in compliance with the National Credit Act (NCA) which prescribes ceiling interest rates. Loans are advanced at fi xed interest rates and clients are therefore not exposed to interest rate fl uctuations. Interest on all loan products remains fi xed regardless of whether the prescribed ceiling rates increase or decrease after the loan is granted. The uncertainty that existed around this treatment at the end of the 2011 fi nancial year has been settled and the Capitec Bank treatment was confi rmed as correct.
Clients do not pay extra for the credit life and retrenchment insurance which is provided on the loan products with terms of six months and longer. The cost of credit life and retrenchment insurance is carried by the bank while competitors add these charges to their loan pricing. The insurance expense amounted to R182 million(2011: R119 million).
Growth in net loan revenue exceeded growth in loan sales as the annuity income from the lengthening of the term of the loan book during the last number of years continued to have an impact. Interest received on loans increased by 58% to R4.2 billion.
As loan sales increasingly include longer-term, higher-value loans the lower yields on these products do, however, continue to affect loan revenue. Yields on all loan products declined during 2012, as our efforts to make lending
Aug Feb Aug Feb
2010 2011 2011 2012
Gross loans and advances Rm 7 796 10 916 14 495 18 408
Loans past due (arrears) Rm 361 626 649 932
Arrears to gross loans and advances % 4.6 5.7 4.5 5.1
Provision for doubtful debts Rm 552 845 1 102 1 545
Provision for doubtful debts to gross loans and advances % 7.1 7.7 7.6 8.4
Provision/arrears coverage ratio* % 153 135 170 166
* The provision/arrears coverage ratio expresses the provision for doubtful debts as a percentage of the loans
in arrears. The ratio is therefore affected by the arrears performance of the month in which it is measured,
while the impairment model is used to determine the provision for doubtful debts over the loan period.
The ratio should therefore not be considered in isolation.
more affordable to our clients continued. However, the rate of decline in yields was lower than during the 2011 fi nancial year due to the fact that the last cut in repo rates by the South African Reserve Bank took place inNovember 2010.
Loan initiation and monthly administration fee income grew by 30% to R1.7 billion.
Loan book, arrears and provision for doubtful debtsGross loan book grew by 69% to R18.4 billionArrears as a percentage of gross loans and advances improved to 5.1%
Gross loans and advances with terms of 12 months and longer totalled R17.7 billion at fi nancial year-end compared to R10.3 billion at the end of February 2011. These loans comprise 96% of the loan book compared to 94% in 2011.
The 60-month loan product contributed R6.7 billion, or 37%, to the gross loan book due to the increase in sales of the product since it was launched in December 2010.
* Net – loans and advances net of impairment provisions
It should be noted that the above chart is not a maturity analysis. Clients repay part of the capital on each of the product types in the following
month, the month thereafter and so forth. In a mature book the capital repayment for the following month will approximate the balance divided
by the term. A maturity analysis is set out in note 6 to the annual fi nancial statements.
979
461
641
378
425
216
507
277
-119 -182
1 112
1 056
757
499
348309211
618
93235
Insurance
LOAN REVENUE BY PRODUCT R’m
2 3 6 12 18 24 36 48 60
(Months)2011 2012
LOAN BOOK BY PRODUCT (R’m)
(Months)
2011 Gross
2011 Net*
2012 Gross
2012 Net*
80
Other 1 3 6 12 6048362418
123 3346
213249
197234
680481
606416
9651 242
8901 097
1 8031 817 1 680
1 643
2 6934 470
2 4964 142
1 0256 721
9616 258
3 138 2 942
2 933 2 710
138106
115 89
181257 160228
22 Capitec Bank Holdings Limited Integrated Report 2012 23
Loans past due (arrears) comprise the full outstanding balance at risk on loans and advances that are in arrears from one day to three months, i.e. if a payment of R1 000 is missed on a loan with an outstanding balance of R30 000, the full outstanding balance of R30 000 is considered to be in arrears.
The gross loan book grew by R7.5 billion compared to February 2011. In contrast arrears grew by R306 million.
Loans and advances more than three months in arrears which were written off amounted to R1.079 billion compared to R625 million in 2011. The increase in the amount written off is a function of loan book growth and does not necessarily result from deterioration in the quality of the loan book for the year.
The quality of the loan book is refl ected in the arrears percentage to gross loans and advances, which has improved from 5.7% at the end of February 2011 to 5.1% at February 2012 despite deterioration in the percentage from 4.5% in August 2011. The arrears percentage refl ects the seasonal trend of higher default rates following the traditional vacation months of December and January. The non-payment of government contract employees in certain departments influenced the arrears and impairment charge as government employees comprise 56% of the loan book.
The provision for doubtful debts as a percentage of gross loans and advances increased from 7.6% at the endof August 2011 to 8.4%. This can partly be attributedto the fluctuation in arrears because the impairment provision model is very sensitive to even slight increases in default rates.
The growth in the less mature, longer-term books during the last six months of the fi nancial year also infl uenced the provision. The provision calculated by the impairment model is based on historical data and the provision on
newer, longer-term loan books like the 48- and 60-month loan books is calculated by stretching the historical information that is available on the shorter, more mature 36-month loan book. The fact that the past does not always reflect current economic circumstances also needs to be taken into consideration where the total loan book is growing rapidly and increasingly consists of newer, less mature loan products. Uncertainty surrounding the performance of longer-term loan books is also greater at the beginning of the term of the loans. These factors are addressed by increasing the IAS 39 provision on the loan books with terms of 12 months and longer. The additional provision is high at the beginning of the term of the loan and decreases as the loan matures. Effectively this steepens the provisioning curve in the beginning of the product’s lifespan. The breakdown of the loan book between current loans, loans in arrears, as well as the movement in the loan provision account is set out in note 6 to the financial statements.
The weighted average outstanding term of the 12 month and longer loan books as at February 2012 is 45 months (2011: 31 months), while the outstanding term of the loan books with terms shorter than 12 months is 3.5 months (2011: 2 months). The weighted average outstanding term of the total book is 45 months. This compares to29 months at the end of 2011 and refl ects the impact of the 60-month loan product.
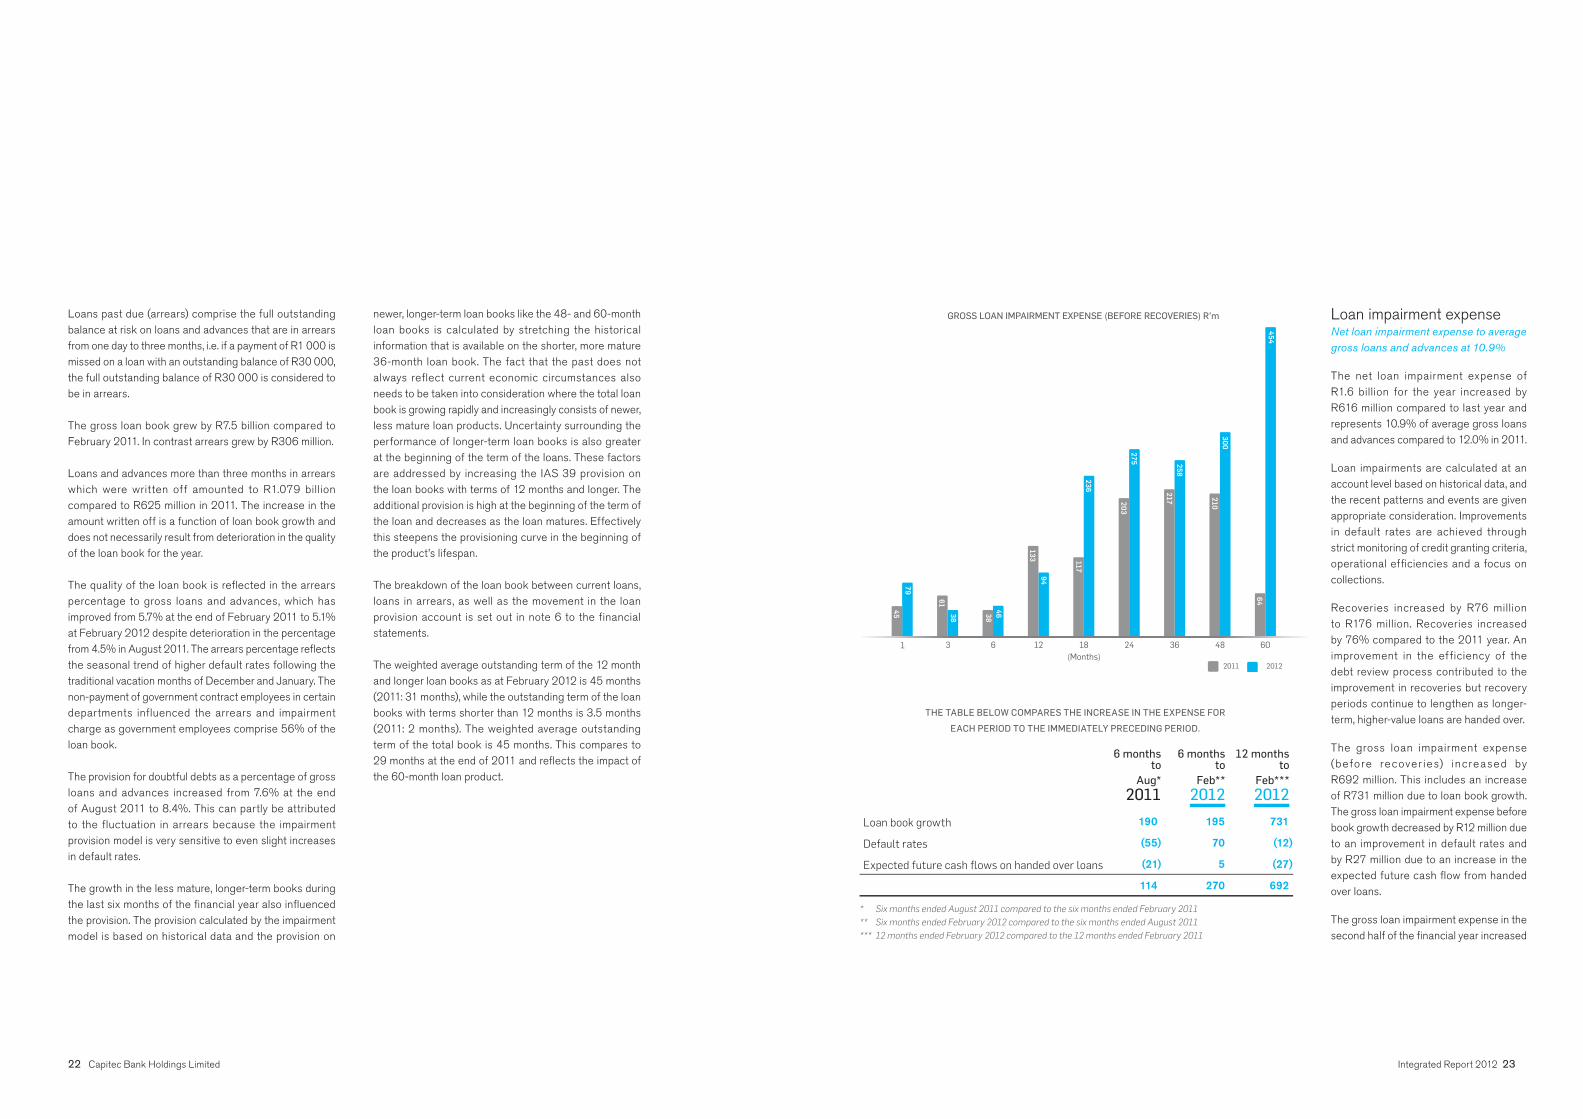
Loan impairment expense Net loan impairment expense to average gross loans and advances at 10.9%
The net loan impairment expense of R1.6 billion for the year increased by R616 million compared to last year and represents 10.9% of average gross loans and advances compared to 12.0% in 2011.
Loan impairments are calculated at an account level based on historical data, and the recent patterns and events are given appropriate consideration. Improvements in default rates are achieved through strict monitoring of credit granting criteria, operational effi ciencies and a focus on collections.
Recoveries increased by R76 million to R176 million. Recoveries increased by 76% compared to the 2011 year. An improvement in the efficiency of the debt review process contributed to the improvement in recoveries but recovery periods continue to lengthen as longer-term, higher-value loans are handed over.
The gross loan impairment expense (before recover ies) increased byR692 million. This includes an increase of R731 million due to loan book growth. The gross loan impairment expense before book growth decreased by R12 million due to an improvement in default rates and by R27 million due to an increase in the expected future cash fl ow from handed over loans.
The gross loan impairment expense in the second half of the fi nancial year increased
6 monthsto
6 monthsto
12 monthsto
Aug* 2011
Feb** 2012
Feb*** 2012
Loan book growth 190 195 731
Default rates (55) 70 (12)
Expected future cash fl ows on handed over loans (21) 5 (27)
114 270 692
* Six months ended August 2011 compared to the six months ended February 2011
** Six months ended February 2012 compared to the six months ended August 2011
*** 12 months ended February 2012 compared to the 12 months ended February 2011
THE TABLE BELOW COMPARES THE INCREASE IN THE EXPENSE FOR
EACH PERIOD TO THE IMMEDIATELY PRECEDING PERIOD.
45464
300210
258217
275203
236117
94133
46383861
7945
1 3 6 12 18 24 36 48 60(Months)
2011 2012
GROSS LOAN IMPAIRMENT EXPENSE (BEFORE RECOVERIES) R’m
24 Capitec Bank Holdings Limited Integrated Report 2012 25
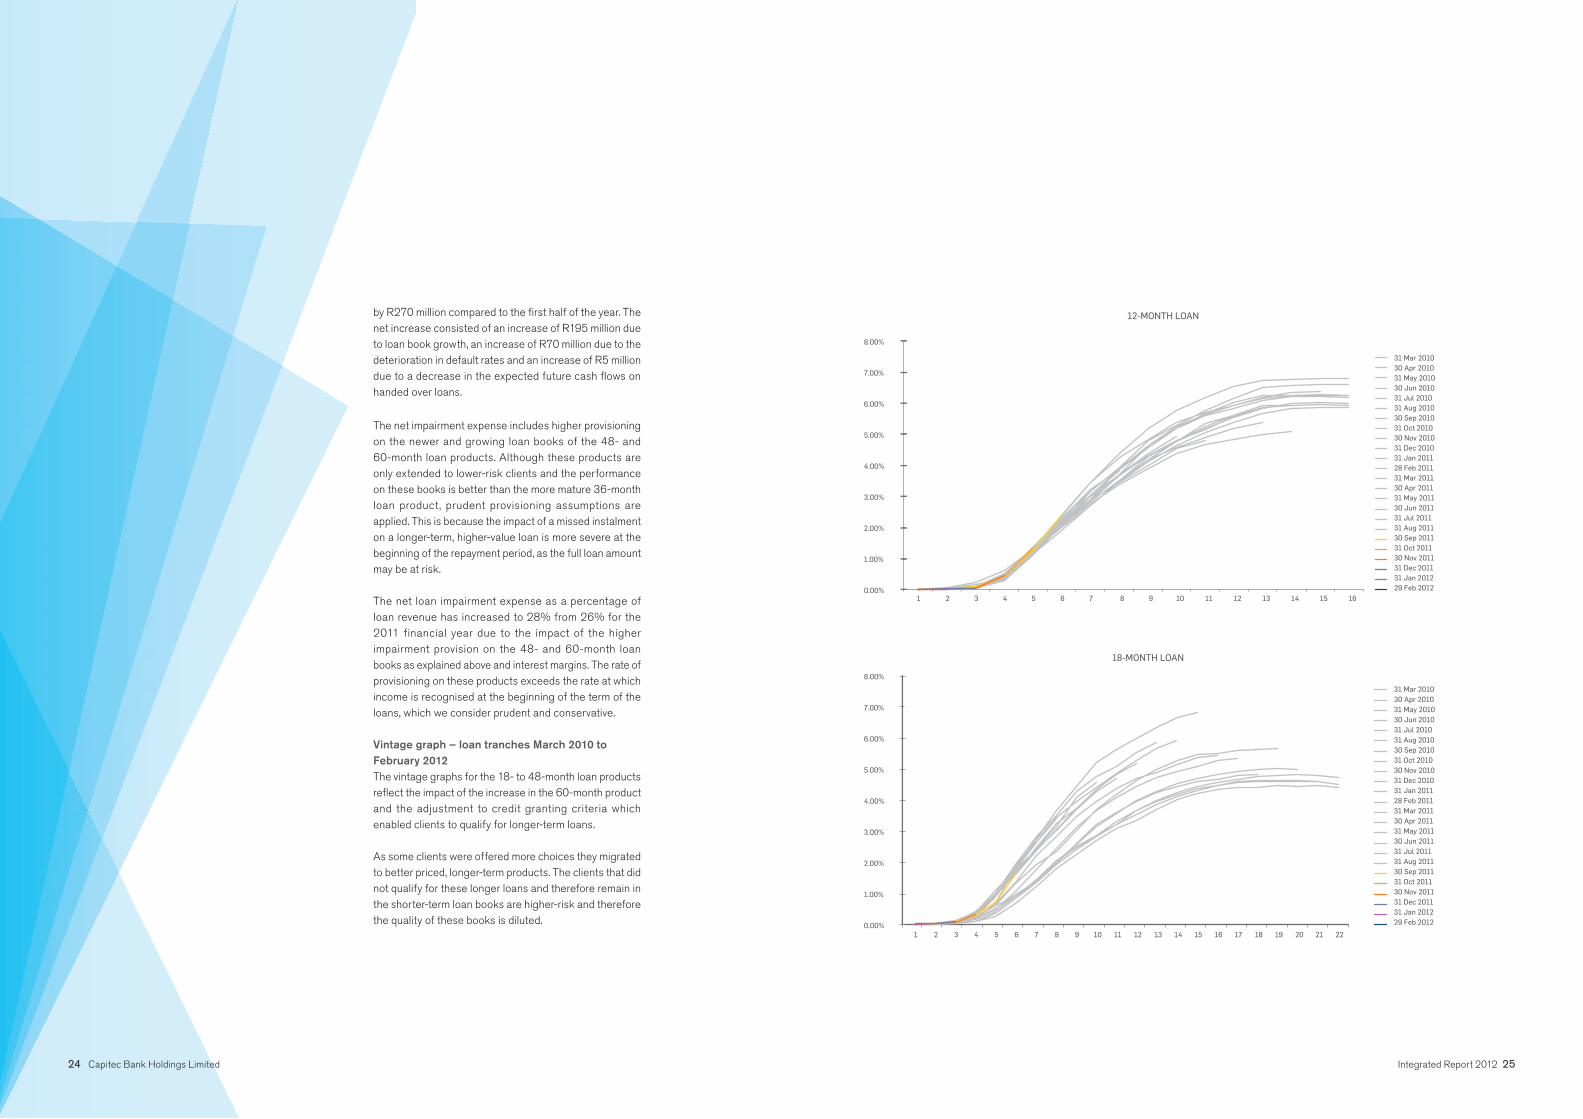
by R270 million compared to the fi rst half of the year. The net increase consisted of an increase of R195 million due to loan book growth, an increase of R70 million due to the deterioration in default rates and an increase of R5 million due to a decrease in the expected future cash fl ows on handed over loans.
The net impairment expense includes higher provisioning on the newer and growing loan books of the 48- and 60-month loan products. Although these products are only extended to lower-risk clients and the performance on these books is better than the more mature 36-month loan product, prudent provisioning assumptions are applied. This is because the impact of a missed instalment on a longer-term, higher-value loan is more severe at the beginning of the repayment period, as the full loan amount may be at risk.
The net loan impairment expense as a percentage of loan revenue has increased to 28% from 26% for the 2011 financial year due to the impact of the higher impairment provision on the 48- and 60-month loan books as explained above and interest margins. The rate of provisioning on these products exceeds the rate at which income is recognised at the beginning of the term of the loans, which we consider prudent and conservative.
Vintage graph – loan tranches March 2010 to February 2012The vintage graphs for the 18- to 48-month loan products refl ect the impact of the increase in the 60-month product and the adjustment to credit granting criteria which enabled clients to qualify for longer-term loans.
As some clients were offered more choices they migrated to better priced, longer-term products. The clients that did not qualify for these longer loans and therefore remain in the shorter-term loan books are higher-risk and therefore the quality of these books is diluted.
12-MONTH LOAN
0.00%
1.00%
2.00%
3.00%
4.00%
5.00%
6.00%
7.00%
8.00%
1 2 3 4 5 6 7 8 9 10 11 12 13 14 15 16
31 Mar 2010
30 Apr 2010
31 May 2010
30 Jun 2010
31 Jul 2010
31 Aug 2010
30 Sep 2010
31 Oct 2010
30 Nov 2010
31 Dec 2010
31 Jan 2011
28 Feb 2011
31 Mar 2011
30 Apr 2011
31 May 2011
30 Jun 2011
31 Jul 2011
31 Aug 2011
30 Sep 2011
31 Oct 2011
30 Nov 2011
31 Dec 2011
31 Jan 2012
29 Feb 2012
18-MONTH LOAN
0.00%
1.00%
2.00%
3.00%
4.00%
5.00%
6.00%
7.00%
8.00%
1 2 3 4 5 6 7 8 9 10 11 12 13 14 15 16 17 18 19 20 21 22
31 Mar 2010
30 Apr 2010
31 May 2010
30 Jun 2010
31 Jul 2010
31 Aug 2010
30 Sep 2010
31 Oct 2010
30 Nov 2010
31 Dec 2010
31 Jan 2011
28 Feb 2011
31 Mar 2011
30 Apr 2011
31 May 2011
30 Jun 2011
31 Jul 2011
31 Aug 2011
30 Sep 2011
31 Oct 2011
30 Nov 2011
31 Dec 2011
31 Jan 2012
29 Feb 2012

26 Capitec Bank Holdings Limited Integrated Report 2012 27
24-MONTH LOAN
0.00%
1.00%
2.00%
3.00%
4.00%
5.00%
6.00%
7.00%
1 2 3 4 5 6 7 8 9 10 11 12 13 14 15 16 17 18 19 20 21 22 23 24
31 Mar 2010
30 Apr 2010
31 May 2010
30 Jun 2010
31 Jul 2010
31 Aug 2010
30 Sep 2010
31 Oct 2010
30 Nov 2010
31 Dec 2010
31 Jan 2011
28 Feb 2011
31 Mar 2011
30 Apr 2011
31 May 2011
30 Jun 2011
31 Jul 2011
31 Aug 2011
30 Sep 2011
31 Oct 2011
30 Nov 2011
31 Dec 2011
31 Jan 2012
29 Feb 2012
36-MONTH LOAN
0.00%
0.50%
1.00%
1.50%
2.00%
2.50%
3.00%
3.50%
4.00%
1 2 3 4 5 6 7 8 9 10 11 12 13 14 15 16 17 18 19 20 21 22 23 24
31 Mar 2010
30 Apr 2010
31 May 2010
30 Jun 2010
31 Jul 2010
31 Aug 2010
30 Sep 2010
31 Oct 2010
30 Nov 2010
31 Dec 2010
31 Jan 2011
28 Feb 2011
31 Mar 2011
30 Apr 2011
31 May 2011
30 Jun 2011
31 Jul 2011
31 Aug 2011
30 Sep 2011
31 Oct 2011
30 Nov 2011
31 Dec 2011
31 Jan 2012
29 Feb 2012
48-MONTH LOAN
0.00%
0.50%
1.00%
1.50%
2.00%
2.50%
3.00%
1 2 3 4 5 6 7 8 9 10 11 12 13 14 15 16 17 18 19 20 21 22
31 Mar 2010
30 Apr 2010
31 May 2010
30 Jun 2010
31 Jul 2010
31 Aug 2010
30 Sep 2010
31 Oct 2010
30 Nov 2010
31 Dec 2010
31 Jan 2011
28 Feb 2011
31 Mar 2011
30 Apr 2011
31 May 2011
30 Jun 2011
31 Jul 2011
31 Aug 2011
30 Sep 2011
31 Oct 2011
30 Nov 2011
31 Dec 2011
31 Jan 2012
29 Feb 2012
60-MONTH LOAN
0.00%
0.20%
0.40%
0.60%
0.80%
1.00%
1.20%
1.40%
1.60%
1.80%
2.00%
1 2 3 4 5 6 7 8 9 10 11 12 13 14 15 16 17 18 19 20 21 22 23 24
31 Mar 2010
30 Apr 2010
31 May 2010
30 Jun 2010
31 Jul 2010
31 Aug 2010
30 Sep 2010
31 Oct 2010
30 Nov 2010
31 Dec 2010
31 Jan 2011
28 Feb 2011
31 Mar 2011
30 Apr 2011
31 May 2011
30 Jun 2011
31 Jul 2011
31 Aug 2011
30 Sep 2011
31 Oct 2011
30 Nov 2011
31 Dec 2011
31 Jan 2012
29 Feb 2012

28 Capitec Bank Holdings Limited Integrated Report 2012 29
Transacting servicesNet transaction fee income grew by 57% to R836 million
Gross transaction fee income grew by 54% to R1.4 billion. Growth in fee income exceeded growth in client numbers despite the fact that Capitec Bank did not increase its fee structure during the 2012 fi nancial year.
The number of clients using stop orders, debit orders and transfers increased and gross fees from these transactions grew by 67% compared to February 2011. The fee income per client utilising these transactions also increased.
Gross acquiring income increased in excess of 100% as the number of PoS (point-of-sale) terminals in operation more than doubled.
Transaction fee expenses grew by 49% to R524 million.
Net transaction fee income covered 34% of banking operating expenses compared to 29% in 2011, making progress towards the target of 40%.
FundingTotal funding grew to R17.5 billion
Retail call savings deposits grew by 61% to R6.3 billion. The increase is largely due to a 49% increase in the number of non-lending, transaction fee clients since February 2011.
Retail fixed savings products, with a maturity of up to 60 months, grew by 73% to R4.0 billion at the end of February 2012. The number of clients with fi xed deposit accounts grew by 41% compared to February 2011, while the average balance per client grew by 23%. As at 29 February 2012 retail fi xed savings comprised 36% (2011: 37%) of term funding. It remains management ’s goal to maintain this percentage at about 40% as fi xed term retail funding remains attractive due to the lower pricing and lower concentration and refi nancing risk. The average maturity of retail fi xed savings as at February 2012 was 15 months compared to 13 months at the end of February 2011.
Two bonds totalling R1.3 billion were issued under the Domestic Medium Term note (“DMTN”) programme in May 2011 and bonds in the amount of R490 million that matured were repaid. Subordinated debt funding in the amount of R619 million was procured of which R575 million is listed under the DMTN programme.
Funding instruments with more varied maturities were issued as Capitec’s profi le became more established in the market and the cost of credit decreased. Funding with terms of 12 months or less in issue increased to R2.5 billion from R842 million in February 2011. The term of funding is matched to the term of the loan book. Total wholesale deposits atthe end of February 2012 amounted to R7.2 billion representing growth of 81% since February 2011.
A capital repayment amounting toR90 million in terms of a foreign bilateral funding agreement takes place in March 2012. Bonds totalling R322 million issued in terms of the DMTN programme mature in May 2012. Further amounts will be issued in terms of the registered bond programme at that stage.
LiquidityLiquidity management remains conservative
Management ’s l iquidit y philosophy remains cautious and conservative. The management of liquidity continues to take preference over the optimisation of profi ts.
Despite diffi cult economic conditions the bank has not experienced volatility in its retail funding base and Capitec complies with the two new Basel III liquidity ratios: the liquidity coverage ratio and the net stable funding ratio.
Funding that is surplus to operational requirements is managed in terms of the liquidity philosophy to ensure that obligations can be met as they become due.
Surplus funding is invested in interest-bearing instruments and instruments are selected to minimise the net carrying cost of surplus funds.
Instruments with maturities greater than three months from the date of acquisition are included in investments and comprise treasury bills issued by the South African National Treasury.
The liquidity position as at 29 February 2012 is set out in note 27.6 to the annual fi nancial statements.
CapitalSuccessful private placement raised R787 million in ordinary share capital
In order to optimise the group’s capital base, R787 million in ordinary share capital was raised in November 2011 by means of a private placement. This capital, together with the subordinated debt procured during the year, enabled the group to maintain a risk-weighted capital adequacy ratio of 39% (2011: 41%) while continuing to grow the loan book and expand the branch network.
The capital adequacy calculations incorporate a calculation change in line with standard Basel practice. The r isk-weighted asset equivalent for operational risk included in the divisor is now determined as per the alternative standardised approach (ASA) calculation for retail banking. The comparative has been restated.
The return on ordinary shareholders’ equity was 29% (2011: 34%) despite the increase in ordinary share capital of R1.1 billion from the rights issue that took place in January 2011 and the increase of R787 million from the private placement mentioned above. The strong return was achieved by growing earnings by 68% to R1.1 billion. The return remained comfortably above the target of 25%.

30 Capitec Bank Holdings Limited Integrated Report 2012 31
Credit ratingOutlook is positive
The long-term and short-term national scale credit ratings for Capitec Bank Limited determined by Moody’s Investors Service remain unchanged at A2.za and P-1.za respectively, but the outlook for these ratings was amended to positive.
The long-term rating refl ects a good long-term credit quality and the short-term rating a superior ability to repay short-term debt obligations.
Cost structureCost-to-income ratio of banking activities improved from 48% to 44%
Capitec’s branch network expanded from 455 branches at the end of February 2011 to 507 branches at the end of February 2012 and the ATM network has grown to2 076 from 1 661 at February 2011.
Capital expenditure for the year grew to R381 million compared to R235 million in 2011 and is expected to increase in line with plans for expansion of the branch network by 55 branches during 2013. Capital expenditure planned for the 2013 fi nancial year totals R673 million.
Banking operating expenses grew by 37% toR2.5 billion mainly due to growth in the branch network and corresponding growth in the number of employees.This represents an increase of R673 million.
The group currently employs 7 194 people, an increase of 35% on 2011. The growth in the number of employees exceeded the growth in the number of branches due to the continued implementation of a centralised collections function and the expansion of information technology support structures. Employment costs, including training
and incentives, comprise 53% of operating expenses and contributed R352 million to the increase in operating expenses.
An incentive for all Capitec Bank employees, in terms of schemes based on growth in headline earnings per share, is included in employment costs. Senior management (excluding strategic management) qualify for a cash-settled performance bonus scheme. This scheme rewards managers based on the growth in headline earnings per share, and to foster a long-term approach by management the amount is paid out over a three-year period. Strategic management are incentivised by means of share options which are equity-settled and share appreciation rights which are cash-settled.
The remuneration report contains an analysis of these bonus schemes.
Training costs increased by 46% to R40 million and comprise 13% of employment costs. Training costs include in-house training of all new employees that are deployed into the branch network and support structures as well as various in-house leadership and other training programmes. Investment in the training of employees is considered crucial to the success of the bank.
The business focuses on cost analysis and management and this approach refl ects in the cost-to-income ratio which decreased to 44% from 48%.
TaxationThe total tax contributions paid over to government for the year amounted to R1.2 billion compared toR698 million in 2011. This includes normal tax, value added tax, secondary tax on companies, unemployment insurance, skills development levies, property rates and taxes as well as employees’ tax. The tax contribution as a
percentage of profi t available for distribution to ordinary shareholders is 59% (2011: 60%). For further detail refer to the statement of economic value added.
The group’s business model, as well as the products and services offered are not complex, and complex tax structuring does not form part of the philosophy ofCapitec Bank.
DividendsThe board of directors considers the capital and funding requirements of the business before declaring dividends. The dividend cover for the past four years ranged from 2.6 to 2.5. The dividend of 300 cents per share declared on 1 March 2012 equates to a dividend cover of 2.6 and is the last dividend to be declared in terms of the secondary tax on companies rules.
André du PlessisFinancial director

32 Capitec Bank Holdings Limited Integrated Report 2012 33
05Stakeholders
ldingss Limited32 Capitec Bank Holdin3
Clients
For clients
− The Global One card facilitates easy, low-cost transactions − Rewarding interest on savings − Access to cost-efficient credit For Capitec
R5.0 billion to R7.4 billion
Shareholders
For shareholders
For Capitec
Funders
For funders
For Capitec
Regulators
For regulators and for Capitec
Suppliers
For suppliers
For Capitec
client satisfaction
Governmentthe 2012 financial
created 1 863 jobs
Evolve
Society
For society
credit
For Capitec
Employees
For employees
For Capitec

34 Capitec Bank Holdings Limited Integrated Report 2012 35
06Clients
Growing a client baseThe success of Capitec Bank is primarily driven by the number of clients that choose to use the bank. The number of transactions each client performs and the extent of credit taken from the bank by clients, determine the income stream that the bank can earn.
The number of transactions that clients perform on the bank system is dependent on whether these clients use the bank as their primary bank. Many clients have bank accounts at more than one bank, but choose one as the primary account into which their salary is deposited and from which all payments are made. This preference is also an indication of the bank: • which clients trust, • get the best value from, and • have the best relationship with.
Capitec Bank regards these clients as the most important to acquire.
The reported client numbers at Capitec Bank are based on a minimum activity level defi ned for active clients over the past three months. This defi nition refl ects client growth of 31% over the past year to 3.7 million clients as at the end of February 2012.
The proportion of the adult population in South Africa that is banked has not changed signifi cantly over the past year and has increased marginally from 62.5% to 62.8% of the total population. This number is estimated at 21.2 million at the end of 2011.
unique product offer
unique positioning
unique client experience
Capitec Bankoffer

36 Capitec Bank Holdings Limited Integrated Report 2012 37
Material issues• Sustainability of the bank• Banking costs
Percentage of adult South Africans who useformal banking
2008 2009 2010 2011
Do 63 60 63 63
Don’t 37 40 37 37
Total number of bank clients
2010 2011
Banked 20 956 844 21 184 871
Formal non-banked 1 667 456 1 605 519
Informally served only 3 000 903 1 852 518
Non-served 7 816 691 9 096 492
Total 33 441 893 33 739 399
Source: Finmark Trust
Capitec Bank does not use demographic segmentationto identify its core client or target market and, contrary to common practice in the industry, the bank does notsegment the market on income. The focus is on providing essential banking to all clients regardless of income level. Essential banking can be defi ned as the key transact-ing, saving and credit needs that clients have to run theireveryday lives. While Finscope* indicates that 97% of all bank clients have transacting products at banks (e.g. a card), only 14% have formal credit and 11% formalsavings products from banks. *Finmark Trust
Based on the above defi nition the total population of49 million in South Africa could potentially be Capitec Bank clients. The presently banked adult population of 21.2 million should, however, be regarded as the total present adult target market for Capitec Bank. The active clients using Capitec Bank therefore represent 7.6% of the total population and 17.5% of the adult banked market in South Africa. Consideration must, however, be given to the fact that, as previously stated, many clients have more than one bank account and that many of these clients have a primary bank account with another bank. Much opportunity therefore exists to expand the bank’s market share in the formally banked market.
Bank clients
Percentage of consumers using:
Transaction products 97
Insurance products 16
Credit from banks 14
Savings from banks 11
Electronic payments 11
Source: Finmark Trust
Capitec bank has addressed the essential banking needs defi ned above by providing innovative, technology-driven solutions that are affordable, accessible, simplifi edand ensure personal support. An open-ended savings and credit platform gives clients options, features and benefi ts that they can choose and structure as they require, with “information support” on their accounts that puts clients in control.
The extent to which Capitec Bank can differentiate its offer on this basis and deliver a simplifi ed, transparent solution which clients trust, will determine the rate of acquisition of new “salary deposit” clients.
Research carried out on an annual basis via Nielsen SA, indicates that Capitec Bank is on the right track. It is regarded by consumers as signifi cantly different in the banking industry. It is the bank to which existing bank clients would most likely switch. The percentage of clients who consider Capitec Bank as the best alternative to change to is higher than for all other industry competitors.
Credit
EEEssssenttiallbbbaannkinngTransact
Save
36

38 Capitec Bank Holdings Limited Integrated Report 2012 39
The productThe Global One solution with all its accounts carries a single monthly admin fee of R4.50 which also includes access to the card, mobile and internet transaction channels.
All transaction prices on the various channels are quoted in the form of a fi xed price per transaction, with only a few price variants.
Monthly communication is sent to clients confi rming the monthly bank costs they have incurred. Tips on their transactional behaviour are added to this, to assist clients to reduce bank fees through the use of alternative transactions.
CommunicationIn-branch communication material includes tables for cost comparison with other service providers, to ensure clients can make informed choices.
Advertising campaigns are designed to deliver messaging which conveys simplifi ed, clear benefi ts and supports the principle of “know what you get, know what you pay.”
A team of consultants who specialise in switching client bank accounts from their existing accounts to Capitec Bank assists clients and informs them when and how best to implement these changes.
Relationships and staying in contactOngoing contact with clients is essential to monitor the acceptance of our services and consumer preferences regarding our product
features. Every form of feedback from the various channels of contact is an opportunity to review our ability to differentiate our offer and to evaluate the quality of service as experienced by clients. The bank has applied the following interactive platforms to ensure adequate feedback over the past year:• Client surveys• SMS communication• Internet communication• Call centre complaint evaluation and review• Formal market research• Blog site monitoring and conversation
Management applies the approach of continuous “service point” evaluation. This includes extensive visits to branches and service points by senior executives to meet with clients and experience the relationship with clients. Branch managers are placed in the front of branches to act as the custodians of client relationships. This ensures a focus on and the ownership of service and client support by the branch manager.
The essence of our unique offerThe best value, essential banking solution which provides:• A single simplifi ed solution called Global One which contains the
essential accounts required for everyday money management.This includes a transaction account, four savings plans and credit plans.
• Easy access to card, cell and internet transacting at no subscription fee.• Paperless in-branch transacting which is quick and convenient.• All needs addressed in real time.
Some challenges in acquiringnew clientsConfusing bank offersAll the traditional banks provide a version of their products and services in a packaged form, at a fi xed monthly price. These offers are accompanied by restrictive terms and conditions which include penalties and additional fees if certain transaction volumes are exceeded.
Alternatively they offer prices on individual transactions in the form of sliding scales or as a percentage of transaction value. This creates confusion for clients and makes comparison of the various solutions diffi cult to the extent that even price comparisons conducted by auditing fi rms have been questioned as to their accuracy.
Research conducted in the market confi rms that a small percentage of clients know what their monthly bank charges are. This makes it challenging to differentiate the Capitec Bank offer on the basis of cost.
Financial skillsFinancial literacy levels are not high in the broader South African market. A general understanding of the time value of money is lacking. Clients therefore do not always understand the differences in the features and cost benefi ts of alternative banking products. This is further complicated by banks who quote transaction fees asa percentage of transaction value.
Confusing pricingIn the case of credit, certain fees and charges are often not refl ected by credit providers as a credit cost, but as insurance cover or product insurance, which can mislead clients. Research conducted by Capitec Bank has indicated that a signifi cant percentage of clients choose credit from a specifi c supplier, even though the offer is not the best in the market. The key features of the credit offer that often determine the choice exercised by clients are the total amount of credit provided and the length of
the credit term which infl uences the monthly payment. A sound understanding of the implications of the credit agreement is therefore often lacking.
Capitec Bank highlights the essence of the contract and emphasises important information that clients need to take note of on the fi rst page of its credit agreements. Specifi c credit communication material is also provided in-branch to clients who request a loan quote. This material enables easy price comparison between credit providers, as a decision support mechanism in the interest of the client.
Resistance to switchThe general perception of clients who want to switch banks is that the administrative process is too cumbersome. There is therefore resistance by clients to go through this process. As a result of this, brand differentiation needs to be even stronger to infl uence the willingness of clients to switch banks.
Simplicity and transparencyThe approachCapitec Bank has applied “simplicity and transparency” as key elements of its market strategies to ensure that a long-term trust relationship is built with clients. The Global One single solution to money management has therefore been simplifi ed to ensure no confusion can exist regarding its features and benefi ts. Clear and simplifi ed communication in all the consulting steps is applied by the bank to minimise the possibility that clients experience an expectation gap.
The service systemNew service flow processes have been developed to enhance transparency. Consultants and clients sit side by side so that clients can be informed simply and clearly of their options and the implications of each step. A step-by-step road map of the administrative process is also incorporated in the service fl ow to inform clients of the process to be followed.
Simplicity
Transparency
CCooonntrool

40 Capitec Bank Holdings Limited Integrated Report 2012 41
• The lowest, most transparent transaction fees.• Personalised support that is in the best interest of
clients.
How will we continue growing?Unique service experienceThe bank has not only entrenched simplicity and transparency in its service steps, but structured unique managerial processes to drive these attributes, including personal support and service, in branches. Administrative processes are minimised in the branches and are controlled from a central backoffi ce. This enables the consulting process to be focused on service interaction and addressing needs effi ciently.
Personal referrals by existing clients are ever-increasing and are testimony to the supportive service experienced by these clients and the value of our unique service processes.
Unique positioningSimplicity and transparency have also been built into advertising communication to entrench this differentiation in the minds of potential clients. This approach continues to build trust and respect in the brand, as clients value the authenticity and sincerity of the offer. Capitec Bank has become known as a straightforward, supportive bank which delivers in the best interests of its clients.
Unique product offerThe bank continues to drive its product differentiation in the market through its key benefi ts to clients. These include:• Global One – simplified single solution to money
management• High interest earned on the transaction account as well
as on fi xed-term savings plans• Low transparent prices on transactions• Excellent prices on mobile and internet transactions• Easy, immediate access to low-priced credit
Market expansionMarket expansion has also occurred naturally as higher income clients in both the older and younger age group segments have been exposed to our simplifi ed low-cost offer. Many clients fi nd the Global One solution adequate for their needs and obtain longer-term traditional credit such as bonds or asset finance from independent providers other than banks.
The expansion of our branch footprint by over 50 branches per year has not only contributed to improved market penetration and the resultant client growth, but has also assisted in the acquisition of a different profi le of client. Shopping mall branches have attracted clients from higher income groups who were clients of the four traditional banks in South Africa. The increase in branch numbers per year will continue at the same rate as in the past and will continue driving client acquisition for the next three to fi ve years.
Opportunity exists to expand our offer in the credit market in the form of a credit card. This will expand the overall market for Capitec Bank, as it will address the needs of higher income clients who presently don’t use the bank. The unsecured credit offer can also be expanded to larger value loans, to address a greater portion of the asset fi nance market, which the bank presently does not address.All these actions have and will continue to result in new client growth occurring at an increasing rate on a year-on-year basis.
Credit in a growing unsecured marketSince the introduction of the National Credit Act, 34 of 2005, the nature of the unsecured credit market in South Africa has changed signifi cantly. The international credit crisis in 2008 resulted in the decline of secured lending and in particular of the mortgage market. This, the formalisation of the unsecured market and the expansion of the formal housing market, which includes electrifi cation of homes, has fuelled signifi cant growth in the unsecured market.
The lending criteria in the secured market were signifi cantly tightened in 2009 and are largely still more stringent than the period leading up to 2008. This has added to the growth of the unsecured market as many clients in need of credit have chosen the unsecured option rather than the asset fi nance option to address their needs.
The total credit advances grew by 31.6% on a year-on-year basis to R98.9 billion for the quarter to September 2011. The mortgage market grew by 15% overthe same period to R30.3 billion and the rest of the secured market by 22% toR30.8 billion. Unsecured credit grew by 58% to R21.2 billion and credit facilities grew by 69% to R14.8 billion. Capitec Bank remains at 5% market share of the total market and 20% market share ofthe unsecured market.
Prices have reduced in the unsecured market and will continue to do so in the foreseeable future. This has further increased the loan amount granted as
CREDIT GRANTED – PER QUARTER
R’m R’m R’m R’m R’m Trend Trend Trend TrendAgreement by type 2007 – Q4 2008 – Q3 2009 – Q3 2010 – Q3 2011 – Q3 2011/2010 2011/2009 2011/2008 2011/2007
Mortgages 53 140 33 766 17 817 26 340 30 278 115% 170% 90% 57%
Secured credit 32 014 22 284 20 174 25 199 30 780 122% 153% 138% 96%
Credit facilities 0 0 6 227 8 813 14 882 169% 239% 0% 0%
Unsecured credit 7 938 7 656 8 374 13 385 21 214 158% 253% 277% 267%
Short-term 883 1 013 990 1 398 1 745 125% 176% 172% 198%
Total credit granted 93 975 64 719 53 582 75 135 98 899 132% 185% 153% 105%
Source: NCR
clients can afford more total credit with the same monthly repayment.
Capitec Bank has followed a cautious approach to extending loan terms and total loan amounts, as many consumers are inexperienced in the use of long-term
credit. A particularly responsible approach has been followed to ensure client affordability levels are sound over a longer period of time. Quality and stability of employer income streams are also evaluated to determine employee income stability.
2007 2008 2009 2010 2011
TREND IN CREDIT CATEGORIES AS A PERCENTAGE OF TOTAL CREDIT
GRANTED OVER THE PAST FIVE YEARS60%
50%
40%
30%
20%
10%
0%
Short-term credit
Secured credit
Unsecured credit
Mortgages
Credit facilities

42 Capitec Bank Holdings Limited Integrated Report 2012 43
Capitec Bank wants to acquire and retain good clients. Credit risk is the likelihood that a client would default on the loan contract payment plan, which we term the “expected default ”. Good clients would be those that will not default on their contractual repayment plan. We aim to allocate the appropriate loan term (expressed in months) within the assessed expected default of the applicant and charge the corresponding interest rate.
The credit life cycle starts at the point that we grant the loan, followed by the collection on pay date and repeat sales to the client, or in the case of arrears, follow-up on the arrears. If a state of rehabilitation (pay as per contracted payment plan) is not achieved, the loan is handed over for legal action. The last mentioned is of course not desired from a client or bank perspective. During the entire process, including the last stage, Capitec Bank ensures that it is compliant with all relevant legislation and acts in a socially responsible way.
When applying for a loan at Capitec Bank the following checks are done to protect the bank and the client:
• Authentication through– Identity book verifi cation– Photo identifi cation– Account holder card swiped – Biometric recognition
• Enquiries are performed at two fraud prevention bureaus
• Documents applied in the lending decision are verifi ed– Payslips and employment– Bank statements– Proof of settlement
• Client information is updated for con-tractual and future contact purposes
Our responsible lending decision is based on the BAS principle – the applicant’s:
• Behaviour (willingness to pay)• Affordability (ability to pay)• Source of payment (when, who and how)
Credit is granted in accordance with a credit policy that is adjusted continuously to accommodate market and economic changes. The policy is approved by the credit committee which reports to the risk and capital management committee of the bank.
Capitec mainly utilises the regulated non-authenticated early debit order (NAEDO) system to collect instalments on the pay dates of clients who do not deposit their salaries with the bank.
Follow-up on clients in arrears is mostly performed centrally from our internal call centre. The objective remains to minimise the arrears by staying in contact and reminding clients to pay. The bank does not charge penalty interest if clients are late, but affords clients a reasonable opportunity to get back on track to the contracted payment plan. A section 129 notice is sent 50 working days before hand-
over for legal action. This informs clients in breach of contract that they should contact the bank to make arrangements to repay. Restructuring options are available. Clients can also approach a debt counsellor to structure their debt settlement. Capitec Bank is a member of the National Debt Mediation Association (NDMA) in order to cooperate as much as possible with clients opting for the debt review route. Debt review applications received from an NDMA-accredited debt counsellor are accepted immediately.
Legal collections are outsourced to various external debt collectors/attorneys. These collectors are contractually managed in terms of mandates and their performance is reviewed monthly. Ad hoc audits and visits are performed on collectors to ensure costs are charged as per our mandates. The mandates and costs are put in place to provide the handed over client the best possible opportunity to rehabilitate. Our agents make use of the emolument attachment order approach, resulting in a payroll deduction instead of the alternatives like attachment of assets.
When more clients default on their loans than anticipated we provide for these loan impairments through our income statement and acknowledge recoveries after write-off through our income statement.
Alternative dispute resolution
Capitec Bank subscribes to the Code of Good Banking Practice
(“the Code”) and in terms of the Code, the bank falls under the
jurisdiction of the Ombudsman of Banking Services.
In terms of the Code, all client complaints or disputes that cannot
be resolved by Capitec Bank can be referred to the Ombudsman.
The Ombudsman’s jurisdiction is limited to amounts of R5 million
and is only available to natural persons, which form the basis
of Capitec Bank’s clientele. Capitec Bank aims to provide each
and every client with an excellent client service experience. In
line with this principle a dispute resolution process, in terms of
which clients can lodge complaints directly with Client Care, has
been established. A process was introduced during December
2010 in terms of which unresolved complaints are escalated. The
escalated enquiries are dealt with by the team who deals with
resolution of matters that fall within the Ombudsman for Banking
Services’ scope.
Loan products offered by Capitec Bank fall within the ambit of
the National Credit Act (NCA). A client in default is given written
notice of the default and advised to refer the loan agreement
to a debt counsellor, alternatively dispute resolution agent, a
consumer court or Ombud with jurisdiction, so that the parties
can resolve any dispute related to the agreement or agree on
a plan to bring the loan payments up to date. This negates the
need to commence with expensive legal proceedings to enforce
loan agreements. It helps the client to order and streamline
repayment of fi nancial liabilities.
Savings product agreements and most of Capitec Bank’s other
products (excluding agreements falling under the NCA) fall
within the ambit of the Consumer Protection Act (CPA). The CPA
provides that a consumer may seek to enforce any right in terms
of the CPA or in terms of a transaction or agreement with Capitec
Bank or resolve any dispute by referring the matter directly to
the National Consumer Tribunal, the applicable Ombud, the
consumer court or an alternative dispute resolution agent.

44 Capitec Bank Holdings Limited Integrated Report 2012 45
Employees represent the face of Capitec Bank and facilitate the service experience that is so unique to the bank. Capitec Bank in turn empowers its employees through association with its brand that is more and more embedded in the mind of society asa fi nancial service provider of choice.
To enhance the service experience, it is imperative to the company that an active two-way communication channel be maintained with employees. Management values employee input to create and maintain a healthy environment where employees feel empowered to contribute to the wellbeing of all stakeholders.
Employees are empowered to raise their concerns through the following platforms:
The employment equity forum had two meetings in the past year. The forum is attended by employees as representatives of the workforce to discuss matters of concern to employees.
C.Connect is a facebook-styled in-house blog platform that allows employees the opportunity to communicate freely regarding in-house matters. The aim is to encourage a culture of sharing information, ideas, concerns and asking of questions amongst employees. Concerns raised are addressed by designated employees.
A helpdesk facility at the Business Support Centre (BSC) provides real-time assistance to branch employees who have queries or diffi culties while servicing a client.
Tip-Offs Anonymous, a hotline where suspicious actions by fellow employees can be reported anonymously in any of the 11 offi cial languages of South Africa.
Line management – employees are invited to discuss matters of concern with their managers.
A remuneration helpdesk was established to give employees a platform where they can obtain clarity about their remuneration concerns.
Employees have the opportunity, through a user-input invitation process, to make enquiries about, and submit comments on, company policies and procedures. A dedicated e-mail address has been established to facilitate that procedure.
Managers from the operations departmentas well as Riaan Stassen, the chief execu-tive offi cer, Gerrie Fourie, the operations executive, and Nathan Motjuwadi, the human resources executive, regularly visit branches to interact with branch employees. During these visits they invite employees to discuss matters of concern with them.
07Employees
ngs Limmitedc Bank HHoldings L
innovative leadershiptalent sourcing
skills development
performance management
recognition and rewards
employerof choice

46 Capitec Bank Holdings Limited Integrated Report 2012 47
Employees have access to a variety of benefi ts:
Permanent
employees
Temporary
employees
Retirement fund √
Medical aid √
Group life √ √
Disability √ √
Leave (including parental) √ √
Share ownership schemes √
Employment equity Capitec policy enforces equal employment opportunities regardless of race, gender or belief. Ability and performance are the only criteria for appointment and promotion. Unfair discrimination in whatever form is not tolerated and is dealt with through the disciplinary processes to facilitate an environment of equal opportunity and fair treatment in the workplace.
The company’s core values are therefore refl ected in its drive for employment equity:• Respect for the individual and regard for individual
dignity• Absence of discrimination• High-quality standards in all aspects of the business.• Performance improvement through empowerment and
team work• Obsession with client care
Capitec Bank has contributed significantly to the employment of women and other previously disadvantaged individuals:
Total women 63%
Previously disadvantaged women 57%
Previously disadvantaged men 29%
CAPITEC BANK WORKFORCE
The table above details the Capitec Bank workforce per occupational level according to gender and race as at 31 August 2011 as required in
terms of section 22 of the Employment Equity Act, 1998 (Act 55 of 1998).
Employees are kept abreast of company-related issues through the following communication tools:
C.Facts – an electronic communicator that deals with facts and newsworthy information.
C.Alert – an electronic communicator that deals with operational issues relevant to branches.
C.Inside – a full-colour magazine covering the company’s development, products and services and other contemporary issues of interest to employees.
Ecobuzz – an electronic newsletter is used to educate and inform employees on environmental issues.
Other platforms for two-way communica-tion include biannual results presentations by the chief executive offi cer and fi nan-cial director to employees at the main and regional offices. At these eventsemployees have opportunities to raise issues and discuss concerns withmanagement either on a one-on-one basis or during the presentation.
Empowering employeesEmpowerment of employees creates an environment where individuals take owner-ship of their work. Various approaches are thus employed to ensure that employees are given the opportunity to develop to their full potential. When people with appro-priate skills and capabilities are employed in the correct positions and are engaged and focused on appropriate activities,targeted business results can be achieved. Strategies are therefore being developed to facilitate the management of the entire employee life cycle to realise maximum empowerment of employees.
As the number of branches increase, the bank continues to appoint people to support its unique service offer. The number of bank employees increased to7 086 at year-end (2011: 5 233). On average, 221 employees were employed per month. Average employee turnover per month amounted to 1% which compares favourably to the average turnover of 13.7% (Deloitte Salary Movements, Premium and Labour Trends 2011/2012 report). Absenteeism was low and amounted to 1.2% of the workforce per month. No workdays were lost due to strikes.
Material issues How material matters are addressed Page
Brand confi dence
and trust in the
market
Reliable and trustworthy service
Stability
Increased access through expanded retail footprint
Affordability, simplicity and transparency of product offer
40 – 42,
60
Fraud In-depth investigations by the forensic audit department
Prevention is facilitated through training, monitoring and
eradication where fraud occurs 104
Employment
equity
Zero tolerance to any form of discrimination
47
Growth Conservative management of liquidity and quality of the
loan book
Continued training and career development of employees
to facilitate exceptional service experience and thus client
acquisition
18, 20,
29, 49
Remuneration Pre-determined and board-approved remuneration policy 50
Male Female Foreign nationals
African Coloured Indian White African Coloured Indian White Male Female
Top management 1 1 0 12 0 0 0 1 0 0 15
Senior management 3 7 3 81 3 1 0 11 2 0 111
Middle management 54 25 10 143 27 16 7 66 3 0 351
Junior management 252 147 31 151 337 184 42 183 0 1 1 328
Semi-skilled 911 298 54 97 2 189 642 85 135 2 4 4 417
Unskilled 58 0 1 0 80 6 0 0 0 0 145
Total permanent 1 279 478 99 484 2 636 849 134 396 7 5 6 367
Temporary employees 0 3 0 5 1 9 1 8 1 0 28
1 279 481 99 489 2 637 858 135 404 8 5 6 395

Targets set for employment equity at managerial level by December 2012 are detailed below:
113%
89%
108%
106%
MIDDLE MANAGEMENT
Achieved
94%
92%
105%
93%
JUNIOR MANAGEMENT
6%
10%
74%
10%
SENIOR MANAGEMENT
1 455
792
< 30
16%
27%
38%
18%
MIDDLE MANAGEMENT
188
225
30 – 50
Set
33%
11%
43%
13%
JUNIOR MANAGEMENT
Total appointments 2 662
> 50
2
Appointments during 2011 categorised according to gender and age:
5281 369
1 7002 456 1 8952 116
1151 173303
435 544304
1 2 3 4 5 6
(Courses)2011 2012
NUMBER OF EMPLOYEES THAT ATTENDED LEARNING
AND DEVELOPMENT OPPORTUNITIES
1 Firm Foundations
2 Management and leadership
3 Projects
4 Sales
5 Business Support Centre
6 Campus
48 Capitec Bank Holdings Limited Integrated Report 2012 49
Targets have been established in support of transformation and equal employment.
In the 2011 integrated annual report, we reported on the targets set for 31 August 2011 as reported to the Department of Labour for junior and middle management appointments and the extent achieved by 28 February 2011. The extent to which targets have been achieved by 31 August 2011 is as follows:
Management and controlThe drive continues to empower employees through lead-ership training and further professional development. Strategies have been put in place to accelerate leader-ship development to ensure that transfer of learning takes place with effective coaching to support performance, growth and succession. During the period under review, 654 employees (9.2% of workforce) received leadership training. Performance of all employees is evaluated at least annually consisting of an interim and fi nal assessment. The primary objectives of performance management are to:
• align efforts with the business plan and goals;• facilitate regular performance feedback and continuous
coaching to improve performance and motivate employees;
• identify training and development needs to promote knowledge, skills and attitude; and
• provide a basis for rewarding employees based on contribution, including both performance-related pay and recognition of achievement.
During the year under review, 665 employees were promoted (457: 2011). Fifteen percent was promoted to management level.
In 2008 a development programme was introduced in terms of which two employees are appointed to the executive management committee on an annual rotation basis. At least one of these employees is a previously disadvantaged individual. All the individuals that have been appointed in this position have confi rmed that the experience was educational and valuable.
Learning and developmentAll employees have access to development opportunities via the various learning and development initiatives established in the bank. The learning and development initiatives are based on three major concepts:
• Faster learning: Performance-based learning which combines traditional learning methods with computer-assisted learning, online performance support and coaching.
• Smarter technology: Technology that integrates learning and knowledge management and includes performance support technology and quick reference guides which enable people to master content and behaviour in the shortest possible time.
• Better results: Rapid and sustainable assimilation of product knowledge, adoption of processes and technology and embedding new behaviours. The outcome is signifi cant improvement in business results and customer satisfaction.
Learning and development create pride in and loyalty to the brand which in turn strongly infl uences the employee’s enthusiasm towards client service.
During the year under review a total of 574 learning and development workshops were offered, attended by 7 035 employees. Firm Foundations is the main training platform where new employees are schooled in the Capitec Bank
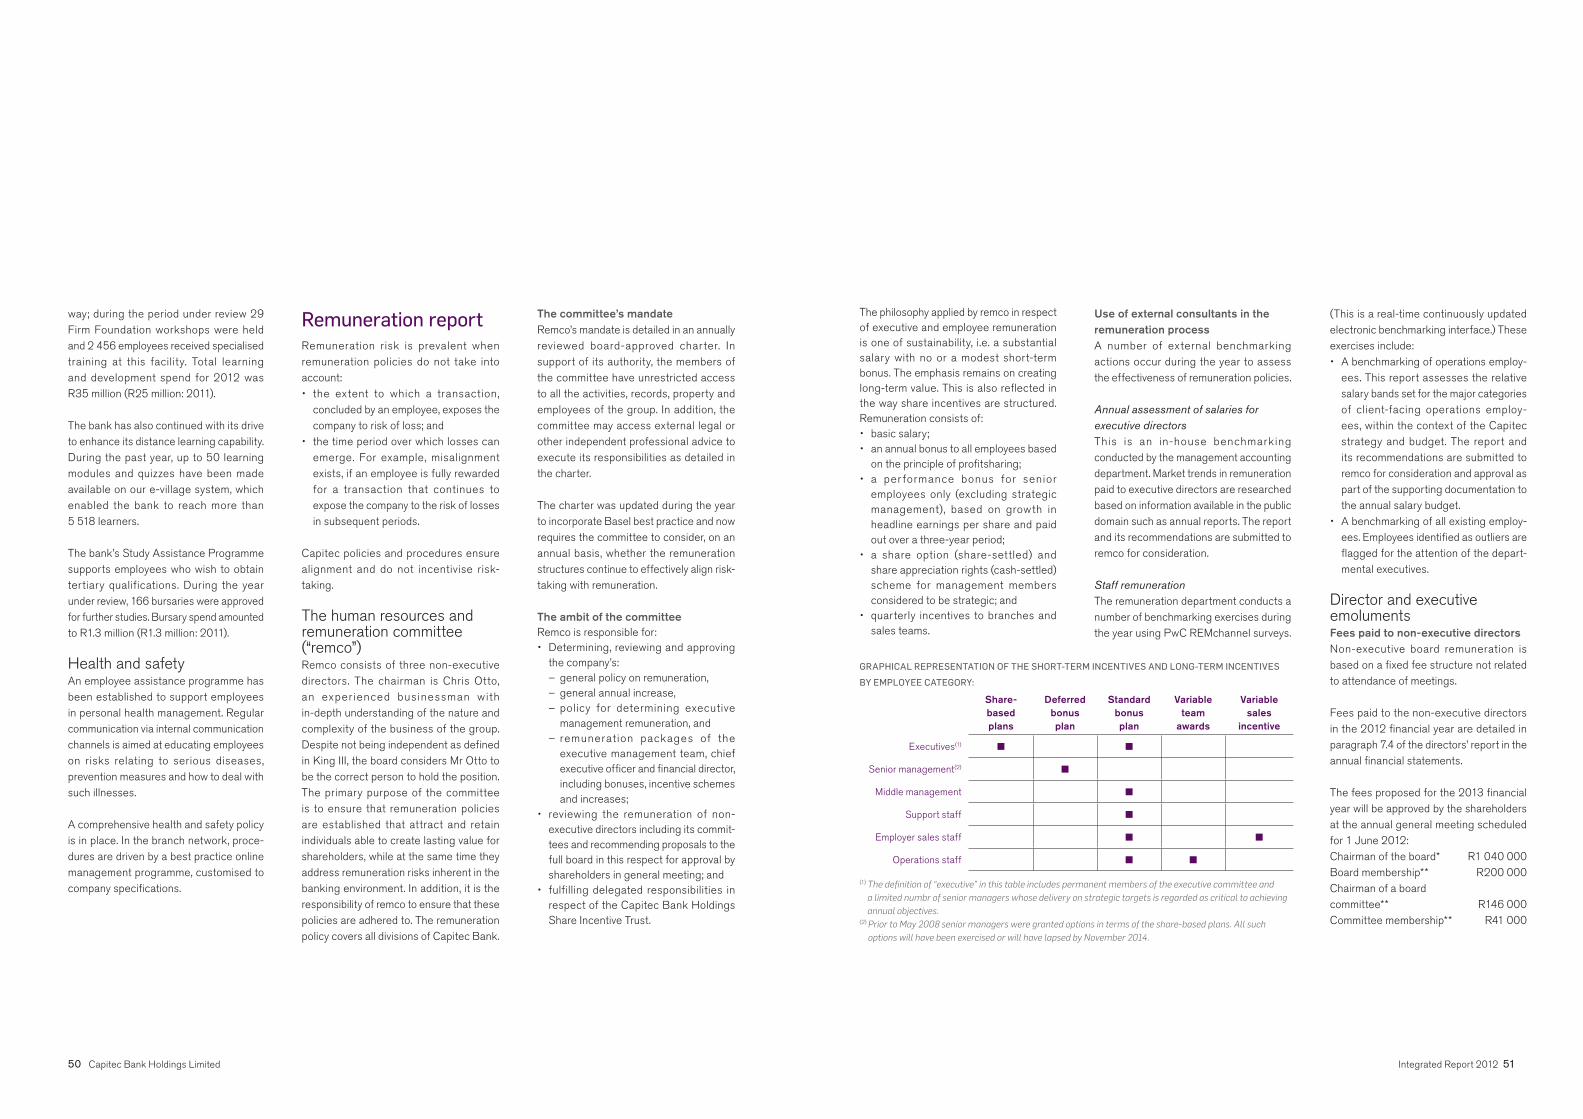
50 Capitec Bank Holdings Limited Integrated Report 2012 51
way; during the period under review 29 Firm Foundation workshops were held and 2 456 employees received specialised training at this facility. Total learning and development spend for 2012 wasR35 million (R25 million: 2011).
The bank has also continued with its drive to enhance its distance learning capability. During the past year, up to 50 learning modules and quizzes have been made available on our e-village system, which enabled the bank to reach more than5 518 learners.
The bank’s Study Assistance Programme supports employees who wish to obtain tertiary qualifications. During the year under review, 166 bursaries were approved for further studies. Bursary spend amounted to R1.3 million (R1.3 million: 2011).
Health and safetyAn employee assistance programme has been established to support employees in personal health management. Regular communication via internal communication channels is aimed at educating employees on risks relating to serious diseases, prevention measures and how to deal with such illnesses.
A comprehensive health and safety policy is in place. In the branch network, proce-dures are driven by a best practice online management programme, customised to company specifi cations.
Remuneration reportRemuneration risk is prevalent when remuneration policies do not take into account:• the extent to which a transaction,
concluded by an employee, exposes the company to risk of loss; and
• the time period over which losses can emerge. For example, misalignment exists, if an employee is fully rewarded for a transaction that continues to expose the company to the risk of losses in subsequent periods.
Capitec policies and procedures ensure alignment and do not incentivise risk- taking.
The human resources and remuneration committee (“remco”)Remco consists of three non-executive directors. The chairman is Chris Otto, an exper ienced businessman with in-depth understanding of the nature and complexity of the business of the group. Despite not being independent as defi ned in King III, the board considers Mr Otto to be the correct person to hold the position. The primary purpose of the committee is to ensure that remuneration policies are established that attract and retain individuals able to create lasting value for shareholders, while at the same time they address remuneration risks inherent in the banking environment. In addition, it is the responsibility of remco to ensure that these policies are adhered to. The remuneration policy covers all divisions of Capitec Bank.
The committee’s mandate Remco’s mandate is detailed in an annually reviewed board-approved charter. In support of its authority, the members of the committee have unrestricted access to all the activities, records, property and employees of the group. In addition, the committee may access external legal or other independent professional advice to execute its responsibilities as detailed in the charter.
The charter was updated during the year to incorporate Basel best practice and now requires the committee to consider, on an annual basis, whether the remuneration structures continue to effectively align risk-taking with remuneration.
The ambit of the committeeRemco is responsible for:• Determining, reviewing and approving
the company’s:– general policy on remuneration, – general annual increase,– policy for determining executive
management remuneration, and– remuneration packages of the
executive management team, chief executive offi cer and fi nancial director, including bonuses, incentive schemes and increases;
• reviewing the remuneration of non-executive directors including its commit-tees and recommending proposals to the full board in this respect for approval by shareholders in general meeting; and
• fulfilling delegated responsibilities in respect of the Capitec Bank Holdings Share Incentive Trust.
The philosophy applied by remco in respect of executive and employee remuneration is one of sustainability, i.e. a substantial salary with no or a modest short-term bonus. The emphasis remains on creating long-term value. This is also refl ected in the way share incentives are structured. Remuneration consists of:• basic salary;• an annual bonus to all employees based
on the principle of profi tsharing;• a per formance bonus for senior
employees only (excluding strategic management), based on growth in headline earnings per share and paid out over a three-year period;
• a share option (share-settled) and share appreciation rights (cash-settled) scheme for management members considered to be strategic; and
• quarterly incentives to branches and sales teams.
Use of external consultants in the remuneration processA number of external benchmarking actions occur during the year to assess the effectiveness of remuneration policies.
Annual assessment of salaries for executive directorsThis is an in-house benchmarking conducted by the management accounting department. Market trends in remuneration paid to executive directors are researched based on information available in the public domain such as annual reports. The report and its recommendations are submitted to remco for consideration.
Staff remunerationThe remuneration department conducts a number of benchmarking exercises during the year using PwC REMchannel surveys.
Share-basedplans
Deferredbonusplan
Standardbonusplan
Variableteam
awards
Variablesales
incentive
Executives(1) ■ ■
Senior management(2) ■
Middle management ■
Support staff ■
Employer sales staff ■ ■
Operations staff ■ ■
GRAPHICAL REPRESENTATION OF THE SHORT-TERM INCENTIVES AND LONG-TERM INCENTIVES
BY EMPLOYEE CATEGORY:
(1) The defi nition of “executive” in this table includes permanent members of the executive committee and
a limited numbr of senior managers whose delivery on strategic targets is regarded as critical to achieving
annual objectives.(2) Prior to May 2008 senior managers were granted options in terms of the share-based plans. All such
options will have been exercised or will have lapsed by November 2014.
(This is a real-time continuously updated electronic benchmarking interface.) These exercises include:• A benchmarking of operations employ-
ees. This report assesses the relative salary bands set for the major categoriesof client-facing operations employ-ees, within the context of the Capitec strategy and budget. The report and its recommendations are submitted to remco for consideration and approval as part of the supporting documentation to the annual salary budget.
• A benchmarking of all existing employ-ees. Employees identifi ed as outliers are fl agged for the attention of the depart-mental executives.
Director and executive emolumentsFees paid to non-executive directors Non-executive board remuneration is based on a fi xed fee structure not related to attendance of meetings.
Fees paid to the non-executive directors in the 2012 fi nancial year are detailed in paragraph 7.4 of the directors’ report in the annual fi nancial statements.
The fees proposed for the 2013 fi nancial year will be approved by the shareholders at the annual general meeting scheduled for 1 June 2012:Chairman of the board* R1 040 000Board membership** R200 000Chairman of a boardcommittee** R146 000Committee membership** R41 000

52 Capitec Bank Holdings Limited Integrated Report 2012 53
* The chairman of the board is paid a retainer and receives no further payment for membership of committees.
** Non-executive directors receive a retainer for membership of the board and for each of the board committees. No fee is paid in respect of the directors’ affairs committee.
Remuneration paid to executive directorsRemuneration paid to executive directors is detailed in paragraph 7.4 of the directors’ report in the annual fi nancial statements.
Remuneration paid to executive offi cersThe members of the executive manage-ment committee (excluding development members) which includes the chief executive offi cer and the fi nancial director, are the key decision-makers in the bank and as such they fall within the category of prescribed offi cer as defi ned in the South African Companies Act. Refer to pages 83 and 84 of this report for the composition of the executive management committee and further information on the members. Decisions regarding risk, including the taking of risk and the management there -of, are centralised within the executive management committee as:• Capitec Bank has a fl at management
structure relative to large organisations which typically have various layers of management with associated levelsof delegated responsibility;
• the bank operates a centralised credit management, backoffice and other support functions. The branch network is
focused on client service delivery rather than risk-taking; and
• there is limited delegation of critical decision-making to senior management, who are focused more on delivery and monitoring the implementation of executive decisions.
Key features and objectives of the remuneration policyThe primary objective of remuneration policy and practices is to attract and retain individuals able to create enduring value for shareholders. Implicit in creating lasting value is the need to appropriately balance risk-taking, including aligning the possible negative or positive consequences of risk-taking as these emerge over time, with remuneration.
The main component of remuneration is the guaranteed remuneration package. All variable compensation components are performance based and based on the successful achievement of individual, team and company targets. No guaranteed variable remuneration is included in employment contracts.
Remuneration levels and structures for risk and compliance employees are determined as part of the annual budget process and are subject to oversight by remco. This happens independently of the relevant risk departments.
The structure of the remuneration plans described below has not materially changed during the past fi nancial year.
Guaranteed remuneration packageAll Capitec Bank employees receivea guaranteed remuneration package that is continuously benchmarked against competitors and the market.
The main advantage of guaranteed remu-neration packages is that they contain and defi ne the total guaranteed cost of employ-ment. Costs are clearly defi ned and well controlled. The structure does not enter-tain open-ended risks and/or liabilities. There are therefore no hidden extras.
Employees have access to the following benefi ts:• Leave• Retirement funding• Healthcare• Disability cover• Death cover• Financial wellness programme• Employee assistance programme• Education assistance programme
Executive share-based plansThe intention of the share-based plans is to retain key employees and incentivise performance aligned with the interest of all stakeholders of the company. This strategy ensures that all parties strive towardsa common goal, increasing the value ofthe business.
The share-based plans comprise share options and share appreciation rights (“SARs”). Both options and SARs are granted annually on an equal basis (50% options, 50% SARs) to members of the executive management team and a limited
number of senior managers whose delivery on strategic targets is regarded as critical to achieving annual objectives. Remco reviews and approves the list of eligible participants and quantum of options and SARs to be issued to participants.
Share optionsEligible employees are granted options to subscribe for ordinary shares in Capitec at an option price equal to the market value of the share, being the 30-day weighted average value per Capitec share on the JSE stock exchange immediately preceding the day on which the options are granted. The employees are entitled but not obliged to subscribe for the Capitec shares at the predetermined exercise price.
Share appreciation rights (SARs)SARs are granted to eligible employees in equal proportion to the share options. SARs are cash-based, but linked to equity performance. Dilution of issued share capital is thus limited as no shares are transferred to the participants. The strike price of the SARs is determined in accordance with that of share options.
The options and SARs mature after three years in tranches of 25% per year. Participants have a six-month period after the date on which the options and SARs mature during which they can be exercised. Unless remco resolves otherwise, options and SARs are forfeited if the participant leaves the employ of the company before they have matured and been exercised.
The executive share-based plans have 64 participants that are eligible to exercise 3 086 893 options and 2 430 241 SARs up to 2017. In the 2012 financial year1 253 326 options and 405 000 SARs were exercised.
As the performance of the share options and SARs is dependent on the market price of Capitec listed shares there is an inherent clawback mechanism in these reward instruments. Should the company not perform as expected, it is likely that the market discipline would result in a decline in the share price and a lower remuneration, or possibly zero remuneration if the instruments are out of the money, for holders.
Senior management cash-settled performance bonus plan (deferred bonus plan)The performance of Capitec Bank has been driven by a combination of innova-tive thinking and dedicated delivery on our objectives. To support the performance-driven culture in the bank a senior man-agement bonus plan has been established that is directly linked to company profi t per-formance. Participation is limited to senior managers and a limited number of other employees who are seen to be in leader-ship roles critical to the current and future success of the business. This bonus plan had 69 participants at 29 February 2012.
The bonus plan is linked to the group’s year-on-year growth in headline earnings per share. Standard reward percentages are applied to a participant’s guaranteed
remuneration in line with earnings targets communicated at the beginning of the fi nancial year.
The payment of the bonus occurs over three years. Deferred balances are forfeited in the event that the employee leaves the company. In the event of a decrease in company profi t on a year-on-year basis, the cumulative deferred bonus balance will decrease with the same percentage.
Cash-settled performance bonus plan for other employees and executive managementThe performance bonus plan is open to all employees in all divisions (excluding participants in the senior management bonus plans but including those on the executive share-based plans).
This bonus plan is linked to the group’s year-on-year growth in headline earnings per share. Common reward percentages (i .e. set percentages common to all employees on this plan) are applied to a participant’s guaranteed remuneration in line with earnings targets communicated at the beginning of the fi nancial year.
The performance bonus plan was estab-lished to fulfi l a number of key business objectives such as:• improving business performance; and• suppor ting stakeholder ideals by
allowing employees to share in the success of the business.

54 Capitec Bank Holdings Limited Integrated Report 2012 55
All bonuses are awarded in two tranches. The fi rst in December based on the interim results and the second in April after the fi nalisation of the year-end results.
Variable sales incentive plan Sales division employees excluding senior sales managers participate in a variable sales incentive plan based on the achieve-ment of predetermined sales targets. Rewards are calculated on the actual sales achieved by the employees.
Qualifying conditions include:• on-standard performance for the period
under review;• clear disciplinary records/conduct
during the period under review;• timeous completion of scheduled
learning sessions; and• regular work attendance during the
period under review.
The quantum of the variable awards relative to the general bonus plan and senior management plan is not material.
Alignment of risk and rewardIn assessing the appropriateness of the risk/reward relationship in remuneration structures of the bank, the remco is guided by the following:• The inherent risks in the business model • The risk-taking and delegation structure
in place within the bank• The status of the risk barometer as an
indicator of the existence and manage-ment of risk
The chairman of remco is also a member of the risk and capital management committee and is therefore fully appraised on risk matters. The Capitec business model is a mono-line retail banking model with strong centralised control. It is not complex as it does not havea variety of business units with different risk profi les. From a risk perspective the terms of both retail advances and savings are relatively short , with a maximum duration of fi ve years, although in each case the weighted average maturity on a business as usual basis is much less. Furthermore, the products sold are simple retail banking products unlike a complex structured product that may be offered by an investment bank to a corporate client. Therefore, remco considers variable incentive plans based on a measurable end result such as growth in headline earnings per share to be appropriate. This is because they reasonably capture the broad range of risks the business is exposed to and which management must manage. This includes risks such as, inter alia, business, credit, liquidity and operational risk. The annual headline earnings per share result will reasonably refl ect impacts, negative and positive, of these risks during the year. Deferring variable compensation over a number of years (as with the senior management bonus plan) will reasonably capture the results of risk taken overa number of fi nancial years. Furthermore, the current method is transparent and subject to annual audit , and easy to understand and communicate.
The executive schemes are based on share price. Similar to growth in headline earnings per share, the share price is regarded as a reasonable metric to capture the range of risks in the business. In particular it is especially sensitive to reputational risk. Unlike headline earnings per share it also offers a greater potential upside and downside for executives. This is especially true for the executive committee who, in addition to holding options and SARs, hold an existing portfolio of Capitec shares, the value of which is subject to any share price volatility.
REMUNERATION ANALYSIS – BANK
Employee classifi cationExecutive
management Senior
management Other
employees Total
Financialstatementreference
Employees Number 10 81 6 995 7 086
Remuneration awards R'000
Fixed R'000 34 001 74 917 863 364 972 282
Cash remuneration(1) (3) R'000 34 001 74 917 863 364 972 282 note 22, note 29
Variable R'000 207 365 131 838 108 898 448 101
Cash staff performance bonus (1) (3) R'000 4 917 2 553 108 898 116 368 note 22
Cash bonus bank (1) R'000 – 29 557 – 29 557 note 22
Share options (2) R'000 114 480 64 083 – 178 563 note 22, note 29
Share appreciation rights (2) R'000 87 968 35 645 – 123 613 note 22, note 29
Variable remuneration
Employees receiving awards Number 10 81 6 995 7 086
Non-deferred R'000 4 917 12 405 108 898 126 220
Deferred R'000 202 448 119 433 – 321 881
Ouststanding deferred remuneration R'000 357 010 190 750 – 547 760
Cash bonus bank R'000 – 24 998 – 24 998 note 15
Share options R'000 200 999 104 401 – 305 400 note 37
Share appreciation rights R'000 156 011 61 351 – 217 362 note 38
Deferred remuneration paid out R'000 147 067 103 072 – 250 139
Cash bonus bank R'000 – 3 419 – 3 419
Share options R'000 105 425 80 691 – 186 116
Share appreciation rights R'000 41 642 18 962 – 60 604
Employees' exposure to adjustments R'000 357 010 190 750 – 547 760
Implicit adjustments (4) R'000 357 010 165 752 – 522 762
Post explicit adjustments (5) R'000 – 24 998 – 24 998
Total remuneration exposed to adjustments R'000 357 010 190 750 – 547 760
Implicit adjustments (4) R'000 357 010 165 752 – 522 762
Post explicit adjustments (5) R'000 – 24 998 – 24 998
Reductions due to post explicit adjustments R'000 – – – –
(1) The aggregate of the totals for these items equals the value disclosed as salaries and wages in note 22.(2) The aggregate of these items for executive management equals the value disclosed as share-based payments in note 29.(3) The aggregate of these items, for executive management, equals the value disclosed as salaries and other short-term benefi ts in note 29.(4) Implicit adjustments refer to the employees’ exposure to movements in the value of share options and share appreciation rights.(5) Explicit adjustments refer to the possibility that the deferred bonus could in the future be adjusted downward based on a decrease in profi t on a year-on-year basis.(6) No sign-on awards, guaranteed bonuses or severance payments were made during the fi nancial year.
rated Repport 22012 55

56 Capitec Bank Holdings Limited Integrated Report 2012 57
Investors in the Capitec group comprise a mixture of retail depositors, equity holders, bond holders and other funders who, through their investments in the group, facilitate the maintenance of a healthy capital adequacy position for continued growth of the group. In turn, through a balance of conservative risk management and innovative business drive these investors earn a lucrative return on their investments.
Investors are kept informed of the group’s progress through prompt announcement of the interim and year-end results and the quarterly publication of the group’s capital adequacy status. To enhance transparency, trading updates were announced on SENS during the year when the board had reasonable certainty that earnings per share would exceed the comparative previous period by more than 20%. Once this information is in the market, analysts, asset managers and other market leaders are engaged in groups as well as on a one-on-one basis to facilitate understanding of the business, its growth and the results achieved.
Minority shareholders are personally invited to attend the annual general meeting of Capitec that is usually held towards the beginning of June every year. At this meeting the fi nancial results are explained and shareholders are invited to raise their concerns. The 2011 annual general meeting was attended by 166
08Investors
shareholders. During the year, shareholder queries are dealt with one-on-one by the secretarial department. Queries can be lodged via [email protected].
The following material issues of concern to investors are discussed in this chapter:• Brand confi dence and trust in the market• Sustainability of growth• Competition• Credit bubble
Capitec was listed in February 2002. The first targeted annual earnings was R30 million in 2003. This has increased steadily by a compounded growth of 49% to R1.07 billion in 2012.
The market capitalisation of Capitec increased by 23.7% during the yearfrom R14.9 billion at 28 February 2011 to R18.4 billion at 29 February 2012. Share-holder value continued to grow during the year and the return on investment (exclud-ing dividend reinvestment) calculated from 28 February 2011 until 29 Febru-ary 2012 amounts to 18.3%. In the ten years since listing on the JSE Limited Capitec’s share price has grown from R1.17(28 February 2002) to R185.00.
The liquidity in the Capitec ordinary share trading on the JSE Limited has increased since November 2011 when Capitec issued 4.2 million ordinary shares to a number of local and international investors. The dip in trading in December may be attributed to the December summer holidays.
dings LiLimited
good corporate governance
growth potential
cautious risk management
blue-chipinvestment

58 Capitec Bank Holdings Limited Integrated Report 2012 59
TransformationOwnershipBlack shareholding in Capitec amounts to 13.7%. Refer to page 4 to identify the major shareholders.
Coral Lagoon and Public Investment Corporation (“PIC”)In 2007 Capitec issued 10 million shares in its ordinary share capital at R300 million to a consortium of black companies, trusts and individuals who hold their interest in Capitec through Coral Lagoon (“the BEE consortium”). In February 2012, theBEE consortium reached an agree-ment with the PIC in terms of which5.2 million shares were sold to the PIC (“the sold shares”) as part of a restructure of the fi nancing of the BEE consortium’s interest in Capitec emanating from an early redemption of the consortium’s loan commitments to its original fi nancier. The sold shares remain restricted, i.e. they can only be sold to black people as defi ned in the BBBEE Act. The balance of the BEE consortium’s shares valued at R872 million at year-end are unencumbered subject thereto that they may only be disposed of to black people. The PIC transferred the sold shares to a BEE-accredited fund. The BEE consortium intends to negotiate a new fi nancing agreement to re-acquire the sold shares.
ThembekaCapitec issued 1.4 million shares in its ordinary share capital to Thembeka (previously Arch Equity) at R6.56 per share. At year-end, this investment was worth R267 million.
Performance on the JSE of the Capitec ordinary shares relative to the Banks Index and the All Share
Index over the past year based on an investment of R100 000 on 1 March 2011 (excluding dividend).
Data extracted from McGregor BFA
Performance on the JSE of the Capitec ordinary shares relative to the Banks Index and the All Share Index
over the past three years based on an investment of R100 000 on 1 March 2009 (excluding dividend).
Data extracted from McGregor BFA
The graph above shows the steady growth in dividends paid on Capitec ordinary shares over the past seven
years. The board considers the capital and funding requirements of the bank before declaring dividends. The
dividend cover over the past fi ve years has ranged from 2.5 to 2.6.
The Capitec preference share is non-redeemable, non-cumulative and non-participating. The preference
share dividends are paid at the earliest date possible in terms of the JSE Listings Requirements, normally
in March and September of each year. The dividend calculation is based on 75% of the prime interest rate.
Shareholders’ approval will be obtained at a special meeting of the preference shareholders scheduled for
1 June 2012 to allow the board to increase the rate paid on the shares to 83.33% of the prime interest rate.
125
120
115
110
105
100
95
90
85
80
R’0
00
Mar11
Apr11
May11
Jun11
Jul11
Aug11
Sep11
Oct11
Nov11
Dec11
Jan12
Feb12
1-YEAR ALSI VS BANK SECTOR VS CAPITEC
ALSI Bank sector Capitec
800
700
600
500
400
300
200
100
0
3-YEAR ALSI VS BANK SECTOR VS CAPITEC
R’0
00
Mar 09 Mar 10 Mar 11 Mar 12
ALSI Bank sector Capitec
Div
iden
d pe
r sh
are
(cen
ts)
Interim Final Total
ORDINARY DIVIDENDS
06 07 08 09 10 11 12
PREFERENCE DIVIDENDS
Dividend per shareD
ivid
end
per
shar
e (c
ents
)Prime lending rate
Pri
me
lend
ing
rate
%
Feb
07
Aug
07
Feb
08
Aug
08
Feb
09
Aug
09
Feb
10
Aug
10
Feb
11
Aug
11
Feb
12
452.3
12.5
13.5
14.5
15.5
14.0
10.5 10.510.0
9.0 9.0 9.0
482.3
527.8
571.1564.6
450.5
390.5380.5
343.8 340.3 336.58

PRICE EARNINGSSh
are
pric
e (c
ents
)
Share price Eps PE Ratio
Feb06
Aug06
Feb07
Aug07
Feb08
Aug08
Feb09
Aug09
Feb10
Aug
10
Feb11
Aug
11
Feb12
18
50
0
52
5
67
8
51
8
11
22
18
84
5
15
90
1
13
35
0
8 2
00
5 5
00
3 0
01
2 9
50
3 9
00
3 7
00
3 7
00
3 0
50
3 1
05
19
15 17 16 15
10 813 16
20
21
36
16
P/E
rat
io
0
5
10
15
20
25
30
35
40
AVERAGE MONTHLY TRADE VOLUMES
50
10
5
36
31
4
58
50
3
36
58
62
7
38
25
5
45
30
9
40
28
7
25
89
6
51
28
7
35
96
1
75
54
2
87
92
8Feb
Jan
Dec
Nov
Oct
Sept
Aug
Jul
Jun
May
Apr
Mar
60 Capitec Bank Holdings Limited Integrated Report 2012 61
Material issuesBrand confi dence and trust inthe marketIn 2011 the Ask Africa Orange Index awarded Capitec Bank the best service company in the banking industry as well as the best overall service company in South Africa. The index uses top independent research to measure service in South Africa. Clients rate factors such as staff friendliness, listening skills, empathy, degree of individual attention and response times.
The index is measured across a number of industries including financial, phar-maceutical and retail. More than 10 000 interviews were done on 93 brands between February and July 2011, making this a true refl ection of the state of brands from the consumer’s perspective. Capitec Bank won the usually even-scoring banking category by a margin of 6%.
Brand confidence and trust in the market is entrenched through the unique personal service that Capitec Bank offers. Continued opening of additional branches throughout South Africa will heighten Capitec Bank’s presence in the mind of the consumer. Simplicity of the products offered, aggressive and transparent pricing based on the philosophy of “what you see is what you get” truly differentiate the Capitec Bank brand.
The graph above shows the trend in the Capitec price/earnings ratio (P/E ratio per 12-month period) for the
period February 2006 to February 2012.
The graph above shows the increase in the average number of Capitec ordinary shares traded per month
since the issue of 4.2 million ordinary shares in November 2011.
Sustainability of growth Capitec Bank continues to differentiate itself by ensuring a unique experience through positioning, product, price and service.
Growth of the business is facilitated by set-ting in place the infrastructure and building blocks required to ensure continued long-term, real growth in assets and profi tability.
Growth of the business is carefully managed through continued opening of branches in areas with dynamic consumer activity and a continuous increase in transactional access points which in turn accelerates client acquisition. Market research, together with personal inter-action with clients by senior management, ensures that the bank stays in touch with client needs and expectations. This facilitates development of innovative but simplifi ed products that address clients’ needs for daily easy money management. Client expectation is further satisfi ed by the transparent affordable price offer of all bank products.
Application of innovative technology and ongoing specialised training of branch employees enhances clients’ unique service experience which further accelerates client acquisition.
Both quality book growth and cautious bad debt management are the main building blocks in the design of a healthy bank.
CompetitionCompetition has increased dramatically over the past 12 months. Brands and products based on Capitec Bank principles are being launched. In most instances, however, the offer fails to deliver the full suite of products packaged in Capitec Bank’s single money management product. Capitec Bank’s low and transparent pricing remains unique.
Capitec Bank’s unique service offer sets it apart from competitors. Emphasis on service excellence enhances the unique experience when doing business with Capitec Bank. It creates word of mouth advertising and continues to ensure referral of new clients. The transparent low-cost product offer enhances the differentiation and is facilitated through development of innovative products anda low-cost banking model.
Credit bubbleRefer to the discussions on page 10 in the chairman’s letter and page 40 in the client report.

reputation and legislationtransparent relationshipswith regulators
fusion of compliance and innovation
quality people and processes
compliantcorporate citizen
62 Capitec Bank Holdings Limited Integrated Report 2012 63
The Capitec group and especially the bank have a good and trusting relationship with its regulators, which include the bank supervision department of the South African Reserve Bank, the National Credit Regulator, the JSE Limited, and to a lesser extent, the Financial Intelligence Centre. These relationships are important because they create transparency between us as a banking institution and the individuals and entities with whom we conduct business. We regard the interconnectedness of the banking industry and the reliance that the economy and citizens of the country place on the bank as one of the most important drivers in our relationships with stakeholders.
Material issues• Law-abiding citizenship• Transparent management processes
from a regulatory perspective
The Banks Act, Companies Act, Security Services Act, National Credit Act, National Payment System Act, Consumer Protection Act and Financial Intelligence Centre Act have all been identified as key and important pieces of legislation that are the main focus of the independent compliance function and management system activities of the bank. This approach and focus achieve a healthy balance of proper and sufficient compliance and efficient interaction with stakeholders and business relative to the bank’s business activities. The material compliance challenges facing the bank in the near future include coming to grips with the amended Financial Action Task Force recommendations to facilitate a
smooth process of fi nancial inclusion and developing a risk-based approach together with acceptable levels of compliance with international best practice and local legislation in the fight against money laundering and financing of terrorism; dealing with the imminent protection of personal information legislation; exchange control regulation and, lastly, continued and high levels of compliance with credit legislation to create a responsible and compliant credit environment.
The compliance offi cer reports to the audit committee at every meeting of this com-mittee, and submits compliance reports to the directors’ affairs committee as required by the Banks Act. All material events of non-compliance are reported to the audit and directors’ affairs committees and the board of directors where necessary. For the period under review the compliance offi cer submitted a report which indicated a good level of compliance by the bank to statutory and regulatory requirements, and the events of non-compliance listed were all non-material and either rectifi ed or are in the process of being addressed through system and process changes. The bank supervision department of the South African Reserve Bank are provided with copies of these reports after every meet-ing of the abovementioned committees. The compliance offi cer has annual pru-dential meetings with the bank supervision department of the South African Reserve Bank and responds to general and ad hoc requests for information and discussion when required.
09Compliance offi cer’s report

10Society
64 Capitec Bank Holdings Limited Integrated Report 2012 65
There were no material regulatory sanc-tions against or penalties imposed on the bank as a result of non-compliance during the period under review.
The bank has a good and professional relationship with regulators and, where possible, tries to infl uence the direction of policy and principles of regulation to the extent where it is benefi cial to the banking industry as a whole while still maintaining high levels of compliance with the spirit and letter of the law. In this regard the bank is involved on industry level with initiatives such as the new banking code of conduct, the payment industry and Basel III developments. To ensure involvement in the national payments system, Capitec Bank is a member of the Payments Association of South Africa (PASA) and is represented on multiple payments forums within the association. Capitec Bank was nominated by the low-volume banks in South Africa to represent them on the PASA council. The bank has also nominated a councillor to the PASA council.
The bank has established a dedicated compliance function as prescribed by regulation 49 of the Banks Act 94 of 1990), as amended (the Banks Act). The compliance function manages the bank’s compliance risk, which is defi ned as “the risk that the controls implemented by the bank to facilitate compliance with the applicable statutory and regulatory
requirements are inadequate or ineffi cient”. The compliance universe of the bank consists of all the statutory and regulatory requirements of relevant legislation, regulations and industry codes applicable to the business and sound management of the bank. The head of compliance reports directly to the chief executive offi cer.
A compliance management system is in place and functioning well. The bank uses management software which con-tains a core selection of legislation that isconsidered the most relevant for the bank. The software is utilised to assist with theidentification of compliance objectives and assessment of compliance risks, thecapturing and documenting of key controls and monitoring activities. The compliance function performs independent compli-ance monitoring on a continuous basis through independent compliance moni-toring officers, in accordance with an annual board approved compliance moni-toring coverage plan. The coming year will also see an increase in the headcount of the compliance function to deal with the ever-increasing compliance and regulatorychallenges facing the bank.
Jan-Hendrik de BeerHead: Compliance
ntegr
easy access to banking
for all South Africansaccess to responsibly
granted credit
employment
education
social support
low-cost banking
prosperity

66 Capitec Bank Holdings Limited Integrated Report 2012 67
The consumer needs easy access to sim -plifi ed and cost-effective banking products, including easy everyday money manage-ment. Capitec Bank addresses this need through its four foundation pillars, i.e. accessibility, affordability, simplicity and personal service.
Society is engaged through clients, as explained on page 35, and through part-nership with specialist education support institutions and ongoing relationships with targeted schools as disclosed below.
The following material issues are discussed below:• Simplifi ed money management• Access to a wide range of transparently
priced bank products• Access to affordable and responsibly
granted credit• Employment opportunities• Numerical and language literacy
Simplifi ed money managementIt is inconceivable that in modern society, individuals are forced to go about their daily business without a bank account through which to transact , save and obtain credit. Yet, as little as 10 years ago, the majority of South Africans’ access to credit was limited to very expensive short-term loans. Access to banks in general was restricted to corporates and individuals that were able to travel with private transport to bank branches of choice and do so during the limited hours that they were open. The majority of working South Africans, however,
were unable to access banks due to the limited trading hours and time and cost required to travel to the branches. The costof transacting on bank accounts and the complex nature of bank products further pushed use of bank accounts out of reach for a signifi cant number of South Africans.
Capitec revolutionised banking by opening branches in areas where other banks did not operate and where a large number of consumers work and shop. Today, Capitec Bank branches are distributed to ensure easy access by the full spectrum of exist-ing and potential clientele in the market. The bank also provides, through innova-tive technology, an increasing number of access points for convenient transacting. In addition, business hours were extended and Capitec Bank branches are generally open from 08:00 to 17:00. By listening to what the consumer really needs Capitec Bank has developed simplifi ed and low-cost bank products that facilitate easy money management. Pricing is trans-parent and what the consumer sees is what he gets. In addition, real savings arepossible and people throughout society are empowered to save. The acceptance of the Capitec Bank offer is evident in the increase in client numbers (refer topage 17) over the past years.
Enhanced personal develop-ment and status in societyAccess to personal loans at affordable prices enables consumers to enhance their personal development and status in society. Access to competitively priced credit, granted in a responsible manner, facilitates investment in longer-term assets such as furniture, vehicles, housing improvements and education. Responsibly granted short-term credit enables clients to manage emergencies and short-term shortfalls in an effi cient and cost-effective manner. Conservative credit risk management (refer to page 99) aims to protect the creditworthiness of Capitec Bank clients and facilitates robustness in their fi nancial health status.
Employment opportunitiesThe continued growth in the Capitec footprint ensures continued growth in employment opportunities. Over the past 11 years Capitec has contributed 7 194 permanent jobs to the South African economy, and in the 2012 fi nancial year, 1 863. Remuneration paid to employees in the 2012 financial year amounted toR1.3 billion (2011: R930 million). Strategy strongly promotes that branch employees be recruited from the communities in surrounding areas that the branches serve to ensure that employees are fl uent in the language spoken in the communities that they serve. Remuneration earned can thus be ploughed back into the communities where clients and employees of Capitec Bank live.
Social development through educational supportCapitec Bank’s corporate social investment (CSI) programme focuses on three main areas of support: high school education, fi nancial literacy and ad hoc donations.
High school educationLiteracy continues to be a seriousconstraint in the employability of a large portion of South Africans. Extensive investigation into the shortcomings in the South African education system has shown that arm’s length donations to institutions are not necessarily in the best interest of the targeted recipients. Strategy was therefore reconsidered and adjusted towards sponsoring an ancillary educa-tion support model for higher-potential, most needy students. The model entails an ongoing relationship with targeted schools, selective bursaries and sponsor-ship packages for learners and ancillary schooling and skills transfer via extramuralstructures. A partnership has been formed with Ikamva Youth, a specialist education support institution. Successful learners will eventually be offered employmentopportunities at Capitec Bank.
A trial programme was set up during 2011 in the Western Cape with Ikamva Youth, UCT and Western Cape schools. The objective is to manage this model in the Western Cape for the fi rst two years to address all the administrative challenges before extending it to other regions.
DonationsAd hoc donations are made in accordance with Capitec Bank policy as disclosed in previous annual reports. The focus remains on education and youth development. In line with policy, no donations were made to political parties.
Consumer educationFinancial literacy is essential to manage personal finances. A financial skills programme was developed to educate employees at their place of work. The programme is free of charge and in line with the Financial Sector Charter. Capitec Bank collaborates with two financial literacy training organisations who present the financial skills programme at the employers on behalf of Capitec Bank.
Live Free projectCapitec Bank’s Live Free project was a national initiative that encouraged South Africans to get back to basics, rediscover the simple things in life and have fun at no or low cost. It consisted of a series of free, interactive events across the country in celebration of simple, everyday pleasures. The project kicked off in December 2010 with two sandcastle construction events in Cape Town and Durban, encouraging beach goers to rediscover the joy of building a sandcastle – free! Then, in February 2011, the project launched the pop-up Le Budget Café just before the National Budget Speech. It encouraged corporate Capetonians to be saving-savvy by packing their own lunch to work, instead of buying it at deli prices. The project culminated in the Swapping Mall project in
Gauteng during National Savings month inJuly 2011, tapping into the activity consumers enjoy so much – “shopping”. The event was held at the trendy Atlas Studios in Braamfontein Johannesburg and consisted of a receiving depot at the entrance area and categorised shopping isles to display the merchandise. Swappers arrived with gently or hardly used items and swapped them for “tokens” at the receiving depot. They were then able to swap their tokens for the used/hardly used items of others. This transaction did not cost the shopper a cent and free coffee was provided to round off the swapping experience and have participants discussing the experience with their friends and other swappers. The swapping mall project was awarded a public relations award, the 2012 Gold Quill of merit. These events illustrate that Capitec Bank thinks differently about life and money, highlighting that wealth is not necessarily experienced in quantity, but rather in attitude to life.
Integrgrratea d Report 202012 676

reliable support
cost effectiveness
transformation
mutualprogress
68 Capitec Bank Holdings Limited Integrated Report 2012 69
The Capitec group is dependent on suppliers to ensure timeous delivery of orders to support employees in their day- to-day functions and ultimately facilitate continued client satisfaction. For suppliers, Capitec represents ever growing business opportunities. Capitec Bank’s total supplier spend increased by 5% during the period under review and qualifying BEE spend amounted to 73% of total supplier spend.
Suppliers are generally engaged on a one-on-one basis and any potential issues are addressed immediately.
The Capitec group subscribes to the Codes of Good Practice issued under the Broad-Based Black Economic Empowerment Act (Act 53 of 2003) (BBBEE Act). Capitec Bank is a level 5 contributor and received a BEE preferential procurement recognition of 80%. The BEE certifi cate is available on the Capitec Bank website at www.capitecbank.co.za.
Alternative dispute resolutionAgreements that do not fall within the ambit of the NCA or the CPA (mainly between Capitec companies and other organisations) have provisions that disputes must fi rst be referred to senior management of both parties to be resolved and/or that an independent expert, who will not act as arbitrator, will resolve the dispute. Failing any of the aforementioned dispute resolution measures, the dispute will be referred to formal arbitration.
11Suppliers
2010 2011 2012
Total procurement spend
Qualifying BEE spend
PROCUREMENT SPEND (R)
589 108407 323
922 2401 260 613806 146
639 797
Material issues are
addressed in various
chapters in this report
How material issues are addressed Page
Brand confi dence
and trust in the market
• Reliable and trustworthy service
• Stability
• Access through expanded retail footprint.
• Affordability, simplicity and transparency of
product offer
40 – 42,
60
Fraud • Zero-tolerance approach towards fraud and
corruption
• A fraud risk management framework is in place in
terms of which fraud and corruption are prevented,
identifi ed, investigated and reported on
• Continous training of employees to recognise fraud
• Industry interaction, e.g. Sabric, where information
is exchanged
• Close working relationship with the South African
Police Service
• Conservative management of growth elements
such as liquidity and credit quality 104
Growth • Systems and processes are geared for expansion
• Conservative management of growth elements
such as liquidity and credit quality
29,
92, 99

70 Capitec Bank Holdings Limited Integrated Report 2012 71
Information technology forms the backbone of the service that Capitec Bank provides to its clients. Innovative application of technology has enabled the development of uncomplicated, low-priced bank products. Through innovative technology a cost-effective business process was developed where fl oor space in branches is used to service clients directly; backoffice functions are centralised. Due to centralisation of the bulk of branch administrative processes, there is no requirement for expensive backoffi ce processes. Branches can remain open for longer hours and consultants in the branches can focus on providing personal service to clients.
Material issues• Security of clients’ money• Downtime management
IT governance framework IT governance is implemented according to the Capitec Bank IT governance policy and supporting IT governance framework. The framework is based on principles and controls as they are defined in the following international standards: Cobit, ITIL and ISO27001. The governance framework defi nes how Capitec Bank ensures that the IT strategy is created, approved, reviewed and implemented in such a way that it is always aligned with the business strategy.
The IT governance framework also defines the organisa-tional structure that is required to facilitate good govern-ance in the areas of technology and information security management. Weekly executive management meetings, as well as formal IT prioritisation meetings provide the platform where strategic IT issues are discussed and cross-functional priorities are agreed. Weekly meetings, focused on IT risks and potential performance issues, ensure that situations which could threaten the availability of systems, or the confi dentiality and integrity of informa-tion, are identifi ed and discussed on a senior management level. This ensures that important issues are dealt with, with the correct level of urgency and focus.
12Informationtechnology
stable platform,innovative
products
input one
technology
innovation
expertise
governance

72 Capitec Bank Holdings Limited Integrated Report 2012 73
IT disaster recovery (DR) The IT risk management department facilitates frequent tests on the ability of the bank to recover systems within an acceptable time limit when disaster strikes. These tests are regularly audited by the internal auditors and the range of tests and scope of tests are improved on a continuous basis. The results for tests conducted during the year showed that Capitec Bank managed to complete a successful switch of all critical and essential systems to the DR site, within the timelines that were agreed with the board and the industry. These tests were completed quarterly and are audited annually.
IT risk management, in cooperation with the operational risk manager, frequently reviews DR and business continuity plan priorities within the bank. These issues are then addressed by IT and the relevant business units to ensure that the time required to recover is driven down continuously to ensure minimal impact on the business in the case of a disaster.
IT compliance The IT risk manager acts as compliance champion for the IT department and in this role facilitates frequent assessment of the status of legal and regulatory compliance issues in cooperation with the Capitec Bank compliance offi cer. Progress on all compliance issues are formally tracked and reported on.
Information security management system (ISMS) The Capitec Bank information security policies and standards provide the platform on which controls to protect sensitive client and business information are designed. The ISMS is based on ISO 27001 and is the responsibility of the information security officer.
During the year Capitec Bank started a forum, which included senior managers within Capitec Bank and external information security experts, which focused on
identifying longer-term information security risks. This forum now forms part of the Capitec Bank risk assessment framework for IT and will become an annual event.
Environmental mattersDuring the year numerous technology changes were implemented to reduce electricity consumption and to improve the ability of the bank to manage the use of electricity more effi ciently:• A system was implemented to manage and report in real
time on electricity consumption.• Changes were implemented to manage air-conditioning
systems more effi ciently.• Lights in head offi ce buildings were replaced by more
environmentally friendly LED lights.• New technology was deployed in the computer centre to
make more effi cient use of electricity and cooling (hot aisle containment).
• The continued deployment of virtualisation technology in the enterprise server environment created a potential saving of 57% in cooling requirements and energy consumption for the year.
• All electronic equipment that was decommissioned was recycled by an accredited third party.
Planned actions for the year ahead• During the year ahead the computer centre will be
expanded to accommodate growth. The design of the computer centre includes the use of hot aisle containment technology which will facilitate more effi cient use of electricity.
• Virtualisation initiatives will lead to another 6% – 10% saving on the utilisation of electricity.
Due to the nature of its business and the manner in which it is managed, Capitec Bank is considered to have a very limited impact on the environment.
13Governance
Report 2012 73Integrate
ethics
integrity
responsibility
honesty
governance
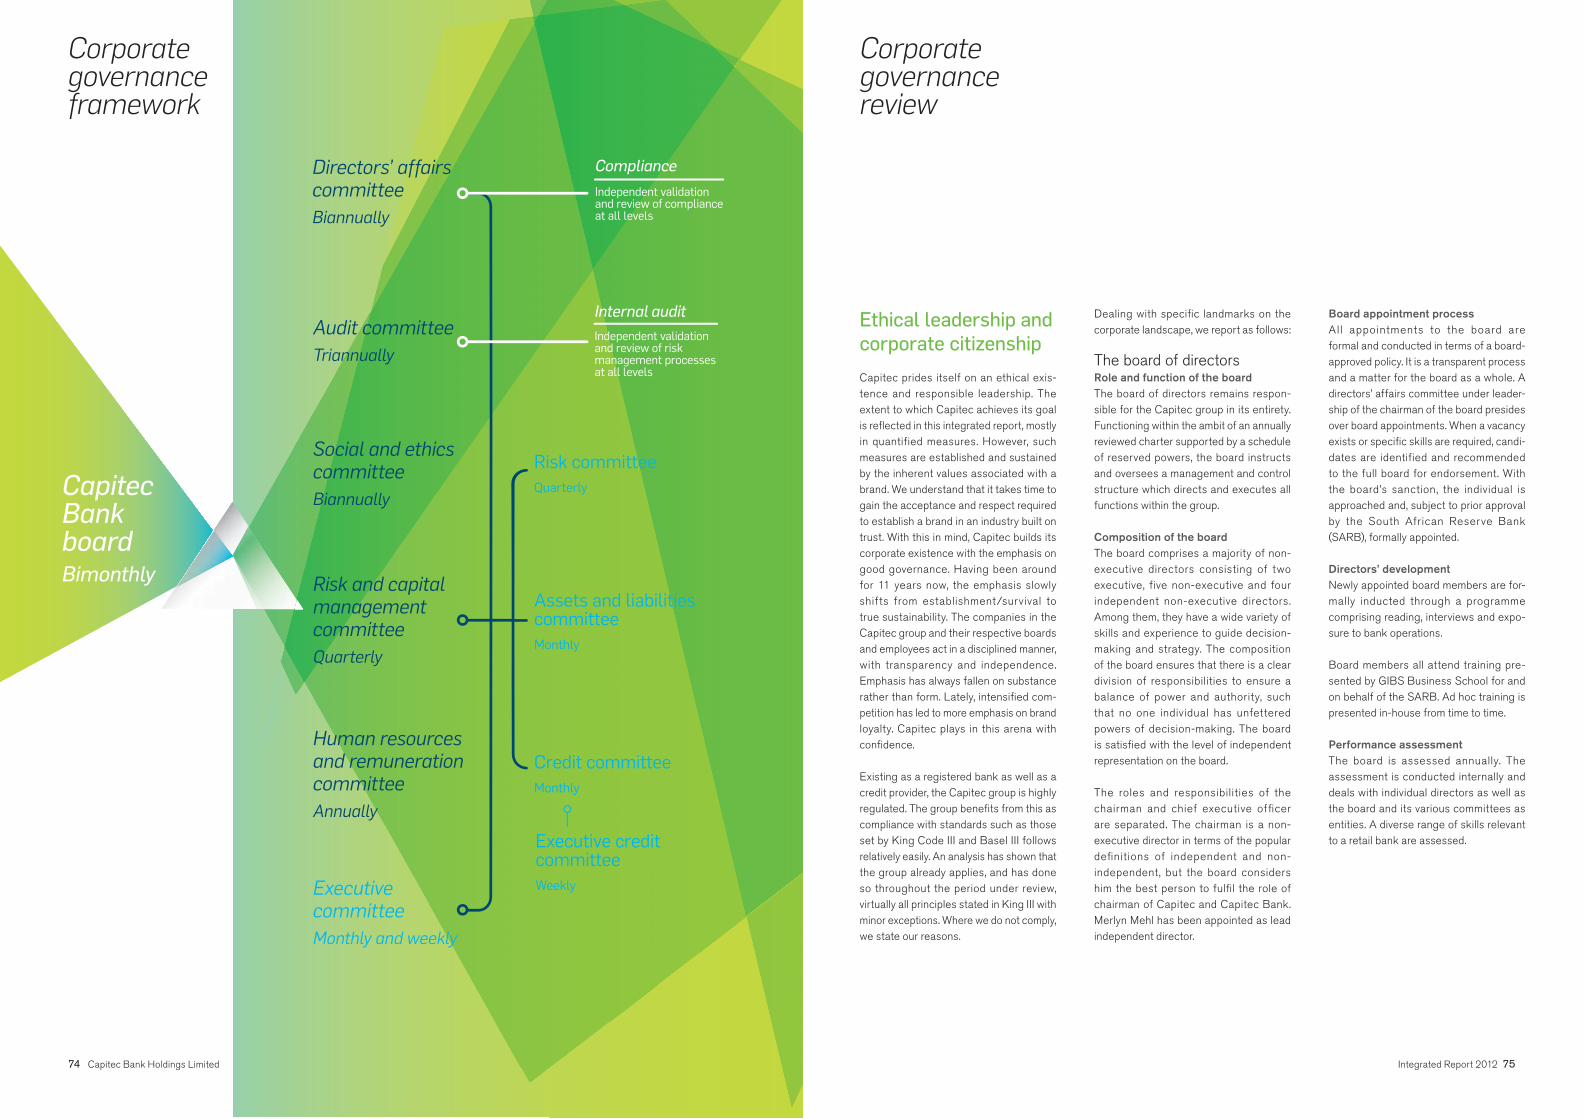
Capitec Bank boardBimonthly
Human resourcesand remunerationcommittee Annually
Executive committee Monthly and weekly
Social and ethicscommitteeBiannually
Audit committeeTriannually
Risk and capitalmanagementcommitteeQuarterly
Directors’ affairscommitteeBiannually
Internal audit
Independent validation and review of risk management processes at all levels
Compliance
Independent validation and review of compliance at all levels
Executive credit committee Weekly
Credit committee Monthly
Assets and liabilities committee Monthly
Risk committee Quarterly
74 Capitec Bank Holdings Limited Integrated Report 2012 75
Ethical leadership and
corporate citizenship
Capitec prides itself on an ethical exis-tence and responsible leadership. The extent to which Capitec achieves its goal is reflected in this integrated report, mostly in quantified measures. However, such measures are established and sustained by the inherent values associated with a brand. We understand that it takes time to gain the acceptance and respect required to establish a brand in an industry built on trust. With this in mind, Capitec builds its corporate existence with the emphasis on good governance. Having been around for 11 years now, the emphasis slowly shifts from establishment/survival to true sustainability. The companies in the Capitec group and their respective boards and employees act in a disciplined manner, with transparency and independence. Emphasis has always fallen on substance rather than form. Lately, intensifi ed com-petition has led to more emphasis on brand loyalty. Capitec plays in this arena with confi dence.
Existing as a registered bank as well as a credit provider, the Capitec group is highly regulated. The group benefits from this as compliance with standards such as those set by King Code III and Basel III follows relatively easily. An analysis has shown that the group already applies, and has done so throughout the period under review, virtually all principles stated in King III with minor exceptions. Where we do not comply, we state our reasons.
Dealing with specifi c landmarks on the corporate landscape, we report as follows:
The board of directors Role and function of the board The board of directors remains respon-sible for the Capitec group in its entirety. Functioning within the ambit of an annually reviewed charter supported by a schedule of reserved powers, the board instructs and oversees a management and control structure which directs and executes all functions within the group.
Composition of the board The board comprises a majority of non-executive directors consisting of two executive, five non-executive and four independent non-executive directors. Among them, they have a wide variety of skills and experience to guide decision-making and strategy. The composition of the board ensures that there is a clear division of responsibilities to ensure a balance of power and authority, such that no one individual has unfettered powers of decision-making. The board is satisfi ed with the level of independent representation on the board.
The roles and responsibilities of the chairman and chief executive officer are separated. The chairman is a non-executive director in terms of the popular definitions of independent and non-independent, but the board considers him the best person to fulfil the role of chairman of Capitec and Capitec Bank. Merlyn Mehl has been appointed as lead independent director.
Board appointment process All appointments to the board are formal and conducted in terms of a board-approved policy. It is a transparent process and a matter for the board as a whole. A directors’ affairs committee under leader-ship of the chairman of the board presides over board appointments. When a vacancy exists or specific skills are required, candi-dates are identified and recommended to the full board for endorsement. With the board’s sanction, the individual is approached and, subject to prior approval by the South African Reserve Bank (SARB), formally appointed.
Directors’ development Newly appointed board members are for-mally inducted through a programme comprising reading, interviews and expo-sure to bank operations.
Board members all attend training pre-sented by GIBS Business School for and on behalf of the SARB. Ad hoc training is presented in-house from time to time.
Performance assessment The board is assessed annually. The assessment is conducted internally and deals with individual directors as well as the board and its various committees as entities. A diverse range of skills relevant to a retail bank are assessed.
Corporate governance review
Corporate governance framework

76 Capitec Bank Holdings Limited Integrated Report 2012 77
Board committees The board oversees a structure of committees comprising the following:
Committee Purpose Composition Quorum Frequency of meetings
1. Board ofdirectors
The board of directors is responsible for the strategy and overall management of the bank
The board consists of:Five non-executive directorsMS du P le Roux (chairman)RJ HuntleyMJ JoostePJ MoutonCA OttoFour independentnon-executive directorsJD McKenzieMC MehlNS Mjoli-MncubeJP van der MerweTwo executive directorsR Stassen (CEO) AP du Plessis (FD)
Majority of directors for the time being in offi ce of which at least 50% must be non-executive
Six times a year
2. Executivemanagement committee
Responsible for operational decision-making, implemen-ta tion of strategic decisions approved by the board and approvals of administrative nature on an ongoing basis
R Stassen (chairman)AP du PlessisJE CarstensCG FischerGM FourieNST MotjuwadiA OlivierC OosthuizenL Solwandle*CG van SchalkwykL VenterC Vermeulen*
Majority of members, including at least three of the following: CEO, FD, exec: risk management and exec: operations
Three times a week and an extended meeting once a month
3. Directors’affairs committee
Responsible for evaluation of board effectiveness, senior management and board succession planning and corporate governance
All non-executive directors Majority of members Twice a year
4. Audit committee Oversees fi nancial controls, reporting and disclosure
JP van der Merwe (chairman)MC MehlNS Mjoli-MncubeIndependent attendeeDG Malan (external audit partner – PricewaterhouseCoopers Inc.)Management attendeesJ-HC de Beer (compliance offi cer)AP du PlessisJJ Gourrah (internal audit)R StassenCG van Schalkwyk
50% but not less than two members
Three times a year
Committee Purpose Composition Quorum Frequency of meetings
5. Human resources and remuneration committee
Determines directors’ and senior executives’ remun eration. Levels of remuneration of all employees, adjustment thereof and, when applicable, additional remuneration such as bonuses and incentives, including share option incentives, are determined
CA Otto (chairman)MS du P le RouxMJ JoosteManagement attendeesR StassenNST Motjuwadi
Majority of members Once a year
6. Risk and capital management committee
Responsible for identifi cation of all risks. Assists the board in reviewing the risk management systems and processes and signifi cant risks facing the bank as well as capital management
MC Mehl (chairman)PJ MoutonCA OttoJP van der MerweManagement attendeesJ-HC de BeerJE Carstens J Delport (operational risk)AP du PlessisJJ GourrahR StassenCG van Schalkwyk
Majority of members Four times a year
7. Large exposures committee
Approval of credit exposures in excess of 10% of bank capital
Risk and capitalmanagement committeeMC Mehl (chairman)PJ MoutonCA OttoJP van der MerweMembers of managementJE CarstensAP du PlessisR StassenCG van Schalkwyk
Majority of members As required
8. Social and ethics committee
Promotes the collective wellbeing of society, thereby facilitating the sustainable growth of the Capitec group
PJ Mouton (chairman)J HuntleyCG van SchalkwykManagement attendeesCG FischerNST Motjuwadi
Majority of members Twice a year
Note:
* Development seats, rotate annually
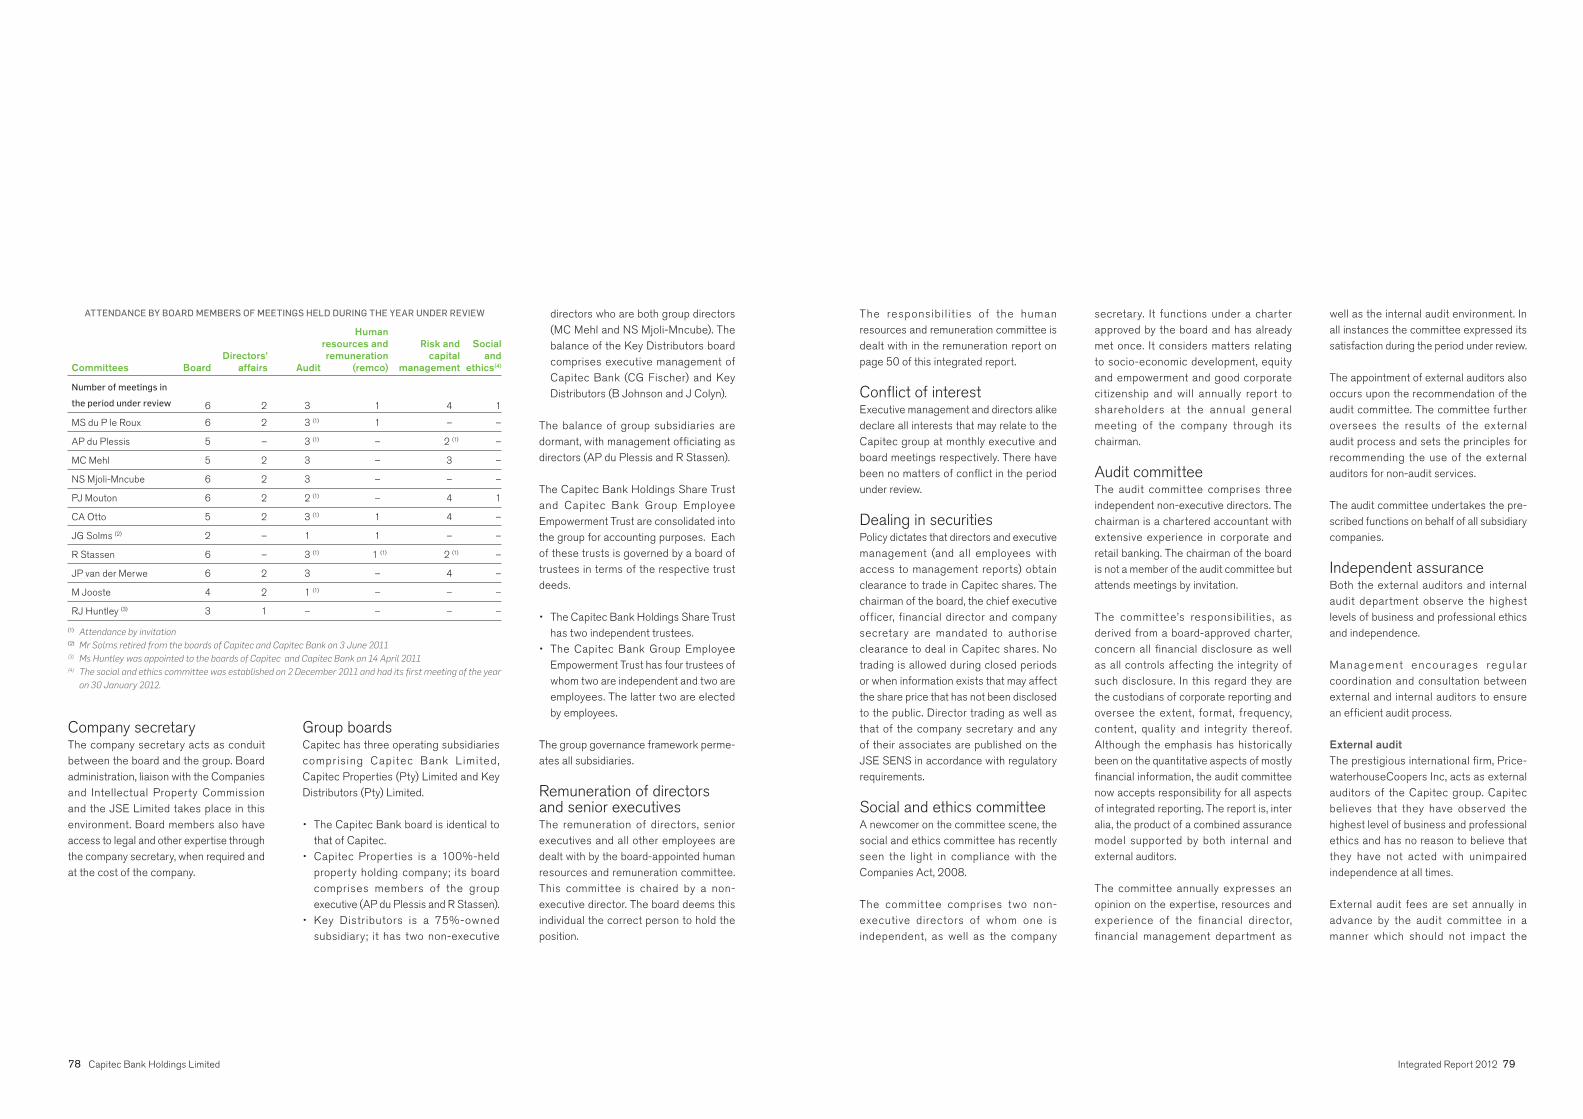
78 Capitec Bank Holdings Limited Integrated Report 2012 79
Company secretary The company secretary acts as conduit between the board and the group. Board administration, liaison with the Companies and Intellectual Property Commission and the JSE Limited takes place in this environment. Board members also have access to legal and other expertise through the company secretary, when required and at the cost of the company.
Group boards Capitec has three operating subsidiaries comprising Capitec Bank Limited , Capitec Properties (Pty) Limited and Key Distributors (Pty) Limited.
• The Capitec Bank board is identical to that of Capitec.
• Capitec Properties is a 100%-held property holding company; its board comprises members of the group executive (AP du Plessis and R Stassen).
• Key Distributors is a 75%-owned subsidiary; it has two non-executive
The responsibil i t ies of the human resources and remuneration committee is dealt with in the remuneration report on page 50 of this integrated report.
Conflict of interest Executive management and directors alike declare all interests that may relate to the Capitec group at monthly executive and board meetings respectively. There have been no matters of conflict in the period under review.
Dealing in securities Policy dictates that directors and executive management (and all employees with access to management reports) obtain clearance to trade in Capitec shares. The chairman of the board, the chief executive officer, financial director and company secretary are mandated to authorise clearance to deal in Capitec shares. No trading is allowed during closed periods or when information exists that may affect the share price that has not been disclosed to the public. Director trading as well as that of the company secretary and any of their associates are published on the JSE SENS in accordance with regulatory requirements.
Social and ethics committeeA newcomer on the committee scene, the social and ethics committee has recently seen the light in compliance with the Companies Act, 2008.
The committee comprises two non- executive directors of whom one is independent, as well as the company
secretary. It functions under a charter approved by the board and has already met once. It considers matters relating to socio-economic development, equity and empowerment and good corporate citizenship and will annually report to shareholders at the annual general meeting of the company through its chairman.
Audit committee The audit committee comprises three independent non-executive directors. The chairman is a chartered accountant with extensive experience in corporate and retail banking. The chairman of the board is not a member of the audit committee but attends meetings by invitation.
The committee’s responsibilities, as derived from a board-approved charter, concern all financial disclosure as well as all controls affecting the integrity of such disclosure. In this regard they are the custodians of corporate reporting and oversee the extent, format, frequency, content, quality and integrity thereof. Although the emphasis has historically been on the quantitative aspects of mostly financial information, the audit committee now accepts responsibility for all aspects of integrated reporting. The report is, inter alia, the product of a combined assurance model supported by both internal and external auditors.
The committee annually expresses an opinion on the expertise, resources and experience of the financial director, financial management department as
well as the internal audit environment. In all instances the committee expressed its satisfaction during the period under review.
The appointment of external auditors also occurs upon the recommendation of the audit committee. The committee further oversees the results of the external audit process and sets the principles for recommending the use of the external auditors for non-audit services.
The audit committee undertakes the pre-scribed functions on behalf of all subsidiary companies.
Independent assurance Both the external auditors and internal audit department observe the highest levels of business and professional ethics and independence.
Management encourages regular coordination and consultation between external and internal auditors to ensure an efficient audit process.
External audit The prestigious international firm, Price-waterhouseCoopers Inc, acts as external auditors of the Capitec group. Capitec believes that they have observed the highest level of business and professional ethics and has no reason to believe that they have not acted with unimpaired independence at all times.
External audit fees are set annually in advance by the audit committee in a manner which should not impact the
ATTENDANCE BY BOARD MEMBERS OF MEETINGS HELD DURING THE YEAR UNDER REVIEW
Committees BoardDirectors’
affairs Audit
Human resources andremuneration
(remco)
Risk andcapital
management
Socialand
ethics(4)
Number of meetings in
the period under review 6 2 3 1 4 1
MS du P le Roux 6 2 3 (1) 1 – –
AP du Plessis 5 – 3 (1) – 2 (1) –
MC Mehl 5 2 3 – 3 –
NS Mjoli-Mncube 6 2 3 – – –
PJ Mouton 6 2 2 (1) – 4 1
CA Otto 5 2 3 (1) 1 4 –
JG Solms (2) 2 – 1 1 – –
R Stassen 6 – 3 (1) 1 (1) 2 (1) –
JP van der Merwe 6 2 3 – 4 –
M Jooste 4 2 1 (1) – – –
RJ Huntley (3) 3 1 – – – –
(1) Attendance by invitation (2) Mr Solms retired from the boards of Capitec and Capitec Bank on 3 June 2011(3) Ms Huntley was appointed to the boards of Capitec and Capitec Bank on 14 April 2011(4) The social and ethics committee was established on 2 December 2011 and had its fi rst meeting of the year
on 30 January 2012.
directors who are both group directors (MC Mehl and NS Mjoli-Mncube). The balance of the Key Distributors board comprises executive management of Capitec Bank (CG Fischer) and Key Distributors (B Johnson and J Colyn).
The balance of group subsidiaries are dormant, with management offi ciating as directors (AP du Plessis and R Stassen).
The Capitec Bank Holdings Share Trust and Capitec Bank Group Employee Empowerment Trust are consolidated into the group for accounting purposes. Each of these trusts is governed by a board of trustees in terms of the respective trust deeds.
• The Capitec Bank Holdings Share Trust has two independent trustees.
• The Capitec Bank Group Employee Empowerment Trust has four trustees of whom two are independent and two are employees. The latter two are elected by employees.
The group governance framework perme-ates all subsidiaries.
Remuneration of directors and senior executives The remuneration of directors, senior executives and all other employees are dealt with by the board-appointed human resources and remuneration committee. This committee is chaired by a non-executive director. The board deems this individual the correct person to hold the position.

80 Capitec Bank Holdings Limited Integrated Report 2012 81
scope of the audit. The extent of the audit determines the audit fee. Non-audit services rendered by the external auditors are limited to ad hoc tax advice and other assurance-related services within the parameters of a policy approved by the audit committee limiting such expense to 40% of the annual audit fee. Details of fees paid to the external auditor are included in note 22 to the annual financial statements, together with details of non-audit services provided and the fees paid in respect thereof.
The engagement partner responsible for the audit rotates every five years. The external auditor attends the annual general meeting of shareholders.
Internal audit Status of internal audit The company has an independent internal audit department with direct accessto the chairman, reporting functionally tothe audit committee and administratively to the chief executive officer. Internal audit is risk-based and the internal auditors submit an annual assessment to the audit committee on the system of internal controls. Apart from own employees it functions on a co-sourced basis with KPMG as external consultants and in accordance with a charter approved by the audit committee. The charter formally defines the purpose, authority and responsibility of internal audit activity and is consistent with the Institute of Internal Auditors’ definition. The head of internal audit is required to attend all audit and risk and capital management committee
meetings and submits a report to each audit committee meeting.
Role and function of internal audit Internal audit forms an integral part of the combined assurance model and focuses on adding value to the operations of the group. To this end it emphasises: • evaluation of appropriateness of and
adherence to company policies and procedures;
• prevention of fraud, unethical behaviour and irregularities;
• production of quality management information; and
• sound business processes and associa-ted controls.
Scope of internal audit The department annually submits a coverage plan to the audit committee for approval. The scope of this plan encompasses the entire business of the group and is prepared with the strategic aim of the group in mind. Great emphasis is placed on implementation and efficiency of systems. In addition, the operations environment is closely monitored and assurance derived that controls are adequate and operating effectively. Increased emphasis is placed on development of centralised monitoring and continuous auditing. In this process, any deficiency detected in governance is referred to management for action. The extent to which recommendations emanating from audits have been imple-mented, are measured.
Board of directors
of Capitec and
Capitec Bank
Non-executive Michiel Scholtz du Pré le Roux (62) BComm LLB Chairman of the board and directors’ affairs committee Michiel is the chairman of Capitec and Capitec Bank. He was the chief executive officer of the bank until 2004. Michiel isa director of Zeder Investments. He spent the fi rst 20 years of his career in the brandy and wine industry before entering the banking industry.
Michiel was appointed to the board of Capitec on 1 March 2001 and Capitec Bank on 6 April 2000.
Markus Johannes Jooste (51) BAcc, CTA, CA(SA) Markus is the chief executive officer of the Steinhoff International Group. He was appointed as group managing director of Steinhoff with responsibility for the Steinhoff group’s northern hemisphere interests in 2000. Through these respon -sibilities he has gained extensive expe-rience in the international business environment.
He serves on the boards of, inter alia, PSG Group, KAP International Holdings and Phumelela Gaming and Leisure.
Markus was appointed to the boards of Capi tec and Capi tec Bank on28 January 2011.
Reitumetse Jacqueline Huntley (49) BProc LLB Jackie is the managing director ofMkhabela Huntley Adekeye Inc. andhas extensive experience in commercial and corporate law, including tele-communications law. She has also worked extensively in low-cost housing, having advised both the Department of Housing and institutions in the housing sector on housing policy and legal aspects of housing. Jackie assisted the City of Johannesburg with the implementation of the bus rapid transit project where she was the interim chief executive officer up to February 2011. She serves on the board and various board committees of Telkom SA and is a director of Rorisang Basadi Investments.
Jackie was appointed to the boardof Capitec and the board of Capitec Bank on 14 April 2011.
Petrus Johannes Mouton (35)BComm (Maths)Chairman of the social and ethics committeePiet is the chief executive offi cer of PSG Group. He serves as a director on the boards of various PSG Group companies, including Curro Holdings, Paladin Capital and Zeder Investments. He has been active in the investment and fi nancial services industry since 1999.
Piet was appointed to the board of Capitec and the board of Capitec Bank on 5 October 2007.
Chris Adriaan Otto (62) BComm LLB Chairman of the human resources and remuneration committee Chris has been an executive director of PSG Group since its formation and has served as a non-executive director since February 2009. He has been involved in PSG Group’s investment in microfinance and the subsequent establishment of Capitec Bank of which he has been a non-executive director since its establishment. He is also a director of Zeder Investments, Kaap Agri, Capevin Investments and Distell.
Chris was appointed to the board of Capitec and the board of Capitec Bank on 6 April 2000.
Independent non-executive Merlyn Claude Mehl (69) PhD (Physics) Lead independent directorChairman of the risk and capital management committee Merlyn serves on the boards of a number of companies. He was previously the chancellor of Peninsula Technikon and the chief executive officer of the Independent Development Trust. He is presently the executive chairman of Triple L Academy.
Merlyn was appointed to the board of Capitec and the board of Capitec Bank on 1 March 2001.
John David McKenzie (65) BSc (Chemical Eng), MAJock serves on the boards of a number of companies. He was the chairman and chief executive offi cer of Caltex PetroleumCorporation until 2001. He was extensively involved in the merger of Caltex, Chevron and Texaco and was appointed president – Asia, Middle East and Africa of Chevron-texaco until 2004. Between 1997 and 2003 he was a member of a number of advisory boards in Singapore, including the American Chamber of Commerce. He was the founder president of the South Africa-Singapore Business Association and a director of the US-Asian Business Council and the Singapore Economic Development Board. Since 2004 he has served as a consultant to the Energy Market Authority and Temasek Holdings in Singapore and acted as chairman of the Commission of Enquiry into the Singapore Electricity and Gas Supply Systems. In South Africa he has been involved in consulting to,inter alia, Sasol, the South African Petro-leum Industry Association’s investigation into the impact of the global economiccrisis on the South African oil industry and other related topics. He currently serves on the boards of Coronation Fund Mana-gers, Sappi and Wesgro and is chairman of the UCT Foundation and Accelerate Cape Town.
Jock was appointed to the board of Capitec and the board of Capitec Bank on 1 March 2012.

82 Capitec Bank Holdings Limited Integrated Report 2012 83
Nonhlanhla Sylvia Mjoli-Mncube (53) BA, MA (City and Regional Planning) Nonhlanhla manages her own company, Mjoli Development Group. She was previously the economic advisor to the former Deputy President of South Africa. She has worked as a town and regional planner in South Africa and as a survey research supervisor at Washington State University. She was an executive director at a subsidiary of Murray& Roberts, the chairman of the National Urban Reconstruction and Housing Agency (NURCHA), as well as the chairman of the Rural Housing Loan Fund, Women for Housing and the Open Society Institute in South Africa. She is a fellow of Massachusetts Institute of Technology (MIT, USA), and a Harvard University Leadership Alumnus. She has won several business women awards. She is a director of Pioneer Foods, Tongaat Hullett and WBHO Construction.
Nonhlanhla was appointed to the boards of Capitec and Capitec Bank on 26 January 2004.
Jan Georg Solms (57)BAcc, CTA, CA(SA) Johnnie has been a member of the JSE since 1981 and is a stockbroker and executive director of stockbrokers Independent Securities.
Johnnie retired from the boards of Capitec and Capitec Bank on 3 June 2011 after ten years of service to the group.
Jacobus Pieter van der Merwe (63) BA, CTA, CA(SA) Chairman of the audit committee Pieter is an experienced retail banker. He commenced his career in banking as chief accountant at Boland Bank in 1974 after which he joined Volkskas Merchant Bank as general manager of finance in 1983. He joined Trust Bank in 1990, and after the amalgamation of Bankorp and Absa he was appointed general manager of Commercial Bank,a division of Absa, responsible for Absa Western Cape (1995 – 1999). In 2000 he was appointed operating
executive of this division. From 2001 to his retirement in 2006 he was an executive director of Absa, the last two and a half years of which he was responsible for group administration, information management, IT, credit and risk.
Pieter was appointed to the boards of Capitec and Capitec Bank on 27 September 2007.
Executive Riaan Stassen (58) BComm (Hons), CA(SA) Chief executive officer Riaan joined Capitec Bank as the managing director in 2000 and was appointed chief executive offi cer of Capitec and Capitec Bank effective March 2004. He gained extensive experience in wholesale distribution and banking and held senior positions in both environments. Riaan was awarded the Cape Times KPMG Business Personality of the Year award in 2007. The nomination criteria for this award included business and entrepreneurial excellence and outstanding company performance.
Riaan was appointed to the boards of Capitec and Capitec Bank on 1 March 2001.
André Pierre du Plessis (50) BComm (Hons), CA(SA) Financial director André joined Capitec Bank in 2000 as the executive: financial management and was appointed financial director of Capitec and Capitec Bank in May 2002. He has extensive experience in business advisory services, financial consulting and strategic and financial management. He was the chief executive of financial management of Boland PKS and NBS Boland Group from 1996 to 2000 and a partner at Arthur Andersen where he was employed from 1986 to 1996.
André was appointed to the boards of Capitec and Capitec Bank on 6 May 2002.
Executive management
committee
Riaan Stassen (58) BComm (Hons), CA(SA) Chief executive officer See board of directors.
André Pierre du Plessis (50) BComm (Hons), CA(SA) Financial director See board of directors.
Jacobus Everhardus Carstens (43) BCompt (Hons), CA(SA) Chief credit officer Jaco joined Capitec Bank in 2004. He gained extensive experience in the credit environment at Old Mutual Bank from 2000 to 2004, serving respectively as head of credit, head of credit risk: policy and decision support and assistant divisional manager: credit, pricing and decision support. Previous positions include manager at Boland Bank from 1997 to 1999 and assistant manager at Ernst & Young from 1992 to 1997.
Carl Gustav Fischer (55) BComm (Hons), MBA Executive: marketing and corporate affairs Carl joined Capitec Bank in 2000. He was the chief executive of marketing and support services of Boland PKS from 1999 to 2000. Previous positions include group marketing and sales director (1996 – 1998) and group production/operations director of Stellenbosch Farmers’ Winery (1993 – 1996).
Gerhardus Metselaar Fourie (48) BComm (Hons), MBA Executive: operations Gerrie has been head of operations at Capitec Bank since 2000. He commenced his career at Stellenbosch Farmers’
Winery in 1987 in the financial planning department, whereafter he was appointed area general manager of KwaZulu-Natal and later Gauteng.
Nathan Stephen Tlaweng Motjuwadi (45) BA (Hons), UED, MBA Executive: human resources Nathan joined Capitec Bank in 2010 with almost 15 years’ experience in the human resources/training environment. Prior to joining Capitec Bank, he was employed by XPS Services, Cyborg Systems, Coca-Cola (SA) (based in South Africa and London), and Danone SA. Nathan started his career as a teacher and head of department (English and History) from 1993 to 1995. He also lectured part time at Unisa’s School of Business Leadership.
André Olivier (44) BComm (Hons), CA(SA) Executive: card services and business development André joined Capitec Bank in 2000 and has been responsible for business development ever since. Card services was incorporated in his area of responsibility in 2009. He was financial risk manager at Boland PKS, after which he was head of operations of Pep Bank, in the bank’s micro-lending division from 1997 to 2000. He gained audit and business advisory experience with Arthur Andersen.
Christiaan Oosthuizen (57) Executive: information technology Chris joined Capitec Bank as head of information technology in 2000. He previously held the position of chief executive of information technology at Boland PKS, where he was employed from 1976 to 2000.
Ludwe Solwandle* (35)MBAManager: operational effi ciencyLudwe joined Capitec Bank in 2008 as branch manager. He was promoted to regional manager in 2009 and

84 Capitec Bank Holdings Limited Integrated Report 2012 85
manager: operational efficiency in 2011. Previous positions include financial advisor at Sanlam Wealth Agency and currency trader at PG Forex.
Christian George van Schalkwyk (57) BComm LLB, CA(SA) Executive: risk management and company secretary Christian joined Capitec Bank as head of risk management and company secretary in 2000. He was chief executive of credit risk and legal services at Boland PKS from 1997 to 2000. Previous positions include being a partner at attorneys Jan S de Villiers (1987 – 1996) and a tax consultant at Arthur Andersen (1985).
Leonardus Venter (50) BA (Hons), MA (Industrial psychology) Executive: business support centre Leon joined Capitec Bank as head of human resources in 2000. He was appointed as executive: business support centre in 2009. Previous positions include human resources manager at Iridium Africa (1998 – 1999), manager of human resources and support at Telkom SA (1993 – 1997) and area personnel manager at Iscor (1986 – 1992).
Chris Vermeulen* (43)BSc, BEd, CISSP, MBAManager: IT riskChris joined Capitec Bank in 2005 as IT risk manager. He has 15 years’ experience in IT, of which 12 years in banking (Boland PKS, BoE and Nedbank). His previous roles include involvement with e-commerce, card innovation, information security and risk management.
* There are two development seats on the executive management committee to provide senior employees the opportunity to gain experience at executive level. The incumbents rotate annually. During the 2012 fi nancial year these positions were fi lled by Ronel Prinsloo and Craig Williams. Ludwe Solwandle and Chris Vermeulen were appointed to the committee on 1 March 2012.
The group views risk management as a measure of ensuring a responsible return on shareholders’ equity. Ultimately, the board remains responsible for risk management. To assist them in performing this duty, the business is managed through a system of internal controls functioning throughout the entity. This promotes an awareness of risk in every area of the business as risk management is seen as the responsibility of each and every employee.
Risk and capital
management
The r isk and capital management committee, chaired by an independent non-executive director, oversees risk management . The committee has a board-approved charter in accordance with which it assists the board in reviewing the processes followed to identify and evaluate risks.
The committee also ensures that risk assessment is an ongoing process and that a formal risk assessment is undertaken at least quarterly.
Subcommittees, comprising executives and senior management , have been established to deal with specific risks facing the group in a structured manner:
Assets and liability committee (alco) • Capital adequacy, liquidity, interest rate,
market, currency and counterparty risk
Credit committee • Counterparty and credit risk
Risk management committee (risco) • Compliance, human resources, legal,
operational, regulatory, reputational, technology and business risk.
These subcommittees report to the risk and capital management committee. Refer to the corporate governance framework in the corporate governance review onpage 74.
To enhance shareholders’ and other stakeholders’ interests, all risks are mitigated to an acceptable level relative to the return generated by the activity concerned. This remains a central theme of the manner in which the business is conducted. The group operates in a structured manner with defined processes and procedures enabling risk assessment within a controlled environment. Existing controls are assessed and, if necessary, adjusted. Reports are generated regularly to monitor risk levels.
The concept of day-to-day financial risk management extends beyond the Inter-national Financial Reporting Standards (IFRS) accounting definitions of financial risks and includes the following: capi-tal adequacy, credit, currency, equity risk in the banking book, interest rate, liquid-ity and solvency risk. The group does not have material counterparty and market risk, as understood in terms of the Regulations promulgated under the Banks Act, 1990 (Act 94 of 1990), as amended (“the Banks
Act”). This is because it does not conduct financial market trading activities.
Impact of Basel III on Capitec In response to the global financial crises the Basel Committee on Banking Supervision (“Basel”) issued revised minimum global standards for banks in December 2010, revised in July 2011. Basel, through the network of central banks, instituted a programme of quantita-tive impact studies (QIS) whereby selected banks report fi gures to enable Basel to assess the impact of their policies. These QIS reports are submitted on a biannual basis. Capitec has participated fully in the QIS process. The main changes under Basel III are summarised as follows: • Tighter definitions of what constitutes
acceptable regulatory capital• New revised minimum global capital
percentages and buffers• A new maximum leverage ratio• Two new minimum liquidity standards• Enhancing capital requirements for
derivatives, repurchase and securities financing transactions
The changes must be phased in overa period beginning in 2013 and endingin 2022.
Basel III is a minimum global standard. This does not prevent the South AfricanReserve Bank (SARB) setting higher standards, as was done with the imple-men tation of Basel II.
Risk and capital management review
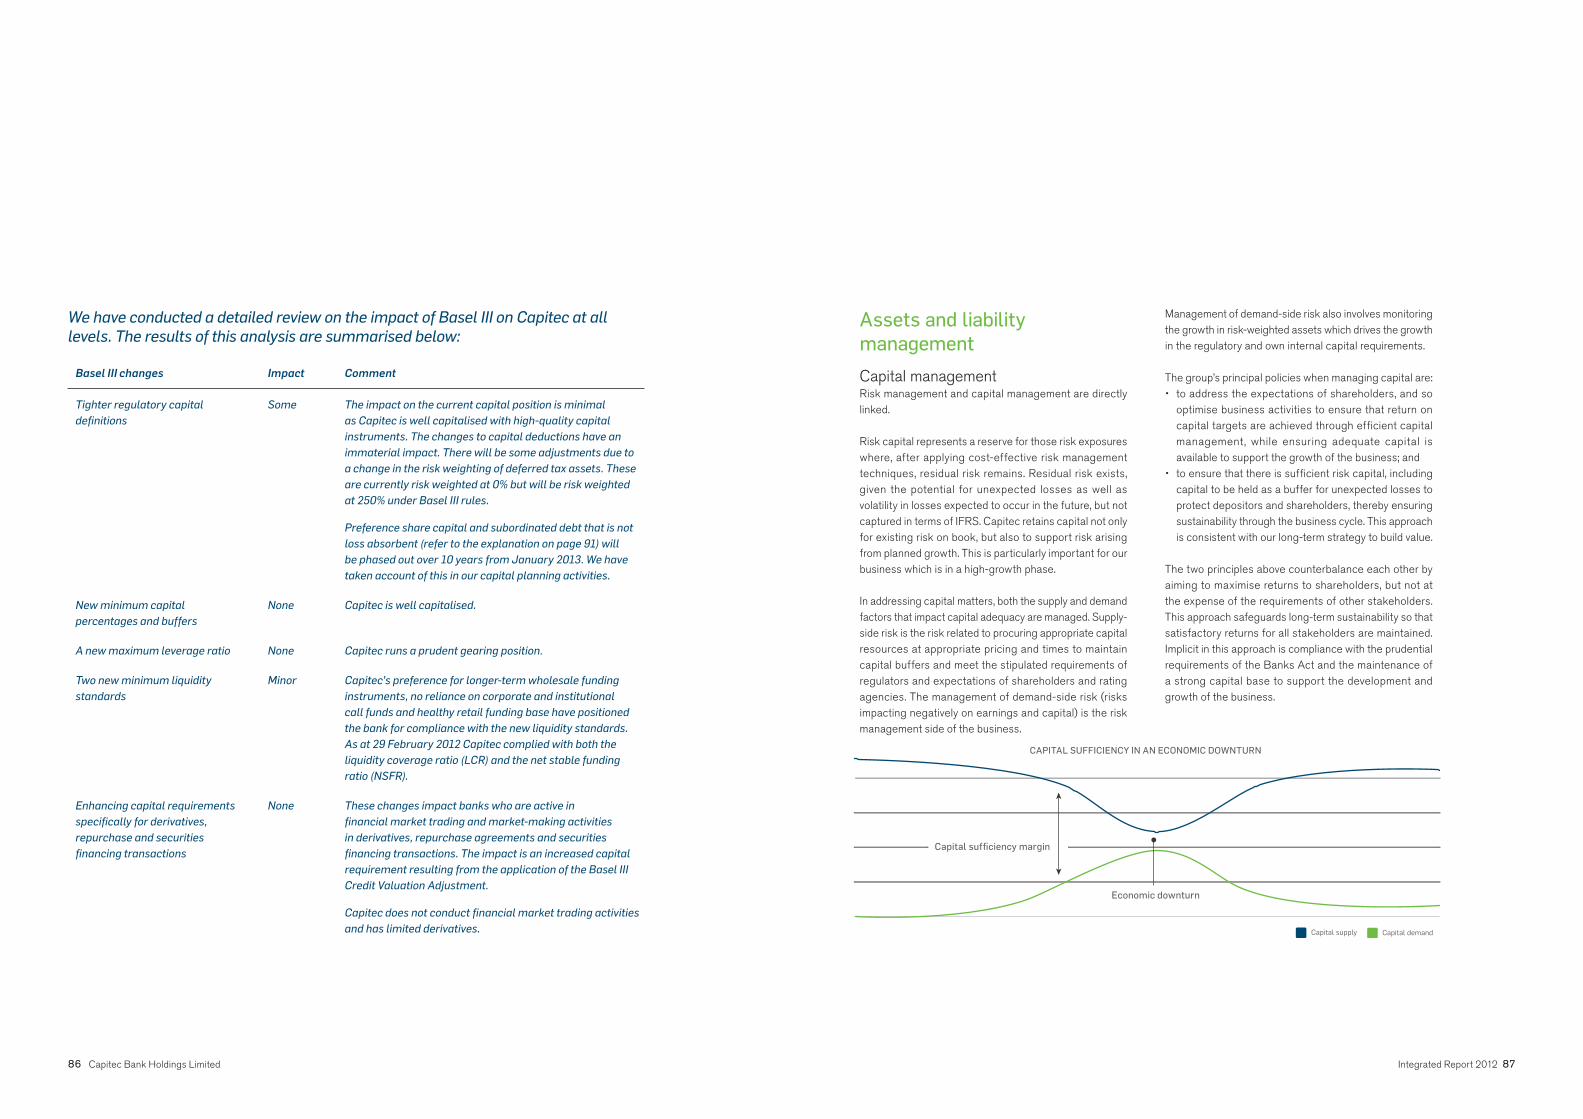
86 Capitec Bank Holdings Limited Integrated Report 2012 87
Basel III changes Impact Comment
Tighter regulatory capital
defi nitions
Some The impact on the current capital position is minimal
as Capitec is well capitalised with high-quality capital
instruments. The changes to capital deductions have an
immaterial impact. There will be some adjustments due to
a change in the risk weighting of deferred tax assets. These
are currently risk weighted at 0% but will be risk weighted
at 250% under Basel III rules.
Preference share capital and subordinated debt that is not
loss absorbent (refer to the explanation on page 91) will
be phased out over 10 years from January 2013. We have
taken account of this in our capital planning activities.
New minimum capital
percentages and buffers
None Capitec is well capitalised.
A new maximum leverage ratio None Capitec runs a prudent gearing position.
Two new minimum liquidity
standards
Minor Capitec’s preference for longer-term wholesale funding
instruments, no reliance on corporate and institutional
call funds and healthy retail funding base have positioned
the bank for compliance with the new liquidity standards.
As at 29 February 2012 Capitec complied with both the
liquidity coverage ratio (LCR) and the net stable funding
ratio (NSFR).
Enhancing capital requirements
specifi cally for derivatives,
repurchase and securities
fi nancing transactions
None These changes impact banks who are active in
fi nancial market trading and market-making activities
in derivatives, repurchase agreements and securities
fi nancing transactions. The impact is an increased capital
requirement resulting from the application of the Basel III
Credit Valuation Adjustment.
Capitec does not conduct fi nancial market trading activities
and has limited derivatives.
We have conducted a detailed review on the impact of Basel III on Capitec at all
levels. The results of this analysis are summarised below:Assets and liability
management
Capital management Risk management and capital management are directly linked.
Risk capital represents a reserve for those risk exposures where, after applying cost-effective risk management techniques, residual risk remains. Residual risk exists, given the potential for unexpected losses as well as volatility in losses expected to occur in the future, but not captured in terms of IFRS. Capitec retains capital not only for existing risk on book, but also to support risk arising from planned growth. This is particularly important for our business which is in a high-growth phase.
In addressing capital matters, both the supply and demand factors that impact capital adequacy are managed. Supply-side risk is the risk related to procuring appropriate capital resources at appropriate pricing and times to maintain capital buffers and meet the stipulated requirements of regulators and expectations of shareholders and rating agencies. The management of demand-side risk (risks impacting negatively on earnings and capital) is the risk management side of the business.
Management of demand-side risk also involves monitoring the growth in risk-weighted assets which drives the growth in the regulatory and own internal capital requirements.
The group’s principal policies when managing capital are: • to address the expectations of shareholders, and so
optimise business activities to ensure that return on capital targets are achieved through efficient capital management, while ensuring adequate capital is available to support the growth of the business; and
• to ensure that there is sufficient risk capital, including capital to be held as a buffer for unexpected losses to protect depositors and shareholders, thereby ensuring sustainability through the business cycle. This approach is consistent with our long-term strategy to build value.
The two principles above counterbalance each other by aiming to maximise returns to shareholders, but not at the expense of the requirements of other stakeholders. This approach safeguards long-term sustainability so that satisfactory returns for all stakeholders are maintained. Implicit in this approach is compliance with the prudential requirements of the Banks Act and the maintenance of a strong capital base to support the development and growth of the business.
CAPITAL SUFFICIENCY IN AN ECONOMIC DOWNTURN
Economic downturn
Capital sufficiency margin
Capital supply Capital demand
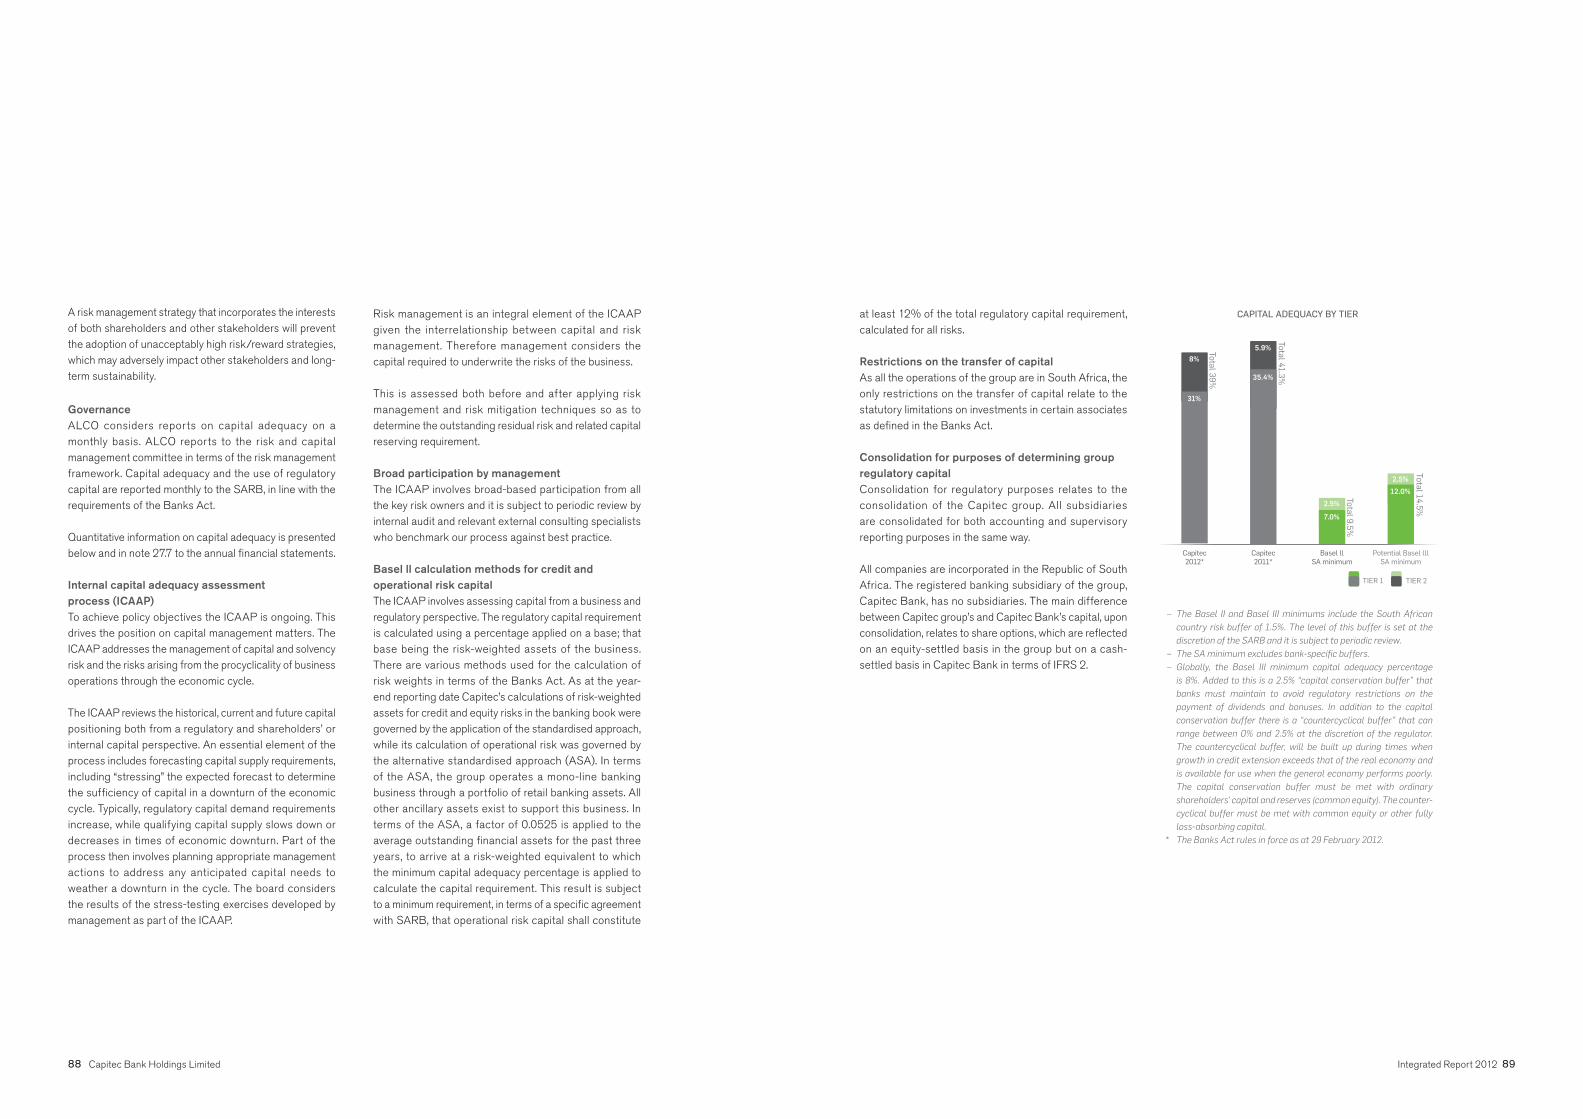
88 Capitec Bank Holdings Limited Integrated Report 2012 89
A risk management strategy that incorporates the interests of both shareholders and other stakeholders will prevent the adoption of unacceptably high risk/reward strategies, which may adversely impact other stakeholders and long-term sustainability.
Governance ALCO considers reports on capital adequacy on a monthly basis. ALCO reports to the risk and capital management committee in terms of the risk management framework. Capital adequacy and the use of regulatory capital are reported monthly to the SARB, in line with the requirements of the Banks Act.
Quantitative information on capital adequacy is presented below and in note 27.7 to the annual financial statements.
Internal capital adequacy assessmentprocess (ICAAP) To achieve policy objectives the ICAAP is ongoing. This drives the position on capital management matters. The ICAAP addresses the management of capital and solvency risk and the risks arising from the procyclicality of business operations through the economic cycle.
The ICAAP reviews the historical, current and future capital positioning both from a regulatory and shareholders’ or internal capital perspective. An essential element of the process includes forecasting capital supply requirements, including “stressing” the expected forecast to determine the sufficiency of capital in a downturn of the economic cycle. Typically, regulatory capital demand requirements increase, while qualifying capital supply slows down or decreases in times of economic downturn. Part of the process then involves planning appropriate management actions to address any anticipated capital needs to weather a downturn in the cycle. The board considers the results of the stress-testing exercises developed by management as part of the ICAAP.
Risk management is an integral element of the ICAAP given the interrelationship between capital and risk management. Therefore management considers the capital required to underwrite the risks of the business.
This is assessed both before and after applying risk management and risk mitigation techniques so as to determine the outstanding residual risk and related capital reserving requirement.
Broad participation by management The ICAAP involves broad-based participation from all the key risk owners and it is subject to periodic review by internal audit and relevant external consulting specialists who benchmark our process against best practice.
Basel ll calculation methods for credit and operational risk capital The ICAAP involves assessing capital from a business and regulatory perspective. The regulatory capital requirement is calculated using a percentage applied on a base; that base being the risk-weighted assets of the business. There are various methods used for the calculation of risk weights in terms of the Banks Act. As at the year-end reporting date Capitec’s calculations of risk-weighted assets for credit and equity risks in the banking book were governed by the application of the standardised approach, while its calculation of operational risk was governed by the alternative standardised approach (ASA). In terms of the ASA, the group operates a mono-line banking business through a portfolio of retail banking assets. All other ancillary assets exist to support this business. In terms of the ASA, a factor of 0.0525 is applied to the average outstanding financial assets for the past three years, to arrive at a risk-weighted equivalent to which the minimum capital adequacy percentage is applied to calculate the capital requirement. This result is subjectto a minimum requirement, in terms of a specific agreement with SARB, that operational risk capital shall constitute
at least 12% of the total regulatory capital requirement, calculated for all risks.
Restrictions on the transfer of capital As all the operations of the group are in South Africa, the only restrictions on the transfer of capital relate to the statutory limitations on investments in certain associates as defi ned in the Banks Act.
Consolidation for purposes of determining group regulatory capitalConsolidation for regulatory purposes relates to the consolidation of the Capitec group. All subsidiaries are consolidated for both accounting and supervisory reporting purposes in the same way.
All companies are incorporated in the Republic of South Africa. The registered banking subsidiary of the group, Capitec Bank, has no subsidiaries. The main difference between Capitec group’s and Capitec Bank’s capital, upon consolidation, relates to share options, which are refl ected on an equity-settled basis in the group but on a cash-settled basis in Capitec Bank in terms of IFRS 2.
– The Basel II and Basel III minimums include the South African
country risk buffer of 1.5%. The level of this buffer is set at the
discretion of the SARB and it is subject to periodic review.
– The SA minimum excludes bank-specifi c buffers.
– Globally, the Basel III minimum capital adequacy percentage
is 8%. Added to this is a 2.5% “capital conservation buffer” that
banks must maintain to avoid regulatory restrictions on the
payment of dividends and bonuses. In addition to the capital
conservation buffer there is a “countercyclical buffer” that can
range between 0% and 2.5% at the discretion of the regulator.
The countercyclical buffer, will be built up during times when
growth in credit extension exceeds that of the real economy and
is available for use when the general economy performs poorly.
The capital conservation buffer must be met with ordinary
shareholders’ capital and reserves (common equity). The counter-
cyclical buffer must be met with common equity or other fully
loss-absorbing capital.
* The Banks Act rules in force as at 29 February 2012.
CAPITAL ADEQUACY BY TIER
Total 14.5%
2.5%
12.0%
Potential Basel lll SA minimum
Basel llSA minimum
Capitec2011*
Capitec2012*
TIER 1 TIER 2
Total 9.5%
2.5%
7.0%
Total 41.3%
5.9%
35.4%Total 39%
8%
31%

90 Capitec Bank Holdings Limited Integrated Report 2012 91
Basel III — The leverage ratio
The leverage ratio will act as a minimum capital
floor or “back-stop” to the current Basel risk-
based capital adequacy framework. It will
constrain leveraging by banks. Mandatory public
disclosure of the ratio is expected from
January 2015.
The ratio is currently set so that the ratio of
Primary (Tier 1) capital to calculated asset
exposure, is not less than 3%. Alternatively stated,
the ratio means that exposure is limited to
33.3 x Tier 1 capital.
The calibration of the exposure amount for the
leverage ratio will be based primarily on the
financial statements. Some adjustment will be
applied to exposures reflected in terms of IFRS
to ensure that the contingent leveraging effects
of derivatives are adequately captured and other
off-balance sheet items are included in the net.
Basel is aiming for global consistency and intends
to ensure that differences in accounting methods
across jurisdictions are adjusted for.
Capitec at 5 x Tier 1 is well below the maximum
leverage of 33.3 x Tier 1.
New capital definitions
• Eligible Tier 1 and Tier 2 instruments
Basel has revised the definitions for instruments
eligible as Tier 1 and Tier 2 regulatory capital. This
means that the main form of Tier 1 capital must be
ordinary shareholders’ capital, share premium and
retained earnings (“common equity”).
• Deductions against capital
The treatment of common regulatory deductions
against the capital base has been harmonised
across jurisdictions. These deductions are now
applied against common equity whereas previously
certain deductions could be applied against other
Tier 1 and Tier 2 capital instruments. The changes
to capital deductions have an immaterial impact
on Capitec’s capital position.
• Loss absorbency
Other Tier 1 and Tier 2 instruments (capital
instruments other than ordinary shareholders’
funds) must now be “loss absorbent” not only on
liquidation but also in the event of a bank bail-
out by public state institutions (referred to by
regulators as the point of non-viability). New capital
instruments will need to make provision for this
requirement to qualify as regulatory capital. This
change impacts perpetual preference shares and
subordinated debt.
All capital that is not loss absorbent will be phased
out over a period of 10 years. This will be done by
setting an overall ceiling limit that reduces by 10%
a year, beginning 1 January 2013. The ceiling is
applied and calculated separately for Tier 1 and
Tier 2 and not at individual instrument level. The
ceiling base is the outstanding capital value of
instruments on 31 December 2012. Subordinated
debt that does not satisfy the loss absorbency
criteria will phase out at the earlier of the 10 years,
actual maturity or the optional call date (where
relevant.) We have taken account of these changes
in our capital planning activities.
• Incentives to redeem
Incentives for the issuer to redeem, including
“interest rate step-up” options are now prohibited.
Subordinated debt agreements concluded post
12 September 2010 must have complied with
this criterion to be eligible for the phasing-out
arrangements. All Capitec subordinated debt
instruments are eligible for phase out.
New minimum capital disclosures
Enhanced Pillar III disclosure requirements around
capital instruments and capital adequacy will be
effective from 1 January 2013.
New Basel minimum capital ratios and buffers
The current Banks Act has historically required banks
to maintain levels of common equity and Tier 1 capital
beyond the original Basel II minimums which means,
locally, Basel III is less of a capital challenge relative
to many banks operating outside South Africa.
As seen in the graph on page 89, Capitec is well
positioned for compliance with Basel III capital rules.
Basel III — New capital definitions, minimum capital ratios and buffers

92 Capitec Bank Holdings Limited Integrated Report 2012 93
Liquidity riskLiquidity risk is the risk that Capitec does not have suffi cient or acceptable cash and cash equivalents, or access thereto, to fund increases in assets and meet its obligations (including, importantly, repayment of depositors’ funds) as they become due, without incurring unacceptable losses. Notwithstanding a greater acceptance of Capitec by the wholesale funding market, liquidity continues to be managed cautiously and conservatively. The group operates an uncomplicated liquidity profile with a preference for long-term funding aligned with the structure of the asset book. The management of liquidity risk takes preference over the optimisation of interest rate risk.
Governance Liquidity risk is managed by ALCO. The committee comprises broad representation by executive and senior management. ALCO meets at least monthly to consider the activities of the treasury desk which operates in terms of an approved asset and liability management (ALM)
risk appetite that the board will tolerate. However, the utilisation of short-term retail deposit funding remains limited to funding net short-term cash flows and remains conservative relative to the rest of the banking industry.
• Capitec has a very low appetite for risk as regards the investment of surplus funds awaiting application in the high-yielding retail loan portfolio. During the year these funds are maintained in call accounts with highly rated South African banks, money market unit trusts operated by large asset managers, treasury bills issued by the National Treasury and SARB debentures.
• Adequate liquid assets are maintained in terms of the Banks Act to fund the liquid asset requirement and the reserve account and to maintain collateral for clearing balances on the South African Multiple Option Settlement (SAMOS) system account.
• The bank places no reliance on interbank facilities as a funding mechanism. While no reliance is placed on interbank facilities, treasury management may use available unsecured facilities from time to time. This is done as Capitec always seeks to ensure it has access to multiple funding sources. Any utilisation of interbank facilities must be reported on and monitored.
Daily cash managementDaily liquidity requirements are managed by forecasting daily funding requirements. This is achieved by forecasting liquidity commitments which can be summarised in two broad categories: those which are considered as day-to-day flows and those that relate to large singular obligations.
Daily rollovers and withdrawals by the retail market, growth in the loan book, inflows from settlements adjusted for expected default and cash-in-transit items are forecast. These are combined with the scheduled contractual cash inflows and outflows in terms of the wholesale funding programme, retail fixed deposits and periodic commitments such as dividend and tax payments. Treasury management maintains regular daily contact with the central branch management office to
– Capitec has no exposure to institutional or corporate call
accounts.
– Wholesale (listed and subordinated debt listed) comprises
domestic medium-term notes listed on the JSE Limited.
Investors in these bonds comprise: banks, insurance companies,
fund managers, and pension and provident funds.
– Wholesale (other) comprises deposits negotiated through
bilateral agreements, including those with European develop-
ment fi nance institutions (DFIs).
– Retail refers to individuals/natural persons.
– This graph shows that Capitec’s contractual mismatch as a
percentage of assets is prudent relative to the total industry
mismatch.
– The source data is as reported on the SARB BA 300 returns, which
exclude the impact of loan impairments.
policy and in line with approved limits. Capitec also has the benefit of an uncomplicated structure – a single treasury desk with a direct reporting line to the financial director in line with the general ethos of flat reporting structures. A backoffice structure is in place to control and monitor all treasury activities.
ALCO receives reports on a monthly basis of daily balances on ATMs and funds in transit with cash management service providers, teller cash, call and fixed deposits and money market funds. Other reports include a cash flow forecast, various stressed cash flow forecasts, treasury desk funding maturity ladder, asset-liability matching, deposit concentrations, progress on funding initiatives, business as usual maturity and contractual maturity reports as well as minimum liquid asset and reserve balance compliance reports. Management also prepares reports on the number of transactions and rand value volumes transacted on the various payment mechanisms that the business is party to, which assist in understanding the related day-to-day and intra-day cash flows.
Principal policies Compliance with the ALM policy results in a low-risk liquidity structure. Capitec is not exposed to the uncertainty that accompanies the use of institutional and corporate call deposits as a funding mechanism, and its asset structure, while extending in term, is still relatively short-term in nature compared to the total banking sector. The principal risk management policies governing the management of liquidity risk as defined in the ALM policy are as follows:
• Wholesale deposit funding is limited, in the main, to contractual maturities of two months or more, although in the past year we have only accepted deposits with maturities of at least six months.
• The risk and capital management committee approved a limited amendment to the rule on what retail demand deposits may fund. There was a marginal increase in the
27% 30%
22% 22%
18% 17%
12% 15%
9% 4%
6% 7%
3% 0%
2% 3%
1% 2%
DIVERSIFICATION OF FUNDING SOURCES
Demand deposits – retail
Equity – ordinary shareholders (listed)
Fixed-term deposits – retail
Fixed-term deposits – wholesale (listed)
Fixed-term deposits – wholesale
(negotiable instruments)
Fixed-term deposits – wholesale (other)
Fixed-term deposits – wholesale
(listed subordinated debt)
Fixed-term deposits – wholesale
(subordinated debt)
Equity – preference shareholders
(listed)
2012 2011
1 MONTH
-60 -6 -6 -51
26
6
-32-32-31-31-28
2 MONTHS 3 MONTHS
Capitec mismatches as % of assets – Feb 12
Total banking industry mismatches as % assets – Dec 11
CUMULATIVE CONTRACTUAL LIQUIDITY MISMATCHES
– INDUSTRY COMPARISON
6 MONTHS 1 YEAR >1 YEAR
%

94 Capitec Bank Holdings Limited Integrated Report 2012 95
manage ATM requirements. Teller cash is maintained at a minimum. The forecasting is supported by behavioural modelling conducted to determine business as usual cash flow requirements, including cash stress points in any given month. The modelling is adjusted for seasonal variations based on historical experience as adjusted for expectations around projected growth and current market dynamics.
The treasurer has regular contact with all the large wholesale depositors to understand their intentions regarding the rollover of wholesale deposits and negotiation of funding. The treasury desk maintains portfolios of highly liquid assets that can be liquidated to meet unexpected variances in forecast requirements. In line with the preference for long-term fixed-term funding, the treasury actively pursues medium and long-term funding opportunities to fund the budgeted growth in the activities of the bank.
Deposit management Management takes care in assessing the relative permanency and value distribution of various funding sources, be they wholesale or retail. For fi xed-term funding, efforts are directed towards managing rollover risk, while for demand savings deposits attention is focused on monitoring and managing the “core” or “stable” element within the retail demand savings deposit base. Statistical techniques are utilised to estimate this core having due regard for client behaviour and the resulting fluctuations in day-to-day cash flows. Internal definitions of core and fluctuating deposits are formally authorised by ALCO.
Interest rates are reviewed daily to ensure that deposit rates remain competitive and appropriate. Treasury management assesses concentration risk within
the deposit portfolio and maintains a well-diversified wholesale and retail funding base. The business has the option of funding in either the retail or wholesale markets. The retail funding base has a strong fixed deposit component.
Treasury management constantly reviews the efficient utilisation of cash resources and evaluates new liquidity initiatives to improve the liquidity profile.
Liquidity contingency planning ALCO receives a monthly stress mismatch report which simulates a stress scenario based on the asset and liability structure for the reporting month. The report also considers the available sources of stress funding to address any strain on the cash flows that may occur. In addition, a contingency funding plan (CFP) specifies qualitative and quantitative measures that must be monitored to identify early warning indications of liquidity stress. The plan provides management with a menu of possible actions to address potential liquidity threats. These actions cover necessary changes to the ALM strategy and communications with stakeholders.
Capitec holds a stock of highly liquid assets which are available in time of liquidity stress.
The CFP operates in conjunction with the ALM policy to ensure a coordinated approach to liquidity management.
Basel III – Two new liquidity standards
The liquidity coverage ratio (LCR)
The LCR is designed as a 30-day stress test. It
requires banks to hold liquid assets sufficient to
cover the envisaged net outflows. These outflows are
calibrated using prescribed Basel factors applied
to assets and liabilities in a static or run-off model.
Basel definitions are used to identify those assets
eligible for the stock of liquid assets. The LCR is more
severe for banks that are dependent on corporate and
institutional demand and short-term deposits.
The net stable funding ratio (NSFR)
The NSFR is designed to ensure a closer matching of
long-term asset cash flows with long-term funding
cash flows. It reduces the traditional role of banks
to intermediate short-term funds for use in funding
longer-term assets.
The LCR and NSFR are only due to be introduced in
2015 and 2018 respectively. Banks currently report
these ratios to the regulator on a biannual basis.
Monthly reporting is expected to start in
January 2013.
Capitec’s prudent liquidity policies – a preference
for longer-term wholesale funding, no reliance on
corporate and institutional call funds and a healthy
retail funding base – have positioned the bank so it
complies with both ratios at 29 February 2012.
– Both the contractual and behavioural mismatches benefi t
positively from the high component of equity funding. This
creates a greater surplus of asset cash fl ows over liability cash
fl ows than at banks with lower capital ratios.
– The main difference between the behavioural and contractual
mismatches relates to the treatment of retail demand deposits.
Ninety-one percent of retail demand deposits are refl ected as
stable based on a one standard deviation measure of volatility,
which is considered reasonable for business as usual conditions.
– The contractual mismatch is reported on a discounted
basis whereas the behavioural mismatch is reported on an
undiscounted basis.
5 833
42%
21%
-2%
16%
20%
CONTRACTUAL AND BEHAVIOURAL LIQUIDITY MISMATCHES R’m
33%
4 705
9 653
12 387
4 841
-7% -7%
BehaviouralContractual
% Discounted assets % Undiscounted assets
Demand to
1 month
Demand to
3 months
Demand to 1 year
Demand to
> 1 year
-1 601
-1 616
-537

2012 2011
80% 79%
8% 9%
7% 2%
SOVEREIGN
4%
1% 5%
5%
BANKS
RETAIL PERSONAL LOANS – IMPAIRED
CORPORATE
RETAIL PERSONAL LOANS – PERFORMING
CREDIT EXPOSURE BY TYPE (NET OF RISK MITIGATION)
96 Capitec Bank Holdings Limited Integrated Report 2012 97
Interest rate riskInterest rate risk is the risk that the value of the balance sheet and earnings are adversely affected by external events that impact market-driven interest rates.
Governance ALCO meets formally at least monthly to, inter alia, consider the sensitivity to interest rate movements and to review the results of management’s analysis of the impact of interest rate movements, including the results of model outputs. ALCO also receives information on yield curve developments, money market interest rates, an economic evaluation with analysis of the likely impact on interest rates and interest matching and rate repricing analysis.
In general the principal policy governing the management of interest rate risk is that management should avoid taking speculative or trading positions on the banking book. ALCO aims to match the fixed or floating rate nature of funding with the fixed and floating rate elements of the loan book and surplus cash positions. To achieve this, significant long-term liabilities with floating or adjustable interest rates may be swapped to fi xed rates.
The bank has a high level of equity relative to liabilities leading to a natural interest rate mismatch between
assets and liabilities. This gives ALCO some fl exibility, where it has a fi rm view on rates, to sustain a mismatch. Policy requires prioritisation of the management of the value of equity over annual earnings in order to ensure sustainability and ensure an appropriate focus in creating value over the longer term. Therefore ALCO considers the impact of interest rate decisions over the longer term and not only on annual earnings.
Although loan rates are fixed, the regulations to the National Credit Act (NCA) can have an impact on the pricing of loans. A reduction of 1% in the SARB repo rate reduces the NCA ceiling by 2.2%.
Equity risk in the banking book Capitec does not deal or maintain a proprietary position in equity investments. During the financial year ended 29 February 2012, the group did not invest in any listed equities.
At the end of the 2012 fi nancial year there were no equity investments as the investments in Visa and MasterCard were sold. All realised gains and losses were included in the income statement.
Currency risk Currency risk is the risk that the value of assets and liabilities denominated in foreign currency are adversely affected by changes in the exchange rate between the rand and those currencies, with a consequent impact on the income statement and shareholders’ equity. All the operations are within South Africa. Capital equipment and technological support services that are imported result in limited exposure to currency fluctuations; however, these transactions are hedged.
HedgingThe authorised use of derivative instruments is restricted to their use in risk mitigation applications.
Interest rate swaps are used to convert floating rate funding to fixed (and vice versa) to achieve ALCO objectives of matching floating/fixed-rate assets to fl oating/fi xed-rate funding. Further information on interest rate hedging strategy is discussed under interest rate risk and in note 27.3 and note 41 to the annual financial statements. The group uses forward foreign exchange contracts (FECs) to cover obligations relating to capital equipment, technology and technology support services needed for the core banking activities. FECs are purchased to exactly match the total value of the underlying foreign currency commitment. With the exception of FECs, use of derivatives must first be approved by ALCO prior to transacting.
Stress testing The group has a programme of stress testing that assists management and the board in understanding the resilience of the business model. Stress testing is conducted for credit, liquidity, interest rate, capital adequacy and business risk. Stress testing is also an integral part of any key changes to credit acceptance rules and loan pricing with the credit management and costing departments.
REGULATORY SENSITIVITY ANALYSIS
2012 2011
R’000 % R’000 %
Sensitivity of equity200 basis points shift
Increase (126 619) (2.1) (70 455) (1.8)
Decrease 116 378 2.0 95 192 2.4
The above equity sensitivity is calculated by modelling the impact on equity of parallel interest shifts of 200 basis points in the yield curve, both
up and down, on the statement of fi nancial position. The analysis is performed on a discounted, run-off basis in line with the requirements of the
Banks Act.
One of the main criticisms levelled at risk management departments at fi nancial institutions before and during the global crises was that risk management processes were irrelevant and too far removed from the essential operations of the business. Therefore a key feature of the stress testing policy is to ensure that it is intuitive and relevant; this includes appropriate involvement of senior management and board structures. To this end the risk management function is mandated with ensuring that stress testing is embedded within the operational processes.

98 Capitec Bank Holdings Limited Integrated Report 2012 99
ANALYSIS OF REGULATORY CREDIT EXPOSURE
Average gross
exposure(1)
Aggregate gross
year-end exposure(2) (4)
Exposure post risk
mitigation(2) (3) (4)
Risk
weights(5)
GROUP 2012 2011 2012 2011 2012 2011
Basel II exposure categories R’000 R’000 R’000 R’000 R’000 R’000 %
On-balance sheet
Corporate (6) 275 728 135 251 243 078 616 875 243 078 616 875 100
Sovereign (7) 1 559 247 1 573 073 1 646 386 1 210 609 1 646 386 1 210 609 0
Banks (claims < 3 months original maturity) (8) 1 273 358 904 503 2 162 873 670 635 1 601 743 208 065 20
Banks (claims > 3 months original maturity) 4 229 – 2 554 – 2 554 – 50
Retail personal loans
– performing 16 108 461 8 783 166 17 438 315 10 253 849 17 438 315 10 253 849 75
– impaired (9) 723 723 461 227 931 742 625 831 931 742 625 831 100
19 944 746 11 857 220 22 424 948 13 377 799 21 863 818 12 915 229
Off-balance sheet
Retail personal loans
– conditionally revocable commitments (10) 618 631 520 667 603 816 549 200 603 816 549 200 0
Total exposure 20 563 377 12 377 887 23 028 764 13 926 999 22 467 634 13 464 429
As required by the Banks Act and regulations (which incorporate Basel II):(1) Average gross exposure is calculated using daily balances for the last six months.(2) Items represent exposure before the deduction of qualifying impairments on advances.(3) Represents exposure after taking into account qualifying collateral. Amounts are shown gross of impairments, which are deducted to calculate risk-weighted assets.(4) ‘Corporate’ and ‘Bank’ exposures were calculated based on an average using daily balances for month twelve of the respective year-ends. All other items are the
balances at year-end.(5) The risk weightings refl ected are the standard risk weightings applied to exposures as required by the Banks Act. Risk weights for exposures (other than retail) are
determined by mapping the exposure’s Fitch International grade rating to a risk-weight percentage using the mapping table below. The risk weightings for retail
exposures are specifi ed directly in the banking regulations.(6) 84% (2011: 96%) of corporate aggregate gross year-end exposure relates to investments in money market unit trusts.(7) Sovereign comprises investments in RSA National Treasury bills and SARB debentures. These exposures are zero risk weighted.(8) Qualifying collateral in the form of highly liquid securities, arising from resale transactions, is deducted to arrive at post risk mitigation values. All resale agreements
are in respect of RSA National Treasury bills and are transacted via STRATE.(9) An ageing of impaired advances is shown in note 6 to the annual fi nancial statements.10) These commitments are a result of undrawn loan amounts. The loans are approved with a contractual repayment period of one month or less. The bank’s contractual
commitment is revocable should a client not meet their contractual obligations or where the bank has determined that the client’s credit risk profi le has changed. 18%
is expected to be drawn down within one month. As these commitments are revocable, there is no capital charge in terms of the standardised approach for credit risk.
For ease of comparison we have presented the corresponding values at 28 February 2011. These commitments are now disclosed on the Banks Act Return 900, line
293 – other contingent liabilities.
RATING GRADES AND RELATED RISK WEIGHTS
Long-term credit assessment AAA to AA- % A+ to A- % BBB+ to BBB- % BB+ to B- % Below B- % Unrated %Sovereigns 0 20 50 100 150 100Public sector entities 20 50 50 100 150 50Banks 20 50 50 100 150 50Security fi rms 20 50 50 100 150 50Banks: short-term claims 20 20 20 50 150 20Security fi rms: short-term claims 20 20 20 50 150 20Long-term credit assessment AAA to AA- A+ to A- BBB+ to BB- Below BB-Corporate entities 20 50 100 150 100Short-term credit assessment A-1/P-1 A-2/P-2 A-3/P-3 OtherBanks and corporate entities 20 50 100 150
The above table of risk weights is applied in terms of the standardised approach to credit risk for portfolios other than retail. Ratings are not applied to retail exposures.
A standard risk weight of 75% is applied to performing retail exposures while impaired exposures attract a standard 100% risk weight, net of allowed impairments.
Credit risk
management
GovernanceCredit committeeCredit risk management is overseen by the credit committee, a subcommittee of the risk and capital management committee. The composition of the credit committee includes a cross-section of management:• Chief executive offi cer• Financial director• Executive: risk management (chairman)• Chief credit offi cer• Executive: operations• Executive: card services and business
development• Credit managers:
– Head: credit monitoring and operations
– Manager: credit decision support– Manager: Capitec collection services– Manager: credit development
The credit committee meets monthly to evaluate the activities of the credit division and operations, new business results, arrears, provisioning and regulatory compliance. This committee determines credit policy. Representation at the weekly executive credit meetings is broad-based as it includes the credit committee members and key senior f inancial management members.
Credit policiesPolicy changes are recommended to the credit committee meeting as and when required. The credit committee reviews the various policies at least annually.
Institutional credit risk management Capitec has a very limited risk appetite as regards the investment of surplus cash. Therefore surplus cash is invested in short-dated instruments with high market liquidity such as National Treasury bills (TB), SARB debentures, cash on call with highly rated banks and short-term TB resale transactions. From time to time, and particularly when the bank has large volumes of surplus cash, Capitec will also invest in the money market unit trusts of large fund managers in order to achieve a level of risk diversifi cation, subject to
sufficient yield commensurate with the additional risk of investing in an instrument with no capital guarantee.
Credit risk related to the investment of surplus cash resources with banks and money market funds is managed by ALCO. ALCO proposes a list of counterparties and related limits which are approved and monitored by the credit committee.A separate large exposures committee exists to evaluate and approve exposures to other banks and money market funds in terms of the limits specified in the Banks Act.
Em
plo
yer p
ress
re
lea
ses O
pe
rati
on
al
inte
llig
en
ce
Regional credit monitoringHandover analysis
Debt review
learnings
Dece
ase
d a
nd
retre
nch
men
t an
alysisC
red
it a
sse
ssm
en
t o
f exc
ep
tio
n r
efe
rra
ls
Und
er a
dmin
ana
lysi
s
Arr
ears
inve
stig
atio
ns
Arr
ears
tren
d di
vide
rs
Credit e
vents log
Executive branch visits
and scoring
Statistical validations
Econom
ic reviews
Employer analysis
Profitability analysis
Debt exposure
profilin
g
BehaviourAffordabilitySource - Who
- When- How
Pub
lic in
formation Operational intelligen
ce M
onitoring intelligence
Data
inte
llig
en
ce
Board of directors W
eekly
ex
ec
utiv
e c
red
it me
etin
g
Credit committee Operational r
isk com
mit
tee
R
isk
an
d c
ap
ita
l m
an
ag
em
ent com
mittee
CREDIT RISK MANAGEMENT GOVERNANCE
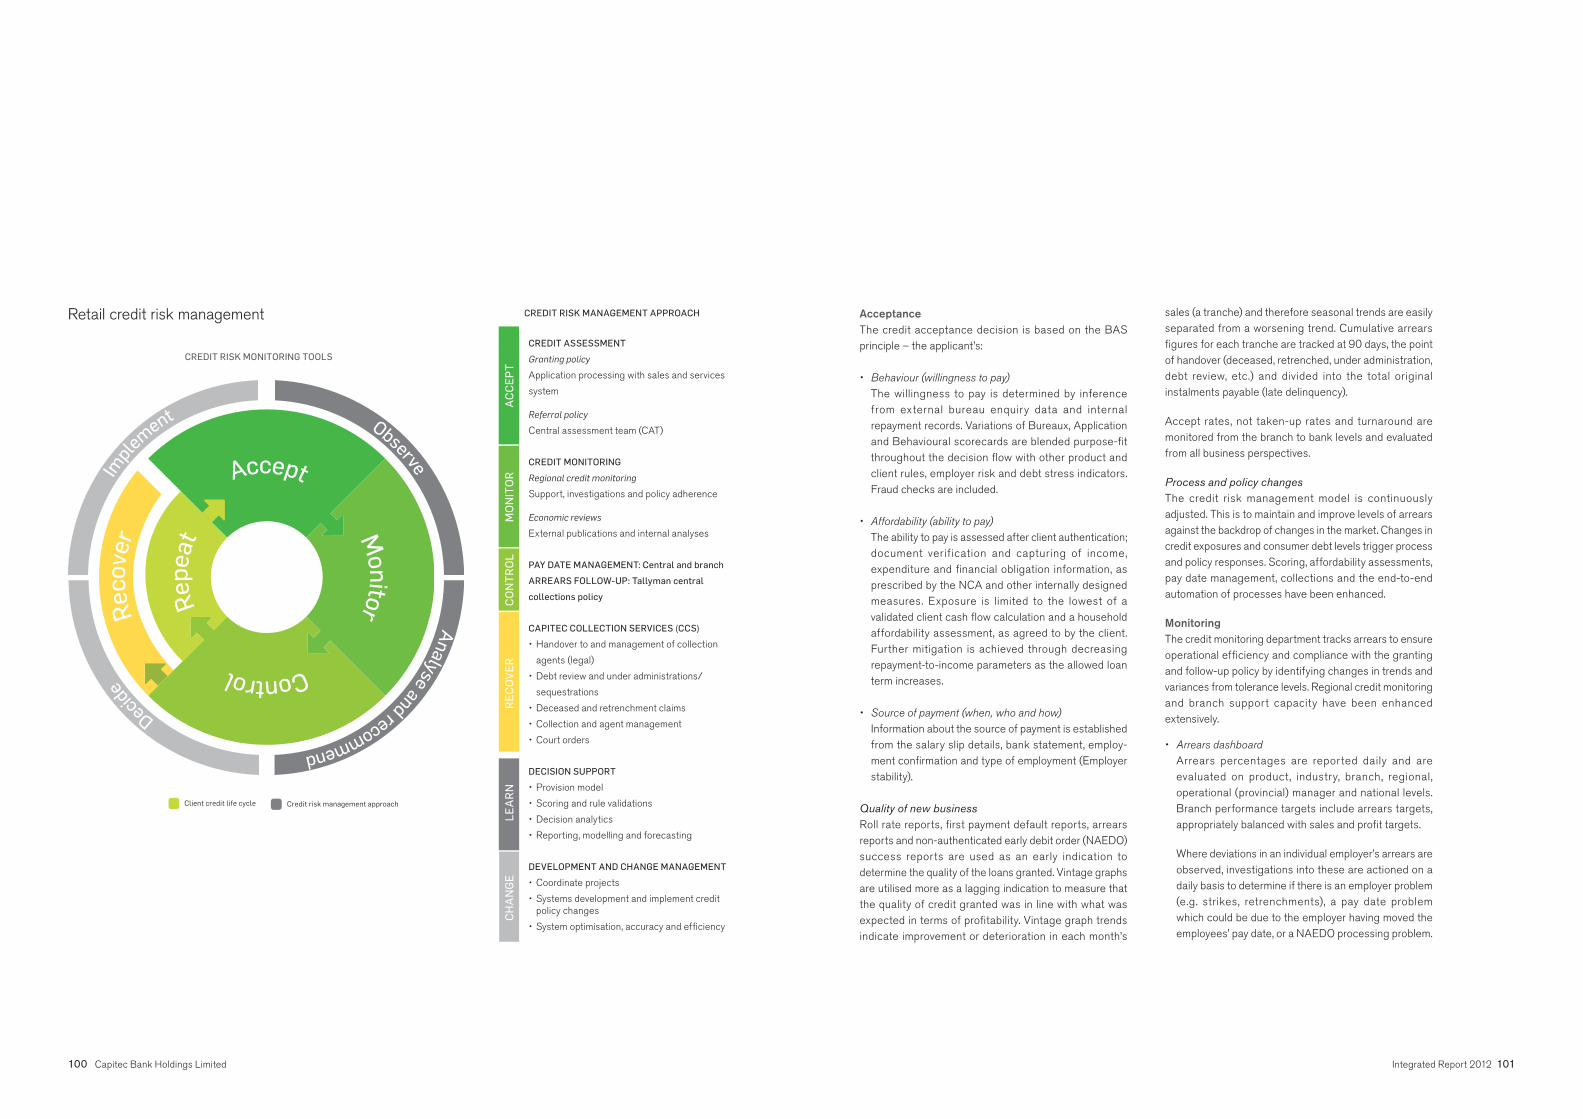
100 Capitec Bank Holdings Limited Integrated Report 2012 101
Acceptance The credit acceptance decision is based on the BAS principle – the applicant’s:
• Behaviour (willingness to pay)
The willingness to pay is determined by inference from external bureau enquiry data and internal repayment records. Variations of Bureaux, Application and Behavioural scorecards are blended purpose-fi t throughout the decision fl ow with other product and client rules, employer risk and debt stress indicators. Fraud checks are included.
• Affordability (ability to pay)
The ability to pay is assessed after client authentication; document verification and capturing of income, expenditure and fi nancial obligation information, as prescribed by the NCA and other internally designed measures. Exposure is limited to the lowest of a validated client cash fl ow calculation and a household affordability assessment, as agreed to by the client. Further mitigation is achieved through decreasing repayment-to-income parameters as the allowed loan term increases.
• Source of payment (when, who and how)
Information about the source of payment is established from the salary slip details, bank statement, employ-ment confi rmation and type of employment (Employer stability).
Quality of new businessRoll rate reports, fi rst payment default reports, arrears reports and non-authenticated early debit order (NAEDO) success reports are used as an early indication to determine the quality of the loans granted. Vintage graphs are utilised more as a lagging indication to measure that the quality of credit granted was in line with what was expected in terms of profi tability. Vintage graph trends indicate improvement or deterioration in each month’s
sales (a tranche) and therefore seasonal trends are easily separated from a worsening trend. Cumulative arrears fi gures for each tranche are tracked at 90 days, the point of handover (deceased, retrenched, under administration, debt review, etc.) and divided into the total original instalments payable (late delinquency).
Accept rates, not taken-up rates and turnaround are monitored from the branch to bank levels and evaluated from all business perspectives.
Process and policy changesThe credit risk management model is continuously adjusted. This is to maintain and improve levels of arrears against the backdrop of changes in the market. Changes in credit exposures and consumer debt levels trigger process and policy responses. Scoring, affordability assessments, pay date management, collections and the end-to-end automation of processes have been enhanced.
Monitoring The credit monitoring department tracks arrears to ensure operational effi ciency and compliance with the granting and follow-up policy by identifying changes in trends and variances from tolerance levels. Regional credit monitoring and branch support capacity have been enhanced extensively.
• Arrears dashboard
Arrears percentages are reported daily and are evaluated on product, industry, branch, regional, operational (provincial) manager and national levels. Branch performance targets include arrears targets, appropriately balanced with sales and profi t targets.
Where deviations in an individual employer’s arrears are observed, investigations into these are actioned on a daily basis to determine if there is an employer problem (e.g. strikes, retrenchments), a pay date problem which could be due to the employer having moved the employees’ pay date, or a NAEDO processing problem.
CREDIT ASSESSMENT
Granting policy
Application processing with sales and services
system
Referral policy
Central assessment team (CAT)
CREDIT MONITORING
Regional credit monitoring
Support, investigations and policy adherence
Economic reviews
External publications and internal analyses
PAY DATE MANAGEMENT: Central and branch
ARREARS FOLLOW-UP: Tallyman central
collections policy
CAPITEC COLLECTION SERVICES (CCS)
• Handover to and management of collection
agents (legal)
• Debt review and under administrations/
sequestrations
• Deceased and retrenchment claims
• Collection and agent management
• Court orders
DECISION SUPPORT
• Provision model
• Scoring and rule validations
• Decision analytics
• Reporting, modelling and forecasting
DEVELOPMENT AND CHANGE MANAGEMENT
• Coordinate projects
• Systems development and implement credit policy changes
• System optimisation, accuracy and effi ciency
Control
Re
pe
at
Re
co
ver M
on
itor
An
alyse and recommend
Observe
Impl
ement
Deci
de
Accept
Client credit life cycle Credit risk management approach
CREDIT RISK MANAGEMENT APPROACH
CREDIT RISK MONITORING TOOLS
Retail credit risk management
AC
CE
PT
MO
NIT
OR
CO
NT
RO
LR
EC
OV
ER
CH
AN
GE
LE
AR
N

102 Capitec Bank Holdings Limited Integrated Report 2012 103
• Roll rate analysis
Arrears trends are monitored using observed roll rates, derived from payment profi les, generated by the loans system (the same payment profi les are submitted to the National Loans Register). These payment profi les form the basis of the loan impairment models and the unexpected loss calculations. Variations of the roll rate tables are utilised to understand the level of rehabilitation on accounts in arrears and to derive new credit-granting rules and collection strategies.
• Credit events log
All identifi ed credit events are registered on a central credit events log and communicated to branches and operations management. System fl ags drive appropriate mitigating action.
• Root cause analysis
Root cause analysis and continuous learning are performed by the regional credit monitoring team. All branches are reviewed every month but branches with high arrears are covered more extensively.
Control• Collection method
Capitec mainly utilises the regulated NAEDO system to collect instalments on the pay dates of clients who do not deposit their salaries with the bank. Collections are mandated by clients in terms of their loan contracts; collections are made from their external bank account or clients can deposit their salary with Capitec Bank and collections are then made from their Capitec Bank account under the same rules as external NAEDO debits.
• Daily collection processes
We proactively re-evaluate the pay dates of employers.
• Arrears follow-up
Arrears follow-up is mostly performed centrally from our internal call centre, run on a best-of-breed collection system and predictive dialler.
RecoveryLegal collections are outsourced to various external debt collectors/attorneys, who are responsible for tracing and instituting legal action. These collectors are contractually managed in terms of mandates and their performance is reviewed monthly. Collectors, the handed-over-accounts database and recoveries are managed by the Capitec collection services (CCS) department. The specialised services area within CCS has the legal skills, with the support of the legal department in the risk management division, to manage debt review applications, deceased estates, retrenchment and deceased cover claims, court orders and under-administration/sequestration cases.
Operational risk management
Operational risk is defi ned as the risk of loss resulting from inadequate or failed internal processes, people and systems or from external events. This defi nition includes legal risk but excludes strategic and reputational risk. Legal risk includes, but is not limited to, exposure to fi nes, penalties or punitive damages resulting from legal actions, as well as private settlements.
GovernanceTo minimise exposure to operational risk that arises as a consequence of the group’s fi nancial risk-taking (credit and market) and operating activities, an operational risk management framework has been implemented in the group. Operational risk governance and management form part of the corporate governance control framework (refer to page 74). The risk committee (risco) has been established to oversee the risk profi le of the group. The role of risco is to direct, govern and coordinate all risk management processes in accordance with an approved policy that sets out the expectations and responsibilities relating to risk management. All divisional heads are members of risco. The heads of the compliance, forensic, internal audit, IT risk and operational risk management units provide independent monitoring and assist business with specialist advice, policies and standards relating to:• business continuity planning and disaster recovery;• forensic services;• information security;• legal risk management;• regulatory risk services• safety and security services; and• an insurance programme.
Operational risk trends are monitored and reported to risco and, where appropriate, to the board risk and capital management committee.
The group considers fi nancial crime to be a major oper-ational risk that leads to losses. For this reason a policy has been implemented to mitigate the risk through the following measures:• a zero-tolerance policy in respect of staff dishonesty,• cooperation with government and industry role players
to ensure the successful apprehension and conviction of the perpetrators of fi nancial crime,
• effective and comprehensive investigation and recovery of losses, and
• proactive identifi cation and prevention of criminal acts against Capitec Bank.
The management of operational risk is inherent in the day-to-day execution of duties by management and is a central element of the management process. A dedicated operational risk manager is responsible for the application of group policies, providing guidance in terms of best practice and for ensuring consistent implementation and reporting of material exposures or trends to the board and regulatory authorities. Line management accepts accountability for the identification, management, measurement and reporting of operational risk.
Operational risk measurement, processes and reporting systemsThe three primary operational risk management processes are risk assessment, loss data collection and the tracking of risk indicators. The results of these processes are utilised to raise awareness of operational risk management and to enhance the internal control environment with the ultimate aim of reducing losses.
Additional related processes include the continuous consideration of the business environment and consistent review of internal control factors, as well as the analysis of operational risk causes. Management is responsible for developing and maintaining control environments to mitigate operational risks inherent in the business. Specifi c mitigating actions are reported to risco. Risk assessments are designed to be forward-looking. In other words, management identifi es risks that could threaten the achievability of business objectives, together with the required set of controls and actions to mitigate the risks. Loss data collection and key risk indicator tracking are backward-looking and enable the monitoring of trends.
104 Capitec Bank Holdings Limited Integrated Report 2012 105
Insurance programmeA comprehensive insurance programme is maintained to cover losses from fraud, theft, professional liability claims, damage to physical assets and the cost of business interruption. The opportunity cost of lost revenue is not covered.
Business continuity planning A continuity management team is responsible for all aspects of business continuity. The business continuity framework and methodology is based on British Stand-ard 25999 and has been approved by the board. The business continuity and disaster recovery plan documents procedures to be followed should an extreme event occur. The disaster recovery and evacuation plans have been tested successfully during the year as part of a scheduled programme.
Fraud preventionA zero-tolerance approach is followed with respect to fraud, theft and dishonesty. Information regarding any irregularities received from employees, management or the independent fraud hotline, Tip-Offs Anonymous, is investigated by our forensic services department. Fraud awareness campaigns, which include e-newsletters, posters and presentations to all employees, are continuously presented. Various channels are available to employees and clients alike for disclosing any dishonesty in the workplace, including:• Toll-free number• Client Care Centre• Website
Occupational health and safetyRates of injury, occupational diseases, lost days and absenteeism due to occupational injuries and number of work-related fatalities per region are insignificant as the working environment is mostly office based.At the Stellenbosch and Bellville campuses, where 1 167 employees are aggregated, health and safety
coordinators arrange the appointment and training of safety, health and environment (SHE) representatives, fi rst aiders, fi re wardens and fi re fi ghters as prescribed by the Occupational Health and Safety Act and in accordance with the Capitec health and safety policies and procedures documents. The branch infrastructure was designed to provide for a low-cash environment. The intention is, inter alia, to safeguard employees and clients in all branches. Cash deposited by clients is held in drop safes. Employees do not have access to the keys of either ATMs or drop safes; the keys are kept off site. Cash is not paid out over the counter but is electronically deposited into the account of the client who then withdraws the required amount at an ATM or other transaction point. Exposure to hazardous material and machinery is limited.
Reputational riskReputational risk is the risk that an activity, action or stance taken by the Capitec group or its offi cials will impair its image in the community and the long-term trust placed in the organisation by its stakeholders; this may result in the loss of business and/or threaten legal action. Capitec views reputational risk as a function of the management of all other risks as well as its communication strategy in the marketplace. If the other risks are well managed and this is adequately communicated to the market, reputational risk is managed appropriately. In terms of the management approach, reputational risk is dealt with by RISCO. Reputational risk is managed on an ongoing basis through compliance with disclosure and communication policies.
Disclosure of information is made in the annual fi nancial statements, via public statements by authorised spokes-persons and through periodic disclosure of information on the website (www.capitecbank.co.za) in terms of the Banks Act requirements.
Policies and proceduresThe group has a dedicated policies and procedures department (“Polproc”). Polproc is responsible for the administration of policies and procedures in terms of the group policy framework. This framework sets minimum standards for policies. These standards govern the creation and maintenance of policies in terms of a policy life cycle and require that policies conform to the four Capitec pillars, which are simplicity, affordability, accessibility and service. Policy developers are required to promote awareness of policies to enable compliance. This may involve training or other interventions for users. Polproc assists policy developers in these. Policy developers and line managers are responsible for assessing compliance with policy. Internal audit monitors compliance with key policies in terms of their annual risk-based audit plans.
Business risk managementBusiness risk is the impact that fl uctuations in earnings, driven by volume and pricing variances against historical and budgeted benchmarks, have on the group. Both positive and negative variances impact the business in various ways and must be managed. Business risk is impacted most signifi cantly by strategic direction and delivery on planned actions to achieve strategic objectives.
StrategyThe board considers strategic direction as part of the annual budgeting and planning processes, when the budget is tabled for approval. The budget is a result of a comprehensive budgeting exercise involving all key decision-makers. A challenge process is used to assess the robustness and substance behind the budget and it is subject to audit by the internal audit department. Daily, weekly and monthly reporting processes are in place to enable effective monitoring. The budget is a critical tool for monitoring progress in terms of strategic objectives. If necessary, adjustments are authorised and made to accommodate significant changes in circumstances and or strategy. Processes and incentives are in place to ensure a focused approach to achieving targets. Variances against budget receive signifi cant attention to understand the underlying drivers.
Statement of responsibility by the board of directors page 108
Certificate by the company secretary page 108
Audit committee report page 109Independent auditor’s report page 110
Directors’ report page 111
Balance sheets page 117
Income statements page 118
Statements of comprehensive income page 119
Statements of changes in equity page 120
Statements of cash flows page 122
Notes to the annual financial statements page 123
transparency
Integrated Report 2012 107
14Annualfi nancialstatements
The preparation of the audited consolidated annual fi nancial statements
was supervised by the fi nancial director, André du Plessis, CA(SA)

108 Capitec Bank Holdings Limited Integrated Report 2012 109
The directors are responsible for the preparation, integrity and fair presentation of the fi nancial statements of Capitec Bank Holdings Limited. The fi nancial statements presented on pages 111 to 178 have been prepared in accordance with International Financial Reporting Standards (IFRS), and include amounts based on judgements and estimates made by management.
The directors consider that in preparing the financial statements they have used the most appropriate accounting policies, consistently applied and supported by reasonable and prudent judgements and estimates and that all statements of IFRS that they consider to be applicable have been followed. The directors are satisfied that the information contained in the fi nancial statements fairly presents the results of operations for the year and the financial position of the group and company at year-end. The directors also prepared the other information included in the annual report and are responsible for both its accuracy and consistency with the fi nancial statements. The directors have the responsibility of ensuring that accounting records are kept. The accounting records should disclose, with reasonable accuracy, the financial position of the companies to enable the directors to ensure that the fi nancial statements comply with relevant legislation.
Capitec Bank Holdings Limited operated in a well-established control environment, which is documented and regularly reviewed. This incorporates risk management and internal
control procedures, which are designed to provide reasonable, but not absolute, assurance that assets are safeguarded and that the risks facing the business are being controlled.
The going concern basis has been adopted in preparing the fi nancial statements. The directors have no reason to believe that the group or any company in the group will not be a going concern in the foreseeable future, based on forecasts and available cash resources. These fi nancial statements support the viability of the group.
The group adhered to the Code of Corporate Practices and Conduct.
The group’s external auditors, Pricewater-houseCoopers Incorporated, audited the fi nancial statements and their report is pre-sented on page 110.
The fi nancial statements were approved by the board of directors on 27 March 2012, and are signed on its behalf by:
Michiel le Roux Chairman
Riaan StassenChief executive offi cer
Statement ofresponsibilityby the boardof directors
Capitec Bank HoldingsLimited and its subsidiaries(the “group”)
Auditcommittee report
Capitec Bank HoldingsLimited and its subsidiaries(the “group”)
The Capitec Bank Holdings group audit committee (“the committee”) is an independent statutory committee appointed by the board of directors in terms of section 64 of the Banks Act (Act 94 of 1990). The committee’s responsibilities include its statutory duties in terms of the Companies Act (Act 71 of 2008) (“the Act”), as well as responsibilities assigned to it by the board of directors of the group.
The committee’s terms of reference are determined by a board-approved charter. The committee has conducted its affairs in compliance with, and has discharged its responsibilities in terms of, the charter for the year ended 29 February 2012.
The committee comprises three indepen-dent non-executive directors. The commit-tee met three times during the year and there was 100% attendance by mem-bers at the meetings. The functions of the committee are detailed in the corporate governance review.
The committee performed the following statutory duties during the period under review:
• Satisfi ed itself that the external auditor is independent of the group, as set out in section 94(8) of the Act.
• Ensured that the appointment of the auditor complied with the Act, and any other legislation relating to the appointment of auditors.
• In consultation with executive manage-ment, agreed to the engagement letter, terms, audit plan and budgeted fees for the 2012 fi nancial year.
• Approved the terms of the master agreement for the provision of non-audit services by the external auditor, and approved the nature and extent of non-audit services that the external auditor may provide.
• Nominated for election at the annual general meeting, Pricewaterhouse-Coopers Inc. as the external audit fi rm. Mr DG Malan is the designated auditor responsible for performing the functions of the audit.
• Satisfied itself, based on the infor-mation and explanations supplied by management and discussions with the independent external auditor and inter-nal auditors, that the system of internal fi nancial controls is effective and forms a basis for the preparation of reliable fi nancial statements.
• Reviewed the accounting policies and the group fi nancial statements for the year ended 29 February 2012 and, based on the information provided to the committee, considers that the group complies, in all material respects, with the requirements of the Act, the JSE Listings Requirements, the King III Code and IFRS.
• Undertook the prescribed functions (in terms of section 94(7) of the Act on behalf of the subsidiary companies of the group.
The committee performed the following duties assigned by the board during the period under review:• Considered the sustainability information
as disclosed in the integrated report,
which is the result of a combined assurance model, and satisfi ed itself that the information is reliable and consistent with the fi nancial results. The committee approved the integrated report.
• Ensured that the company’s internal audit function is independent and had the necessary resources and authority to enable it to discharge its duties. The committee recommended the internal audit charter for approval by the board and approved the annual audit plan.
• During the year, the committee met with the external auditors and with the head of the internal audit function without management being present.
• The committee satisfi ed itself that the group fi nancial director has appropriate expertise and experience as required by the JSE Listings Requirement 3.84(h).
Pieter van der MerweChairman27 March 2012
Certifi cate by the company secretary
I hereby certify, in terms of section 88(2)(e) of the Companies Act (Act 71 of 2008) (the ‘Act'), that to the best of my knowledge, for the year ended 29 February 2012, the company has lodged with the Companies Commissioner all such returns and notices as required in terms of the Act and that all such returns and notices are true, correct and up to date.
Christian van SchalkwykStellenbosch27 March 2012

110 Capitec Bank Holdings Limited Integrated Report 2012 111
The directors present their annual report, which forms part of the audited fi nancial statements of the company, for the year ended 29 February 2012.
1. Nature of businessThe company’s main business is that of a bank controlling company as envisaged in the Banks Act, 1990. The company’s subsidiaries conduct retail banking and the wholesale distribution of consumer goods.
2. Review of operations
The operating results and the state of affairs of the company and the group are fully set out in the attached balance sheets, income statements, statements of comprehensive income, statements of changes in equity, statements of cash fl ows and the notes thereto.
The group’s earnings attributable to shareholders amounted to R1 094.3 million (2011: R656.0 million).
3. Financial results and dividendsThe fi nancial results of the company and the group are set out in the attached fi nancial statements.
Dividends The company declared the following dividends for the current and previous fi nancial years:
Independent auditor’sreport
To the shareholders of Capitec Bank Holdings Limited
We have audited the consolidated annual financial statements and annual fi nancial statements of Capitec Bank Holdings Limited, which comprise the consolidated and separate balance sheets as at 29 February 2012, and the consolidated and separate income statements, statements of comprehensive income, changes in equity and cash fl ows for the year then ended, and a summary of signifi cant accounting policies and other explanatory notes, and the directors’ report, as set out on pages 111 to 178.
Directors’ responsibility for the fi nancial statements
The company’s directors are responsible for the preparation and fair presentation of these financial statements in accordance with International Financial Reporting Standards and the requirements of the Companies Act of South Africa, and for such internal control as the directors determine is necessary to enable the preparation of fi nancial statements that are free from material misstatements, whether due to fraud or error.
Auditor’s responsibility
Our responsibility is to express an opinion on these fi nancial statements based on our audit. We conducted our audit in accordance with International Standards on Auditing. Those standards require that we comply with ethical requirements and plan and perform the audit to obtain reasonable assurance whether the fi nancial statements are free from material misstatement.
An audit involves performing procedures to obtain audit evidence about the amounts and disclosures in the fi nan-cial statements. The procedures selected depend on the auditor’s judgement, including the assessment of the risks of material misstatement of the fi nancial state-ments, whether due to fraud or error. In making those risk assessments, the auditor considers internal control rele-vant to the entity’s preparation and fair presentation of the
fi nancial statements in order to design audit procedures that are appropriate in the circumstances, but not for thepurpose of expressing an opinion on the effectiveness of the entity’s internal control. An audit also includes eval-uating the appropriateness of accounting policies used and the reasonableness of accounting estimates made by management, as well as evaluating the overall presen-tation of the fi nancial statements.
We believe that the audit evidence we have obtained is suffi cient and appropriate to provide a basis for our audit opinion.
Opinion
In our opinion, the fi nancial statements present fairly, in all material respects, the consolidated and separate fi nancial position of Capitec Bank Holdings Limited as at29 February 2012, and its consolidated and separate fi nancial performance and its consolidated and sepa-rate cash fl ows for the year then ended in accordance with International Financial Reporting Standards and the requirements of the Companies Act of South Africa.
PricewaterhouseCoopers Inc.Director: DG MalanRegistered AuditorCape Town 27 March 2012
2012DPS Rand Declared LDT Date paid
Ordinary dividend
Interim 125.0 124 102 750 27 Sep 2011 25 Nov 2011 5 Dec 2011
Final* 300.0 297 846 600 1 Mar 2012 15 Mar 2012 26 Mar 2012
Preference dividend
Interim 340.27 9 762 508 31 Aug 2011 16 Sep 2011 26 Sep 2011
Final 336.58 9 656 527 29 Feb 2012 15 Mar 2012 26 Mar 2012
2011Ordinary dividend
Interim 85.0 71 573 930 29 Sep 2010 26 Nov 2010 6 Dec 2010
Final 205.0 193 836 676 29 Mar 2011 17 Jun 2011 27 Jun 2011
Preference dividend
Interim 380.65 6 410 949 31 Aug 2010 16 Sep 2010 27 Sep 2010
Final 343.77 9 342 955 28 Feb 2011 17 Mar 2011 28 Mar 2011
* An ordinary dividend of 300 cents per share was declared by the directors on 1 March 2012 (2011: 205 cents). In line with IFRS,
no accrual was made for this dividend.
Directors’report
Year ended 29 February 2012

112 Capitec Bank Holdings Limited Integrated Report 2012 113
4. Share capital
Ordinary shares: 5 894 528 shares were issued this fi nancial year (2011: 10 405 135) and share issue costs of R11 679 035 (2011: R43 777 068) were allocated against share premium.
Preference shares: Nil (2011: 1 184 803) shares were issued this fi nancial year and share costs of Nil (2011: R788 087) were allocated against share premium .
Settlement of share optionsThe group settled 1 253 326 options (2011: 1 270 826 options) relating to the share incentive scheme.
5. Directors and secretary
Information relating to the directors and secretary of the company is in section 13 of the annual report.
6. Group details
The group’s place of domicile and country of incorporation is the Republic of South Africa and it has a primary listing on the JSE Limited.
Registered offi ce: 1 Quantum Street, Techno Park, Stellenbosch, 7600
7. Interests of the directors in share capital and contracts
7.1 At year-end, the directors, in aggregate, were directly or indirectly, benefi cially or non-benefi cially, interested in 18 499 242 (2011: 18 716 809) Capitec Bank Holdings Limited shares, equivalent to 18.63% (2011: 20.04%), of the issued share capital of Capitec Bank Holdings Limited. The individual interests of the directors were as follows:
2012 Number of shares held
** Benefi cial ** Non-benefi cial Total
Direct Indirect** Direct Indirect** shares %
AP du Plessis* 55 202 1 173 151 – – 1 228 353 1.24
MS du P le Roux (Chairman) – – – 14 367 841 14 367 841 14.47
RJ Huntley (1) – – – 28 200 28 200 0.03
MJ Joost (2) – – – – – 0.00
MC Mehl 40 784 – – – 40 784 0.04
NS Mjoli-Mncube 110 000 – – – 110 000 0.11
PJ Mouton – 11 000 – – 11 000 0.01
CA Otto 1 064 – – 506 500 507 564 0.51
JG Solms (3) – – – – – 0.00
R Stassen* 137 819 – – 2 047 681 2 185 500 2.20
JP van der Merwe 20 000 – – – 20 000 0.02
364 869 1 184 151 – 16 950 222 18 499 242 18.63
2011AP du Plessis* – 1 173 151 – – 1 173 151 1.26
MS du P le Roux (Chairman) – – – 14 367 841 14 367 841 15.39
MJ Jooste (2) – – – – – 0.00
MC Mehl 70 784 – – – 70 784 0.08
NS Mjoli-Mncube 110 000 – – – 110 000 0.12
PJ Mouton – 11 000 – – 11 000 0.01
CA Otto 1 064 – – 506 500 507 564 0.54
JG Solms (3) 108 500 44 969 – – 153 469 0.16
R Stassen* 67 819 – – 2 235 181 2 303 000 2.47
JP van der Merwe 20 000 – – – 20 000 0.02
378 167 1 229 120 – 17 109 522 18 716 809 20.04
* Executive** Includes shareholding through associates as defi ned in terms of the JSE Listings Requirements.(1) Appointed on 14 April 2011.(2) Appointed on 28 January 2011.(3) Resigned on 3 June 2011.
7.2 At year-end the directors were participants in the Capitec Bank Holdings Limited share incentive scheme in respect of 977 375 (2011: 1 258 250) Capitec Bank Holdings Limited share options.
2012 Openingbalance
(Options exercised)/Options granted
Closingbalance
Maturitydate
Issuedate
Strikeprice
Numberof shareoptions
Numberof share options
Marketprice
Exercisedate
Numberof share options
Directors R R
AP du Plessis 12 Apr 11 12 Apr 06 30.73 13 125 (13 125) 177.00 4 May 11 –
(direct benefi cial) 21 Apr 11 21 Apr 08 35.54 15 685 (15 685) 175.00 5 May 11 –
21 Apr 11 21 Apr 08 35.54 15 565 (15 565) 188.00 31 May 11 –
26 Apr 11 26 Apr 07 35.82 19 000 (19 000) 188.00 31 May 11 –
20 May 11 20 May 05 14.05 17 500 (17 500) 189.00 2 Jun 11 –
12 Apr 12 12 Apr 06 30.73 13 125 – – 13 125
15 Apr 12 15 Apr 09 31.23 18 750 – – 18 750
21 Apr 12 21 Apr 08 35.54 31 250 – – 31 250
26 Apr 12 26 Apr 07 35.82 19 000 – – 19 000
14 Apr 13 14 Apr 10 97.30 3 125 – – 3 125
15 Apr 13 15 Apr 09 31.23 18 750 – – 18 750
21 Apr 13 21 Apr 08 35.54 31 250 – – 31 250
26 Apr 13 26 Apr 07 35.82 19 000 – – 19 000
12 Apr 14 12 Apr 11 160.09 – 3 750 – 3 750
14 Apr 14 14 Apr 10 97.30 3 125 – – 3 125
15 Apr 14 15 Apr 09 31.23 18 750 – – 18 750
21 Apr 14 21 Apr 08 35.54 31 250 – – 31 250
12 Apr 15 12 Apr 11 160.09 – 3 750 – 3 750
14 Apr 15 14 Apr 10 97.30 3 125 – – 3 125
15 Apr 15 15 Apr 09 31.23 18 750 – – 18 750
12 Apr 16 12 Apr 11 160.09 – 3 750 – 3 750
14 Apr 16 14 Apr 10 97.30 3 125 – – 3 125
12 Apr 17 12 Apr 11 160.09 – 3 750 – 3 750
313 250 (65 875) 247 375
R Stassen 12 Apr 11 12 Apr 06 30.73 50 000 (50 000) 175.00 5 May 11 –
(direct benefi cial) 21 Apr 11 21 Apr 08 35.54 125 000 (125 000) 178.25 17 May 11 –
20 May 11 20 May 05 14.05 70 000 (70 000) 187.50 3 Jun 11 –
12 Apr 12 12 Apr 06 30.73 50 000 – – 50 000
15 Apr 12 15 Apr 09 31.23 62 500 – – 62 500
21 Apr 12 21 Apr 08 35.54 125 000 – – 125 000
14 Apr 13 14 Apr 10 97.30 6 250 – – 6 250
15 Apr 13 15 Apr 09 31.23 62 500 – – 62 500
21 Apr 13 21 Apr 08 35.54 125 000 – – 125 000
12 Apr 14 12 Apr 11 160.09 – 7 500 – 7 500
14 Apr 14 14 Apr 10 97.30 6 250 – – 6 250
15 Apr 14 15 Apr 09 31.23 62 500 – – 62 500
21 Apr 14 21 Apr 08 35.54 125 000 – – 125 000
12 Apr 15 12 Apr 11 160.09 – 7 500 – 7 500
14 Apr 15 14 Apr 10 97.30 6 250 – – 6 250
15 Apr 15 15 Apr 09 31.23 62 500 – – 62 500
12 Apr 16 12 Apr 11 160.09 – 7 500 – 7 500
14 Apr 16 14 Apr 10 97.30 6 250 – – 6 250
12 Apr 17 12 Apr 11 160.09 – 7 500 – 7 500
945 000 (215 000) 730 000
Total 1 258 250 (280 875) 977 375

114 Capitec Bank Holdings Limited Integrated Report 2012 115
The directors were also participants in the Capitec Bank Holdings Limited share incentive scheme in respect of 876 250 (2011: 987 500) share appreciation rights (SARs) as follows:
2012 Openingbalance
(SAR exercised) /SAR granted
Closingbalance
Maturitydate
Issuedate
SAR exercise
priceNumberof SAR
Numberof SAR
Marketprice
Exercisedate
Numberof SAR
Directors R R
AP du Plessis 21 Apr 11 21 Apr 08 35.54 31 250 (31 250) 175.00 5 May 11 –
(direct benefi cial) 15 Apr 12 15 Apr 09 31.23 18 750 – – 18 750
21 Apr 12 21 Apr 08 35.54 31 250 – – 31 250
14 Apr 13 14 Apr 10 97.30 3 125 – – 3 125
15 Apr 13 15 Apr 09 31.23 18 750 – – 18 750
21 Apr 13 21 Apr 08 35.54 31 250 – – 31 250
12 Apr 14 12 Apr 11 160.09 – 3 750 – 3 750
14 Apr 14 14 Apr 10 97.30 3 125 – – 3 125
15 Apr 14 15 Apr 09 31.23 18 750 – – 18 750
21 Apr 14 21 Apr 08 35.54 31 250 – – 31 250
12 Apr 15 12 Apr 11 160.09 – 3 750 – 3 750
14 Apr 15 14 Apr 10 97.30 3 125 – – 3 125
15 Apr 15 15 Apr 09 31.23 18 750 – – 18 750
12 Apr 16 12 Apr 11 160.09 – 3 750 – 3 750
14 Apr 16 14 Apr 10 97.30 3 125 – – 3 125
12 Apr 17 12 Apr 11 160.09 – 3 750 – 3 750
212 500 (16 250) 196 250
R Stassen 21 Apr 11 21 Apr 08 35.54 125 000 (125 000) 188.00 24 May 11 –
(direct benefi cial) 15 Apr 12 15 Apr 09 31.23 62 500 – – 62 500
21 Apr 12 21 Apr 08 35.54 125 000 – – 125 000
14 Apr 13 14 Apr 10 97.30 6 250 – – 6 250
15 Apr 13 15 Apr 09 31.23 62 500 – – 62 500
21 Apr 13 21 Apr 08 35.54 125 000 – – 125 000
12 Apr 14 12 Apr 11 160.09 – 7 500 – 7 500
14 Apr 14 14 Apr 10 97.30 6 250 – – 6 250
15 Apr 14 15 Apr 09 31.23 62 500 – – 62 500
21 Apr 14 21 Apr 08 35.54 125 000 – – 125 000
12 Apr 15 12 Apr 11 160.09 – 7 500 – 7 500
14 Apr 15 14 Apr 10 97.30 6 250 – – 6 250
15 Apr 15 15 Apr 09 31.23 62 500 – – 62 500
12 Apr 16 12 Apr 11 160.09 – 7 500 – 7 500
14 Apr 16 14 Apr 10 97.30 6 250 – – 6 250
12 Apr 17 12 Apr 11 160.09 – 7 500 – 7 500
775 000 (95 000) 680 000
Total 987 500 (111 250) 876 250
7.4 The directors’ remuneration in respect of the fi nancial year was as follows:
2012 SalariesFringe
benefi ts Bonuses Fees Total
Fair value of options and rights
granted during the
year on reporting
date
R’000 R’000 R’000 R’000 R’000 R’000
Executive
AP du Plessis 4 172 151 593 – 4 916 269
R Stassen 8 872 324 1 323 – 10 519 538
Non-executive
MS du P le Roux (Chairman) – – – 1 040 1 040 –
RJ Huntley – – – 116 116 –
MJ Jooste (1) – – – 150 150 –
MC Mehl – – – 348 348 –
NS Mjoli-Mncube – – – 202 202 –
PJ Mouton – – – 238 238 –
JG Solms – – – 63 63 –
CA Otto – – – 348 348 –
JP van der Merwe – – – 348 348 –
13 044 475 1 916 2 853 18 288 807
The total share option expense relating to directors amounted to R4 482 281 (2011: R2 236 166) and share appreciation rights expense amounted to R46 288 285 (2011: R46 172 105). This expense includes the movement on all tranches.
2011 SalariesFringe
benefi ts Bonuses Fees Total
R’000 R’000 R’000 R’000 R’000Executive
AP du Plessis 3 733 121 449 – 4 303
R Stassen 7 143 299 3 720 – 11 162
Non-executive
MS du P le Roux (Chairman) – – – 960 960
TD Mahloele – – – 95 95
MC Mehl – – – 319 319
NS Mjoli-Mncube – – – 184 184
PJ Mouton – – – 184 184
CA Otto – – – 292 292
JG Solms – – – 222 222
JP van der Merwe – – – 319 319
MJ Jooste (1) – – – 10 10
10 876 420 4 169 2 585 18 050
7.3 At year-end, the directors, in aggregate, were indirectly non-benefi cially interested in 21 000 (2011:21 000) Capitec Bank Holdings Limited non-redeemable, non-cumulative, non-participating preference shares, equivalent to 0.73% (2011: 0.73%) of the issued preference share capital of Capitec Bank Holdings Limited.
The individual interest of the directors were as follows:
2012 2011
Non-benefi cial indirect
Number of shares %
Number of shares %
R Stassen 21 000 0.73 21 000 0.73
21 000 0.73 21 000 0.73
(1) Director’s fees paid to Steinhoff International Holdings Limited

116 Capitec Bank Holdings Limited Integrated Report 2012 117
8. Investments in subsidiariesInformation relating to the company’s fi nancial interest in its subsidiaries is set out in note 9 to the fi nancial statements.
9. Material events after year-endNo event, which is material to the fi nancial affairs of the group, has occurred between the reporting date and the date of approval of the fi nancial statements.
10. Prescribed offi cersThe executive directors are the prescribed offi cers of the company. GROUP COMPANY
2012 2011 2012 2011
Notes R’000 R’000 R’000 R’000
Assets
Cash and cash equivalents 4 4 551 203 2 841 918 18 13
Investments designated at fair value 5 1 198 833 988 664 – –
Loans and advances to clients 6 16 863 028 10 071 466 – –
Inventory 7 42 079 30 847 – –
Other receivables 8 57 745 48 177 9 657 9 355
Current income tax assets 62 331 – – –
Interest in subsidiaries 9 – – 3 203 661 2 196 440
Property and equipment 10 543 121 375 185 – –
Intangible assets 11 69 262 34 357 – –
Deferred income tax assets 12 234 242 48 903 – –
Total assets 23 621 844 14 439 517 3 213 336 2 205 808
Liabilities
Loans and deposits at amortised cost 13 17 692 062 10 449 883 – –
Provisions 15 24 998 14 403 – –
Other liabilities 14 718 549 489 685 10 303 10 533
Current income tax liabilities 885 35 033 – –
Total liabilities 18 436 494 10 989 004 10 303 10 533
Equity
Capital and reserves
Ordinary share capital and premium 16 2 926 435 1 918 677 2 926 435 1 918 677
Cash fl ow hedge reserve 17 (1 920) (3 469) – –
Retained earnings 2 001 866 1 276 336 17 629 17 629
Share capital and reserves attributable to ordinary shareholders 4 926 381 3 191 544 2 944 064 1 936 306
Non-redeemable, non-cumulative, non-participating
preference share capital and premium 16 258 969 258 969 258 969 258 969
Total equity 5 185 350 3 450 513 3 203 033 2 195 275
Total equity and liabilities 23 621 844 14 439 517 3 213 336 2 205 808
Balancesheets
As at 29 February 2012
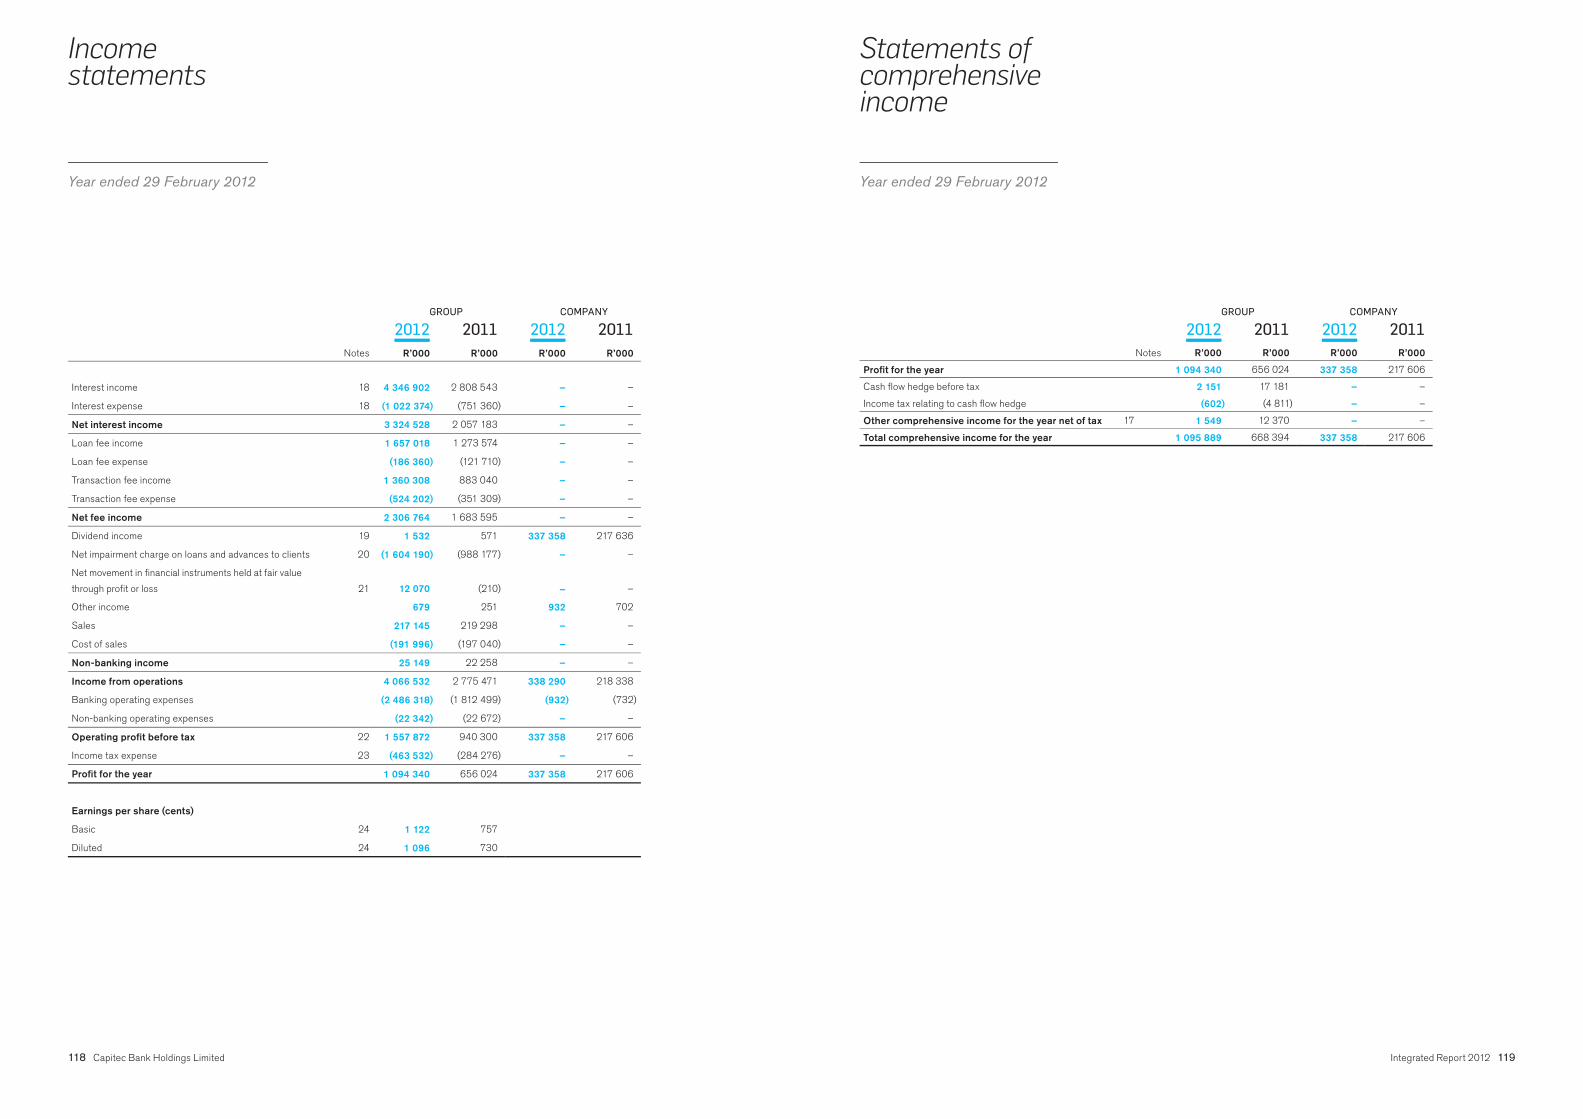
118 Capitec Bank Holdings Limited Integrated Report 2012 119
GROUP COMPANY
2012 2011 2012 2011
Notes R’000 R’000 R’000 R’000
Interest income 18 4 346 902 2 808 543 – –
Interest expense 18 (1 022 374) (751 360) – –
Net interest income 3 324 528 2 057 183 – –
Loan fee income 1 657 018 1 273 574 – –
Loan fee expense (186 360) (121 710) – –
Transaction fee income 1 360 308 883 040 – –
Transaction fee expense (524 202) (351 309) – –
Net fee income 2 306 764 1 683 595 – –
Dividend income 19 1 532 571 337 358 217 636
Net impairment charge on loans and advances to clients 20 (1 604 190) (988 177) – –
Net movement in fi nancial instruments held at fair value
through profi t or loss 21 12 070 (210) – –
Other income 679 251 932 702
Sales 217 145 219 298 – –
Cost of sales (191 996) (197 040) – –
Non-banking income 25 149 22 258 – –
Income from operations 4 066 532 2 775 471 338 290 218 338
Banking operating expenses (2 486 318) (1 812 499) (932) (732)
Non-banking operating expenses (22 342) (22 672) – –
Operating profi t before tax 22 1 557 872 940 300 337 358 217 606
Income tax expense 23 (463 532) (284 276) – –
Profi t for the year 1 094 340 656 024 337 358 217 606
Earnings per share (cents)
Basic 24 1 122 757
Diluted 24 1 096 730
Incomestatements
Year ended 29 February 2012
GROUP COMPANY
2012 2011 2012 2011
Notes R’000 R’000 R’000 R’000
Profi t for the year 1 094 340 656 024 337 358 217 606
Cash fl ow hedge before tax 2 151 17 181 – –
Income tax relating to cash fl ow hedge (602) (4 811) – –
Other comprehensive income for the year net of tax 17 1 549 12 370 – –
Total comprehensive income for the year 1 095 889 668 394 337 358 217 606
Statements of comprehensive income
Year ended 29 February 2012

120 Capitec Bank Holdings Limited Integrated Report 2012 121
Ordinary share
capital and premium
Preference share
capital and premium
Cash fl ow hedge
reserveRetained earnings Total
GROUP R’000 R’000 R’000 R’000 R’000
Balance at 28 February 2010 682 219 154 606 (15 839) 906 991 1 727 977
Total comprehensive income for the year – – 12 370 656 024 668 394
Ordinary dividend – – – (201 882) (201 882)
Preference dividend – – – (15 754) (15 754)
Employee share option scheme: Value of
employee services – – – 11 706 11 706
Shares issued and acquired for employee
share options at cost 127 169 – – (131 591) (4 422)
Proceeds on settlement of employee
share options – – – 23 255 23 255
Tax effect on share options – – – 27 587 27 587
Shares issued 1 153 066 105 151 – – 1 258 217
Share issue expenses (43 777) (788) – – (44 565)
Balance at 28 February 2011 1 918 677 258 969 (3 469) 1 276 336 3 450 513
Total comprehensive income for the year – – 1 549 1 094 340 1 095 889
Ordinary dividend – – – (317 939) (317 939)
Preference dividend – – – (19 419) (19 419)
Employee share option scheme: Value of
employee services – – – 11 778 11 778
Shares issued and acquired for employee
share options at cost 220 505 – – (221 207) (702)
Proceeds on settlement of employee
share options – – – 35 091 35 091
Tax effect on share options – – – 142 886 142 886
Shares issued 798 932 – – – 798 932
Share issue expenses (11 679) – – – (11 679)
Balance at 29 February 2012 2 926 435 258 969 (1 920) 2 001 866 5 185 350
Notes 16 16 17
Statements of changes in equity
Year ended 29 February 2012
Ordinary share
capital and premium
Preference share
capital and premium
Retained earnings Total
COMPANY R’000 R’000 R’000 R’000
Balance at 28 February 2010 682 219 154 606 17 659 854 484
Total comprehensive income for the year – – 217 606 217 606
Ordinary dividend – – (201 882) (201 882)
Preference dividend – – (15 754) (15 754)
Shares issued 1 280 235 105 151 – 1 385 386
Share issue expenses (43 777) (788) – (44 565)
Balance at 28 February 2011 1 918 677 258 969 17 629 2 195 275
Total comprehensive income for the year – – 337 358 337 358
Ordinary dividend – – (317 939) (317 939)
Preference dividend – – (19 419) (19 419)
Shares issued 1 019 437 – – 1 019 437
Share issue expenses (11 679) – – (11 679)
Balance at 29 February 2012 2 926 435 258 969 17 629 3 203 033
Notes 16 16
Statements of changes in equity (continued)
Year ended 29 February 2012

122 Capitec Bank Holdings Limited Integrated Report 2012 123
Statementsofcash fl ows
Year ended 29 February 2012
GROUP COMPANY
2012 2011 2012 2011
Notes R’000 R’000 R’000 R’000
Cash fl ow from operating activities
Cash fl ow from operations 30 2 406 380 (537 593) 337 038 214 828
Income taxes paid 31 (603 066) (290 639) – –
1 803 314 (828 232) 337 038 214 828
Cash fl ow from investing activities
Purchase of property and equipment 10 (315 366) (203 170) – –
Proceeds from disposal of property and equipment 1 236 3 107 – –
Purchase of intangible assets 11 (65 873) (32 193) – –
Investment in subsidiaries – – (1 007 221) (1 341 909)
Acquisition of investments at fair value through profi t or loss (1 542 428) (1 469 502) – –
Disposal of investments at fair value through profi t or loss 1 344 330 1 786 927 – –
(578 101) 85 169 (1 007 221) (1 341 909)
Cash fl ow from fi nancing activities
Dividends paid 32 (337 570) (214 092) (337 570) (213 728)
Preference shares issued 16 – 104 363 – 104 363
Ordinary shares issued 16 1 007 758 1 236 458 1 007 758 1 236 458
Realised loss on settlement of employee share options less
participants’ contributions 33 (186 116) (108 336) – –
484 072 1 018 393 670 188 1 127 093
Net increase in cash and cash equivalents 1 709 285 275 330 5 12
Cash and cash equivalents at the beginning of the year 2 841 918 2 566 588 13 1
Cash and cash equivalents at the end of the year 4 4 551 203 2 841 918 18 13
Notes to the annual fi nancial statements
Year ended 29 February 2012
1. Accounting policiesThe principal accounting policies applied in the preparation of these consolidated fi nancial statements are set out below. These policies have been consistently applied to all the years presented, unless otherwise stated. Accounting policies have been consistently applied through subsidiaries in the group.
Basis of preparationThe group’s consolidated fi nancial statements have been prepared in accordance with International Financial Reporting Standards (IFRS). The consolidated fi nancial statements have been prepared under the historical cost convention, as modifi ed by the revaluation of fi nancial instruments held at fair value through profi t or loss.
The preparation of fi nancial statements in conformity with IFRS requires the use of certain critical accounting estimates. It also requires management to exercise its judgement in the process of applying the group’s accounting policies. The areas involving a higher degree of judgement or complexity, or areas where assumptions and estimates are signifi cant to the consolidated fi nancial statements, are disclosed in note 2.
1.1 Basis of consolidationThe consolidated fi nancial statements include those of the company, all its subsidiaries, the share incentive trust and the employee empowerment trust.
Subsidiaries are all entities (including special-purpose entities) over which the group has the power to govern the fi nancial and operating policies generally accompanying a shareholding of more than one half of the voting rights. The existence and effect of potential voting rights that are currently exercisable or convertible are considered when assessing whether the group controls another entity. Subsidiaries are fully consolidated from the date on which control is transferred to the group. They are de-consolidated from the date that control ceases.
The group uses the purchase method of accounting to account for the acquisition of subsidiaries. The cost of an acquisition is measured, as the fair value of the assets given, equity instruments issued and liabilities incurred or assumed at the date of exchange, plus costs directly attributable to the acquisition. Identifi able assets acquired and liabilities and contingent liabilities assumed in a business combination are measured initially at their fair values at the acquisition date, irrespective of the extent of any non-controlling interest. The excess of the cost of acquisition over the fair value of the group’s share of the identifi able net assets acquired is recorded as goodwill. If the cost of acquisition is less than the fair value of the net assets of the subsidiary acquired, the difference is recognised directly in the income statement.
Intercompany transactions, balances and unrealised gains on transactions between group companies are eliminated.
Investments in subsidiaries are accounted for at cost less allowance for impairment. The carrying amounts of these investments are reviewed annually and written down for impairment where considered necessary.
Transactions and non-controlling interestsThe group treats transactions with non-controlling interests as transactions with equity owners of the group. For purchases from non-controlling interests, the difference between any consideration paid and the relevant share of the carrying value of the net assets of the subsidiary acquired, is recorded in equity. Gains or losses on disposals to non-controlling interests are also recorded in equity.
124 Capitec Bank Holdings Limited Integrated Report 2012 125
The group has changed its accounting policy for transactions with non-controlling interests and the accounting for loss of control or signifi cant infl uence from 1 March 2010 when revised IAS 27 Consolidated and separate fi nancial
statements, became effective for the group.
Previously, transactions with non-controlling interests were treated as transactions with parties external to the group. Disposals therefore resulted in gains and losses in profi t or loss, and purchases resulted in goodwill, being the difference between any consideration paid and the relevant share of the carrying value of the net assets of the subsidiary acquired.
The group has applied a new policy to transactions occurring on or after 1 March 2010. As a consequence, no adjustments to any amounts previously recognised in the fi nancial statements were necessary.
1.2 Cash and cash equivalentsCash and cash equivalents comprise balances with less than three months’ maturity from the date of acquisition, including: cash, balances with central banks, treasury bills and other eligible bills, amounts due from banks, non-bank money market investments and short-term government securities. Cash and cash equivalents are stated at cost which approximates fair value due to the short-term nature of these instruments.
1.3 Financial instrumentsThe group recognises fi nancial assets on the balance sheet once it becomes a party to the contractual terms of the particular fi nancial instrument.
Financial assets are derecognised when the rights to receive cash fl ows from the fi nancial assets have expired or where the group has transferred substantially all risks and rewards of ownership.
Management determines the categorisation of its fi nancial instruments at initial recognition and re-evaluates this categorisation at each reporting date.
1.3.1 The group categorises its fi nancial assets in the following categories: (a) Financial assets at fair value through profi t or loss
This category has two subclasses: fi nancial assets held for trading, and those designated at fair value through profi t or loss at inception. A fi nancial asset is categorised as held for trading if acquired principally for the purpose of selling in the short term or if so designated by management. Derivatives are categorised as held for trading unless they are designated as hedges.
Purchases and sales of fi nancial assets at fair value through profi t or loss are recognised on trade date, being the date on which the group commits to purchase or sell the asset.
Gains and losses on fi nancial assets at fair value through profi t or loss are measured as the difference between the fair values and the carrying amounts adjusted for dividend income (1.16.4), and are included in the income statement.
(b) Loans and advancesLoans and advances are non-derivative fi nancial assets with fi xed or determinable payments that are not quoted in an active market, other than:
(i) those that the entity intends to sell immediately or in the short term, which are categorised as held for trading, and those that the entity upon initial recognition designates as at fair value through profi t or loss;
(ii) those that the entity upon initial recognition designates as available-for-sale; or (iii) those for which the holder may not recover substantially all of its initial investment, other than
because of credit deterioration.
They arise when the group provides money, goods or services directly to a debtor with no intention of trading the advance. Included within this category are group loans receivable and other receivables. Loans and advances are recognised when funds are advanced to the borrowers.
(c) Held-to-maturity investmentsThe group currently has no held-to-maturity investments. Held-to-maturity investments are non-derivative fi nancial assets with fi xed or determinable payments and fi xed maturities that the group’s management has the positive intention and ability to hold to maturity. Were the group to sell other than an insignifi cant amount of held-to-maturity assets, the entire category would be tainted and re-categorised as available-for-sale.
(d) Available-for-sale fi nancial assetsThe group currently has no available-for-sale fi nancial assets. Available-for-sale fi nancial assets are assets that management intend to hold on a continuing basis, which may be sold in response to needs for liquidity or changes in interest rates, exchange rates or equity prices.
Financial assets, other than those held at fair value through profi t or loss, are initially recognised at fair value plus transaction costs.
Financial assets at fair value through profi t or loss and available-for-sale fi nancial assets are subsequently carried at fair value. Loans and advances are carried at amortised cost using the effective interest rate method. Gains and losses arising from changes in the fair value of fi nancial assets at fair value through profi t or loss are included in the income statement in the period in which they arise.
Refer to note 1.3.4 with reference to hedging instruments.
The fair values of quoted fi nancial assets in active markets are based on current bid prices.
1.3.2 The group categorises its fi nancial liabilities in the following categories:The group recognises a fi nancial liability once it becomes a party to the contractual terms of the fi nancial instrument. Financial liabilities, other than those held at fair value through profi t or loss, are recognised initially at fair value, generally being their issue proceeds net of transaction costs incurred.
A fi nancial liability, or part of a fi nancial liability, is derecognised once the obligation specifi ed in the contract relating to the fi nancial liability is discharged, cancelled or has expired.
(a) Deposits held at amortised costDeposits held at amortised cost are recognised initially at fair value and are subsequently stated at amortised cost using the effective interest method. Any differences (other than transaction charges) between net proceeds and the redemption value are recognised in the income statement over the period of the borrowing using the effective yield method.
(b) Deposits held at fair value through profi t or lossThese deposits are fair valued by discounting the value using an appropriate discount rate determined with reference to quoted rates on market instruments with similar credit characteristics and maturities.
Financial liabilities are designated at fair value through profi t or loss, where required, in order to eliminate or reduce measurement or recognition inconsistencies that would otherwise arise from measuring liabilities on different bases; or if a group of fi nancial liabilities is managed and its performance evaluated on a fair value basis, in accordance with a documented risk management or investment strategy, and information about the group is provided internally on that basis to the management committee and board of directors.
126 Capitec Bank Holdings Limited Integrated Report 2012 127
Gains and losses arising from changes in the fair value of deposits held at fair value through profi t or loss are included in the income statement in the period in which they arise.
(c) Other fi nancial liabilitiesIncluded within this class of fi nancial liabilities are trade and other payables, provisions and grouploans payable that will be settled in cash and cash equivalents. Trade and other payables and group loans payable are recognised initially at fair value and are subsequently stated at amortised cost using the effective interest rate method. Refer to note 1.12 for the accounting policy applied in measuring provisions.
1.3.3 Offsetting fi nancial instrumentsFinancial assets and liabilities are offset and the net amount reported in the balance sheet when there is a legally enforceable right to set off the recognised amounts and there is an intention to settle on a net basis, or to realise the asset and settle the liability simultaneously. Deferred loan income reduces the outstanding loans and advances balance on the basis that the revenue will be recognised over the terms of the loans.
1.3.4 Derivative fi nancial instruments and hedging activitiesDerivative fi nancial instruments exclude equity instruments that are accounted for in terms of IFRS 2 Share-based payment.
Derivatives are initially recognised at fair value on the date a derivative contract is entered into and are subsequently remeasured at fair value. Transaction costs are expensed. The method of recognising the resulting gain or loss depends on whether the derivative is designated as a hedging instrument, and if so, the nature of the item being hedged. Fair values are obtained from quoted market prices, where available, alternatively using valuation techniques or based on observable market prices where possible, failing which estimates are used.
Interest rate swaps are valued on a discounted cash fl ow basis using yield curves appropriate for the relevant swap rates. Quoted market prices are used where available and estimates are derived from quoted prices where required.
All contracts are carried as assets when fair value is positive and as liabilities when fair value is negative. Derivatives are held only to cover economic exposure.
The group designates certain derivatives as:(a) hedges of the fair value of recognised assets or liabilities or a fi rm commitment (fair value hedge); or(b) hedges of a particular risk associated with a recognised asset or liability or a highly probable forecast
transaction (cash fl ow hedge); or(c) economic hedges if not qualifying in terms of the accounting criteria classifi ed as ‘fair value through
profi t or loss’.
The use of derivatives is restricted to the hedging of forecast cash fl ows for specifi c transactions. Currently derivatives are limited to interest rate swaps and forward foreign exchange contracts.
Treatment of hedges qualifying as ‘cash fl ow hedges’
The effective portion of changes in the fair value of derivatives that are designated and qualify as cash fl ow hedges is recognised in other comprehensive income. The gain or loss relating to the ineffective portion is recognised immediately in the income statement.
Amounts accumulated in equity are reclassifi ed to profi t or loss in the periods when the hedged item affects profi t or loss (for example, when the interest payments that are hedged are recognised as an expense). The gain or loss relating to the effective portion of interest rate swaps hedging variable rate borrowings
is recognised in the income statement within ‘interest expense’. The gain or loss relating to the ineffective portion is recognised in the income statement within ‘movement in fi nancial instruments held at fair value through profi t or loss’.
When a hedging instrument expires or is sold, or when a hedge no longer meets the criteria for hedge accounting, any cumulative gain or loss existing in equity at that time remains in equity and is recognised when the forecast transaction is ultimately recognised in the income statement. When a forecast transaction is no longer expected to occur, the cumulative gain or loss that was reported in equity is immediately transferred to the income statement within ‘movement in fi nancial instruments held at fair value through profi t or loss’.
The group documents at the inception of the transaction the relationship between hedging instruments and hedged items, as well as its risk management objectives and strategy for undertaking various hedging transactions. The group also documents its assessment, both at hedge inception and on an ongoing basis, of whether the derivatives that are used in hedging transactions are highly effective in offsetting changes cash fl ows of hedged items.
Treatment of economic hedges classifi ed as ‘fair value through profi t or loss’
Changes in the fair value of these derivatives classifi ed as ‘fair value through profi t and loss’ are taken to profi t or loss immediately on remeasurement.
The fair values of various derivative instruments used for hedging purposes are disclosed in note 41. Movements on the hedging reserve in shareholders’ equity are shown in note 17.
1.3.5 Financial guarantee contractsA fi nancial guarantee contract is a contract that requires the group (issuer) to make specifi ed payments to reimburse the holder for a loss it incurs because a specifi ed debtor fails to make payment when due in accordance with the original or modifi ed terms of a debt instrument.
Financial guarantee liabilities are initially recognised at fair value and then amortised over the life of the fi nancial guarantee. Subsequent to initial recognition, the fi nancial guarantee liability is measured at the higher of the present value of any expected payment, when a payment under the guarantee has become probable, and the unamortised premium.
1.3.6 Resale agreementsFinancial instruments purchased under agreements to resell, at either a fi xed price or the purchase price plus a lender’s rate of return, are recorded as loans granted under resale agreements and included under cash and cash equivalents or loans and advances as appropriate. The difference between the purchase and sales price is treated as interest and amortised over the life of the reverse repurchase agreement using the effective interest rate method.
1.4 Impairment of advancesThe estimation of allowances for impairments is inherently uncertain and depends on many factors, including general economic conditions, structural changes within industries, changes in individual customer circumstances and other external factors such as legal requirements, regulatory specifi cations and governmental policy changes.
Loans and advances are stated at amortised cost net of identifi ed impairments and incurred but unidentifi ed impairments.
Loans and advances are considered impaired if, and only if, there is objective evidence of impairment as a result of events that occurred after initial asset recognition (known as loss events) and these loss events have an adverse impact on the assets’ estimated future cash fl ows that can be measured reliably.

128 Capitec Bank Holdings Limited Integrated Report 2012 129
Objective evidence that loans and advances may be impaired includes the following observable data:(a) A breach of contract, such as a default or delinquency in interest or principal payments. In this regard instalments
past due date are considered in breach of contract.(b) Historical loss experience of groups of fi nancial assets with similar repayment terms.(c) Data indicating that there is a measurable decrease in the estimated future cash fl ows from a group of fi nancial
assets since the initial recognition of those assets, although the decrease cannot yet be identifi ed with the individual fi nancial assets in the group including:• adverse changes in the payment status of borrowers in the group; or• national or local economic conditions that correlate with defaults on the assets in the group.
In determining whether a loss event has occurred, loans and advances are subjected to regular evaluations of the overall client risk profi le and payments record.
The historical loss experience is adjusted on the basis of observable data to refl ect the effects of current conditions that did not affect the period on which the historical loss experience is based and to remove the effects ofconditions in the historical period that do not currently exist.
On a collective basis, the group assesses whether objective evidence of impairment exists for groups of fi nancial assets with similar repayment terms. If there is objective evidence that an impairment loss on loans and advances has been incurred, the amount of the loss is measured as the difference between the assets’ carrying amounts and the present value of estimated future cash fl ows (excluding future credit losses that have not yet been incurred) discounted at the respective fi nancial assets’ original effective interest rates (the recoverable amount).
1.4.1 Identifi ed impairmentLoans and advances within the group comprise a large number of small homogenous assets. Statistical techniques are used to calculate impairment allowances collectively, based on historical default and recovery rates. These statistical analyses use as primary inputs the extent to which accounts in the portfolio are in arrears and historical loss experience on the eventual losses encountered from similar delinquent portfolios.
These statistics feed discounted cash fl ow models, which have been developed for each of the loan products, offered by the group. The models are updated periodically in order to refl ect appropriate changes in inputs.
Models contain both judgemental and non-judgemental inputs. The extent of judgement utilised in models developed for new loan products is greater than that for older products given the limited historical experience available for the new products.
In outline, the statistical analyses are performed on a portfolio basis as follows:
• Loans and advances are monitored on a product basis, with each month’s advances being treated as a discrete portfolio, on which an analysis of the run-off of recoveries, in period buckets and stratifi ed between default statistics, is performed in order to develop a historical base for statistics on probability of default (PD).
• These derived statistics, based on actual experience, are used in plotting default values on a model curve that refl ects the risk profi le of the portfolio.
• Clients in arrears by more than 90 days are handed over for collection and written off. Recoveries from short-term loans are regarded as negligible as collateral is not required for the granting of advances in the current product range. The estimated recoveries on longer-term loans discounted at the contractual rates are recognised in gross loans and advances.
• Upon write-off the accrual of interest income on the original term of the advance is discontinued.
1.4.2 Incurred but unidentifi ed impairmentIn addition to the impairment estimated for assets with recognised objective evidence of impairment, an estimate is made for impairments associated with those assets in the balance sheet that are impaired, but for which objective evidence is not yet available.
• The impairment calculation utilises the results of the statistical analyses referred to above to estimate the proportion of assets in each portfolio that are likely to display objective evidence of impairment over the emergence period. The emergence period is defi ned as the experience of the length of time that it takes for objective evidence to become apparent after the asset has become impaired.
• In considering the occurrence of a loss event over the life of a loan, it is assumed that there is a constant risk of the loss event occurring at any point in the life of the loan.
• For a portfolio of loans in a particular month most of the provision is recognised in the early stages of the contractual period, as the outstanding loan balances are larger.
The methodology and assumptions used for estimating future cash fl ows are reviewed regularly to reduce differences between loss estimates and actual loss experience.
All impaired loans and advances are reviewed on a monthly basis and any changes to the amount and timing of the expected future cash fl ows compared to previous estimates will result in a change to the charges for impairment of loans and advances in the income statement.
1.4.3 Loan write-offsClients (and the related impairment allowance accounts) are normally written off in full when they are in arrears for more than 90 days.
1.5 InventoryInventory is stated at the lower of the cost or net realisable value. Cost is determined using the fi rst-in fi rst-out (FIFO) method. Net realisable value is the estimate of the selling price in the ordinary course of business, less selling expenses. Inventory is carried net of rebates. All inventories comprise fi nished goods.
1.6 Interest-free loans grantedInterest-free group loans with no fi xed maturities are viewed as part of the company’s investment in subsidiaries and are carried at cost net of impairment.
1.7 Current taxIncome tax payable on profi ts, based on the applicable tax law, is recognised as an expense in the period in which profi ts arise. Secondary tax on companies is calculated in terms of the applicable tax law and disclosed as part of the tax expense on the income statement.
South African resident companies are subject to a dual corporate tax system, one part of the tax being levied on taxable income and the other, secondary tax on companies (called STC), on distributed income. A company incurs STC charges on the declaration or deemed declaration of dividends (as defi ned under tax law) to its shareholders. STC is not a withholding tax on shareholders, but a tax on companies.
The STC tax consequence of dividends is recognised as a taxation charge in the income statement in the same period that the related dividend is accrued as a liability. The STC liability is reduced by dividends received during the dividend cycle. Where dividends declared exceed the dividends received during a cycle, STC is payable at the current STC rate on the net amount. Where dividends received exceed dividends declared within a cycle, there is no liability to pay STC. The potential tax benefi t related to excess dividends received is carried forward to the next dividend cycle as an STC credit. Deferred tax assets are recognised on unutilised STC credits to the extent that it is probable that the group will declare future dividends to utilise such STC credits.
130 Capitec Bank Holdings Limited Integrated Report 2012 131
1.8 Deferred taxDeferred income tax is provided in full, using the liability method, on temporary differences arising between the tax bases of assets and liabilities and their carrying amounts for fi nancial reporting purposes. Deferred income tax is determined using tax laws and rates that have been enacted or substantially enacted by the reporting date and are expected to apply when the related deferred income tax asset is realised or the deferred income tax liability is settled.
The principal temporary differences arise from depreciation of property and equipment, revaluation of certain fi nancial assets and liabilities and tax losses carried forward. Deferred tax assets are raised only to the extent that it is probable that future taxable income will be available against which the unused tax losses can be utilised.
A deferred tax asset is raised on unutilised STC credits, to the extent that these will be used in future years.
1.9 Property and equipmentLand and buildings comprise a sectional title development right and a warehouse. All property and equipment is stated at historical cost less depreciation. Historical cost includes expenditure that is directly attributable to the acquisition of the items.
Subsequent costs are included in the assets’ carrying amount or are recognised as a separate asset, as appropriate, only when it is probable that future economic benefi ts associated with the item will fl ow to the group and the cost of the item can be measured reliably. All other repairs and maintenance costs are charged to the income statement during the fi nancial period in which they were incurred.
Land is not depreciated. Depreciation on other assets is calculated, using the straight-line method to allocate their cost to their residual values over their estimated useful lives, as follows:
• Banking application hardware 3 – 5 years• Automated teller machines 8 years• Computer equipment 3 – 5 years• Offi ce equipment 5 – 8 years• Motor vehicles 5 years• Buildings 25 years
The assets’ residual values and useful lives are annually reviewed and adjusted, if appropriate.
Gains and losses on disposals are determined by comparing proceeds with carrying amounts. These are included in the income statement.
1.10 Intangible assets 1.10.1 Goodwill
Goodwill represents the excess of the cost of an acquisition over the fair value of the group’s share of the net identifi able assets of the acquired subsidiary at the date of acquisition. Goodwill on acquisitions of subsidiaries is included in ‘intangible assets’. Goodwill is tested annually for impairment and carried at cost less accumulated impairment losses. Gains and losses on the disposal of an entity include the carrying amount of goodwill relating to the entity sold. Goodwill is allocated to cash-generating units for the purpose of impairment testing.
1.10.2 Computer software Acquired computer software licences are capitalised on the basis of the costs incurred to acquire and bring to use the specifi c software. Computer software is carried at cost less accumulated amortisation and impairment losses.
Costs associated with maintaining computer software programmes are recognised as an expense as incurred. Costs that are directly associated with the production of identifi able and unique software products
controlled by the group, and that will probably generate economic benefi ts exceeding costs beyond one year, are recognised as intangible assets. Direct costs include software development employee costs and an appropriate portion of relevant overheads.
Amortisation on computer software is calculated using the straight-line method to allocate their cost to their residual values over their estimated useful lives, as follows:
• Banking application software 6 years• Server software 3 – 5 years• Desktop application software 2 – 4 years
The assets’ useful lives are annually reviewed and adjusted where appropriate.
1.11 Impairment of non-fi nancial assets Equipment and other non-fi nancial assets (for example property and computer software) are reviewed for impairment losses whenever events or changes in circumstances indicate that the carrying amount may not be recoverable. An impairment loss is recognised for the amount by which the carrying amount of the asset exceeds its recoverable amount, which is the higher of an asset’s net selling price and value in use. For the purpose of assessing impairment, assets are grouped at the lowest levels for which there are separately identifi able cash fl ows (cash-generating units). Non-fi nancial assets, other than goodwill, that suffered impairment are reviewed for possible reversal of the impairment at each reporting date.
1.12 ProvisionsProvisions for expenses are obligations of the group for which there is uncertainty as to the timing or amount of the outfl ow of economic resources. Provisions are recognised when:
• the group has a present legal or constructive obligation as a result of past events;• it is probable that an outfl ow of resources embodying economic benefi ts will be required to settle the obligation;
and• a reliable estimate of the amount of the obligation can be made.
Where there are a number of similar obligations, the likelihood that an outfl ow will be required in settlement is determined by considering the class of obligations as a whole. A provision is recognised even if the likelihood of an outfl ow with respect to any one item included in the same class of obligations may be small.
Provisions are measured at the present value of the expenditures expected to be required to settle the obligation using a pre-tax rate that refl ects current market assessments of the time value of money and the risks specifi c to the obligation. The increase in the provision due to passage of time is recognised as interest expense.
1.13 Share capital 1.13.1 Categories of share capital
Authorised share capital consists of: • ordinary shares, and • non-redeemable, non-cumulative, non-participating preference shares.
1.13.2 Share issue costsIncremental costs directly attributable to the issue of new shares or options or to the acquisition of a business are shown in equity as a deduction, net of tax, from the proceeds.
1.13.3 Dividends declaredDividends on ordinary shares and preference shares are recognised in equity in the period in which they have been approved by the group’s directors. Dividends for the year that are declared after the balance sheet date are dealt with in the directors’ report.

132 Capitec Bank Holdings Limited Integrated Report 2012 133
1.13.4 Treasury sharesWhere the company or other members of the group purchase the company’s equity share capital, the consideration paid is deducted from total shareholders’ equity as shares held by the group until they are cancelled or sold.
1.13.5. Unissued sharesAn amount of 5% (2011: 5%) of the issued ordinary share capital and all unissued non-redeemable, non-cumulative, non-participating preference shares are under the control of the directors until the next annual general meeting.
1.14 Employee benefi ts 1.14.1 Pension obligations
The group contributes to a provident fund classifi ed as a defi ned-contribution fund.
For defi ned-contribution plans, the group pays fi xed contributions to privately administered provident fund plans on a contractual basis. The group has no further payment obligations once the contributions have been paid. The contributions are recognised as employee benefi t expenses when they are due. Prepaid contributions are recognised as an asset to the extent that a cash refund or a reduction in the future payments is available.
1.14.2 Share-based compensationThe group operates an equity-settled, share-based compensation plan. The fair value of the employee services received in exchange for the grant of the options is recognised as an expense. The total amount to be expensed over the vesting period is determined by reference to the fair value of the options on grant date, excluding the impact of any non-market vesting conditions (for example, profi tability and sales growth targets). Non-market vesting conditions are included in assumptions about the number of options that are expected to become exercisable. At each balance sheet date, the entity revises its estimates of the number of options that are expected to vest. It recognises the impact of the revision of original estimates, if any, in the income statement, and a corresponding adjustment to equity over the remaining vesting period.
The group also has cash-settled, share-based compensation plans. The fair value of the liability incurred for employee services received is recognised as an expense over the vesting period. Until the liability is settled, the group remeasures the fair value of the liability at each reporting date and at the date of settlement, with any changes in value recognised in profi t or loss for the period.
1.14.3 Performance incentive schemeThe group operates a performance incentive scheme for senior and other employees, who are seen to be in leadership roles critical to the current and future success of the group’s business,
The amount recognised as a liability is the present value of the obligation at the end of the reporting period. The rate used to discount the obligation is determined by reference to market yields at the end of the reporting period on government bonds. The currency and term of the bonds is consistent with the currency and term of the obligation.
The employee service cost is recognised in the income statement as the obligation arises.
1.15 Foreign currency translation 1.15.1 Functional and presentation currency
Items included in the fi nancial statements of each of the group’s entities are measured using the currency of the primary economic environment in which the entity operates (“the functional currency”). The consolidated fi nancial statements are presented in South African rands (“rand”), which is the group, and company’s functional and presentation currency. The fi nancial statements of all the subsidiaries are also presented in rand, which is their functional and presentation currency.
1.15.2 Transactions and balancesForeign currency transactions are translated into the functional currency using the exchange rates prevailing at the dates of the transactions. Foreign exchange gains and losses resulting from the settlement of such transactions and from the translation at year-end exchange rates of monetary assets and liabilities denominated in foreign currencies are recognised in the income statement. Translation differences on non-monetary items are reported as part of the fair value gain or loss.
1.16 Revenue recognition 1.16.1 Interest income and expense
Interest income and expense are recognised in the income statement for all instruments measured at amortised cost and at fair value through profi t or loss using the effective interest rate method.
The effective interest rate method is a method of calculating the amortised cost of a fi nancial asset or a fi nancial liability and of allocating the interest income or interest expense over the relevant period. The effective interest rate is the rate that exactly discounts estimated future cash payments or receipts through the expected life of the fi nancial instrument or, when appropriate, a shorter period to the net carrying amount of the fi nancial asset or fi nancial liability. When calculating the effective interest rate, the group estimates cash fl ows considering all contractual terms of the fi nancial instrument (for example, prepayment options) but does not consider future credit losses. The calculation includes all fees and points paid or received between parties to the contract that are an integral part of the effective interest rate.
Once a fi nancial asset or a group of similar fi nancial assets has been written down as a result of an impairment loss, interest income is recognised using the rate of interest used to discount the future cash fl ows for the purpose of measuring the impairment loss.
1.16.2 Fee incomeTransaction fees are recognised on an accrual basis in the period in which the services are rendered. The portion of loan origination fees that relate to the creation of a fi nancial asset together with the related incremental transaction costs are amortised over the term of the loan on an effective yield basis. Transaction and service-related loan fee income is recognised when the services are provided.
1.16.3 Non-banking salesNon-banking sales represent the net sales value of all products sold to third parties after the deduction of trade discounts. Revenue is recognised when the risks and rewards of ownership have been transferred to the customer. Revenue is recognised net of value added tax.
1.16.4 Dividend incomeDividend income is recognised in the income statement when the entity’s right to receive payment is established. Dividends on listed preference shares accrue on a day-to-day basis based on the terms of underlying instruments.
1.17 Segment reportingOperating segments are reported in a manner consistent with the internal reporting provided to the chief operating decision-maker. The chief operating decision-maker, who is responsible for allocating resources and assessing the performance of the operating segments, has been identifi ed as the executive management committee that makes strategic decisions.
1.18 Leases 1.18.1 Where a group company is the lessee
Leases where a signifi cant portion of the risks and rewards of ownership are retained by the lessor are classifi ed as operating leases. Payments made under operating leases, net of any incentives received from the lessor, are charged to the income statement on a straight-line basis over the period of the lease.

134 Capitec Bank Holdings Limited Integrated Report 2012 135
When an operating lease is terminated before the lease period has expired, any penalty payment to the lessor is recognised as an expense in the period in which termination takes place.
1.18.2 Where a group company is the lessorRental from the subletting of leased premises is recognised on a straight-line basis over the lease term. Subletting is incidental to the group’s occupation of certain properties.
1.19 Standards, interpretations and amendments to published standards applied for the fi rst time during the current fi nancial year Amendment to IAS 24 Related party disclosures (effective 1 March 2011)
• Improvements to IFRSs 2010 issued in May 2010• IAS 27 Consolidated and separate fi nancial statements (effective 1 March 2011)
The implications of these statements have no impact on measurements of assets and liabilities at the previous year-end. Comparatives are provided for new disclosures where required in terms of the standards.
1.20 Standards, interpretations and amendments to published standards that are not yet effective Certain new standards, amendments and interpretations to existing standards have been published that are mandatory for the group’s accounting periods beginning on or after 1 March 2012 or later periods but which the group has not early adopted, as follows:
• IFRS 9 Financial instruments (effective 1 March 2013)• Amendments to IAS 12 Deferred tax: recovery of underlying assets (effective 1 March 2012)• IFRS 10 Consolidated fi nancial statements (effective 1 March 2013)• IFRS 11 Joint arrangements (effective 1 March 2013)• IFRS 12 Disclosure of interests in other entities (effective 1 March 2013)• IFRS 13 Fair value measurement (effective 1 March 2013)• Amendments to IAS 1 Presentation of items of other comprehensive income (effective 1 March 2013)• Amendments to IAS 19 Employee benefi ts (effective 1 March 2013)• Revised IAS 27 Separate fi nancial statements (effective 1 March 2013)• Revised IAS 28 Investments in associates and joint ventures (effective 1 March 2013)• Amendments to IFRS 7 Financial instruments disclosures – transfer of fi nancial assets (effective 1 March 2012)• Amendment to IFRS 7 Financial instruments disclosure (effective 1 March 2013)
Management is in the process of assessing the impact of these amendments and standards on the reported results of the group and the company.
2. Critical accounting estimates and judgements in applyingaccounting policies
In conformity with IFRS, the preparation of fi nancial statements for the group requires management to make estimates and assumptions that affect the reported amounts of assets, liabilities, revenues and expenses, and the disclosure of contingent assets and liabilities in the fi nancial statements and accompanying notes. Although these estimates are based on management’s knowledge of current events and actions that may be undertaken in the future, actual results may ultimately differ from estimates.
The estimates and assumptions that have a signifi cant risk of causing material adjustment to the carrying amounts of assets and liabilities within the next fi nancial year are discussed below.
Impairment losses on loans and advances The group reviews its loan portfolio to assess impairment at least on a monthly basis. In determining whether an impairment loss should be recorded in the income statement, the group makes judgements as to whether there is any observable data indicating that there is a measurable decrease in the estimated future cash fl ows froma portfolio of loans before the decrease can be identifi ed with an individual loan in that portfolio. This evidence may include observable data indicating that there has been an adverse change in the payment status of borrowers ina group, or national or local economic conditions that correlate with defaults on assets in the group. Management uses estimates based on historical loss experience for assets with credit risk characteristics and objective evidence of impairment similar to those in the portfolio when scheduling its future cash fl ows. The methodology and assumptions used for estimating both the amount and timing of future cash fl ows are reviewed regularly to reduce any differences between loss estimates and actual loss experience. Refer to note 1.4 for the accounting policy regarding the impairment of advances.
An increase or decrease of 5% of the estimated default rates will have the following impact on the impairment allowance.
2012 2011
Expected default rates R’000 R’000
Increase by 5% 23 966 16 548
Decrease by 5% (23 934) (16 514)
Property and equipmentProperty and equipment are depreciated over their useful lives, taking into account their residual values at the end of their useful lives. The residual values and useful lives are based on industry knowledge and past experience with similar assets. Refer to note 1.9 for the accounting policy regarding property and equipment.
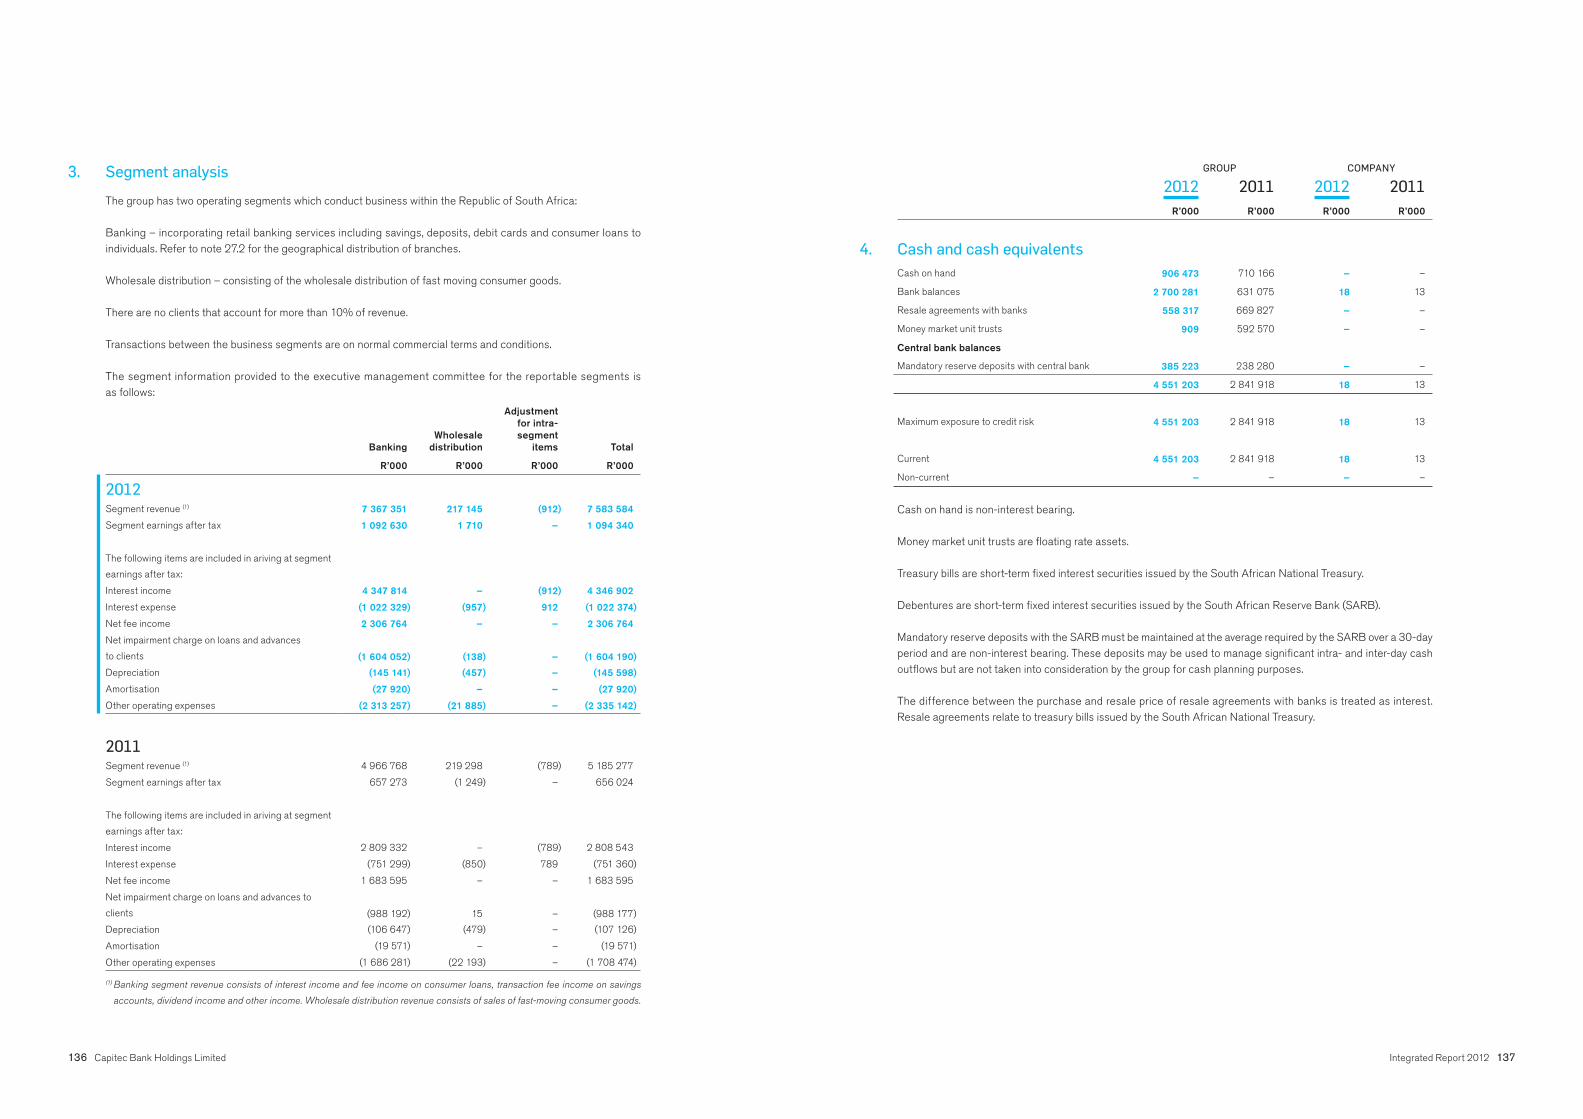
136 Capitec Bank Holdings Limited Integrated Report 2012 137
3. Segment analysis
The group has two operating segments which conduct business within the Republic of South Africa:
Banking – incorporating retail banking services including savings, deposits, debit cards and consumer loans to individuals. Refer to note 27.2 for the geographical distribution of branches.
Wholesale distribution – consisting of the wholesale distribution of fast moving consumer goods.
There are no clients that account for more than 10% of revenue.
Transactions between the business segments are on normal commercial terms and conditions.
The segment information provided to the executive management committee for the reportable segments isas follows:
Banking Wholesale distribution
Adjustment for intra-segment
items Total
R’000 R’000 R’000 R’000
2012
Segment revenue (1) 7 367 351 217 145 (912) 7 583 584
Segment earnings after tax 1 092 630 1 710 – 1 094 340
The following items are included in ariving at segment
earnings after tax:
Interest income 4 347 814 – (912) 4 346 902
Interest expense (1 022 329) (957) 912 (1 022 374)
Net fee income 2 306 764 – – 2 306 764
Net impairment charge on loans and advances
to clients (1 604 052) (138) – (1 604 190)
Depreciation (145 141) (457) – (145 598)
Amortisation (27 920) – – (27 920)
Other operating expenses (2 313 257) (21 885) – (2 335 142)
2011Segment revenue (1) 4 966 768 219 298 (789) 5 185 277
Segment earnings after tax 657 273 (1 249) – 656 024
The following items are included in ariving at segment
earnings after tax:
Interest income 2 809 332 – (789) 2 808 543
Interest expense (751 299) (850) 789 (751 360)
Net fee income 1 683 595 – – 1 683 595
Net impairment charge on loans and advances to
clients (988 192) 15 – (988 177)
Depreciation (106 647) (479) – (107 126)
Amortisation (19 571) – – (19 571)
Other operating expenses (1 686 281) (22 193) – (1 708 474)
(1) Banking segment revenue consists of interest income and fee income on consumer loans, transaction fee income on savings
accounts, dividend income and other income. Wholesale distribution revenue consists of sales of fast-moving consumer goods.
GROUP COMPANY
2012 2011 2012 2011
R’000 R’000 R’000 R’000
4. Cash and cash equivalents
Cash on hand 906 473 710 166 – –
Bank balances 2 700 281 631 075 18 13
Resale agreements with banks 558 317 669 827 – –
Money market unit trusts 909 592 570 – –
Central bank balances
Mandatory reserve deposits with central bank 385 223 238 280 – –
4 551 203 2 841 918 18 13
Maximum exposure to credit risk 4 551 203 2 841 918 18 13
Current 4 551 203 2 841 918 18 13
Non-current – – – –
Cash on hand is non-interest bearing. Money market unit trusts are fl oating rate assets.
Treasury bills are short-term fi xed interest securities issued by the South African National Treasury.
Debentures are short-term fi xed interest securities issued by the South African Reserve Bank (SARB).
Mandatory reserve deposits with the SARB must be maintained at the average required by the SARB over a 30-day period and are non-interest bearing. These deposits may be used to manage signifi cant intra- and inter-day cash outfl ows but are not taken into consideration by the group for cash planning purposes.
The difference between the purchase and resale price of resale agreements with banks is treated as interest. Resale agreements relate to treasury bills issued by the South African National Treasury.

138 Capitec Bank Holdings Limited Integrated Report 2012 139
5. Investments designated at fair value
Unlisted equity investments at fair value
Amortised cost 33 3 125 – –
Cumulative fair value adjustment – other market risk 16 302 13 617 – –
Balance at the beginning of the year 16 335 16 742 – –
(Disposals)/ additions (33) (3 092) – –
Exchange rate risk 3 682 (1 605) – –
Other market risk 8 944 1 190 – –
Realised on disposals (28 928) 3 100 – –
Fair value adjustment (16 302) 2 685 – –
Amortised cost – 33 – –
Cumulative fair value adjustment – other market risk – 16 302 – –
Balance at the end of the year – 16 335 – –
Interest-bearing debt instruments(1)
Amortised cost 972 340 1 289 773 – –
Cumulative fair value adjustment (11) (217) – –
Balance at the beginning of the year 972 329 1 289 556 – –
(Disposals)/additions 227 059 (317 433) – –
Interest rate risk (555) 206 – –
Credit risk – – –
Fair value adjustment (555) 206 – –
Amortised cost 1 199 399 972 340 – –
Cumulative fair value adjustment (566) (11) –
Balance at the end of the year 1 198 833 972 329 – –
Total investments at fair value 1 198 833 988 664 – –
Credit risk for fi nancial assets designated at fair value (2):
Maximum exposure to credit risk 1 198 833 972 329 – –
Current 1 198 833 988 664 – –
Non-current – – – –
The methods and assumptions applied to calculate the fair value changes due to interest rate risk and exchange rate risk are set out in notes 27.3 and 27.4. Fair value adjustments are not attributable to changes in credit risk during the year, and cumulatively. The directors’ valuation of investments at fair value through profi t or loss is equal to the assets’ carrying value. This group of fi nancial assets and their performances are managed and evaluated on a fair value basis in accordance with a documented risk management strategy. Information about this group is provided internally on that basis to the management committee and board of directors. (1) Interest-bearing instruments comprise unlisted instruments with a maturity greater than three months from date of acquisition.
This fi gure comprises government instruments (2011: government instruments).(2) Exposure to credit risk arises from the interest-bearing debt instruments only.
GROUP COMPANY
2012 2011 2012 2011
R’000 R’000 R’000 R’000
6. Loans and advances to clients
Maturity analysis of loans and advances
Demand to one month 1 105 723 895 717 – –
One to three months 1 184 056 953 143 – –
Three months to one year 4 464 590 3 419 393 – –
More than one year 12 145 976 6 017 098 – –
Total 18 900 345 11 285 351 – –
Deferred loan fee income (492 071) (369 159) – –
Gross loans and advances 18 408 274 10 916 192 – –
Allowance for impaired loans and advances (1 545 246) (844 726) – –
Net amount (1) (2) 16 863 028 10 071 466 – –
Credit quality of performing loans and advances (3)
Top two grades of the internal rating system 7 678 686 1 125 112
Percentage of total performing loans 44% 11%
Bottom two grades of the internal rating system 204 987 51 478
Percentage of total performing loans 1.2% 0.5%
Impairment of loans and advances
Gross 17 476 532 10 290 361 – –
Impairment (1 015 181) (512 082) – –
Not past due 16 461 351 9 778 279 – –
Gross 931 742 625 831 – –
Impairment (530 065) (332 644) – –
Past due 401 677 293 187 – –
Net amount 16 863 028 10 071 466 – –
Past due loans and advances are in arrears from one day to three months and not handed over. All past due loans and advances are impaired. Loans and advances not past due on which an impairment allowance has been raised are treated as fully performing loans and advances.
Included in loans and advances is an investment of R23.8 million (2011: R22.2 million) in cumulative preference shares bearing interest at 80% of the prime interest rate with a redemption date of 15 February 2014.
The remainder of loans and advances comprise unsecured loans to individuals at fi xed rates.
(1) Loans and advances are unsecured and the balance constitutes the maximum exposure to credit risk.
(2) Included within loans and advances is related accrued interest receivable of R101.4 million (2011: R58.6 million).
(3) A customer rating system of 7 external classifi cations and 9 internal classifi cations is utilised, which in combination with
a qualitative category grades a customer into 11 possible scores of which the higher qualifi es a customer for a lower-risk product
or lower score limits a customer to higher-risk products.
GROUP COMPANY
2012 2011 2012 2011
R’000 R’000 R’000 R’000

140 Capitec Bank Holdings Limited Integrated Report 2012 141
6. Loans and advances to clients (continued)
Movement on provision for impaired advances
Unidentifi ed losses 512 082 182 171 – –
Identifi ed losses 332 644 200 162 – –
Opening balance 844 726 382 333 – –
Unidentifi ed losses 503 099 329 911 – –
Identifi ed losses 197 421 132 482 – –
Movement 700 520 462 393 – –
Unidentifi ed losses 1 015 181 512 082 – –
Identifi ed losses 530 065 332 644 – –
Closing balance 1 545 246 844 726 – –
Ageing of impaired advances
< 60 days 828 008 558 682 – –
60 – 90 days 103 734 67 149 – –
931 742 625 831
Exposure to credit risk:
Loans and advances to clients 18 900 345 11 285 351 – –
Conditionally revocable retail loan commitments 603 816 549 200 – –
Maximum exposure to credit risk 19 504 161 11 834 551 – –
Conditionally revocable retail loan commitments totalling R603.8 million (2011: R549.2 million) are included in the credit risk analysis above. The commitments are a result of undrawn loan amounts. The loans are advanced witha contractual repayment period of one month or less.
The group’s contractual commitment is revocable should a client not meet their contractual obligations or where the group has determined that the client’s credit risk profi le has changed. A total of 18.3% of these commitments is expected to be drawn down within one month. As these are one-month loans, repayment of any future drawdowns must also occur within the month.
7. Inventory
Finished goods 42 079 30 847 – –
42 079 30 847 – –
Current 42 079 30 847 – –
Non-current – – – –
The cost of obsolete inventories recognised as an expense and included in cost of sales amounted to Nil(2011: R124 496).
GROUP COMPANY
2012 2011 2012 2011
R’000 R’000 R’000 R’000
GROUP COMPANY
2012 2011 2012 2011
R’000 R’000 R’000 R’000
8. Other receivables
Rental deposits 2 356 2 931 – –
Accrued income 28 270 13 967 9 657 9 355
Receivables at fair value through profi t or loss (Note 27.10) – 4 662 – –
Derivative (Note 40) 263 – – –
Prepayments 26 856 26 617 – –
57 745 48 177 9 657 9 355
Current 55 589 46 041 9 657 9 355
Non-current 2 156 2 136 – –
9. Interest in subsidiaries
Investment in unlisted subsidiaries at cost – – 3 187 311 2 191 362
Loans to subsidiaries – – 16 350 5 078
– – 3 203 661 2 196 440
Loans to subsidiaries are interest-free and have no fi xed repayment terms. Loans are managed as part of the investment in subsidiaries.
All holdings are in the ordinary and preference share capital of the subsidiary concerned.
Name Domicile Holding % Nature of business
Capitec Bank Limited South Africa 100% BankingKeynes Rational Corporate Services (Pty) Limited South Africa 100% DormantCapitec Properties (Pty) Limited South Africa 100% Property Keymatrix (Pty) Limited South Africa 100% DormantKey Distributors (Pty) Limited South Africa 75% Wholesale distributionCapitec Bank Holdings Share Trust South Africa – Share incentive trustCapitec Bank Group Employee Empowerment Trust South Africa – Employee empowerment trust

142 Capitec Bank Holdings Limited Integrated Report 2012 143
11. Intangible assets
Computer software
Cost 98 294 70 800 – –
Accumulated amortisation (63 937) (48 589) – –
Opening net book value 34 357 22 211 – –
Additions 65 873 32 193 – –
Scrappings (3 048) (476) – –
Amortisation charge (27 920) (19 571) – –
Net book value at the end of the year 69 262 34 357 – –
Cost 148 574 98 294 – –
Accumulated amortisation (79 312) (63 937) – –
Net book value at the end of the year 69 262 34 357 – –
Current – – – –
Non-current 69 262 34 357 – –
Computer software substantially consists of the primary banking application system.
12. Deferred income tax assets
Deferred income taxes are calculated on all temporary differences under the liability method using an effective tax rate of 28% (2011: 28%). The deferred tax assets are stated at the rate at which the assets are expected to be realised.
The movement on the deferred income tax account
is as follows:
Balance at the beginning of the year 48 903 19 183 – –
Cash fl ow hedge (602) (4 811) – –
Income statement charge 185 941 34 531 – –
Balance at the end of the year 234 242 48 903 – –
Deferred income tax assets are attributable to the
following items:
Provisions and accruals 261 640 70 366 – –
Cash fl ow hedge 747 1 349 – –
Capital allowances (21 787) (15 929) – –
Prepayments (6 358) (6 883) – –
234 242 48 903 – –
Current 135 854 343 – –
Non-current 98 388 48 560 – –
GROUP COMPANY
2012 2011 2012 2011
R’000 R’000 R’000 R’000
10. Property and equipment
Land and buildings(1)
Computer Equipment
Offi ce equipment
and vehicles Total
GROUP R’000 R’000 R’000 R’000
2012Opening net book value 32 846 157 084 185 255 375 185
Additions 45 180 285 135 036 315 366
Disposals – (1 300) (532) (1 832)
Depreciation charge (55) (79 249) (66 294) (145 598)
Net book value at the end of the year 32 836 256 820 253 465 543 121
Cost 33 184 473 594 547 905 1 054 683
Accumulated depreciation (348) (216 774) 294 440 (511 562)
Net book value at the end of the year 32 836 256 820 253 465 543 121
Current – – – –
Non-current 32 836 256 820 253 465 543 121
2011Cost 33 139 236 948 331 588 601 675
Accumulated depreciation (240) (139 791) (180 034) (320 065)
Opening net book value 32 899 97 157 151 554 281 610
Additions – 113 163 90 007 203 170
Disposals – (1 252) (1 217) (2 469)
Depreciation charge (53) (51 984) (55 089) (107 126)
Net book value at the end of the year 32 846 157 084 185 255 375 185
Cost 33 139 332 568 416 505 782 212
Accumulated depreciation (293) (175 484) (231 250) (407 027)
Net book value at the end of the year 32 846 157 084 185 255 375 185
Current – – – –
Non-current 32 846 157 084 185 255 375 185
(1) Land and buildings with a book value of R1.5 million (2011: R1.6 million) are encumbered in terms of a mortgage bond (note 13).

144 Capitec Bank Holdings Limited Integrated Report 2012 145
13. Loans and deposits at amortised cost
By maturity
Within one month 6 911 390 4 414 990 – –
One to three months 932 963 955 228 – –
Three months to one year 3 932 021 1 368 723 – –
More than one year 5 915 688 3 710 942 – –
17 692 062 10 449 883 – –
By nature
Retail savings 6 348 206 3 933 098 – –
Retail fi xed deposits 4 014 621 2 315 659 – –
Wholesale(1) 1 297 275 928 293 – –
Subordinated debt – unlisted bonds(2) 499 254 454 646 – –
Subordinated debt – listed bonds(3) 591 533 - – –
Listed senior bonds(4) 2 775 944 1 993 708 – –
Other unlisted negotiable instruments 1 998 468 577 067 – –
Reserve Bank settlement balance 166 761 247 412 – –
17 692 062 10 449 883 – –
Amounts payable on maturity of the funding 20 547 386 12 308 648 – –
The difference between the amounts payable on maturity and the loans and deposits at amortised cost relates to future fi nance cost. (1) Wholesale deposits include a mortgage bond of R0.4 million (2011: R0.6 million) that is secured as stated in note 10. (2) Subordinated unlisted bonds comprise 12-year fl oating rate bonds. The debt is callable by the bank after seven years. Bonds
in the amount of R250 million bear interest at a rate of 3-month JIBAR plus 6.75% for the fi rst seven years and 3-month JIBAR
plus 8.00% for the last fi ve years if not called. Bonds in the amount to R200 million bear interest at a rate of 3-month JIBAR plus
5.75% for the fi rst seven years and 3-month JIBAR plus 7.00% for the last fi ve years if not called.(3) Subordinated listed bonds comprise a seven-year fi xed rate bond in the amount of R250 million that bears interest at a rate of
3.91% over the R204 government bond, a seven-year fl oating rate bond in the amount of R150 million that bears interest at a
rate of 4.50% over the 3-month JIBAR rate and a seven-year fi xed rate bond in the amount of R175 million that bears interest at
a rate of 4.16% over the R204 government bond.(4) Listed senior bonds consist of domestic medium-term notes. Domestic medium-term notes (nominal value R1 150 million)
issued at variable rates are hedged through interest rate swap agreements as set out in notes 17 and 41.
All deposits, with the exception of the mortgage bond (refer (1)), are unsecured.
GROUP COMPANY
2012 2011 2012 2011
R’000 R’000 R’000 R’000
14. Other liabilities
Trade payables 222 663 163 996 30 48
Dividends payable 10 273 10 485 10 273 10 485
Accruals 264 930 154 200 – –
Share appreciation rights (Note 38) 217 362 154 735 – –
Derivatives (Note 40 and 41) 3 321 6 269 – –
718 549 489 685 10 303 10 533
Current 493 739 312 046 10 303 10 533
Non-current 224 810 177 639 – –
15. Provisions
Performance incentive scheme
Balance at the beginning of the year 14 403 7 117 – –
Addition 19 705 10 923 – –
Used during the year (9 110) (3 637) – –
Balance at the end of the year 24 998 14 403 – –
Current — — – –
Non-current 24 998 14 403 – –
Senior management qualify for a cash-settled performance bonus scheme. The scheme rewards managers based on the growth in headline earnings per share and, in order to foster a long-term approach by management, the bonus is paid out over a three-year period. The bonuses to be paid out in the 2014, 2015 and 2016 fi nancial years are included in provisions. The bonus to be paid in the 2013 fi nancial year is included in accruals.
GROUP COMPANY
2012 2011 2012 2011
R’000 R’000 R’000 R’000
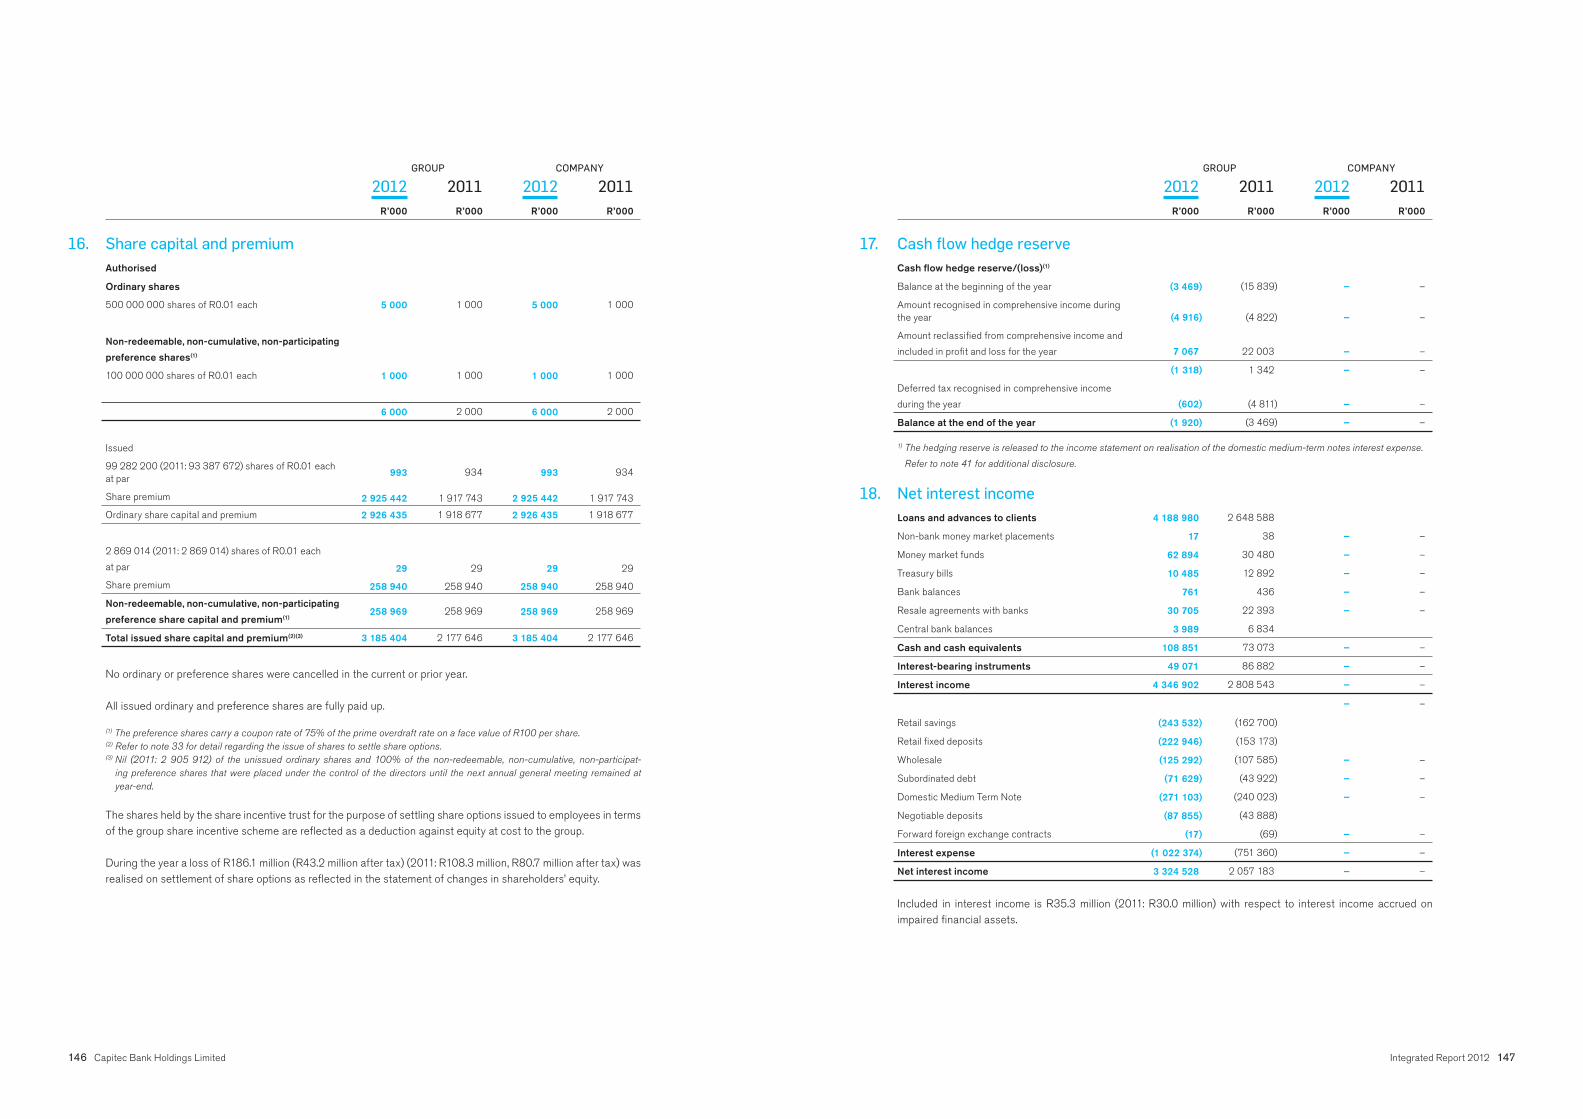
146 Capitec Bank Holdings Limited Integrated Report 2012 147
16. Share capital and premium
Authorised
Ordinary shares
500 000 000 shares of R0.01 each 5 000 1 000 5 000 1 000
Non-redeemable, non-cumulative, non-participating
preference shares(1)
100 000 000 shares of R0.01 each 1 000 1 000 1 000 1 000
6 000 2 000 6 000 2 000
Issued
99 282 200 (2011: 93 387 672) shares of R0.01 each at par
993 934 993 934
Share premium 2 925 442 1 917 743 2 925 442 1 917 743
Ordinary share capital and premium 2 926 435 1 918 677 2 926 435 1 918 677
2 869 014 (2011: 2 869 014) shares of R0.01 each
at par 29 29 29 29
Share premium 258 940 258 940 258 940 258 940
Non-redeemable, non-cumulative, non-participating
preference share capital and premium(1) 258 969 258 969 258 969 258 969
Total issued share capital and premium(2)(3) 3 185 404 2 177 646 3 185 404 2 177 646
No ordinary or preference shares were cancelled in the current or prior year.
All issued ordinary and preference shares are fully paid up.
(1) The preference shares carry a coupon rate of 75% of the prime overdraft rate on a face value of R100 per share.(2) Refer to note 33 for detail regarding the issue of shares to settle share options. (3) Nil (2011: 2 905 912) of the unissued ordinary shares and 100% of the non-redeemable, non-cumulative, non-participat-
ing preference shares that were placed under the control of the directors until the next annual general meeting remained at
year-end.
The shares held by the share incentive trust for the purpose of settling share options issued to employees in terms of the group share incentive scheme are refl ected as a deduction against equity at cost to the group.
During the year a loss of R186.1 million (R43.2 million after tax) (2011: R108.3 million, R80.7 million after tax) was realised on settlement of share options as refl ected in the statement of changes in shareholders’ equity.
GROUP COMPANY
2012 2011 2012 2011
R’000 R’000 R’000 R’000
17. Cash fl ow hedge reserve
Cash fl ow hedge reserve/(loss)(1)
Balance at the beginning of the year (3 469) (15 839) – –
Amount recognised in comprehensive income during the year (4 916) (4 822) – –
Amount reclassifi ed from comprehensive income and
included in profi t and loss for the year 7 067 22 003 – –
(1 318) 1 342 – –
Deferred tax recognised in comprehensive income
during the year (602) (4 811) – –
Balance at the end of the year (1 920) (3 469) – –
1) The hedging reserve is released to the income statement on realisation of the domestic medium-term notes interest expense.
Refer to note 41 for additional disclosure.
18. Net interest income
Loans and advances to clients 4 188 980 2 648 588
Non-bank money market placements 17 38 – –
Money market funds 62 894 30 480 – –
Treasury bills 10 485 12 892 – –
Bank balances 761 436 – –
Resale agreements with banks 30 705 22 393 – –
Central bank balances 3 989 6 834
Cash and cash equivalents 108 851 73 073 – –
Interest-bearing instruments 49 071 86 882 – –
Interest income 4 346 902 2 808 543 – –
– –
Retail savings (243 532) (162 700)
Retail fi xed deposits (222 946) (153 173)
Wholesale (125 292) (107 585) – –
Subordinated debt (71 629) (43 922) – –
Domestic Medium Term Note (271 103) (240 023) – –
Negotiable deposits (87 855) (43 888)
Forward foreign exchange contracts (17) (69) – –
Interest expense (1 022 374) (751 360) – –
Net interest income 3 324 528 2 057 183 – –
Included in interest income is R35.3 million (2011: R30.0 million) with respect to interest income accrued on impaired fi nancial assets.
GROUP COMPANY
2012 2011 2012 2011
R’000 R’000 R’000 R’000

148 Capitec Bank Holdings Limited Integrated Report 2012 149
19. Dividend income
Ordinary dividends – – 317 939 201 882
Preference dividends – – 19 419 15 754
Subsidiaries – – 337 358 217 636
Investments at fair value through profi t or loss 1 532 571 – –
1 532 571 337 358 217 636
20. Net impairment charge on loans and advances to clients
Bad debts 1 079 237 626 199 – –
Movement in impairment allowance 700 520 462 393 – –
Bad debts recovered (175 567) (100 415) – –
Net impairment charge 1 604 190 988 177 – –
21. Net movement in fi nancial instruments held at fair value through profi t or loss
Change in fair value due to changes in credit risk – – – –
Change in fair value due to other factors 12 070 (210) – –
Financial assets held at fair value through profi t or loss 12 070 (210) – –
The methods and assumptions applied to calculate the fair value changes due to credit risk are set out inNote 27.10 and credit risk mitigation techniques are set out in Note 27.1.
GROUP COMPANY
2012 2011 2012 2011
R’000 R’000 R’000 R’000
GROUP COMPANY
2012 2011 2012 2011
R’000 R’000 R’000 R’000
22. Operating profi t before tax
The following items have been included in arriving at operating profi t before tax:
Loss/(Profi t) on disposal of equipment 596 (638) – –
Loss on scrapping of intangibles 3 048 476 – –
Depreciation on fi xed assets 145 598 107 126 – –
Amortisation of computer software 27 920 19 571 – –
Foreign exchange (gains)/losses (1) (3) (1) – –
Operating lease rentalsLand and buildings 163 588 127 054 – –
Offi ce equipment 3 160 3 076 – –
166 748 130 130 – –
Income from subletting (2 529) (2 086) – –
Auditors’ remunerationAudit fees – current year 2 681 2 622 – –
Audit fees – prior year (over)/underprovision 166 (584) – –
Other services 228 205 – 85
Less: Other services accounted for in equity – (85) – (85)
3 075 2 158 – –
Directors’ emoluments (included in employee costs below)Executive
Salaries 13 044 10 876 – –
Fringe benefi ts 475 420 – –
Bonuses 1 916 4 169 – –
Share appreciation rights 46 288 46 172 – –
Share options 4 482 2 236 – –
Non-executive
Fees 2 853 2 585 – –
Employee costsSalaries and wages 1 129 445 796 680 – –
Equity-settled share-based payment 11 778 11 706 – –
Cash-settled share appreciation rights 123 613 121 503 – –
Social security cost 24 522 18 181 – –
Training cost 40 488 27 729 – –
Training refund (5 287) (3 318) – –
1 324 559 972 481 – –
Consultancy fees relating to non-employees comprise:Managerial services 76 646 – –
Secretarial services 4 432 891 625 439
Technical 13 900 7 637 – –
Administrative 7 988 4 904 – –
26 396 14 078 625 439
(1) Excludes change in fair value of fi nancial assets through profi t or loss as per note 5.

150 Capitec Bank Holdings Limited Integrated Report 2012 151
23. Income tax expense
Normal company tax 615 889 297 044 – –
Secondary tax on companies 33 584 21 763 – –
Current tax 649 473 318 807 – –
Normal company tax (185 941) (34 531) – –
Deferred tax (185 941) (34 531) – –
463 532 284 276 – –
The tax on the profi t before tax differs from the theoretical amount that would arise using the basic tax rate as follows:
Profi t before tax 1 557 872 940 300 337 358 217 606
Tax calculated at a tax rate of 28% 436 204 263 284 94 460 60 930
Secondary tax on companies 33 584 21 763 – –
Adjustments for prior periods (8) (238) – –
Income not subject to tax (5 854) (613) (94 460) (60 930)
Expenses not deductible for tax purposes 128 3 – –
Withholding tax 8 6 – –
Movement in unutilised tax losses (530) 71 – –
Income tax expense 463 532 284 276 – –
Estimated tax losses at year-end available for utilisation against future taxable income 12 814 14 703 212 238
Less: Applied in raising a deferred tax asset – – – –
Net calculated tax losses carried forward 12 814 14 703 212 238
Tax relief calculated at current tax rates 4 928 5 512 59 67
The utilisation of the tax losses is dependent on suffi cient future taxable income being earned.
GROUP COMPANY
2012 2011 2012 2011
R’000 R’000 R’000 R’000
24. Earnings per share
Basic earnings per share is calculated by dividing the net profi t after tax attributable to ordinary equity holders by the weighted average number of ordinary shares in issue during the year.
Net profi t after tax 1 094 340 656 024
Preference dividend (19 419) (15 754)
Net profi t after tax attributable to ordinary shareholders 1 074 921 640 270
Weighted average number of ordinary shares in issue (thousands) 95 790 84 565
Basic earnings per share (cents) 1 122 757
Diluted earnings per share is calculated using the weighted average number of ordinary shares in issue, adjusted to assume conversion of all potentially dilutive ordinary shares. For 2012 and 2011 potentially dilutive ordinary shares consisted only of share options. A calculation is done to determine the number of shares that could have been acquired at fair value (determined as the average annual market share price of the company’s shares) based on the monetary value of the subscription rights attached to outstanding options. The number of shares calculated above is compared with the number of shares that would have been issued assuming the exercise of the share options. The difference is added to the denominator as an issue of ordinary shares for no consideration. No adjustment is made to earnings (numerator).
Net profi t used to determine diluted earnings per share 1 074 921 640 270
Weighted average number of ordinary shares in issue (thousands) 95 790 84 565
Adjustment for:
Exercise of share options 2 271 3 088
Weighted average number of ordinary shares for diluted earnings per share (thousands) 98 061 87 653
Diluted earnings per share (cents) 1 096 730
GROUP
2012 2011
R’000 R’000

152 Capitec Bank Holdings Limited Integrated Report 2012 153
25. Headline earnings per share attributable to ordinary
shareholders
Net profi t attributable to ordinary shareholders 1 074 921 640 270
Non-headline items
Loss/(Profi t) on disposal of property and equipment 596 (638)
Income tax charge – property and equipment (192) 193
Loss on scrapping of intangible assets 3 048 476
Income tax charge – intangible assets (853) (133)
Headline earnings 1 077 520 640 168
Basic headline earnings per share (cents) 1 125 757
Diluted headline earnings per share (cents) 1 099 730
GROUP
2012 2011
R’000 R’000
26. Dividend per share
The directors declared a fi nal dividend in respect of 2012 of 300 cents per share (2011: 205 cents per share) amounting to a dividend of R297.8 million (2011: R193.8 million) on 1 March 2012 .
The secondary tax on companies in respect of this dividend will amount to R29.8 million (2011 R19.1 million).
These fi nancial statements do not refl ect this dividend payable, which will be accounted for in shareholders’ equity as an appropriation of retained earnings in the year ending 28 February 2013, which is in line with recommended accounting practice.
An interim dividend of 125 cents per share (2011: 85 cents per share) was declared on 27 September 2011 and paid on 5 December 2011.
27. Financial risk management
The fi nancial instruments carried on the balance sheet are set out in note 27.9.
The group views risk management as a measure of ensuring a responsible return on shareholders’ equity. Ultimately, the board remains responsible for risk management. To assist them in performing this duty, the company is managed through a system of internal controls functioning throughout the entity so that an awareness of risk pervades every aspect of the business and is seen as the responsibility of each employee of the group. The board has established a risk and capital management committee comprising four independent non-executive directors. The committee has a formal charter in accordance with which it assists the board in reviewing the processes followed to identify risk and considering such risks in the group environment. The committee also assists the board in ensuring that risk assessment is an ongoing process and that a formal risk assessment is undertaken at least quarterly.
Subcommittees, comprising executives and senior management, have been established to deal in a structured manner with specifi c risks facing the company:• Credit committee – credit and counterparty risk.• Assets and liability committee (alco) – interest rate, market, liquidity, counterparty, currency and capital
adequacy risk.• Operational risk committee – legal, compliance, technology, operational and reputational risk.
The group operates in a structured manner with defi ned processes and procedures enabling risk assessment within a controlled environment. Accordingly, an assessment of key risks is performed with weightings on impact and probability assigned. Existing controls are assessed and, if necessary, adjusted. Thereafter reports are generated at regular intervals to enable monitoring of risk levels.

154 Capitec Bank Holdings Limited Integrated Report 2012 155
27.1 Credit risk
Loans and advances are disclosed net of impairment allowances.
RetailThe group specialises in granting personal unsecured loans. Exposure to name concentration credit risk is low due to the nature and distribution of the loan book. Exposure to systemic credit risk is regarded as being higher than normal banking activities due to the demographic credit characteristics of the client base. Measures taken by the group to limit credit risk to acceptable levels include, inter alia, the application of standard credit accept-ance procedures to assess potential clients, daily monitoring of collectible balances at both branch and head offi ce level and monitoring by the credit and risk committees. No security is obtained for loans and advances, and accordingly the entire balance as per the balance sheet is exposed to credit risk. The credit quality of loans and advances is disclosed in note 6.
The maximum capital advanced in terms of any one personal loan is R150 000 (2011: R120 000). At balance sheet date the number of outstanding loans was 1 375 508 (2011: 1 203 807).
WholesaleThe group only invests centrally managed cash surpluses in cash and liquid assets with the SARB, South African registered banking entities and money market funds of high credit standing. Potential exposure to counterparty concentration credit risk exists principally in cash and cash equivalents and interest-bearing instruments (notes 4and 5). Exposure to counterparty credit risk is controlled using alco approved limits which are monitored and enforced by the credit committee. This ensures that the fi nancial assets that the group may place with any one counterparty are limited, by reference to the long-term and short-term credit ratings assigned for that counterparty by Fitch.
At balance sheet date the international long-term credit ratings, using Fitch ratings, were as follows:
Notes AAA-A BBB Below BBB Not rated
Total carrying amount
R’000 R’000 R’000 R’000 R’000
2012Cash on hand 4 906 473 – – – 906 473 Bank balances 4 1 639 902 1 060 374 – 5 2 700 281 Resale agreements with banks 4 – 558 317 – – 558 317 Money market instruments 4 – – – 909 909 Treasury bills (< 3 months) 4 – – – – – Central bank balances 4 385 223 – – – 385 223 Treasury bills (> 3 months) 5 1 198 833 – – – 1 198 833
4 130 431 1 618 691 – 914 5 750 036
2011Cash on hand 4 710 166 – – – 710 166
Bank balances 4 267 640 363 474 – (39) 631 075
Resale agreements with banks 4 – 669 827 – – 669 827
Money market instruments 4 – – – 592 570 592 570
Treasury bills (< 3 months) 4 – – – – –
Central bank balances 4 238 280 – – – 238 280
Treasury bills (> 3 months) 5 972 329 – – – 972 329
2 188 415 1 033 301 – 592 531 3 814 247
The bank balances were with 18 institutions (2011: 10), with the maximum exposure to one institution being R1 514 million (2011: R1 096 million). This exposure consists of government instruments.
Money market instruments consist of interest accrued on money market unit trust investments that were realised during February 2012. The placements were with two institutions (2011: eight).
27.2 Geographical concentration of operations
All the group’s operating activities are situated within the Republic of South Africa.
Capitec Bank branches are distributed across South Africa and at year-end the breakdown by province wasas follows:
2012 2011
Eastern Cape 61 55
Free State 31 27
Gauteng 140 123
KwaZulu-Natal 79 74
Limpopo 40 31
Mpumalanga 41 44
North West 27 28
Northern Cape 18 13
Western Cape 70 60
507 455
27.3 Interest rate risk
The group operates within the ambit of the National Credit Act when considering interest rates on the advancing of short-term personal loans.
The current group interest profi le is uncomplicated and is monitored by the assets and liabilities committee (alco). Management aims to match the fi xed or fl oating rate nature of funding with the fi xed and fl oating rate elements of the loan book and surplus cash positions.
Financial assets and liabilities are accounted for, in the main, on an amortised cost basis and therefore the income statement is not signifi cantly impacted by fair value interest rate risk. The return on surplus cash balances placed in call money market accounts varies with changes in interbank interest rates as does the interest payable on fl oating rate bond liabilities and some retail deposits, resulting in cash fl ow interest rate risk. Floating rate bond liabilities may be hedged using interest rate swaps in order to match positions. The use of interest rate swaps mitigates the changes in cash fl ows of variable rate bonds issued by the group. The objective is to protect the group from uncontrolled changes in future interest cash fl ow commitments that arise from changes in market interest rates and re-borrowing of current balances that can have a negative impact on the value of the business and annual earnings. The use of interest rate swaps has the economic effect of converting borrowings from fl oating rates to fi xed rates. Under the terms of the interest rate swaps, the group agrees with other banking entities to exchange, quarterly, the difference between fi xed contractual rates and fl oating rate interest amounts calculated by reference to the agreed notional amounts. The group has discretion over the rates offered on its demand savings deposits. Retail advances are only offered in fi xed rate terms. The maturity breakdown of the advances book is set out in note 6 and note 27.6.
Alco meets monthly and considers the results of management’s analysis of the impact of interest rates on the group which includes, inter alia, the results of various models and the impact of interest rate strategy on the gross margin.

156 Capitec Bank Holdings Limited Integrated Report 2012 157
27.3 Interest rate risk (continued)
The sensitivity analysis presented below is a run-off analysis.
The sensitivity analysis below refl ects the impact of a 200 basis point increase or decrease in interest rates:• Immediately following the reporting date• Based on fl oating rate assets and liabilities held at amortised cost (cash and cash equivalents, negotiable
instruments, retail savings deposits, fl oating bond liabilities)• Assets and liabilities accounted for at fair value through profi t and loss• On balance sheet at the reporting date. • The movement in rates was applied as a parallel shift in the applicable yield curves
Unless otherwise stated, the continuity of items for the purpose of this analysis is the contractual maturity dates.
Impact on income statement Impact on equity
2012 2011 2012 2011
200 basis points Pre-tax Post-tax Pre-tax Post-tax Pre-tax Post-tax Pre-tax Post-tax
R’000 R’000 R’000 R’000 R’000 R’000 R’000 R’000
Increase (111 592) (80 346) (65 331) (47 038) (82 223) (60 133) (63 517) (46 664)
Decrease 111 592 80 346 65 330 47 038 82 223 60 133 63 516 46 664
27.4 Currency risk
The exposure to foreign currency purchase risk relating to the importation of capital equipment, technology and technology support services needed for the core banking activities is managed through the purchase of forward foreign exchange contracts.
27.5 Other market risk
There is no exposure to other pricing risk.
27.6 Liquidity risk
The group manages liquidity cautiously and operates an uncomplicated maturity profi le which is monitored by alco. The matching of the term of funding to the term of the loan book reduces the liquidity risk of the group.
The table below analyses assets and liabilities of the group into relevant maturity groupings based on the remain-ing period at balance sheet date to the contractual maturity date. The table was prepared on the following basis:• Asset and liability cash fl ows are presented on an undiscounted basis with an adjustment to refl ect the total
discounted result.• The cash fl ows of fl oating rate fi nancial instruments are calculated using published forward market rates at
balance sheet date.• The cash fl ows of the derivative fi nancial instruments are included on a gross basis.• Contractual cash fl ows with respect to off-balance sheet items which have not yet been recorded on the balance
sheet, are excluded. Refer to note 34.• Conditionally revocable retail loan commitments totalling R603.8 million (2011: R549.2 million) are not included
in the liquidity analysis below. The commitments are a result of undrawn loan amounts. The loans are advanced with a contractural repayment term of one month or less.
• The group’s contractual commitment is revocable should a client not meet his/her obligations or where the group has determined that a client’s credit risk profi le has changed. A total of 18.3% of these commitments is expected to be drawn down within one month. As these are one-month loans, repayment of any future drawdowns must also occur within one month.
• Adjustments to loans and advances to clients relate to initiation fee income.• Non-cash liabilities, representing leave pay and the straight-lining of operating leases, are disclosed as adjustments
to trade and other payables.
27.6 Liquidity risk (continued)
Maturities of fi nancial assetsand fi nancial liabilities (discounted cash fl ows) Notes
Demandto one month
One tothree
months
Three months to
one year
More than
one year Adjustment Total
R’000 R’000 R’000 R’000 R’000 R’000
2012Undiscounted assets
Cash and cash equivalents – sovereigns 4 – – – – – –
Cash and cash equivalents – banks 4 4 538 222 15 274 – – – 4 553 496
Cash and cash equivalents – corporate money markets unit trusts 4 909 – – – – 909
Investments at fair value through profi t or loss 5 48 290 75 000 1 127 060 – – 1 250 350
Loans and advances to clients – retail personal 6 1 504 581 2 052 357 7 650 217 17 724 937 (492 071) 28 440 021
Loans and advances to clients – retail other 6 802 – – – – 802
Loans and advances to clients – corporate other 6 14 438 – – 23 781 – 38 219
Other receivables 8 28 733 – – 2 156 – 30 889
Current income tax assets – – 62 331 – – 62 331
Undiscounted assets 6 135 975 2 142 631 8 839 608 17 750 874 (492 071) 34 377 017
Adjustments for undiscounted assets (417 208) (869 345) (3 236 192) (5 602 742) – (10 125 487)
Discounted assets
Loan impairment provision 6 (130 479) (237 420) (493 418) (683 929) – (1 545 246)
Total discounted assets 5 588 288 1 035 866 5 109 998 11 464 203 (492 071) 22 706 284
Undiscounted liabilities
Loans and deposits at amortised cost 13 6 916 087 1 015 697 4 350 825 8 264 777 – 20 547 386
Trade and other payables 14 277 809 116 671 99 259 145 849 78 997 718 585
Current income tax liabilities – 885 – – – 885
Provisions 15 – – – 24 998 – 24 998
Undiscounted liabilities 7 193 896 1 133 253 4 450 084 8 435 624 78 997 21 291 854
Adjustments for undiscounted liabilities to depositors (4 697) (82 745) (418 893) (2 349 025) – (2 855 360)
Total discounted liabilities 7 189 199 1 050 508 4 031 191 6 086 599 78 997 18 436 494
Net liquidity excess/(shortfall) (1 600 911) (14 642) 1 078 807 5 377 604 (571 068) 4 269 790
Cumulative liquidity excess/(shortfall) (1 600 911) (1 615 553) (536 746) 4 840 858 4 269 790 4 269 790

158 Capitec Bank Holdings Limited Integrated Report 2012 159
27.6 Liquidity risk (continued)
Maturities of fi nancial assetsand fi nancial liabilities (discounted cash fl ows) Notes
Demandto one month
One tothree
months
Three months to
one year
More than
one year Adjustment Total
R’000 R’000 R’000 R’000 R’000 R’000
2011Undiscounted assets
Cash and cash equivalents 4 2 841 918 – – – – 2 841 918
Investments at fair value through profi t or loss 5 225 744 248 810 537 500 – – 1 012 054
Undiscounted assets 3 067 662 248 810 537 500 – – 3 853 972
Adjustments for undiscounted assets (411) (2 847) (20 132) – – (23 390)
Discounted assets
Loans and advances to clients 6 895 717 953 143 3 419 393 6 017 098 (369 159) 10 916 192
Loan impairment provision 6 (105 764) (199 336) (441 602) (98 024) – (844 726)
Other receivables 8 14 762 – 4 662 2 136 – 21 560
Total discounted assets 3 871 966 999 770 3 499 821 5 921 210 (369 159) 13 923 608
Undiscounted liabilities
Loans and deposits at amortised cost 13 4 419 413 1 013 657 1 673 440 5 202 138 – 12 308 648
Trade and other payables 14 214 280 45 838 51 928 119 367 58 333 489 746
Current income tax liabilities 986 – 34 047 – – 35 033
Provisions 15 – – – 14 403 – 14 403
Undiscounted liabilities 4 634 679 1 059 495 1 759 415 5 335 908 58 333 12 847 830
Adjustments for undiscounted liabilities to depositors (4 423) (58 490) (304 717) (1 491 196) – (1 858 826)
Total discounted liabilities 4 630 256 1 001 005 1 454 698 3 844 712 58 333 10 989 004
Net liquidity (shortfall)/excess (758 290) (1 235) 2 045 123 2 076 498 (427 492) 2 934 604
Cumulative liquidity(shortfall)/excess (758 290) (759 525) 1 285 598 3 362 096 2 934 604 2 934 604
The contractual maturity of the fi nancial assets and liabilities of the company are all on demand to one month.
Much of the liquidity shortfall in the demand to three-month categories results from the investment of excess cash in treasury bills and SARB debentures with maturities in excess of three months. These instruments are highly liquid and can be converted into cash should the need arise.
The defi nitions of sovereign, corporate and retail are aligned with the Banks Act Regulations.
27.7 Capital management
The group’s principal objectives when managing capital are to:• address the expectations of its shareholders, and optimise business activities to ensure return on capital targets
are achieved through effi cient capital management;• ensure that the group and bank holds suffi cient risk capital. Risk capital caters for unexpected losses that
may arise, protects shareholders and depositors and thereby assures the sustainability of the bank through the business cycle; and
• comply with the capital supervisory requirements of the South African Reserve Bank (SARB) as codifi ed in the Banks Act 1990 (as amended) and related regulations.
The group conducts a Capitec internal capital adequacy assessment process (CICAAP) on an ongoing basis, which drives the group’s position on capital management matters. The CICAAP reviews the historic, current and future capital positioning of the group, both from an internal and regulatory capital perspective.
The table below summarises the composition of regulatory capital for the group and the bank:
GROUP BANK
2012 2011 2012 2011
R’000 R’000 R’000 R’000
Ordinary share capital 2 926 435 1 918 677 3 380 895 2 384 427
Accumulated profi t 2 001 866 1 276 336 1 210 468 577 213
Preference share capital 258 969 258 969 258 969 258 969
Intangible assets in terms of IFRS (69 258) (34 357) (69 258) (34 357)
Specifi ed advances (28 063) (22 153) (28 063) (22 153)
Unappropriated profi t (275 094) (47 842) (275 094) (47 842)
Total regulatory adjustments (372 415) (104 352) (372 415) (104 352)
Primary (Tier 1) capital 4 814 855 3 349 630 4 477 917 3 116 257
Unidentifi ed impairments 175 987 108 441 175 987 108 441
Subordinated debt 1 069 000 450 000 1 069 000 450 000
Secondary (Tier 2) capital 1 244 987 558 441 1 244 987 558 441
Total qualifying regulatory capital 6 059 842 3 908 071 5 722 904 3 674 698
Primary % 31.0 35.4 28.9 32.7
Secondary % 8.0 5.9 8.0 5.9
Total capital adequacy % (1) (2) 39.0 41.3 36.9 38.6
Composition of required regulatory capital
On balance sheet 1 334 286 820 998 1 337 388 824 030
Off balance sheet – – 112 122
Credit risk 1 334 286 820 998 1 337 500 824 152
Operational risk 80 615 28 604 80 779 28 695
Equity risk in banking book – 1 552 – 1 552
Other assets 61 906 47 755 55 357 50 037
Total regulatory capital requirement (3) 1 476 807 898 909 1 473 636 904 436

160 Capitec Bank Holdings Limited Integrated Report 2012 161
(1) The total capital adequacy ratio percentage (CAR%) is determined by dividing the total qualifying regulatory capital by total risk-
weighted assets.(2) The CAR% calculations incorporate a calculation change in line with standard Basel practice. The risk-weighted asset/equiva-
lent for operational risk included in the divisor is now as per the Alternative Standardised Approach calculation for retail banking.
The previous method calculated the risk-weighted asset/equivalent for operational risk as the inverse of the operational risk
fl oor. There has been no change by the regulator to the capital requirement. The comparative has been restated.(3) This value is reported in terms of the Banks Act circular 5/2011. It excludes the required regulatory capital amount relating to
the bank-specifi c buffer (Basel pillar 2b add-on). The value disclosed is 9.5% of risk-weighted assets, being the Basel global
minimum requirement of 8% and a South African country-specifi c buffer of 1.5%.(4) Risk-weighted assets are calculated by using regulatory percentages applied to the balance sheet, in order to establish the base
for calculating the required regulatory capital.(5) The adjustments refl ect mainly the impact of the regulatory percentages and the addition of a risk-weighted equivalent for
operational risk.
Composition of risk-weighted assets (4)
On balance sheet 14 045 118 8 642 086 14 077 773 8 674 003
Off balance sheet – – 1 182 1 283
Credit risk 14 045 118 8 642 086 14 078 955 8 675 286
Operational risk 848 574 301 094 850 303 302 056
Equity risk in the banking book – 16 335 – 16 335
Other assets 651 640 502 681 582 700 526 707
Total risk-weighted assets 15 545 332 9 462 196 15 511 958 9 520 384
Total assets based on IFRS 23 621 844 14 439 517 23 583 053 14 498 054
Total risk-weighted assets – adjustments (5) (8 076 512) (4 977 321) (8 071 095) (4 977 670)
Total risk-weighted assets – regulatory 15 545 332 9 462 196 15 511 958 9 520 384
GROUP BANK
2012 2011 2012 2011
R’000 R’000 R’000 R’000
27.7 Capital management (continued)
27.8 Gains and losses per category of fi nancial assets and fi nancial liabilities
Notes
Heldfor
trading
Designated
at fair value
Loans and receivables
Financial liabilities at
amortised cost Total
R’000 R’000 R’000 R’000 R’000
2012Interest income 18 – 49 071 4 297 831 – 4 346 902
Interest expense 18 (17) – – (1 022 357) (1 022 374)
Loan fee income – – 1 657 018 – 1 657 018
Loan fee expense – 33 820 (220 180) – (186 360)
Transaction fee income – – – 1 360 308 1 360 308
Transaction fee expense – – – (524 202) (524 202)
Dividend income 19 – 1 532 – – 1 532
Net impairment on loans and advancesto clients 20 – – (1 604 190) – (1 604 190)
Net movement in fi nancial instruments held at fair value through profi t or loss 21 – 12 070 – – 12 070
2011Interest income 18 – 86 882 2 721 661 – 2 808 543
Interest expense 18 (69) – – (751 291) (751 360)
Loan fee income – – 1 273 574 – 1 273 574
Loan fee expense – (3 757) (117 953) – (121 710)
Transaction fee income – – – 883 040 883 040
Transaction fee expense – – – (351 309) (351 309)
Dividend income 19 – 571 – – 571
Net impairment on loans and advancesto clients 20 – – (988 177) – (988 177)
Net movement in fi nancial instruments held at fair value through profi t or loss 21 – (210) – – (210)

162 Capitec Bank Holdings Limited Integrated Report 2012 163
27.10 Fair value hierarchy
Valuation of assets and liabilities The fair value of fi nancial liabilities is calculated by discounting the contractual cash fl ows based on an appropriate market-related rate. The market-related rate is determined with reference to the movement in the risk-free rate for the remaining duration of the liabilities and adjusted for any movement in the risk premium as determined through the judgement of management taking into account their knowledge of the market including recent transactions and developments.
The difference in the present value for assets and liabilities, based on the risk premium determined at the later of the start of the fi nancial year or the inception of the instrument compared to the risk premium at the earlier of year-end or derecognition of the fi nancial liability is determined to be the change in fair value attributable to credit risk for the current year.
Financial assets are valued based on the nature of the item. Listed fi nancial assets are valued with reference to the closing bid price.
Unlisted debt instruments are valued by discounting expected cash fl ows based on an appropriate market-related rate. The discount rate is determined as for fi nancial liabilities, but the cash fl ows are adjusted for expected future service costs.
Unlisted equity instruments that will be converted to listed instruments are valued with reference to the current market value of the listed instrument, adjusted for the time to and conditions of conversion and the existence of alternative markets such as over-the-counter markets.
Other unlisted equity instruments are valued taking into account factors such as net asset value, expected cash fl ows, expected profi tability and appropriate price/earnings ratios.
Valuation techniques for derivatives are set out in accounting policy note 1.3.4.
Receivables at fair value through profi t or loss consist of a profi t share on a credit life and retrenchment insurance policy. Total gains or losses for the period included in profi t or loss are presented in loan fee expenses on the income statement. The profi t share is determined in terms of the insurance contract and includes an estimate of the unreported claims as at the end of the period.
A 10% change in the estimate of unreported claims would have an impact of R4.4 (2011: R0.5 million) on the fair value of the receivable.
IFRS 7 specifi es a hierarchy of valuation techniques for assets and liabilities measured at fair value based on whether the inputs to those techniques are observable or unobservable. Observable inputs refl ect market data obtained from independent sources and unobservable inputs refl ect the group’s market assumptions.
These two types of inputs have created the following fair value hierarchy:Level 1 – Quoted prices in active markets for identical assets and liabilitiesLevel 2 – Inputs other than prices or indirectly by derivation from pricesLevel 3 – Inputs for the asset or liability that are not based on observable market data
The group considers relevant and observable market prices where possible.
27.9 Classifi cation of fi nancial assets and fi nancial liabilities
Notes
Heldfor
tradingHeld at
fair value
Loansand
receiv-ables
Availablefor sale
Financial liabilities at
amortised cost Total
Fairvalue
R’000 R’000 R’000 R’000 R’000 R’000 R’000
2012Financial assets
Cash and cash equivalents 4 – – 4 551 203 – – 4 551 203 4 551 203
Investments at fair value through profi t or loss 5 – 1 198 833* – – – 1 198 833 1 198 833
Loans and advances to clients 6 – – 16 863 028 – – 16 863 028 17 016 644
Other receivables 8 263 – 30 626 – – 30 889 30 418
Financial liabilities
Loans and deposits at amortised cost 13 – – – – 17 692 062 17 692 062 17 818 558
Trade and other payables 14 – 3 321# – – 715 228 718 549 718 107
Provisions 15 – – – – 24 998 24 998 24 998
2011Financial assets
Cash and cash equivalents 4 – – 2 841 918 – – 2 841 918 2 841 918
Investments at fair value through profi t or loss 5 – 988 664* – – – 988 664 988 664
Loans and advances to clients 6 – – 10 071 466 – – 10 071 466 10 251 002
Other receivables 8 – 4 662 16 898 – – 21 560 21 046
Financial liabilities
Loans and deposits at amortised cost 13 – – – – 10 449 883 10 449 883 10 519 902
Trade and other payables 14 – 6 269# – – 483 416 489 685 489 898
Provisions 15 – – – – 14 403 14 403 14 403
* Designated at fair value through profi t or loss
# Cash fl ow hedge

164 Capitec Bank Holdings Limited Integrated Report 2012 165
29. Related-party transactions
Transactions with subsidiaries
Investments in subsidiaries are disclosed in note 9.
Dividend received
Ordinary dividend – – 317 939 201 882
Preference dividend – – 19 419 15 754
Capitec Bank Limited – – 337 358 217 636
Management fees received
Capitec Bank Limited – – 932 702
Loans due from:
Capitec Bank Limited – – 16 351 5 079
Loans due to:
Keymatrix (Pty) Limited – – 1 1
Guarantees (1)
Key Distributors received a guarantee from a fellow subsidiary, Capitec Bank Limited. The value guaranteed is R4.4 million (2011: R4.4 million).
The balance outstanding at year-end that is covered amounted to R2.4 million (2011: R2.6 million). A market-related guarantee fee of R70 830 (2011: R83 182) was paid by Key Distributors (Pty) Limited to Capitec Bank Limited.
Capitec Bank Holdings LimitedAn intra-group unlimited suretyship provided in favour of a fi nancial institution in respect of operating facilities of Capitec Bank Limited with a maximum exposure of R5.6 million (2011: R0.7 million).
A suretyship limited to R0.6 million (2011: R0.6 million) in favour of a fi nancial institution with which Key Distributors (Pty) Limited has a mortgage bond.
PSG Group and subsidiaries (2)
Brokers’ fees 46 63 – –
Sponsor fees 72 63 72 63
Commitment fees – 16 844 – 16 844
Loans and advances to directors and other key
management employees included in loans
and advances to clients
Loans outstanding at the beginning of the year 5 714 2 742 – –
Loans advanced during the year 3 431 6 043 – –
Interest charged on loans during the year 514 400 – –
Loan repayments during the year (5 515) (3 471) – –
Loans outstanding at the end of the year 4 144 5 714 – –
Less advanced by subsidiaries (4 144) (5 714) – –
GROUP COMPANY
2012 2011 2012 2011
R’000 R’000 R’000 R’000
27.10 Fair value hierarchy (continued)
Assets and liabilities measured at fair value
Level 1 Level 2 Level 3 Total
R’000 R’000 R’000 R’000
2012Investments at fair value through profi t or loss – 1 198 833 – 1 198 833
Total assets – 1 198 833 – 1 198 833
Trade and other payables – 3 321 – 3 321
Total liabilities – 3 321 – 3 321
2011Investments at fair value through profi t or loss – 988 664 – 988 664
Receivables at fair value through profi t or loss – – 4 662 4 662
Total assets – 988 664 4 662 993 326
Trade and other payables – 6 269 – 6 269
Total liabilities – 6 269 – 6 269
Reconciliation of receivables at fair value through profi t or loss
2012 2011
R’000 R’000
Balance at the beginning of the year 4 662 8 419
Gains and losses recognised in profi t or loss 33 820 (3 757)
Settlements (38 482) –
Balance at the end of the year – 4 662
28. Retirement benefi tsGROUP COMPANY
2012 2011 2012 2011
R’000 R’000 R’000 R’000
The group contributed on behalf of all employees
who elected to be members of the provident fund.
The provident fund, a defi ned-contribution fund, is
administered independently of the group and is subject
to the Pension Funds Act, 1956 (Act 24 of 1956). The
amount contributed is included in salaries and wages
as per note 22. 57 272 38 978 – –
Since 1 July 2001 it is compulsory for all new appointments to be members of the provident fund. The group will continue to contribute to the fund on behalf of all members. The group has no exposure in respect of any post-retirement benefi ts payable.
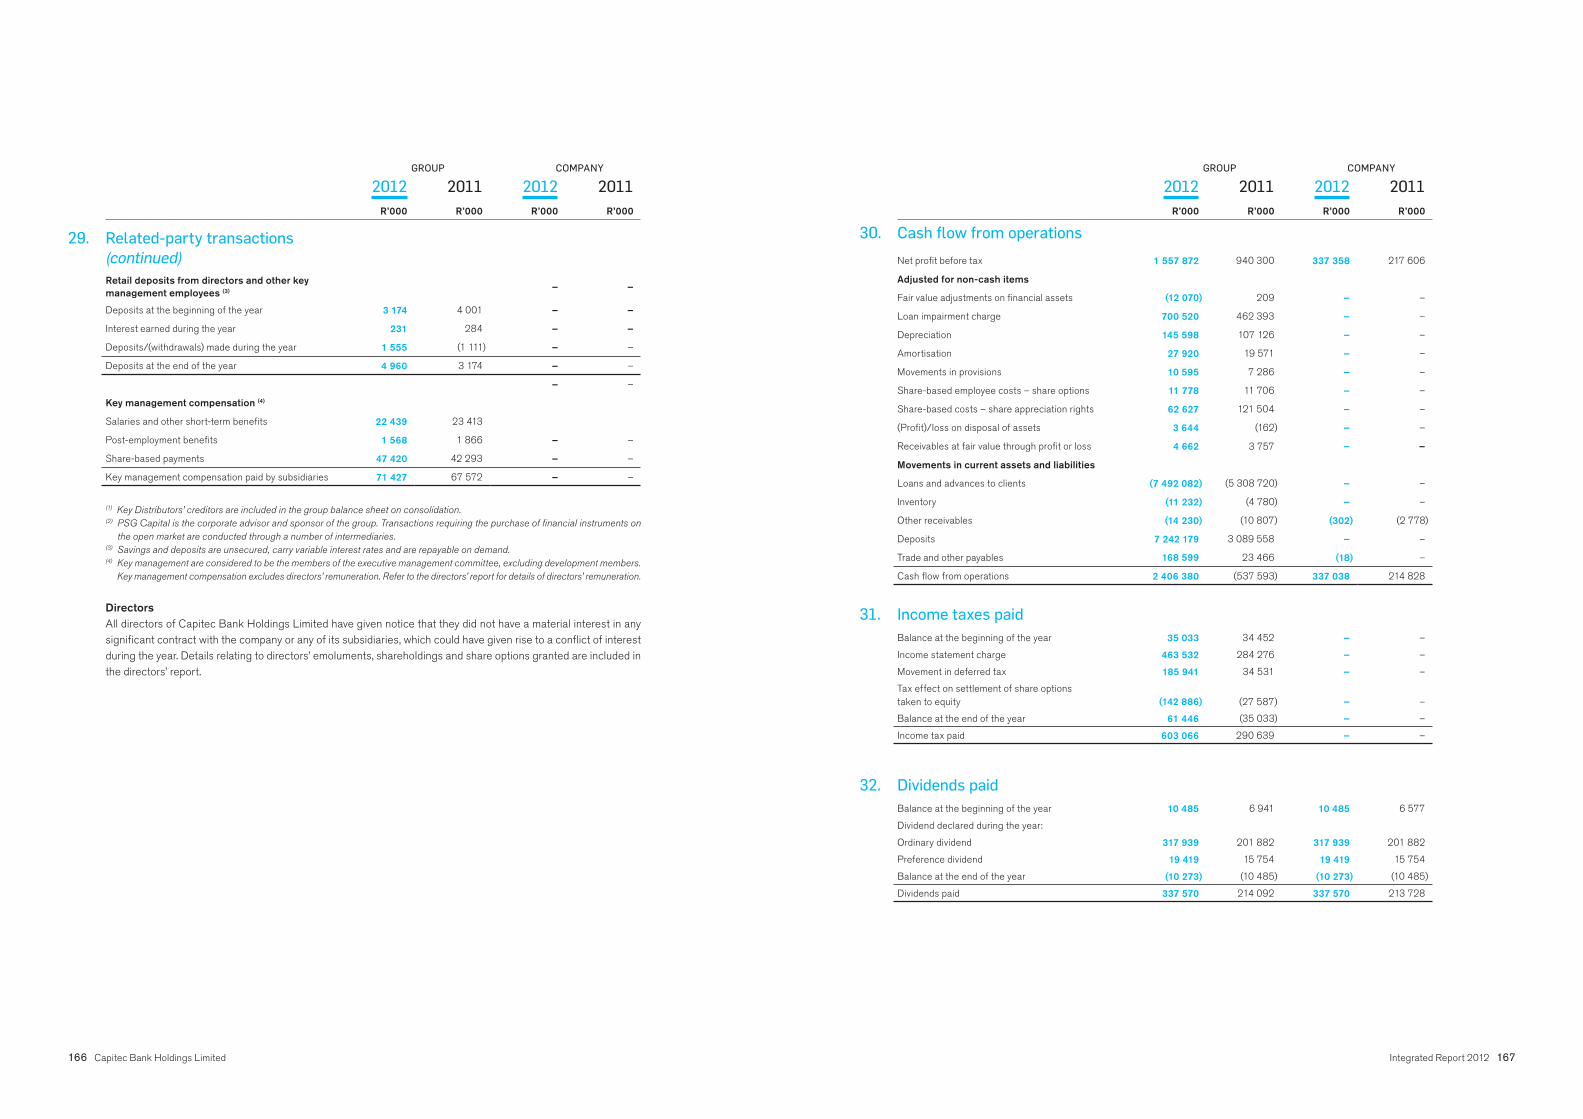
166 Capitec Bank Holdings Limited Integrated Report 2012 167
GROUP COMPANY
2012 2011 2012 2011
R’000 R’000 R’000 R’000
29. Related-party transactions
(continued)
Retail deposits from directors and other key management employees (3) – –
Deposits at the beginning of the year 3 174 4 001 – –
Interest earned during the year 231 284 – –
Deposits/(withdrawals) made during the year 1 555 (1 111) – –
Deposits at the end of the year 4 960 3 174 – –
– –
Key management compensation (4)
Salaries and other short-term benefi ts 22 439 23 413
Post-employment benefi ts 1 568 1 866 – –
Share-based payments 47 420 42 293 – –
Key management compensation paid by subsidiaries 71 427 67 572 – –
(1) Key Distributors’ creditors are included in the group balance sheet on consolidation. (2) PSG Capital is the corporate advisor and sponsor of the group. Transactions requiring the purchase of fi nancial instruments on
the open market are conducted through a number of intermediaries.(3) Savings and deposits are unsecured, carry variable interest rates and are repayable on demand.(4) Key management are considered to be the members of the executive management committee, excluding development members.
Key management compensation excludes directors’ remuneration. Refer to the directors’ report for details of directors’ remuneration.
DirectorsAll directors of Capitec Bank Holdings Limited have given notice that they did not have a material interest in any signifi cant contract with the company or any of its subsidiaries, which could have given rise to a confl ict of interest during the year. Details relating to directors’ emoluments, shareholdings and share options granted are included in the directors’ report.
Net profi t before tax 1 557 872 940 300 337 358 217 606
Adjusted for non-cash items
Fair value adjustments on fi nancial assets (12 070) 209 – –
Loan impairment charge 700 520 462 393 – –
Depreciation 145 598 107 126 – –
Amortisation 27 920 19 571 – –
Movements in provisions 10 595 7 286 – –
Share-based employee costs – share options 11 778 11 706 – –
Share-based costs – share appreciation rights 62 627 121 504 – –
(Profi t)/loss on disposal of assets 3 644 (162) – –
Receivables at fair value through profi t or loss 4 662 3 757 – –
Movements in current assets and liabilities
Loans and advances to clients (7 492 082) (5 308 720) – –
Inventory (11 232) (4 780) – –
Other receivables (14 230) (10 807) (302) (2 778)
Deposits 7 242 179 3 089 558 – –
Trade and other payables 168 599 23 466 (18) –
Cash fl ow from operations 2 406 380 (537 593) 337 038 214 828
31. Income taxes paid
Balance at the beginning of the year 35 033 34 452 – –
Income statement charge 463 532 284 276 – –
Movement in deferred tax 185 941 34 531 – –
Tax effect on settlement of share optionstaken to equity (142 886) (27 587) – –
Balance at the end of the year 61 446 (35 033) – –
Income tax paid 603 066 290 639 – –
32. Dividends paid
Balance at the beginning of the year 10 485 6 941 10 485 6 577
Dividend declared during the year:
Ordinary dividend 317 939 201 882 317 939 201 882
Preference dividend 19 419 15 754 19 419 15 754
Balance at the end of the year (10 273) (10 485) (10 273) (10 485)
Dividends paid 337 570 214 092 337 570 213 728
GROUP COMPANY
2012 2011 2012 2011
R’000 R’000 R’000 R’000
30. Cash fl ow from operations

168 Capitec Bank Holdings Limited Integrated Report 2012 169
35. Borrowing powers
In terms of the articles of association of Capitec Bank Holdings Limited, the directors may at their discretion raise or borrow money for the purpose of the business of the company without limitation.
These borrowing powers are subject to the limitations of the Banks Act, 1990 (Act 94 of 1990) andsection 45(3)(a)(ii) of the Companies Act, 2008. A special resolution was passed at the Annual General Meeting on 3 June 2011 authorising the board to approve that the company provides any fi nancial assistance that it deems fi t to any related or interrelated company, on the terms and conditions and for the amount that the board may determine.
The increase in borrowings from the previous year is for the purposes of funding the general banking business, including future expansion of the loan book and capital expenditure.
36. Share incentive scheme
The share incentive scheme has been authorised and adopted by the shareholders of Capitec Bank Holdings Limited (CBHL). The trustees act in terms of the powers bestowed on them by the trust deed and receive instructions from time to time from the boards of CBHL and the bank. The bank provides the fi nance required from time to time by the trustees to perform their duties. Service costs of options issued to employees of subsidiaries of CBHL are fi nanced by the relevant subsidiary.
The bank allows its employees to purchase shares in Capitec Bank Holdings Limited up to a value not exceeding 20% (2011: 20%) of their monthly salary.
The purchase price includes a subsidy of 20% (2011: 20%) and the transaction costs are borne by the company.
The shares are held by the trustees on behalf of the participants for as long as required to save the holding expenses of a broker account for participants.
The share incentive scheme prescribes that European type options, with durations ranging from three to six years, should be allocated at the market value, determined as the weighted average price per share over a period of30 trading days on the JSE Limited prior to the date of allocation.
2012 2011
Number Number
Options issued to employees of Capitec Bank Limited
Balance at the beginning of the year 4 221 594 5 322 184
Options granted 138 000 182 736
Options cancelled and/or lapsed (19 375) (12 500)
Options exercised (1 253 326) (1 270 826)
Balance at the end of the year 3 086 893 4 221 594
GROUP COMPANY
2012 2011 2012 2011
R’000 R’000 R’000 R’000
33. Realised loss on settlement of employee share options less participants’ contributions
1 249 576 (2011: 1 227 212) ordinary shares issued (220 505) (127 169) – –
Shares acquired (702) (4 422) – –
Fair value of shares utilised to settle share options (221 207) (131 591) – –
Proceeds on settlement of options 35 091 23 255 – –
(186 116) (108 336) – –
34. Commitments and contingent liabilities
Property operating lease commitments
The future aggregate minimum lease payments under non-cancellable leases are as follows:
Within one year 167 995 129 070 – –
From one to fi ve years 470 288 357 702 – –
After fi ve years 99 694 54 331 – –
Total future cash fl ows 737 977 541 103 – –
Straight-lining accrued (35 749) (25 354) – –
Future expenses 702 228 515 749 – –
Other operating lease commitments
Within one year 2 253 1 988 – –
From one to fi ve years 5 083 5 093 – –
7 336 7 081 – –
Capital commitments – approved by the board
Contracted for
Property and equipment 85 195 29 609 – –
Intangible assets 6 744 – – –
Not contracted for
Property and equipment 458 247 417 556 – –
Intangible assets 122 329 88 212 – –
672 515 535 377 – –
Capitec Bank Holdings LimitedAn intra-group unlimited suretyship provided in favour of a fi nancial institution in respect of operating facilities of Capitec Bank Limited with a maximum exposure of R5.6 million (2011: R0.7 million).
A suretyship limited to R0.6 million (2011: R0.6 million) in favour of a fi nancial institution with which Key Distributors (Pty) Limited has a mortgage bond.

170 Capitec Bank Holdings Limited Integrated Report 2012 171
2012 2011
Number Number
Shares purchased/issued during the year 1 253 326 1 270 826
Shares utilised for settlement of options (1 253 326) (1 270 826)
Shares available for settlement of options – –
Settled in cash – –
Settled in shares (1 253 326) (1 270 826)
Options exercised (1 253 326) (1 270 826)
The bank offers share options in Capitec Bank Holdings Limited to members of management who are able to make signifi cant contributions to the achievement of the bank’s objectives. The exercise price of the granted options is equal to the weighted 30-day market price of the shares on the date of the grant. Options are conditional on the employee completing the vesting period applicable to each group of options issued to that employee.
37. Share option expense
Data utilised in the valuation of options grantedThe table below provides detail regarding the data used in the valuation of the share options to which IFRS 2 has been applied. Share options are refl ected on an equity-settled basis and are valued at issue date. The number of options that are expected to vest are re-estimated on an annual basis.
Year granted
Strike price
R
Share price
onissue date
R
Volatility used
invaluation
%
Divi-dend yield
%Year
maturing
Risk-freerate
%
Numberof
options out-
standing
Fair value on issue/repricing
dateignoring vesting
conditionsR’000
Expected(1) vesting
proportion%
Value taking into
account expected
vesting proportion
R’000
2006/2007 30.20 31.00 36.1 1.4 2012/2013 7.6 12 500 167 99.1 166
30.73 34.00 36.3 1.3 2012/2013 7.6 252 500 3 960 98.8 3 911
2007/2008 36.07 36.00 34.2 1.7 2012/2013 7.9 7 500 101 99.1 100
36.00 34.2 1.7 2013/2014 7.9 7 500 110 89.2 98
36.00 35.60 34.1 1.7 2012/2013 7.9 13 889 182 98.8 180
35.60 34.1 1.7 2013/2014 7.8 13 889 198 88.9 176
35.82 38.30 34.0 2.2 2012/2013 7.8 156 750 2 240 98.4 2 204
38.30 34.0 2.2 2013/2014 7.7 156 750 2 392 88.5 2 118
41.46 38.00 34.1 1.7 2012/2013 8.6 5 125 69 91.2 63
38.00 34.1 1.7 2013/2014 8.5 5 125 75 82.1 62
2008/2009 35.54 33.10 36.6 3.2 2012/2013 9.6 395 625 3 983 98.5 3 923
33.10 36.6 3.2 2013/2014 9.4 395 625 4 390 88.7 3 892
33.10 36.6 3.2 2014/2015 9.3 395 625 4 707 79.8 3 756
35.82 38.90 33.9 0.6 2012/2013 8.4 12 562 198 98.4 194
38.90 33.9 0.6 2013/2014 8.3 12 562 219 88.5 194
28.96 29.05 37.1 3.0 2012/2013 8.1 6 250 58 91.4 53
29.05 37.1 3.0 2013/2014 8.0 6 250 63 82.3 52
29.05 37.1 3.0 2014/2015 8.0 6 250 67 74.1 50
2009/2010 31.23 36.50 37.2 4.6 2012/2013 7.9 209 375 2 315 98.7 2 285
36.50 37.2 4.6 2013/2014 8.2 209 375 2 500 88.8 2 220
36.50 37.2 4.6 2014/2015 8.4 209 375 2 633 79.9 2 105
36.50 37.2 4.6 2015/2016 8.5 209 375 2 722 72.0 1 958
45.49 61.50 36.8 3.5 2012/2013 8.2 12 500 293 93.5 274
61.50 36.8 3.5 2013/2014 8.5 12 500 312 84.2 263
61.50 36.8 3.5 2014/2015 8.7 12 500 326 75.7 247
61.50 36.8 3.5 2015/2016 8.8 12 500 337 68.2 230
61.05 64.00 36.7 3.4 2012/2013 8.2 4 095 76 93.1 70
64.00 36.7 3.4 2013/2014 8.5 4 095 85 83.8 72
64.00 36.7 3.4 2014/2015 8.7 4 095 93 75.5 70
64.00 36.7 3.4 2015/2016 8.8 4 095 98 67.9 67
2010/2011 97.30 100.20 35.9 2.4 2013/2014 7.4 42 497 1 236 88.8 1 098
100.20 35.9 2.4 2014/2015 7.7 42 497 1 419 80.0 1 135
100.20 35.9 2.4 2015/2016 7.9 42 503 1 569 72.0 1 129
100.20 35.9 2.4 2016/2017 8.2 42 503 1 702 64.8 1 102
117.79 129.00 35.5 2.2 2013/2014 6.6 3 184 126 86.1 109
129.00 35.5 2.2 2014/2015 6.9 3 184 143 77.5 111
129.00 35.5 2.2 2015/2016 7.2 3 184 157 69.7 110
129.00 35.5 2.2 2016/2017 7.5 3 184 169 62.8 106
2011/2012 160.09 168.00 34.4 1.9 2014/2015 7.5 34 494 1 742 80.0 1 394
168.00 34.4 1.9 2015/2016 7.8 34 494 2 009 72.0 1 447
168.00 34.4 1.9 2016/2017 8.0 34 506 2 232 64.8 1 446
168.00 34.4 1.9 2017/2018 8.2 34 506 2 420 58.3 1 411
Grand total 3 086 893 49 891 83.5 41 649
(1) Executive staff turnover of 8% p.a. (2011:10%) was used to estimate likelihood of vesting conditions realising. This is re-estimated
in terms of IFRS 2 on an annual basis.
2012 2011
Analysis of outstanding share options by year of maturity
Weighted average strike
priceR Number
Weighted average strike
priceR Number
Financial year
2011/2012 – – 29.95 1 255 826
2012/2013 34.14 1 088 671 34.14 1 096 796
2013/2014 44.93 869 352 44.47 874 977
2014/2015 69.35 708 020 47.66 676 651
2015/2016 98.14 306 151 63.52 271 657
2016/2017 130.59 80 193 93.81 45 687
2017/2018 160.09 34 506 – –
43.58 3 086 893 35.10 4 221 594
36. Share incentive scheme
(continued)

172 Capitec Bank Holdings Limited Integrated Report 2012 173
38. Share appreciation rights
Data utilised in the valuation of share appreciation rights granted The table below provides detail regarding the data used in the valuation of the share options to which IFRS 2
has been applied. Share appreciation rights are expected to vest and are re-estimated on an annual basis.(1)
Year granted
Strike price
Yearmaturing
Risk-freerate
Number of options
outstandingFair
value
Portionof term expired
Expected vesting
proportion(2)
Liabilityat year-end
% R’000 % % R’000
2009/2010 31.23 2012/2013 5.6 209 375 32 111 95.8 99.0 30 442
2013/2014 5.8 209 375 31 459 71.9 91.0 20 584
2014/2015 6.1 209 375 30 846 57.5 83.8 14 858
2015/2016 6.4 209 375 30 270 47.9 77.1 11 180
45.49 2012/2013 5.7 12 500 1 725 78.7 94.8 1 288
2013/2014 5.9 12 500 1 697 59.1 87.2 874
2014/2015 6.2 12 500 1 672 47.3 80.3 634
2015/2016 6.5 12 500 1 648 39.4 73.8 480
61.05 2012/2013 5.7 4 095 503 77.6 94.5 369
2013/2014 5.9 4 095 498 58.2 87.0 252
2014/2015 6.2 4 095 494 46.5 80.0 184
2015/2016 6.5 4 095 490 38.8 73.6 140
2008/2009 28.96 2012/2013 5.7 6 250 958 78.7 93.1 702
2013/2014 6.0 6 250 938 63.0 85.7 506
2014/2015 6.3 6 250 920 52.5 78.8 381
35.54 2012/2013 5.6 395 625 58 963 96.4 98.8 56 194
2013/2014 5.8 395 625 57 824 77.2 90.9 40 567
2014/2015 6.1 395 625 56 763 64.3 83.7 30 535
2010/2011 97.30 2013/2014 5.8 42 497 3 766 62.6 91.1 2 147
2014/2015 6.1 42 497 3 846 47.0 83.8 1 513
2015/2016 6.4 42 503 3 928 37.6 77.1 1 138
2016/2017 6.7 42 503 3 995 31.3 70.9 886
117.79 2013/2014 5.8 3 184 229 52.6 88.8 107
2014/2015 6.2 3 184 242 39.5 81.7 78
2015/2016 6.5 3 184 253 31.6 75.2 60
2016/2017 6.7 3 184 262 26.3 69.2 48
2011/2012 160.09 2014/2015 6.1 34 494 1 682 29.5 83.8 416
2015/2016 6.4 34 494 1 907 22.1 77.1 325
2016/2017 6.7 34 506 2 082 17.7 70.9 261
2017/2018 6.9 34 506 2 219 14.7 65.3 213
Grand total 2 430 241 334 190 73.2 88.8 217 362
Note 14(1) All rights were valued using the following variables:
Dividend yield 2.6%
Volatility 33.1%
Ex dividend share price (cents) 180.29 (2) Executive staff turnover of 8% p.a. (2011:10%) was used to estimate likelihood of vesting conditions realising. A re-estimate in
terms of IFRS 2 will be done on an annual basis.
39. Share appreciation rights: BEE consortium
The Capitec Bank Group Employee Empowerment Trust is a 5% participant in the BEE consortium thatpurchased 10 million shares in the group in February 2007. Funding for the share purchase was mainly obtained from the IDC.
During February 2008, a communication was sent out by Capitec Bank on behalf of the Trust to employees of the bank, informing them that each permanent employee, not participating in the share incentive scheme and employed at 29 February 2008, would benefi t from cash disbursements, based on the cumulative increase in value of 200 Capitec Bank Holdings shares less funding costs, paid in increments of 25% over four years. The payments commenced in February 2010 and depend on continued employment by the group.
The agreement with employees constitutes a cash-settled equity-based compensation plan in terms of IFRS 2 and the trust is considered to be a subsidiary of the group.
At 29 February 2012, 1 502 (28 February 2011: 1 666) employees qualifi ed for the rights.
Yeargranted
Yearmaturing
Risk-free rate Rights
Value per right
Estimated value
Portion of term expired
Expected vesting portion Fair value
% Number R R’000 % % R’000
2008 2013 5.6% 300 400 84.95 13 863 80% 86% 9 576
(1) All rights were valued using the following variables:
Dividend yield 2.6%
Volatility 33.1%
Ex dividend share price (cents) 180.29 (2) Actual staff turnover of participants of 14% p.a. (2011: 10%) was used to estimate the likelihood of vesting conditions realising.
A re-estimate in terms of IFRS 2 will be done on an annual basis.
(3) The estimated value consists of the cumulative value of the rights less payments to date.

174 Capitec Bank Holdings Limited Integrated Report 2012 175
40. Derivative fi nancial instruments: economic hedges
Notional Fair values
amount Assets Liabilities
R’000 R’000 R’000
2012Forward foreign exchange contracts
Notional amounts in ZAR 4 101 263 –
Notional amounts in USD 579 – –
2011Forward foreign exchange contracts
Notional amounts in ZAR 4 271 – 203
Notional amounts in USD 579 – –
Forward foreign exchange contracts represent commitments to purchase foreign currency, including undelivered spot transactions, and were entered into to match corresponding expected future transactions to the amount of R4.1 million (2011: R4.3 million).
41. Derivative fi nancial instruments: cash fl ow hedges
Notional Fair values
amount Assets Liabilities
R’000 R’000 R’000
2012Interest rate swaps 1 150 000 – 3 321
2011Interest rate swaps 380 000 – 6 066
Demand toone month
One tothree months
Three monthsto one year
More thanone year
Grandtotal
R’000 R’000 R’000 R’000 R’000
2012Discounted swap cash fl ows – 1 058 2 438 (175) 3 321
Net – 1 058 2 438 (175) 3 321
2011Discounted swap cash fl ows – 6 066 – – 6 066
Net – 6 066 – – 6 066
Gains and losses recognised in the hedging reserve in comprehensive income (note 17) on interest rate swap contracts as at fi nancial year-end will be continuously released to the income statement in line with the interest expense on the underlying hedged domestic medium-term notes.
The forecasted cash fl ows presented above show how the cash fl ow hedging reserve, at fi nancial year-end, will be released to the income statement over time. The interest rate swaps have quarterly reset and settlement dates. For the interest rate swaps the forecast cash fl ows were based on contracted interest rates.
At 29 February 2012, the fi xed interest rates were between 5.74% and 6.32% and the fl oating rates were based on forecast 3-month JIBAR rates at 29 February 2012.
The fair value adjustment removed from the cash fl ow hedging reserve and transferred to the income statement amounting to a debit of R7.1 million (2011: R22 million), has been included in interest expense inthe income statement. No gains and losses on ineffective portions of such derivatives were recognised in the income statement in 2012 and 2011. There were no transactions for which cash fl ow hedge accounting had to be discontinued in 2012 and 2011 as a result of highly probable cash fl ow no longer being expected to occur.

176 Capitec Bank Holdings Limited Integrated Report 2012 177
42. Shareholders holding more than 5% of the company’s ordinary shares
Shareholder Shares held Shareholding
Year ended 29 February 2012 Number %
PSG Financial Services Limited 32 314 970 32.55
Limietberg Beleggings (Pty) Limited 10 398 444 10.47
Coral Lagoon Investments 194 (Pty) Limited (1) 10 000 000 10.07
(1) Coral Lagoon Investments 194 (Pty) Limited (Coral) disposed of 5 284 735 shares in the ordinary share of Capitec on
29 February 2012 (settlement date of the transaction in terms of the STRATE operating system being 7 March 2012) to the
Public Investment Corporation SOC (PIC) as part of a restructuring of the fi nancing of Coral’s interest in Capitec. Subsequent
to the acquisition of these shares the PIC holds an interest of 7.8% in the ordinary shares of Capitec.
43. Black economic empowerment shareholding
Shareholder Shares held Shareholding
Year ended 29 February 2012 Number %
Coral Lagoon Investments 194 (Pty) Limited 10 000 000 10.07
Thembeka Capital Limited 3 473 193 3.50
Merlyn Claude Mehl 40 784 0.04
Nonhlahnla Mjoli-Mncube 110 000 0.11
13 623 977 13.72
44. Shareholding by executive management (1)
Shareholder Shares held Shareholding
Year ended 29 February 2012 Number %
CG van Schalkwyk 719 355 0.72
CG Fischer 1 109 654 1.12
A Olivier 252 634 0.25
L Venter 327 306 0.33
C Oosthuizen 102 575 0.10
NST Motjuwadi 246 0.00
JE Carstens 2 491 0.00
GM Fourie 975 342 0.98
3 489 603 3.5
(1) Executive directors’ shareholdings is presented in note 7.1 of the directors’ report.
Analysis of shareholders holding ordinary sharesNumber of
shareholders% of total
Number of shares
% of interest
1 – 1 000 7 439 78.68 2 150 676 2.00
1 001 – 10 000 1 646 17.41 4 544 660 5.00
10 001 – 100 000 291 3.08 8 912 053 9.00
100 001 and over 79 0.84 83 674 811 84.00
9 455 100.00 99 282 200 100.00
Shareholder spread
Public shareholders 9 432 99.76 38 496 188 38.80
Holdings less than 5% 9 432 99.76 38 496 188 38.80
There are no public shareholders with holdings of 5% or more
Non-public shareholders excluding directors and their associates 2 0.02 42 314 970 42.55
There are no non-public shareholders (excluding directors and their associates) holding less than 5%
Holdings of 5% or more 2 0.02 42 314 970 42.55
PSG Financial Services Limited 1 0.01 32 314 970 32.55
Coral Lagoon Investments 194 (Pty) Limited (1) 1 0.01 10 000 000 10.00
Directors (refer to page 112 for detail) 21 0.22 18 471 042 18.65
Directors of company or any subsidiaries 6 0.06 364 869 0.40
Associates of directors of company or any of its subsidiaries (2) 15 0.16 18 106 173 18.25
9 455 100.00 99 282 200 100.00
(1) Coral Lagoon Investments 194 (Pty) Limited disposed of 5 284 735 shares in the ordinary share capital of Capitec to the Public Invest-
ment Corporation SOC Limited on 29 February 2012. The transaction settled on 7 March 2012. The BEE status of these shares remains
unchanged.(2) Excludes 28 200 shares held by RJ Huntley via Coral Lagoon Investments 194 (Pty) Limited.
Analysis of shareholders holding non-redeemable, non-cumulative,non-participating preference shares (preference shares)
Number of shareholders
% of total
Number of shares
% of interest
1 – 1 000 515 50.89 260 601 9.08
1 001 – 10 000 456 45.06 1 469 568 51.22
10 001 – 100 000 39 3.85 890 019 31.02
100 001 and over 2 0.20 248 826 8.68
1 012 100.00 2 869 014 100.00
Shareholder spread
Public shareholders 1 011 99.90 2 848 014 99.27
Holdings less than 5% 1 011 99.90 2 848 014 99.27
There are no public shareholders holding more than 5%
Non-public shareholders excluding directors and/or their associates 0 0.00 0 0.00
There are no non-public shareholders other than the associateof a director
Directors (refer to page 115 for detail) 1 0.10 21 000 0.73
None of the directors hold preference shares
Associates of directors of company or any of its subsidiaries 1 0.10 21 000 0.73
1 012 100.00 2 869 014 100.00
Statutoryinformation

178 Capitec Bank Holdings Limited Integrated Report 2012 179
Special resolution ofa subsidiary
The following special resolutions were passed by Capitec Bank Limited (“Capitec Bank” or “the bank”) during the fi nancial year under review:
1. Special resolution number 1“Resolved, in terms of section 66(9) of the Companies Act, 71 of 2008, as amended (“the Act”), and in accordance with special resolution 3.2 of the 2011 notice of the Capitec annual general meeting dealing with the directors’ fees proposed to the shareholders of Capitec and subject to approval by the shareholders of Capitec, that Capitec Bank pays the stated directors’ fees to the said boards of Capitec and Capitec Bank.”
2. Special resolution number 2“Resolved that the bank be authorised, for a period up to 15 months from the date of this resolution, as a general approval, to repurchase any of the ordinary shares issued by the bank upon such terms and conditions and in such amounts as the directors may from time to time decide, but subject to the provisions of sections 46 and 48 of the Act, the Banks Act, 1990 (Act 94 of 1990), as amended, the Listings Requirements of the JSE Limited (“JSE”), as applicable and the memorandum of incorporation of the bank.”
3. Special resolution number 3“Resolved that the bank be authorised as a general approval to acquire shares issued by its holding company, upon such terms and conditions and in such amounts as the directors of the bank may from time to time decide, but subject to the provisions of sections 46 and 48 of the Act, the memorandum of incorporation of the bank and, insofar as they may be applicable, the Banks Act, 1990 (Act 94 of 1990), as amended (“the Banks Act”) and the Listings Requirements of the JSE Limited (“JSE”), provided always that:
• This general approval shall expire at the date of the bank’s next AGM in 2012 or 3 September 2012, whichever is the earlier;
• Purchases of securities in the listed holding company will only be effected through the order book operated by the JSE trading system and done without any prior understanding or arrangement between the bank and the counterparty (reported trades are prohibited);
• An announcement must be published when the bank has acquired on a cumulative basis, 3% of the number of shares the holding company had in issue prior to the acquisition, pursuant to which the aforesaid 3% threshold is reached, containing full details thereof as well as for each 3% in aggregate of the initial number of that class acquired thereafter;
• Acquisitions by the bank of shares in its holding company will be limited to an aggregate of 10% of the holding company’s issued capital as at the date this authority is granted;
• The bank will not purchase shares in the holding company at a price more than 10% above the weighted average of the market value for the fi ve business days immediately preceding the date of acquisition. To the extent applicable, the JSE will be consulted for a ruling if the company’s securities have not traded in such fi ve business day period;
• The bank will at any point in time, if applicable, appoint only one agent to effect any purchase(s) of the holding company’s shares.
4. Special resolution number 4“Resolved in terms of section 45(3)(a)(ii) of the Act, as a general approval, that the board of the bank be authorised to approve that the bank provides any direct or indirect fi nancial assistance (“fi nancial assistance” will herein have the meaning attributed to it in section 45(1) of the Act) that the board of the bank may deem fi t to any company or corporation that is related or inter-related (“related” and “inter-related” will herein have the meaning attributed to it in section 2 of the Act) to the bank, on the terms and conditions and for amounts that the board of the bank may determine.”
Shareholders’ calendar
Financial year-end29 February 2012
Profi t announcement28 March 2012
Integrated annual reportMay 2012
Annual general meeting1 June 2012
Interim reportSeptember 2012
Ordinary dividend
JSE codeCPI
ISINZAE 000035861
Final dividend number 16 was paid on 26 March 2012
Salient dates for the dividend payment were:
Last day to trade cum dividendThursday, 15 March 2012
Record dateFriday, 23 March 2012
Administration and addresses
Capitec Bank Holdings Limited
Registration number1999/025903/06
AuditorsPricewaterhouseCoopers Inc.
DirectorsMS du Pré le Roux (Chairman)R Stassen (Chief executive offi cer)AP du Plessis (Financial director)RJ Huntley (Ms) (appointed 14 April 2011)MJ JoosteJD McKenzie (appointed 1 March 2012)MC Mehl (Prof)NS Mjoli-Mncube (Ms)PJ MoutonCA OttoJG Solms (retired 3 June 2011)JP van der Merwe
SecretaryCG van Schalkwyk
Registered address1 Quantum Street, Techno Park,Stellenbosch 7600
Postal addressPO Box 12451, Die Boord,Stellenbosch 7613
Websitewww.capitecbank.co.za