marketing dashboards & causal modeling€¦ · drill downs multiple data sources high support...
TRANSCRIPT

1105 Burlingame Avenue Burlingame CA 94010 650.685.4400 main | 650.685.4401 fax | www.firewhite.com© 2004. This presentation and all derivative works are copyrighted to Firewhite Consulting, Inc.
Marketing Dashboards & Causal Modeling

2
Why we’re here
Discuss how to use data to build the right kind of marketing scorecards Based on our work with Fortune 500 clients in retailing, technology, and other sectorsPractical, hands on approach
TERMSscorecard = dashboard
3
What you will learn
How accountability hurts and helpsThe 5 different types of dashboardsHow causal models help

4
Good News
CEOs want to partner with CMOs to grow the business

5
Bad News
It’s a killing field out thereThe average tenure of a CMO is 18-22 months

6
Accountability
The new imperativeMarketing often the only discretionary dollars left at your company with the exception of R&DWhat you spend today better drive revenue tomorrowSame time – enormous pressure to “up the activity level” – often in ways that make little sense

7
Dashboard typesLEVEL 1 LEVEL 2 LEVEL 3 LEVEL 4 LEVEL 5
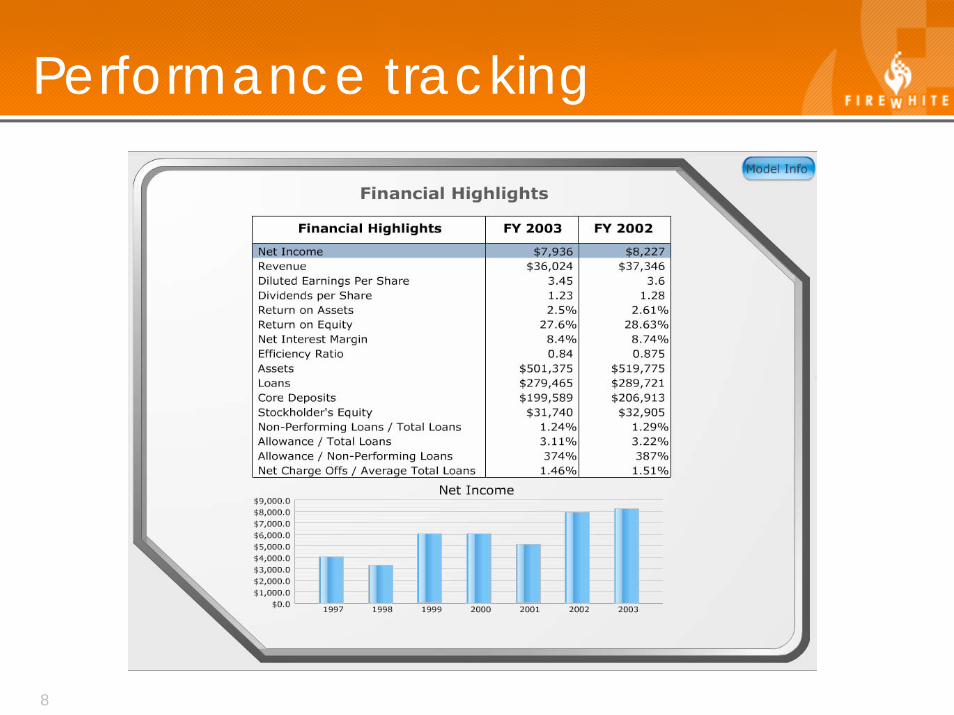
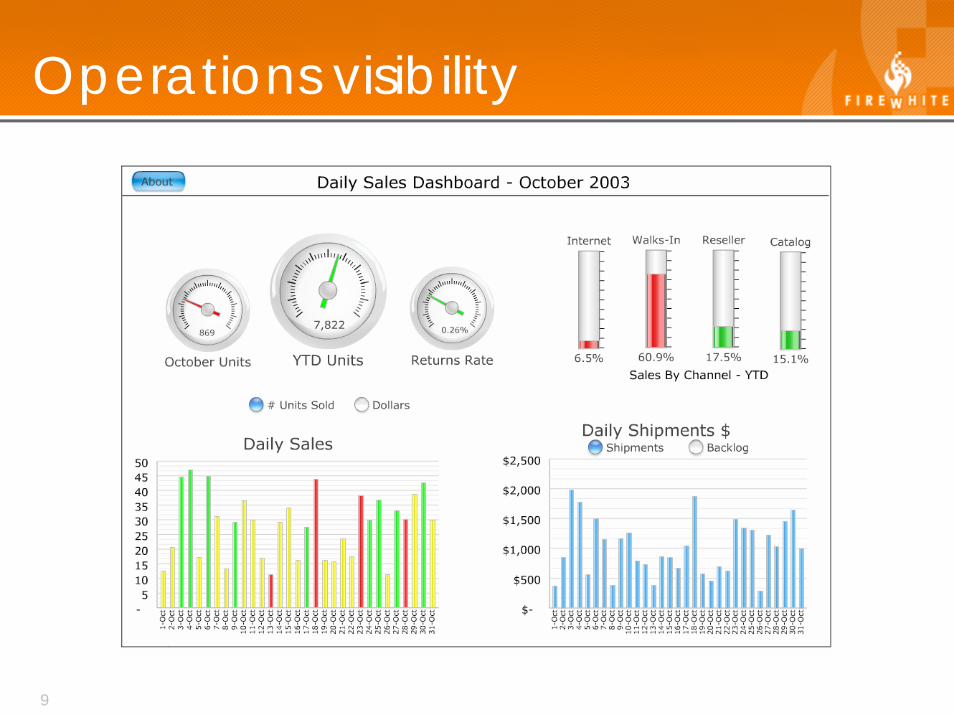
Type Performance Operations Collaborative Marketing Predictive
Accountability Limited Low Moderate High High
Decisions supported
TacticalShort term
TacticalShort term
Track progressQuarterly
Track resultsBackwards looking
Track results Optimize investment strategiesBoth backwards and forwards looking
Data requirements
Existing financial reports
Data feeds from CRM/SFA systems
Data feeds from multiple ERP systems
Multiple data feeds from both within and outside the company
Multiple data feedsfrom both within and outside the companyIncludes predictive models using most recent data
Technology requirements
Minimal LowDatabase Query & Reporting
ModerateMulti-user
ModerateDrill downsMultiple data sources
High Support for OLAPPredictive Analytics
8
Performance tracking
9
Operations visibility
10
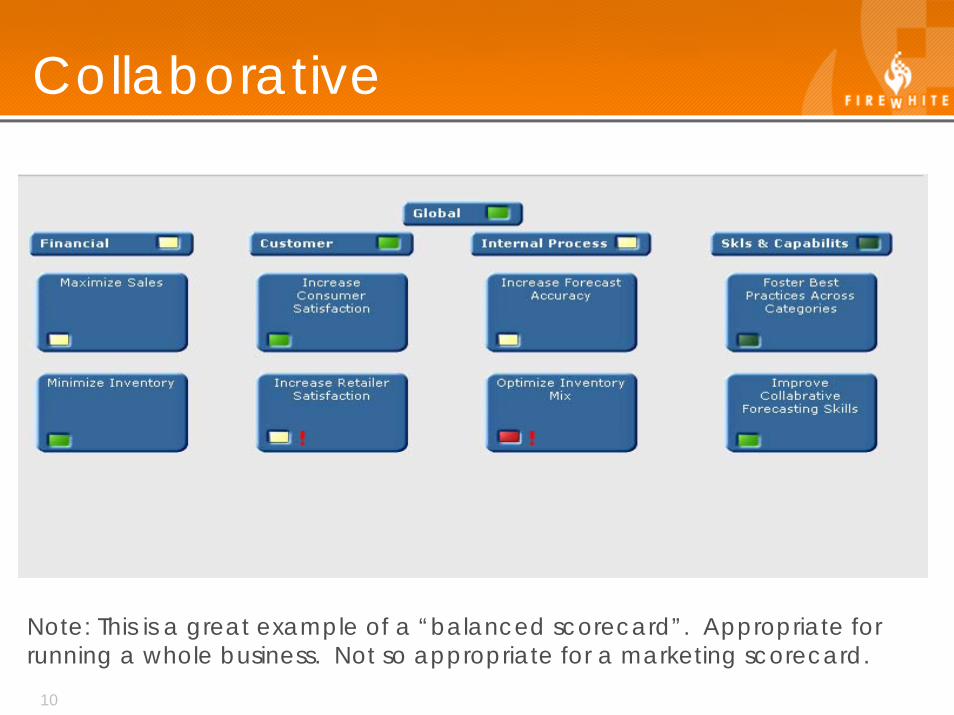
Collaborative
Note: This is a great example of a “balanced scorecard”. Appropriate for running a whole business. Not so appropriate for a marketing scorecard.

11
Marketing
12
Predictive
Final stage in evolution of dashboardsDiscussed extensively in next section
13
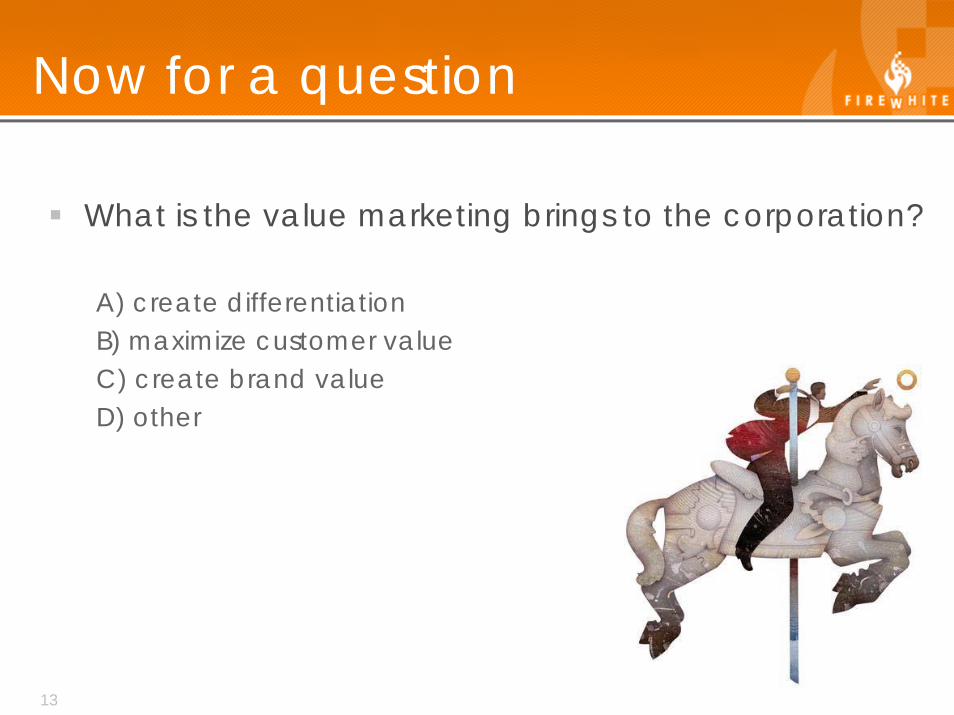
Now for a question
What is the value marketing brings to the corporation?
A) create differentiationB) maximize customer valueC) create brand valueD) other

14
Point of this exercise
The answer is B maximize customer value
Clarity of marketing mission is paramountEvery company has different set of strategies, initiatives, and objectives
Mission
Strategy
Initiatives & Objectives
Revenue and profits
15
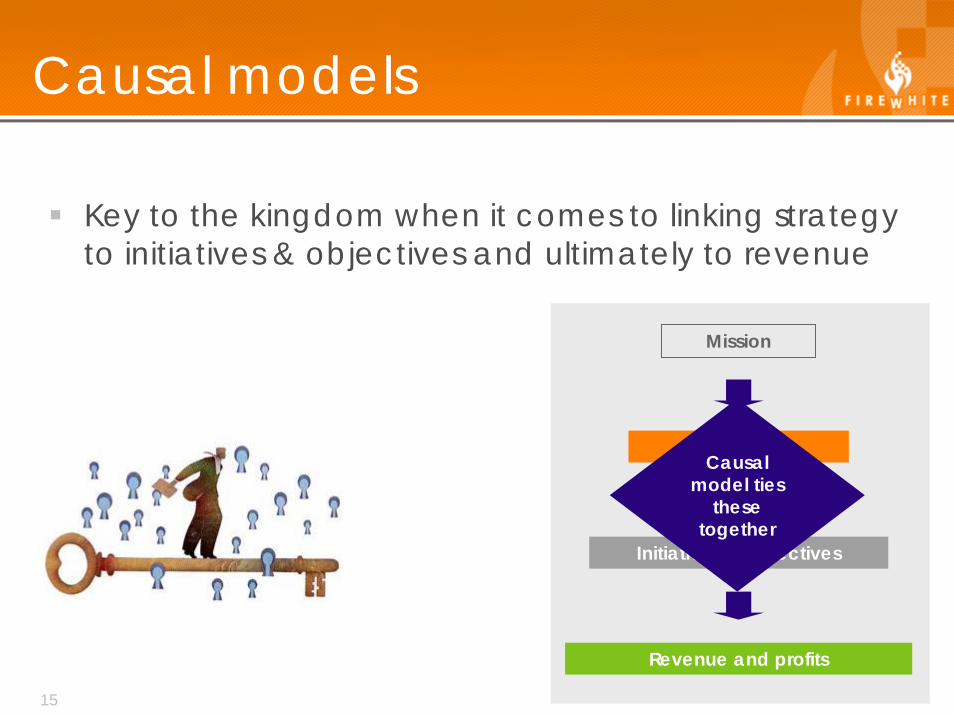
Causal models
Key to the kingdom when it comes to linking strategy to initiatives & objectives and ultimately to revenue
Mission
Strategy
Initiatives & Objectives
Revenue and profits
Causal model ties
these together

16
Causal modelCausal model defined…
A system that describes the underlying cause and effect relationships underlying your goalTells how aligned your world is with the real worldRequired method: hypothesize test learn update
Goal
Cause A Cause B Cause C
Cause D

17
SimCity ExamplePleasant,
growing cityMetrics:Mayor RatingCity FinancesConsumer Confidence

18
SimCity causal modelPleasant,
growing city
Quality of life Healthy economy
Demographics
Infrastructure quality
Environmental quality
Energy supply
Municipal service levels
Metrics:Mayor RatingCity FinancesConsumer Confidence
Number of employers
Tax levels

19
Marketing example
GeneralizedPlatform for discussion – let’s hear your questionsWon’t cover each element in excruciating detail
20
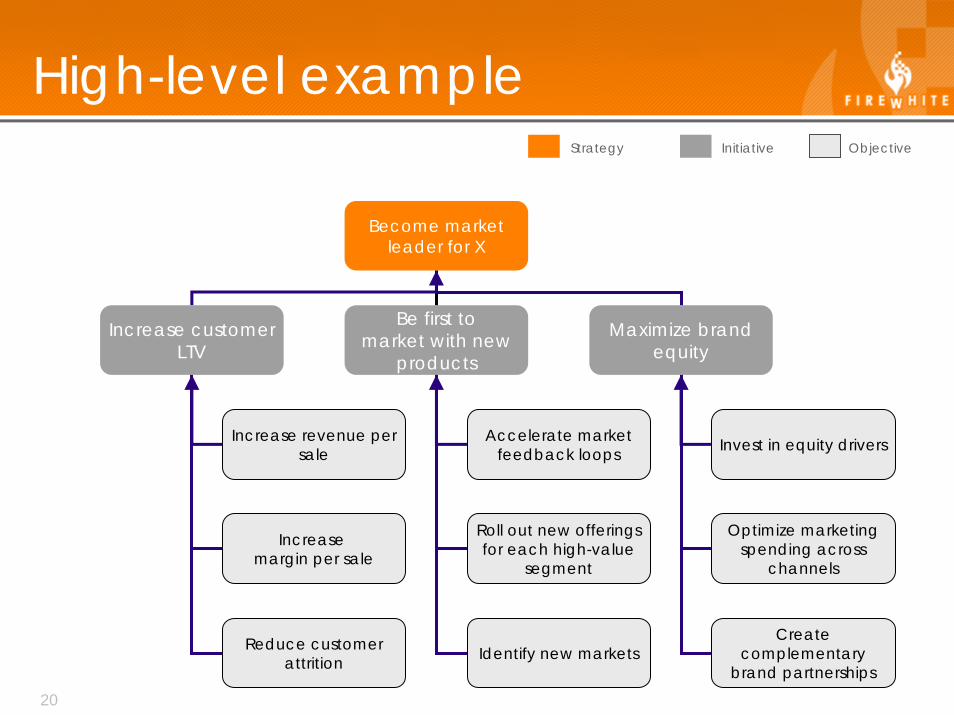
High-level exampleStrategy Initiative Objective
Become market leader for X
Increase customer LTV
Be first to market with new
products
Maximize brand equity
Increase revenue per sale
Increase margin per sale
Reduce customer attrition
Accelerate market feedback loops
Roll out new offerings for each high-value
segment
Invest in equity drivers
Optimize marketing spending across
channels
Create complementary
brand partnershipsIdentify new markets

21
More granular exampleStrategy Initiative Objective
Increase customer LTV
Increase revenue per sale
Increase margin per sale
Reduce customer attrition
Improve segment mix
Adjust product mix
Enhance up-sell & cross-sell programs
Engineer pricing
Reduce dependence on promotional pricing
Reduce customer dissatisfaction
Increase loyalty program membership
Accelerate rollout of new products

22
Don’t go overboard
Prioritize objectives that make sense for the business, not just marketingToo much granularity upfront will make your scorecard unwieldy
23
Metrics
Obvious next step – after you’ve established a causal model that you think will workMetrics you pick should be designed to turn the data you have into information that sheds light on resultsChoice of metrics
Depends on what data you have, can have, will never get
If the data is important, get it – you can only manage what you can measure
Need a mix of historical measures as well as leading indicators

24
Examples
Example Metrics
Adjust product mix
Enhance up-sell & cross-sell programs
• Rate of growth of desired segments • Revenue per sale to desired segments• Satisfaction rate by segment
Improve segment mix
Increase revenue per sale
• Ratio of sales from new products vs. existing products• Number of new products schedule for launch in quarter• New product development spending
• Ratio of up-sell cross-sell revenue vs. core products• % of upsell/cross-sell merchandize for coming quarter• Number of sales force & customer requests for cross-
sell/up-sell merchandise• Spend on upsell/cross-sell promotion
Metrics talked about in other sessions … we’ll just touch upon them here
25
Setting levels
Make sure you use the right levelPractical guidance
Look backwards then set “stretch” goalsModel, track numbers over time – to set a band around numbers vs. absolute goalsGet the variance right – targeting a band not an absolute number
26
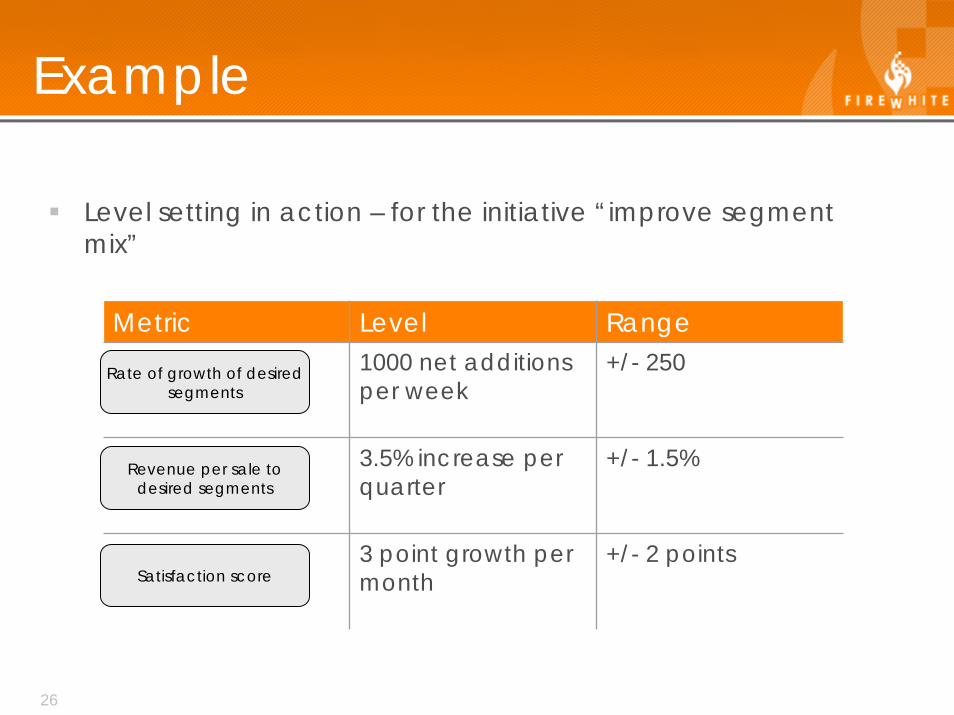
Example
Level setting in action – for the initiative “improve segment mix”
Metric Level Range1000 net additions per week
+/- 250
3.5% increase per quarter
+/- 1.5%
3 point growth per month
+/- 2 points
Rate of growth of desired segments
Revenue per sale to desired segments
Satisfaction score

27
KPIs
Key Performance Indicators …performance snapshotsDrill down to where you need to goShould be statistically modeled to maximize utility
Multivariate regression, if possibleIf not, work towards it
28
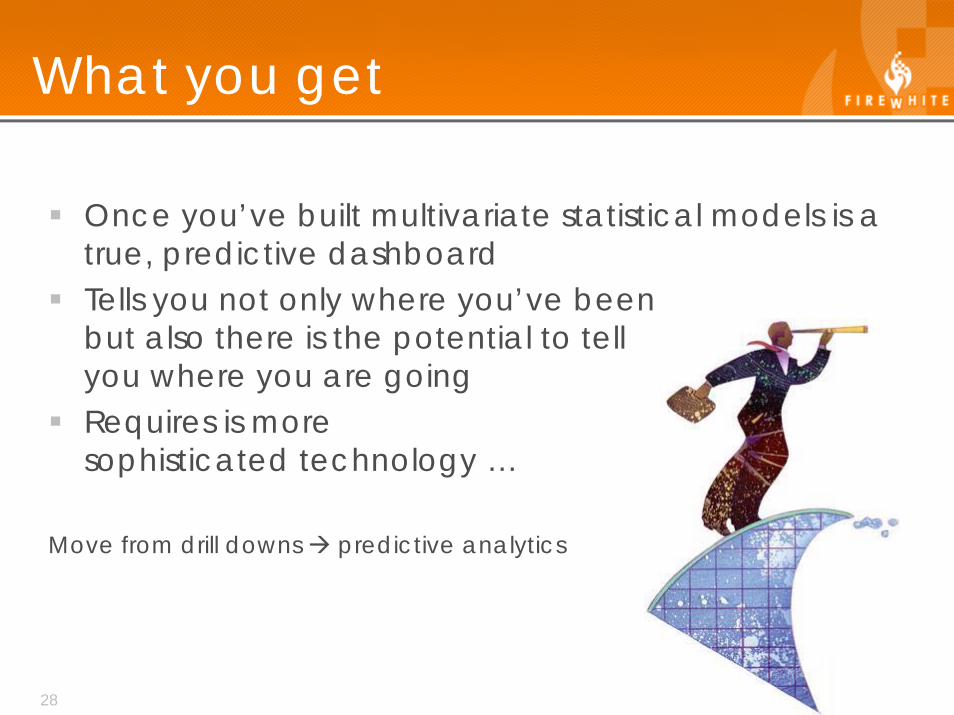
What you get
Once you’ve built multivariate statistical models is a true, predictive dashboardTells you not only where you’ve beenbut also there is the potential to tell you where you are goingRequires is more sophisticated technology …
Move from drill downs predictive analytics

29
Drill down exampleDashboard
Click to see metrics that
compose the KPI

30
Drill down exampleKPI
Click to see trend for overall metric
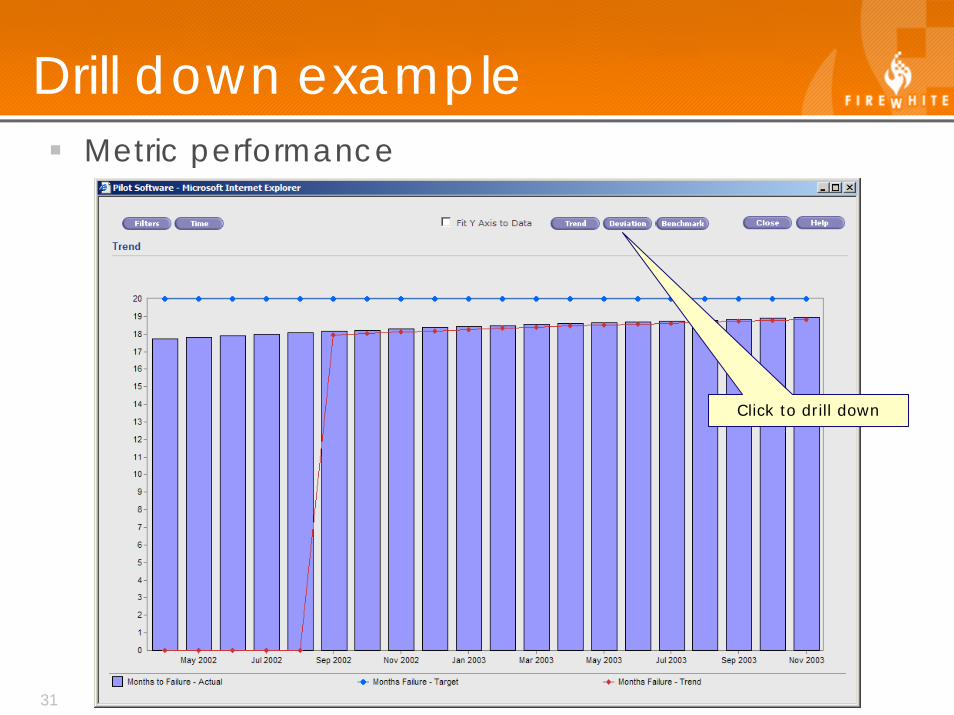
31
Drill down exampleMetric performance
Click to drill down

32
Drill down exampleMetric components
Problems in RED
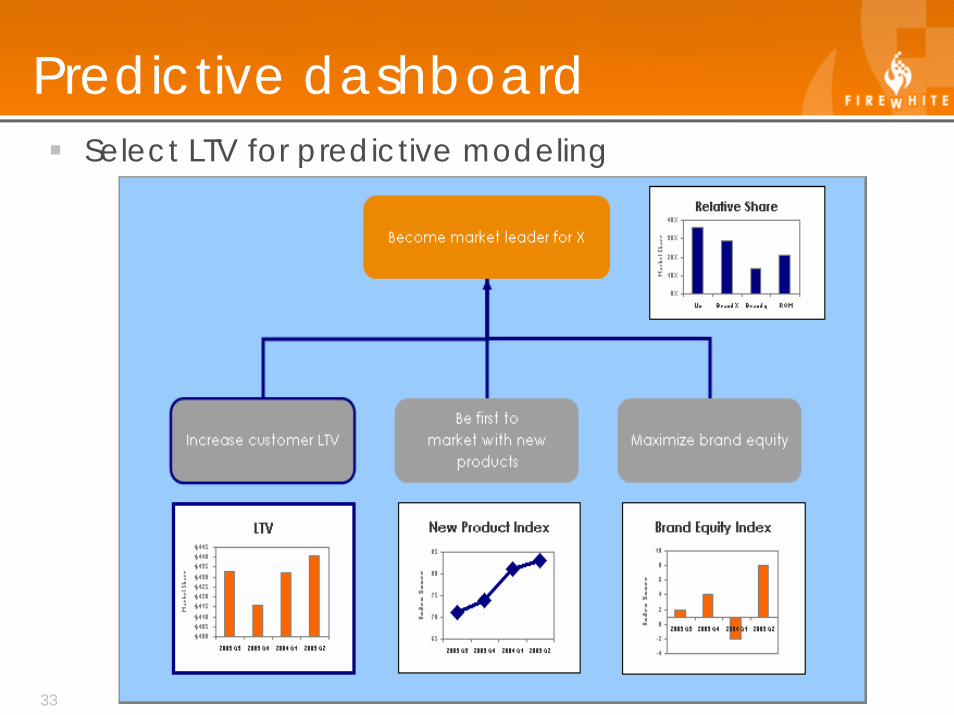
33
Predictive dashboardSelect LTV for predictive modeling

34
Predictive modelingPredict impact of changes in KPI on market shareAssess ROI of alternative growth paths
35
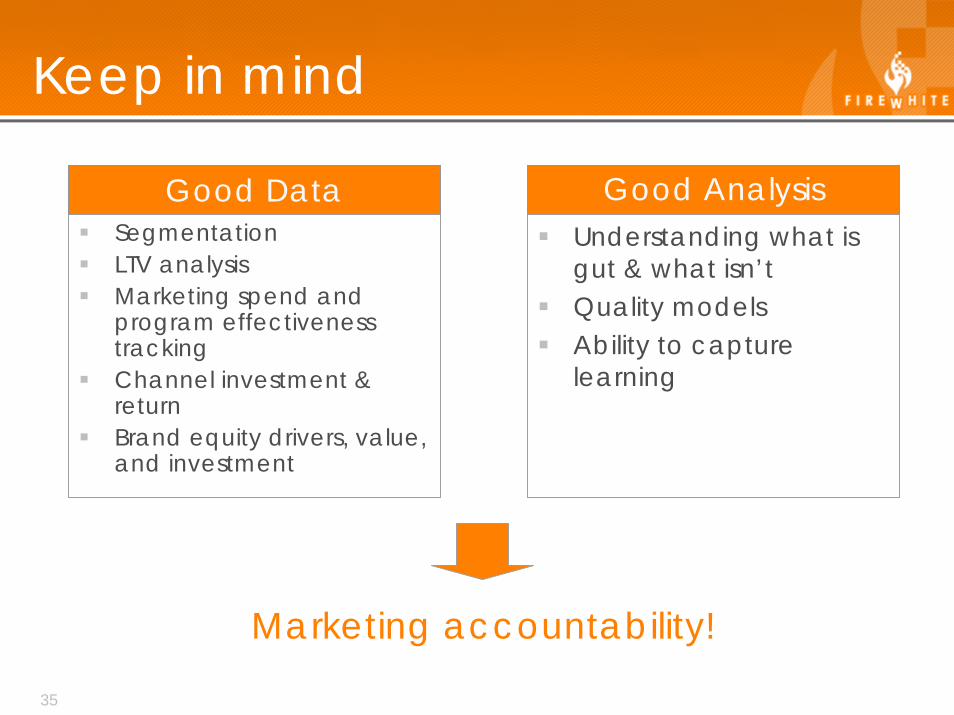
Keep in mind
Good Data Good AnalysisUnderstanding what is gut & what isn’tQuality modelsAbility to capture learning
SegmentationLTV analysisMarketing spend and program effectiveness trackingChannel investment & returnBrand equity drivers, value, and investment
Marketing accountability!

36
Bringing this back
Inside your companyTake a prototype approachUse Excel and/or Flash in the beginning, don’t worry too much about technologyGet metrics, level setting, and statistical models right

37
Questions?LEVEL 1 LEVEL 2 LEVEL 3 LEVEL 4 LEVEL 5
Type Performance Operations Collaborative Marketing Predictive
Accountability Limited Low Moderate High High
Decisions supported
TacticalShort term
TacticalShort term
Track progressQuarterly
Track resultsBackwards looking
Track results Optimize investment strategiesBoth backwards and forwards looking
Data requirements
Existing financial reports
Data feeds from CRM/SFA systems
Data feeds from multiple ERP systems
Multiple data feeds from both within and outside the company
Multiple data feedsfrom both within and outside the companyIncludes predictive models using most recent data
Technology requirements
Minimal LowDatabase Query & Reporting
ModerateMulti-user
ModerateDrill downsMultiple data sources
High Support for OLAPPredictive Analytics

38
Coordinates
Firewhite Consulting, Inc.1105 Burlingame AvenueBurlingame, CA 94010
650.685.4400 talk650.685.4401 fax650.270.4309 mobilewww.firewhite.com