marketing research 4e - textbook media · the essentials of marketing research, 4th edition (which...
TRANSCRIPT

Textbook Media Press
Replacing Oligarch Textbooks since 2004
The Quality Instructors Expect
At Prices Students Can Afford
The Essentials of Marketing Research
About the new 4th Edition:
Identifying and assessing information is a key to a successful marketing strategy. The Essentials of Marketing Research, 4th Edition (which was previously published by Routledge and has been totally revamped for our “textbook media” model) guides the student in designing, conducting and interpreting marketing research. This comprehensive textbook covers the full range of topics, including: Secondary research and data mining Marketing research ethics Internet marketing research Qualitative and exploratory research Data collection tool design and deployment Qualitative data analysis Statistical analysis Research report preparation With learning objectives at the beginning of each chapter, 24 cases and free data sets, this book offers a range of tools to help students develop and test their research and analytical skills.
Just Published! 2016 ©
4e
Lawrence S. Silver, Southeastern Oklahoma State University Robert Stevens, Southeastern Oklahoma State University Courtney Kernek, Southeastern Oklahoma State University Bruce Wrenn, Andrews University David Loudon, Samford University

Instructor’s Manual
Test Item File
Computerized Test Bank
PowerPoint Lecture Slides
To Request a Review Copy
For Instructors
4th Edition Student Options & Prices
Textbook Media offers an alternative path.
We specialize in acquiring the rights to under-served textbooks from the big publish-
ers, and then revising them for our textbook media model. That means a quality text-
book from proven authors—a textbook that was developed by the oligarchs via peer
reviews, and includes a competitive instructor support package. So instructors get
the quality they expect, while knowing they’re keeping course costs reasonable.

3
3
Brief Table of Contents
Part I: THE MARKETING RESEARCH PROCESS AND DECISION MAKING 2
Chapter 1: Introduction to Marketing Research 3
Chapter 2: Ethics in Marketing Research 29
PART II: SECONDARY DATA AND RESEARCH DESIGNS 51
Chapter 3: Secondary Data 52
Chapter 4: Research Designs: Exploratory and Qualitative Research 71
Chapter 5: Research Designs: Descriptive and Causal Research 97
PART III: MEASUREMENT, DATA COLLECTION, AND SAMPLING 123
Chapter 6: Measurement 124
Chapter 7: Primary Data Collection 154
Chapter 8: Designing the Data-Gathering Instrument 176
Chapter 9: Sampling Methods and Sampling Size 192
Chapter 10: Fielding the Data-Gathering Instrument 213
Chapter 11: Analyzing and Interpreting Data for Decisions 235
Chapter 12: Analyzing Qualitative and Big Data 257
Chapter 13 : Advanced Data Analysis 269
Chapter 14: The Research Report 289
PART IV: CASES c-1 (accompanied by free data-sets for your students)
INDEX i-1
Case 1 Lone Pine Kennel Club c-2
Case 2 Silver Jewelry Stores c-4
Case 3 Select Hotels of North America c-7
Case 4 River Pines School: A c-10
Case 5 River Pines School: B c-13
Case 6 Gary Branch, CPA c-18
Case 7 Juan Carlos’ Mexican Restaurant c-24
Case 8 Usedcars.com c-31
Case 9 Welcome Home Church c-38
Case 10 The Learning Source c-43
Case 11 Madison County Country Club c-47
Case 12 Plasco, Inc. c-52
Case 13 St John’s School c-56
Case 14 The Webmasters c-61
Case 15 House of Topiary c-65
Case 16 Professional Home Inspection c-68
Case 17 Europska Databanka c-75
Case 18 Northside Chiropractic Services c-81
Case 19 Internet Versus Mail Surveys c-86
Case 20 Louisiana Purchase Gardens and Zoo c-90
Case 21 Mac’s Sausage Company c-96
Case 22 The Online Marketplace c-100
Case 23 Victorian Rose Gift and Flower Shop c-104
Case 24 MCS Publishing Company c-109
Measurement, Data Collection,
and Sampling
Part 3
Chapter
6 6.1 INTRODUCTION
6.2 THE PROCESS OF MEASUREMENT
Step 1: Determine the Construct(s) of
Interest
Step 2: Specify the Construct’s Domain
Step 3: Establish Operational Definitions
Step 4: Collect Data to Test Measures
Step 5: Purify the Measures
Step 6: Conduct Validity Tests
Step 7: Analyze Research Findings
6-2a Commentary on the Measurement
Process
6-3 WHAT IS TO BE MEASURED?
6-4 WHO IS TO BE MEASURED?
6-5 HOW TO MEASURE WHAT NEEDS TO BE
MEASURED
6-5a The Nominal Scale
6-5b The Ordinal Scale
6-5c The Interval Scale
6-5d The Ratio Scale
6-6 ASSESSING RELIABILITY AND VALIDITY OF OUR MEASURES
6-6a Reliability
6-6b Validity
6-6c Commentary on Reliability and Va-lidity
6-7 MEASURING PSYCHOLOGICAL VARIA-BLES
6-7a Attitude Measurement
6.7b Itemized Rating Scales
6-7c Likert Scales
6-7d Rank-Order Scales
6-7e Comparative Rating Scales
6-7f Semantic Differential Scales
6-7g Stapel Scales
6-7h Commentary on Scales
SUMMARY DISCUSSION QUESTIONS
ENDNOTES
Measurement
Chapter Outline

Silver, Stevens, Kernek, Wrenn & Loudon The Essentials of Marketing Research 4e
Chapter 6 -125- Measurement
-125-
Learning Objectives
Upon completing this chapter, you should understand:
What is meant by the measurement process. The differences in nominal, ordinal, interval, and ratio levels of measurements. The concepts of validity and reliability of measurement. What is meant by a measurement scale. How scales are used in marketing research.
6.1 INTRODUCTION
In Chapter 1 we described marketing research as
producing the information managers need to make marketing decisions. In that chapter we also listed numerous examples of how the results of marketing research can inform marketing decisions such as in concept and product testing, market segmenta-tion, competitive analysis, customer satisfaction studies, and the like. These, and many other exam-ples of marketing research studies, illustrate the need for measurement: “rules for assigning numbers to objects in such a way as to represent quantities of attributes.” 1 Several things we should note about this definition:
1. Not all of what researchers do involves meas-urement. Researchers are interested in generating information, which leads to knowledge, which leads to better decisions. Sometimes that information is in the form of insights from exploratory research studies such as focus groups, in-depth interviews, projective research, and similar methods. For these techniques we are generating information, but we are not assigning numbers to objects, so we are not measuring. As we have said before, information does not have to have num-bers attached to it to have value; we are dangerously oversimplifying our analysis when we favor information with numbers over that without, simply because it has the appearance of being hard evidence.
2. The “rules for assigning numbers” will be discussed in greater depth in this chapter, but we should note here that those rules exist so that we can be more scientific in our measures, and can place more confidence in the numbers that those rules help generate (see Figure 1.2). We want to make decisions that are grounded in information that we believe correctly represent reality. This means the assignment of numbers should map the empirical nature isomorphically (i.e., on a “one-to-one” basis).

Silver, Stevens, Kernek, Wrenn & Loudon The Essentials of Marketing Research 4e
Chapter 6 -126 Measurement
-126-
For example, if we assign the number “5 pounds” to
represent the weight of an object, we want to make sure that the weight is 5 pounds and not 8 pounds or 3 pounds. Using a carefully calibrated scale is how we ensure in this ex-ample that we have correctly measured the item’s weight—assigned numbers to the object to accurately represent the quantity of its attribute of weight. The mundane nature of this example disappears when we find ourselves confronted with the need to measure variables of interest to marketers such as intentions, attitudes, and perceptions. How can we
be sure that the number “4” correctly captures the intensity with which a re-spondent holds an intention, for example? We will devote further discussion to the ways of ensuring good measures in our research in this chapter.
3. The definition states that we attach numbers to the attributes of an object and not to the object itself. For example, we cannot measure the quantity of what you are now holding in your hand or viewing on your screen. There is no scale for measuring the amount of “bookness” in a book. We can, however, measure the attributes of a print book—its weight, dimensions in inches, number of pages, and so forth. We can even measure qualities less obvious such as its stature as great literature or its educational value; but, as described in point number 2, the rules for assigning numbers to those attributes will involve different measuring devices than those used to measure its physical properties. This caveat also holds true for the measurement of variables of interest to marketers.
We measure a consumer’s attitudes, income, brand loyalty, and other things, instead of measuring the consumer. In some cases, such as attitudes, we go a step further and measure the subcomponents of the variable. Attitudes, for example, are said to consist of cognitive, affective, and conative components that we would want to measure to ensure we have captured the essence of how strong a person’s attitude was toward an object. For example, if we are to claim we have measured a parent’s attitude toward a new product concept for a child’s fruit drink, we need to measure beliefs and knowledge (the cognitive component of attitudes), how positive or negative he or she feels about the concept (the affective component), and the parent’s predisposition to behave toward the product (the conative component).
4. Scientists in the physical sciences such as physics, chemistry, and biology have something of an advantage over behavioral scientists because the things physical scientists are interested in measuring have a physical reality, and the devices used to measure these things can be physically calibrated. Accurate measures are gen-erated by carefully calibrating the measuring devices (such as micrometers and weight scales). Behavioral scientists, such as marketing researchers, cannot see or feel those things of interest to them (perceptions, intentions, brand loyalty, atti-tudes), and so must find ways of determining if the process they use to attach numbers is trustworthy in order to know if the numbers resulting from that pro-

Silver, Stevens, Kernek, Wrenn & Loudon The Essentials of Marketing Research 4e
Chapter 6 -127- Measurement
-127-
cess are trustworthy. In other words, while a chemist can trust that the weight of
a chemical is what a carefully calibrated scale says it is, the marketing researcher can trust that he or she has obtained a good measure of intent to purchase only by having faith in the measurement process used to attach numbers to that inten-tion. There is no way of comparing the numbers on the intention scale to a stand-ardized measure for intentions the way a chemist can check the measures of weight against a standardized scale for weight. We trust the numbers because we trust the process used to attach those numbers.
6.2 THE PROCESS OF MEASUREMENT
Information gained from conducting marketing research contributes to better deci-sion making by reducing risk, which can happen only if researchers are able to collect
information that accurately represents the phenomenon under study. When it is ap-propriate to measure that phenomenon, that is, attach numbers to reflect the amount of an attribute inherent in that object of interest, we must try to ensure that the pro-cess we use to take those measures is a good process. We have nothing to compare those numbers with to determine if they are good numbers, so we make sure the pro-cess is trustworthy so that we can believe the numbers resulting from the process are trustworthy and can indeed reduce the risk of decision making. The following pro-cess can help generate good measures (see Figures 6.1 and 6.2).
Figure 6.1.
Measurement Hierarchy
Note: Circled numbers represent
the stage of the process out-
lined in Figure 6.2 that the activi-ty occurs.
Silver, Stevens, Kernek, Wrenn & Loudon The Essentials of Marketing Research 4e
Chapter 6 -128 Measurement
-128-
Step 1: Determine the Construct(s) of Interest
Constructs are abstract constructions (hence, the name) that are of interest to researchers. Some examples of con-structs of interest to marketing researchers are customer satisfaction, heavy users, channel conflict, brand loyalty, and marketing orientation. These constructs are typical of the type of constructions of interest to marketers—they have no tangible reality apart from our defining them (unlike, for example, a botanist’s plant), we define and study them because we need to understand them in order to make decisions based on that understanding (for example, changing our policies on return of purchases in order to increase customer satisfaction). Because they
have no tangible reality they are generally not directly observable. We cannot see customer satisfaction, but we can indirectly observe it by asking customers a series of questions that we believe reveal how satisfied customers are with our firm in specific areas. As an example of measuring a construct we will use “marketing orienta-tion”—a core construct of the marketing discipline.
Step 2: Specify the Construct’s Domain
We must take care that we are accurately capturing what should be included in the definition of that construct. We previously mentioned that the tricomponent model indi-cates that an attitude contains in its domain cognitive, affective, and conative components. Social scientists have studied the construct “attitude” over many years and have generally agreed that its domain includes these three components. We specify a construct’s domain by providing a constitutive definition for the construct. A constitutive definition defines a construct by using other constructs to identify conceptual boundaries, showing how it is discernable from other similar but different con-structs. A construct’s constitutive definition is what has
been generally accepted in the marketing literature as a definition. Consider the constitutive definitions for the following related, but different, constructs:
Marketing orientation is the attention to identifying and satisfying customer needs, integration of effort by all areas of the organization to satisfying those needs, and focusing on the means by which an organization can achieve its goals most effi-ciently while satisfying those needs. Market orientation is the systematic gathering of information on customers and competitors, both present and potential, the systematic analysis of the information for the purpose of developing marketing knowledge, and
FIGURE 6.2. Developing
Good Measures: The Measurement Process
Step 1:
Determine the Construct(s)
of Interest
Step 2: Specify the Construct’s Domain
Step 3: Establish Operational Definitions
Step 4: Collect Data to Test Measures
Step 5: Purify the Measures
Step 6: Conduct Validity Tests
Step 7: Analyze Research Findings

Silver, Stevens, Kernek, Wrenn & Loudon The Essentials of Marketing Research 4e
Chapter 6 -129- Measurement
-129-
the systematic use of such knowledge to guide strategy recognition, understanding,
creation, selection, implementation, and modification.2
The definition of market orientation is distinguished from marketing orienta-tion by what it adds (a focus on potential customers as well as present customers and on competitors as well as customers), and subtracts (an interfunctional coordi-nation).
Step 3: Establish Operational Definitions
The constitutive definition makes it possible to better define the construct’s domain by use of an operational definition. An operational definition indicates what observa-ble attributes of the construct will be measured and the process that will be used to at-tach numbers to those attributes so as to represent the quantity of the attributes. Of-
ten, a construct’s attributes are identified in the constitutive definition.
We need to establish operational definitions of our constructs to move them from the world of abstract concepts into the empirical world where we can measure them. Marketing orientation remains an abstract concept until we say exactly what its attributes are and how, specifically, we intend to measure those attributes.
One example of operationalizing the marketing orientation construct3 in a hos-pital setting involved identifying five attributes of the construct (customer philoso-phy, marketing information systems, integrated marketing effort, strategic orientation, and operational efficiency), and then generating a set of nine statements for each attrib-ute which fell along a strength of marketing orientation continuum anchored by the end points of “primitive” to “world class.” These statements were assigned a score on the nine-point scale by a panel of expert judges. The following are two examples of statements whose average score by the judges fell at different points on the scale. Respondents (hospital administrators) would choose which statements most accu-rately reflected the marketing practices at their hospital.
These example were two of forty-five item statements (nine statements for each of five attributes), which represent the operationalization of the marketing ori-entation construct.
Figure 6.3 Strength of Marketing Orientation
“Marketing here is more than a staff function—it is heavily involved in line decision making.” (8.35)
“The feeling in my organization is that marketing activity is often contrary to the values of this hospital.” (1.25)
Silver, Stevens, Kernek, Wrenn & Loudon The Essentials of Marketing Research 4e
Chapter 6 -130 Measurement
-130-
Another operationalization4 of marketing orientation involved identifying
four attributes of the construct (intelligence generation, intelligence dissemination, response design, and response implementation), and then generating thirty-two item statements, each of which would be scored on a five-point scale ranging from strongly disagree to strongly agree. Some examples of these operationalizations of the intelligence dissemination attribute (respondents were executives at manufac-turing firms) are:
Note that these two operational approaches differ in the identification of the con-
struct attributes, the item statements used to operationalize the attributes, and the method used to attach numbers to the item statements (also part of the operationaliza-tion process). Both examples, however, share in common the operationalization process of describing a specific set of operations that must be carried out in order to empirically measure the construct’s attributes (i.e., move it from mere abstract con-ceptualization to the real world where it can be measured by establishing a process for attaching numbers to represent the quantity of the attribute—in these cases the de-gree to which a firm exhibits marketing-oriented behavior). Researchers might not choose the same means of operationalizing the constructs of interest. How can we tell if our chosen approach represents good measurement methods if it is different from the methods used by other researchers, who can demonstrate that their methods have resulted, in fact, in good measures? The answer to this question lies in the next steps of the measurement process.
Step 4: Collect Data to Test Measures
In this step we use our operationalized measures to collect data from our target popula-tion (i.e., the measures in Figure 6.1). We need this data to help us determine if we are on the right track with our operationalized measures. That is, have we done a good job in developing the operational definitions and measuring processes so that they accurately represent our constructs of interest? As was mentioned before, since we
We have interdepartmental meetings at least once a quarter to discuss
market trends or strategies.
Data on customer satisfaction are disseminated at all levels in this business unit on a regular basis.
1 2 3 4 5
Strongly disagree Disagree Neither agree Agree Strongly agree
or disagree
1 2 3 4 5
Strongly disagree Disagree Neither agree Agree Strongly agree
or disagree
Silver, Stevens, Kernek, Wrenn & Loudon The Essentials of Marketing Research 4e
Chapter 6 -131- Measurement
-131-
have no standardized measures that can be calibrated to give us accurate data, such
as a chemist using a carefully calibrated weight scale, we must use data to help us deter-mine if the methods used to collect that data were good. If the process of measurement is good the results of the process will also be assumed to be good. “Collecting data” in the previous two examples would consist of using the questionnaires to collect respons-es from the target populations (hospital administrators in the first example, executives at manufacturing firms in the second).
Step 5: Purify the Measures
In Step 5 we use the data collected in Step 4 to determine which items in our original list of operationalized items are reliable. Some items we thought would be good ways to operationalize our abstract constructs may not be as good as we thought. We can de-
termine which item statements are keepers and which are to be rejected for our final item list by conducting reliability tests. We will discuss reliability in greater detail later in this chapter, but for now we are using some statistical procedures to help identify which item statements work together as a set, capturing the various aspects of the construct’s attributes we were seeking to measure in our operationalizations.
For example, the two statements that were used to illustrate the attributes for marketing orientation in the two studies described in Step 2 were keepers — they passed the statistical tests intended to use the collected data to determine which item statements were appropriate pieces of the whole attribute we sought to meas-ure. Other item statements might have failed those tests (the statements did not con-tribute to describing the attribute as we thought they would), and are eliminated from
the final version of our measuring device (questionnaires in these two cases).
Step 6: Conduct Validity Tests
Once we have purified the scale by eliminating item statements that fail to pass our reliability test, we are ready to conduct another test to determine how much faith we will place in the results of our research. Here we are testing for validity—did we actually measure what we were trying to measure? Validity will also be discussed in greater depth later in this chapter. Here, we should merely make note of the need to determine how successful we were in establishing measures that did correctly reflect the quantities of those attributes of our constructs of interest. Did we, in fact, accurately measure the degree to which an organization was marketing orient-
ed?
Step 7: Analyze Research Findings
If we have successfully developed measures that are reliable (Step 5) and valid (Step 6) we are now ready to analyze our data to achieve the objectives of our research study: answer research questions, test hypotheses, check for cause and effect rela-tionships, describe the extent to which a population behaves in a specific manner, and the like. A report can then be written that states the results of the research.

Silver, Stevens, Kernek, Wrenn & Loudon The Essentials of Marketing Research 4e
Chapter 6 -132 Measurement
-132-
6-2a Commentary on the Measurement Process
Note that in this seven-step process data are actually analyzed two different ways. In Steps 5 and 6 data are being analyzed not to determine what are the findings of the re-search itself (i.e., not to obtain answers to the research questions), but rather to de-termine if the process used to collect the data generated results which can be trust-ed—did the process generate reliable, valid information? Both of these measures of da-ta trustworthiness are matters of degree instead of binary yes or no conclusions. We de-termine the degree of reliability and validity rather than determining whether the data are or are not reliable or valid. Once we have established degree of reliability and validity we are in a better position to know how secure we can be in our research conclusions when we analyze the same data in Step 7 to achieve the purpose of doing the research study itself.
We should also point out that some measurement processes5 suggest collecting data twice—once to determine which item statements are reliable (after Step 4), then again after unreliable item statements have been eliminated (between Steps 4 and 5), performing reliability and validity tests on the second set of data, followed by analysis of the data for research findings (Step 7).
Now a reality check: Do all or most marketing research studies actually follow a measurement process similar to the seven step process outlined here? Well, yes and no. Marketing scholars doing research on topics of interest to the discipline of marketing (such as “Does being marketing oriented in-crease a firm’s profit?”), would have to do something like
this process or they might not get their research results published! However, applied marketing-research studies, such as described in this text, are less vigilant in conducting such measurement processes. It should be obvious that all researchers are concerned whether or not they have measures that can be trusted before drawing conclusions and making decisions based on research findings. There-fore, attention to issues of construct domain, proper opera-
tional definitions, appropriate data-collection methods, and reliability and validity checks are efforts intended to generate data that accurately represent the object of the research and can lead to better decisions.
6-3 WHAT IS TO BE MEASURED?
There are many different types of measures used in marketing research. However, most measures fall into one of the following three categories:6
1. States of being—age, sex, income, education, and the like.
2. Behavior—purchase patterns, brand loyalty, and the like.
3. States of mind—attitudes, preferences, personality, and the like.
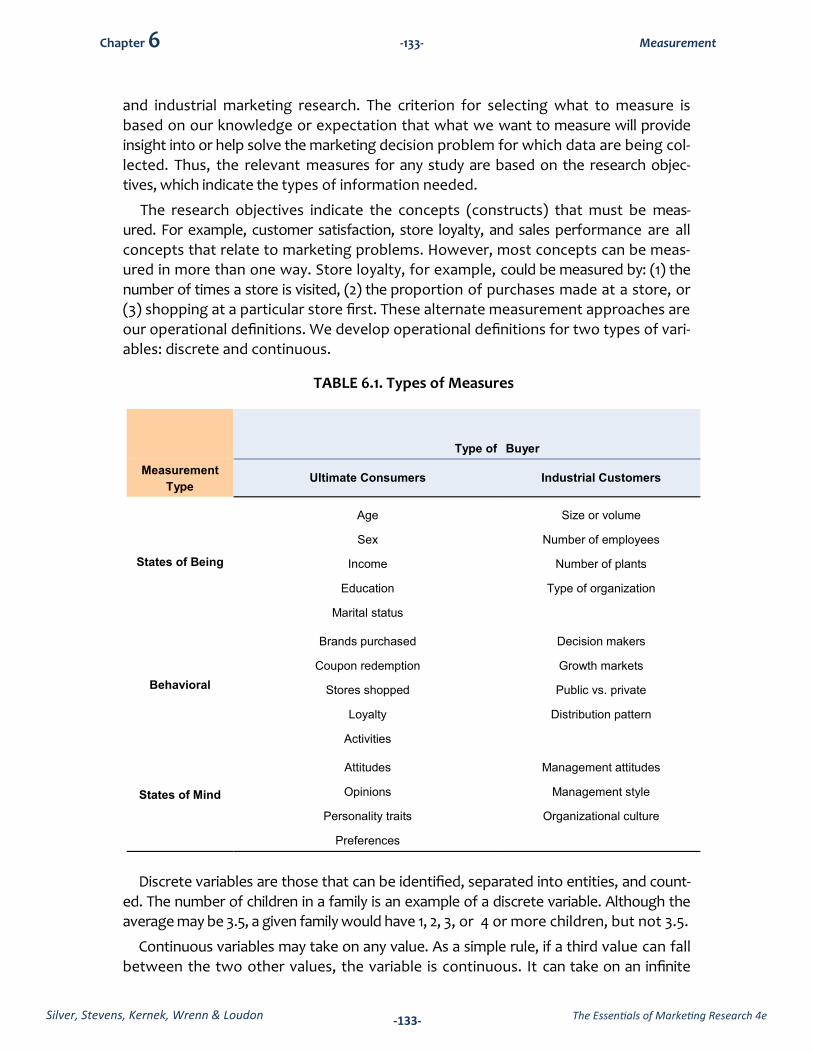
Table 6.1 shows examples of the types of measures frequently used in consumer
Silver, Stevens, Kernek, Wrenn & Loudon The Essentials of Marketing Research 4e
Chapter 6 -133- Measurement
-133-
and industrial marketing research. The criterion for selecting what to measure is
based on our knowledge or expectation that what we want to measure will provide insight into or help solve the marketing decision problem for which data are being col-lected. Thus, the relevant measures for any study are based on the research objec-tives, which indicate the types of information needed.
The research objectives indicate the concepts (constructs) that must be meas-ured. For example, customer satisfaction, store loyalty, and sales performance are all concepts that relate to marketing problems. However, most concepts can be meas-ured in more than one way. Store loyalty, for example, could be measured by: (1) the number of times a store is visited, (2) the proportion of purchases made at a store, or (3) shopping at a particular store first. These alternate measurement approaches are our operational definitions. We develop operational definitions for two types of vari-ables: discrete and continuous.
TABLE 6.1. Types of Measures
Discrete variables are those that can be identified, separated into entities, and count-ed. The number of children in a family is an example of a discrete variable. Although the average may be 3.5, a given family would have 1, 2, 3, or 4 or more children, but not 3.5.
Continuous variables may take on any value. As a simple rule, if a third value can fall between the two other values, the variable is continuous. It can take on an infinite
Type of Buyer
Measurement
Type Ultimate Consumers Industrial Customers
States of Being
Age
Sex
Income
Education
Marital status
Size or volume
Number of employees
Number of plants
Type of organization
Behavioral
Brands purchased
Coupon redemption
Stores shopped
Loyalty
Activities
Decision makers
Growth markets
Public vs. private
Distribution pattern
States of Mind
Attitudes
Opinions
Personality traits
Preferences
Management attitudes
Management style
Organizational culture

Silver, Stevens, Kernek, Wrenn & Loudon The Essentials of Marketing Research 4e
Chapter 6 -134 Measurement
-134-
number of values within some specified range. Temperature, distance, and time are
continuous variables, and each can be measured to finer and finer degrees of accura-cy. Frequently, continuous variables are rounded and converted to discrete variables expressed in convenient units such as degrees, miles, or minutes.
6-4 WHO IS TO BE MEASURED?
The question of the object of the measurement process may appear to have obvious answers: people, stores, or geographic areas. However, more thoughtful answers would reveal a multiplicity of possible objects to be measured.
For example, the level of influence on decision making of a husband and wife de-pends in part upon the product or service being purchased. The resulting decision might be wife dominated, husband dominated, joint, or autonomic (either solitary or
unilateral). Moreover, such decision-making influence can change over time, as evi-denced in recent trends toward female heads of households making financial deci-sions.7 Husband-wife decision making also varies from culture to culture.8 In another study of children’s influence on decision making in the family, it was discovered that about 17 percent of the nine-to-twelve-year-old children survey considered them-selves the main decision maker with regard to a decision to go to a restaurant, and 40 percent thought themselves the primary decision maker in choice of restaurant.9 Thus, collecting data from the “decision maker” does not always represent an obvi-ous choice of respondent.
The buying-center concept used in understanding organizational buying patterns pro-vides a useful framework for other consumer and industrial purchasers.10 A buying cen-
ter consists of everyone involved in a buying action.
Buying-center participants play different roles. These roles must be identified and understood to select the type of respondents to be measured in a research project. These roles are:
Users—those who actually use the product
Gatekeepers—those who control the flow of information or access to decision makers
Influencers—those who influence the choice of product or supplier by providing in-formation
Deciders—those who actually make the choice of product or supplier
Buyers—those who actually complete the exchange process for a family or organization
The major point of this discussion is to emphasize the need to judiciously select the respondents, stores, areas—the “who” to be measured. If we ask questions of the wrong people, we will still get answers, but they will not be meaningful and could even be misleading.

Silver, Stevens, Kernek, Wrenn & Loudon The Essentials of Marketing Research 4e
Chapter 6 -135- Measurement
-135-
6-5 HOW TO MEASURE WHAT NEEDS TO BE MEASURED
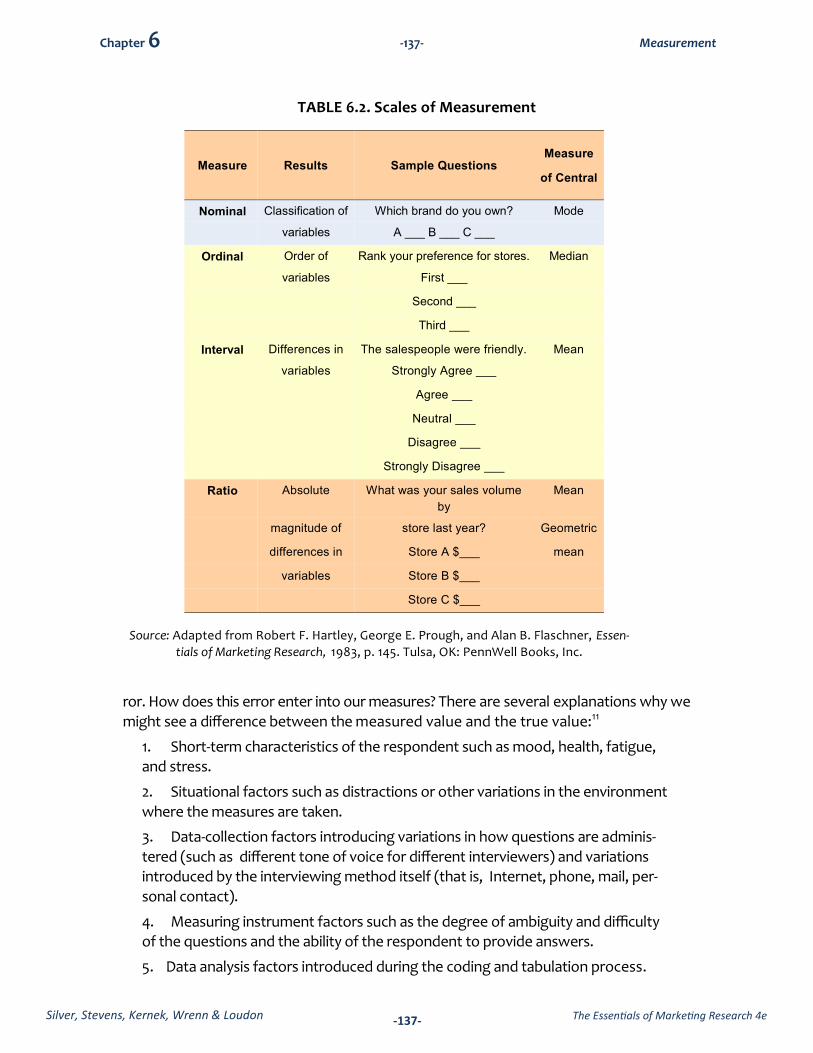
Measurement involves a system of logical decision rules incorporated into a scale. Four scales widely used in marketing research are nominal, ordinal, interval, and ratio scales. These are listed in order of the least sophisticated to the most sophisticated in terms of the amount of information each provides. The scale classification of a measure de-termines the appropriate statistical procedure to use in analyzing the data generated through the measurement process.
6-5a The Nominal Scale
The nominal scale is the lowest level of measurement. It measures difference in kind (male, female, member, nonmember, and the like). Many people consider a nominal scale a qualitative classification rather than a measurement. It produces categorical
data rather than the metric data derived from more advanced scales. While numbers may be used as labels (e.g., 0 for males, 1 for females), they can be replaced by words, figures, letters, or other symbols to identify and distinguish each category. Nominal scales are said to recognize differences in kind, but not differences in degree. As a result, nominal scales tend to oversimplify reality. All items assigned to the same class are assumed to be identical.
Summaries of data from a nominal scale measurement are usually reported as a count of observations in each class or a relative frequency distribution. A mode, or most frequently observed case, is the only central tendency measure permitted. Since the nominal scale does not acknowledge differences in degree, there are no useful measures of dispersion (such as range, standard deviation, and variance). This scale
calls for nonparametric statistical techniques such as chi-square analysis.
6-5b The Ordinal Scale
The ordinal scale goes a step further than the nominal scale to introduce a direction of difference. If measurement can be ordered so that one item has more than, or
less than, some property when compared with another item, measurement is said to be on an ordinal scale. Ordinal scales are frequently used in ranking items such as best, or second best. Such a ranking reveals position, but not degree. For example, if favorite vacation destinations are rank ordered, it may be determined that Florida ranks first, the Rocky Mountains second, and New England third, but it is not clear
if all three are relatively close in desira-bility, or if Florida is much more desira-ble and the Rockies and New England are distant second and third choices.
The most appropriate statistic describ-ing the central tendency on an ordinal scale is the median. Dispersion can be quantified using the range, interquartile range, and percentiles.

Silver, Stevens, Kernek, Wrenn & Loudon The Essentials of Marketing Research 4e
Chapter 6 -136 Measurement
-136-
6-5c The Interval Scale
Measurement is achieved on an interval scale with two features: (1) a unit of meas-urement, and (2) an arbitrary origin. Temperature, for example, is measured by in-terval scales. Each scale has a unit of measurement, a degree of temperature. An inter-val scale indicates a difference, a direction of difference, and a magnitude of differ-ence, with the amount expressed in constant scale units. The difference between 20 and 30 degrees represents the same difference and direction as the difference between 100 and 110 degrees.
The arbitrary origin of the interval scale means there is no natural origin or zero point from which the scale derives. For example, though both Fahrenheit and Celsius scales are used to measure temperature, each has its own zero point.
The arithmetic mean is the most common measure of central tendency or average. Dis-persion about the mean is measured by the standard deviation. Many researchers will assume their measures are interval level measures to permit the use of more powerful statistical procedures. Great care must be used here to avoid the use of inappropriate statistical procedures.
6-5d The Ratio Scale
The most advanced level of measurement is made with a ratio scale. This scale has a nat-ural origin. Zero means a complete absence of the property being measured. Prop-erties measured on a ratio scale include weight, height, distance, speed, and sales. Measurement on a ratio scale is less frequent in marketing research than in the physical
sciences. All the common descriptive and analytical statistical techniques used with interval scales can be used with ratio scales. In addition, computation of absolute magnitudes are possible with a ratio scale, but not with an interval scale. Therefore, while it cannot be said that 100°F is twice as hot as 50°F (it is not when converted to Celsi-us), it can be said that $2 million in sales is twice as much as $1 million in sales.
Table 6.2 (next page) is a summary of these measurement levels along with sam-ple types of variables and questions used in their measurement.
6-6 ASSESSING RELIABILITY AND VALIDITY OF OUR MEASURES
In a perfect world our measures would exactly represent the construct under study, with no bias or error introduced into the measurement process. Since we live in an im-perfect world we must expect that the numbers we collect in our research to repre-sent our constructs will contain a certain amount of error. In other words, if M rep-resents our measures (i.e., numbers) and T represents the true, accurate quantity of our construct we are trying to measure, we could represent the relationship as
M = T + E
where E represents errors introduced into the measure. Here we see that any numbers that are collected in the measurement process to represent the attributes of the con-struct of interest contain the true quantity of the attribute plus a certain amount of er-
Silver, Stevens, Kernek, Wrenn & Loudon The Essentials of Marketing Research 4e
Chapter 6 -137- Measurement
-137-
ror. How does this error enter into our measures? There are several explanations why we might see a difference between the measured value and the true value:11
1. Short-term characteristics of the respondent such as mood, health, fatigue, and stress.
2. Situational factors such as distractions or other variations in the environment
where the measures are taken.
3. Data-collection factors introducing variations in how questions are adminis-tered (such as different tone of voice for different interviewers) and variations introduced by the interviewing method itself (that is, Internet, phone, mail, per-sonal contact).
4. Measuring instrument factors such as the degree of ambiguity and difficulty of the questions and the ability of the respondent to provide answers.
5. Data analysis factors introduced during the coding and tabulation process.
Measure Results Sample Questions Measure
of Central
Nominal Classification of Which brand do you own? Mode
variables A ___ B ___ C ___
Ordinal Order of Rank your preference for stores. Median
variables First ___
Second ___
Third ___
Interval Differences in The salespeople were friendly. Mean
variables Strongly Agree ___
Agree ___
Neutral ___
Disagree ___
Strongly Disagree ___
Ratio Absolute What was your sales volume
by
Mean
magnitude of store last year? Geometric
differences in Store A $___ mean
variables Store B $___
Store C $___
TABLE 6.2. Scales of Measurement
Source: Adapted from Robert F. Hartley, George E. Prough, and Alan B. Flaschner, Essen-
tials of Marketing Research, 1983, p. 145. Tulsa, OK: PennWell Books, Inc.

Silver, Stevens, Kernek, Wrenn & Loudon The Essentials of Marketing Research 4e
Chapter 6 -138 Measurement
-138-
6-6a Reliability
A reliable measure is one that consistently gener-ates the same result over repeated measures. For example, if a scale shows that a standard-ized one pound weight actually weighs one pound when placed on the scale today, tomor-row, and next Tuesday, then it appears to be a reli-able scale. If it reads a different weight, then it is unreliable, the degree of unreliability indicated by how frequently and by how much it reads an in-accurate weight. A reliable scale will also indicate that a different weight placed on the scale con-sistently shows a different measure than the
one pound weight (that is, a scale is not relia-ble if it says a one-pound weight weighs one pound consistently, but says every other weight is also one pound because it is stuck on that measure). We can determine wheth-er our measures of psychological constructs are reliable using one of several types of tests.
Test-Retest Reliability. The objective with test-retest reliability assessment is to meas-ure the same subjects at two different points in time under approximately the same conditions and compare results. If there was actually no change in the object of meas-urement (such as someone’s preferences or attitudes), a reliable measuring device (such as a questionnaire) would generate the same results. Obvious problems are that it may not be possible to get the same respondents to respond to the test, the meas-urement process itself may alter the second responses, and conditions may be difficult to duplicate.
Alternative Form. The deficiencies of test-retest reliability measures can be overcome to some degree by using an alternative form of the measuring device. If you have at least two equivalent measuring forms (such as questionnaires), researchers can admin-ister one form and then two weeks later administer the alternative form. Correlating the results provides a measure of the reliability of the forms.
Internal Consistency. Measuring reliability using an internal consistency approach usually involves the use of different samples of respondents to determine reliability of measures. A typical way to assess internal consistency would be to use a split-half tech-nique, which involves giving the measuring instrument (such as a questionnaire) to all the respondents, then randomly dividing them into halves and comparing the two halves. High correlation represents good reliability. Another type of split-half compar-ison involves randomly splitting the item statements intended to measure the same construct into halves and comparing the results of the two halves of the statements for the entire sample. Again, high correlation of results (the way the respondents an-swered the item statements) suggests good reliability. Another way of testing for inter-nal consistency is to use a statistical test such as Cronbach’s alpha for intervally scaled data or KR-20 for nominally scaled data. These measures will indicate how well each indi-

Silver, Stevens, Kernek, Wrenn & Loudon The Essentials of Marketing Research 4e
Chapter 6 -139- Measurement
-139-
vidual item statement correlates with other items in the instrument. A low correlation
means the item statement should be removed from the instrument. Cronbach’s alpha is a common test done in Step 5: Purify the Measures of Our Measurement Process (see Figure 6.2). Also note that in Figure 6.1, reliability tests are using measures (data such as answers to questionnaires) to test whether our operational definitions (questionnaire questions) are reliable (e.g., internally consistent).
6-6b Validity
Validity is the extent to which differences found among respondents using a measuring tool reflect true differences among respondents. The difficulty in assessing validity is that the true value is usually unknown. If the true value were known, absolute validity could be measured. In the absence of knowledge of the true value, the concern must
be with relative validity, that is, how well the variable is measured using one measur-ing technique versus competing techniques. Validity is assessed by examining three different types of validity: content, predictive, and construct.
The content validity of a measuring instrument is the extent to which it provides adequate coverage of the topic under study. To evaluate the content validity of an instrument, it must first be decided what elements constitute adequate coverage of the problem in terms of variables to be measured. Then the measuring instrument must be analyzed to assure all variables are being measured adequately. Thus, if peoples’ atti-tudes toward purchasing different automobiles are being measured, questions should be included regarding attitudes toward cars’ reliability, safety, performance, warranty coverage, cost of ownership, and the like, since those attributes constitute attitudes to-
ward automobile purchase.
Content validity rests on the ability to adequately cover the most important attrib-utes of the concept being measured. It is testing to determine how well we have speci-fied the domain of our construct (see Figure 6.1). It is one of the most common forms of validity addressed in practical marketing research. A common method of testing for
content validity is to ask experts to judge whether the item statements are what they purport to be. For example, if you are trying to develop item statements intended to measure customer satisfaction with the content of a Web site, you could get several ex-perts on customer satisfaction for Web sites to judge the adequacy of your item statements, or use item statements previously found to have passed content validi-ty tests.
Predictive or pragmatic validity reflects the success of measures used for estimating purposes. The researcher may want to predict some outcome or estimate the existence of some current be-havior or condition. The measure has predictive validity if it works (see Figure 6.1). For example, the ACT test required by many col-leges has proved most college students has proved useful in pre-dicting success in college courses. Thus, it is said to have predictive validity. Correlation of the independent (ACT test score) and de-pendent (college GPA) variables is often used to test for predic-tive validity.

Silver, Stevens, Kernek, Wrenn & Loudon The Essentials of Marketing Research 4e
Chapter 6 -140 Measurement
-140-
Construct validity involves the desire to measure or infer the presence of abstract
characteristics for which no empirical validation seems possible. Attitude scales, ap-titude tests, and personality tests generally concern concepts that fall in this catego-ry. In this situation, construct validity is assessed on how well the measurement tool measures constructs that have theoretically defined models as an underpinning. For example, a new personality test must measure personality traits as defined in per-sonality theory in order to have construct validity. Construct validity is usually deter-mined by testing to see if measures converge (convergent validity) when they are supposed to measure the same thing, but by different means or by different re-spondents, and discriminate (discriminant validity) when they are measuring differ-ent things. Construct validity is obviously important—if we are not really measuring what we thought we were measuring (we thought we were measuring brand loyalty but we were actually measuring store loyalty), we cannot have confidence that our decisions based on the research will achieve their goals. When two independent methods of measuring the same construct converge as expected (such as two different measures of the degree of a consumer’s brand loyalty), then we have some degree of convergent validity (see Figure 6.1). When two measures diverge as ex-pected (such as brand loyalty and eagerness to try a new brand), then we have some degree of discriminant validity. How each of these tests of construct validity is determined varies for different research studies.
6-6c Commentary on Reliability and Validity
As stated previously, researchers conducting research in order to make marketing decisions rarely conduct the kinds of formal tests of reliability and validity described
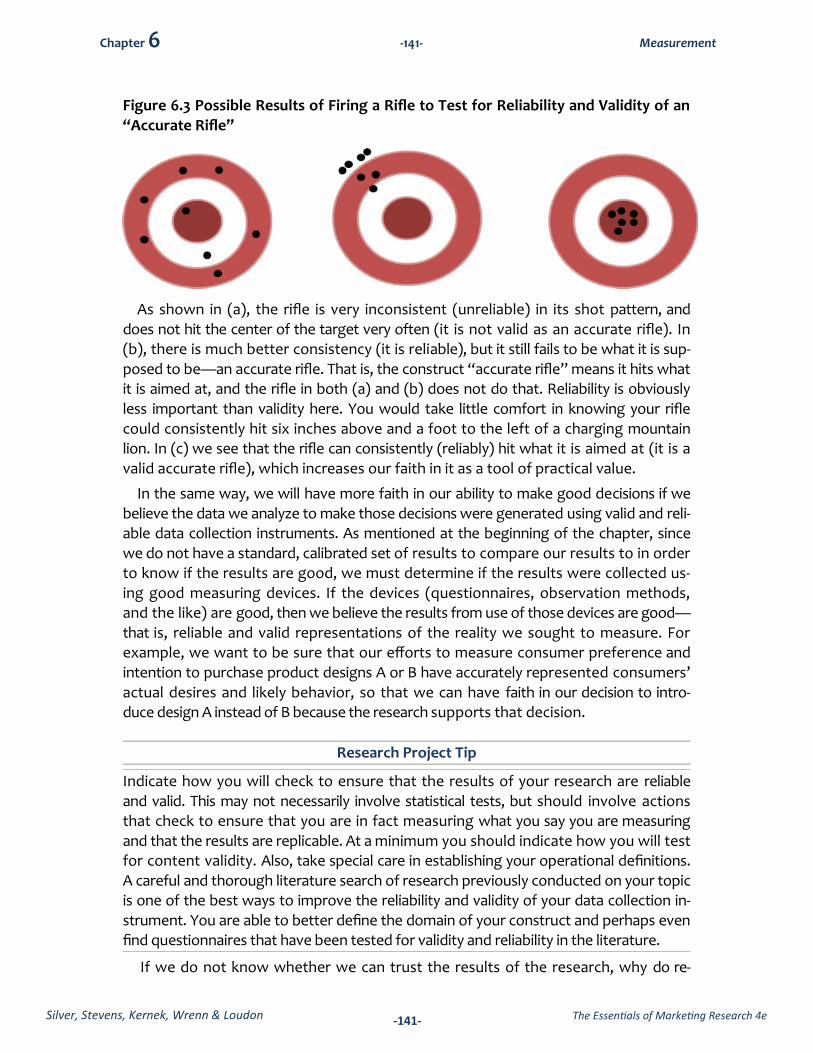
here. However, it should be obvious to the reader that good research is good, at least to some degree, because it generates data we have faith in as a picture of reality—i.e., it uses a data collection instrument which could consistently generate similar results when used repeatedly (it is reliable), and it measures what it is intended to measure (it is valid). An illustration will help make the point about the wisdom of being concerned about these issues when doing research, even nonacademic practical research. Let’s say our construct of interest is an accurate rifle. If we were living on the frontier, an accu-rate rifle would not only be an abstract concept of intellectual interest, it could be a life or death matter! That is practical in the extreme! We want to do reliability and va-lidity tests on the rifle before we make decisions based on its use, so we clamp it in a vise to make it steady (and remove the variability of the skill of the shooter) and sight it at the center of a target a reasonable distance away. We do this at an indoor shooting range where conditions are held constant (so we can avoid the problems previously mentioned about environmental variables that can affect our measures). The rifle is then fired numerous times using a mechanical triggering device. Figure 6.3 displays several differ-ent possible results of our test.
(a) Neither Reliable nor Valid
(b) Reliable, but not Valid
(c) Reliable and Valid
Silver, Stevens, Kernek, Wrenn & Loudon The Essentials of Marketing Research 4e
Chapter 6 -141- Measurement
-141-
Figure 6.3 Possible Results of Firing a Rifle to Test for Reliability and Validity of an
“Accurate Rifle”
As shown in (a), the rifle is very inconsistent (unreliable) in its shot pattern, and does not hit the center of the target very often (it is not valid as an accurate rifle). In (b), there is much better consistency (it is reliable), but it still fails to be what it is sup-posed to be—an accurate rifle. That is, the construct “accurate rifle” means it hits what it is aimed at, and the rifle in both (a) and (b) does not do that. Reliability is obviously less important than validity here. You would take little comfort in knowing your rifle could consistently hit six inches above and a foot to the left of a charging mountain lion. In (c) we see that the rifle can consistently (reliably) hit what it is aimed at (it is a valid accurate rifle), which increases our faith in it as a tool of practical value.
In the same way, we will have more faith in our ability to make good decisions if we believe the data we analyze to make those decisions were generated using valid and reli-able data collection instruments. As mentioned at the beginning of the chapter, since we do not have a standard, calibrated set of results to compare our results to in order to know if the results are good, we must determine if the results were collected us-ing good measuring devices. If the devices (questionnaires, observation methods, and the like) are good, then we believe the results from use of those devices are good—that is, reliable and valid representations of the reality we sought to measure. For example, we want to be sure that our efforts to measure consumer preference and intention to purchase product designs A or B have accurately represented consumers’ actual desires and likely behavior, so that we can have faith in our decision to intro-duce design A instead of B because the research supports that decision.
Research Project Tip
Indicate how you will check to ensure that the results of your research are reliable and valid. This may not necessarily involve statistical tests, but should involve actions that check to ensure that you are in fact measuring what you say you are measuring and that the results are replicable. At a minimum you should indicate how you will test for content validity. Also, take special care in establishing your operational definitions. A careful and thorough literature search of research previously conducted on your topic is one of the best ways to improve the reliability and validity of your data collection in-strument. You are able to better define the domain of your construct and perhaps even find questionnaires that have been tested for validity and reliability in the literature.
If we do not know whether we can trust the results of the research, why do re-

Silver, Stevens, Kernek, Wrenn & Loudon The Essentials of Marketing Research 4e
Chapter 6 -142 Measurement
-142-
search at all? The alternative to good research is to make your decision and hope for the
best. By doing marketing research we are saying that we want to reduce the uncer-tainty of the decision-making process. But we can only reduce the uncertainty by a reli-able and valid representation of the real state of our constructs of interest. So, even if formal methods of testing for validity and reliability are not used, the wise researcher devotes thought to the construction of research instruments and using research meth-ods that have proven over time to generate valid and reliable results. Interested readers should refer to some of the major works on the subject.12
6-7 MEASURING PSYCHOLOGICAL VARIABLES
Measurement of most variables depends upon self-report, that is, by the respondents volunteering the information when asked, instead of through observation. While a
state of mind is obviously not directly observable (you cannot see a motive for pur-chasing an item), many behaviors are also not observable. Consequently, marketing re-searchers must ask people to respond to questions intended to measure (attach num-bers to) an attribute of a construct in ways that reveal the quantity of the attribute. Re-searchers have developed scales that are believed to capture the quantity or intensity of the construct’s attribute.
Many of the states of mind mentioned are typically measured using scales devel-oped for that purpose. We will describe several scales used for measuring various states of mind after discussing attitude measurement, a common object of measure-ment for marketing researchers.
6-7a Attitude Measurement
Attitudes are one of the most frequently measured constructs by marketing re-searchers. Why are attitudes of such universal interest? Because marketing decision makers are interested in them. Why are marketing decision makers interested in atti-tudes? Because they believe there is a close connection between the way a person
thinks (their attitude) and what they are likely to do (their behavior). Why, then, don’t we just study behavior, since marketers are actually ultimately interested in under-standing and influencing people’s behavior, not just their attitudes? There are sever-al good reasons why marketers do focus on attitudes instead of exclusively on behavior:
1. Marketers may not have access to observation of or reporting of a person’s be-havior. The behavior may occur over a long period of time or in private settings only, and therefore observation is either not possible or prohibitively expensive. Also, sometimes the behavior itself is of a nature that people will not voluntarily report it, but will answer attitude questions related to the behavior.
2. Sometimes the behavior cannot be reported because it has not yet occurred. Marketers seeking to determine the best combination of attributes for a new product must ask attitudinal questions about the desirability of those features since the product itself has yet to be produced and, hence, there is no behavior that can be recorded concerning the product.
Silver, Stevens, Kernek, Wrenn & Loudon The Essentials of Marketing Research 4e
Chapter 6 -143- Measurement
-143-
3. Attitudes, under certain circumstances, are reasonably good predictors of be-
havior. Consequently, by measuring someone’s attitudes we can obtain a good indication of their likely behavior in the future. The connection between atti-tudes and behavior has, however, been the subject of extended debate among marketing researchers.13 Attitudes can help us understand why certain behav-iors occur.
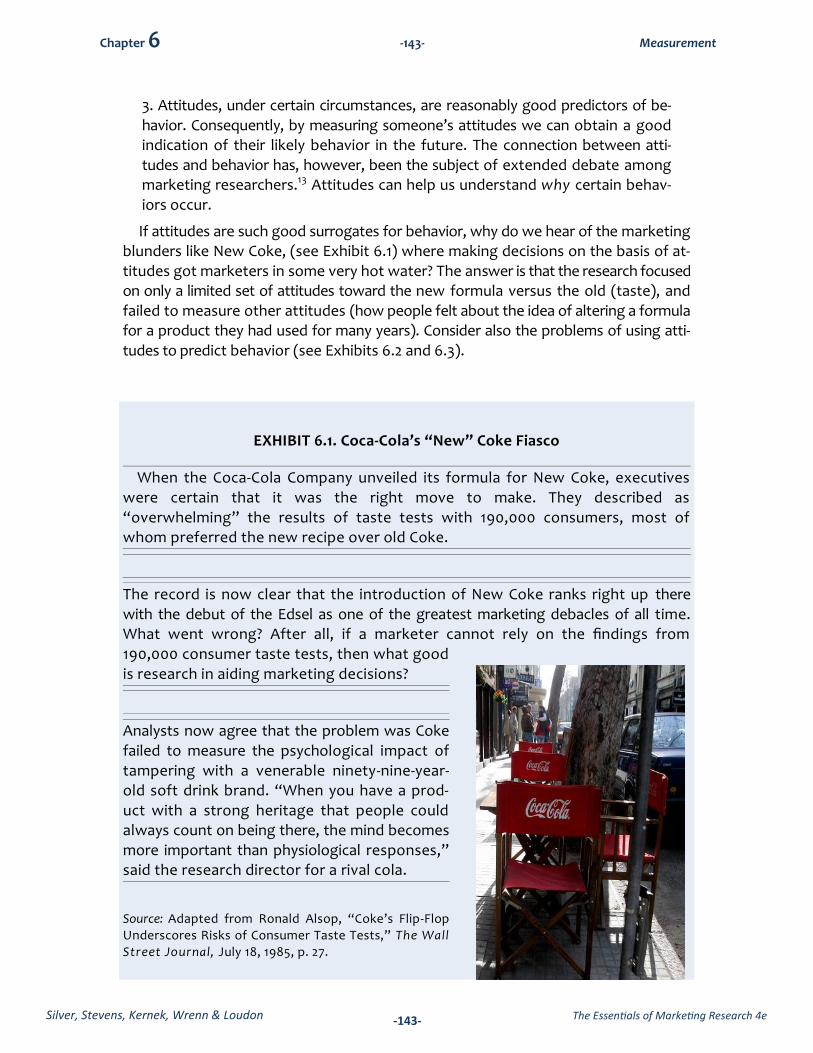
If attitudes are such good surrogates for behavior, why do we hear of the marketing blunders like New Coke, (see Exhibit 6.1) where making decisions on the basis of at-titudes got marketers in some very hot water? The answer is that the research focused on only a limited set of attitudes toward the new formula versus the old (taste), and failed to measure other attitudes (how people felt about the idea of altering a formula for a product they had used for many years). Consider also the problems of using atti-
tudes to predict behavior (see Exhibits 6.2 and 6.3).
EXHIBIT 6.1. Coca-Cola’s “New” Coke Fiasco
When the Coca-Cola Company unveiled its formula for New Coke, executives were certain that it was the right move to make. They described as “overwhelming” the results of taste tests with 190,000 consumers, most of whom preferred the new recipe over old Coke.
The record is now clear that the introduction of New Coke ranks right up there with the debut of the Edsel as one of the greatest marketing debacles of all time. What went wrong? After all, if a marketer cannot rely on the findings from 190,000 consumer taste tests, then what good is research in aiding marketing decisions?
Analysts now agree that the problem was Coke failed to measure the psychological impact of tampering with a venerable ninety-nine-year-old soft drink brand. “When you have a prod-
uct with a strong heritage that people could always count on being there, the mind becomes more important than physiological responses,” said the research director for a rival cola.
Source: Adapted from Ronald Alsop, “Coke’s Flip-Flop
Underscores Risks of Consumer Taste Tests,” The Wall
Street Journal, July 18, 1985, p. 27.
Silver, Stevens, Kernek, Wrenn & Loudon The Essentials of Marketing Research 4e
Chapter 6 -144 Measurement
-144-
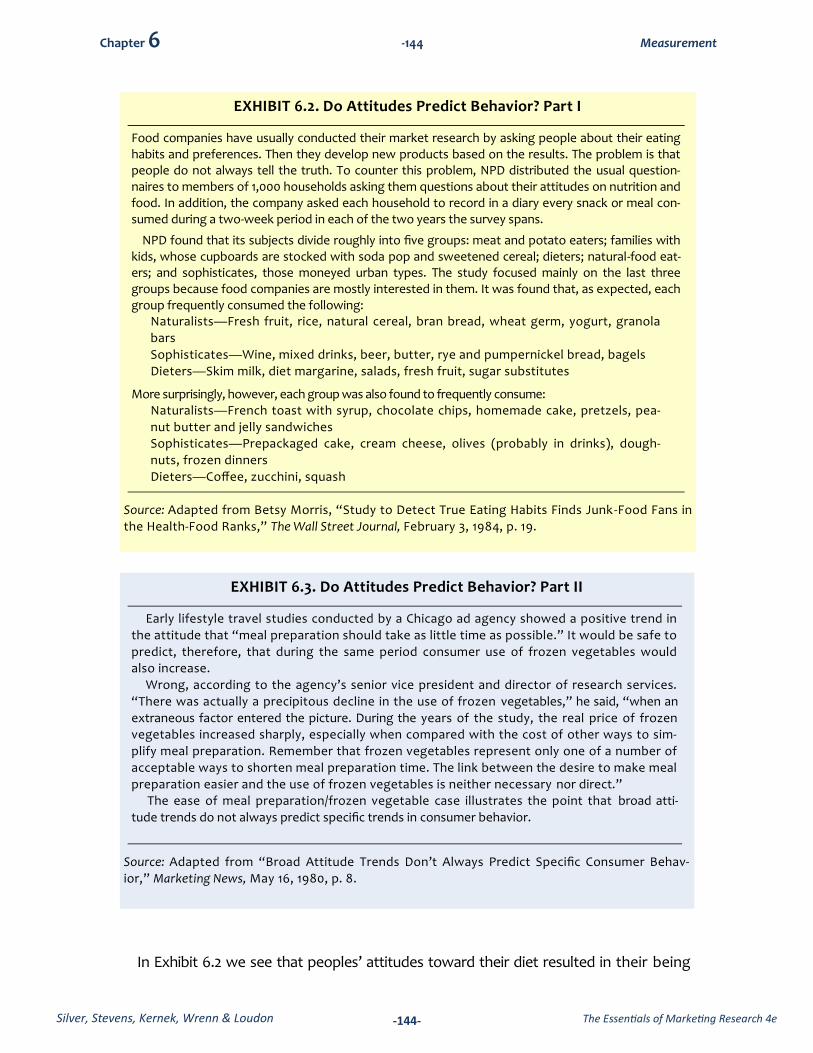
In Exhibit 6.2 we see that peoples’ attitudes toward their diet resulted in their being
EXHIBIT 6.2. Do Attitudes Predict Behavior? Part I
Source: Adapted from Betsy Morris, “Study to Detect True Eating Habits Finds Junk -Food Fans in
the Health-Food Ranks,” The Wall Street Journal, February 3, 1984, p. 19.
Food companies have usually conducted their market research by asking people about their eating habits and preferences. Then they develop new products based on the results. The problem is that people do not always tell the truth. To counter this problem, NPD distributed the usual question-naires to members of 1,000 households asking them questions about their attitudes on nutrition and food. In addition, the company asked each household to record in a diary every snack or meal con-sumed during a two-week period in each of the two years the survey spans.
NPD found that its subjects divide roughly into five groups: meat and potato eaters; families with kids, whose cupboards are stocked with soda pop and sweetened cereal; dieters; natural-food eat-ers; and sophisticates, those moneyed urban types. The study focused mainly on the last three groups because food companies are mostly interested in them. It was found that, as expected, each group frequently consumed the following:
Naturalists—Fresh fruit, rice, natural cereal, bran bread, wheat germ, yogurt, granola
bars
Sophisticates—Wine, mixed drinks, beer, butter, rye and pumpernickel bread, bagels
Dieters—Skim milk, diet margarine, salads, fresh fruit, sugar substitutes
More surprisingly, however, each group was also found to frequently consume: Naturalists—French toast with syrup, chocolate chips, homemade cake, pretzels, pea-
nut butter and jelly sandwiches Sophisticates—Prepackaged cake, cream cheese, olives (probably in drinks), dough-
nuts, frozen dinners
Dieters—Coffee, zucchini, squash
EXHIBIT 6.3. Do Attitudes Predict Behavior? Part II
Source: Adapted from “Broad Attitude Trends Don’t Always Predict Specific Consumer Behav-
ior,” Marketing News, May 16, 1980, p. 8.
Early lifestyle travel studies conducted by a Chicago ad agency showed a positive trend in
the attitude that “meal preparation should take as little time as possible.” It would be safe to
predict, therefore, that during the same period consumer use of frozen vegetables would also increase.
Wrong, according to the agency’s senior vice president and director of research services.
“There was actually a precipitous decline in the use of frozen vegetables,” he said, “when an
extraneous factor entered the picture. During the years of the study, the real price of frozen vegetables increased sharply, especially when compared with the cost of other ways to sim-
plify meal preparation. Remember that frozen vegetables represent only one of a number of
acceptable ways to shorten meal preparation time. The link between the desire to make meal
preparation easier and the use of frozen vegetables is neither necessary nor direct.” The ease of meal preparation/frozen vegetable case illustrates the point that broad atti-
tude trends do not always predict specific trends in consumer behavior.

Silver, Stevens, Kernek, Wrenn & Loudon The Essentials of Marketing Research 4e
Chapter 6 -145- Measurement
-145-
classified in specific groups. Separate measures of their behavior indicate not all of
what they eat would be predicted from their attitudes. Why this inconsistency? Just as in the New Coke example, we see that people hold a multiplicity of attitudes to-ward an object, and not all attitudes will be consistent with a specific behavior (solid lines indicate consistency, dotted lines inconsistency):
Here, we see that attitude A1 is consistent with behavior B1, but not with behavior B2, while attitude A2 is consistent with behavior B2, but not B1. In other words, because people have a multiplicity of attitudes, focusing on any one attitude (A1) may not permit successful prediction of a single behavior (B2).
In Exhibit 6.3, we see that people were increasingly in agreement with the attitude that meal preparation should take as little time as possible. This fact failed to lead to an increase in sales of frozen vegetables. Why this inconsistency? In this case a multiplicity of behaviors are possible, only some of which are consistent with the attitude con-cerning meal preparation time.
Lesson
Attitudes and behavior are complex phenomena. When we try to simplify what is
inherently complex for our own convenience we often draw erroneous conclusions. We are seekers after truth, not simplicity. If truth is complex, let’s try to understand its complexity. If it is simple, let’s just be thankful for its simplicity. What these exam-ples do tell us is that we must strive very hard to make sure we have correctly sampled the domain of the attitudes we are seeking to measure (that is, have good content validity). For example, if we are trying to measure peoples’ attitudes toward eating healthfully, we would want to have a number of item statements that would be divided among the three components of attitudes. Example attitude questions about eating healthfully might be:

Silver, Stevens, Kernek, Wrenn & Loudon The Essentials of Marketing Research 4e
Chapter 6 -146 Measurement
-146-
We would also want to correctly sample from the domain of the behavior of interest to us. We will now discuss the use of scales to measure attitudes and other psychologi-cal variables of interest to marketers.
6.7b Itemized Rating Scales
Itemized rating scales are just that—the points on the scale are itemized, with a de-scription of the scale point provided. Several choices confront the researcher using an itemized rating scale:
1. The number of item statements and scale points. Research has indicated that scale reliability improves, up to a point, with increases in the number of item statements and scale points.14 So, for example, a questionnaire that asks for attitudes toward healthy eating is more reliable if it uses twelve attitude item statements (an example of an item statement is a declarative statement
with itemized responses such as “I like the taste of most healthy foods” with re-sponses like strongly agree, agree, neither agree nor disagree, disagree, strongly disagree), rather than three item statements -- but thirty item statements is prob-ably less reliable than twelve. Why? Because of the fatigue factor—respondents grow weary of answering too many questions, and their responses are made more to get finished rather than as a true representation of their state of mind. The same is true for response points on the scale; five is better than three, but more than ten points does not improve reliability. Typically, the number of scale points varies between five to seven (see examples).
2. Odd or even number of points. Is a scale with an even number of points pref-erable to an odd number, or is the odd number preferable? There is no hard evi-
dence that supports either choice. The odd number provides a midpoint on the scale, while the even number forces respondents to lean toward one end of the scale or the other. This remains a matter of researcher preference.
3. Use of “don’t know” and “no opinion.” The general tendency for interviewers is to discourage respondents from choosing a “don’t know” or “no opinion” op-tion when responding to a scaled item statement. Many respondents then select the midpoint of an odd-number scale as the default option. Obviously, research-ers analyzing the data are then unable to determine how many people marked “3” on the five-point scale because that expressed the intensity with which
Strongly Strongly Agree Disagree
Affective I like the taste of healthy foods. _____ _____ _____ _____ ______ _____
Cognitive I believe eating healthfully will in-crease my life span. _____ _____ _____ _____ ______ _____
Conative I try to buy healthy foods whenever possible. _____ _____ _____ _____ ______ _____

Silver, Stevens, Kernek, Wrenn & Loudon The Essentials of Marketing Research 4e
Chapter 6 -147- Measurement
-147-
they held an attitude, and how many marked “3” because they did not know how
they felt, and chose the midpoint because it was the safest option available. These kinds of compromises to the validity of the instrument argue persuasively for a scale that provides for both a “don’t know” and a “no opinion” option for re-spondents, and for instructions to interviewers to accept these responses from respondents.
It is generally conceded that itemized rating scales generate intervally scaled data, although there is an ongoing debate in the social sciences as to whether that position is defensible or not (some researchers believe itemized rating scales generate only ordi-nal data).
Examples of Itemized Rating Scales
6-7c Likert Scales
ATTITUDES
Strongly Agree Agree Disagree Strongly Disagree
5 4 3 2 1
Neither Agree or Disagree
PERFORMANCE OR QUALITYExcellent Very Good Good Fair Poor
5 4 3 2 1
SATISFACTIONCompletely Very Somewhat Very
Satisfied Satisfied Dissatisfied Dissatisfied
10 9 8 7 6 5 4 3 2 1
Fairly Well Satisfied
IMPORTANCEOf Critical Very Somewhat Of Little Not at all
Importance Important Important Importance Important
5 4 3 2 1
EXPERIENCE Did Not Far Below
Far Exceeded Exceeded My Met My Meet My My
My Expectations Expectations Expectations Expectations Expectations
5 4 3 2 1
INTENTIONExtremely Very Somewhat About 50-50 Somewhat Very Extremely
Unlikely Unlikely Unlikely Chance Unlikely Unlikely Unlikely
7 6 5 4 3 2 1
BEHAVIORAlways Frequently Occasionally Infrequently Not at All
5 4 3 2 1
Two or About Less Than
More Than About Once Three Times Once a Once a Almost
Once a Week a Week a Week Month Month Never Never
7 6 5 4 3 2 1
Silver, Stevens, Kernek, Wrenn & Loudon The Essentials of Marketing Research 4e
Chapter 6 -148 Measurement
-148-
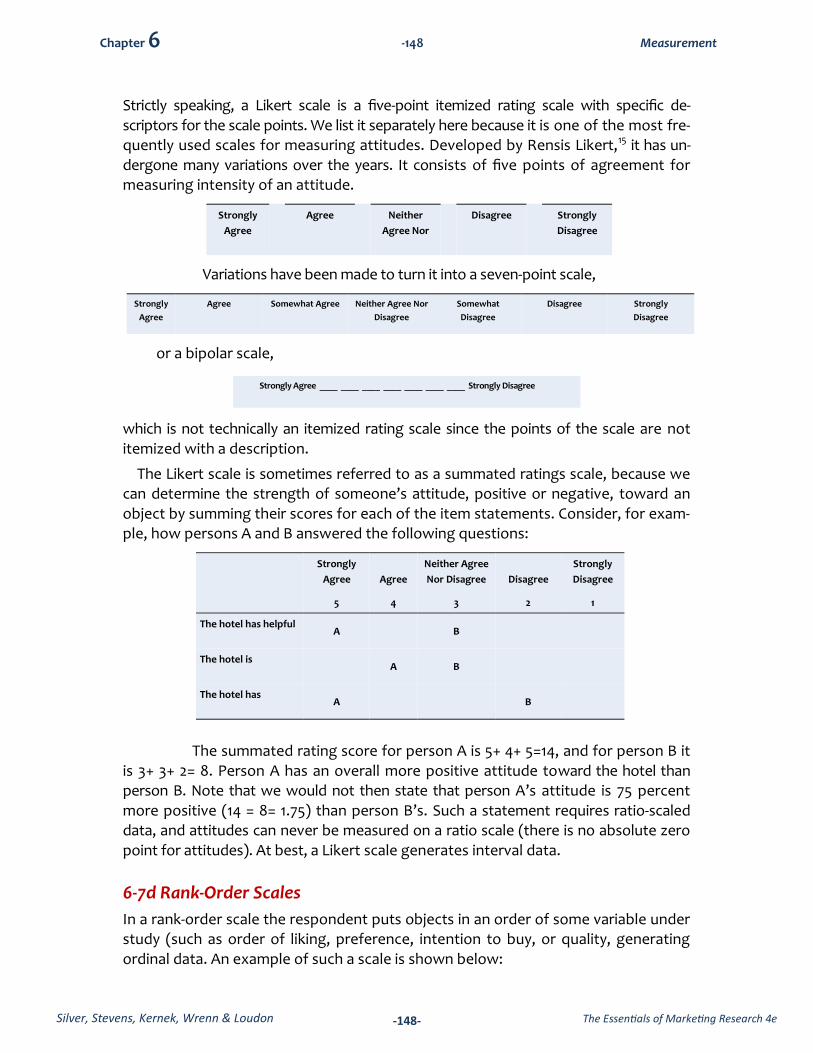
Strictly speaking, a Likert scale is a five-point itemized rating scale with specific de-
scriptors for the scale points. We list it separately here because it is one of the most fre-quently used scales for measuring attitudes. Developed by Rensis Likert,15 it has un-dergone many variations over the years. It consists of five points of agreement for measuring intensity of an attitude.
Variations have been made to turn it into a seven-point scale,
or a bipolar scale,
which is not technically an itemized rating scale since the points of the scale are not itemized with a description.
The Likert scale is sometimes referred to as a summated ratings scale, because we can determine the strength of someone’s attitude, positive or negative, toward an object by summing their scores for each of the item statements. Consider, for exam-ple, how persons A and B answered the following questions:
The summated rating score for person A is 5+ 4+ 5=14, and for person B it is 3+ 3+ 2= 8. Person A has an overall more positive attitude toward the hotel than person B. Note that we would not then state that person A’s attitude is 75 percent
more positive (14 = 8= 1.75) than person B’s. Such a statement requires ratio-scaled data, and attitudes can never be measured on a ratio scale (there is no absolute zero point for attitudes). At best, a Likert scale generates interval data.
6-7d Rank-Order Scales
In a rank-order scale the respondent puts objects in an order of some variable under study (such as order of liking, preference, intention to buy, or quality, generating ordinal data. An example of such a scale is shown below:
Strongly
Agree
Agree Neither
Agree Nor
Disagree Strongly
Disagree
Strongly
Agree
Agree Somewhat Agree Neither Agree Nor
Disagree
Somewhat
Disagree
Disagree Strongly
Disagree
Strongly
Agree
5
Agree
4
Neither Agree
Nor Disagree
3
Disagree
2
Strongly
Disagree
1
The hotel has helpful A B
The hotel is A B
The hotel has A B
Strongly Agree ____ ____ ____ ____ ____ ____ ____ Strongly Disagree

Silver, Stevens, Kernek, Wrenn & Loudon The Essentials of Marketing Research 4e
Chapter 6 -149- Measurement
-149-
Rank-order the following sporting events in terms of most desirable to least
desirable for you to attend (1 = most desirable, 2 = second most desirable, and so on):
__ Super Bowl
__ World Series
__ NBA Championship Game
__ NHL All-Star Game
__ NCAA Basketball Championship
__ Masters Golf Tournament
The advantages of a rank-order scale are that it is easy for the respondent to un-derstand and respond to, and it is a realistic representation of choice behavior (some
objects would be purchased before others according to the rank order). The disad-vantages are that the rank order appears without the researcher knowing his or her location on a like-dislike continuum. That is, all the items may be toward the highly liked end of the scale, or spread out along the scale so that number one is liked while the bottom numbered item is disliked, or all located at the disliked end of the scale (put another way, even the item ranked number one is only the least disliked of the entire group of disliked items rank-ordered). Another disadvantage is that data analy-sis is limited to those procedures permissible for ordinal-ranked data. Also, the re-spondents’ actual first choice may not have been included on the list, but research-ers would not know this. Finally, we do not know how far apart the items are on the list in terms of desirability (1 and 2 may be highly desirable and close together, 3, 4, and 5 are much less desirable and far down the list), and we do not know why the
items were ranked in that order.
6-7e Comparative Rating Scales
The comparative rating scale (also called a constant-sum scale) requires respond-ents to divide a fixed number of points, usually 100, among items according to their importance to the respondent. The result provides researchers with some under-standing of the magnitude of the difference between the items’ importance to the respondent. An example is:
Please allocate 100 points among the items below such that the allocation repre-sents the importance of each item to your choice of a hotel. The higher the number of points, the greater its importance. If an item has no importance you
would assign no points to it. Please check when fınished to ensure that your point total is 100.
Hotel belongs to a national chain ___
I receive frequent guest points for my stay ___
Location is convenient ___
Is good value for the money ___
Listed as a top quality hotel in guide book___
Total 100 points

Silver, Stevens, Kernek, Wrenn & Loudon The Essentials of Marketing Research 4e
Chapter 6 -150 Measurement
-150-
The task of allocating points becomes more difficult with a large number of
items. Ten items are generally considered the maximum limit for the comparative rating scale.
6-7f Semantic Differential Scales
The semantic differential scale is a seven-point scale using pairs of adjectives or phrases that are opposite in meaning. Each pair of adjectives measures a different dimension of the concept. The respondent chooses one of the seven scale positions that most closely reflects his or her feelings. A large number of dimensions would be needed to completely measure a concept.
Two forms of a semantic differential scaled statement are:
Again, the numbers assigned to the positions on the scale indicate order, so at least an ordinal level of measurement has been achieved, although many re-searchers assume interval level data are obtained through this method. Seman-tic differential scales can also be graphed to show comparisons by group or objects by plotting medians or means.
Figure 6.6 Profiles of Two Restaurants Using a Semantic Differential Scale
6-7g Stapel Scales
The Stapel scale is used as a substitute for the semantic differential when it is difficult to construct pairs of bipolar adjectives. The following example illustrates a Stapel scale for measuring airline performance on seating comfort.
Clean 1 2 3 4 5 6 7 Dirty
The store was
clean. 1 2 3 4 5 6 7 The store was dirty.

Silver, Stevens, Kernek, Wrenn & Loudon The Essentials of Marketing Research 4e
Chapter 6 -151- Measurement
-151-
Respondents would be instructed to circle positive numbers for when the adjective increasingly accurately describes the airline seating in economy class, and negative numbers when the adjective is increasingly less accurate in describing the airline. Stapel scales generate results similar to the semantic differential, but are easier to construct and
administer, particularly over the phone.
6-7h Commentary on Scales
Some types of scales are designed to collect measures of a specific type of construct, while others can be used for more than one type of construct. For example, Likert, semantic differential, and Stapel scales were all originally designed as attitude-rating scales. They are also generally thought of as interval scales (generating intervally scaled data).
A comparative rating scale, in contrast, is an interval scale (or quasiinterval—scientists are not in agreement about this) that could be used to measure several con-
structs. See the following examples.
Motives. Allocate 100 points among this list of items with respect to their im-portance in selecting a university for an undergraduate degree:
Parents attended the university _____
National reputation for quality _____
Student-teacher ratio _____
Cost of tuition _____
Close to home _____
Total 100 points
Preferences. Allocate 100 points among this list of items with respect to your preference for places to vacation:
Disneyworld _____ Mountains _____ Beach _____ Golf Resort _____ Total 100 points
Delta United American Northwest
Comfortable
Seating
+3
+2
+1
-1
-2
-3
+3
+2
+1
-1
-2
-3
+3
+2
+1
-1
-2
-3
+3
+2
+1
-1
-2
-3
Silver, Stevens, Kernek, Wrenn & Loudon The Essentials of Marketing Research 4e
Chapter 6 -152 Measurement
-152-
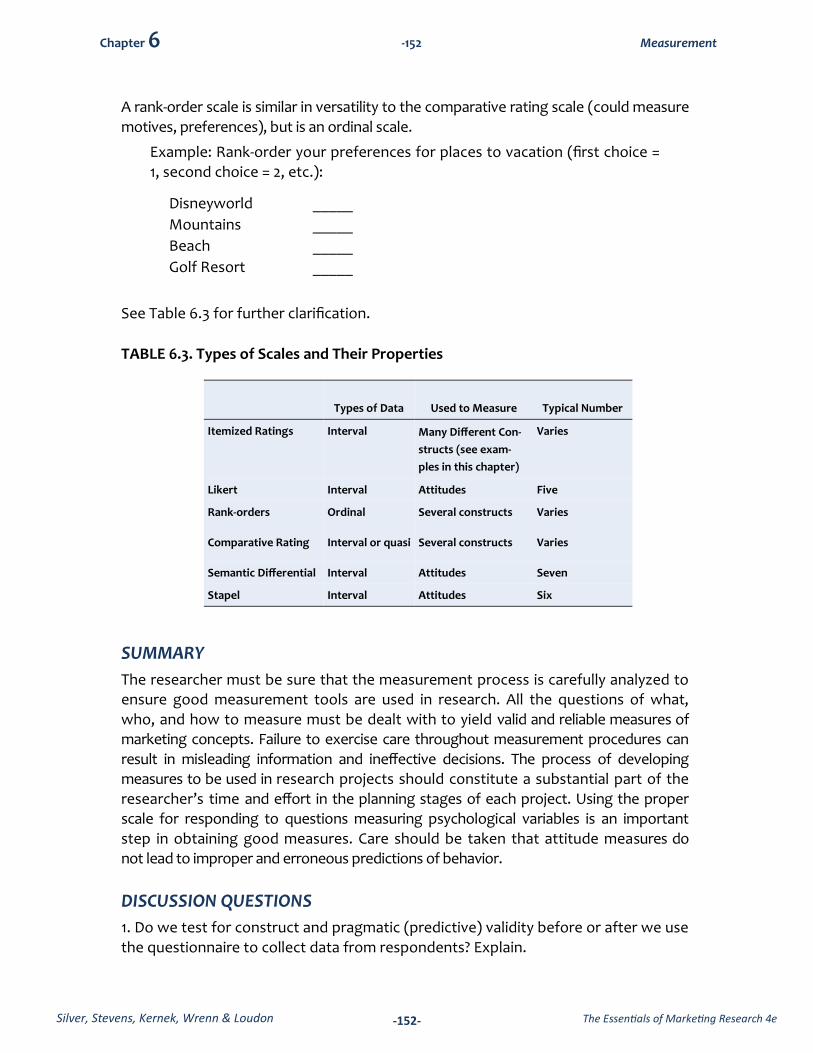
A rank-order scale is similar in versatility to the comparative rating scale (could measure
motives, preferences), but is an ordinal scale.
Example: Rank-order your preferences for places to vacation (first choice = 1, second choice = 2, etc.):
Disneyworld _____
Mountains _____
Beach _____
Golf Resort _____
See Table 6.3 for further clarification.
TABLE 6.3. Types of Scales and Their Properties
SUMMARY
The researcher must be sure that the measurement process is carefully analyzed to ensure good measurement tools are used in research. All the questions of what, who, and how to measure must be dealt with to yield valid and reliable measures of marketing concepts. Failure to exercise care throughout measurement procedures can result in misleading information and ineffective decisions. The process of developing measures to be used in research projects should constitute a substantial part of the researcher’s time and effort in the planning stages of each project. Using the proper scale for responding to questions measuring psychological variables is an important step in obtaining good measures. Care should be taken that attitude measures do not lead to improper and erroneous predictions of behavior.
DISCUSSION QUESTIONS
1. Do we test for construct and pragmatic (predictive) validity before or after we use the questionnaire to collect data from respondents? Explain.
Types of Data Used to Measure Typical Number
Itemized Ratings Interval Many Different Con-
structs (see exam-
ples in this chapter)
Varies
Likert Interval Attitudes Five
Rank-orders Ordinal Several constructs Varies
Comparative Rating Interval or quasi Several constructs Varies
Semantic Differential Interval Attitudes Seven
Stapel Interval Attitudes Six
Silver, Stevens, Kernek, Wrenn & Loudon The Essentials of Marketing Research 4e
Chapter 6 -153- Measurement
-153-
2. Discuss how a thorough literature search can help improve the validity of the
measures we will obtain in the descriptive research phase of a research project.
3. Describe how we could use Figures 6.1 and 6.2 to develop a questionnaire that could be used to measure attitudes and behavior toward a healthy diet. Provide ex-amples of questions that could be generated from this process. Discuss how we would test the questionnaire for reliability and validity.
ENDNOTES
1. Jim C. Nunnally, Psychometric Theory, Second Edition (New York: McGraw-Hill, 1978), p. 3.
2. Shelby D. Hunt and Robert N. Morgan, “The Comparative Advantage Theory of Competition,” Journal of Mar-
keting, 59(April 1995), pp. 1-15.
3. Bruce Wrenn, “What Really Counts When Hospitals Adopt a Marketing Orientation: The Contribution of the
Components of Marketing Orientation to Hospital Performance,” Journal of NonProfit and Public Sector Market-
ing, 7(1/2, 1996), pp. 111-133.
4. Bernard J. Jaworski and Ajay K. Kohl, “Marketing Orientation: Antecedents and Consequences,” Journal of
Marketing, 57(July 1993), pp. 53-70.
5. Gilbert Churchill, “A Paradigm for Developing Better Measures of Marketing Constructs,” Journal of Marketing
Research, 16(February 1979), pp. 64-73.
6. Robert D. Buzzell, Donald F. Cox, and Rex V. Brown, Marketing Research and Information Systems: Text and
Cases (New York: McGraw-Hill, 1969), p. 133.
7. Raymond, Joan. 2000. “For Richer and for Poorer,” American Demographics, (July), pp. 58-64.
8. Ford, John B., Michael S. LaTour, and Tony L. Henthorne. 1995. “Perceptions of Marital Roles in Purchase Deci-
sion Processes: A Cross-Cultural Study,” Journal of the Academy of Marketing Science, Vol. 23, No. 2, pp. 120-131.
9. Labrecque, J. and L. Ricard. 2001. “Children’s Influence on Family Decision-Making: A Restaurant Study,” Jour-
nal of Business Research (November), pp. 173-176.
10. Michael D. Hutt and Thomas W. Spegh, Industrial Marketing Management (Hinsdale, IL: The Dryden Press,
1985), pp. 65-69.
11. Thomas C. Kinnear and James R. Taylor, Marketing Research (New York: McGraw-Hill, 1996), p. 231.
12. For an in-depth discussion of the measure process see Jim C. Nunnally, Psychometric Theory, Second Edition
(New York: McGraw-Hill, 1978); Claire Selltiz, Lawrence S. Wrightsman, and Stuart W. Cook, Research Methods in
Social Relations, Third Edition (New York: Holt, Rinehart and Winston, 1976); Fred N. Kerlinger, Foundations of
Behavioral Research, Third Edition (New York: Holt, Rinehart and Winston, 1986).
13. For a discussion of some of the associations between attitudes and behavior see Richard Lutz, “The Role of
Attitude Theory in Marketing,” in Harold Kassarjian and Thomas Robertson (Eds.), Perspectives in Consumer Be-
havior, Fourth Edition (Upper Saddle River, NJ: Prentice-Hall, 1991), pp. 317-339; John Mowen and Michael Minor,
Consumer Behavior (Upper Saddle River, NJ: Prentice-Hall, 1998), p. 263.
14. Gilbert A. Churchill, Jr. and J. Paul Peter, “Research Design Effects on the Reliability of Rating Scales: A Meta-
Analysis,” Journal of Marketing Research, 21 (November 1984), pp. 360-375.
15. Rensis Likert, “A Technique for the Measurement of Attitudes,” Archives of Psychology, (140, 1932).

Silver, Stevens, Kernek, Wrenn & Loudon The Essentials of Marketing Research 4e
Case 24 c-109 MCS Publishing Company
c-109
Case
24 MCS Publishing Company
In 1992, MCS Publishing launched its first academic business journal because of the demand for more outlets for college professors to publish their research. Because the primary accreditation agency for colleges of business required professors to demonstrate currency in their discipline through research and publishing of their findings, the demand for appropriate journal outlets grew. Within the next five
years, 23 more journal titles were added. MCS’s success in this arena was due primar-ily to its printing technology and ability to print small volumes of a publication at a profit.
The success of these journals spurred the management at MCS to consider the college textbook market. Sales of textbooks and related materials are estimated at $6.9 billon dollars (National Association of College Stores, www.nacs.org/public/research/higher_ed_retail.asp, March 16, 2006). While MCS recognized it did not have the resources to compete with the large publishers such as McGraw-Hill, Thom-son, and Prentice-Hall, they believed the market was large enough for them to cap-ture a small portion and make a profit doing it. Thus, the decision was made to enter this market by focusing on a subset of the market -- colleges of business.
MCS had already developed relationships with business professors through its aca-demic journals since many served as editors, co-editors, and on editorial review boards. Business publications accounted for over half of their academic journals. The company already had the technology to print textbooks, they owned their own printing presses, and they already had a highly-developed database of business pro-fessors throughout the United States. The only thing MCS did not have was an un-derstanding of the process business professors used in deciding on a particular text-book.
To gather this critical information, MCS contracted with a marketing research
This case was prepared by Dr. Robert E. Stevens, Southeastern Oklahoma State University, Dr. David L. Loudon, Samford University, and Dr. C. William McConkey, University of Louisiana
at Monroe, retired. Names, selected data, and corporate identities have been disguised.

Silver, Stevens, Kernek, Wrenn & Loudon The Essentials of Marketing Research 4e
Case 24 c-110 MCS Publishing Company
c-110
firm in Louisiana. The firm prepared a research proposal and used MCS’s current list
of business professors as their sampling frame. Excerpts of their research proposal as well as the questionnaire follow.
Detailed Study Objectives
The market research study objectives were as follows:
I. Identify the relative importance of various criteria used in the adoption of a text-book.
a. Content
b. Edition of text
c. Author(s) of text
d. Advertising
e. Cost
f. Length
g. Online material
II. Identify the relative importance of various ancillary materials.
a. Test bank (electronic and paper)
b. PowerPoint slides (basic and video-enhanced)
c. Online materials (testing, quizzes, class material)
d. Instructor’s manual (CD and paper)
e. Cases
f. Videos
III. Explore reasons a professor switches textbooks.
IV. Determine desirability of various methods of promoting a textbook.
a. Direct contact (E-mail, telephone, direct mail)
b. Publisher’s website
c. Examination copy
d. Advertisements
e. Booth displays at conferences
f. Contact by book reps
V. Determine desirability and frequency of contact methods.
a. Method (personal visit, telephone, e-mail)
b. Frequency of current contact
c. Frequency of desired contact
VI. Explore the helpfulness of direct mail promotions.
a. Specific book promotion
b. Multiple book promotion
VII. Evaluate various book promotion options in terms of encouraging a professor to take a closer look at a new book.
a. E-mail

Silver, Stevens, Kernek, Wrenn & Loudon The Essentials of Marketing Research 4e
Case 24 c-111 MCS Publishing Company
c-111
b. Direct mail
c. Magazine
d. Website
e. Telephone
f. Contact by book rep
g. Examination copy
VIII. Evaluate impact of demographic information on textbook adoption.
a. Years of teaching experience
b. Rank
c. School size
Methodology
MCS’s business professor database contained 13,041 names and corresponding e-mail addresses. Since the professors represented a good cross-section of universi-ties throughout all of the United States, the marketing research firm believed the database was a good representation of the business professor population.
An e-mail was sent to each of the 13,041 names in the database asking the individual if they would be willing to participate in the research. Embedded in the e-mail was a link to the actual survey. Once the survey was completed, it was submit-ted by the respondent to the marketing research firm.
For various reasons, such as wrong e-mail address, insufficient e-mail address, or the e-mail was viewed as SPAM by the university’s e-mail filter system, 1,274 e-mails were returned. This resulted in 11,767 e-mails being delivered. From this sam-ple, 1,192 responded to the questionnaire, yielding a response rate of 10.13 percent.
Individuals were surveyed using a structured-undisguised questionnaire ap-proach. Responses were automatically tabulated by the computerized system and placed in an Excel spreadsheet. This process greatly reduced data entry errors by clerks. The data were then analyzed by using frequency counts and means of each item. Significance tests were conducted based on the respondent’s rank, years of teaching experience, and the size of the institution.
QUESTIONNAIRE
The Textbook Adoption Process Used by College of Business Professors
MCS Publishing
“For each of the statements listed below, please indicate your answer by clicking in the cir-cle or box. If you teach more than one course, answer the questions for the course or cours-es you teach most frequently.”
1) Please identify the relative importance of the following criteria in your decision to adopt a textbook. Very unimportant Very important
Content 1 2 3 4 5
Edition of text 1 2 3 4 5
Ancillary materials 1 2 3 4 5
Author(s) of text 1 2 3 4 5

Silver, Stevens, Kernek, Wrenn & Loudon The Essentials of Marketing Research 4e
Case 24 c-112 MCS Publishing Company
c-112
Advertising of text 1 2 3 4 5
Cost of text 1 2 3 4 5
Length of text 1 2 3 4 5
Online textbook only 1 2 3 4 5
Online and hard copy 1 2 3 4 5
2) Please identify the relative importance of the following ancillary materials in your decision to adopt a textbook. Very unimportant Very important
Electronic test bank 1 2 3 4 5
Online testing 1 2 3 4 5
Hard copy of test bank 1 2 3 4 5
Video-enhanced PowerPoint slides 1 2 3 4 5
Basic PowerPoint slides 1 2 3 4 5
Hard copy of instructor’s manual 1 2 3 4 5
Instructor’s manual on CD 1 2 3 4 5
Cases 1 2 3 4 5
Online student quizzes 1 2 3 4 5
Online class material 1 2 3 4 5
CD for students 1 2 3 4 5
Videos 1 2 3 4 5
3) Why do you switch textbooks from the edition you are currently using? (Please mark all that apply.)
___ Unhappy with the current textbook
___ Unhappy with the publisher of the current textbook
___ Dissatisfied with the ancillary materials of the current textbook
___ New edition of my current text is coming out and I want to change
___ Content of a new textbook
___ New textbook is better suited to my teaching style
___ Better ancillaries in the new textbook
4) In terms of learning about new textbooks, evaluate each of the following methods on a scale of 1 to 5 with 1 being very undesirable to 5 being very desirable.
Very undesirable Very desirable
E-mail 1 2 3 4 5
Direct mail 1 2 3 4 5
Publisher’s website 1 2 3 4 5
Telephone 1 2 3 4 5
Examination copy 1 2 3 4 5
Advertisements in media 1 2 3 4 5
Booth displays at conferences 1 2 3 4 5
Contact by book representative 1 2 3 4 5

Silver, Stevens, Kernek, Wrenn & Loudon The Essentials of Marketing Research 4e
Case 24 c-113 MCS Publishing Company
c-113
5) In terms of communication from your book reps, how desirable is each of the following methods? Very undesirable Very desirable
Personal visit 1 2 3 4 5
Telephone contact 1 2 3 4 5
E-mail contact 1 2 3 4 5
6) How often, if at all, do book reps contact you?
___ Four or more times a semester ___ Once a year
___ Two to three times a semester ___ Less than once a year
___ Once a semester ___ Never
7) How often would you like to be contacted by your book rep?
___ Four or more times a semester ___ Once a year
___ Two to three times a semester ___ Less than once a year
___ Once a semester
8) How helpful are the following types of direct mail promotions from a publisher?
Not helpful Very helpful
Specific book promotions 1 2 3 4 5
Multiple book promotions in one piece 1 2 3 4 5
9) What, if any, types of book promotions encourage you to take a closer look at a text-book? Please rate each methodology below on a scale of 1 to 5 with 1 being most ineffective to 5 being most effective. Most ineffective Most effective
E-mail 1 2 3 4 5
Direct mail 1 2 3 4 5
Magazine 1 2 3 4 5
Website 1 2 3 4 5
Telephone 1 2 3 4 5
Contact with book representative 1 2 3 4 5
Examination copy 1 2 3 4 5
10) How long have you been teaching?
___ 5 years or less ___ 16-20 years
___ 6-10 years ___ More than 20 years
___ 11-15 years
11) What is your current rank?
___ Adjunct ___ Associate professor
___ Instructor ___ Full professor
___ Assistant professor
12) What is your institution’s current student enrollment?
___ Less than 1,000 ___ 15,000 – 19,999
___ 1,000 – 4,999 ___ 20,000 – 24,999
___ 5,000 – 9,999 ___ 25,000 or more
___ 10,000 – 14,999

Silver, Stevens, Kernek, Wrenn & Loudon The Essentials of Marketing Research 4e
Case 24 c-114 MCS Publishing Company
c-114
Discussion Questions
1. Are the study objectives and methodology appropriate for management’s infor-mation needs given in the case? Discuss.
2. Evaluate the questionnaire in relation to the research objectives. Are the appropri-ate topics covered? Is the sequence of questions logical? Is the structure of the indi-vidual questions appropriate for the needed data?
3. Evaluate the sampling process and sample size. What type of sampling methodolo-gy is being used? Is the publishing company’s professor database a good sampling frame since it does not contain the e-mails of every business professor within the United States? What problems could the sampling frame and sample cause in this situation?
Basic SPSS Applications
Use the SPSS file to analyze the data and answer the following questions:
1. What is the demographic profile of the respondents in this survey?
2. What criteria do professors use in selecting a textbook?
3. How important are the various ancillary materials provided by publishing compa-nies?
4. Why do professors switch textbooks?
5. In terms of learning about new books, what methods are the most desirable?
6. How are professors being contacted by book reps? How often are professors be-ing contacted and how does that compare to what they prefer?
7. What types of book promotions encourage a professor to take a closer look at a textbook?
Advanced SPSS Applications
1. Are there any significant differences in responses based on the number of years an individual has been teaching? (For this analysis, it is recommended that you collapse the number of years the respondent has been teaching into three categories: 10 years or less, 11-20 years, and more than 20 years.)
2. Are there any significant differences in responses based on the respondent’s rank? (For this analysis, it is recommended that you collapse the respondent’s rank into three categories: Assistant and below, Associate, and Full.)
3. Does school size have any significant impact on the respondent’s answers to the survey questions? (For this analysis, it is recommended that you collapse the student
enrollment of the institution into four categories: Less than 5,000, 5,000-9,999, 10,000-19,999, and 20,000 or more.)