marketing research text and cases
TRANSCRIPT


Bruce Wrenn, PhDRobert Stevens, PhDDavid Loudon, PhD
Marketing ResearchText and Cases
Pre-publicationREVIEW
“M arketing Research: Text and Casesis a basic, clear, and thorough
guide to the process and science of con-ducting research. This text is especiallyhelpful to those who do not have amathematical background or those whohave been away from a statistics coursefor a few years. Its straightforward dis-cussion presents the concepts of re-search without clouding the issue withscenarios simultaneously. This allows thereader to truly understand the conceptand then make an application with thecase studies provided at the end of thebook.
As an instructor of a marketing re-search course, I believe this text assiststhe reader by presenting each of thethree different types of research de-sign (exploratory, descriptive, andcausal) and then offering methodsused in that particular design. Thechapter on primary research is espe-cially helpful to the novice researcher.
I believe this book would be a veryuseful text for an undergraduate coursein research or a helpful addition to anMBA course in marketing manage-ment.”
Phylis M. Mansfield, PhDAssistant Professor of Marketing,Penn State University, Erie

NOTES FOR PROFESSIONAL LIBRARIANSAND LIBRARY USERS
This is an original book title published by Best Business Books®, an im-print of The Haworth Press, Inc. Unless otherwise noted in specific chap-ters with attribution, materials in this book have not been previously pub-lished elsewhere in any format or language.
CONSERVATION AND PRESERVATION NOTES
All books published by The Haworth Press, Inc. and its imprints areprinted on certified pH neutral, acid free book grade paper. This papermeets the minimum requirements of American National Standard for In-formation Sciences-Permanence of Paper for Printed Material, ANSIZ39.48-1984.

Marketing ResearchText and Cases

BEST BUSINESS BOOKSRobert E. Stevens, PhDDavid L. Loudon, PhD
Editors in Chief
Strategic Planning for Collegiate Athletics by Deborah A. Yow, R. HenryMigliore, William W. Bowden, Robert E. Stevens, and David L.Loudon
Church Wake-Up Call: A Ministries Management Approach That IsPurpose-Oriented and Inter-Generational in Outreach by WilliamBenke and Le Etta N. Benke
Organizational Behavior by Jeff O. Harris and Sandra J. Hartman
Marketing Research: Text and Cases by Bruce Wrenn, Robert Stevens,and David Loudon
Doing Business in Mexico: A Practical Guide by Gus Gordon andThurmon Williams

Marketing ResearchText and Cases
Bruce Wrenn, PhDRobert Stevens, PhDDavid Loudon, PhD
Best Business Books®An Imprint of The Haworth Press, Inc.
New York • London • Oxford
Published by
Best Business Books®, an imprint of The Haworth Press, Inc., 10 Alice Street, Binghamton, NY13904-1580.
© 2002 by Bruce Wrenn/Robert Stevens/David Loudon. All rights reserved. No part of this workmay be reproduced or utilized in any form or by any means, electronic or mechanical, includingphotocopying, microfilm, and recording, or by any information storage and retrieval system,without permission in writing from the publisher. Printed in the United States of America.
In all case studies names, selected data, and corporate identities have been disguised.
Cover design by Anastasia Litwak.
Library of Congress Cataloging-in-Publication Data
Wrenn, W. Bruce.Marketing research : text and cases / W. Bruce Wrenn, Robert E. Stevens, David L. Loudon.
p. cm.Includes bibliographical references and index.ISBN 0-7890-0940-4 (alk. paper)—ISBN 0-7890-1590-0 (alk. paper)1. Marketing research. 2. Marketing research—Case studies. I. Loudon, David L. II. Stevens,
Robert E., 1942- III. Title.
HF5415.2. W74 2002658.8’3—dc21
2001035947

CONTENTS
Acknowledgments xi
Chapter 1. Introduction to Marketing Research 1
The Marketing-Decision Environment 1Marketing Research 2Marketing Research and Decision Making 3Strategic versus Tactical Information Needs 6The Nature of Marketing Research 6Steps in a Marketing Research Project 12Marketing Information Systems 24Summary 25
Chapter 2. Research Designs for Management DecisionMaking 27
Types of Research Designs 27Exploratory Research 30Descriptive Research 37Causal Research 44Experimentation 46Exploratory, Descriptive, or Causal Observation 60Dangers of Defining Design by Technique 61Summary 62
Chapter 3. Secondary Data 63
Uses of Secondary Data 63Advantages of Secondary Data 64Disadvantages of Secondary Data 65Secondary Data Sources 65Summary 78
Chapter 4. Primary Data Collection 79
Sources of Primary Data 80Types of Primary Data 80

Methods of Collecting Primary Data 84Communication Methods 86Survey Methods 96Observation Methods 106Summary 107
Chapter 5. Measurement 109
Introduction 109The Process of Measurement 111What Is to Be Measured? 117Who Is to Be Measured? 118How to Measure What Needs to Be Measured 119Assessing Reliability and Validity of Our Measures 121Measuring Psychological Variables 127Summary 138
Chapter 6. Designing the Data-Gathering Instrument 139
Goals of a Questionnaire 141Classification of Questions 143Designing a Questionnaire 147Summary 154
Chapter 7. Sampling Methods and Sample Size 157
What Is Sampling? 157Why Sampling? 158Sampling Error, Sample Bias, and Nonsampling Error 159Sampling Decision Model 160Probability Sampling 163Nonprobability Samples 165Probability versus Nonprobability Sampling 167Statistical Sampling Concepts 168What Is a “Significant” Statistically Significant Difference? 176Summary 177
Chapter 8. Fielding the Data-Gathering Instrument 179
Planning 179Guidelines for Interviewers 180

Types of Interviews 181The Interviewing Relationship 183The Interviewing Situation 184The Actual Interview 186Fielding a Research Project 189Errors in Data Collection 195Types of Nonsampling Errors 196Summary 200
Chapter 9. Introduction to Data Analysis 201
From Data to Decisions 202Data Summary Methods 206Cross-Tabulation 212Summary 221
Chapter 10. Advanced Data Analysis 223
Marketing Research and Statistical Analysis 223Hypothesis Testing 224Measures of Association 233Summary 241
Chapter 11. The Research Report 243
Introduction 243Report Format 244Guidelines for the Written Report 269Oral Reports 276Summary 278
CASES 279
Contributors 280Case 1. Lone Pine Kennel Club 281Case 2. Select Hotels of North America 283Case 3. River Pines School: A 287Case 4. River Pines School: B 291Case 5. Gary Branch, CPA 297Case 6. Juan Carlos’ Mexican Restaurant 305

Case 7. Usedcars.com 313Case 8. Welcome Home Church 321Case 9. The Learning Source 325Case 10. Madison County Country Club 331Case 11. Plasco, Inc. 337Case 12. St. John’s School 343Case 13. The Webmasters 349Case 14. House of Topiary 355Case 15. Professional Home Inspection 359Case 16. Europska Databanka 369
Notes 379
Index 385

ABOUT THE AUTHORS
Bruce Wrenn, PhD, is Associate Professor of Marketing in the Division ofBusiness and Economics at Indiana University South Bend. The author ofseveral books on marketing management, planning, research, and market-ing for religious organizations, Dr. Wrenn has also written numerous arti-cles on marketing strategy, research, and marketing techniques for nonprofitand health care organizations. He spent several years with a major pharma-ceutical company performing market analysis and planning and has servedas a consultant to a number of industries, religious denominations, and orga-nizations in the food, high tech, and health care industries.
Robert Stevens, PhD, is Professor of Marketing in the Department of Man-agement and Marketing at the University of Louisiana at Monroe. Duringhis distinguished career, Dr. Stevens has taught at the University of Arkan-sas, the University of Southern Mississippi, and Hong Kong Shue Yan Col-lege. His repertoire of courses has included marketing management, busi-ness research, statistics, marketing research, and strategic management. Theauthor and co-author of 20 books and well over 100 articles, he has pub-lished his research findings in a number of business journals and numerousprofessional conference proceedings. He is co-editor of the Journal of Min-istry Marketing & Management and Services Marketing Quarterly, andserves on the editorial boards of four other professional journals. Dr.Stevens has acted as a marketing consultant to local, regional, and nationalorganizations and is the owner of two small businesses.
David Loudon, PhD, is Professor of Marketing and Head, Department ofManagement and Marketing in the College of Business Administration atthe University of Louisiana at Monroe. He has been a faculty member atLouisiana State University, the University of Rhode Island, Hong KongShue Yan College, and the North American Executive Program in Monterrey,Mexico. He has taught a variety of courses but focuses on marketing man-agement and consumer behavior. Dr. Loudon is the co-author of twelvebooks and has conducted research in the United States, Europe, Asia, andLatin America on such topics as consumer behavior, international market-ing, services marketing, and marketing management. He has written over100 papers, articles, and business cases, and his research findings have beenpublished in a number of journals and in the proceedings of numerous pro-fessional conferences. He is co-editor of Best Business Books, an imprint ofThe Haworth Press, Inc., and co-editor of two journals: Services MarketingQuarterly and Journal of Ministry Marketing & Management.


Acknowledgments
Many individuals contributed to the development of this book. We owespecial thanks to Cynthia Castillo, who typed the many drafts of cases andto Orsolya Lunscsek, who helped with the development of the test bank—both MBA students at the University of Louisiana at Monroe. Specialthanks also to Vicki Mikulak who typed drafts of the book.
Special thanks to the following contributors of cases and case teachingnotes: Dr. Henry S. Cole, Dr. Bruce C. Walker, Dr. Stanley G. Williamson,Dr. Marlene M. Reed, Michael R. Luthy, and Dr. Edward L. Felton.
PowerPoint slides are available for this text and can be acquired by con-tacting Dr. Robert E. Stevens: University of Louisiana at Monroe, 700 Uni-versity Dr., Monroe, LA 71209, telephone (318) 342-1201, or [email protected].

Chapter 1
Introduction to Marketing ResearchIntroduction to Marketing Research
THE MARKETING-DECISION ENVIRONMENT
Marketing decisions in contemporary organizations are some of the mostimportant decisions made by managers. The decisions of what consumersegments to serve with what products/services, at what prices, throughwhich channels, and with what type and amounts of promotion not only de-termine the marketing posture of a firm, but also affect decisions in otherareas as well. The decision to emphasize quality products, for example, af-fects decisions on procurement, production personnel, quality control, etc.
Many companies are discovering that the decisions involved in creatingand distributing goods and services for selected consumer segments havesuch long-run implications for the organization that they are now beingviewed as strategic decisions necessitating input by top management. Somemarketing decisions, such as those relating to strategy, may involve com-mitments and directions that continue to guide efforts as long as they provesuccessful. A belief that future success requires the organization to become“market oriented”1 or “market sensitive” has increased the importance ofthe intelligence function within organizations as they seek to make the rightresponses to a marketplace. Right responses become increasingly importantas competition heats up in markets. Firms are discovering that they must bemarket driven in order to make decisions that meet with market approval.
Developing an understanding of consumer needs, wants, perceptions,etc., is a prerequisite to effective decision making. Consider the different re-sults of marketing Pepsi AM in the United States and Chee-tos in China.Pepsi AM was introduced without research, which would have revealed thatthe name suggested it to be drunk only in the morning, thereby restrictingmarket size to specific-occasion usage. Frito-Lay did extensive research onthe market for snack foods in China before introducing Chee-tos there.They learned that cheese was not a common item in the diet of Chinese, thattraditional Chee-tos flavors did not appeal to consumers there, but that someflavors were appealing (savory American cream and zesty Japanese steak).They also researched Chinese reaction to Chester Cheetah, the cartoon char-
acter on the bag, and the Chinese translation of “Chee-tos” (luckily corre-sponding to Chinese characters qu duo or “new surprise”). Pepsi AM was aflop; Chee-tos were such a success that Frito-Lay could not keep storeshelves stocked.2
Marketing research is the specific marketing function relied upon to pro-vide information for marketing decisions. However, it should be stressed atthe outset that merely doing marketing research does not guarantee that betterdecisions will be made. The quality of each stage of a marketing research pro-ject will either contribute to better decision making or will make it an everelusive goal. If research results are correctly analyzed and imaginatively ap-plied, studies have shown that increased profitability is often the outcome.3
MARKETING RESEARCH
The American Marketing Association defines marketing research as fol-lows:
Marketing research is the function which links the consumer, cus-tomer, and public to the marketer through information—informationused to identify and define marketing opportunities and problems;generate, refine, and evaluate marketing actions; monitor marketingperformance; and improve understanding of marketing as a process.
Marketing research specifies the information required to addressthese issues; designs the method for collecting information; managesand implements the data collection process; analyzes the results; andcommunicates the findings and their implications.4
This rather lengthy definition suggests the connection between research anddecision making in business organizations.
Research, in a business context, is defined as an organized, formal inquiryinto an area to obtain information for use in decision making. When the adjec-tive marketing is added to research, the context of the area of inquiry is de-fined. Marketing research, then, refers to procedures and techniques involvedin the design, data collection, analysis, and presentation of information usedin making marketing decisions. More succinctly, marketing research pro-duces the information managers need to make marketing decisions.5
Although many of the procedures used to conduct marketing researchcan also be used to conduct other types of research, marketing decisions re-quire approaches that fit the decision-making environment to which theyare being applied. Marketing research can make its greatest contribution tomanagement when the researcher understands the environment, industry,company, management goals and styles, and decision processes that giverise to the need for information.

MARKETING RESEARCH AND DECISION MAKING
Although conducting the activities of marketing research requires usinga variety of research techniques, the focus of the research should not be onthe techniques. Marketing research should focus on decisions to be maderather than the collection techniques used to gather information to facilitatedecision making. This focus is central to understanding the marketing re-search function in terms of what it should be and to the effective and effi-cient use of research as an aid to decision making. Any user or provider ofmarketing research who loses sight of this central focus is likely to end up inone of two awkward and costly positions: (1) failing to collect the informa-tion actually needed to make a decision or (2) collecting information that isnot needed in a given decision-making context.6 The result of the first is in-effectiveness—not reaching a desired objective, and the result of the secondis inefficiency—failing to reach an objective in the least costly manner. Thechances of either of these occurring are greatly reduced when the decision tobe made is the focus of the research effort.
To maintain this focal point, an understanding of the purpose and role ofmarketing research in decision making is necessary. The basic purpose ofmarketing research is to reduce uncertainty or error in decision making. It isthe uncertainty of the outcome surrounding a decision that makes decisionmaking difficult. If the outcome of choosing one alternative over another isknown, then choosing the right alternative would be simple, given the deci-sion-making criteria. If it were certain that alternative A would result in$100,000 in profit and that alternative B would result in $50,000 in profit,and the decision criterion was to maximize profits, then the choice of alter-native A would be obvious. However, business decisions must be made un-der conditions of uncertainty—it is unknown if alternative A will produce$50,000 more than B. In fact, either or both alternatives may result in losses.It is the ability to reduce uncertainty that gives information its value.
Analyzing what is involved in making a decision will help in understand-ing how information aids decision making. Decision making is defined as achoice among alternative courses of action. For purposes of analysis, a deci-sion can be broken down into four distinct steps (see Figure 1.1): (1) iden-tify a problem or opportunity, (2) define the problem or opportunity,(3) identify alternative courses of action, and (4) select a specific course ofaction.
Identify a Problem or Opportunity
A problem or opportunity is the focus of management efforts to maintainor restore performance. A problem is anything that stands in the way ofachieving an objective, whereas an opportunity is a chance to improve onoverall performance.

Managers need information to aid in recognizing problems and opportu-nities because before a problem can be defined and alternatives developed,it must be recognized. An example of this type of information is attitudinaldata that compares attitudes toward competing brands. Since attitudes usu-ally are predictive of sales behavior, if attitudes toward a company’s prod-uct were less favorable than before, the attitudinal information would makethe managers aware of the existence of a problem or potential problem. Op-portunities may depend upon the existence of pertinent information, such asknowing that distributors are displeased with a competitor’s new policy ofquantity discounts and as a result may be willing to place increased ordersfor your product.
Define the Problem or Opportunity
Once a problem or opportunity has been recognized, it must be defined.Until a clear definition of the problem is established, no alternative coursesof action can be considered. In most cases a problem cannot be definedwithout some exploration. This is because the symptoms of the problem arerecognized first and there may be several problems that produce the sameset of symptoms. An analogy using the human body may help in under-standing this point. A person experiencing a headache (symptom) may besuffering from a sinus infection, stress, the flu, or a host of other illnesses(potential problems). Treating the headache may provide temporary relief,but not dealing with the root problem will ensure its return, perhaps worsen-ing physical conditions.
The same type of phenomenon occurs in marketing. A firm, experiencinga decline in sales (symptom), may find it to be the result of a decline in totalindustry sales, lower prices by competitors, low product quality, or a myriadof other potential problems. No alternative courses of action should be con-sidered until the actual problem is defined. Thus, information aids the man-ager at this stage in the decision-making process by defining the problem.
In some cases an entire research project must be devoted to defining theproblem or identifying an opportunity because of a lack of insight or prior
FIGURE 1.1. Steps in Decision Making
Step 1 Step 2 Step 3 Step 4
Recognizethe Existenceof Problemsand Opportu-nities
Define theExact Natureof Problemsand Opportu-nities
IdentifyAlternativeCoursesof Action
Select anAlternativeCourseof Action

knowledge of a particular area. This type of study is usually called an ex-ploratory study and will be discussed more fully in Chapter 2.
Identify Alternatives
The third stage in the decision-making process involves identifying via-ble alternatives. For some problems, developing alternatives is a naturaloutcome of defining the problem, especially if that particular problem oropportunity has occurred before. A manager’s past knowledge and experi-ences are used to develop the alternatives in these situations. However, inother situations a real contribution of research is to inform the decisionmaker of the options available to him or her. A company considering intro-duction of a new product may use consumer information to determine theposition of current offerings to evaluate different ways its new productcould be positioned in the market. Information on the significant product at-tributes and how consumers position existing products on these attributeswould be an evaluation of possible “openings” (options) available at a giventime.
Select an Alternative
The final stage in the decision-making process is the choice among thealternative courses of action available to the decision maker. Informationprovided by research can aid a manager at this stage by estimating the ef-fects of the various alternatives on the decision criteria. For example, a firmconsidering introduction of a new product may test market two versions ofthat product. The two versions of the product are two alternatives to be con-sidered and the sales and profits resulting from test marketing these two ver-sions become the information needed to choose one alternative over an-other. Another example is the pretest of television commercials usingdifferent themes, characters, scripts, etc., to provide information on con-sumer reactions to alternative commercials. This information also aids thedecision maker in selecting the best advertising approaches to use.
Information collected through research must be directly related to the de-cision to be made in order to accomplish its purpose of risk reduction. Thus,the focus of research should be the decision-making processes in generaland, specifically, the decision to be made in a given situation, rather than thedata or the techniques used to collect the data. There is always the danger ofa person involved in marketing research viewing himself or herself as a re-search technician rather than as someone who provides information to helpmanagers make decisions to solve problems and take advantage of opportu-nities. In fact, it is safe to say that the best researchers think like decisionmakers in search of information to make decisions rather than as researchersin search of answers to research questions.

STRATEGIC VERSUS TACTICAL INFORMATION NEEDS
Managers are called upon to make two broad categories of decisions—strategic and tactical. The strategic decisions are those that have long-runimplications and effects. These decisions are critical to a firm’s success andmay not be altered if successful. Tactical decisions are short run in scopeand effect and are usually altered on a regular basis. An example of thesetwo types of decisions will help clarify the distinction and also clarify whatmany researchers and managers have failed to understand.
A company analyzing an industry for possible entry would be consider-ing a strategic move—entering a new industry. This requires information onsuch things as competitor strengths and weaknesses, market shares held bycompetitors, market growth potential, production, financial and marketingrequirements for success in the industry, strategic tendencies of competi-tors, etc. This is strategic information. Once the decision to enter the indus-try has been made, information on current prices charged by specific com-petitors, current package designs and sizes, etc., is needed to make thetactical decisions for the short run—a year or less. This is tactical informa-tion.
Thus, strategic decisions require strategic information, and tactical deci-sions require tactical information. Failure to recognize the distinction be-tween decision types and information types will result in information thatdeals with the right areas—prices for example—but with the wrong timeframe. For tactical decisions, a manager needs to know competitive pricesand their emphasis by both competitors and consumers. For strategic deci-sions, the manager is more interested in competitors’ abilities and tenden-cies to use pricing as a retaliatory weapon.
The researcher and the manager must be certain the time frame for thedecision is specified in advance to ensure that the right type of informationis collected. This should be a joint effort by both information user and pro-vider.
THE NATURE OF MARKETING RESEARCH
It is obvious at this point that the key to understanding when marketingresearch can be of greatest value to organizations is to understand the deci-sions facing marketing managers. These areas and the related forms of mar-keting research include:
Concept/product testing. A concept or product test consists of evaluatingconsumer response to a new product or concept. This is often a part of thetest market in the development of a new product. It is also used to determinehow a product or service can best be positioned in a particular sector of themarketplace. For example, product testing would answer what the con-

sumer’s perception of new products or services to be offered might be. Itcan also examine how users perceive a product’s value as well as its attrib-utes and benefits or how perceived values and attributes relate to actual needand demand.
Tracking study. A tracking study is an ongoing periodic survey ofprerecruited consumers who record their use of various products or ser-vices. Specific preferences are measured and compared to evaluate changesin perceptions, preferences, and actual usage over time.
Product/brand service usage. Product or brand usage studies serve to de-termine current demand for the various brands of a product or service. Thistype of approach may also determine which brand name has primary aware-ness in the consumers’ minds or which they prefer as well as how often andwhy it is used.
Advertising penetration. Advertising penetration analyses evaluate themessage that is actually being communicated to the target audience. Thistype of study serves to determine if the intended message is understood,how persuasive it is, or how well it motivates. These studies may also evalu-ate the effectiveness of individual media for a particular target market.
Image evaluation. Image studies provide feedback relative to the image acompany, product, or service has in the eyes of the consumers. Image stud-ies may reveal attribute perceptions of a particular brand or determine itsstrengths and weaknesses.
Public opinion surveys. Public opinion surveys determine the key issuesin the minds of the public or specific customers (or investors), relative tospecific issues, individuals, or business sectors. They reveal whether opin-ion is positive or negative, determine the degree of importance of specificissues, or evaluate awareness levels of key issues.
Copy testing. Copy testing allows for an evaluation of consumer re-sponse to ad copy being considered. It determines how well the intendedmessage is actually being communicated. Copy tests ensure the wordingused is consistent with the language of the target audience. Copy testing isused most effectively in the conceptual stages of copy development to allowfor consumer feedback on concepts portrayed by various preliminary adcopy.
Test marketing/product placements. Product placements are a bit moreextensive than product tests. Product tests take place in a controlled setting,such as a shopping mall where consumers are recruited to test a product. In aproduct placement study, the product to be test marketed is placed in thehome of the consumer for a specific period of time. After this period a per-sonal or telephone interview is used to record the specific responses of theuser concerning the product. This type of study will determine how con-sumers respond to a product that often has no name or packaging appeals as-sociated with it.

Taste tests. Taste tests are conducted in a controlled environment whereconsumers are recruited to taste a product and give their evaluations. Tastetests serve to determine the acceptance of a product without brand or pack-aging appeals relative to attributes of flavor, texture, aroma, and visual ap-peal. Taste tests may be conducted with variations of a single product orwith samples of competitors’ products tasted for comparison testing.
Market segmentation. Market segmentation studies determine how amarket is segmented by product usage, demand, or customer profiles. Thesestudies usually develop demographic, psychographic, product preference,and lifestyle profiles of key market segments.
Media measurement. These studies determine what share of the marketthe medium being tested actually has and how a target market is identifieddemographically and psychographically. Media studies also evaluate pref-erences in programming as well as promotional appeals that are most effec-tive in reaching and expanding a particular target audience.
Market feasibility. A market feasibility study analyzes the market de-mand for a new product, brand, or service. This type of study usually evalu-ates potential market size, determines what kind of demand might be ex-pected, what market dynamics are interacting, and what market segmentsmight be most receptive to the introduction of a new product or brand. Fea-sibility studies may also determine market feedback relative to similar prod-uct or services, attributes sought, as well as pricing and packaging perspec-tives.
Location studies. For local customer-intensive businesses, the locationmust be determined. Location studies serve to evaluate the size of the poten-tial market surrounding a proposed location and whether local demand willsupport the facility.
Market share/market size studies. Market share/market size studies de-termine what products are being purchased at what volume and the actualsize of sales being realized by each competitor. These studies can also iden-tify and determine the strength of new firms that have recently entered themarket in a strong growth mode.
Competitive analysis. A competitive analysis is often part of a marketshare/market size study. It consists of an evaluation of the strengths andweaknesses of competitors. It may also include pertinent data relative to lo-cations, sales approaches, and the extent of their product lines and manufac-turing capabilities.
Positioning studies. Positioning studies evaluate how leading companiesor brands are viewed in the minds of consumers concerning key product orimage attributes. This type of study will evaluate perceived strengths andweaknesses of each, as well as determine key attributes consumers associatewith their idea of an “ideal” supplier of a particular product or service.

Customer satisfaction studies. Customer satisfaction studies evaluate thelevel of satisfaction existing customers have with the products or services ofa company or organization. The basic philosophy is that it is cheaper to keepan existing customer than to try to attract a new one. Therefore, continuousanalysis of existing customers provides input on how to change what is be-ing done to increase satisfaction or lessen dissatisfaction.
Marketing Research for Small Organizations
While it is true that larger corporations would account for the largest shareof expenditures for the aforementioned applications of research, small busi-nesses and entrepreneurial ventures are certainly interested in obtaining re-search results that can help them make better decisions in these areas. Suchfirms would typically seek answers to the following types of questions aswell.
Customer Research
• Which customer groups represent the best target markets for myproduct or service?
• How large is the existing and potential market? What is its rate ofgrowth?
• What unfulfilled needs exist for my product? How are customers cur-rently fulfilling those needs?
• Under what circumstances would customers use the product? Whatbenefits are customers seeking to gain in these circumstances?
• Where would customers expect to buy the product? What processesdo they go through when buying the product?
• Who makes the purchase decision for this type of product? How arethey influenced by others in the household (or company) when mak-ing this decision?
• What is the value customers place on having their needs fulfilled bythis type of product?
Competitor Analysis
• Who are my competitors (i.e., alternatives to addressing the needs ofpotential customers)?
• How brand loyal are customers to my competitors?• How do potential buyers perceive competitors’ offerings?• What are my competitors’ competitive advantages and how are they
exploiting them through their marketing programs?

Operational Environment
• By what means (channels, methods) is this type of production madeavailable to customers? Is there an opportunity to innovate here?
• How are customers made aware of this type of product? What oppor-tunities exist to increase efficiency and effectiveness in promotion?
• What technological developments are likely to occur in this marketand how will they affect our competitive position?
• What cultural/social environmental trends could impact our busi-ness? How?
• What will be the impact of the regulatory environment on our busi-ness now and in the foreseeable future?
• What economic and demographic trends are occurring which couldaffect the nature of the market opportunity? How?
These examples of issues of interest to small businesses are typical of thekinds of questions that marketing research can seek to answer. How researcharrives at the answers to these questions can vary from project to project.
The Nature of Conventional and Unconventional Research
It is important to reiterate that a study of marketing research should beginwith this understanding—marketing research is not focused on the use ofsurveys or experiments or observations (i.e., techniques). Marketing re-search is about finding solutions to management problems and aiding inbetter decision making. Therefore, the goal of using marketing research isnot to propagate convention in the use of research methods, but rather tofind solutions. When it is obvious that the best method of finding a solutionto a problem is to conduct a survey (or conduct an experiment, or use obser-vational methods, etc.), then it is important to use such techniques scientifi-cally, so that we have faith that the findings contain as much “truth” as wecan afford. Sometimes the method we use to search for the truth in order toreduce uncertainty and make better decisions follows convention. Some-times it is unique and unconventional. We do not “score points” for conven-tionality; we succeed by finding efficient and effective means of gatheringinformation which aids decision making. The following example will helpto illustrate this point:
A producer of frozen dinner entrees set an objective that the com-pany’s food products should not just be good heat-and-serve meals, butshould aim higher and be considered excellent cuisine in general. At anadvanced stage of product development they wanted to see how closethey were getting to their objective, and decided upon a somewhat un-conventional method of testing product quality. They rented the ball-

room of a local hotel noted for its excellent catering service and underthe guise of a professional organization invited local business profes-sionals to attend a meeting where a well-known speaker would make apresentation on a topic of interest to the business community. Unbe-knownst to the attendees, the company had the hotel kitchen heat andserve the food company’s frozen entrees instead of the hotel’s usual ca-tered meal. At each table of eight in the audience the company had amember of its staff playing the role of just another invited guest. Duringthe meal the employee would engage others at the table in a discussionof the quality of the food (e.g., “I see you got the lasagna while I gotchicken Kiev. How is the lasagna here?”). After the meal and speechthe other guests at each table were debriefed about the ruse.
By taking this approach the firm was able to obtain insights into howclose they were getting to having a product that could compare favorably tocuisine prepared by chefs and with high expectations by diners. Althoughnot the only research conducted by the firm for this line of products, thisrather unconventional method gave them good insights at this stage of theprocess that might have exceeded what traditional taste tests could haveachieved. Once again, our overriding objective is to improve decision mak-ing, not pursue convention.
We would be remiss, however, if we did not follow-up that admonitionwith this caveat—we are not suggesting an “anything goes” approach to re-search. We must always ensure that we pursue research that is both relatedto the management problem and its related decisional issues, and mustmake certain our methods are scientific and represent the most efficientmeans of seeking answers to our questions. Figure 1.2 helps to show thepossible combinations of these variables.
Better decision making by using research results only comes from re-search which falls in cell #1. However, you can imaginatively apply scien-tific methodology that goes against “convention,” and still end up in cell #1.The point here being that when we set out to do our research we do not set
FIGURE 1.2. Outcomes of Research
Is Research Relevant to a Real ManagementProblem?
YES NO
Does the Research FollowScientific Methods?
YES1. Results are
relevant andbelievable.
2. Results arebelievable, butnot relevant.
NO3. Results are
relevant, but notbelievable.
4. Results areneither relevantnor believable.
out to write a questionnaire, or conduct in-depth interviews, or run an exper-iment, etc.; we set out to solve a problem, to evaluate an opportunity, to testhypotheses, etc., so that we can reduce uncertainty and improve our deci-sion making. So, we need to understand that it is possible to be both scien-tific and unconventional, and we must be open to using whatever methodrepresents the most efficient and effective means of generating relevant andbelievable results, and not be bound by our past proclivities to use certain“comfortable” methods.
STEPS IN A MARKETING RESEARCH PROJECT
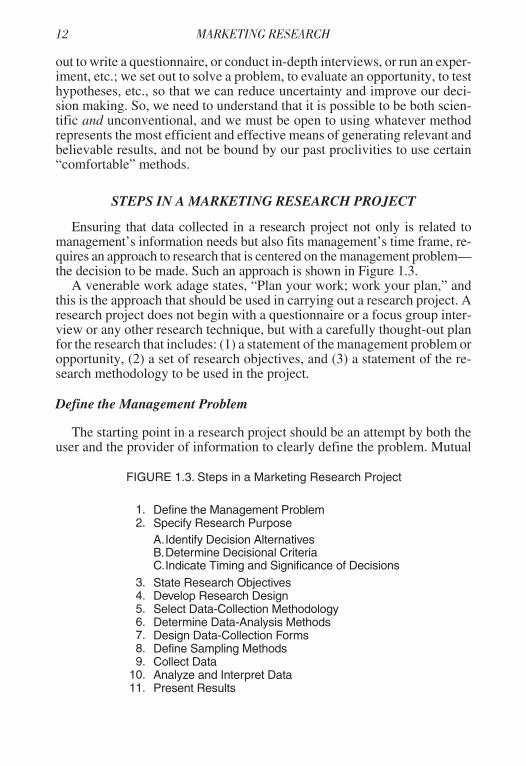
Ensuring that data collected in a research project not only is related tomanagement’s information needs but also fits management’s time frame, re-quires an approach to research that is centered on the management problem—the decision to be made. Such an approach is shown in Figure 1.3.
A venerable work adage states, “Plan your work; work your plan,” andthis is the approach that should be used in carrying out a research project. Aresearch project does not begin with a questionnaire or a focus group inter-view or any other research technique, but with a carefully thought-out planfor the research that includes: (1) a statement of the management problem oropportunity, (2) a set of research objectives, and (3) a statement of the re-search methodology to be used in the project.
Define the Management Problem
The starting point in a research project should be an attempt by both theuser and the provider of information to clearly define the problem. Mutual
FIGURE 1.3. Steps in a Marketing Research Project
1. Define the Management Problem2. Specify Research Purpose
A.Identify Decision AlternativesB.Determine Decisional CriteriaC.Indicate Timing and Significance of Decisions
3. State Research Objectives4. Develop Research Design5. Select Data-Collection Methodology6. Determine Data-Analysis Methods7. Design Data-Collection Forms8. Define Sampling Methods9. Collect Data
10. Analyze and Interpret Data11. Present Results

understanding and agreement are vitally necessary at this point in the re-search process. Failure by either party to understand or clearly define themajor issue requiring information will surely lead to disappointment andwasted effort. Studies have shown that the proper utilization of the findingsfrom marketing research by managers is directly affected by the quality ofinteractions that take place between managers and researchers, plus thelevel of researcher involvement in the research decision-making process.7Many information users, especially the uninitiated, have been “burned,”never to be “burned” again, by someone who has collected some data, thencollected the money and left them with a lot of “useful” information.8
A health care administrator recently related such a story. He had heard agreat deal about marketing and the need for having information on consum-ers, although he was unclear about both. He was approached by a marketingresearch firm that offered to supply a lot of “useful marketing information”for a reasonable fee. Several months after he had received the final reportand the marketing research firm had received his check, he realized that hehad no idea of how to use the information or if it was what he really needed.
This type of problem can be avoided, or at least minimized, through user-provider interaction, analysis, and discussion of the key management issuesinvolved in a given situation. The information provider’s task is to convertthe manager’s statement of symptoms to likely problems and decision is-sues and then finally to information needs. Two key questions that must al-ways be dealt with at this stage are: (1) what information does the decisionmaker believe is needed to make a specific decision and (2) how will the in-formation be used to make the decision? Asking these questions will causethe information user to begin thinking in terms of the information needed tomake the decision rather than the decision itself. Also, the user can move toa level of thinking specifically about how the information will be used.
An example of this interaction process will help clarify this point. An ex-ecutive vice president for a franchise of a national motel-restaurant chainwas evaluating his information needs with one of the authors about a majorremodeling of one of the chain’s restaurants. The author posed the questionabout how the information was going to be used in the decision-making pro-cess. The chain’s vice president then realized that corporate policy would not
Research Project Tip
A problem exists when there is a difference between the ideal state andthe actual state. An opportunity exists when the market favorably valuessomething the organization can do. Ask the client to describe “the bot-tom line” of what he or she sees as the problem or opportunity that re-quires research in order to make decisions. This is a starting point, butmore work is needed to determine the focus of the research.

permit deviating from the established interior designs currently used even ifinformation were available that an alternate design would be more accept-able to consumers. He then concluded that he did not need the information!The information could have been easily obtained through a survey, but thebottom line would have been management’s inability to act on it. The man-ager realized that he needed to work on a policy change at the corporatelevel and if information was needed, it would be to evaluate that particularpolicy.
One type of question that can aid in the process of identifying the realproblem in its proper scope is the “why” question. The researcher uses thewhy question to help separate what is known (i.e., facts) from what ismerely assumed (i.e., hypotheses). The following example of a manufac-turer of capital equipment will help illustrate the use of the why question.
The Compton Company was a capital equipment manufacturerwith a market share larger than its next two competitors combined. Allcompanies in this business sold through independent distributors whotypically carried the lines of several manufacturers. Compton had forseveral years been suffering a loss of market share. In an effort to re-gain share they fired their ad agency. The new agency conducted astudy of end-use customers and discovered that the fired ad agencyhad done an outstanding job of creating awareness and interest in theCompton line. The study also revealed that these end-users were buy-ing competitor’s equipment from the distributors. The switch from in-terest in Compton to the competition was not a failure of the advertis-ing, but rather the result of distributors’ motivation to sell the productsof manufacturers’ running sales contests, offering cash bonuses, andsupplying technical sales assistance.9
If a marketing researcher had been called in to help address Compton’sproblem the resulting conversation might have been as follows:
Manager: We need you to help us find a new advertising agency.
Researcher: Why do you believe you need a new ad agency?
Manager: Because our market share is slipping.
Researcher: Why do you believe that is the fault of your ad agency?
Manager: Because we think they have not created a high enoughlevel of awareness and interest in our product among target marketmembers.
Researcher: OK, but why do you believe that? What evidence do youhave that ties your declining market share to a problem with advertising?
At this point it will become obvious that the company does not have anyevidence that supports the contention that poor advertising is the source ofthe decline in market share. This realization should open the door for the re-searcher to suggest that the issue be defined as a decline in market share, andthat some research could be done to identify the source of the problem.Asking “why” questions allows all parties involved to separate facts fromhypotheses and give direction to research that can help solve real problemsin their proper scope. Once the problem has been determined, the researchercan enter into discussions with the decision maker regarding the appropriatepurpose for the research.
Specify Research Purpose
It is important to establish an understanding between the decision maker andthe researcher as to the role the research will play in providing information foruse in making decisions.10 This suggests that one of the first things researchersshould do is identify the decision alternatives facing the decision maker.
Identify Decision Alternatives
As has been repeatedly stressed in this chapter, effective research is re-search that results in better decision making. Hence, as a first step in deter-mining the role of research in solving the management problem, the re-searcher should ask “what if ” questions to help identify the decisions underconsideration. For example, continuing the Compton Company dialog be-tween researcher and decision maker:
Researcher: What if the research revealed that potential customersbelieved our products failed to offer features comparable to our com-petitors, and so bought competitor’s products?
Manager: Well, I do not think that is happening, but if it were then wewould change our product to offer those features.
Research Project Tip
You will need to ask “why” questions similar to the Compton Companyexample to distinguish between facts and hypotheses. Sometimes the cli-ent believes a hypothesis so strongly that it has become a “fact” in the cli-ent’s mind. Asking “why” questions helps focus researchers and deci-sion makers on the “real” problem (i.e., the problem in its proper scope).

A review of such “what if ” questions will identify those areas in whichdecisions might be made to solve the management problem. If the answer tothe question is that knowing such information would not make a differencein the decisions made, then the researcher knows not to include that issue inthe research since it would not positively influence decision making. It isobvious that it is necessary for the researcher to “think like a decisionmaker” in order to know what questions to ask. Putting yourself in the posi-tion of a decision maker, thinking what decisions you might be faced with,and then asking “what if ” questions to determine if the actual decisionmaker sees things as you do is an effective means of beginning the processof determining the research purpose.
Determine Decisional Criteria
Once the decision alternatives facing the decision maker seeking to solvethe management problem have been specified, the researcher must deter-mine what criteria the manager will use to choose among the alternatives.Different managers facing a choice among alternatives might desire differ-ent information, or information in different forms to feel comfortable in dis-tinguishing which alternative is best. The decisional criteria are those piecesof information that can be used to identify which alternatives are truly capa-ble of solving the problem. For example, in the Compton Company case thedialog to help identify one of the decisional criteria might have looked likethe following:
Researcher: So, one area we might want to consider making a deci-sion in would be redesigning the product with the latest features. Whatinformation would you need to have in order to make those types ofdecisions?
Manager: I would want to know the features desired by our targetmarket customers, and how those features are expected to deliver spe-cific benefits to those customers. I would also like to see how our cus-tomers compare our products to our competitors’ products.
Research Project Tip
Asking “what if ” questions aids the researcher in determining the pur-pose of the research. Write down all the topics where the answers to“what if ” questions reveal decisions that are to be made based on suchfindings. Research will attempt to provide information that makes a dif-ference in decision making.

A similar dialog would help to identify other decisional criteria. Throughthis process of specifying decisional alternatives and the criteria used tochoose among the alternatives, the researcher is also helping the decisionmaker to clarify in his or her own mind how to arrive at a decision to solvethe real management problem.
Indicate Timing and Significance of Decisions
Other areas of concern to the researcher trying to arrive at a statement ofresearch purpose are the amount of time available to the decision makerwithin which to make the decision, and how important the decision is to thefirm. The same management problem could result in very different researchpurposes if decision makers see the timing and significance of the researchdifferently. Researchers are responsible for ensuring that the research pur-pose not only fits the decisional criteria needs, but is also consistent with thetiming and significance accorded the research and the associated decision-making process.
Statement of research purpose. Once the decision alternatives, criteria,and timing and significance of the decisions have been considered it is use-ful for the researcher to construct a one (or two) sentence declaration of theresearch purpose. For the Compton Company case such a sentence might beas follows:
Research Purpose
To determine the cause(s) of the decline in our market share andidentify possible actions that could be taken to recover the lost share.
The researcher would need to obtain agreement with the decision makeras to the appropriateness of such a statement, as well as agreement with theresearch questions.
Research Project Tip
You may have to ask a series of probing questions intended to get the cli-ent to reveal what information in what form he or she will need in orderto make the decisions faced. Sometimes these criteria have not been ex-plicitly identified before such questioning. By “thinking like a marketingdecision maker” you can determine if the client might be interested in thesame information you might use if you were in the client’s position.

State Research Objectives
Research objectives consist of questions and hypotheses. The researchquestions represent a decomposition of the problem into a series of state-ments that constitute the end results sought by the research project. Thequestions should be stated in such a way that their accomplishment will pro-vide the information necessary to solve the problem as stated. The questionsserve to guide the research results by providing direction, scope of a givenproject, and serve as the basis for developing the methodology to be used inthe project.
In the area of research questions, both the user and provider should interactto maximize the research results that the user and provider are anticipating.The provider of the information usually assumes the role of interpreting needsand developing a list of questions that serve as a basis of negotiation for finalresearch objectives. Objectives should be stated in the form of questions sothat the researcher can think in terms of finding ways to provide answers tothose questions. The following illustration will help make this clear.
In the Compton Company case the research questions might be framed asfollows:
• Where has market share declined (e.g., products, geographic areas,channel type, etc.)?
• What is the level of awareness and interest in our products among tar-get market members?
• What competitive actions have attracted our customers?• What are the perceptions of our dealers and distributors for our poli-
cies and practices (i.e., what is the status of our relationships withdealers)?
• How do customers rate the quality, features, price, etc., of our prod-ucts versus competitors?
Other questions could be stated. Note that in each case research must bedone (sometimes internal to the company, sometimes external) to discoverinformation that can answer the research questions.
Research Project Tip
Be sure your research questions are in the form of questions, and requireresearch of some type (internal or external to the organization) to get an-swers to the questions. Plan on spending a fair amount of time develop-ing these questions (and hypotheses) since all the remaining steps of theresearch process will be seeking to get answers to these questions (andtesting your hypotheses).

Hypotheses are speculations regarding specific findings of the research.They are helpful to researchers when their presence results in actions takenby the researcher that might not have occurred in the absence of the hypoth-esis. If the presence of an hypothesis in no way affects the research or theanalysis of the data, the hypothesis is superfluous and does not need to bestated. If, on the other hand, the hypothesis influences the research in anyone of the following ways, it should be included:
1. Choice of respondents. If the researcher believes that an importantpart of the research is to determine if a speculated difference in atti-tudes, behaviors, preferences, etc., exists between two groups of re-spondents, the hypothesis is useful to the research. For example:
Hypothesis: Customers on the west coast favor this product featuremore than customers on the east coast.
Such a hypothesis affects the research by causing the researcher to in-clude customers from both coasts in the sample. Without the need totest such a hypothesis, the sample may not include enough customerson the east and west coasts to allow for comparisons. Of course, aswith all research questions and hypotheses, there should be some de-cision-making relevance in pursuit of an answer to the question ortesting the hypothesis.
2. Questions asked. A second area where hypotheses “work for” re-searchers is in influencing the questions asked of respondents. For ex-ample:
Hypothesis: Customer interest in our product declines when they seewhat it costs.
Research Project Tip
Since the research process from this point on will focus on achieving theresearch objectives (i.e., answering the research questions and testing thehypotheses), the researcher needs to “step back” and objectively look atthese objectives and ask the question: Do I really believe that getting an-swers to these questions (and testing these hypotheses) will provide theinformation needed to make the necessary decisions to solve manage-ment’s problem? Sometimes all the research questions look good indi-vidually, but collectively they just do not provide the information neces-sary to make the decisions. In this case more research questions areneeded.

To test this hypothesis the researcher must find some way to ask ques-tions that determine the role of price in affecting customer interest in theproduct. So, hypotheses that aid the researcher by suggesting variablesto be included in the data collection instrument are “keepers.”
3. Analysis of data. Another use of hypotheses that argues for their inclu-sion is when the hypothesis identifies analytical tasks that must beperformed to test the hypothesis, as shown below:
Hypothesis: Sales declines for this product are not uniform across thecountry.
Here, a test of the hypothesis requires the researcher to examine thesales data on a regional, district, state, or some other appropriate geo-graphical breakout. Absent such a hypothesis, the data might not beexamined in this manner.
Develop Research Design
Once we have established the research questions and hypotheses wemust plan a research design by which we will get answers to our researchquestions and test our hypotheses. While it is important that the researcherbe precise and comprehensive in the development of research questions andhypotheses in order that the research design directly address those researchneeds, the researcher must also be flexible in order to make changes to boththe research questions/hypotheses and the design in the course of conduct-ing the research. This flexibility is important because unanticipated discov-
Research Project Tip
Hypotheses can be very helpful in identifying issues for the research toinvestigate, but are superfluous if they do not “work for you” as the threeexamples illustrate. Include them when their presence results in the re-search being somehow different than it would be if they were not there.
Research Project Assignment
Prepare a short (no more than three single-spaced pages) Statement ofManagement Problem, Research Purpose (include decision alternatives,criteria, timing, and importance), Research Objectives, and Hypothesesbased on your dialogs with the client. Get the client’s reactions, revise asnecessary, and submit to your instructor.

eries during the research may require reformulation of questions/hypothe-ses and the research design followed to address them.
Research designs will involve the use of one or more of three broad cate-gories of research approaches: exploratory, descriptive, and causal. Explor-atory research is usually called for if the management problem is vague orcan be only broadly defined. Research at this stage may involve a variety oftechniques (literature review, focus groups, in-depth interviews, psycho-analytic studies, and case studies) and is characterized by the flexibility al-lowed to researchers in the exploration of relevant issues. Descriptive re-search is conducted when there is a need to measure the frequency withwhich a sampled population behaves, thinks, or is likely to act or to deter-mine the extent to which two variables covary. Research must be highlystructured in descriptive research so that any variation in the variables underinvestigation can be attributed to differences in the respondents rather thanto variations in the questioning, which is acceptable in exploratory research.Causal research is also highly structured, and includes exercise of controlover variables in order to test cause-and-effect relationships between vari-ables. While exploratory research is used to generate hypotheses, both de-scriptive and causal research are used to test hypotheses.
Select Data-Collection Methodology
A research design provides the overall plan indicating how the re-searcher will obtain answers to the research questions and test hypotheses.The researcher must also identify the specific methodology that will be usedto collect the data. These decisions include determining the extent to whichthe questions can be answered using secondary data—data that have alreadybeen collected for other purposes than the research under investigation—ormust be answered by the use of primary data—which are collected explic-itly for the research study at hand. If primary data must be collected, deci-sions must be made with regard to the use of communication and/or obser-vation approaches to generating the data, the degree of structure anddisguise of the research, and how to administer the research—observationby either electronic, mechanical, or human methods; communication in per-son, through the mail, over the phone; or via computer or Internet link.
Determine Data-Analysis Methods
The next research decision area concerns the methods used to analyze thedata. The major criterion used in making this decision is the nature of thedata to be analyzed. The purpose of the analysis is to obtain meaning fromthe raw data that have been collected.
For many researchers the area of data analysis can be the most trouble-some. While some data-analysis techniques do require an understanding of
statistics, it is not true that all research results must be managed by statisticalexperts to be interpretable or useful. However, use of the proper data-analy-sis approach will mean the difference between capitalizing on all the carefulwork done to generate the data versus not being able to discover the answersto research objectives, or worse, drawing erroneous conclusions.
It is important to identify how the information will be analyzed before adata-collection instrument is developed because it is necessary to know howone plans to use the data in getting answers to research objectives before thequestion that generates the data can be asked. For example, if one needs toexamine the differences in attitudes of people aged 13 to 16, 17 to 20, 21 to24, and 25 to 28, one cannot ask about the respondent’s age by using catego-ries less than 18 years, 18 to 25, or 25 and older. Less obvious and more so-phisticated analytical reasons provide additional support for the need to de-termine data-analysis approaches before developing the data-collectioninstrument.
Design Data-Collection Forms
The researcher must determine what is to be measured, in addition to an-swering this difficult question: “How will we measure what we need tomeasure?” For example, if attitudes are to be measured, which techniquewill be used? The method of equal-appearing intervals? The semantic dif-ferential? The Likert technique? In many cases no validated measuringtechniques are available, so the researcher must rely on what has been usedin past studies and on his or her own judgment to decide upon the appropri-ate technique.
It is extremely important that the researcher develop operational defini-tions of the concepts to be measured and that these be stated explicitly. Evenseemingly simple concepts, such as awareness, can be defined in severalways, each having different meaning and relative importance. To know that60 percent of the respondents said they had heard of Kleenex is not the sameas 60 percent saying that Kleenex is what comes to mind when they think offacial tissues. Yet both of these approaches could be considered as measur-ing awareness.
The specific instruments (forms) that will be used to measure the variablesof interest must then be designed. This would involve the design of the obser-vation form or questionnaire. In either case, these forms should coincide withthe decisions made with respect to what should be measured and how.
Define Sampling Methods
The next step in the research is to define the population or universe of thestudy. The research universe includes all of the people, stores, or places thatpossess some characteristic management is interested in measuring. The

universe must be defined for each research project and this defined universebecomes the group from which a sample is drawn. The list of all universe el-ements is sometimes referred to as the sampling frame.
It is extremely important that the sampling frame include all members ofthe population. Failure to meet this requirement can result in bias. If, for ex-ample, the researcher is trying to estimate the average income in a givenarea and intends to use the telephone book as the population listing or sam-pling frame, at least three problems would be encountered. First, not every-one has a telephone and those who do not tend to have low incomes. Sec-ond, there are usually 15 to 20 percent in an area with unlisted numbers.Third, new residents would not be listed. Thus, the difference between thesampling frame (telephone book) and area residents could be substantialand would bias the results.
It is imperative that the population be carefully identified and a samplingtechnique used that minimizes the chance of bias introduced through thesampling frame not containing all elements of the population. Samplingmethods also include determination of techniques and sample size. Twoseparate decisions are called for in this step. The first is how specific sampleelements will be drawn from the population. There are two broad categoriesof sampling techniques: probability and nonprobability. The approach se-lected depends on the nature of the problem and the nature of the populationunder study. For probability designs the objective is to draw a sample that isboth representative and useful. For nonprobability designs the objective isto select a useful sample even though it may not be representative of thepopulation it comes from. These distinctions will be clarified later, but it isimportant to note that the sample design influences the applicability of vari-ous types of statistical analysis—some analysis types are directly dependentupon an assumption about how sample elements are drawn.
Sampling issues are pertinent even when we are dealing with decisionmakers who say “I cannot afford the time or money to do a big survey. I justwant to get a feel for the market opportunity and then I will take mychances.” For example, if in the Compton Company case the decision mak-ers held such an opinion about what competitor policies were with dealers,the researcher is still faced with the need to define the population of interest(all dealers, dealers of a certain volume of business or location, etc.), de-velop a sampling frame (list) of the dealers, and determine how many andwho to talk with in order to get answers to the research questions.
Sample size represents the other side of the decision to be made. Deter-mining how many sample elements are needed to accomplish the researchobjectives requires both analysis and judgment. The techniques for deter-mining sample size are discussed in Chapter 7, including a whole series ofother nonstatistical questions, such as costs, response rate, homogeneity ofsample elements, etc., which must be considered to determine sample size.

In some studies the cost may dictate a lower sample size than would be re-quired given requirements about sampling reliability.
Collect, Analyze and Interpret the Data, and Present the Results
Once the previous steps have been completed and the planning stage ofthe research project has been carried out, the plan is now ready for execu-tion. The execution stages involve collecting the data from the populationsampled in the ways specified, and analyzing the data using the analysistechniques already identified in the research plan. If the research plan orproposal has been well thought out and “debugged” early through revisionsof objectives and research designs, then the implementation steps will flowmuch better.
Once the data are collected and analyzed the researcher must interpretthe results of the findings in terms of the management problem for which thedata were collected. This means determining what the results imply aboutthe solution to the management problem and recommending a course of ac-tion to management. If the purpose of the research project was to determinethe feasibility of introducing a new product and the results of the researchproject show that the product will produce an acceptable level of profits,then the research should recommend introduction of the product unlessthere are known internal or external barriers to entry that cannot be over-come. This means the researcher must move beyond the role of the scientistin objectively collecting and analyzing data. Now the role requires a man-agement consultant in a science that states: Given these facts and this inter-pretation, I recommend this action. This does not, of course, mean that theaction recommended will be followed by management. Since the researcheris usually in a staff capacity, only recommendations for action can be of-fered. Management can accept or reject the recommendations; this is man-agement’s prerogative. However, to be effective in getting results imple-mented, the researcher must assume this role of recommending action. Theresearcher should be involved in the problem definitions and objectives tobe able to recommend courses of action based on interpretation of results.
To some this approach may seem to be overstepping the researcher’s re-sponsibilities to make recommendations. Yet most managers appreciate thisapproach since it at least represents a starting point in deciding what actionshould be taken given certain research results. Remember, information hasnot really served its basic purpose until it is used in decision making.
MARKETING INFORMATION SYSTEMS
Some organizations have moved beyond the stage of thinking of infor-mation needs in terms of projects and have focused attention on creating in-
formation systems that provide a continuous flow of information to users.While such a focus may shift priorities in terms of the amount spent on in-formation for a database and that spent for specific projects, it should bepointed out that even if information is collected on a regular basis as a partof the information system, the principles of good marketing research setforth in this book are still applicable to these information systems. The factthat information is collected on a regular basis does not negate the need forrelating it to the decisions to be made, for using correct sampling tech-niques, etc. The basic principles outlined are applicable to all informationflows; some directly and others indirectly, but nonetheless applicable. There-fore, an understanding of these principles will help ensure better quality ofinformation regardless of the nature of the system or procedures used to pro-vide the information.
SUMMARY
This chapter focused on the purpose, use, and overall approaches to gath-ering information for making marketing decisions. An understanding of thedecision-making process and how information can aid management is thebasis for planning and implementing research projects. Research projects,in turn, should be carried out in such a way that this focus of providing prob-lem-solving information is central to the research process.


Chapter 2
Research Designs for ManagementDecision Making
Research Designs for ManagementDecision Making
As described in our outline of the research process, the next step afterstating the management problem, research purpose, and research hypothe-ses and questions, is to formulate a research design. The starting point forthe research design is, in fact, the research questions and hypotheses wehave so carefully developed. In essence, the research design answers thequestion: How are we going to get answers to these research questions andtest these hypotheses? The research design is a plan of action indicating thespecific steps that are necessary to provide answers to those questions, testthe hypotheses, and thereby achieve the research purpose that helps chooseamong the decision alternatives to solve the management problem or capi-talize on the market opportunity (see Figure 2.1).
TYPES OF RESEARCH DESIGNS
A research design is like a roadmap—you can see where you currentlyare, where you want to be at the completion of your journey, and can deter-mine the best (most efficient and effective) route to take to get to your desti-nation. We may have to take unforeseen detours along the way, but by keep-ing our ultimate objective constantly in mind and using our map we canarrive at our destination. Our research purpose and objectives suggest whichroute (design) might be best to get us where we want to go, but there is morethan one way to “get there from here.” Choice of research design is not likesolving a problem in algebra where there is only one correct answer and aninfinite number of wrong ones. Choice of research design is more like se-lecting a cheesecake recipe—some are better than others but there is no onewhich is universally accepted as “best.” Successfully completing a researchproject consists of making those choices that will fulfill the research pur-

pose and obtain answers to the research questions in an efficient and effec-tive manner.
Choice of design type is not determined by the nature of the strategic de-cision faced by the manager such that we would use research design Awhenever we need to evaluate the extent of a new product opportunity, ordesign B when deciding on which of two advertising programs to run.Rather, choice of research design is influenced by a number of variablessuch as the decision maker’s attitude toward risk, the types of decisions be-ing faced, the size of the research budget, the decision-making time frame,the nature of the research objectives, and other subtle and not-so-subtle fac-tors. Much of the choice, however, will depend upon the fundamental ob-jective implied by the research question:
• To conduct a general exploration of the issue, gain some broad in-sights into the phenomenon, and achieve a better “feel” for the sub-ject under investigation (e.g., What do customers mean by “goodvalue”?).
• To describe a population, event, or phenomenon in a precise mannerwhere we can attach numbers to represent the extent to which some-
FIGURE 2.1. The Relationship Between Research Design and the Solutionto Management’s Problem
Research Design A research design is a plan of action indicating howyou will get answers to . . .
Research Questionsand Hypotheses
the research questions and test the hypotheses,which must be addressed in order to achieve . . .
Research Purpose the research purpose. The research purpose identi-fied . . .
Decisional Criteria the decisional criteria, which are the informationpieces that can aid the decision maker in choosingfrom among . . .
Decisional Alternatives the decision alternatives, which in turn could . . .
Management Problem help solve the management problem or capitalizeon the opportunity that initiated the need for re-search.
thing occurs or determine the degree two or more variables covary(e.g., determine the relationship between age and consumption rate).
• To attribute cause and effect relationships among two or more vari-ables so that we can better understand and predict the outcome of onevariable (e.g., sales) when varying another (e.g., advertising).
These three broadly different objectives give us the names of our threecategories of research designs: exploratory, descriptive, and causal. Beforewe discuss each of these design types a cautionary note is in order. Somemight think that the research design decision suggests a choice among thedesign types. Although there are research situations in which all the re-search questions might be answered by doing only one of these types (e.g., acausal research experiment to determine which of three prices results in thegreatest profits), it is more often the case that the research design might in-volve more than one of these types performed in some sequence. For exam-ple, in the case of the Compton Company described in Chapter 1, if researchhad been conducted, the research objectives might first have required ex-ploratory research to more precisely define the problem, followed by de-scriptive research which could have determined the frequency that distribu-tors recommended a competing brand, or the extent to which purchaseintent covaried by previous experience with the Compton brand. Some re-search questions might have been completely answered using just one of theresearch design types, while others required a sequence of two or all threetypes. The overall research design is intended to indicate exactly how thedifferent design types will be utilized to get answers to the research ques-tions or test the hypothesis.
A further cautionary note is needed to warn the reader that while it mayappear that if sequencing is done the sequence would be exploratory, thendescriptive, then causal, that is not always the case. For example, somecompanies may do an annual survey of consumers to determine the fre-quency with which certain behaviors are performed (e.g., washing dishes byhand) followed by exploratory research that probes to gain an in-depth un-derstanding of the circumstances surrounding that behavior (i.e., descrip-tive then exploratory rather than exploratory then descriptive). It is not hardto imagine a research design that might sequence as exploratory, then de-scriptive, then exploratory again; or causal, then descriptive. It is importantto remember that because a research design is a plan of action to obtain an-swers to the research questions, it is those questions that suggest which de-sign types are necessary and the sequence of conducting those design types,if a sequence is needed. An example later in this chapter will be used to il-lustrate this point. With these cautions in mind we will now discuss the de-sign types in greater detail.

EXPLORATORY RESEARCH
Exploratory research is in some ways akin to detective work—there is asearch for “clues” to reveal what happened or is currently taking place, a va-riety of sources might be used to provide insights and information, and theresearcher/detective “follows where his or her nose leads” in the search forideas, insights, and clarification. Researchers doing exploratory researchmust adopt a very flexible attitude toward collecting information in this typeof research and be constantly asking themselves what lies beneath the sur-face of what they are learning and/or seeing. An insatiable curiosity is avaluable trait for exploratory researchers.
Such curiosity will serve the exploratory researcher well when, for ex-ample, they see the need to ask a follow-up question of a respondent whohas mentioned some unanticipated answer to a researcher’s query. The fol-low-up question is not listed on the researcher’s interview guide, but the cu-rious interviewer instinctively knows that the conversation should begin todeviate from the guide because the unexpected response may be revealingmuch more important issues surrounding the topic for investigation thanwere originally anticipated by the researcher. A willingness to follow one’sinstincts and detour into new territory is not only acceptable in exploratoryresearch, it is commendable! Inspired insight, new ideas, clarifications, andrevelatory observations are all the desired outcomes from exploratory re-search and decision makers should not judge the quality of the idea or in-sight based on its source.
An example of serendipitous exploratory research is the story of the ad-vertising agency for Schlitz beer failing to come up with a new beer sloganafter examining mounds of survey research done on beer drinkers, only tohave one of the agency’s staff overhear a patron at a bar exclaim, when thebartender reported that he could not fill the patron’s order for Schlitz be-cause he was temporally out, “When you’re out of Schlitz, you’re out ofbeer.” A new ad slogan was born! Although we do not want to give the im-pression that any approach is acceptable for doing exploratory research, orthat all methods are of equal value in providing desired information, it is
Research Project Tip
Your choice of a research design goes beyond simply saying whichtype(s) of approaches you will use (exploratory, descriptive, or causal).You must indicate the specific way you will get answers to each researchquestion.

true that exploratory research is characterized by a flexibility of method thatis minimal with descriptive and causal designs.
Exploratory research is needed whenever the decision maker has an ob-jective of:
1. More precisely defining an ambiguous problem or opportunity (e.g.,“Why have sales started to decline?”).
2. Increasing the decision maker’s understanding of an issue (e.g.,“What do consumers mean by saying they want a ‘dry beer’?”).
3. Developing hypotheses that could explain the occurrence of certainphenomena (e.g., “Different ethnic groups seek different levels ofspice in our canned beans.”).
4. Generating ideas (e.g., “What can be done to improve our relation-ships with independent distributors?”).
5. Providing insights (e.g., “What government regulations are likely tobe passed during the next year that will affect us?”).
6. Establishing priorities for future research or determining the practi-cality of conducting some research (e.g., “Should we try to survey allour salespeople on this issue or just talk with the leading salespersonin each region?”).
7. Identifying the variables and levels of variables for descriptive orcausal research (e.g., “We will focus our attention on determining thelevel of consumer interest in these three product concepts because ex-ploratory research shows no interest in the other two.”).
Tools Used to Conduct Exploratory Research
Literature Review
More often than not the proper place to begin a research study is to inves-tigate previous work related to the research issues under study. Exploratoryresearch seeks to generate ideas, insights, and hypotheses, and reading whatothers have done and discovered about the topic in which you are interestedcan save valuable time and resources in the search for those ideas. For ex-ample, if your research objective consists of developing an instrument tomeasure customer’s satisfaction with your product or service, a search ofpreviously published studies measuring customer satisfaction could gener-ate many ideas and insights useful in developing your own instrument. Thismay be done by using one or more of numerous books on the subject cur-rently available, or by doing a search of a library database where key wordssuch as “customer satisfaction” or “customer service” are used to reveal ar-ticles published on the subject during a specific time period (e.g., the previ-

ous three years) or searching the Web for information. Chapter 3 discussessources and uses of secondary data in more depth.
Personal Interviews
One of the best ways to obtain desired insights, hypotheses, clarifica-tions, etc., is to talk with someone whose experience, expertise, or positiongives them unique perspective on the subject of interest. While in somecases such key informants are obvious, such as talking with secretariesabout changes in your word-processing software, sometimes valuable in-sights come from not-so-obvious sources, such as talking with shoeshinepeople about executive footwear or golf caddies about golf equipment. Thekey to achieving your research objective of gaining insight, ideas, etc.,through exploratory personal interviews is to be flexible and think aboutwhat you are hearing. Your objective in conducting the interview is not toget your seven questions asked and answered in the course of the conversa-tion. The questions are the means to the objective of gaining insights; theyare not the objective itself. My objective is to gain insight and I might beable to achieve that objective far better by asking questions related to what Iam hearing than doggedly pursuing my original questions.
Researchers should never confuse the exploratory personal interview withone conducted in descriptive research. Descriptive-research interviewing re-quires a consistency in the questions asked and the way the questions areasked which is not conducive to achieving exploratory objectives. With de-scriptive, we need to eliminate the variance of results due to differences in in-terviewing circumstances so that we can attribute the results to variances inrespondent attitudes and behaviors, hence the need for consistent interview-ing behavior. With exploratory, we are not trying to precisely measure somevariable, we are trying to gain penetrating insights into some important issue.Hence, each of our exploratory interviews may take a different tack as weseek to probe and query each key informant to gain full benefit of their uniqueexperiences.
In the same sense, descriptive-research interviewing may require a prob-ability sample of respondents so that we can compute sampling errors andbe able to make statements such as “We are 95 percent confident that some-where between 77 percent to 81 percent of dealers prefer brand A overbrand B.” Never, however, should exploratory research use a probabilitysample since our entire objective in talking with people is to select thosewho are in a position to shed an unusual amount of light on the topic of inter-est. They are chosen precisely because they are unusual (i.e., in the best posi-tion to shed some light on the subject), not because they hopefully representthe “usual.” Another way of thinking about this is to answer the question“How many people do you need to talk with to get a good idea?” The answer,
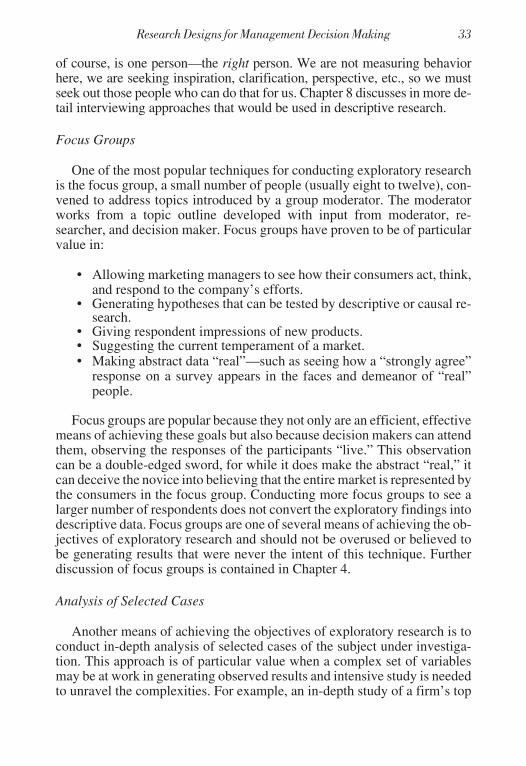
of course, is one person—the right person. We are not measuring behaviorhere, we are seeking inspiration, clarification, perspective, etc., so we mustseek out those people who can do that for us. Chapter 8 discusses in more de-tail interviewing approaches that would be used in descriptive research.
Focus Groups
One of the most popular techniques for conducting exploratory researchis the focus group, a small number of people (usually eight to twelve), con-vened to address topics introduced by a group moderator. The moderatorworks from a topic outline developed with input from moderator, re-searcher, and decision maker. Focus groups have proven to be of particularvalue in:
• Allowing marketing managers to see how their consumers act, think,and respond to the company’s efforts.
• Generating hypotheses that can be tested by descriptive or causal re-search.
• Giving respondent impressions of new products.• Suggesting the current temperament of a market.• Making abstract data “real”—such as seeing how a “strongly agree”
response on a survey appears in the faces and demeanor of “real”people.
Focus groups are popular because they not only are an efficient, effectivemeans of achieving these goals but also because decision makers can attendthem, observing the responses of the participants “live.” This observationcan be a double-edged sword, for while it does make the abstract “real,” itcan deceive the novice into believing that the entire market is represented bythe consumers in the focus group. Conducting more focus groups to see alarger number of respondents does not convert the exploratory findings intodescriptive data. Focus groups are one of several means of achieving the ob-jectives of exploratory research and should not be overused or believed tobe generating results that were never the intent of this technique. Furtherdiscussion of focus groups is contained in Chapter 4.
Analysis of Selected Cases
Another means of achieving the objectives of exploratory research is toconduct in-depth analysis of selected cases of the subject under investiga-tion. This approach is of particular value when a complex set of variablesmay be at work in generating observed results and intensive study is neededto unravel the complexities. For example, an in-depth study of a firm’s top

salespeople and comparison with the worst salespeople, might reveal char-acteristics common to stellar performers. Here again, the exploratory inves-tigator is best served by an active curiosity and willingness to deviate fromthe initial plan when findings suggest new courses of inquiry might provemore productive. It is easy to see how the exploratory research objectives ofgenerating insights and hypotheses would be well served by use of this tech-nique.
Projective Techniques
Researchers might be exploring a topic where respondents are either un-willing or unable to directly answer questions about why they think or act asthey do. Highly sensitive topics involving their private lives are obviouslyin this category, but more mundane behaviors may also hide deep psycho-logical motivations. For example, in a case investigating why some womenpersisted in preferring a messy, expensive spray to kill roaches instead ofusing a more efficient trap that the women acknowledged to have more ben-efits than their sprays, researchers discovered that the women transferredhostilities for the men who had left them to the roaches and wanted to seethe roaches squirm and die. The method used to uncover these hidden mo-tives is one of the so-called projective techniques, named because respon-dents project their deep psychological motivations through a variety ofcommunication and observable methods. These methods typically include:
1. Word association. Respondents are given a series of words and re-spond by saying the first word that comes to mind. The response, thefrequency of the response, and time it takes to make the response arekeys to understanding the underlying motives toward the subject. Ifno response is given, it is interpreted to mean that emotional involve-ment is so high as to block the response.
2. Sentence completion. Similar to word association, sentence comple-tion requires the respondent to enter words or phrases to complete agiven sentence such as: People who use the Discover credit card are___________ . Responses are then analyzed for content.
3. Storytelling. Here respondents are given a cartoon, photograph, draw-ing, or are asked to draw a scene related to the subject under investiga-tion and tell what is happening in the scene. In theory, the respondentwill reveal inner thoughts by using the visual aid as a stimulus to elicitthese deep motivations. Therefore, if the picture is of two people sit-ting and looking at a computer screen in an office, the story that is toldabout the people will reveal how the respondent feels about usingcomputers in a work environment.

4. Third-person technique/role-playing. This technique is a reflection ofwhat Oscar Wilde meant when he said “A man is least himself whenhe talks in his own person; when he is given a mask he will tell thetruth.” Respondents are told to explain why a third person (a co-worker, neighbor, etc.) might act in a certain way. For example, astimulus might appear as: We are trying to better understand what fea-tures people might consider when buying a garden tractor. Pleasethink about people you know and tell us what features would be im-portant to them for such a product. Role-playing requires the respon-dent to play the role of another party in a staged scenario, such as ask-ing a retailer to play the role of a customer coming into a retailestablishment.
5. Collages. This technique involves asking the respondent to cut pic-tures out of magazines and arrange them on poster board to depictsome issue of interest to the researcher. For example, respondentsmight be asked to choose pictures that tell a story of how they decidedto start exercising daily, or to find pictures that convey their image ofthe Compaq computer brand.
6. Music association. Here the researcher plays a variety of music selec-tions and asks the respondent to associate the music with one of thebrands being evaluated. The objective is to determine a brand’s emo-tional content for the respondent (e.g., associating one brand of vodkawith hard rock music and another brand with cool jazz).
7. Anthropomorphicizing. In this approach the respondent is asked to de-scribe what the product or service being researched would look like ifit were a person—age, gender, attractiveness, how would he or she bedressed, what would his or her occupation be, what kind of car wouldhe or she drive, or health status, etc. A variation of this is asking whatfamous person the product or service would be.
As can be seen from the description of these techniques, one must beskilled not only in structuring these approaches, but also must be an experi-enced professional in interpreting the results. Also, their use is often bi-modal—either an organization (such as an advertising agency or marketingconsulting firm) uses them extensively or not at all. They have been shownto provide intriguing new insights into behavior, but are best left to expertsto operate and interpret.
The Value of Exploratory Research
All of these exploratory techniques, when properly applied, can be suc-cessfully used to achieve the research objectives of generating ideas, hy-potheses, clarifying concepts, etc. Quite often in a multistaged research proj-

ect, one might start with exploratory research, then use the results to helpstructure a descriptive research questionnaire or a causal research experi-ment. While that is frequently the case, exploratory results do not havevalue only as preliminary work before the “real” research takes place. De-pending on the research purpose or attitude of the decision maker towardrisk, exploratory research may be the only research that is done. For exam-ple, if in-depth interviews with twenty selected purchasing agents generateonly ridicule of a new product idea, it is not necessary to conduct a struc-tured survey of 500 to kill the idea. However, if you want to ultimately pro-duce an ad that says your paintbrush is preferred two to one over a majorcompetitor’s by professional painters, exploratory research will not be suf-ficient to support your claims. If a decision maker is a high risk taker, ex-ploratory research may be all that is desired before a decision can bereached. If the stakes increase, however, that same decision maker maywant to follow up the exploratory research with more structured and quanti-fiable descriptive or causal research.
The point we are trying to make here is that well-conducted exploratoryresearch can be extremely valuable in achieving the objectives endemic tothat type of research, apart from its contributing to later phases of the re-search study. The fact that it does not generate precise quantifiable data isnot a “weakness” of the approach. When properly conducted and inter-preted it can serve as a powerful aid to decision making, depending upon thedecisions being faced and the decision-making style of the manager.
To know whether exploratory research is alone sufficient or should befollowed by descriptive or causal research, the researcher should examinethe research questions, the decisional criteria, the time available to do the re-search, and the research budget. An example might help to illustrate the in-terplay of these factors in determining whether exploratory research shouldbe followed by quantitative research.
In the case of the Compton Company described in Chapter 1, the manag-ers decided, incorrectly as it turned out, to get a new advertising agency in-stead of doing research to discover the cause of their declining market share.If they learned a lesson from this experience and next time decide to do re-search before making a decision, their preferred decision-making stylemight be to rely on exploratory approaches rather than a full-scale quantita-tive study.
So, a research question such as: “Are our dealer policies competitive?”might with some decision makers involve doing exploratory research tofirst clarify concepts, formulate the issue more precisely, gain valuable in-sights into dealer relations, etc., then descriptive research to discover thefrequency with which dealers rate your company’s policies as fair, motivat-ing, understandable, etc., compared to your competitors. The ComptonCompany managers, however, may merely want you to have in-depth con-

versations with a few key dealers (i.e., their decision criteria), report the re-sults of your conversations, and then they are ready to make their decision.Whether the research would be staged as exploratory followed by descrip-tive, or exploratory only would therefore depend upon how the decisionmakers (with the help of the researchers, see Chapter 1) defined the decisionalternatives and criteria that would be used to choose among the alterna-tives, the time available for the research, and the research budget.
In some cases the research question itself suggests descriptive researchwill be needed to follow up exploratory findings. If, in collaboration withthe decision maker, the researcher writes the research question as: “Whatpercentage of dealers rate our company as having the best customer ser-vice?”, then it will be necessary to follow the exploratory research with de-scriptive research. Here the exploratory clarifies terms such as “best” and“customer service” and identifies what areas of customer service are mostimportant to dealers, and the descriptive determines the percentage of deal-ers rating the company’s and its competitors’ customer service along thoseimportant dimensions. It is descriptive, not exploratory, that provides quan-tification of responses.
DESCRIPTIVE RESEARCH
As the name implies, descriptive research seeks to describe something.More specifically, descriptive research is conducted when seeking to ac-complish the following objectives:
1. Describe the characteristics of relevant groups such as the 20 percentof our customers who generate 80 percent of our business. Having a
Research Project Tip
If your research questions require some exploratory research to gain in-sights, ideas, generate hypotheses, etc., either to answer the questions en-tirely, or before you can go on to descriptive or causal research, you shouldindicate in detail how that exploratory research is to be conducted. For ex-ample, indicate not only that a literature search is to be conducted to helpanswer research question #3, but also describe what literature is to be re-viewed. Wherever possible include a photocopy of a page or two of thedocument being reviewed. For personal interviews, profile the specifictypes of people you plan to interview and list the topics you plan to coverin the interview. Link each research objective with the exploratory tech-niques you plan to use to answer the question, along with a detailed discus-sion of exactly what the use of that technique will involve.

description of our “heavy users” can define a target for our future mar-keting efforts intended to find more prospects similar to our best cus-tomers.
2. Determine the extent to which two or more variables covary. For ex-ample, does consumption rate vary by age of consumer?
3. Estimate the proportion of a population who act or think a certain way.For example, how often do childless couples eat at restaurants in atypical month?
4. Make specific predictions. For example, we might want to forecast thenumber of wholesalers who will be converting to a new inventorytracking software system in the next year.
Descriptive research is highly structured and rigid in its approach to datacollection compared to exploratory research’s unstructured and flexible ap-proach. As such, descriptive research presupposes much prior knowledgeon the part of the researcher regarding who will be targeted as a respondent,what issues are of highest priority to be addressed in the study, how thequestions are to be phrased to reflect the vocabulary and experience of therespondents, when to ask the questions, where to find the respondents, andwhy these particular questions need to be answered in order to make deci-sions. Thus, exploratory research may often be needed to allow descriptiveresearch requirements to be met.
While exploratory research may generate a hypothesis (e.g., Hispanicsoffer a more attractive market for our product than do Asians), it is descrip-tive research (or causal) that provides for a test of the hypothesis. Explor-atory research may be needed to answer the who, what, when, where, why,and how of doing descriptive research (e.g., who should be the respondentsof the survey), while descriptive research answers these same questionsabout the market (e.g., who are the high consumers of our product).Whereas exploratory research suggests, descriptive quantifies.
Finding answers to these who, what, when, where, why, and how ques-tions in descriptive research demands disciplined thinking on the part of theresearcher. This is illustrated by the following example:
Suppose a chain of food convenience stores was planning to open anew outlet and wanted to determine how people begin patronizingsuch a store. Imagine some of the questions that would need to be an-swered before data collection for this descriptive study could begin.
• Who is to be considered a “patron”? Anyone who enters the store?Even those who participate in only the grand-opening prize give-away? Someone who purchases anything from the store?
• Should patrons be defined on the basis of the family unit or as indi-viduals?
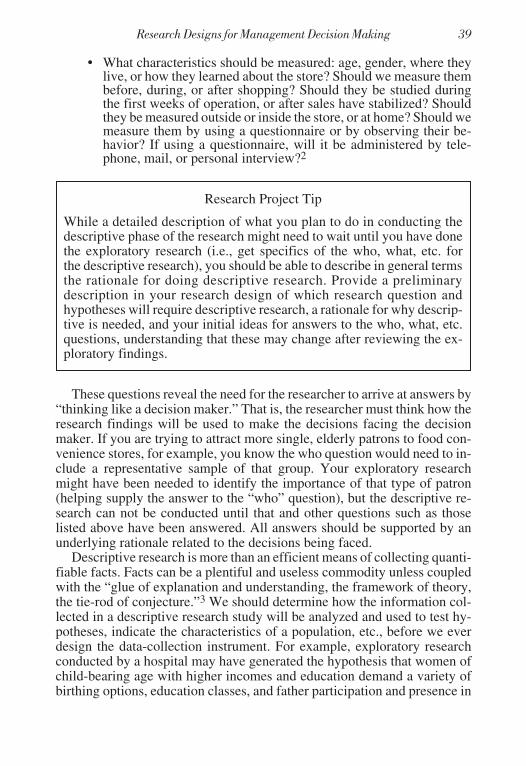
• What characteristics should be measured: age, gender, where theylive, or how they learned about the store? Should we measure thembefore, during, or after shopping? Should they be studied duringthe first weeks of operation, or after sales have stabilized? Shouldthey be measured outside or inside the store, or at home? Should wemeasure them by using a questionnaire or by observing their be-havior? If using a questionnaire, will it be administered by tele-phone, mail, or personal interview?2
These questions reveal the need for the researcher to arrive at answers by“thinking like a decision maker.” That is, the researcher must think how theresearch findings will be used to make the decisions facing the decisionmaker. If you are trying to attract more single, elderly patrons to food con-venience stores, for example, you know the who question would need to in-clude a representative sample of that group. Your exploratory researchmight have been needed to identify the importance of that type of patron(helping supply the answer to the “who” question), but the descriptive re-search can not be conducted until that and other questions such as thoselisted above have been answered. All answers should be supported by anunderlying rationale related to the decisions being faced.
Descriptive research is more than an efficient means of collecting quanti-fiable facts. Facts can be a plentiful and useless commodity unless coupledwith the “glue of explanation and understanding, the framework of theory,the tie-rod of conjecture.”3 We should determine how the information col-lected in a descriptive research study will be analyzed and used to test hy-potheses, indicate the characteristics of a population, etc., before we everdesign the data-collection instrument. For example, exploratory researchconducted by a hospital may have generated the hypothesis that women ofchild-bearing age with higher incomes and education demand a variety ofbirthing options, education classes, and father participation and presence in
Research Project Tip
While a detailed description of what you plan to do in conducting thedescriptive phase of the research might need to wait until you have donethe exploratory research (i.e., get specifics of the who, what, etc. forthe descriptive research), you should be able to describe in general termsthe rationale for doing descriptive research. Provide a preliminarydescription in your research design of which research question andhypotheses will require descriptive research, a rationale for why descrip-tive is needed, and your initial ideas for answers to the who, what, etc.questions, understanding that these may change after reviewing the ex-ploratory findings.

the delivery room, including during a cesarean section. Secondary data mayreveal that the hospital is located in an area of high concentration of womenof above average income and education, and that pregnancy rates are aver-age for the area. Descriptive research may seek to test the hypotheses thatthese women:
• Do demand and expect their hospital to provide an obstetrics pro-gram with those characteristics.
• Are not presently satisfied with the options available from other hos-pitals.
• Are looking for and would be attracted to a hospital that did offer anobstetrics program that satisfied their wants and needs.
Here, the exploratory research generated, but could not test, the hypothe-ses, and the descriptive research generated facts in a form that provided themeans of testing the hypotheses. It is important to note that researcherswould have determined how the hypotheses would be tested before they de-signed questions in the questionnaire to generate the desired facts. That is,they would have set up dummy tables or chosen the multivariate statisticaltechniques to be used to test the hypotheses, then determined how datawould be collected to allow for the use of these procedures for hypothesestesting. For example, sample dummy tables can be seen in Figure 2.2.
By setting up this table before we even design the questionnaire or deter-mine the number and type of respondents to survey, we have in effecthelped specify the parameters for those parts of the research design. One hy-pothesis is that we should see the percentages on the top row of these tablesget larger as we move to higher incomes (e.g., higher-income expectantmothers put more emphasis on such services in choosing a hospital than dolower-income expectant mothers). Other dummy tables would be devel-oped to show how other hypotheses would be tested. This table was devel-oped because researchers were intent on testing the hypotheses arising outof the exploratory research, and will be used once completed to influencedecisions about service design, promotion, and other aspects of the market-ing program. Design of such a table also permits researchers to develop adata-collection instrument such as a questionnaire that can provide the datain a form that permit the hypotheses to be tested. While sounding somewhatconvoluted, it is true that we determine how the data will be analyzed beforewe develop the questions that provided the data. Remember, “No problem isdefinitely formulated until the researcher can specify how [he or she] willmake [his or her] analysis and how the results will contribute to a practicalsolution.”4 The basic types of descriptive research studies used to providesuch data are cross-sectional and longitudinal studies.

FIGURE 2.2. Sample Dummy Tables for Hypothesis Testing
SiblingEducationClasses
Household Income Per Year
$25,000 $25,001 - $40,000 $40,001 - $55,000 > $55,000
High
Medium
Low
Father Presentin Delivery Room
Household Income Per Year
$25,000 $25,001 - $40,000 $40,001 - $55,000 > $55,000
High
Medium
Low
Nurse Midwife
Household Income Per Year
$25,000 $25,001 - $40,000 $40,001 - $55,000 > $55,000
High
Medium
Low
PhysicianReferral Service
Household Income Per Year
$25,000 $25,001 - $40,000 $40,001 - $55,000 > $55,000
High
Medium
Low
Cross-Sectional Designs
The best known and most frequently used descriptive design, cross-sectional analysis, involves a sampling of a population of interest at onepoint in time. This technique is sometimes referred to as a sample survey,because it often involves a probability sampling plan intended to choose re-spondents who will be representative of a certain population. As with all de-scriptive research, sample surveys are characterized by a high degree ofstructure—in both the data-collection instrument and in the data-collectionprocess itself. The only way we can be sure we are measuring frequency or
Impo
rtanc
eof
Serv
ice
Prog
ram
Feat
ure
inD
eter
min
ing
Hos
pita
lCho
ice

variation in the phenomenon under investigation is to build a high degree ofstructure into the instrument and process. That structure was not only notneeded in exploratory research, it would have been a deterrent to achievingour objectives of insight, ideas, hypotheses, clarification, etc. Chapter 4 willdiscuss how to conduct sample surveys via questionnaires or observation inorder to achieve the goals of a descriptive research study.
Cross-sectional surveys do not always have to involve selection of a one-time sample of respondents from the population. Several firms such asThe Home Testing Institute, Market Facts, and National Family Opinion(NFO) operate omnibus panels that consist of hundreds of thousands ofU.S. households that have been selected to proportionately represent theU.S. population along key dimensions such as age, income, sex, ethniccomposition, and geographic dispersion. Members of such households arerecruited to serve on the panel and agree to participate in answering ques-tionnaires or trying products when requested to do so by the company main-taining the panel. Using such a panel allows an organization to select certaindemographic characteristics for respondents (e.g., single males under thirty-five years of age) and send a questionnaire to them, knowing that the cost offinding and getting a response from a targeted number of this group (e.g.,1,000 completed questionnaires) is much less than trying to complete such aproject in the general population where response rates may be as low as 1 or2 percent.
These panels are particularly cost-effective when research is being con-ducted on a topic where the incidence rate in the population is very low(e.g., vegetarians, people with three-car garages, people with fax machinesin their homes, etc.). In such cases it is possible to buy a few screening ques-tions on the monthly questionnaire sent to, say, 50,000 panel members toidentify those members who fit the desired profile, then send only thosequalified panelists a longer questionnaire to obtain the detailed informationbeing sought. Firms maintaining such omnibus panels turn over member-ship frequently to avoid participating households becoming “professionalrespondents,” which would reduce the respondents’ representativeness forthe general population.
Some organizations recruit and maintain their own panels. For example,Parker Pen maintains a panel of people who use writing pens frequently. Suchcorporate panels are useful when the company wants to assess targeted con-sumers’ attitudes on a scheduled basis, try out potential new products in an in-home setting before making a go, no-go decision, or seek information onawareness and knowledge of competitive promotions. These panels are usedmore than once over time, similar to the longitudinal panels discussed below,but since the subject of the research changes constantly it is best to think ofthese panels as company-run omnibus cross-sectional survey research panels.

Longitudinal Studies
Whereas cross-sectional studies are like taking snapshots of a target pop-ulation at a point in time, longitudinal studies are similar to filming video-tapes of the respondents. The primary objective of longitudinal research isto monitor behavior over time and thereby identify behavioral (or attitudi-nal) changes. Sometimes referred to as true panels, these longitudinal pan-els report the same information (e.g., grocery store purchases, or purchasesand use of a particular product or service) at specific points in time. This in-formation can be combined with other pertinent information to determine,for example, if brand switching occurred after exposure to a trial sample,coupon, or advertisement.
One of the best-known panels for consumer goods is Information Re-source’s BehaviorScan, which continuously tracks 21,000 households inseven markets by having panel members use a specially coded card thattracks optically scanned purchases by household members at selected gro-cery stores. BehaviorScan can be used for test-marketing purposes by split-ting the panel into two or more matched groups based on household demo-graphics, and then sending different promotional appeals to the groups viadirect mail, newspaper ads, or even TV. Changes in purchasing patterns canbe measured after the promotional appeal is made. A.C. Nielsen Companyoffers a similar service, where 40,000 households use hand-held scanners intheir homes to track purchases.
The ability to use longitudinal panels for tracking changes in purchasebehavior and brand loyalty has advantages over the use of cross-sectionalsurveys. For example, consider Table 2.1 and information taken from twocross-sectional sample surveys.
It appears that no brand switching occurred between the two surveystaken in time periods 1 and 2. A longitudinal analysis, however, might re-veal a very different story, as shown in Table 2.2.
Table 2.2 shows that in fact there was considerable brand-switching be-havior, and that brand C enjoyed the greatest brand loyalty, brand A the
TABLE 2.1. Two Cross-Sectional Sample Surveys
Number of Consumers Buying
Period 1 Period 2Brand A 100 100Brand B 150 150Brand C 250 250Total 500 500

least. Longitudinal panels also have an advantage over sample surveys inthat panel members record purchases immediately and therefore generateaccurate purchase data, whereas cross-sectional surveyors often must relyon respondents’ memories for reporting purchases. However, cross-sectional studies may often be more representative of the target population,due to the difficulties of recruiting and maintaining a representative samplein a panel design.
CAUSAL RESEARCH
While descriptive research is effective in identifying covariation be-tween variables (e.g., blue packages outsell red ones, consumption rate var-ies by education level) it cannot truly indicate causality (e.g., color causessales, education causes consumption). When we are in need of determiningif two or more variables are causally related we must turn to causal-researchprocedures. While there might be a tendency to see many research objec-tives from a causal perspective (“We really want to know what causes con-sumers to act that way”), there is a difference between causality in the ver-nacular and how it is defined by scientists. Quite often decision makers donot need to test for a causal relationship in order to make good decisions. Imight need to know only that blue packages outsell red ones or that con-sumption of my product increases with educational level in order to makeappropriate marketing decisions. Testing for causality is a risky, expensive,time-consuming proposition and may not in the end permit better decisionsthan those made by simply acknowledging the covariation that descriptiveresearch identified.
However, in some cases a test of our hypothesis requires causal research(e.g., greater sales will result from having four shelf offerings of our productin stores under 60,000 square feet than having two facings in stores over80,000 square feet). Remember that we stated that descriptive research ischaracterized by its more structured approach as compared to exploratory?Causal research is also highly structured, but is characterized also by the use
TABLE 2.2. Longitudinal Panel
Brand Purchasedin Period 1
Brand Purchased in Period 2Brand A Brand B Brand C Total
Brand A 50 20 30 100Brand B 20 80 50 150Brand C 30 50 170 250Total 100 150 250

of control procedures used during the experimental designs associated withtests of causal relationships.
Our interest in causal research is to determine the degree to which onevariable is causally related to another (e.g., Does ad “A” cause people to re-member its message better than ad “B”? Does a 10 percent decrease in pricecause an increase in profit compared to no price change?). Obviously, in allsuch cases we are concerned with truly determining the impact of our inde-pendent variable (ads A and B, or price in the examples above) on our de-pendent variable (ad recall or profit in the examples), and not some extrane-ous variable that “leaks” into our test (e.g., a competitor’s actions, anenvironmental event). Therefore, when we conduct a causal experiment wedo three things:
1. Manipulation: We manipulate the causal or independent variablesuch as ad message or price.
2. Measure: We measure the effect or dependent variable such as ad re-call or profit.
3. Control: We control other variables which could have an impact onour dependent variable, such as making sure that our product withprice P1 in store S1 is found on the same shelf level as that productwith price P2 in store S2.
In addition to manipulation, measurement, and control, we should alsothink of causal research as requiring three types of evidence: concomitantvariation, time order of occurrence, and elimination of other possible causalfactors.
Concomitant Variation. Cause and effect must vary together in somepredictable manner. They may vary in a positive (i.e., the cause and effectboth increase or decrease together) or inverse relationship (i.e., one in-creases while the other decreases). Statistical tests indicate the degree of theconcomitant variation, such as chi-square tests, correlation, regression, oranalysis of variance. Concomitant variation, when we are dealing with theactions of people as with marketing research, is a matter of degree and is notabsolute or perfect in the correlation of movement between cause and ef-fect. Scientists infer cause and effect relationships if the presence of thecause makes the occurrence of the effect more likely from a statistically sig-nificant standpoint. However, no matter how strong that relationship, mereconcomitant variation alone is insufficient to infer a causal relationship. Wemust see the next two pieces of evidence present.
Time Order of Occurrence. To demonstrate that X causes Y, we must beable to consistently see that X occurs first before we see Y, and not viceversa.

Elimination of Other Possible Causal Factors. Conducting experimentsunder actual market conditions (“in the field”) makes it difficult to controlfor other possible factors that could influence the effect variable. For exam-ple, if we are trying to determine how the amount of shelf space influencesthe sales for a particular brand of cereal, we realize that other variables suchas price, advertising, sales promotion and environmental events (e.g., goodor bad publicity about the product), not to mention the activities of our com-petition could also influence sales. So when we say we must design an ex-periment that involves manipulation, measurement, and control, what weare saying is that we must find ways of holding all other possible causal fac-tors “constant” while manipulating the causal factor(s) under investigation.Otherwise, when we measure our effect variable we will not know if the ob-served change was due to our manipulated variable, shelf space, or someother variable, such as competitor pricing.
When we cannot exercise physical control (i.e., putting the products onthe same level of store shelf ), we can in effect still have control over the ex-periment by measuring the nonphysically controlled variable. For example,we cannot control our competitor’s pricing in our test markets, but if we canmeasure the competitor’s price, we can use our statistical analysis proce-dure to control for differences in competitive pricing by “making all elseequal” and just measuring the effect of our price change on our sales. Howthis is done is beyond the scope of this discussion, but researchers should beaware that control can be exerted through both “physical” means as well asvia measurement. The key in both cases is to anticipate what variables, otherthan the ones being manipulated, could have an effect on the dependentvariable and then exercise control in some form over those variables.
As previously mentioned, causal research is often conducted through theuse of controlled experiments to allow for testing of cause and effect. Wewill now discuss experimentation in marketing research.
EXPERIMENTATION
What Is Experimentation?
Experimental designs differ from other research designs in the degree ofcontrol exerted by the researcher over the conditions under which data arecollected. When observational or survey designs are employed, the re-searcher measures the variables of interest but does not attempt to manipu-late or control the variables. However, in experimental (causal) designs, re-searchers are exercising control over the variables of interest.
For example, a retailer trying to isolate the influence of price changes onthe sales volume of a product, must identify the nonprice variables such aslocation of the product in the store, time period of the day/week, promotion,

etc., and control these variables because they also influence sales volume.Simply altering price and measuring sales is not an adequate design becauseof the impact of nonprice variables on sales.
Essentially, the key differences in experimentation and other designs are:
1. In an experiment, one or more of the independent variables are delib-erately manipulated while others are controlled.
2. Combinations of conditions (particular values of the independentvariables, e.g., different prices) are assigned to sample elements(e.g., different stores) on a random basis. This reduces the likelihoodof preexisting conditions affecting the results.
The Terminology of Experimentation
There are several terms that are used to describe the concepts involved inan experiment. Knowledge of these terms is essential to understanding ex-perimental designs.
Experimental Treatments
The term “treatment” is used to describe a specific manner of manipulat-ing an independent variable. For example, if an experiment was designed tomeasure the influence of three different levels of advertising on sales, theneach level of advertising would be a different treatment. If the effects of thethree levels of advertising were combined with two levels of price, thenthere would be six experimental treatments as shown in the following:
Price level one withAdvertising level oneAdvertising level twoAdvertising level three
Price level two withAdvertising level oneAdvertising level twoAdvertising level three
Since price level one with advertising level one represents a specifiedcombination of independent variables, it is referred to as an experimentaltreatment. Each combination of price and advertising levels creates anotherexperimental treatment. Therefore, this example consists of six differenttreatments.

Experimental Units
Experimental units are the geographic areas, stores, or people whose re-sponses are measured in determining the effect of the different treatments.If the price and advertising levels described earlier are used in different geo-graphical areas, then the areas represent experimental units. Each group ofexperimental units is a sample of all possible units and is used for compar-ing the impact of the treatments. Continuing the example, each of the sixtreatments may be assigned to 40 different geographic locations for a totalof 240 units. If we took a measure of sales before and after each treatment ineach location we would have a total of 480 (i.e., 240 × 2) “observations.”
Experimental Designs
The experimental design is the specific process used to arrange inde-pendent variables into treatments and then assign treatments to units. Thereare many possible designs and great care should be exercised in choosingand/or modifying the design. Choosing the best design is the most importantaspect of experimentation. Several designs will be discussed in a later sec-tion, but it should be noted that researchers unfamiliar with experimentationshould seek advice in setting up an experiment.
Control Group
In many experiments the use of a control group is a necessary element ofthe design. A control group is randomly selected just like other groups ofunits in the experiment. However, the control group does not receive a treat-ment and thus serves as a benchmark for comparing the effects of treat-ments. If an experiment was used to determine the impact of two new levelsof price on sales, prices held at the previous level in some areas would en-able these areas to serve as controls in analyzing the results.
Validity and Experimentation
While there are a number of different types of validity, the two major va-rieties are considered here: internal validity and external validity. Internalvalidity has to do with whether the independent variables that were manipu-lated caused the changes in the dependent variable or whether other factorsinvolved also influenced the dependent variable. There are many threats tointernal validity. Some of the major ones are:
1. History. During the time that an experiment is taking place, someevents may occur that affect the relationship being studied. For exam-

ple, economic conditions may change, new products may be intro-duced, or other factors may change that alter the results.
2. Maturation. Changes may also take place within the subject that are afunction of the passage of time and are not specific to any particularevent. These are of special concern when the study covers a long pe-riod of time, but may also be a factor in tests that are as short as anhour or two. For example, a subject can become hungry, bored, ortired in a short time and this can affect response results.
3. Testing. When pretreatment and posttreatment measures are used, theprocess of taking a test can affect the scores of a second measurement.The experience of participation in the first measurement can have alearning effect that influences the results on the second measurement.
4. Instrumentation. This threat to internal validity comes from changesin measuring instruments or observers. Using different questions ordifferent observers or interviewers is a validity threat.
5. Selection. One of the more important threats to internal validity is thedifferential selection of subjects to be included in experimental andcontrol groups. The concern is over initial differences that exist be-tween subjects. If subjects are randomly assigned to experimental andcontrol groups, this problem can be overcome.
6. Statistical regression. This potential loss of validity is of special con-cern when subjects have been selected on the basis of their extremescores. For example, if the most productive and least productive sales-people are included in an experiment, there is a tendency for the aver-age of the high scores to decline and the low scores to increase.
7. Mortality. Mortality occurs when the composition of the study groupschanges during the experiment. Subjects dropping out of an experi-ment, for example, causes the makeup of the group to change.
While internal validity concerns whether experimental or nonexperi-mental factors caused the observed differences, external validity is con-cerned with whether the results are generalizable to other subjects, stores, orareas. The major threats to external validity are:
1. Subject selection. The process by which test subjects are selected foran experiment may be a threat to external validity. The populationfrom which subjects are selected may not be the same as the targetmarket. For example, if college students were used as subjects, gener-alizing to other types of consumers may not be appropriate.
2. Other factors. The experimental settings themselves may have an ef-fect on a subject’s response. Artificial settings, for example, can giveresults that are not representative of actual market situations. If the

subjects know they are participating in a price experiment, they maybe more sensitive to price than normal.
Field versus Laboratory Experiments
There are two types of settings in which experiments are conducted—field and laboratory. Field experiments result in an experimental settingwhich is more realistic in terms of modeling actual conditions and is there-fore higher on external validity. Field experiments are carried out in a natu-ral setting with a minimum of artificial elements in the experiment. Thedownside of field experiments is that they usually cost more, have lower in-ternal validity due to lack of control over variables that influence the de-pendent variable, and also may alert competition to changes a company iscontemplating in marketing their products.
Laboratory experiments are experiments conducted under artificial con-ditions, such as testing television ads in a movie theater rather than in buyers’homes. Such experiments usually are lower in costs, have higher internalvalidity due to more control of the experimental environment, and providegreater secrecy of potential marketing actions. It is also possible to use moreelaborate measurement techniques in a laboratory setting than in field ex-periments.
Disadvantages of laboratory experiments include loss of realism andlower external validity. These are due to the artificial conditions used in theexperiment. For example, an experiment where people are given playmoney and asked to shop in a laboratory setting may reveal a great dealabout some aspects of consumer behavior but there would be great diffi-culty in trying to generalize the findings to the purchase environment en-countered in the marketplace.
The type of information to be generated from the experiment and its in-tended use dictate which type of experimental setting is more appropriate ina given situation. It is even possible to use both—a laboratory experimentfollowed by a field experiment—to validate the findings of the laboratorystudy under actual market conditions.
Experimental Design Symbols
Certain symbols have been developed to help describe experimental de-signs. These symbols have been used because they help in understandingthe designs. These symbols include:
• X = exposure of a group of subjects to an experimental treatment or alevel of an independent variable (e.g., to a particular ad or productprice, etc.). If different levels are used, then such as X1, X2, X3, . . .,Xn are used.

• O = observation or measurement of the dependent variable in whichthe researcher is interested.
• R = random assignment of people to groups or groups to treatments.
Other notions are also helpful. The left-to-right notation indicates thetime sequence of occurrence of events. Thus the notation
RO1XO2
would mean that subjects were randomly assigned to this group (R); a be-fore measure (O1) was taken; the subjects were then exposed to the treat-ment (X); and then an after measure (O2) was taken.
All the notations on a single line refer to a single group of respondents,and notations that appear together vertically identify events that occurred atthe same point in time. Thus,
O1X1O2X1O3
refers to two groups of subjects, one of which received a pretest measureand a posttest measure (O1 and O2), whereas the other received only aposttest measure (O3). Both groups were exposed to the same treatment(X1) and that the treatment and posttest measures occurred at the same timefor both groups.
Ethics and Experimentation
Over the past few years, there has been increasing concern for protectingthe rights of subjects used in research projects. This is a potential problem inall studies involving human subjects. The researcher should give carefulconsideration to the potential negative effects on those participating in anexperiment to avoid violating the subjects’ rights and deflect potential law-suits. Luckily, most marketing research experiments are not likely to in-volve negative effects, but the possibility of such effects should be carefullyevaluated.5
Experimental Research Designs
There are many possible experimental designs to choose from and theyvary widely in terms of both complexity and effectiveness. The most widelyaccepted classifications of designs are: (1) preexperiments, (2) true experi-ments, and (3) quasi experiments. While complete coverage of experimen-tal designs is beyond the scope of this book, a brief explanation and exam-ples of these follows:

Preexperimental Designs
Preexperimental designs are designs that are weak in terms of their abil-ity to control the various threats to internal validity. This is especially truewith the one-shot case study.
One-Shot Case Study. This design may be noted as:
X1O1
An example of such a study would be to conduct a sales training programwithout a measure of the salespeople’s knowledge before participation inthe training program. Results would reveal only how much they know afterthe program but not how effective the program was in increasing knowl-edge.
One-Group Pretest-Posttest. This design can be represented as:
O1X1O2
It is an improvement on the one-shot case study because of the additionof the pretest measurement, but it is still a weak design in that it fails to con-trol for history, maturation, and other internal validity problems.
Static-Group Comparison. This design provides for two study groups,one of which receives the experimental treatment while the other serves as acontrol. The design is:
X1O1O2
The addition of a control group makes this design better than the previ-ous two designs. However, there is no way to ensure that the two groupswere not different before the introduction of the treatment.
True Experimental Designs
The major deficiency of the previous designs is that they fail to providegroups that are comparable. The way to achieve comparability is throughthe random assignment of subjects to groups and treatments to groups. Thisdeficit is overcome in the following true experimental designs.
Pretest-Posttest Control Group. This design is represented as:
RO1X1O2RO3 O4

In this design, most internal validity problems are minimized. However,there are still some difficulties. For example, history may occur in onegroup and not the other. Also, if communication exists between the groups,the effect of the treatment can be altered.
Posttest-Only Control Group. Pretest measurements are not used in thisdesign. Pretest measurements are well-established in experimental researchdesign but are not really necessary when random assignment to groups ispossible. The design is represented as:
RX1O1R O2
The simplicity of this design makes it more attractive than the pretest-posttest control group design. Internal validity threats from history, matura-tion, selection, and statistical regression are adequately controlled by ran-dom assignment. This design also eliminates some external validity prob-lems as well. How does this design accomplish such notable achievements?We can think of the O1 observation as a combination of the treatment effect(e.g., a change in price, or the advertising campaign we ran, or a change inpackage design, etc.), plus the effect of all the extraneous variables (i.e., his-tory, maturation, testing effect, instrumentation, selection, statistical regres-sion, and mortality). However, since O2 will theoretically be subject to allthe same extraneous variables, the only difference between what we ob-serve between O1 and O2 (e.g., a measure of sales at two stores) will be thefact that O1 (e.g., sales at store #1) was measured after the treatment X1(e.g., where prices were lowered), and O2 (e.g., sales at store #2) did not re-ceive the treatment. Therefore, all the other extraneous variable effects“wash” or cancel out between the two observations, so any difference in theobservations must be due to the treatment. These results are dependent,however, on the random assignment of multiple units (stores in this exam-ple) to either the test or control conditions. Sample sizes for each of the testand control conditions must be large enough to approach a “normal distribu-tion” of stores so that we can assume that the only difference that we see be-tween O1 and O2 is the result of the treatment, and not due to some extrane-ous variable differences between the test and control stores.
Quasi Experiments
Under actual field conditions, one often cannot control enough of thevariables to use a true experiment design. Under such conditions, quasi ex-periments can be used. In a quasi experiment, comparable experimental andcontrol groups cannot be established through random assignment. Often theresearcher cannot even determine when or to whom to expose the experi-

mental variable. Usually, however, it is possible to determine when andwhom to measure. The loss of control over treatment manipulation (the“when” of the experimental variable exposure) and the test unit assignment(the “who” of the experimental variable exposure) greatly increases thechance of obtaining confounded results. Therefore, we have to build intoour design the ability to account for the possible effects of variables outsideour control in the field, so that we can more safely conclude whether thetreatment was, in fact, the thing that caused the results we observed.
A quasi experiment is not as effective as a true experiment design, but isusually superior to available nonexperimental approaches. Only two quasi-experimental designs will be discussed here.
Nonequivalent Control Group. This is one of the most widely used quasi-experimental designs. It differs from true experimental design because thegroups are not randomly assigned. This design can be represented as follows:
O1X1O2O3 O4
Pretest results are one indicator of the degree of comparability betweentest and control groups. If the pretest results are significantly different, thereis reason to doubt the groups’ comparability. Obviously, the more alike theO1 and O3 measures are, the more useful the control group is in indicatingthe difference the treatment has made (i.e., comparing the difference in theO2 to O1 with the difference between O4 to O3). Close similarity allows forcontrol over the extraneous variables of history, maturation, testing, instru-mentation, selection, and mortality. However, statistical regression can be aproblem if either the test or control group has been selected on the basis ofextreme scores. In such a case, the O2 or O4 measures could be more the re-sult of simply regressing back from the extreme to the average score, ratherthan the result of anything that intervened between the first and second ob-servation of either group.
Separate Sample Pretest-Posttest. This design is most applicable inthose situations where we cannot control when and to whom to introducethe treatment but can control when and whom to measure. The design is:
R O1R X1O2
This design is more appropriate when the population is large and there isno way to restrict who receives the treatment. For example, suppose a com-pany launches an internal marketing campaign to change its employees’ at-titudes toward customers. Two random samples of employees may be se-lected, one of which is interviewed regarding attitudes prior to the campaign.After the campaign the other group is interviewed.

Limitations of Causal Research
It is natural for managers to be attracted to the results that can be gainedfrom doing experimentation. After all, are we not often looking to knowwhat really causes the effects we see such as satisfied customers, rising (orfalling) sales, motivated salespersons, etc.? However attractive causal re-search may be, managers should recognize the following limitations:6
1. Field experiments can involve many variables outside the control ofthe experimenters, resulting in unanticipated differences in conditionssurrounding treatment groups.
2. It may be difficult or expensive to gain the cooperation of retailers andwholesalers when setting up the experiment.
3. Marketing personnel may lack knowledge of experimental proce-dures, reducing the chance of results which demonstrate causality.
4. Experiments are notoriously expensive and time consuming.5. The experimenter must be careful not to introduce bias into the experi-
ment by saying or doing something that may consciously or uncon-sciously affect the behavior of the test participants.
Ex Post Facto Research
Ex post facto (after the fact) studies are those that try to discover a causalrelationship without manipulation of the independent variable or controlover respondent exposure to treatment conditions. These studies are charac-terized by an observance of an outcome followed by attempts to find thecausal factor that caused the observed outcome. Consider this example:
A research manager for a regional bank was concerned with assess-ing customer images of their various branch locations. A mail surveyasked whether they were satisfied with the services provided by thebranch location that they used. Each respondent rated his or herbranch location on a number of attributes: for example, friendliness ofbank personnel, convenience of location, parking facilities, and soforth. After receiving the questionnaires, the manager divided thesample into two groups: those who expressed satisfaction with thebranch location and those who expressed dissatisfaction. An analysisof these two groups revealed that compared with customers who ex-pressed satisfaction, dissatisfied customers rated their branch locationas unsatisfactory with respect to friendliness of service. The researcherconcluded that friendliness of services is the primary factor leading tocustomer satisfaction, and, consequently, it plays an important part inthe decision about which bank to use.7

In this example, there is an attempt to identify a cause-effect relationship expost facto, without manipulation of variables, assignment of respondents totreatments, or control of extraneous variables. The observed association be-tween friendliness of service, customer satisfaction, and choice of bank mayin fact be spurious and the correlation was in fact due to another variable notincluded in the analysis.
For example, the people who rated their branch lower on the friendlinessand satisfaction scales may be from an area populated by high-incomehouseholds and who may have higher expectations of all aspects of serviceand who are more difficult to please in general. In such a case, the samelevel of service and friendliness of personnel among the branches is per-ceived differently by respondents, as is their level of overall satisfaction. Itis obvious that any causal inference drawn from ex post facto research,while indicating a possible causal relationship, must be supplemented withtrue experimental or quasi-experimental studies before we can draw cause-effect conclusions. However, in some cases, merely demonstrating covaria-tion between variables of interest is sufficient for marketing planning pur-poses. We merely must be careful not to assume we know more than we canlegitimately claim we do.
Test Marketing
Test marketing is the name given to a set of experimental or quasi-exper-imental (field) studies that are intended to determine the rate of market ac-ceptance for (usually) a new product. A company typically would use testmarketing to determine such information as:
• The sales volume and market share expectations of the new product• Some estimate of the repurchase cycle and likelihood of repurchase• A profile of trier-adopters• An understanding of competitor reactions to the new product• Some feel for the effect of the new product sales on existing product
sales• Performance of new product package design in generating trial and
satisfaction
With the cost and likelihood of new product failure, it is easy to see the in-centive of marketers conducting test markets to avoid large-scale introduc-tion of products destined to fail. On the other hand, test marketing itself maycost millions of dollars, delay the cash flow of a successful new product, andalert competitors to your plans, so the costs may be high in either case.However, when the stakes are high and the costs of failure are very signifi-cant, test marketing may be the best of the unattractive options available.

There are several points to ponder when making the decision whether ornot to test market a product.8
1. It is necessary to weigh the cost and risk of product failure against theprofit and profitability of success. The higher the probability of suc-cess and lower the costs of failure, the less attractive is test marketing.
2. The difference in the scale of investment involved in the test versusnational launch route has an important bearing on deciding whether totest. The greater the investment called for in manufacturing, the morevaluable a test market becomes in indicating the payout of such an in-vestment before it is made.
3. Another factor to be considered is the likelihood and speed with whichthe competition will be able to copy the new product and preempt partof your national market or overseas markets, should the test marketprove successful.
4. Investments in plant and machinery are only part of the costs involvedin a new product launch. The investment in marketing expenses andeffort may be extensive, as well as the fact that sometimes the newproduct will only be given space at the retail level previously occupiedby your existing products. Stock returns and buy-backs for unsuccess-ful products likewise increase the costs of failure, not to mention thepsychological impact of failing on a national scale. The higher theseassociated costs, the greater the potential value of test marketing inhelping decision makers arrive at the best decision regarding large-scale product launch.
A.C. Nielsen data indicate that 75 percent of products that undergo testmarketing succeed, while 80 percent of products not test marketed fail.9
Careful readers, however, may identify this implied causal relationship be-tween test marketing and success as ex post facto research—we observe therelationship and identify the implied causal factor instead of conducting acontrolled test to determine causality. In this case, it could be that the type offirms doing test marketing (large, big-budget firms with considerable mar-keting expertise), or not doing test marketing (small, low-budget firmswithout high-priced marketing talent), may explain more of the success ratethan does test marketing itself.
Three Types of Test Markets
Standard Test Markets. In a standard test markets the firm uses its ownregular distribution channels and sales force to stock the product in selected
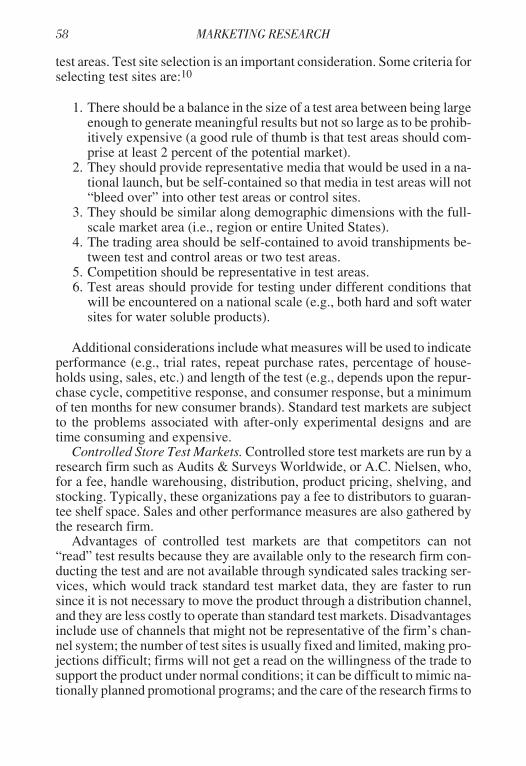
test areas. Test site selection is an important consideration. Some criteria forselecting test sites are:10
1. There should be a balance in the size of a test area between being largeenough to generate meaningful results but not so large as to be prohib-itively expensive (a good rule of thumb is that test areas should com-prise at least 2 percent of the potential market).
2. They should provide representative media that would be used in a na-tional launch, but be self-contained so that media in test areas will not“bleed over” into other test areas or control sites.
3. They should be similar along demographic dimensions with the full-scale market area (i.e., region or entire United States).
4. The trading area should be self-contained to avoid transhipments be-tween test and control areas or two test areas.
5. Competition should be representative in test areas.6. Test areas should provide for testing under different conditions that
will be encountered on a national scale (e.g., both hard and soft watersites for water soluble products).
Additional considerations include what measures will be used to indicateperformance (e.g., trial rates, repeat purchase rates, percentage of house-holds using, sales, etc.) and length of the test (e.g., depends upon the repur-chase cycle, competitive response, and consumer response, but a minimumof ten months for new consumer brands). Standard test markets are subjectto the problems associated with after-only experimental designs and aretime consuming and expensive.
Controlled Store Test Markets. Controlled store test markets are run by aresearch firm such as Audits & Surveys Worldwide, or A.C. Nielsen, who,for a fee, handle warehousing, distribution, product pricing, shelving, andstocking. Typically, these organizations pay a fee to distributors to guaran-tee shelf space. Sales and other performance measures are also gathered bythe research firm.
Advantages of controlled test markets are that competitors can not“read” test results because they are available only to the research firm con-ducting the test and are not available through syndicated sales tracking ser-vices, which would track standard test market data, they are faster to runsince it is not necessary to move the product through a distribution channel,and they are less costly to operate than standard test markets. Disadvantagesinclude use of channels that might not be representative of the firm’s chan-nel system; the number of test sites is usually fixed and limited, making pro-jections difficult; firms will not get a read on the willingness of the trade tosupport the product under normal conditions; it can be difficult to mimic na-tionally planned promotional programs; and the care of the research firms to

avoid stock-outs, optional shelf positioning, correct use of point-of-purchasematerials, and so on may not duplicate conditions existing with the normallaunch of a product. Nevertheless, controlled store test markets are oftenused as a check before going to standard test markets. If the results arepromising, a standard test market follows. If not, the product is killed or re-vised.
Simulated Test Markets. A simulated test market is not conducted in thefield, but rather in a laboratory setting. Firms providing such services (e.g.,Burke; M/A/R/C; NPO Research; Yankelovich Clancy Shulman; CustomResearch, Inc.) follow a procedure that usually includes the following:
1. Respondents are recruited and screened to fit the desired demographicand usage patterns of the target market.
2. Respondents are shown ads for the tested products as well as competi-tive products, or are shown product concepts or prototypes.
3. Respondents are asked to record their attitudes toward the product onstructured questionnaires and are either asked to indicate their pur-chase interest or are given a chance to buy the product or competitiveproducts in a simulated shopping environment. For example, an aislemight be set up similar to an aisle in a drugstore with your testedcough syrup along with competitive cough syrups. Respondents canpurchase any of the brands they desire.
4. Those who choose the tested products take it home and use it as theywould under normal conditions, and are contacted after an appropriatetime period and asked a series of attitudinal, repurchase intent, and usage-related questions.
5. Data from these steps are processed by a computer programmed tocalculate estimated sales volume, market share, and other perfor-mance data based on assumptions of a marketing mix incorporatedinto the program.
Simulated test markets do not assume that the attitudes and behaviors ev-idenced in the simulation will be exactly duplicated in the market, but ratherdepend upon observed relationships that have been discovered historicallybetween laboratory and eventual market findings. While costing in the lowsix-figures, simulated test markets are cheap compared to a full-blown stan-dard test market, they are confidential, and permit easy modifications in amarketing mix to calibrate the most successful plan for introduction. Thedisadvantage is that they operate under a series of assumptions about whatwill really happen, while standard test markets are the real thing. Reportedaccuracy of simulated test markets are within 29 percent of forecast 90 per-cent of the time.11

EXPLORATORY, DESCRIPTIVE,OR CAUSAL OBSERVATION
The previous discussion of research designs followed the generally ac-cepted practice of discussing the techniques for carrying out the researchwithout distinguishing between the data-collection methods of communica-tion or observation. We will discuss those two methods at greater length inChapter 4, but the reader should be alerted to the fact, at this point, that ob-servation can be legitimately conducted as a part of exploratory, descrip-tive, or causal research. The use of observation for collecting causal data isperhaps most obvious (e.g., sales data collected in a test market representsobservation). Less obvious is the use of observation in exploratory or de-scriptive research. This situation is at least partly explained by the lack ofcategories used to classify observation techniques such as exist for commu-nication methods (e.g., focus groups, cross-sectional sample surveys, etc.).
The difficulty in classifying observational techniques does not diminishthe value of these techniques, however, it just makes their discussion a littlemore difficult. It is perhaps best to think of observational research, whateverthe technique, as being appropriately used when it is consistent with theoverall objectives of the research design under which it is being applied.Therefore, observational research in exploratory designs is being used togain insights, ideas, clarification, etc., while descriptive observational re-search is determining frequency of occurrence, the extent to which two ob-servational behaviors covary, etc., and causal observation is conducted in acontrolled setting to determine if a causal relationship exists between care-fully defined variables. Such desirable consistency is the rule whether ob-servation is the sole data-collection method, or combined with communica-tion. For example, in a focus group intended to gain insight into consumerattitudes about a brand, the body language of consumers observed by the re-searchers provides additional insights into their feelings. Likewise, in de-scriptive research, coupling survey information with diary of purchases(i.e., observed data) can provide opportunity to see if attitudes and behaviorcovary. However observation is done, it is the objective of research that willdetermine how it is applied—flexibility inherent in exploratory observa-tion, structure inherent in descriptive observation, and control inherent incausal observation.
In another example, observation data collected by optical scanners insupermarkets could be used to generate ideas or hypotheses in the explor-atory phase of a research project (e.g., maybe large packages are outsellingsmaller packages because they seem to offer better value), test hypothesesvia covariation in the descriptive phase (e.g., package size purchases covarywith number of people in the household), or test hypotheses via experimen-tal design in the causal phase (e.g., varying coupon amounts has a greater ef-fect on sales of the 16 oz. package size of Brand A than the 8 oz. size). In this

example it is important to note that the only reason the data could be used inthe descriptive and causal research designs is that it was originally collectedby using a methodology that generated “quantifiably precise” data. In otherwords, you cannot use information that was originally generated using ex-ploratory research methodology in making descriptive or causal researchcalculations (e.g., focus groups cannot generate descriptive data if you do ahundred of them instead of three because the methodology is not intended togenerate quantifiable information—it was intended to provide insights,ideas, etc.).
DANGERS OF DEFINING DESIGN BY TECHNIQUE
Just as it is not appropriate to define a research design by data-collectionmethod (e.g., exploratory research is not always done via communication;causal, not always by observation), it is also inappropriate to think research“tools” are the province of only one design. While some techniques are as-sociated with only one design, such as experiments with causal and projec-tive techniques for exploratory, other techniques may be used successfullyunder all three designs. Therefore, it is dangerous to define a design by atechnique. Rather, designs are defined by the objectives and resulting meth-odology pursued which is consistent with the methodology. An examplewill help make this point. Table 2.3 shows the difference in using a surveywhen doing exploratory, descriptive, or causal research.
TABLE 2.3. Differences in Using a Survey by Research Design Type
ExploratoryResearch
DescriptiveResearch
CausalResearch
Objectives Gain insights,ideas
Quantify Test variables for causalrelationships
Hypothesesare
Generated Tested viacovariation
Tested via experimenta-tion
SamplingMethod
Nonprobability Probability Random assignmentto treatments
Survey Ques-tions
Can changeover courseof research
Fixed Fixed
Structure ofData Collec-tion
Loosely struc-tured
Highly structured Controlled
Exampleof SurveyQuestion
“Why did you firststart using Tide?”
“Which of the fol-lowing reasonsbest explains whyyou first startedusing Tide?”
“Do you recall seeingany TV commercials inthe past 24 hours for alaundry detergent?”(Unaided recall mea-sures after testing anew TV commercial.)

While acknowledging that surveys can and are used for exploratory re-search, we should emphasize that the preferred methods for achieving theobjectives of exploratory research remain the five techniques (literature re-view, personal interviews, etc.) discussed earlier in this chapter. They aremore capable of generating the depth of insight desired as an outcome fromexploratory research.
SUMMARY
Good strategy and good marketing decisions do not just “happen.” Theyare grounded in accurate, timely, and useful market intelligence. Such in-formation is obtained only through the careful translation of managementproblems into a research purpose, a research purpose into a set of researchobjectives, and those research objectives into a research design. Such a de-sign is a road map that helps us arrive at our planned destination of havingthe information we need for decision making. The research design may in-volve one or more of the three categories of research: exploratory, descrip-tive, or causal. Our research objectives suggest that one or combinations ofthese types will be needed to obtain the desired information.
Whenever researchers must find answers to research questions dealingwith cause and effect inferences they must consider the need for experimen-tation. Experimental designs differ from exploratory or descriptive designsin the degree of control exerted by the researcher over relevant variables.Experiments involve manipulation, control, and measurement of variablesin order to allow for causal inference. In some cases such experiments mustbe conducted in the field, rather than in a controlled laboratory setting andare referred to as quasi experiments. Several experimental designs werediscussed, along with test marketing, one of the most commonly conductedcausal experimental approaches used by marketers.
Research Project Assignment
Describe the design to be used in conducting the research for your pro-ject. Be as specific as possible in detailing exactly how you will get an-swers to your research questions and test your hypotheses. For example,don’t just say you will do exploratory research; rather say you will do aliterature search of census data for research question #4, which will pro-vide information needed to do descriptive research in the form of amailed sample survey to get answers to research questions #6 and #7, etc.

Chapter 3
Secondary DataSecondary Data
Research design, as discussed in Chapter 2, is the “road map” for the re-searcher, indicating the route the researcher will take in collecting the infor-mation to ultimately solve the management problem or evaluate the marketopportunity in question. The types of data collected in executing this re-search design will be either (1) primary data or (2) secondary data. Primarydata are those data that are collected for the first time by the researcher forthe specific research project at hand. Secondary data are data previouslygathered for some other purpose. There is some confusion about the terms“primary” and “secondary.” These terms have nothing to do with the rela-tive importance of the information. Whether the data are primary or second-ary is determined by whether they originated with the specific study in con-sideration or not.
The first tenet of data gathering among researchers is to exhaust allsources of secondary data before engaging in a search for primary data.Many research questions can be answered more quickly and with less ex-pense through the proper use of secondary information. However, cautionmust be used to ensure that primary sources of secondary data are used sincethey are generally more accurate and complete than secondary sources ofsecondary data.
USES OF SECONDARY DATA
There are several important uses of secondary data even though the re-search design might require the use of primary data. The most common usesare:
1. In some cases the information and insights gained from secondarydata are sufficient to answer the research question.
2. Secondary data can provide the background necessary to understandthe problem situation and provide an overview of the market dynamics.
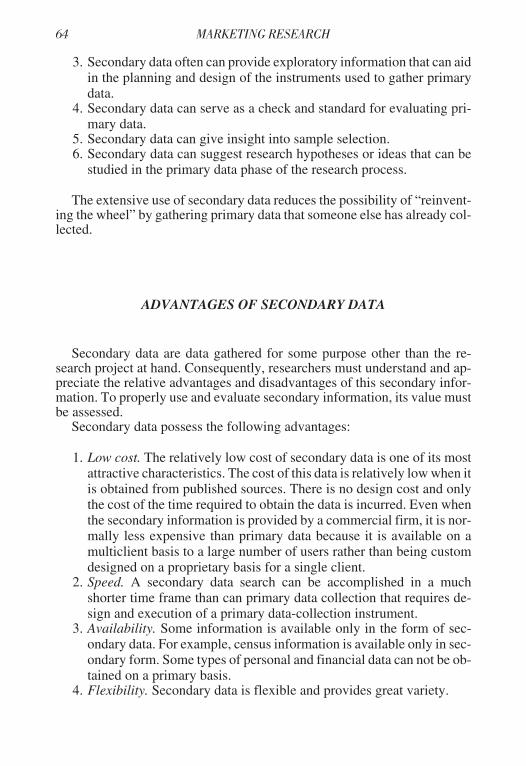
3. Secondary data often can provide exploratory information that can aidin the planning and design of the instruments used to gather primarydata.
4. Secondary data can serve as a check and standard for evaluating pri-mary data.
5. Secondary data can give insight into sample selection.6. Secondary data can suggest research hypotheses or ideas that can be
studied in the primary data phase of the research process.
The extensive use of secondary data reduces the possibility of “reinvent-ing the wheel” by gathering primary data that someone else has already col-lected.
ADVANTAGES OF SECONDARY DATA
Secondary data are data gathered for some purpose other than the re-search project at hand. Consequently, researchers must understand and ap-preciate the relative advantages and disadvantages of this secondary infor-mation. To properly use and evaluate secondary information, its value mustbe assessed.
Secondary data possess the following advantages:
1. Low cost. The relatively low cost of secondary data is one of its mostattractive characteristics. The cost of this data is relatively low when itis obtained from published sources. There is no design cost and onlythe cost of the time required to obtain the data is incurred. Even whenthe secondary information is provided by a commercial firm, it is nor-mally less expensive than primary data because it is available on amulticlient basis to a large number of users rather than being customdesigned on a proprietary basis for a single client.
2. Speed. A secondary data search can be accomplished in a muchshorter time frame than can primary data collection that requires de-sign and execution of a primary data-collection instrument.
3. Availability. Some information is available only in the form of sec-ondary data. For example, census information is available only in sec-ondary form. Some types of personal and financial data can not be ob-tained on a primary basis.
4. Flexibility. Secondary data is flexible and provides great variety.

DISADVANTAGES OF SECONDARY DATA
Since secondary data, both internal and external, were generated forsome purpose other than to answer the research question at hand, care mustbe taken in their application. The limitations of secondary data must be con-sidered. Secondary data have the following potential limitations or dis-advantages:
1. A poor “fit.” The secondary data collected for some other research ob-jective or purpose may not be relevant to the research question athand. In most cases, the secondary data will not adequately fit theproblem. In other cases, secondary data collected from varioussources will not be in the right intervals, units of measurement or cate-gories for proper cross-comparison. The secondary data may not becollected from the correct or most representative sample frame.
2. Accuracy. The question of accuracy takes several things into consid-eration. First of all, there is the question of whether the secondary datacame from a primary or secondary source. Secondary sources of sec-ondary data should be avoided. The next consideration is the organi-zation or agency that originally collected the data. What is the qualityof their methodology and data-gathering design? What is their reputa-tion for credibility?
3. Age. A major problem with published and secondary data is the time-liness of the information. Old information is not necessarily bad infor-mation; however, in many dynamic markets, up-to-date informationis an absolute necessity.
4. Quality. Information quality is sometimes unknown. The reputationand capability of the collecting agency is important to assessing thequality of the information provided. To verify the overall quality ofsecondary information, it may be necessary to know how the datawere collected, what the sampling plan was, what data collectionmethod was used, what field procedures were utilized, what trainingwas provided, what degree of nonresponse was experienced, and whatother sources of error are possible.
SECONDARY DATA SOURCES
The first problem that confronts a researcher in initiating a secondarydata search is the massive amount, wide variety, and many locations of sec-ondary data. Some method of logically summarizing the sources of second-ary data is helpful. Most textbooks on the subject divide secondary datasources into two groups: (1) internal data sources and (2) external datasources.

Internal secondary data sources are closest at hand since they are foundwithin the organization initiating the research process. These internal datahave been collected for other purposes but are available to be consolidated,compared, and analyzed to answer the new research question being posed.This is particularly true of organizations that have sophisticated manage-ment information systems that routinely gather and consolidate useful mar-keting, accounting, and production information.
Specific internal records or sources of internal secondary data are:
1. Invoice records2. Income statements (various cost information)3. Sales results4. Advertising expenditures5. Accounts receivable logs6. Inventory records7. Production reports and schedules8. Complaint letters and other customer correspondence9. Salesperson’s reports (observations)
10. Management reports11. Service records12. Accounts payable logs13. Budgets14. Distributor reports and feedback15. Cash register receipts16. Warranty cards
Even though most research projects require more than just internal data,this is a very cost-efficient place to begin the data search. Quite often a re-view of all internal secondary data sources will inexpensively give directionfor the next phase of data collection. The internal search will give clues towhat external data sources are required to gather the information needed toanswer the research question.
External secondary data originate outside the confines of the organiza-tion. There is an overwhelming number of external sources of data availableto the researcher. Good external secondary data may be found through li-braries, Web searches, associations, and general guides to secondary data.Most trade associations accumulate and distribute information pertinent totheir industry. Quite often this includes sales and other information gath-ered from their members. The Directory of Directories and the Encyclope-dia of Associations are excellent sources for finding associations and orga-nizations that may provide secondary information for a particular industry.
Data mining is a term commonly used to described the process by whichcompanies extract consumer behavioral patterns from analysis of huge

databases containing internally and externally generated data. These data-bases contain information gleaned from customer Web site visits, warrantycards, calls to toll free numbers, retail purchases, credit card usage, car reg-istration information, home mortgage information, and thousands of otherdatabases, including the U.S. Census. The use of neural network and paral-lel processing technology allows marketers to search through these data-bases to find behavioral patterns that can help identify the best prospectsfor:
• Upgrading customers to more profitable products• Cross-selling different products or services offered by the company• Special offers or offers combining several companies (e.g., travel pack-
ages)• Continued long-term relationship building• “Weblining”—similar to the practice of “redlining” where vigorous
customer service is reserved for only a firm’s best customers andwithheld from the marginal customers, all based on the customer re-cords in the database1
The use of the Internet as a key channel of distribution has allowed manycompanies to develop even more sophisticated databases for marketing pur-poses.2 For example, customers clicking on NextCard, Inc.’s ad for a creditcard on the Quicken.com financial Web site can have their credit historychecked and a card issued (or application rejected) in thirty-five seconds.
Secondary Data Sources on the World Wide Web
The Web has become the first, and too often the only, source to be usedby the marketing researcher in search of pertinent secondary data. It is rea-sonable to assume the reader of this text has had experience “surfing theWeb,” and therefore is familiar with Web browsers (e.g., Netscape Navigatoror Microsoft Internet Explorer), search engines or portals (e.g., AltaVista,Infoseek, HotBot, Google, Excite, Yahoo!, etc.), indexes of business andother periodical literature (e.g., EBSCOHOST), Web search strategies (e.g.,use of parentheses, and, or, not, +, –, quotation marks, asterisk, etc.), anduse of newsgroups (i.e., Internet sites where people can post queries or re-spond to other people’s queries or post comments. Over 250,000 news-groups exist, each devoted to a specific topic). The savvy researcher canharness these and other resources and methods of using the Internet to dis-cover relevant secondary data available over the World Wide Web. The fol-lowing are some useful Web sites for marketing researchers:

Meta-Sites or Sources of Research Reports
http://djinteractive.comDow Jones Interactive’s market research reports.
http://lexis-nexis.comLexis is a comprehensive legal database and Nexis offers full-textbusiness and news sources.
www.asiresearch.comLinks to sources of market research in the advertising and entertain-ment industries.
www.dialog.comFeatures many business databases.
www.imarketinc.comMarketPlace Information’s one-stop shopping for marketing re-sources for business-to-business marketing. Includes over 1,000 mar-ket profiles, a directory of 100,000 marketing service firms, and mail-ing lists.
www.imrmall.comA “Shopping Mall for Market Research,” this site includes thousandsof marketing research reports conducted by scores of research compa-nies in a variety of industries (e.g., transport, travel, leisure, cateringand food, aerospace, real estate, etc.). It also includes Market Re-source Locator with links to over 600 Web sites of interest to research-ers (many are in Europe).
www.marketresearch.comLinks to many other research Web sites. Tools_to_toc.html is the Ta-ble of Contents to this reference tool.
www.mra-net.orgThe Marketing Research Association’s site includes the latest editionof their Blue Book and a listing of research firms in the United States.Also, they have links to other marketing research sites, a newsgroupwhere researchers can post items of interest to other researchers, andan events calendar.
www.tetrad.comGood source of U.S. demographic information.

www.prodigy.comDatabases on business, news, etc.
www.profound.comMarket research reports located in the ResearchLine database.
www.quirks.comA directory of sources of market research firms and reports.
www.usadata.comCalling itself the “Marketing Information Portal Company,” this siteaggregates data from a number of marketing research firms to allowthe researcher to click on any one of several dozen general industrytopics (for example, automotive or home improvement) to find avail-able market research reports. You can also find out such trivia as theU.S. city where Internet shopping is most popular (Austin, TX), or thebest-selling candy bar (Snickers).
www.worldopinion.comA global meta-site frequently used by marketing researchers.
Research Associations
www.marketingpower.com American Marketing Associationwww.arfsite.org Advertising Research Foundationwww.casro.org Council of American Survey Research
Organizationswww.cmor.org Council for Marketing and Opinion Researchwww.marketresearch.org.uk Market Research Societywww.mra-net.org Marketing Research Associationwww.nmoa.org National Mail Order Associationwww.pmrs-aprm.com Professional Marketing Research Societywww.qrca.org Qualitative Research Consultants Associationwww.researchindustry.org Research Industry CoalitionOther association Web sites Use Yahoo! search engine and use
expression “+ association” in search (e.g.,+ real estate + association, or “marketingresearch” + association, etc.)
Directories of Market Research Firms
www.bluebook.org Market Research Association’s directory ofmarketing research firms

www.greenbook.org American Marketing Association’sdirectory of marketing research firms
www.quirks.com Quirks directory of marketing research firms
Marketing Research Firms/Government Sites
www.acnielsen.com A.C. Nielsen—syndicated data and customresearch
www.bea.doc.gov Bureau of Economic Analysiswww.burke.com Burke—marketing research and marketing
consulting firmwww.census.gov U.S. Census Bureauwww.ssa.gov Office of Research and Statisticswww.claritas.com Claritas—geodemographic data firmwww.fedstats.gov FedStats (links to seventy federal agencies)www.findsvp.com Find/SVP—Consulting and research serviceswww.marcresearch.com M/A/R/C Research—custom researchwww.marketfacts.com Market Facts, Inc.—full service and
consumer panel research firmwww.maritz.com Maritz Marketing Research, Inc.—full
service research firm
Articles Describing Internet Search Strategiesfor Marketing Researchers
Marydee Ojala, “Creating Your Own Market Research Report,” OnlineUser, (March/April 1997), pp. 20-24.
“Directories for Locating Marketing Research Reports,” The InformationAdvisor, (June 1999), pp. 6-8.
David Curle, “Out-of-the-Way Sources for Market Research on the Web,”Online, (Jan/Feb 1998), pp. 63-68.
Marydee Ojala, “Top Sources for Market Research Reports,” Online User,(March/April 1997), pp. 15-19.
Susan M. Klopper, “Unearthing Market Research: Get Ready for a BumpyRide,” Searcher, (March 2000), pp. 42-48.
“Using Search Engines to Conduct Market Research,” The Information Ad-visor, (September 1999), pp. 1-2.
Syndicated Data Sources
Specific syndicated sources are available to provide marketing informa-tion. Several specific syndicated services are:
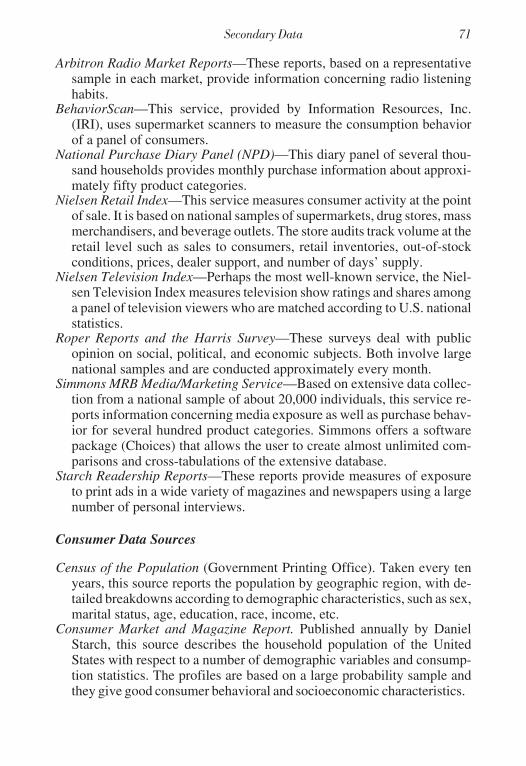
Arbitron Radio Market Reports—These reports, based on a representativesample in each market, provide information concerning radio listeninghabits.
BehaviorScan—This service, provided by Information Resources, Inc.(IRI), uses supermarket scanners to measure the consumption behaviorof a panel of consumers.
National Purchase Diary Panel (NPD)—This diary panel of several thou-sand households provides monthly purchase information about approxi-mately fifty product categories.
Nielsen Retail Index—This service measures consumer activity at the pointof sale. It is based on national samples of supermarkets, drug stores, massmerchandisers, and beverage outlets. The store audits track volume at theretail level such as sales to consumers, retail inventories, out-of-stockconditions, prices, dealer support, and number of days’ supply.
Nielsen Television Index—Perhaps the most well-known service, the Niel-sen Television Index measures television show ratings and shares amonga panel of television viewers who are matched according to U.S. nationalstatistics.
Roper Reports and the Harris Survey—These surveys deal with publicopinion on social, political, and economic subjects. Both involve largenational samples and are conducted approximately every month.
Simmons MRB Media/Marketing Service—Based on extensive data collec-tion from a national sample of about 20,000 individuals, this service re-ports information concerning media exposure as well as purchase behav-ior for several hundred product categories. Simmons offers a softwarepackage (Choices) that allows the user to create almost unlimited com-parisons and cross-tabulations of the extensive database.
Starch Readership Reports—These reports provide measures of exposureto print ads in a wide variety of magazines and newspapers using a largenumber of personal interviews.
Consumer Data Sources
Census of the Population (Government Printing Office). Taken every tenyears, this source reports the population by geographic region, with de-tailed breakdowns according to demographic characteristics, such as sex,marital status, age, education, race, income, etc.
Consumer Market and Magazine Report. Published annually by DanielStarch, this source describes the household population of the UnitedStates with respect to a number of demographic variables and consump-tion statistics. The profiles are based on a large probability sample andthey give good consumer behavioral and socioeconomic characteristics.
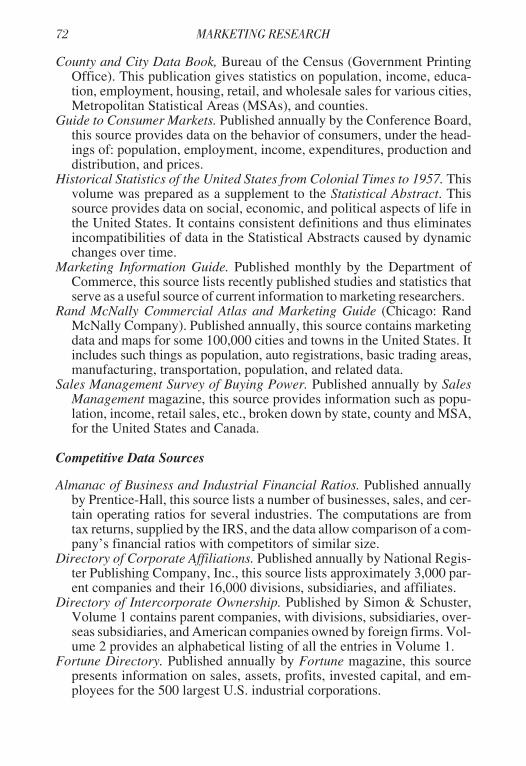
County and City Data Book, Bureau of the Census (Government PrintingOffice). This publication gives statistics on population, income, educa-tion, employment, housing, retail, and wholesale sales for various cities,Metropolitan Statistical Areas (MSAs), and counties.
Guide to Consumer Markets. Published annually by the Conference Board,this source provides data on the behavior of consumers, under the head-ings of: population, employment, income, expenditures, production anddistribution, and prices.
Historical Statistics of the United States from Colonial Times to 1957. Thisvolume was prepared as a supplement to the Statistical Abstract. Thissource provides data on social, economic, and political aspects of life inthe United States. It contains consistent definitions and thus eliminatesincompatibilities of data in the Statistical Abstracts caused by dynamicchanges over time.
Marketing Information Guide. Published monthly by the Department ofCommerce, this source lists recently published studies and statistics thatserve as a useful source of current information to marketing researchers.
Rand McNally Commercial Atlas and Marketing Guide (Chicago: RandMcNally Company). Published annually, this source contains marketingdata and maps for some 100,000 cities and towns in the United States. Itincludes such things as population, auto registrations, basic trading areas,manufacturing, transportation, population, and related data.
Sales Management Survey of Buying Power. Published annually by SalesManagement magazine, this source provides information such as popu-lation, income, retail sales, etc., broken down by state, county and MSA,for the United States and Canada.
Competitive Data Sources
Almanac of Business and Industrial Financial Ratios. Published annuallyby Prentice-Hall, this source lists a number of businesses, sales, and cer-tain operating ratios for several industries. The computations are fromtax returns, supplied by the IRS, and the data allow comparison of a com-pany’s financial ratios with competitors of similar size.
Directory of Corporate Affiliations. Published annually by National Regis-ter Publishing Company, Inc., this source lists approximately 3,000 par-ent companies and their 16,000 divisions, subsidiaries, and affiliates.
Directory of Intercorporate Ownership. Published by Simon & Schuster,Volume 1 contains parent companies, with divisions, subsidiaries, over-seas subsidiaries, and American companies owned by foreign firms. Vol-ume 2 provides an alphabetical listing of all the entries in Volume 1.
Fortune Directory. Published annually by Fortune magazine, this sourcepresents information on sales, assets, profits, invested capital, and em-ployees for the 500 largest U.S. industrial corporations.

Fortune Double 500 Directory. Published annually in the May to August is-sues of Fortune magazine, this source offers information on assets, sales,and profits of 1,000 of the largest U.S. firms; fifty largest banks; life in-surance companies; and retailing, transportation, utility, and financialcompanies. In addition, this source ranks foreign firms and banks.
Middle Market Directory. Published annually by Dun and Bradstreet, thissource lists companies with assets in the range of $500,000 to $999,999.The directory offers information on some 30,000 companies’ officers,products, sales, and number of employees.
Million Dollar Directory. Published annually by Dun and Bradstreet, thissource offers the same information as the Middle Market Directory, onlyfor companies with assets over $1 million.
Moody’s Industrial Manual. Published annually, this source provides infor-mation on selected companies’ products and description, history, merg-ers and acquisition record, principal plants and properties, principal of-fices, as well as seven years of financial statements and statisticalrecords.
Moody’s Manual of Investments. This source documents historical and op-erational data on selected firms and five years of their balance sheets, in-come accounts, and dividend records.
Moody’s Manuals. This source list includes manuals entitled Banks and Fi-nance, Municipals and Governments, Public Utilities, and Transporta-tion. These manuals contain balance sheet and income statements forvarious companies and government units.
Reference Book of Corporate Managements. Published annually by Dunand Bradstreet, this source gives a list of 2,400 companies and their30,000 officers and directors.
Sheldon’s Retail Directory of the United States and Canada. Published an-nually by Phelon, Sheldon and Marsar, Inc., this source supplies the larg-est chain, department, and specialty stores, by state and city, and by Ca-nadian province and city. This source also includes merchandise managersand buyers.
Standard and Poor’s Register of Corporations, Directors, and Executives.Published annually by Standard and Poor, this source provides officers,sales, products, and number of employees for some 30,000 U.S. and Ca-nadian corporations.
State Manufacturing Directories. Published for each state, these sourcesgive company addresses, products, officers, etc., by geographic location.
Thomas Register of American Manufacturers. Published annually by theThomas Publishing Company, this source gives specific manufacturersof individual products, as well as the company’s address, branch offices,and subsidiaries.

Wall Street Journal Index. Published monthly, this source lists corporatenews, alphabetically, by firm name, as it has occurred in The Wall StreetJournal.
Market Data Sources
American Statistics Index: A Comprehensive Guide and Index to the Statis-tical Publications of the U.S. Government. Published monthly by theCongressional Information Service, this source indexes statistical publi-cations of federal agencies, and it is a useful starting point for obtainingmarket data.
Ayer Directory of Publications. Published annually by Ayer Press, thissource is a comprehensive listing of newspapers, magazines, and tradepublications of the United States, by states, Canada, Bermuda, Republicsof Panama and the Philippines, and the Bahamas.
Bureau of the Census Catalog (Government Printing Office). Publishedquarterly, this source is a comprehensive guide to Census Bureau publi-cations. Publications include agriculture, foreign trade, governments,population, and the economic census.
Business Conditions Digest. Bureau of Economic Analysis, Department ofCommerce (Government Printing Office). Published monthly, this sourcegives indications of business activity in table and chart form.
Business Cycle Developments, Bureau of the Census (Government PrintingOffice). Published monthly, this source provides some seventy businessactivity indicators, that give keys to general economic conditions.
Business Periodicals Index. This source lists articles by subject headingfrom 150 or more business periodicals. It also suggests alternate keywords that can be used to determine a standard of relevance in environ-mental analysis.
Business Statistics, Department of Commerce. Published biennially, thissource is a supplement to “The Survey of Current Business.” It providesinformation from some 2,500 statistical series, starting in 1939.
Census of Business (Government Printing Office). Published every fiveyears, this source supplies statistics on the retail, wholesale, and servicetrades. The census of service trade compiles information on receipts, legalform of organization, employment, and number of units by geographicarea.
Census of Manufacturers (Government Printing Office). Published everyfive years, this source presents manufacturers by type of industry. It con-tains detailed industry and geographic statistics, such as the number ofestablishments, quantity of output, value added in manufacture, employ-ment, wages, inventories, sales by customer class, and fuel, water, andenergy consumption.

Census of Retail Trade (Government Printing Office). Taken every fiveyears, in years ending in 2 and 7, this source provides information on 100retail classifications arranged by SIC numbers. Statistics are compiled onnumber of establishments, total sales, sales by product line, size of firms,employment and payroll for states, MSAs, counties, and cities of 2,500or more.
Census of Selected Service Industries (Government Printing Office). Takenevery five years, in years ending in 2 and 7, this source compiles statisticson 150 or more service classifications. Information on the number of es-tablishments, receipts, payrolls, etc., are provided for various service or-ganizations.
Census of Transportation (Government Printing Office). Taken every fiveyears, in years ending in 2 and 7, this source presents three specific sur-veys: Truck Inventory and Use Survey, National Travel Survey, andCommodity Transportation Survey.
Census of Wholesale Trade (Government Printing Office). Taken every fiveyears, in years ending in 2 and 7, this source provides statistics of 118wholesale classifications. Information includes numbers of establish-ments, sales, personnel, payroll, etc.
Commodity Yearbook. Published annually by the Commodity Research Bu-reau, this source supplies data on prices, production, exports, stocks, etc.,for 100 commodities.
County Business Patterns. Departments of Commerce and Health, Educa-tion and Welfare. Published annually, this source gives statistics on thenumber of businesses by type and their employment and payroll brokendown by county.
Directories of Federal Statistics for Local Areas, and for States: Guides toSources, Bureau of the Census (Government Printing Office). These twodirectories list sources of federal statistics for local areas, and for states,respectively. Data includes such topics as population, health, education,income, finance, etc.
Directory of Federal Statistics for Local Areas: A Guide to Sources (Gov-ernment Printing Office). This source looks at topics such as population,finance, income, education, etc., in a local perspective.
Economic Almanac. Published every two years by the National IndustrialConference Board, this source gives data on population, prices, commu-nications, transportation, electric and gas consumption, construction,mining and manufacturing output, in the U.S., Canada, and other se-lected world areas.
Economic Indicators, Council of Economic Advisors, Department of Com-merce (Government Printing Office). Published monthly, this sourcegives current, key indicators of general business conditions, such asgross national product (GNP), personal consumption expenditures, etc.

F and S Index. This detailed index on business-related subjects offers infor-mation about companies, industries, and products from numerous busi-ness-oriented newspapers, trade journals, financial publications, andspecial reports.
Federal Reserve Bulletin (Washington, DC: Federal Reserve System Boardof Governors). Published monthly, this publication offers financial dataon interest rates, credit, savings, banking activity; an index of industrialproduction; and finance and international trade statistics.
Handbook of Economic Statistics. Economics Statistics Bureau. Publishedannually, this source, presents current and historical statistics of U.S. in-dustry, commerce, agriculture, and labor.
Market Analysis: A Handbook of Current Data Sources. Written byNathalie Frank and published by Scarecrow Press of Metuchen, NJ, thisbook offers sources of secondary information broken down on the basisof indexes, abstracts, directories, etc.
Market Guide (New York: Editor and Publisher magazine). Published an-nually, this source presents data on population, principal industries,transportation facilities, households, banks, and retail outlets for some1,500 U.S. and Canadian newspaper markets.
Measuring Markets: A Guide to the Use of Federal and State StatisticalData (Government Printing Office). This publication lists federal andstate publications covering population, income, employment, taxes, andsales. It is a useful starting point for the marketing researcher who is in-terested in locating secondary data.
Merchandising. Published annually in the March issue of this magazine isthe “Statistical and Marketing Report,” which presents charts and tablesof sales, shipments, product saturation and replacement, trade in and im-port/export figures for home electronics, major appliances, and house-wares. Also appearing annually in the May issue is the “Statistical andMarketing Forecast.” This gives manufacturer’s sales projections for thecoming year and is useful in forecasting certain market factors.
Monthly Labor Review, Bureau of Labor Statistics (Government PrintingOffice). Published monthly, this source presents information on employ-ment, earnings, and wholesale and retail prices.
Predicasts (Cleveland, OH: Predicasts, Inc.). This abstract gives forecastsand market data, condensed to one line, from business and financial pub-lications, trade journals, and newspapers. It includes information onproducts, industries and the economy, and it presents a consensus fore-cast for each data series.
Public Affairs Information Services Bulletin (PAIS). Similar to, but differ-ent from, the Business Periodicals Index, this source includes more for-eign publications, and it includes many books, government publications,and many nonperiodical publications.

Reader’s Guide to Periodical Literature. This index presents articles frommagazines of a general nature, such as U.S. News and World Report,Time, Newsweek, Saturday Review, etc. It also suggests alternate keywords that provide initial insight into the nature of the environment.
Standard and Poor’s Industry Survey. Published annually, this source of-fers current surveys of industries and a monthly Trends and Projectionssection, useful in forecasting market factors.
Standard and Poor’s Trade and Securities Statistics. Published monthly byStandard and Poor Corporation, this source contains statistics on bank-ing, production, labor, commodity prices, income, trade, securities, etc.
Statistical Abstract of the United States, Bureau of the Census (GovernmentPrinting Office). Published annually, this source serves as a good initialreference for other secondary data sources. It includes data tables cover-ing social, economic, industrial, political, and demographic subjects.
Statistics of Income. Internal Revenue Service, published annually, thissource gives balance sheet and income statement statistics, preparedfrom federal income tax returns of corporations, and broken down bymajor industry, asset size, etc.
Survey of Current Business, Bureau of Economic Analysis, Department ofCommerce (Government Printing Office). Published monthly, thissource presents indicators of general business, personal consumption ex-penditures, industry statistics, domestic trade, earnings and employmentby industry, real estate activity, etc.
U.S. Industrial Outlook (Government Printing Office). Published annually,this source provides a detailed analysis of approximately 200 manufac-turing and nonmanufacturing industries. It contains information on re-cent developments, current trends, and a ten-year outlook for the indus-tries. This source is useful in forecasting the specific marketing factors ofa market analysis.
Miscellaneous Data Sources
Business Publication Rates and Data. Published by Standard Rate and DataService, Inc. This index lists various trade publication sources.
Economic Census (Government Printing Office). A comprehensive and pe-riodic canvass of U.S. industrial and business activities, taken by theCensus Bureau every five years. In addition to providing the frameworkfor forecasting and planning, these censuses provide weights and bench-marks for indexes of industrial production, productivity, and price. Man-agement uses these in economic or sales forecasting, and analyzing salesperformance, allocating advertising budgets, locating plants, warehousesand stores, and so on.

Encyclopedia of Associations. Published by Gale Research Co. May ac-quaint a researcher with various associations for cost data pertaining todesired industry.
Moody’s Investors Services, Inc. Published by Standard and Poor Corpora-tion (New York), this is a financial reporting source that includes manylarge firms.
Standard Corporation Records. Published by Standard and Poor Corpora-tion (New York), this is a publication of financial reporting data of thelarger firms.
SUMMARY
Whenever research requirements are defined, secondary data should beexploited first to give background, direction, and control over the total re-search process. Beginning with a secondary data search will ensure that themaximum benefit is derived from the collection of primary data. All perti-nent secondary data should be gathered before moving to the primary gath-ering stage because it is generally quicker and cheaper to collect secondarydata. Good secondary data can be found both internally and externally. Li-brary facilities, as well as the Web, should be used as a starting point ingathering secondary data, while the federal government is the largest singlesource of secondary information.
Although secondary information may answer the research question, gen-erally it provides only the springboard for a collection of specific custom-designed information.
Research Project Tip
Virtually all research projects will benefit from conducting a literaturereview of secondary data sources. While this will undoubtedly includethe use of the Web, you should also visit a university and/or public li-brary. It is not enough to merely print out those articles available as a“full-text” print option on EBSCOHOST, for example. Other very im-portant articles and secondary data sources are available only by visitingyour library. Conducting a literature review only from in front of yourcomputer screen is not sufficient. This is not a time to take shortcuts. Keyinformation may be available only with the expenditure of time and hardwork.

Chapter 4
Primary Data CollectionPrimary Data Collection
The search for answers to our research questions, or the tests of our hy-potheses to determine whether or not they are supported by the informationwe collect, may require us to go beyond the examination of existing data.When we find ourselves in such a situation we are in need of primary data—data not available in a secondary form that must be collected to address thespecific needs of our research. Research studies can be at any point on acontinuum, which at one end answers all research questions with secondarydata and at the other end where no existing secondary data can be used to an-swer the research questions (Figure 4.1). Chapter 3 provided guidance onhow and where to look for secondary sources of information. In this chapterwe examine the search for primary data.
It is important not to lose sight of how we arrived at the point of acknowl-edging our need for primary data. We are seeking to make decisions to solvea management problem (or assess a market opportunity, etc.), and we wantthose decisions to be informed decisions, rather than be based on hunches orguesswork. Consequently, we have identified a purpose for the research anda specific set of research questions to keep ourselves on track as we seek in-formation to inform our decision making. Thus, the primary data we seek isin a form needed to answer a question, test a hypothesis, or in some waycontribute to better decision making. We would know, for example, that weneeded to measure consumer preferences because they were one of the cri-teria decision makers want to consider when choosing among decision al-ternatives (e.g., do consumers prefer product design A or design B). In otherwords, we do not “automatically” include any particular type of primarydata in our research—there must be a reason for its inclusion, which ulti-mately can be traced to its contribution to making better decisions.
FIGURE 4.1. Continuum of Answers to Research Questions
All Secondary Data Equal Parts Secondaryand Primary Data
All Primary Data
Research Studies Can Fall Anywhere on This Continuum

SOURCES OF PRIMARY DATA
Primary data originate from various sources. Some of the major sourcesare:
1. The organization itself. We generally think of the organization as asource of internal secondary information; however, the organizationcan also be a valuable beginning source of primary data for answeringresearch questions (e.g., a survey of the sales force).
2. The environment. The market environment includes customers andpotential customers, as well as competitors. Customers are very im-portant sources of information related to their demands and intentions.An emerging factor relative to the market environment is competition.Competition is increasing in importance and the next decade will beone of severe marketing warfare among competitors. Customers, andeven potential customers, can be surveyed and information can begathered from them much easier than from competitors. It is difficultto obtain information directly from competitors, however. Competitiveintelligence and analysis is an important type of primary data.
3. The distribution channel. Wholesalers, retailers, manufacturers, andvarious suppliers and users can be vital sources of information for anorganization. In fact, the role of wholesalers and retailers has in-creased greatly in importance in recent years in many product catego-ries.
TYPES OF PRIMARY DATA
Primary data come in a variety of forms. Some of the more commontypes of primary data are:
Demographic/Socioeconomic Data
Information such as age, education, occupation, marital status, sex, in-come, ethnic identification, social status, etc., are of interest to marketersbecause when combined with other types of primary data (e.g., consump-tion rates, attitudes, etc.), these descriptions help marketers profile targetmarket members or other groups of interest. Consequently, through mediaplans, channels of distribution, and other ways, marketing plans can reflectthe type of people who are our targets. In other words, this information isquite often of interest to us because the means by which we get our messageand product to our target market is most often described in terms of demo-graphic/socioeconomic data (e.g., magazine subscription lists, typical retailcustomers, TV viewers, etc.). The equivalent of demographics for industrial

marketers (e.g., sales volume, number of employees, location, North Amer-ican Industrial Classification System [NAICS] code, etc.) is likewise usedin combination with other information for targeting purposes.
Another reason for collecting this information is to test hypotheses thatare related to groupings of peopleby demographic/ socioeconomiccategory (e.g., young people willprefer concept A and middle-aged people will prefer conceptB; consumption rate is directlycorrelated with income; peoplewith college degrees do this be-havior more frequently than thosewith no college education, etc.).
Attitudes
Attitudes refer to a person’sfeelings, convictions, or beliefsfor an object, idea, or individual.Attitudes are a common object ofmeasurement for marketing re-searchers because it is believedthat they are precursors of behav-ior. While marketers are ulti-mately responsible for influenc-ing behavior, not just attitudes, we are not always able to observe andmeasure behaviors. For example, for a potential new product we may haveto measure attitudes toward the product concept instead of behavior towarda product that does not yet exist. Also, attitudes help us to understand whypeople behave as they do, and marketers always want to know why behavioroccurs, in addition to the frequency with which it occurs. Chapter 5 dis-cusses some of the more common means of measuring attitudes.
Psychographics/Lifestyle Data
This type of data is concernedwith people’s personality traits,what interests them, how theylive, and their values. It is some-times referred to as a person’sAIOs—activities, interests, andopinions. While empirical evi-
Please check the highest educationallevel you have achieved:
Less than high schoolHigh school graduateSome collegeCollege graduateSome graduate schoolPost-graduate degree
I like the taste of healthy foods.
Strongly AgreeAgreeNeither Agree or DisagreeDisagreeStrongly Disagree
If I have an hour of free time I wouldrather (check one):
Read a bookWatch TVPursue my hobbyTake a walk

dence linking someone’s personality with their purchase and consumptionbehavior is weak, marketers find that combining psychographics and life-style information with demographics provides a “three-dimensional” per-spective of a target market, permitting a much better focus to a marketingprogram.
Intentions
Intentions refer to theanticipated future behav-iors of an individual. Thisis a subject of interest tomarketers who factor theplanned behavior of theirconsumers heavily intomarketing plans. Inten-tions may be specific tothe research project under investigation, or may be the kinds of purchase in-tentions routinely measured by such organizations as the Survey ResearchCenter at the University of Michigan. While there will always be some dis-parity between what consumers say they will do, and what they actually do,marketers feel that obtaining some measure of planned future behavior isuseful in distinguishing the potential of several alternative offerings.
Awareness/Knowledge
Referring to what sub-jects do or do not knowabout an object of in-vestigation, awareness andknowledge is of interestto marketers who wish todistinguish the image, ex-perience, feelings, etc., ofconsumers who are famil-iar with a product fromthose who are not. If I aminterested in determining my brand’s image, for example, I want to first de-termine which consumers are aware of and knowledgeable about my brand.Other areas for determining awareness (unaided or aided) and extent ofknowledge are advertisement recall, retail store familiarity, manufacturers,country of product origin, and so on.
Read the product concept below and indicatethe likelihood you will buy such a product:
Definitely Definitely WillWill Purchase Not Purchase
___ ___ ___ ___ ___ ___ ___7 6 5 4 3 2 1
Which brands of riding lawn mowers have youever heard of? [Interviewer: Do not read list.Check all brands mentioned.]
John Deere WhiteSimplicity CaseCraftsman Lawn BoyOther: ___________________________

Motivations
Motives consist of inner states that direct our behavior toward a goal.Other terms used to describe motives are urges, drives, or impulses. Ourconcern with motives centers around an interest in why people act as theydo. When we ask respondents to indicate how important each of severalproduct attributes is in influencing their choice we are attempting to identifywhat motives are influencing their behavior. Other ways of assessing mo-tives include projective techniques (see Chapter 2), open-ended questionsasking why people acted as they did, and a variety of other exploratory, de-scriptive, or even causal techniques intended to probe the needs that channela person’s actions.
Behaviors
Behaviors are the actual actionstaken by respondents. Marketersmay have an interest in any num-ber of specific behaviors enactedby selected groups of respondents,but typically purchase and con-sumption behaviors are of signifi-cant interest. Obtaining informa-tion about a person’s behaviors might be accomplished through either self-report (e.g., asking someone to indicate how often they consume a particu-lar product), or through observation, either disguised or undisguised, of asubject’s behavior as it occurs.
How important are each of the following in influencing your choice of alaundry detergent for the first time?
VeryImportant
SomewhatImportant Important
Not VeryImportant
Not At AllImportant
Advertisement
ConsumerMagazine Test
Coupon
Friend or relative
Sale
Sample
How often do you go out to see amovie?
Less than once a monthOnce a monthTwo or three times a monthOnce a week or more

METHODS OF COLLECTING PRIMARY DATA
The design of any research project is developed to obtain answers to thequestions and objectives of the study. This will call for specific types of in-formation and also indicate specific methods of gathering the data. The pri-mary methods of collecting primary data are (1) communication and (2) ob-servation. Communication includes various direct approaches of askingquestions of respondents by either personal interview, telephone survey,electronic survey, or mail questionnaire. Observation, on the other hand, in-volves the process of viewing market situations either in the field or in labo-ratory settings. In this method of data collection, an observer records activi-ties of the entity being observed, either in a structured (descriptive or causalresearch) or unstructured (exploratory) fashion. Sometimes the actions ofinterest are recorded by mechanical devices instead of using an observer.
Choosing Between Observation and Communication Methods
How does a researcher know when to use communication or observationto collect primary data? Each approach has inherent advantages and dis-advantages that can affect the decision of when to appropriately use it forcollecting information.
Advantages and Disadvantages of the Communication Method
Communication methods have the advantages of versatility, speed, andcost. Versatility is the ability to cover a wide spectrum of types of primarydata. Examining our list of primary data types reveals that communicationis the preferred (and sometimes only) method of collecting information onattitudes, intentions, awareness/knowledge, motives, demographics/socio-economic, and behaviors (e.g., self-report of past behaviors). Obtaining ac-curate and truthful answers to questions on these topics is always a concern,but certainly communication methods are a versatile means of addressingthe need for information in such areas.
Communication also provides the benefits of speed and cost. These twobenefits are interrelated and refer to the degree of control the researcher hasover data collection. It is much faster and less expensive to develop ques-tions that ask people to recount their experiences (behaviors) than it is to setup an observational research process and wait for the behavior to occur inorder to record it. A telephone interviewer, for example, may conduct fourextensive interviews in the same hour the observational researcher is stillwaiting to observe the first relevant behavior.

Disadvantages of the communication method involve the lack of cooper-ation on the part of the research subject. Some subjects may either be unableor unwilling to answer questions. Perhaps worse than being unable to an-swer questions is when they do not recall the facts in questions yet invent ananswer so as to not disappoint the interviewer! Another disadvantage, then,is the bias in responses that may be introduced in the process of asking ques-tions. We will discuss this at greater length in Chapter 8.
Advantages and Disadvantages of the Observation Method
Observation has several advantages over the communication method.The disadvantages of the communication method—inability or unwilling-ness for subject to communicate, interviewer bias—are not present with ob-servation. Also, some types of behavior, such as observing small children atplay or solving problems, lend themselves much more readily to observa-tional study than communication. Observational information is thought tohave an advantage over communication in objectivity and accuracy. Sub-jects wishing to portray themselves in the most positive light will respond toquestions accordingly, but when unknowingly observed, a record of theirbehavior may reflect more objectivity and accuracy. Also, descriptive ob-servational research, such as scanner data from a supermarket, generatesmore accurately and objectively determined data than achieved by commu-nication (e.g., trying to recall purchases and list them on a questionnaire).
Two disadvantages characterize the observation method. First, some in-formation internal to subjects such as attitudes, intentions, motives, etc., cannot be observed. It is important to remember this when tempted to attributesuch things to people based on an observation of their behavior. For exam-ple, you might observe someone examining the back of a food carton andbelieve they are studying the product’s nutritional content when they werelooking for the name of the producer. Second, the observed behavior mustbe of short duration and occur frequently enough to permit a cost-effectiveplan for its measurement.
Often communication may be productively combined with observationto gain the benefits of both, with none of the disadvantages, since the dis-advantages of one method are the advantages of the other. The usual se-quence would be to observe behavior and then ask questions about whythe person behaved as he or she did. For example, if a company were try-ing to build a better infant highchair they might observe mothers feedingtheir infants using currently available brands, then ask what they liked ordisliked about them, why they performed particular acts in using the high-chairs, etc.

COMMUNICATION METHODS
At the risk of repeating ourselves, we will note that the communicationmethod (and observation too) can be used for information collection usingexploratory, descriptive, or causal research designs. As we have already in-dicated, the most commonly used communication method, the survey, canbe used in all three research designs, although it is most commonly thoughtof as a primary tool of descriptive research. We will discuss a common ex-ploratory research communication method—focus groups—then discussthe descriptive communication survey research method.
Exploratory Communication—Focus Group Interviewing
One of the most popular exploratory research techniques, focus group in-terviewing, consists of a small group of people (usually eight to twelve) as-sembled for the purpose of discussing in an unstructured, spontaneous man-ner topics introduced by a group moderator. The objective of conductingfocus groups is not to accomplish the goals of a survey, but to conduct one ata lower cost. In fact, focus groups, as an exploratory research technique,cannot be substituted for a descriptive research’s survey design. Focusgroups are a popular technique and when appropriately used, they can effec-tively and efficiently achieve the following goals of exploratory research:
• Generate new ideas or hypotheses, which can be tested in later phasesof the research study
• Clarify concepts, actions, or terms used by consumers• Prioritize issues for further investigation• Provide an opportunity for management to see how their “real” con-
sumers think, feel, and act• Obtain an “early read” on changing market trends
Research Project Tip
When writing up the preliminary results of your research you should de-scribe the methodology you used in detail. It is not enough, for example,to say you conducted a search of the literature and then completed fourin-depth interviews with consumers. You should describe the databasesyou used in your search, the key words used in searching the computerdatabases (e.g., LEXIS/NEXIS), include a photocopy of the printout ofthe results of the search (e.g., articles list, abstracts, or first page of pub-lished article or report). In-depth interviews indicate the criteria you usedin selecting people to interview, a description of the people interviewed,a copy of interview guides, etc.

Focus groups are good at accomplishing such objectives because theirrelatively unstructured approach permits a free exchange of ideas, feelings,and experiences to emerge around a series of topics introduced by a modera-tor. The moderator works from a topic outline that covers the major areas ofinterest to the client firm, but because each group session consists of differ-ent individuals with their own feelings, desires, opinions, etc., no two ses-sions with the same agenda will be exactly the same in conduct or findings.The term focus group is used because the moderator focuses the group’s at-tention on the predetermined subjects, without letting the discussion go toofar afield. However, it is considered unstructured in the sense that a goodmoderator will consider the particular dynamics of each group when intro-ducing these topics and the order in which they are brought up for discus-sion. Because they are so frequently used in marketing research, severalbooks have been exclusively devoted to a discussion of how to conduct andanalyze focus group sessions.1 We will confine our discussion here to a fewof the more important aspects of using focus groups as a qualitative explor-atory research approach.
Why Conduct Focus Groups?
The standard reasons for conducting focus groups include:Idea Generation. Consumers or knowledgeable experts may provide a
good source of new products or other ideas in the fertile environment of agroup setting.
Reveal Consumers’ Needs, Perceptions, Attitudes. Probing consumerson why they think or act the way they do may reveal less obvious, but no lessimportant, reasons for their behavior.
Help in Structuring Questionnaires. Hearing the way consumers thinkand talk about a product, activity, or consumption experience not only gen-erates hypotheses that might be tested in a descriptive research design, butalso informs the researcher about how to word questions in ways directlyrelevant to the consumer’s experience.
Some less frequently mentioned reasons for conducting focus groups in-clude:
Postquantitative Research. Focus groups are most often mentioned as re-search done prior to a survey, but they might be of equal value in helping re-searchers to “put flesh on the bones” of quantitative research. Discoveringthat a certain percentage of consumers behave in a particular fashion maymake it desirable to probe a group of those consumers in some depth to dis-cover why and how they came to act in that manner.
Making the Abstract Real. One of the most memorable qualities of focusgroups is their ability to make “real” what was heretofore only considered in

a very abstract manner. For example, it is one thing for a product manager ofa brand of dog food to know that many dog owners really love their dogs. Itis quite another for that product manager to see dog owners in a focus grouptake obvious delight in recounting their Ginger’s latest adventure with a rac-coon, or grow misty-eyed in remembering Biff, now dead ten years, or hearthe soft lilt in their voice as they describe the relationship they have withJason, their golden retriever. Attendance at a focus group can infuse lifelessmarket data with new meaning and make its implications more memorableand meaningful. One checklist for management using focus groups to ob-tain a more “three-dimensional” understanding of their actual customers in-cludes the following advice:2
1. Do not expect the people in the focus group to look like “idealizedcustomers.” Fitness seekers may not look like aerobic instructors—they are just trying to.
2. It can be shocking to find that your customers may not like you verymuch. Listening to what they have to say about your company’s prod-ucts and personnel and your ideas can be ego-bruising. You cannot ar-gue with them—be prepared to listen to the good and bad news.
3. Your customers are unlikely to think or care as much about your prod-uct as you do. It may be what you worry about for ten hours a day, butnot them.
4. Do not expect focus group participants to be just like you are—or to betotally different either.
5. People are not always consistent in what they say. That does not meanthey are liars or hypocrites—just human.
6. Your moderator is a good resource to put the study in a context withother research he or she has done. Are the responses more or less posi-tive than he or she has seen in other focus groups?
7. If your screening process was effective, you are looking at realcustomers—whether you like what you see or not.
8. Be honest about what you expected to see. We all have preconcep-tions, just ask whether yours are based on research or prejudice.
Reinforcing Beliefs. Judith Langer recounted an experience by TheGillette Company, which illustrated the ability of focus groups to convey amessage much more powerfully to employees than repeat admonitions bymanagement:
A focus group with women showed that consumers are more de-manding and “educated” about quality than in the past. This commentwas typical:

“I think as consumers we’re becoming more aware of what goesinto a product. For myself, I have become more aware of the ingredi-ents—food or clothing or whatever. I feel that I’m not the same shop-per I was perhaps six years ago. That was just fad buying. Now I lookat something.”
Marketing, market research, and research and development peopleobserve the group; the videotape of the session has since been shownto others in the company. Hans Lopater, Gillette’s research director,says that the focus group made what top management has been sayingmore tangible and believable.3
Early Barometer. Focus groups may provide an early warning system ofshifts in the market. Probing consumers on lifestyle changes, consumptionpatterns, opinions of new competitive entries, etc., may reveal threats andopportunities entering the market long before they might be revealed in alarge-scale survey. Keeping an open mind and maintaining an active curios-ity allow for researchers to see the far-reaching significance of seeminglyinnocuous observations made by focus group participants.
Focus Group Composition
Conventional industry wisdom suggests that focus groups should consistof eight to twelve people selected to be homogeneous along some character-istic important to the researcher (e.g., do a lot of baking, own foreign luxurycars, manage their own retirement account with more than $100,000 in-vested, etc.). Usually recruitment of focus group participants strives to findpeople who fit the desired profile but who do not know each other—thus re-ducing the inhibitions of group members to describe their actual feelings orbehaviors. Typically, group sessions last from one and a half to two hours.Going against such conventional wisdom may be necessary in some cases.For example, one of the authors conducted research for a food company thatwanted a few direct questions asked prior to presenting participants withprepared versions of their food products, as well as their competitor’s.While not a taste test per se, the client wanted to hear the subjects’ reactionsto the products and a discussion of the circumstances under which the prod-ucts would be used in their homes. For this study a series of one-hour groupsessions were run with five people per group. The more structured discus-sion and the desire to query each participant made the shorter time andsmaller group more conducive to achieving the study’s objectives.
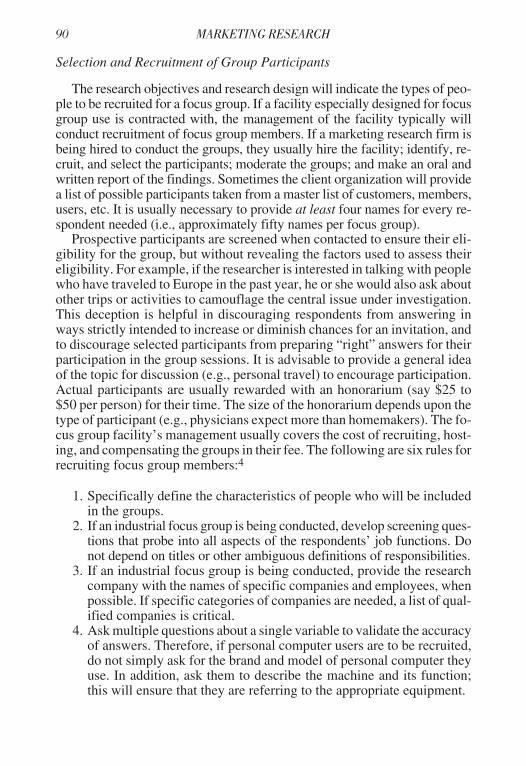
Selection and Recruitment of Group Participants
The research objectives and research design will indicate the types of peo-ple to be recruited for a focus group. If a facility especially designed for focusgroup use is contracted with, the management of the facility typically willconduct recruitment of focus group members. If a marketing research firm isbeing hired to conduct the groups, they usually hire the facility; identify, re-cruit, and select the participants; moderate the groups; and make an oral andwritten report of the findings. Sometimes the client organization will providea list of possible participants taken from a master list of customers, members,users, etc. It is usually necessary to provide at least four names for every re-spondent needed (i.e., approximately fifty names per focus group).
Prospective participants are screened when contacted to ensure their eli-gibility for the group, but without revealing the factors used to assess theireligibility. For example, if the researcher is interested in talking with peoplewho have traveled to Europe in the past year, he or she would also ask aboutother trips or activities to camouflage the central issue under investigation.This deception is helpful in discouraging respondents from answering inways strictly intended to increase or diminish chances for an invitation, andto discourage selected participants from preparing “right” answers for theirparticipation in the group sessions. It is advisable to provide a general ideaof the topic for discussion (e.g., personal travel) to encourage participation.Actual participants are usually rewarded with an honorarium (say $25 to$50 per person) for their time. The size of the honorarium depends upon thetype of participant (e.g., physicians expect more than homemakers). The fo-cus group facility’s management usually covers the cost of recruiting, host-ing, and compensating the groups in their fee. The following are six rules forrecruiting focus group members:4
1. Specifically define the characteristics of people who will be includedin the groups.
2. If an industrial focus group is being conducted, develop screening ques-tions that probe into all aspects of the respondents’ job functions. Donot depend on titles or other ambiguous definitions of responsibilities.
3. If an industrial focus group is being conducted, provide the researchcompany with the names of specific companies and employees, whenpossible. If specific categories of companies are needed, a list of qual-ified companies is critical.
4. Ask multiple questions about a single variable to validate the accuracyof answers. Therefore, if personal computer users are to be recruited,do not simply ask for the brand and model of personal computer theyuse. In addition, ask them to describe the machine and its function;this will ensure that they are referring to the appropriate equipment.

5. Do not accept respondents who have participated in a focus group dur-ing the previous year.
6. Have each participant arrive fifteen minutes early to complete aprediscussion questionnaire. This will provide additional backgroundinformation on each respondent, reconfirm their suitability for the dis-cussion, and help the company collect useful factual information.
Moderator Role and Responsibilities
The moderator plays a key role in obtaining maximum value from con-ducting focus groups. The moderator helps design the study guide, assiststhe manager/researcher who is seeking the information, and leads the dis-cussion in a skillful way to address the study’s objectives while stimulatingand probing group participants to contribute to the discussion. The follow-ing are ten traits of a good focus group moderator.5
1. Be experienced in focus group research.2. Provide sufficient help in conceptualizing the focus group research
design, rather than simply executing the groups exactly as specified.3. Prepare a detailed moderator guide well in advance of the focus
group.4. Engage in advance preparation to improve overall knowledge of the
area being discussed.5. Provide some “added value” to the project beyond simply doing an
effective job of conducting the session.6. Maintain control of the group without leading or influencing the par-
ticipants.7. Be open to modern techniques such as visual stimulation, conceptual
mapping, attitude scaling, or role-playing, which can be used todelve deeper into the minds of participants.
8. Take personal responsibility for the amount of time allowed for therecruitment, screening, and selection of participants.
9. Share in the feeling of urgency to complete the focus group while de-siring to achieve an excellent total research project.
10. Demonstrate the enthusiasm and exhibit the energy necessary tokeep the group interested even when the hour is running late.
Reporting the Results of Focus Groups
In writing the findings of focus groups, care must be taken not to implythat results typify the target population. The groups were not formed in aneffort to generate inferential statistics, but rather to clarify concepts, gener-

ate ideas and insights, make the abstract real, etc. Therefore, it is the qualita-tive rather then quantitative conclusions that should be the focus of the writ-ten report. Goldman and McDonald make the following suggestions aboutwriting the report on focus group findings:6
1. The report should not be a sequential summary or transcript of the ses-sions, but rather a “logically organized and coherent interpretation ofthe meaning of these events.”
2. The report should begin with an introductory section that reviews theresearch purpose, research objectives, and a short description of theresearch methodology. This is followed by a report of findings, themarketing implications, recommendations, and suggestions for futureresearch phases.
3. An “Executive Summary” at the beginning of the report should coverthe major discoveries as well as the relevant marketing implicationsthat can be justifiably concluded based on the qualitative research re-sults.
4. The results section is not necessarily best done by following the se-quence of topics covered in the discussions. It may rather be ap-proached as focusing on marketing problems or market segments, anddiscuss the findings from the groups that might have been addressedin diverse order during the group sessions.
5. The written analysis should progress from the general to the more spe-cific. For example, a report on a new snack product concept mightstart with a discussion of general observations about snack eating,then go to a discussion of brand image and loyalty, then address the re-sponse to the new snack concepts.
6. The marketing implications section should provide guidance for thedevelopment of marketing response to the findings without overstat-ing the conclusiveness of the qualitative findings. Everyone, reportwriters and readers, should remain aware of the limited objectives forconducting the groups, as well as the limitations of this type of re-search method in general.
Trends in Focus Groups
Several new variations in the traditional focus group approach are beingsuccessfully used by some companies. One is two-way focus groups, whichinvolves conducting a focus group, then having a specific group of respon-dents interested in the comments of the first focus group view the video ofthe focus group during their own focus group session. This approach couldbe expanded to a three-way focus group setting. One of the authors of this

text worked with a company that supplied food products to fine restaurantsthat used a three-way focus group approach. In this instance the first groupconsisted of patrons of expensive restaurants talking about their experi-ences at such restaurants. The video of these consumers was then viewed ina focus group of chefs and restaurant managers who commented on whatthey were seeing and were asked what they might do to address the needs ofthese consumers. The video of the chef’s focus group was then observed bythe food brokers used by the food service company who talked about whatthey could do differently to better serve the needs of the chefs. Managersfrom the sponsoring food service company attended all three focus groups(multiple groups of each “level” of focus groups were conducted).
Quads is another variation of focus groups that has been used. In thesegroups usually four respondents (hence the name quads) discuss a limitedset of topics, perhaps engage in a taste test, and might complete a short eval-uation of products. These take less time to complete than the usual focusgroup (less than one hour as opposed to one and one half to two hours), al-lowing for more of these to be conducted in an evening than traditional fo-cus groups. The attraction of these quads is the ability to get 100 percentparticipation of respondents (in a ten person focus group participation byeach person is more limited) on a short, specific set of issues, allowing ob-servers to more easily focus on the differences in responses and generate hy-potheses regarding those observations. Conducting more groups allows formore “fine tuning” of discussion questions and methodology and changes tobe made from one group session to the next. Both two-way and quad varia-tions of focus group approaches (and many more variations practiced by re-search firms) illustrate the flexibility inherent in conducting good explor-atory communication research.
Internet focus groups are rapidly gaining in popularity. Internet focusgroups are, like all focus groups, an exploratory research technique that cap-italizes on the efficiency afforded by the Internet to engage people in di-verse geographic locations together in a discussion of a topic of interest tothe researcher and participants. Such groups can be conducted within acompany with employees or externally with customers or members of a tar-get market. If confidentiality is a concern with employees, they can use ahyper-link embedded in e-mail to go to a secure Web site where they canparticipate anonymously.
Internet focus groups with consumers have an obvious advantage in costsavings over traditional focus groups (approximately one-fifth to one-halfthe cost) as well as allowing for greater diversity among participants. Partic-ipants may in some situations be able to enter their input and reactions toother participants anytime during the extended focus group time frame—twenty-four hours a day. Use of IRC (Internet Relay Chat) and/or Web chatsites make it easy for participants to contribute to a discussion set up at that

specific site for a specific purpose. It is then possible to immediately gener-ate transcripts of twenty to thirty pages of verbatim responses for analysis.Advantages include speed of recruitment, savings in travel costs and timeaway from the office, respondents are able to participate from the comfortof their own home, and anonymity of responses. Disadvantages include aloss of observable information (e.g., facial expressions, body language,sense of excitement, confusion, etc.), which veteran focus group modera-tors use in analyzing traditional group sessions. Also, it is not possible to en-sure that the person engaging in the focus group session is really the personyou wanted. It is not possible to effectively screen people for certain desir-able and easily verifiable characteristics (e.g., age, gender, racial back-ground, etc.), and be certain the person on the Internet actually fits the de-sired profile. Also, unless the topic is about the use of the Internet itself, thepeople who are available for Internet focus groups may or may not be repre-sentative of the complete target market.
Some research companies operate Internet focus groups by recruitingand building a database of respondents from screening people visiting theirWeb site or through other recruitment methods. These people are then pro-filed through a series of questions, which allows the research firm to selectrespondents with the characteristics desired by the client organization. Po-tential respondents are e-mailed, asking them to go to a particular Web siteat a particular time (using a hyperlink embedded in the e-mail). The “mod-erator” types in questions and responds, probes, and clarifies during the ses-sion by typing in queries. For an example of a company doing these types offocus groups visit <www.greenfieldonline.com>.
Sequencing of Focus Groups and Surveys
While the usual sequence of focus groups and surveys is to do focusgroups first to generate hypotheses and then a descriptive survey to test thehypotheses, there are some advantages to doing focus groups after descrip-tive research as well as before. Advantages of conducting focus groups afterdoing descriptive research are:
1. Managers are not as likely to be unduly influenced by anomalous re-sponses. When you have already determined the frequency withwhich certain behaviors are performed, you have a perceptual frame-work to use when listening to people describe their behavior and themotives behind it. When you hear something that deviates signifi-cantly from the norm you do not have to wonder if the person repre-sents a significant number of people in the market, you already knowthe frequencies with which such behavior is performed. You can con-centrate on probing to understand the relevant behavior.
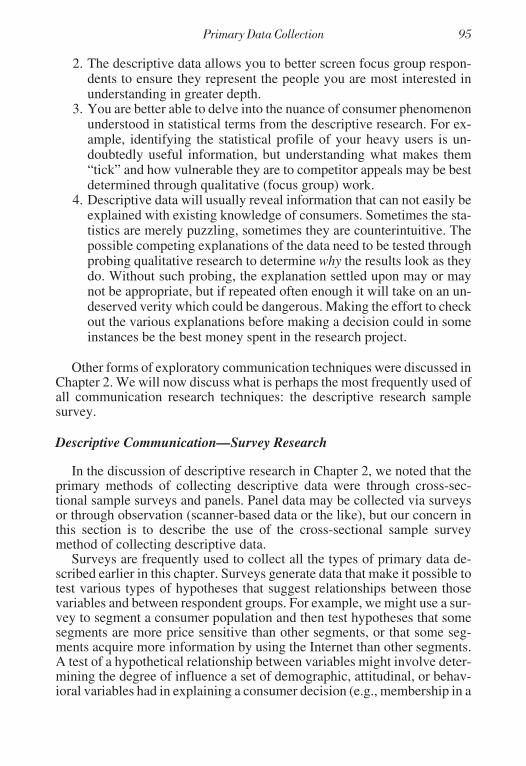
2. The descriptive data allows you to better screen focus group respon-dents to ensure they represent the people you are most interested inunderstanding in greater depth.
3. You are better able to delve into the nuance of consumer phenomenonunderstood in statistical terms from the descriptive research. For ex-ample, identifying the statistical profile of your heavy users is un-doubtedly useful information, but understanding what makes them“tick” and how vulnerable they are to competitor appeals may be bestdetermined through qualitative (focus group) work.
4. Descriptive data will usually reveal information that can not easily beexplained with existing knowledge of consumers. Sometimes the sta-tistics are merely puzzling, sometimes they are counterintuitive. Thepossible competing explanations of the data need to be tested throughprobing qualitative research to determine why the results look as theydo. Without such probing, the explanation settled upon may or maynot be appropriate, but if repeated often enough it will take on an un-deserved verity which could be dangerous. Making the effort to checkout the various explanations before making a decision could in someinstances be the best money spent in the research project.
Other forms of exploratory communication techniques were discussed inChapter 2. We will now discuss what is perhaps the most frequently used ofall communication research techniques: the descriptive research samplesurvey.
Descriptive Communication—Survey Research
In the discussion of descriptive research in Chapter 2, we noted that theprimary methods of collecting descriptive data were through cross-sec-tional sample surveys and panels. Panel data may be collected via surveysor through observation (scanner-based data or the like), but our concern inthis section is to describe the use of the cross-sectional sample surveymethod of collecting descriptive data.
Surveys are frequently used to collect all the types of primary data de-scribed earlier in this chapter. Surveys generate data that make it possible totest various types of hypotheses that suggest relationships between thosevariables and between respondent groups. For example, we might use a sur-vey to segment a consumer population and then test hypotheses that somesegments are more price sensitive than other segments, or that some seg-ments acquire more information by using the Internet than other segments.A test of a hypothetical relationship between variables might involve deter-mining the degree of influence a set of demographic, attitudinal, or behav-ioral variables had in explaining a consumer decision (e.g., membership in a

health club). As we will see in our chapters on data analysis, statistical ana-lytical techniques to test such hypotheses require that the data being ana-lyzed be collected through descriptive or causal data collection methods,and most frequently the method for descriptive research is a survey.
SURVEY METHODS
Descriptive research surveys can be conducted in a variety of ways usingmany combinations of people and electronics and conducted in a variety oflocations. Table 4.1 displays a few of the types of survey delivery methodspossible from such combinations. We will first discuss the more “tradi-tional” methods of conducting surveys by telephone, mail, or in person,then discuss some of the newer ways these methods and the computer andfax technologies are being used in survey research.
Telephone Interviewing
Telephone interviewing is usually employed when the study design requiresspeedy collection of information from a large, geographically dispersed popu-lation that would be too costly to do in person; when eligibility is difficult (ne-cessitating many contacts for a completed interview); when the questionnaire isrelatively short; or when face-to-face contact is not necessary.
From the Home
In this case, interviewing is conducted directly from the interviewer’shome. The interviewer has all the materials that will be needed to complete
TABLE 4.1. Survey Delivery Methods
Human/Electronic InvolvementLocationof Interaction Telephone Mail Personal
Computeror Fax
Home WATS or IVR Self-adminis-tered or pan-els
Door to door Internet ordisk by mail
Work WATS or IVR Self-adminis-tered or lockbox
Executiveinterview
Internet orfax
Malls — — Mall inter-cept
Computerassisted
Central LocationResearchFacility
— — On-site Computerassisted

an assignment in his or her home and use the specified period (per instruc-tions) on the telephone contacting respondents and conducting interviews.
From Central Location Phone Banks
A research firm may conduct interviewing from its facilities equippedwith wide area telephone service (WATS). Central location interviewinghas many advantages. It allows for constant monitoring and supervision. Ifan interviewer has a problem or question, it can be handled on the spot. Mis-takes can be corrected; respondents can be called back immediately if thesupervisor finds that the interviewer’s information is not complete. Inter-views can be monitored to ensure correct interviewing procedures and tech-niques, and that quotas are being filled. Since telephone interviewing is themost commonly used method of data collection, a detailed discussion on thespecific procedures of telephone interviewing is located in Chapter 8.
Most market research companies now use some form of computer-assistedtelephone interviewing (CATI) system. The survey instrument or question-naire is programmed into a computer, and the “pages” of the questionnaireappear on the terminal screen in front of the interviewer. The interviewercan input the results either through the keyboard or in some cases by usingan electronic light pen that can touch the appropriate response on the screen.The CATI System also provides for automatic skip patterns, immediate datainput, and in some cases automatic dialing. This system promotes flexibilityand simplification. In addition, increased speed and improved accuracy ofthe data are accomplished. Various programs of random-digit dialing can beattached to the CATI system. The computer-generated random-digit num-bers can eliminate the sampling bias of unlisted numbers.
Predictive dialing is another important feature that makes telephone in-terviewing more effective. With predictive dialing, the technology does thedialing, recognizes a voice response, and switches to the caller so fast thatthe interviewer virtually hears the entire “hello.” The system predicts howmany dials to make to keep the interviewing staff busy without spendingover half of their time just making contact. The system automatically redialsno-answer and busy numbers at specified intervals. Some predictive dialingsystems can be set to identify answering machines automatically and re-schedule those calls as well. This results in more efficient calling and higherpenetration of the sample list.
Increasingly, research firms are turning to Interactive Voice Response(IVR) systems to conduct surveys by phone. In this approach respondentsdial a toll-free number and respond to recorded questions either with a lim-ited set of voice responses indicated (e.g., “Please answer by saying home,work, or both.”), or by using the designated buttons on a touch-tone phone.Respondents may be members of a major panel (e.g., Market Facts, Na-

tional Family Opinion, or Home Testing Institute), or just responding to aone-time survey. The use of IVR, or Completely Automated TelephoneSurveys (CATS), has been used to get quality data very quickly and has theadvantage of letting respondents call anytime to answer the survey.
The advantage of having an interviewer ask questions of a respondent us-ing a WATS line is, of course, the ability to ask open-ended questions whereprobing for response is needed and answer respondent questions or provideclarification when necessary. These needs may sometimes be greater thanthe needs for the speed and cost savings of the IVR approach.
Telephone Communication
As compared to personal or mail interviewing, telephone interviewshave the advantage of speed and relative economy. Interviews of this typeare also easily validated and the personal interaction of a qualified inter-viewer maintains a relatively high degree of control. The proper sequencingof question response also can be maintained. While not as flexible and pro-ductive as a personal interview, a well-designed questionnaire administeredby a skilled interviewer can gather relatively comprehensive information.The interviewer also is in a position to probe at appropriate times and followappropriate skip patterns. Weaknesses of the telephone interview are its in-ability to be as long or as detailed as personal interviews and its inability toshow the respondent any products, pictures, or lists. Specific advantagesand disadvantages of telephone interviewing are listed in Table 4.2.
TABLE 4.2. Advantages and Disadvantages of Telephone Interviewing
Advantages Disadvantages
1. Provides ease of making a contact(callback) with a respondent.
1. Exhibits cannot be shown unless amail/phone or phone/mail/phonemethodology is used.
2. Administration and close super-vision is provided by professionalstaff at a central telephone center.
2. Question limitations such as limitedscales.
3. Drawing representative samples ofpersons with telephones is relativelyeasy.
3. Long interviews are difficult toadminister by telephone.
4. Sequential disclosure, and question-naire flexibility with skip patterns,refer backs, etc., is possible.
5. Speed in gathering information.6. Relatively low cost.7. Simplicity at conducting a pretest.8. Access to hard-to-reach people.

Mail Surveys
Mail surveys are commonly used in either ad hoc (one time) or mailpanel research. In ad hoc research projects a sample of respondents is cho-sen to be representative of the population of interest and a questionnaire issent by mail. The mail questionnaire may be preceded by and/or followedby a telephone call intended to encourage participation. The combination oftelephone and mail is an attempt to reduce the high rate of nonresponse thatplagues ad hoc, and to a lesser degree panel, mail surveys.
When mail is used in surveying people at work a lockbox approach issometimes used to avoid secretaries or assistants completing a survey in-tended for an executive. Here an accompanying letter tells the respondentthe purpose of the survey and that the box is a gift, but the combination willbe provided at the time of a phone interview. The respondent opens the boxat a scheduled interview time, completes the interview and, in some in-stances, returns the survey by mail.
Mail surveys are sometimes dropped off at homes or work sites with theintent of having the respondent complete the questionnaire and return it bymail. Such an approach has been shown to increase response rates and hasthe advantage of allowing the person dropping off the questionnaire to ex-plain the purpose of the interview.
Mail questionnaires allow for wide distribution. Also, the lack of inter-viewer/respondent interaction can give the feeling of anonymity that canencourage accurate response to relatively sensitive questions. In theory, therespondent has time to check records or even confer with someone else tomake sure reported information is accurate. Disadvantages include a low re-sponse rate that results in nonresponse error. Control of the sample is mini-mal. Knowing the difference in results between those who participated andthose who did not is not possible. Too often participants are those who areeither more interested in the subject area or who have more free time to fillout questionnaires. Also, a mail survey is slow, less flexible, and does notallow for probing. Control is lost with a mail questionnaire and sequencingis difficult. Furthermore, researchers never actually know who completedthe questionnaire. Many of these problems can be overcome through the useof mail surveys conducted by consumer panel organizations (see Chap-ter 2). Table 4.3 lists the advantages and disadvantages of mail surveys.
Personal Interviewing
This face-to-face method is employed when the survey may be too longto conduct over the telephone or there might be material to show the respon-dent. Personal interviews are effective when the interviewer is placing aproduct in a home or office; the respondent is tasting a product; or the sam-ple necessitates contacting homes in a specific manner, such as every fourth

home or going to every home until an interview is conducted, then skippinga specified number of homes before attempting the next contact as well asother applications.
Personal interviews allow for more in-depth probing on various issuesand are the most productive, accurate, comprehensive, controlled, and ver-satile types of communication. There is ample opportunity for a well-trained interviewer to probe and interpret body language, facial expression,and other nuances during the interaction. Rapport can be developed thatwould put the interviewee at ease and gain his or her cooperation. The inter-viewer can explain any misunderstanding the respondent might have andkeep the respondent on track and in sequence in responding to the question-naire. In spite of the advantages of greater depth and productivity, the per-sonal interview does take more time and money to administer. The advan-tages and disadvantages of personal interviewing are listed in Table 4.4.
There are several varieties of personal interviews. The most commonare:
Door-to-Door Interviewing
In door-to-door interviewing, the client or field-service director will as-sign an interviewing location and often the exact address at which to begin.The interviewer then takes a specific direction in order to contact respon-
TABLE 4.3. Advantages and Disadvantages of Mail Surveys
Advantages Disadvantages
1. Cost-effective.
2. Efficiency in reaching largesamples.
3. Access to hard-to-reach peo-ple.
4. Self-administered/no inter-viewer bias.
5. Limited use of exhibits ispossible.
1. Low return rate.
2. Nonreturn bias; those who return a mailquestionnaire may not represent thesample as a whole.
3. No control of who fills out the question-naire.
4. No ability for sequential disclosure ofinformation.
5. Slow response.
6. Hard to pretest.
7. Question limitations.

dents according to the sample pattern that is specified to be followed. Theinterviewer will ask the questions and record the respondent’s answers ei-ther during the interview or immediately afterward.
Central Location/Mall Interviewing
The use of a central location or mall area is effective in instances whererespondents will taste a product, look at a package design, view a commer-cial, or listen to a recording or view a videotape and report their impres-sions. Shopping malls are frequently used because of their high volume oftraffic. Other central locations such as a church meeting hall, hotel, or otherfacility might be used to conduct a large number of personal interviews.When this method of personal interviewing is used, the respondents aregenerally recruited in advance. Shopping malls may be used as locations forprearranged interviews or involve “intercepts” where shoppers are recruitedin the mall for the interviews.
Vendor/Dealer/Executive/Professional Interviewing
Interviewing of executives at their places of business is the business-to-business marketing research equivalent to consumer door-to-door inter-viewing. Locating people of interest to the researcher by title or name can beexpensive and time-consuming if an accurate list is not available from a listvendor. Once identified, respondents must be contacted, an appointmentscheduled for the interview, and then the survey can be administered in per-son at the workplace. Highly trained interviewers who are appropriately
TABLE 4.4. Advantages and Disadvantages of Personal Interviewing
Advantages Disadvantages
1. Exhibits such as ads, packages,pictures can be shown.
1. High cost
2. Flexibility and versatility. 2. Interviewer bias.
3. Speed can be accomplished withmultiple interviews being completedin multiple locations.
3. Administration/execution prob-lems.
4. Sampling can be done in a very repre-sentative way.
5. Observation of the respondent allowsfor viewing behavior as well as askingquestions.

dressed and knowledgeable about the topic are much more likely to be suc-cessful in obtaining response, so this type of interviewing can be costly.
See Figure 4.5 for the strengths and weaknesses of the “traditional”means of surveying respondents.
Computer or Fax Survey
It is not uncommon for the computer to be used in telephone (CATI) in-terviewing, personal interviews conducted at shopping malls, or at a centrallocation. See Table 4.6 for a summary of the various ways the computermay be used in survey research. See Table 4.7 for benefits achieved throughthe various computer-assisted survey methods.
Internet Research
Earlier in this chapter we discussed the use of the Internet for doing ex-ploratory research in the form of Internet focus groups. We will now discussthe use of the Internet for conducting survey research.7 (Chapter 8 will dis-cuss a firm that specializes in Internet survey research.) Some of the newer,Internet and facsimile based approaches will be discussed here. Several rea-sons have been suggested for explaining the rise in the use of the Internet forconducting surveys. First, the questionnaire can be created, distributed torespondents, and electronically sent to the researcher very quickly. Sincedata are electronically delivered, statistical analysis software can be pro-
FIGURE 4.5. Strengths and Weaknesses of Methods of Data Collection
Interviewing Questionnaire
Personal TelephoneSelf-
Administered Mail Back
Response Rate Moderateto High
Moderateto High
High Low to High
Timing Slow Fast Moderate Slow
Cost/Coverage High Moderate Low Low
Interviewer Impact(bias)
High Moderate Low Low
Ability to handlecomplex questions
High Low Moderate Moderate
Control High High Low Low
Length Long Short Long Long
Sample Control High High Moderate Low
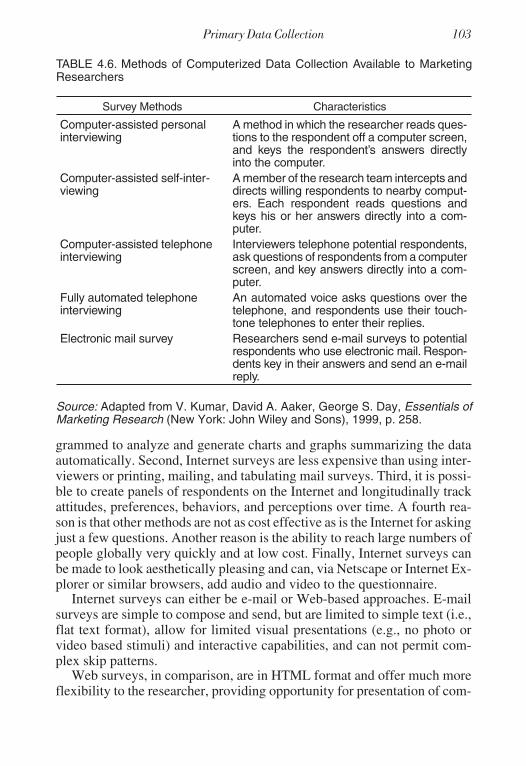
grammed to analyze and generate charts and graphs summarizing the dataautomatically. Second, Internet surveys are less expensive than using inter-viewers or printing, mailing, and tabulating mail surveys. Third, it is possi-ble to create panels of respondents on the Internet and longitudinally trackattitudes, preferences, behaviors, and perceptions over time. A fourth rea-son is that other methods are not as cost effective as is the Internet for askingjust a few questions. Another reason is the ability to reach large numbers ofpeople globally very quickly and at low cost. Finally, Internet surveys canbe made to look aesthetically pleasing and can, via Netscape or Internet Ex-plorer or similar browsers, add audio and video to the questionnaire.
Internet surveys can either be e-mail or Web-based approaches. E-mailsurveys are simple to compose and send, but are limited to simple text (i.e.,flat text format), allow for limited visual presentations (e.g., no photo orvideo based stimuli) and interactive capabilities, and can not permit com-plex skip patterns.
Web surveys, in comparison, are in HTML format and offer much moreflexibility to the researcher, providing opportunity for presentation of com-
TABLE 4.6. Methods of Computerized Data Collection Available to MarketingResearchers
Survey Methods Characteristics
Computer-assisted personalinterviewing
A method in which the researcher reads ques-tions to the respondent off a computer screen,and keys the respondent’s answers directlyinto the computer.
Computer-assisted self-inter-viewing
A member of the research team intercepts anddirects willing respondents to nearby comput-ers. Each respondent reads questions andkeys his or her answers directly into a com-puter.
Computer-assisted telephoneinterviewing
Interviewers telephone potential respondents,ask questions of respondents from a computerscreen, and key answers directly into a com-puter.
Fully automated telephoneinterviewing
An automated voice asks questions over thetelephone, and respondents use their touch-tone telephones to enter their replies.
Electronic mail survey Researchers send e-mail surveys to potentialrespondents who use electronic mail. Respon-dents key in their answers and send an e-mailreply.
Source: Adapted from V. Kumar, David A. Aaker, George S. Day, Essentials ofMarketing Research (New York: John Wiley and Sons), 1999, p. 258.
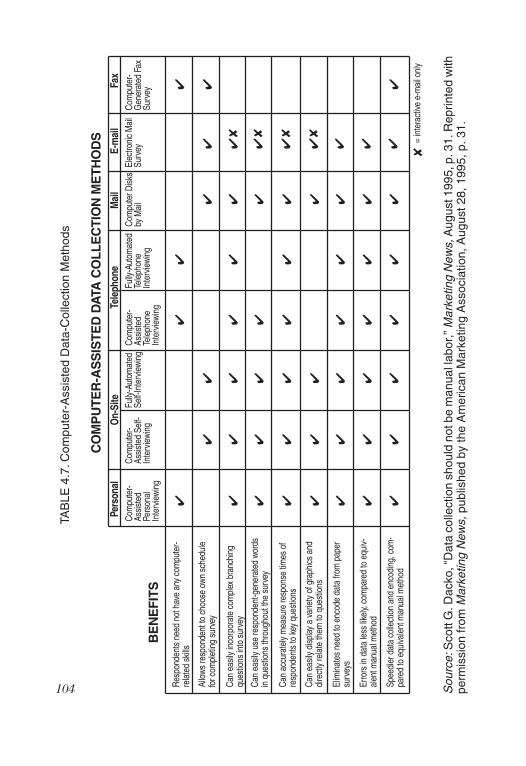
CO
MP
UTE
R-A
SS
ISTE
DD
ATA
CO
LLE
CTI
ON
ME
THO
DS
BE
NE
FITS
Pers
onal
On-
Site
Tele
phon
eM
ail
E-m
ail
Fax
Com
pute
r-As
siste
dPe
rson
alIn
terv
iewi
ng
Com
pute
r-As
siste
dSe
lf-In
terv
iewi
ng
Fully
-Aut
omat
edSe
lf-In
terv
iewi
ngCo
mpu
ter-
Assis
ted
Tele
phon
eIn
terv
iewi
ng
Fully
-Aut
omat
edTe
leph
one
Inte
rvie
wing
Com
pute
r Disk
sby
Mai
lEl
ectro
nic
Mai
lSu
rvey
Com
pute
r-G
ener
ated
Fax
Surv
ey
Res
pond
ents
need
not h
ave
any
com
pute
r-re
late
dsk
ills
Allo
wsre
spon
dent
toch
oose
own
sche
dule
for c
ompl
etin
gsu
rvey
Can
easil
yin
corp
orat
eco
mpl
exbr
anch
ing
ques
tions
into
surv
ey
Can
easil
yus
ere
spon
dent
-gen
erat
edwo
rds
inqu
estio
nsth
roug
hout
the
surv
ey
Can
easil
ydi
spla
ya
varie
tyof
grap
hics
and
dire
ctly
rela
teth
emto
ques
tions
Elim
inat
esne
edto
enco
deda
tafro
mpa
per
surv
eys
Erro
rsin
data
less
likel
y,co
mpa
red
toeq
uiv-
alen
t man
ual m
etho
d
Spee
dier
data
colle
ctio
nan
den
codi
ng, c
om-
pare
dto
equi
vale
ntm
anua
l met
hod
Can
accu
rate
lym
easu
rere
spon
setim
esof
resp
onde
nts
toke
yqu
estio
ns
=in
tera
ctive
e-m
ail o
nly
✔
✔✔
✔✔
✔✔
✔ ✔
✔✔
✔✔
✔✔
✔✘
✔✔
✔✔
✔✔
✘
✔✔
✔✔
✔✔
✔✘
✔✔
✔✔
✔✘
✔✔
✔✔
✔✔
✔
✔✔
✔✔
✔✔
✔
✔✔
✔✔
✔✔
✔✔
✘
TAB
LE4.
7.C
ompu
ter-
Ass
iste
dD
ata-
Col
lect
ion
Met
hods
Sou
rce:
Sco
ttG
.Dac
ko,“
Dat
aco
llect
ion
shou
ldno
tbe
man
uall
abor
,”M
arke
ting
New
s,A
ugus
t199
5,p.
31.R
eprin
ted
with
perm
issi
onfr
omM
arke
ting
New
s,pu
blis
hed
byth
eA
mer
ican
Mar
ketin
gA
ssoc
iatio
n,A
ugus
t28,
1995
,p.3
1.

plex audio and visual stimuli such as animation, photos, and video clips; in-teraction with respondent; skip patterns; use of color; pop-up instructions toprovide help with questions; and drop-down boxes to allow respondents tochoose from long lists of possible answers (e.g., “In which state do you cur-rently reside?”). Based on answers to a set of screening questions, Web-based Internet surveys can direct respondents to customized survey ques-tions specifically designed with those respondent characteristics in mind.These types of HTML format surveys can also be downloaded to the re-spondent’s computer for completion and then either mailed or electroni-cally sent to the researcher. Of course differences in monitor screen size,computer clock speed, use of full or partial screen for viewing question-naire, use of broadband versus telephone transmission lines, etc., may resultin different presentations of the questionnaire for different viewers. Also,computer navigation skills still vary widely across the population and mustbe taken into account when designing a Web-based survey. DesigningInternet surveys adds another set of challenges to the researcher using ques-tionnaires to collect data, and those researchers interested in using this me-dium should consult one of the recent publications addressing this topic(see, for example, Don Dillman, Mail and Internet Surveys, New York:John Wiley and Sons, 2000, pp. 361-401).
Some of the movement toward the use of the Internet for survey researchis due to the increasing number of people with access to and amount of timedevoted to being on the Web. Set-up time can be as fast or faster than CATI,with faster survey execution (often the targeted number of completed sur-veys can be reached in a few days). Also, the ability of the respondent tochoose the time for completing the survey gives it an advantage over per-sonal or telephone interviewing.
Not everything about the use of the Internet for survey research is posi-tive, however. At present one of the issues of greatest concern is the degreeto which respondents to Internet surveys are representative of a target popu-lation. If the survey is meant to be projectable to a population with a highpercentage of access to and usage of the Internet (e.g., university faculty,businesses, groups of professionals, purchasers of computer equipment),then this issue is of less concern. But when the survey is meant to beprojectable to the “mass market” (i.e., U.S. population in general or a largeportion of it cutting across ages, occupations, income levels, etc.), then con-ducting research by using the Internet exclusively is problematic. Descrip-tive research requires the use of probability sampling methods and not onlyis a large percentage of the U.S. population not reachable at home via theInternet, and is therefore in violation of the “known and equal probability”random sample selection requirement, it is also true that e-mail address di-rectories do not provide all addresses with a known probability of beingsampled. “In sum, e-mail and Web surveying of the general public is cur-

rently inadequate as a means of accessing random samples of defined popu-lations of households and/or individuals.”8
In comparison, the sampling frame for telephone interviews is well de-fined and its coverage biases are documented. With phone interviewing it ismuch easier to verify that the respondent is the person you targeted than it iswith Internet surveys. Voluntary response at a Web site is particularly trou-blesome as a means of sampling a specified population with particular pa-rameters (e.g., geographic, demographic, experience, etc., characteristics).Based on these problems, many researchers restrict Internet surveys tononprobability-sampling based exploratory research. However, there areresearchers who claim it is just as valid to use the Internet for probability-sampling based descriptive research as it is to use mall interviews or mailsurveys. As previously mentioned, these claims for projectability are morevalid when almost the entire target population has Internet access.
Another computer-based survey method is to put the questionnaire on acomputer disk and send it by mail to the home or work location of the re-spondent. The computer disk contains the skip patterns for the question-naire in its software. For example, if the question is, “Do you have a pet?”and the answer is no, the next question asked is different than if the answerwas yes. Some of the same advantages and disadvantages regarding the useof graphics and other visuals, and ease of tabulating and statistically analyz-ing e-mail surveys are also true for computer disk by mail surveys.
Fax Surveys
Fax Surveys have also seen increased usage in the past decade. Distrib-uting and receiving results via facsimile machines is much faster than mail.However, despite improved technology the quality of print reproduction byfax is not as good as is available in mail surveys. The much greater inci-dence of fax machines in businesses compared to homes is a reason why thisform of survey delivery is best utilized in business-to-business research.Advantages include quick dissemination and response and preparation ofonly one paper copy of cover letter and questionnaire. Disadvantages in-clude lower quality reproduction of print, lack of color capability, reducedlength of survey, no incentives for response can be included, return trans-mission cost may discourage response, and it must be possible to receivemultiple replies simultaneously or a constant busy signal will discouragesome respondents from replying.
OBSERVATION METHODS
Observation involves the process of physically or mechanically record-ing some specific aspect of a consumer’s activity or behavior. Some re-
search designs call for this type of data. Some contend that observation ismore objective than communication. However, observation, whether in afield setting or a laboratory, is not very versatile. Observation cannot an-swer questions concerning attitudes, opinions, motivations, and intentionsof consumers. Observation works well when measuring specific behavioralvariables but is less effective measuring attitudinal variables. Often a designthat starts with unobtrusive observations followed by communication to ob-tain information about motives, attitudes, etc., behind the observed behav-ior, is an effective approach. Direct observation involves actually watchingan individual’s behavior. Their purchase behavior is watched or they areviewed while using a specific product. Sometimes this behavior is moni-tored in a natural setting or real-life situation. Observations can also bemade in an artificial setting that is developed by the researcher to simulate areal-life situation. Quite often a contrived store setting is established to sim-ulate consumers’ responses to products in an “actual” purchase situation. Amajor advantage of artificial or simulated observation is the greater degreeof control offered researchers to alter specific variables.
An observation may be accomplished with or without the knowledge ofthe subject. Obviously, the advantage of disguised observation is that thesubject has no motivation to alter his or her behavior. Mechanical observa-tion is sometimes appropriate to meet the study objectives of the researchdesign. When this is the case various mechanical devices such as camerasand counting instruments are used to make observation. Eye motion, gal-vanic skin response, perspiration, pupil size, and various counting devicesare examples of mechanical methods of measuring and recording activity.Eye tracking equipment can be used to measure where the eye goes in view-ing an advertisement, a product package, or promotional display. A specificapplication of this technology would be to determine the impact of color inadvertising and copy on a newspaper page. The tracking equipment recordsnot only where the eye goes on the page, but also how long it focuses on aspecific area. People meters are designed to measure both the channel that isbeing watched as well as which person in the household is doing the watching.
SUMMARY
So far, we have discovered that the pursuit of answers to research objec-tives necessitates both a research design and data-collection methods thatpermit the execution of that design. “Good research” in any particular casecould involve collection of information using one or more of the combina-tions of research design type and data-collection method. Table 4.8 illus-trates that all combinations are possible. Which cell(s) a researcher shouldbe in is a function of the research objectives, research budget, time avail-able, and the decision maker’s preferred data form for making decisions.

TABLE 4.8. Examples of Data-Collection Methods Used for Generating Explor-atory, Descriptive, or Causal Research Information
Data-Collection Form Research Design Types
Exploratory Descriptive Causal
Secondary
Communication Previous industrystudies help to definewhat “customer ser-vice” means to con-sumers.
Annual survey re-vealing the numberof times during theweek people washdishes by hand.
A journal article thatreports on testing thehypothesis that publicservice advertisingchanges peoples’ atti-tudes toward donatingblood.
Observation A Wall Street Journalarticle reporting thatthere are a growingnumber of magazinesdevoted to Internetusage.
Syndicated data in-dicating the marketshares of variousbrands of coffee.
A report by a market-ing research firm onthe use of test market-ing by different indus-tries in the past year.
Primary
Communication A focus group of dis-tributors that dis-cusses trends inpackage handlingtechnologies.
A survey of sales-people to deter-mine the frequencywith which competi-tors have given freegoods to dealers.
Running two adver-tisements in matchedmarkets and determin-ing which ad resultedin greater recall andpositive attitudes to-ward the company.
Observation Watching production-line workers using ahandheld grinder andgaining insights onproduct designchanges.
Recording licenseplate numbers instore parking lotand getting R. L.Polk to generate amap showing tradearea and distribu-tion of customers.
Doing a test market fora new product and de-termining if salesreached objectives.

Chapter 5
MeasurementMeasurement
INTRODUCTION
In Chapter 1 we described marketing research as producing the informa-tion managers need to make marketing decisions. In that chapter we alsolisted numerous examples of how the results of marketing research can in-form marketing decisions such as in concept/product testing, market seg-mentation, competitive analysis, customer satisfaction studies, etc. These,and many other examples of marketing research studies, illustrate the needfor measurement—“rules for assigning numbers to objects in such a way asto represent quantities of attributes.” 1 Several things we should note aboutthis definition:
1. Not all of what researchers do involves measurement. Researchers areinterested in generating information, which leads to knowledge, which leadsto better decisions. Sometimes that information is in the form of insightsfrom exploratory research studies such as focus groups, in-depth inter-views, projective research, and similar methods. For these techniques weare generating information, but we are not “assigning numbers to objects,”so we are not “measuring.” As we have said before, information does nothave to have numbers attached to it to have value, and we are dangerouslyoversimplifying our analysis when we favor information with numbers overthat without, simply because it has the appearance of being “hard evidence.”
2. The “rules for assigning numbers” will be discussed in greater depth inthis chapter, but we should note here that those rules exist so that we can bemore scientific in our measures, and can place more confidence in the num-bers that those rules help generate. We want to make decisions that aregrounded in information that we believe correctly represent reality. Thismeans the assignment of numbers should map the empirical natureisomorphically (i.e., on a “one-to-one” basis).
For example, if we assign the number “5 lbs” to represent the weight ofan object, we want to make sure that the weight is 5 lbs and not 8 lbs or 3 lbs.Using a carefully calibrated scale is how we ensure in this example that we

have correctly measured the item’s weight—assigned numbers to the objectto accurately represent the quantity of its attribute of weight. The mundanequality of this example disappears when we find ourselves confronted withthe need to measure variables of interest to marketers such as intentions, at-titudes, perceptions, etc. How can we be sure that the number “4” correctlycaptures the intensity with which a respondent holds an intention, for exam-ple? We will devote further discussion to the ways of ensuring good mea-sures in our research in this chapter.
3. The definition states that we attach numbers to the attributes of an ob-ject and not to the object itself. For example, we cannot measure the quan-tity of what you are now holding in your hand. There is no scale for measur-ing the amount of “bookness” in a book. We can, however, measure theattributes of a book—its weight, dimensions in inches, number of pages,and so forth. We can even measure qualities less obvious such as its statureas great literature or its educational value; but, as described in point number2, the rules for assigning numbers to those attributes will involve differentmeasuring devices than those used to measure its physical properties. Thiscaveat also holds true for the measurement of variables of interest to mar-keters.
We measure a consumer’s attitudes, income, brand loyalty, etc., insteadof measuring the consumer. In some cases, such as attitudes, we go a stepfurther and measure the subcomponents of the variable. Attitudes, for ex-ample, are said to consist of cognitive, affective, and conative componentsthat we would want to measure to ensure we have captured the essence ofhow strong one’s attitude was toward an object. For example, if we are toclaim we have measured a parent’s attitude toward a new product conceptfor a child’s fruit drink, we need to measure beliefs and knowledge (the cog-nitive component of attitudes), how positive or negative he or she feelsabout the concept (the affective component), and the parent’s predispositionto behave toward the product (the conative component).
4. Scientists in the physical sciences such as physics, chemistry, and biol-ogy have something of an advantage over behavioral scientists because thethings they are interested in measuring have a physical reality, and the de-vices used to measure these things can be physically calibrated. “Good mea-sures” are generated by carefully calibrating the measuring devices (e.g.,micrometers, weight scales, etc.). Behavioral scientists, such as marketingresearchers, cannot see or feel those things of interest to them (e.g., percep-tions, intentions, brand loyalty, attitudes, etc.), and so must find ways of de-termining if the process they use to attach numbers is trustworthy in order toknow if the numbers resulting from that process are trustworthy. In otherwords, while a chemist can trust that the weight of a chemical is what a care-fully calibrated scale says it is, the marketing researcher can trust that he orshe has obtained a good measure of intent to purchase only by having faith

in the measurement process used to attach numbers to that intention. Thereis no way of comparing the numbers on the intention scale to a standardizedmeasure for intentions the way a chemist can check the measures of weightagainst a standardized scale for weight. We trust the numbers because wetrust the process used to attach those numbers.
THE PROCESS OF MEASUREMENT
Information gained from conducting marketing research contributes tobetter decision making by reducing risk, which can happen only if research-ers are able to collect information that accurately represents the phenome-non under study. When it is appropriate to measure that phenomenon, thatis, attach numbers to reflect the amount of an attribute inherent in that objectof interest, then we must try to ensure that the process we use to take thosemeasures is a “good” process. We have nothing to compare those numbersto to determine if they are “good” numbers, so we make sure the process istrustworthy so that we can believe the numbers resulting from the processare trustworthy and can indeed reduce the risk of decision making. The fol-lowing process can help generate good measures (see Figure 5.1).
Step 1: Determine the Construct(s) of Interest
Constructs are abstract “constructions” (hence, the name) that are of in-terest to researchers. Some examples of constructs of interest to marketingresearchers are customer satisfaction, heavy users, channel conflict, brandloyalty, marketing orientation, etc. These constructs are typical of the typeof constructions of interest to marketers—they have no tangible realityapart from our defining them (unlike, for example, a botanist’s plant), andwe define them and study them because we need to understand them in or-der to make decisions based on that understanding (e.g., changing our poli-cies on return of purchases to increase customer satisfaction). Because theyhave no tangible reality they are generally not directly observable. Wecannot see customer satisfaction, but we can indirectly observe it by askingcustomers a series of questions that we believe reveal how satisfied custom-ers are with our firm in specific areas. As an example of measuring a con-struct we will use “marketing orientation”—a core construct of the market-ing discipline.
Step 2: Specify the Construct’s Domain
We must take care that we are accurately capturing what should be in-cluded in the definition of that construct. We previously mentioned that thetricomponent model indicates that an attitude contains in its domain cogni-

FIGURE 5.1. Developing Good Measures: The Measurement Process
Step 1:Determine the Construct(s) of Interest
Step 2:Specify the Construct(s) Domain
Step 3:Establish Operational Definitions
Step 4:Collect Data to Test Measures
Step 5:Purify the Measures
Step 6:Conduct Validity Tests
Step 7:Analyze Research Findings
tive, affective, and conative components. Social scientists have studied theconstruct “attitude” over many years and have generally agreed that its do-main includes these three components. We specify a construct’s domain byproviding a constitutive definition for the construct. A constitutive defini-tion defines a construct by using other constructs to identify conceptualboundaries, showing how it is discernable from other similar but differentconstructs. Consider the differences in the constitutive definitions for thefollowing related, but different, constructs:
Marketing orientation is the attention to identifying and satisfying cus-tomer needs, integration of effort by all areas of the organization to satisfy-ing those needs, and focusing on the means by which an organization canachieve its goals most efficiently while satisfying those needs. Market ori-entation is the systematic gathering of information on customers and com-petitors, both present and potential, the systematic analysis of the informa-tion for the purpose of developing marketing knowledge, and the systematicuse of such knowledge to guide strategy recognition, understanding, cre-ation, selection, implementation, and modification.2

The definition of market orientation is distinguished from marketing ori-entation by what it adds (a focus on potential customers as well as presentcustomers and on competitors as well as customers), and subtracts (aninterfunctional coordination).
Step 3: Establish Operational Definitions
The constitutive definition makes it possible to better define the con-struct’s domain by use of an operational definition. An operational defini-tion indicates what observable attributes of the construct will be measuredand the process that will be used to attach numbers to those attributes so asto represent the quantity of the attributes.
We need to establish operational definitions of our constructs to movethem from the world of abstract concepts into the empirical world where wecan measure them. Marketing orientation remains an abstract concept untilwe say exactly what its attributes are and how, specifically, we intend tomeasure those attributes.
One example of operationalizing the marketing orientation construct3 ina hospital setting involved identifying five attributes of the construct (cus-tomer philosophy, marketing information systems, integrated marketing ef-fort, strategic orientation, and operational efficiency), and then generating aset of nine statements for each attribute which fell along a strength of mar-keting orientation continuum anchored by the end points of “primitive” to“world class.” These statements were assigned a score on the nine-pointscale by a panel of expert judges. The following are two examples of state-ments whose average score by the judges fell at different points on the scale.Respondents (hospital administrators) would choose which statements mostaccurately reflected the marketing practices at their hospital.
Strength of Marketing Orientation
These example statements were two of forty-five item statements (ninestatements for each of five attributes), which represent the operationali-zation of the marketing orientation construct.
“Marketing here is more than a stafffunction—it is heavily involved in linedecision making.” (8.35)
“The feeling in my organization is thatmarketing activity is often contrary to thevalues of this hospital.” (1.25)

Another operationalization4 of marketing orientation involved identify-ing four attributes of the construct (intelligence generation, intelligence dis-semination, response design, and response implementation), and then gen-erating thirty-two item statements, each of which would be scored on a five-point scale ranging from “strongly disagree” to “strongly agree.” Some ex-amples of these operationalizations of the intelligence dissemination attrib-ute (respondents were executives at manufacturing firms) are:
We have interdepartmental meetings at least once a quarter to discussmarket trends or strategies.
1 2 3 4 5
StronglyDisagree
Disagree Neither Agreenor Disagree
Agree StronglyAgree
Data on customer satisfaction are disseminated at all levels in this busi-ness unit on a regular basis.
1 2 3 4 5
StronglyDisagree
Disagree Neither Agreenor Disagree
Agree StronglyAgree
Note that these two operational approaches differ in the identification ofthe construct attributes, the item statements used to operationalize the attrib-utes, and the method used to attach numbers to the item statements (also partof the operationalization process). Both examples, however, share in com-mon the operationalization process of describing a specific set of operationsthat must be carried out in order to empirically measure the construct’s attrib-utes (i.e., move it from mere abstract conceptualization to the “real world”where it can be measured by establishing a process for attaching numbers torepresent the quantity of the attribute—in these cases the degree to which afirm exhibits marketing oriented behavior). Researchers may not choose thesame means of operationalizing the constructs of interest. How can we tell ifour chosen approach represents “good measurement” methods if it is differ-ent from the methods used by other researchers, perhaps who can demon-strate that their methods have resulted, in fact, in good measures? The answerto this question lies in the next steps of the measurement process.
Step 4: Collect Data to Test Measures
In this step we use our operationalized measures to collect data from ourtarget population. We need this data to help us determine if we are on the
right track with our operationalized measures. That is, have we done a goodjob in developing the operational definitions and measuring processes sothat they accurately represent our constructs of interest? As was mentionedbefore, since we have no standardized measures that can be calibrated togive us accurate data, such as a chemist using a carefully calibrated weightscale, we must use data to help us determine if the methods used to collectthat data were “good.” If the process of measurement is good the results ofthe process will also be assumed to be good. “Collecting data” in the previ-ous two examples would consist of using the questionnaires to collect re-sponses from the target populations (hospital administrators in the first ex-ample, executives at manufacturing firms in the second).
Step 5: Purify the Measures
In Step 5 we use the data collected in Step 4 to determine which items inour original list of operationalized items have “made the cut.” Some itemswe thought would be good ways to operationalize our abstract constructsmay not be as good as we thought. We can determine which item statementsare keepers and which are to be rejected for our final item list by conductingreliability tests. We will discuss reliability in greater detail later in this chap-ter, but suffice it to say for now that we are using some statistical proceduresto help identify which item statements “hang together” as a set, capturingthe various aspects of the construct’s attributes we were seeking to measurein our operationalizations.
For example, the two statements that were used to illustrate the attributesfor marketing orientation in the two studies described in Step 2 were keep-ers — they passed the statistical tests intended to use the collected data todetermine which item statements were appropriate pieces of the whole at-tribute we sought to measure. Other item statements might have failed thosetests (i.e., the statements did not contribute to describing the attribute as wethought they would), and are eliminated from the final version of our mea-suring device (questionnaires in these two cases).
Step 6: Conduct Validity Tests
Once we have purified the scale by eliminating item statements that failto pass our reliability test we are ready to conduct another test to determinehow much faith we will place in the results of our research. Here we are test-ing for validity—did we actually measure what we were trying to measure?Validity will also be discussed in greater depth later in this chapter. Here,we should merely make note of the need to determine how successful wewere in establishing measures that did correctly reflect the quantities ofthose attributes of our constructs of interest (e.g., Did we, in fact, accuratelymeasure the degree to which an organization was marketing oriented?).

Step 7: Analyze Research Findings
If we have successfully developed measures that are reliable (Step 5) andvalid (Step 6) we are now ready to analyze our data to achieve the objectivesof our research study: answer research questions, test hypotheses, check forcause and effect relationships, describe the extent to which a population be-haves in a specific manner, etc. A report can then be written that states theresults of the research.
Commentary on the Measurement Process
Note that in this seven-step process data are actually analyzed two differ-ent ways. In Steps 5 and 6 data are being analyzed not to determine what arethe findings of the research itself (i.e., not to obtain answers to the researchquestions), but rather to determine if the process used to collect the datagenerated results which can be trusted—that is, did the process generate re-liable, valid information. Both of these measures of “data trustworthiness”are matters of degree instead of binary yes or no conclusions. We determinethe degree of reliability and validity rather than determining the data is or isnot reliable or valid. Once we have established degree of reliability and va-lidity we are in a better position to know how secure we can be in our re-search conclusions when we analyze the same data in Step 7 to achieve thepurpose of doing the research study itself.
We should also point out that some measurement processes5 suggest col-lecting data twice—once to determine which item statements are reliable(i.e., after Step 4), then again after unreliable item statements have beeneliminated (i.e., between Steps 4 and 5), performing reliability and validitytests on the second set of data, followed by analysis of the data for researchfindings (Step 7).
Now a reality check: Do all or most marketing research studies actuallyfollow a measurement process similar to the seven step process outlinedhere? Well, yes and no. Marketing scholars doing research on topics of in-terest to the discipline of marketing (such as “Does being marketing ori-ented increase a firm’s profit?” ), would have to do something like this pro-cess or they might not get their research results published! However,applied marketing-research studies, such as described in this text, are lessvigilant in conducting such measurement processes. It should be obviousthat all researchers are concerned whether or not they have measures thatcan be trusted before drawing conclusions and making decisions based onresearch findings. Therefore, attention to issues of construct domain, properoperational definitions, appropriate data-collection methods, and reliabilityand validity checks are efforts intended to generate data that accurately rep-resents the object of the research and can lead to better decisions.

WHAT IS TO BE MEASURED?
There are many different types of measures used in marketing research.However, most measures fall into one of the following three categories:6
1. States of being—age, sex, income, education, etc.2. Behavior—purchase patterns, brand loyalty, etc.3. States of mind—attitudes, preferences, personality, etc.
Table 5.1 shows examples of the types of measures frequently used inconsumer and industrial marketing research. The criterion for selectingwhat to measure is based on our knowledge or expectation that what wewant to measure will provide insight into or help solve the marketing deci-sion problem for which data are being collected. Thus, the relevant mea-sures for any study are based on the research objectives, which indicate thetypes of information needed.
The research objectives indicate the concepts (constructs) that must bemeasured. For example, customer satisfaction, store loyalty, and sales per-formance are all concepts that relate to marketing problems. However, mostconcepts can be measured in more than one way. Store loyalty, for example,could be measured by: (1) the number of times a store is visited, (2) the pro-portion of purchases made at a store, or (3) shopping at a particular storefirst. These alternate measurement approaches are our operational defini-tions. We develop operational definitions for two types of variables: dis-crete and continuous.
TABLE 5.1. Types of Measures
Measurement Type Type of Buyer
Ultimate Consumers Industrial Customers
States of Being AgeSexIncomeEducationMarital status
Size or volumeNumber of employeesNumber of plantsType of organization
Behavioral Brands purchasedCoupon redemptionStores shoppedLoyaltyActivities
Decision makersGrowth marketsPublic vs. privateDistribution pattern
States of Mind AttitudesOpinionsPersonality traitsPreferences
Management attitudesManagement styleOrganizational culture

Discrete variables are those that can be identified, separated into entities,and counted. The number of children in a family is an example of a discretevariable. Although the average may be 3.5, a given family would have 1, 2,3, or, 4 or more children, but not 3.5.
Continuous variables may take on any value. As a simple rule, if a thirdvalue can fall between the two other values, the variable is continuous. Itcan take on an infinite number of values within some specified range. Tem-perature, distance, and time are continuous variables, and each can be mea-sured to finer and finer degrees of accuracy. Frequently, continuous vari-ables are rounded and converted to discrete variables expressed in convenientunits such as degrees, miles, or minutes.
WHO IS TO BE MEASURED?
The question of the object of the measurement process may appear tohave obvious answers: people, stores, or geographic areas. However, morethoughtful answers would reveal a multiplicity of possible objects to bemeasured.
For example, a study of marital roles in decision processes yielded fourdistinctively different perceptions of the role of the husband and wife. In es-sence, the role played by each person varied with the product being pur-chased. The husband was dominant in the purchase of life insurance, thewife was dominant in food and kitchenware purchases. They tended toshare equal roles in purchasing housing, vacations, and living room furni-ture, and to be autonomic or independent in the purchase of the husband’sclothing and nonprescription drugs.7 Another study revealed that both teen-age boys and girls play an important role in the family’s purchase of groceryitems, especially where working mothers or single parents were present.8Thus, collecting data from the “decision maker” does not always representan obvious choice of respondent.
The buying-center concept used in understanding organizational buyingpatterns provides a useful framework for other consumer and industrial pur-chasers.9 A buying center consists of everyone involved in a buying action.
Buying-center participants play different roles. These roles must be iden-tified and understood to select the type of respondents to be measured in aresearch project. These roles are:
• Users—those who actually use the product• Gatekeepers—those who control the flow of information or access to
decision makers• Influencers—those who influence the choice of product or supplier
by providing information

• Deciders—those who actually make the choice of product and/orsupplier
• Buyers—those who actually complete the exchange process for afamily or organization
The major point of this discussion is to emphasize the need to judiciouslyselect the respondents, stores, areas—i.e., the “who” to be measured. If weask questions of the wrong people, we will still get answers; they just willnot be meaningful and could even be misleading.
HOW TO MEASURE WHAT NEEDS TO BE MEASURED
Measurement involves a system of logical decision rules whose standardis a scale. Four scales widely used in marketing research are nominal, ordi-nal, interval, and ratio scales. These are listed in order of the least sophisti-cated to the most sophisticated in terms of the amount of information eachprovides. The scale classification of a measure determines the appropriatestatistical procedure to use in analyzing the data generated through the mea-surement process.
The Nominal Scale
The nominal scale is the lowest level of measurement. It measures differ-ence in kind (e.g., male, female, member, nonmember, etc.). Many peopleconsider a nominal scale a qualitative classification rather than a measure-ment. It produces categorical data rather than the metric data derived frommore advanced scales. While numbers may be used as labels (e.g., 0 formales, 1 for females), they can be replaced by words, figures, letters, orother symbols to identify and distinguish each category. Nominal scales aresaid to recognize differences in kind, but not differences in degree. As a re-sult, nominal scales tend to oversimplify reality. All items assigned to thesame class are assumed to be identical.
Summaries of data from a nominal scale measurement are usually re-ported as a count of observations in each class or a relative frequency distri-bution. A mode, or most frequently observed case, is the only central ten-dency measure permitted. Since the nominal scale does not acknowledgedifferences in degree, there are no useful measures of dispersion (such asrange, standard deviation, variance, etc.). This scale calls for nonparametricstatistical techniques such as chi-square analysis.
The Ordinal Scale
The ordinal scale goes a step further than the nominal scale to introduce adirection of difference. If measurement can be ordered so that one item has

more than or less than some property when compared with another item,measurement is said to be on an ordinal scale. Ordinal scales are frequentlyused in ranking items such as best, second best, etc. Such a ranking revealsposition, but not degree. For example, if favorite vacation destinations arerank ordered, it may be determined that Florida ranks first, the RockyMountains second, and New England third, but it is not clear if all three arerelatively close in desirability, or if Florida is much more desirable and theRockies and New England are a distant second and third choice.
The most appropriate statistic describing the central tendency on an ordi-nal scale is the median. Dispersion can be quantified using the range,interquartile range, and percentiles.
The Interval Scale
Measurement is achieved on an interval scale with two additional fea-tures: (1) a unit of measurement, and (2) an arbitrary origin. Temperature,for example, is measured by interval scales. Each scale has a unit of mea-surement, a degree of temperature. An interval scale indicates a difference,a direction of difference, and a magnitude of difference, with the amount ex-pressed in constant scale units. The difference between 20 and 30 degreesrepresents the same difference and direction as the difference between 100and 110 degrees.
The arbitrary origin of the interval scale means there is no natural originor zero point from which the scale derives. For example, both Fahrenheitand Celsius scales are used to measure temperature, each having its ownzero point.
The arithmetic mean is the most common measure of central tendency oraverage. Dispersion about the mean is measured by the standard deviation.Many researchers will assume their measures are interval level measures topermit the use of more powerful statistical procedures. Great care must beused here to avoid the use of inappropriate statistical procedures.
The Ratio Scale
The most advanced level of measurement is made with a ratio scale. Thisscale has a natural origin. Zero means a complete absence of the propertybeing measured. Properties measured on a ratio scale include weight,height, distance, speed, and sales. Measurement on a ratio scale is less fre-quent in marketing research than in the physical sciences. All the commondescriptive and analytical statistical techniques used with interval scalescan be used with ratio scales. In addition, computation of absolute magni-tudes are possible with a ratio scale, but not with an interval scale. There-fore, while it cannot be said that 100°F is twice as hot as 50°F (it is not when

converted to Celsius), it can be said that $2 million in sales is twice as muchas $1 million in sales.
Table 5.2 is a summary of these measurement levels along with sampletypes of variables and questions used in their measurement.
ASSESSING RELIABILITY AND VALIDITYOF OUR MEASURES
In a perfect world our measures would exactly represent the constructunder study, with no bias or error introduced into the measurement process.Since we live in an imperfect world we must expect that the numbers wecollect in our research to represent our constructs will contain a certainamount of error. In other words, if M represents our measures (i.e., num-
TABLE 5.2. Scales of Measurement
Measure Results Sample Questions Measureof CentralTendency
Nominal Classification ofvariables
Which brand do you own?A ___ B ___ C ___
Mode
Ordinal Order ofvariables
Rank your preference for stores.First ___Second ___Third ___
Median
Interval Differences invariables
The salespeople were friendly.Strongly Agree ___Agree ___Neutral ___Disagree ___Strongly Disagree ___
Mean
Ratio Absolutemagnitude ofdifferences invariables
What was your sales volume bystore last year?Store A $___Store B $___Store C $___
MeanGeometricmean
Source: Adapted from Robert F. Hartley, George E. Prough, and Alan B.Flaschner, Essentials of Marketing Research, 1983, p. 145. Tulsa, OK:PennWell Books, Inc.

bers) and T represents the true, accurate quantity of our construct we are try-ing to measure, we could represent the relationship as
M = T + E
where E represents errors introduced into the measure. Here we see that anynumbers that are collected in the measurement process to represent the at-tributes of the construct of interest contain the true quantity of the attributeplus a certain amount of error. How does this error enter into our measures?There are several explanations why we might see a difference between themeasured value and the true value:10
1. Short-term characteristics of the respondent such as mood, health, fa-tigue, stress, etc.
2. Situational factors such as distractions or other variations in the envi-ronment where the measures are taken.
3. Data-collection factors introducing variations in how questions areadministered (e.g., different tone of voice for different interviewers,etc.) and variations introduced by the interviewing method itself (i.e.,Internet, phone, mail, personal contact).
4. Measuring instrument factors such as the degree of ambiguity and dif-ficulty of the questions and the ability of the respondent to provide an-swers.
5. Data analysis factors introduced during the coding and tabulation pro-cess.
Reliability
A reliable measure is one that consistently generates the same result overrepeated measures. For example, if a scale shows that a standardized 1 lbweight actually weighs 1 lb when placed on the scale today, tomorrow, andnext Tuesday, then it appears to be a reliable scale. If it reads a different weight,then it is unreliable, the degree of unreliability indicated by how frequently andby how much it reads an inaccurate weight. A reliable scale will also indi-cate that a different weight placed on the scale consistently shows a differ-ent measure than the 1 lb weight (i.e., a scale is not reliable if it says a 1 lbweight weighs 1 lb consistently, but says every other weight is also 1 lb be-cause it is stuck on that measure). We can determine whether our measuresof psychological constructs are reliable using one of several types of tests.
Test-Retest Reliability. The objective with test-retest reliability assess-ment is to measure the same subjects at two different points in time underapproximately the same conditions as possible and compare results. If therewas actually no change in the object of measurement (e.g., someone’s pref-

erences, attitudes, etc.), a reliable measuring device (e.g., questionnaire)would generate the same results. Obvious problems are that it may not bepossible to get the same respondents to respond to the test, the measurementprocess itself may alter the second responses, and conditions may be diffi-cult to duplicate.
Alternative Form. The deficiencies of test-retest reliability measures canbe overcome to some degree by using an alternative form of the measuringdevice. If you have at least two equivalent measuring forms (e.g., question-naires), researchers can administer one form and then two weeks later ad-minister the alternate form. Correlating the results provides a measure of thereliability of the forms.
Internal Consistency. Measuring reliability using an internal consistencyapproach usually involves the use of different samples of respondents to de-termine reliability of measures. A typical way to assess internal consistencywould be to use a split-half technique, which involves giving the measuringinstrument (e.g., questionnaire) to all the respondents, then randomly divid-ing them into halves and comparing the two halves. High correlation repre-sents good reliability. Another type of split-half comparison involves ran-domly splitting the item statements intended to measure the same constructinto halves and comparing the results of the two halves of the statements forthe entire sample. Again, high correlation of results (e.g., the way the re-spondents answered the item statements) suggests good reliability. Anotherway of testing for internal consistency is to use a statistical test such asCronbach’s alpha for intervally scaled data or KR-20 for nominally scaleddata. These measures will indicate how well each individual item statementcorrelates with other items in the instrument. A low correlation means theitem statement should be removed from the instrument. Cronbach’s alpha isa common test done in Step 5: Purify the Measures of Our MeasurementProcess (see Figure 5.1).
Validity
Validity is the extent to which differences found among respondents us-ing a measuring tool reflect true differences among respondents. The diffi-culty in assessing validity is that the true value is usually unknown. If thetrue value were known, absolute validity could be measured. In the absenceof knowledge of the true value, the concern must be with relative validity,i.e., how well the variable is measured using one measuring technique ver-sus competing techniques. Validity is assessed by examining three differenttypes of validity: content, predictive, and construct.
The content validity of a measuring instrument is the extent to which itprovides adequate coverage of the topic under study. To evaluate the con-tent validity of an instrument, it must first be decided what elements consti-
tute adequate coverage of the problem in terms of variables to be measured.Then the measuring instrument must be analyzed to assure all variables arebeing measured adequately. Thus, if peoples’ attitudes toward purchasingdifferent automobiles are being measured, questions should be included re-garding attitudes toward the car’s reliability, safety, performance, warrantycoverage, cost of ownership, etc., since those attributes constitute attitudestoward automobile purchase.
Content validity rests on the ability to adequately cover the most impor-tant attributes of the concept being measured. It is testing to determine howwell we have specified the domain of our construct (see Step 2 of Figure5.1). It is one of the most common forms of validity addressed in “practical”marketing research. A common method of testing for content validity is toask “experts” to judge whether the item statements are what they purport tobe. For example, if you are trying to develop item statements intended tomeasure customer satisfaction with the content of a Web site you could getseveral experts on customer satisfaction for Web sites to judge the adequacyof your item statements, or use item statements previously found to havepassed content validity tests.
Predictive or pragmatic validity reflects the success of measures used forestimating purposes. The researcher may want to predict some outcome orestimate the existence of some current behavior or condition. The measurehas predictive validity if it works. For example, the ACT test required ofmost college students has proved useful in predicting success in collegecourses. Thus, it is said to have predictive validity. Correlation of the inde-pendent (ACT test score) and dependent (college GPA) variables is oftenused to test for predictive validity.
Construct validity involves the desire to measure or infer the presence ofabstract characteristics for which no empirical validation seems possible.Attitude scales, aptitude tests, and personality tests generally concern con-cepts that fall in this category. In this situation, construct validity is assessedon how well the measurement tool measures constructs that have theoreti-cally defined models as an underpinning. For example, a new personalitytest must measure personality traits as defined in personality theory in orderto have construct validity. Construct validity is usually determined by test-ing to see if measures converge (i.e., convergent validity) when they aresupposed to measure the same thing, but by different means or by differentrespondents, and discriminate (i.e., discriminant validity) when you aremeasuring different things. Construct validity is obviously important—ifwe are not really measuring what we thought we were measuring (e.g., wethought we were measuring brand loyalty but we were actually measuringstore loyalty), we cannot have confidence that our decisions based on the re-search will achieve their goals. When two independent methods of measur-ing the same construct converge as expected (e.g., two different measures of

the degree of a consumer’s brand loyalty), then we have some degree ofconvergent validity. When two measures diverge as expected (e.g., brandloyalty and eagerness to try a new brand), then we have some degree ofdiscriminant validity. How each of these tests of construct validity are de-termined varies for different research studies.
Commentary on Reliability and Validity
As stated previously, researchers conducting research in order to makemarketing decisions rarely conduct the kinds of formal tests of reliabilityand validity described here. However, it should be obvious to the reader thatgood research is “good,” at least to some degree, because it generates datayou have faith in as a picture of reality—i.e., it used a data collection instru-ment which could consistently generate similar results when used repeat-edly (it is reliable), and it measured what it was intended to measure (it isvalid). An illustration will help make the point about the wisdom of beingconcerned about these issues when doing research, even nonacademic prac-tical research. Let’s say our construct of interest is an “accurate rifle.” If wewere living on the frontier, an accurate rifle would not only be an abstractconcept of intellectual interest, it could be a life or death matter! That ispractical in the extreme! We want to do reliability and validity tests on therifle before we “make decisions” based on its use, so we clamp it in a vise tomake it steady (and remove the variability of the skill of the rifleman) andsight it at the center of a target a reasonable distance away. We do this at anindoor shooting range where conditions are held constant (so we can avoidthe problems previously mentioned about environmental variables that canaffect our measures). The rifle is then fired numerous times using a mechan-ical triggering device. Figure 5.2 displays several different possible resultsof our test.
As shown in (a), the rifle is very inconsistent (i.e., unreliable) in its shotpattern, and does not hit the center of the target very often (i.e., it is not valid
(a) Neither Reliable nor Valid (b) Reliable, but not Valid (c) Reliable and Valid
Figure 5.2. Possible Results of Firing a Rifle to Test for Reliability and Validityof an “Accurate Rifle”

as an “accurate rifle” ). In (b), there is much better consistency (i.e., it is reli-able), but it still fails to be what it is supposed to be—an accurate rifle. Thatis, the construct “accurate rifle” means it hits what it is aimed at, and the ri-fle in both (a) and (b) does not do that. Reliability is obviously less impor-tant than validity here. You would take little comfort in knowing your riflecould consistently hit six inches above and a foot to the left of a chargingmountain lion. In (c) we see that the rifle can consistently (reliably) hit whatit is aimed at (it is a valid “accurate rifle” ), which increases our faith in it asa tool of practical value.
In the same way, we will have more faith in our ability to make good de-cisions if we believe the data we analyze to make those decisions were gen-erated using valid and reliable data collection instruments. As mentioned atthe beginning of the chapter, since we do not have a standard, calibrated setof results to compare our results to in order to know if the results are “good,”we must determine if the results were collected using good measuring de-vices. If the devices (e.g., questionnaires, observation methods, etc.) aregood, then we believe the results from use of those devices are good—thatis, reliable and valid representations of the reality we sought to measure. Forexample, we want to be sure that our efforts to measure consumer prefer-ence and intention to purchase product designs A or B have accurately rep-resented consumer actual desires and likely behavior, so that we can havefaith in our decision to introduce design A instead of B because the researchsupports that decision.
If we do not know whether we can trust the results of the research, whydo research at all? The alternative to good research is to make your decisionand hope for the best. By doing marketing research we are saying that wewant to reduce the uncertainty of the decision making process. But we canonly reduce the uncertainty by a reliable and valid representation of the“real” state of our constructs of interest. So, even if formal methods of test-ing for validity and reliability are not used, it is the wise researcher who de-votes thought to the construction of research instruments and using researchmethods that have proven over time to generate valid and reliable results.Interested readers should refer to some of the major works on the subject.11
Research Project Tip
Indicate how you will check to ensure that the results of your research arereliable and valid. This may not necessarily involve statistical tests, butshould involve actions that check to ensure that you are in fact measuringwhat you say you are measuring and that the results are replicable. At aminimum you should indicate how you will test for content validity.Also, take special care in establishing your operational definitions.

MEASURING PSYCHOLOGICAL VARIABLES
Measurement of most variables depends upon self-report, that is, by therespondents volunteering the information when asked, instead of throughobservation. While a state of mind is obviously not directly observable (e.g.,you cannot see a “motive” for purchasing an item), many behaviors are alsonot observable. Consequently, marketing researchers must ask people to re-spond to questions intended to measure (attach numbers to) an attribute of aconstruct in ways that reveal the quantity of the attribute. Researchers havedeveloped scales that are believed to capture the quantity or intensity of theconstruct’s attribute.
Scales are either unidimensional or multidimensional. Unidimensionalscales measure attributes one at a time. Multidimensional scales measureseveral attributes simultaneously. Many of the states of mind mentioned aretypically measured using scales developed for that purpose. We will de-scribe several scales used for measuring various states of mind after dis-cussing attitude measurement, a common object of measurement for mar-keting researchers.
Attitude Measurement
Attitudes are one of the most frequently measured constructs by marketingresearchers. Why are attitudes of such universal interest? Because marketing-decision makers are interested in them. Why are marketing-decision makersinterested in attitudes? Because they believe there is a close connection be-tween the way a person thinks (i.e., their attitude) and what they are likely todo (i.e., their behavior). Why then, don’t we just study behavior, since mar-keters are actually ultimately interested in understanding and influencing aperson’s behavior, not just their attitudes. There are several good reasons whymarketers do focus on attitudes instead of exclusively on behavior:
1. Marketers may not have access to observation of or reporting of a per-son’s behavior. The behavior may occur over a long period of time orin private settings only, and therefore observation is either not possi-ble or prohibitively expensive. Also, sometimes the behavior itself isof a nature that people will not voluntarily report it, but will answer at-titude questions related to the behavior.
2. Sometimes the behavior cannot be reported because it has not yet oc-curred. Marketers seeking to determine the best combination of attrib-utes for a new product must ask attitudinal questions about the desir-ability of those features since the product itself has yet to be producedand, hence, there is no behavior that can be recorded concerning theproduct.

3. Attitudes, under certain circumstances, are reasonably good predictorsof behavior. Consequently, by measuring someone’s attitudes we canobtain a good indication of their likely behavior in the future. The con-nection between attitudes and behavior has, however, been the subjectof extended debate among marketing researchers.12 Attitudes canhelp us understand why certain behaviors occur.
If attitudes are such good surrogates for behavior, why do we hear of themarketing blunders like “ New Coke,” (see Exhibit 5.1) where making deci-sions on the basis of attitudes got marketers in some very hot water? The an-swer is that the research focused on only a limited set of attitudes toward thenew formula versus the old (taste), and failed to measure other attitudes(how people felt about the idea of altering a formula for a product they hadused for many years). Consider also the problems of using attitudes to pre-dict behavior (see Exhibits 5.2 and 5.3).
EXHIBIT 5.1. Coca-Cola’s “New” Coke Fiasco
When the Coca-Cola Company unveiled its formula for “ New” Coke, execu-tives were certain that it was the right move to make. They described as “over-whelming” the results of taste tests with 190,000 consumers, most of whom pre-ferred the new recipe over old Coke.
The record is now clear that the introduction of “New” Coke ranks right upthere with the debut of the Edsel as one of the greatest marketing debacles of alltime. What went wrong? After all, if a marketer cannot rely on the findings from190,000 consumer taste tests, then what good is research in aiding marketingdecisions?
Anaysts now agree that the problem was Coke failed to measure the psycho-logical impact of tampering with a venerable ninety-nine-year-old soft drinkbrand. “When you have a product with a strong heritage that people could al-ways count on being there, the mind becomes more important than physiologicalresponses,” said the research director for a rival cola.
Source: Adapted from Ronald Alsop, “Coke’s Flip-Flop Underscores Risks ofConsumer Taste Tests,” The Wall Street Journal, July 18, 1985, p. 27.
EXHIBIT 5.2. Do Attitudes Predict Behavior? Part I
Food companies have usually conducted their market research by askingpeople about their eating habits and preferences. Then they develop new prod-ucts based on the results. The problem is that people do not always tell the truth.To counter this problem, NPD distributed the usual questionnaires to membersof 1,000 households asking them questions about their attitudes on nutrition andfood. In addition, the company asked each household to record in a diary everysnack or meal consumed during a two-week period in each of the two years thesurvey spans.

NPD found that its subjects divide roughly into five groups: meat and potatoeaters; families with kids, whose cupboards are stocked with soda pop andsweetened cereal; dieters; natural-food eaters; and sophisticates, those mon-eyed urban types. The study focused mainly on the last three groups becausefood companies are mostly interested in them. It was found that, as expected,each group frequently consumed the following:
Naturalists—Fresh fruit, rice, natural cereal, bran bread, wheat germ, yo-gurt, granola bars
Sophisticates—Wine, mixed drinks, beer, butter, rye/pumpernickel bread,bagels
Dieters—Skim milk, diet margarine, salads, fresh fruit, sugar substitutes
More surprisingly, however, each group was also found to frequently consume:
Naturalists—French toast with syrup, chocolate chips, homemade cake,pretzels, peanut butter and jelly sandwiches
Sophisticates—Prepackaged cake, cream cheese, olives (probably indrinks), doughnuts, frozen dinners
Dieters—Coffee, zucchini, squash
Source: Adapted from Betsy Morris, “Study to Detect True Eating Habits FindsJunk-Food Fans in the Health-Food Ranks,” The Wall Street Journal, February 3,1984, p. 19.
EXHIBIT 5.3. Do Attitudes Predict Behavior? Part II
Early lifestyle travel studies conducted by a Chicago ad agency showed apositive trend in the attitude that “meal preparation should take as little time aspossible.” It would be safe to predict, therefore, that during the same period con-sumer use of frozen vegetables would also increase.
Wrong, according to the agency’s senior vice president and director of re-search services. “There was actually a precipitous decline in the use of frozenvegetables,” he said, “when an extraneous factor entered the picture. During theyears of the study, the real price of frozen vegetables increased sharply, espe-cially when compared with the cost of other ways to simplify meal preparation.Remember that frozen vegetables represent only one of a number of acceptableways to shorten meal preparation time. The link between the desire to makemeal preparation easier and the use of frozen vegetables is neither necessarynor direct.”
The ease of meal preparation/frozen vegetable case illustrates the point thatbroad attitude trends do not always predict specific trends in consumer behavior.
Source: Adapted from “Broad Attitude Trends Don’t Always Predict SpecificConsumer Behavior,” Marketing News, May 16, 1980, p. 8.

In Exhibit 5.2 we see that peoples’ attitudes toward their diet resulted intheir being classified in specific groups. Separate measures of their behaviorindicate not all of what they eat would be predicted from their attitudes.Why this inconsistency? Just as in the “New” Coke example, we see thatpeople hold a multiplicity of attitudes toward an object, and not all attitudeswill be consistent with a specific behavior (solid lines indicate consistency,dotted lines inconsistency):
A1: I think of myself as a sophisticated B1: Eat rye breadconsumer.A2: An occasional guilty pleasure is one B2: Eat Twinkiesway to give yourself a treat for beinggood the rest of the time.
Here, we see that attitude A1 is consistent with behavior B1, but not withbehavior B2, while attitude A2 is consistent with behavior B2, but not B1. Inother words, because people have a multiplicity of attitudes, focusing on anyone attitude (i.e., A1) may not permit successful prediction of a single be-havior (i.e., B2).
In Exhibit 5.3, we see that people were increasingly in agreement withthe attitude that meal preparation should take as little time as possible. Thisfact failed to lead to an increase in sales of frozen vegetables. Why this in-consistency? In this case a multiplicity of behaviors are possible, only someof which are consistent with the attitude concerning meal preparation time.
A1:Meal preparation shouldtake as little time as possi-ble.
B1: Eat at fast-food res-taurants.
B2: Cook with a micro-wave.B3: Buy fewer frozenvegetables.
Lesson
Attitudes and behavior are complex phenomena. When we try to sim-plify what is inherently complex for our own convenience we often draw er-roneous conclusions. We are seekers after truth, not simplicity. If truth iscomplex, let’s try to understand its complexity. If it is simple, let’s just bethankful for its simplicity. What these examples do tell us is that we muststrive very hard to make sure we have correctly sampled the domain of theattitudes we are seeking to measure (i.e., have good content validity). Forexample, if we are trying to measure peoples’ attitudes toward eatinghealthfully, we would want to have a number of item statements that wouldbe divided among the three components of attitudes. Example attitude ques-tions about eating healthfully might be:

Strongly StronglyAgree Disagree
Affective I like the taste of healthyfoods.
_____ _____ _____ _____ _____ _____
Cogni-tive
I believe eating health-fully will increase my lifespan.
_____ _____ _____ _____ _____ _____
Conative I try to buy healthy foodswhenever possible.
_____ _____ _____ _____ _____ _____
We would also want to correctly sample from the domain of the behaviorof interest to us. We will now discuss the use of scales to measure attitudesand other psychological variables of interest to marketers.
Itemized Rating Scales
Itemized rating scales are just that—the points on the scale are “item-ized,” with a description of the scale point provided. Several choices con-front the researcher using an itemized rating scale:
1. The number of item statements and scale points. Research has indi-cated that scale reliability improves, up to a point, with increases inthe number of item statements and scale points.13 So, for example, aquestionnaire that asks for attitudes toward healthy eating is more reli-able if it uses twelve attitude item statements (e.g., an example of anitem statement is a declarative statement with itemized responses suchas “I like the taste of most healthy foods” with responses like stronglyagree, agree, neither agree nor disagree, disagree, strongly disagree),rather than three item statements, but thirty item statements is proba-bly less reliable than twelve. Why? Because of the fatigue factor—re-spondents get fatigued in answering too many questions and their re-sponses are made more to “get it over with” rather than as a truerepresentation of their state of mind. The same is true for responsepoints on the scale—five is better than three, but more than ten pointsdoes not improve reliability. Typically, the number of scale pointsvary between five to seven (see examples).
2. Odd or even number of points. Is a scale with an even number ofpoints preferable to an odd number, or is the odd number preferable?There is no hard evidence that supports either choice. The odd numberprovides a midpoint on the scale, while the even number forces re-spondents to “choose sides” (lean toward one end of the scale or theother). This remains a matter of researcher preference.
3. Use of “don’t know” and “no opinion.” The general tendency for in-terviewers is to discourage respondents from choosing a “don’t
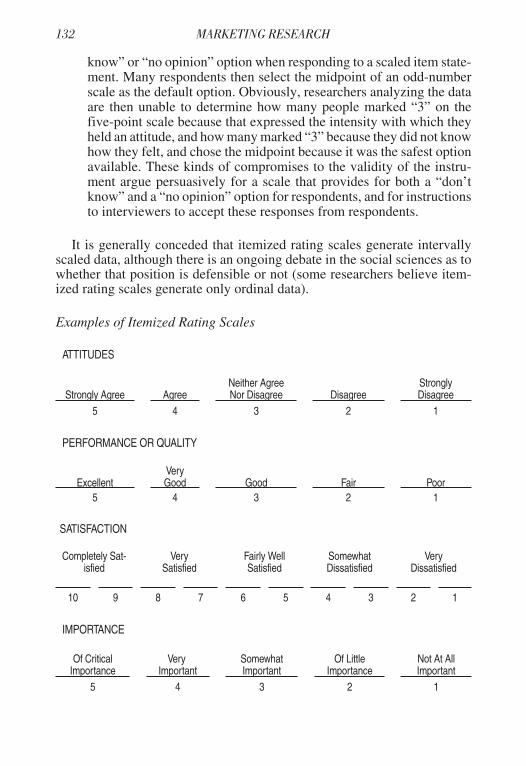
know” or “no opinion” option when responding to a scaled item state-ment. Many respondents then select the midpoint of an odd-numberscale as the default option. Obviously, researchers analyzing the dataare then unable to determine how many people marked “3” on thefive-point scale because that expressed the intensity with which theyheld an attitude, and how many marked “3” because they did not knowhow they felt, and chose the midpoint because it was the safest optionavailable. These kinds of compromises to the validity of the instru-ment argue persuasively for a scale that provides for both a “don’tknow” and a “no opinion” option for respondents, and for instructionsto interviewers to accept these responses from respondents.
It is generally conceded that itemized rating scales generate intervallyscaled data, although there is an ongoing debate in the social sciences as towhether that position is defensible or not (some researchers believe item-ized rating scales generate only ordinal data).
Examples of Itemized Rating Scales
ATTITUDES
Strongly Agree AgreeNeither AgreeNor Disagree Disagree
StronglyDisagree
5 4 3 2 1
PERFORMANCE OR QUALITY
ExcellentVeryGood Good Fair Poor
5 4 3 2 1
SATISFACTION
Completely Sat-isfied
VerySatisfied
Fairly WellSatisfied
SomewhatDissatisfied
VeryDissatisfied
10 9 8 7 6 5 4 3 2 1
IMPORTANCE
Of CriticalImportance
VeryImportant
SomewhatImportant
Of LittleImportance
Not At AllImportant
5 4 3 2 1

EXPERIENCE
Far ExceededMy
Expectations
ExceededMy
ExpectationsMet My
Expectations
Did NotMeet My
ExpectationsFar Below MyExpectations
5 4 3 2 1
INTENTION
ExtremelyLikely
VeryLikely
SomewhatLikely
About 50-50 Chance
SomewhatUnlikely
VeryUnlikely
ExtremelyUnlikely
7 6 5 4 3 2 1
BEHAVIOR
Always Frequently Occasionally Infrequently Not At All
5 4 3 2 1
MoreThan
Once aWeek
AboutOnce aWeek
Two orThree
Times aMonth
AboutOnce aMonth
Less ThanOnce aMonth
AlmostNever
Never
7 6 5 4 3 2 1
Likert Scales
Strictly speaking, a Likert scale is a five-point itemized rating scale withspecific descriptors for the scale points. We list it separately here because itis one of the most frequently used scales for measuring attitudes. Developedby Rensis Likert,14 it has undergone many variations over the years. It con-sists of five points of agreement for measuring intensity of an attitude.
StronglyAgree
Agree Neither AgreeNor Disagree
Disagree Strongly Dis-agree
Variations have been made to turn it into a seven-point scale,
StronglyAgree
Agree SomewhatAgree
Neither AgreeNor Disagree
SomewhatDisagree
Disagree StronglyDisagree
or a bipolar scale,
Strongly Agree ___ ___ ___ ___ ___ ___ ___ Strongly Disagree

which is not technically an itemized rating scale since the points of the scaleare not “itemized” with a description.
The Likert scale is sometimes referred to as a summated ratings scale, be-cause you can determine the strength of someone’s attitude, positive or neg-ative, toward an object by summing their scores for each of the item state-ments. Consider, for example, how persons A and B answered the followingquestions:
StronglyAgree
5Agree
4
Neither AgreeNor Disagree
3Disagree
2
StronglyDisagree
1
The hotel has helpfulemployees.
A B
The hotel is convenientlylocated.
A B
The hotel has reasonablerates.
A B
The summated rating score for person A is 5 + 4 + 5 = 14, and for personB it is 3 + 3 + 2 = 8. Person A then has an overall more positive attitude to-ward the hotel than person B. Note that we would not then state that personA’s attitude is 75 percent more positive (14 ÷ 8 = 1.75) than person B’s.Such a statement requires ratio-scaled data, and attitudes can never be mea-sured on a ratio scale (there is no absolute zero point for attitudes). At best, aLikert scale generates interval data.
Rank-Order Scales
In a rank-order scale the respondent puts objects in an order of some vari-able under study (e.g., order of liking, preference, intention to buy, quality,etc.), generating ordinal data. An example of such a scale is shown below:
Rank-order the following sporting events in terms of most desirable toleast desirable for you to attend (1 = most desirable, 2 = second mostdesirable, etc.)
_____ Super Bowl_____ World Series_____ NBA Championship Game_____ NHL All-Star Game_____ NCAA Basketball Championship_____ Masters Golf Tournament
The advantages of a rank-order scale are that it is easy for the respondentto understand and respond to, and it is a realistic representation of choice be-

havior (i.e., some objects would be purchased before others according to therank order). The disadvantages are that the rank order appears without theresearcher knowing his or her location on a like-dislike continuum. That is,all the items may be toward the highly liked end of the scale, or spread outalong the scale so that number one is liked while the bottom numbered itemis disliked, or all located at the disliked end of the scale (e.g., even the itemranked number one is only the least disliked of the entire group of dislikeditems rank-ordered). Another disadvantage is that data analysis is limited tothose procedures permissible for ordinal-ranked data. Also, the respondentsactual first choice may not have been included on the list, but researcherswould not know this. Finally, we do not know how far apart the items are onthe list in terms of desirability (e.g., 1 and 2 may be highly desirable andclose together, 3, 4, and 5 are much less desirable and far down the list), andwe do not know why the items were ranked in that order.
Comparative Rating Scales
The comparative rating scale (also called a constant-sum scale) requiresrespondents to divide a fixed number of points, usually 100, among itemsaccording to their importance to the respondent. The result provides re-searchers with some understanding of the magnitude of the difference be-tween the items importance to the respondent. An example is:
Please allocate 100 points among the items below such that the alloca-tion represents the importance of each item to your choice of a hotel.The higher the number of points, the greater its importance. If an itemhas no importance you would assign no points to it. Please checkwhen finished to ensure that your point total is 100.
Hotel belongs to a national chain _____I receive frequent guest “points” for my stay _____Location is convenient _____Is good value for the money _____Listed as a top quality hotel in guide book _____Total 100 points
The task of allocating points becomes more difficult with a large numberof items. Ten items are generally considered the maximum limit for thecomparative rating scale.
Semantic Differential Scales
The semantic differential scale is a seven-point scale using pairs of adjec-tives or phrases that are opposite in meaning. Each pair of adjectives mea-

sures a different dimension of the concept. The respondent chooses one of theseven scale positions that most closely reflects his or her feelings. A largenumber of dimensions would be needed to completely measure a concept.
Two forms of a semantic differential scaled statement are:
Again, the numbers assigned to the positions on the scale indicate order,so at least an ordinal level of measurement has been achieved, althoughmany researchers assume interval level data are obtained through thismethod. Semantic differential scales can also be graphed to show compari-sons by group or objects by plotting medians or means.
Stapel Scales
The Stapel scale is used as a substitute for the semantic differential when itis difficult to construct pairs of bipolar adjectives. The following example il-lustrates a Stapel scale for measuring airline performance on seating comfort.
Delta United American NorthwestComfortableSeating
+3 +3 +3 +3+2 +2 +2 +2+1 +1 +1 +1-1 -1 -1 -1-2 -2 -2 -2-3 -3 -3 -3
Respondents would be instructed to circle positive numbers for when theadjective increasingly accurately describes the airline seating in economyclass, and negative numbers when the adjective is increasingly less accuratein describing the airline. Stapel scales generate results similar to the seman-tic differential, but are easier to construct and administer, particularly overthe phone.
Commentary on Scales
Some types of scales are designed to collect measures of a specific typeof construct, while others can be used for more than one type of construct.For example, Likert, semantic differential, and Stapel scales were all origi-nally designed as attitude-rating scales. They are also generally thought ofas interval scales (i.e., generating intervally scaled data).
Clean
The storewas clean
1
1
2
2
3
3
4
4
5
5
6
6
7
7
Dirty
The storewas dirty

A comparative rating scale, in contrast, is an interval scale (or quasi-interval—scientists are not in agreement about this) that could be used tomeasure several constructs. See the following examples.
Motives. Allocate 100 points among this list of items with respect to theirimportance in selecting a university for an undergraduate degree:
Parents attended the universityNational reputation for qualityStudent-teacher ratioCost of tuitionClose to homeTotal 100 points
Preferences. Allocate 100 points among this list of items with respect toyour preference for places to vacation:
DisneyworldMountainsBeachGolf ResortTotal 100 points
A rank-order scale is similar in versatility to the comparative rating scale(e.g., could measure motives, preferences), but is an ordinal scale.
Example: Rank-order your preferences for places to vacation (firstchoice = 1, second choice = 2, etc.):
DisneyworldMountainsBeachGolf Resort
See Table 5.3 for further clarification.
TABLE 5.3. Types of Scales and Their Properties
Scale Names Types of Data Used to MeasureTypical Numberof Scale Points
Itemized Rating Interval Many DifferentConstructs(see examplesin this chapter)
Varies
Likert Interval Attitudes Five

TABLE 5.3 (continued)
Rank-order Ordinal SeveralConstructs
Varies
ComparativeRating (Con-stant-Sum)
Intervalor quasi-interval
SeveralConstructs
Varies
SemanticDifferential
Interval Attitudes Seven
Stapel Interval Attitudes Six
SUMMARY
The researcher must be sure that the measurement process is carefullyanalyzed to ensure good measurement tools are used in research. All thequestions of what, who, and how to measure must be dealt with to yieldvalid and reliable measures of marketing concepts. Failure to exercise carethroughout measurement procedures can result in misleading informationand ineffective decisions. The process of developing measures to be used inresearch projects should constitute a substantial part of the researcher’s timeand effort in the planning stages of each project. Using the proper scale forresponding to questions measuring psychological variables is an importantstep in obtaining good measures. Care should be taken that attitude mea-sures do not lead to improper and erroneous predictions of behavior.

Chapter 6
Designing the Data-Gathering InstrumentDesigning the Data-Gathering Instrument
When we use the term data-gathering instrument, we typically are refer-ring to using a descriptive research design data-collection method. That isbecause we do not think of collecting data per se in exploratory research(i.e., we are generating hypotheses, ideas, insights, clarifying concepts,prioritizing objectives for the next phase of research, etc.), and although wedo generate data in causal research, we tend to think in terms of putting to-gether an experimental design rather than designing a data-collection in-strument.
The quality of the information gathered is directly proportional to thequality of the instrument designed to collect the data. Consequently, it is ex-tremely important that the most effective data-gathering instrument possi-ble be constructed.
As mentioned in Chapter 2, it is vital to anticipate the total informationneeds of the project so the data-gathering instrument can be designed insuch a way that it will provide answers to the research questions. The instru-ment must also gather the data in a form that permits processing it using theanalytical techniques selected. As a result of its importance, the data-gather-ing instrument is the “hinge” that holds the research project together andmust be done well.
A questionnaire is the main type of data-gathering instrument in descrip-tive-research designs. A questionnaire is defined in Webster’s New Colle-giate Dictionary as “a set of questions for obtaining statistically useful orpersonal information from individuals.” Obviously, an effective question-naire is much more than that. Since poor questionnaire design is a primarycontributor to nonsampling errors, specifically response errors, the ques-tionnaire should be well designed. The questions should minimize the pos-sibility that respondents will give inaccurate answers. The questions that areasked respondents are the basic essence of a research project. Inquiring byway of interrogation through specific questions forms the basic core of sur-vey research. The reliability and validity of survey results are dependent onthe way the specific questions are planned, constructed, and executed.

Constructing a questionnaire that generates accurate data that is relevantto solving the management problem is not a simple matter. It is quite possi-ble to construct a questionnaire that flows well from part to part, containingquestions easily understood by respondents, addressing the issues identifiedin the study’s research objectives, and lending itself to the appropriate ana-lytical techniques, but totally failing to present an accurate picture of realityconducive to making decisions that lead to a solution of the managementproblem. How is this possible? As Patricia Labaw notes, a questionnaire ismore than just a series of well-worded questions. “It is a totality, a gestaltthat is greater than the sum of its individual questions. A questionnaire is or-ganic, with each part vital to every other part, and all parts must be handledsimultaneously to create this whole instrument.”1
A questionnaire must provide data that allows the researcher to deter-mine the information contained in Table 6.1. Without these contextualizingcomponents, it is not possible to extract meaning from the answers respon-dents give to the questions in a questionnaire.
We need to include questions that reveal respondent consciousness,knowledge, behavior, and environmental situation so that we can know howto interpret, or extract meaning from the answers to those questions that arederived from our research objectives. While our research objectives provideguidance for what questions we will ask respondents, fulfill the researchpurpose, and permit selection from among our decision alternatives,thereby solving our management problem, those research objectives are notthe only source of our questionnaire questions. We will only be able to de-rive meaning from the answer to those questions by using responses to thefour components discussed in Table 6.1 as a “filter.” For example, we canimagine grouping respondents, based on their answers to some factual ques-tions, into two groups, those knowledgeable about the topic and those notknowledgeable about the topic, and then analyzing the responses by theknowledgeable group in our attempt to make meaningful conclusions fromthe data. In fact, answers to well-worded, relevant questions may lackmeaning for several reasons:2
1. Respondents may not respond truthfully to the question, either to pro-tect their ignorance or true feelings.
2. The questions were understandable, but failed to allow respondents toreveal how they really thought, felt, or behaved because of inadequateresponse options.
3. Respondents may answer without really being in touch with their ownthoughts or emotions (this is a consciousness problem).
4. Respondents provide meaningful answers but they only provide apiece of the total picture. Other questions that could have completedthe picture were not asked.

5. Respondents may answer the questions honestly, but the answerswere based on incomplete or faulty knowledge. More knowledgemight have changed the answers.
6. Researchers may impute meaningfulness to the answers when, in fact,the issues have no importance or salience to the respondents. Theyjust answered because we asked, they really do not make their deci-sions by thinking about the issue. It is vitally important to us but not atall important to them.
GOALS OF A QUESTIONNAIRE
Researchers therefore should take great care in designing a data-collec-tion instrument that it is perceived in the gestalt sense—more than just awell ordered series of questions resulting from our research objectives. Agood questionnaire should accomplish the following goals:
Contextualize the Information Collected
This is what we mean by collecting meaningful information, as outlinedin Table 6.1. The researcher should include any questions that will aid in theinterpretation of those questions that are directly related to the research ob-jectives. In other words, include questions such as those indicated in Table6.1 and others, which can be used by the decision maker in the decision-making process, even if those additional questions are not directly related tothe research objectives. A questionnaire is more than merely a conversionof research objectives into questionnaire questions.
Express the Study Objectives in Question Form
The questionnaire must capture the essence of the study objectives andask questions that will gather the data that will provide the informationneeded to answer the various research questions. Quite often, a set of studyobjectives are adapted to an existing questionnaire that has been effective inthe past. Each project with its unique set of study objectives should have acustom-made questionnaire designed especially for that project. The designof the questionnaire is the wrong place to try to economize during the re-search process.
Measure the Attitude, Behavior, Intention, Attributes,or Other Characteristics of the Respondent
The questions must be specific and reported in a form that will allow forcomparisons to be made and results to be analyzed. The responses to the

TAB
LE6.
1.N
eces
sary
Com
pone
nts
ofQ
uest
ionn
aire
sto
Allo
wfo
rM
eani
ngfu
lAna
lysi
s
Com
pone
ntW
hati
tmea
nsE
vide
nce
ofit
Why
itis
need
edE
xam
ple
1.D
eter
min
atio
nof
leve
lsof
resp
onde
ntco
nsci
ousn
ess
Doe
sth
ere
spon
-de
ntse
eor
unde
r-st
and
the
impl
i-ca
tions
ofhi
sor
her
answ
ers
toth
equ
estio
ns?
Unc
onsc
ious
an-
swer
sth
atar
ein
con-
sist
ent,
notb
ased
onob
ject
ive
real
ity,
pure
lyem
otio
nal,
ig-
nora
nt,o
rm
isle
adin
g
Ifda
tafr
oman
swer
sre
flect
low
leve
lofc
on-
scio
usne
ss,n
oam
ount
ofst
atis
tical
anal
ysis
can
help
usto
pred
ict
beha
vior
Res
pond
ents
ays
inan
swer
toon
equ
estio
nth
atth
eydo
n’t
belie
vein
abor
tion
“und
eran
yci
rcum
stan
ces,
”the
nsa
yin
an-
othe
ran
swer
that
abor
tion
isO
Kto
save
am
othe
r’slif
e
2.D
elin
eatio
nof
the
stru
ctur
esor
envi
ron-
men
tsaf
fect
ing
beha
vior
The
phys
ical
de-
term
inan
tssu
r-ro
undi
ngth
ere
spon
dent
’sbe
-ha
vior
Suc
hth
ings
asag
e,se
x,he
alth
,rac
e,lo
-ca
le,m
obili
ty,e
tc.,
whi
chim
ping
eon
re-
spon
dent
sab
ility
tobe
have
ince
rtai
nw
ays
Peo
ple,
desp
iteth
eir
at-
titud
esto
war
dan
obje
ct,
may
beha
vein
way
sdi
f-fe
rent
than
thei
rat
titud
ew
ould
sugg
estb
ecau
seof
envi
ronm
enta
lor
situ
-at
iona
lcon
stra
ints
Whi
lea
resp
onde
nt’s
attit
ude
tow
ard
mas
stra
nsit
may
bequ
itefa
vora
ble,
the
key
dete
r-m
inan
tofw
heth
erhe
orsh
ew
illus
eit
isw
heth
erit
exis
tsin
his
orhe
ren
viro
nmen
t
3.D
eter
min
atio
nof
leve
lsof
resp
onde
ntkn
owle
dge
Doe
sth
ere
spon
-de
ntre
ally
have
anun
ders
tand
ing
ofth
eto
pic
ofth
equ
estio
ns?
Abi
lity
toan
swer
fac-
tual
ques
tions
cor-
rect
ly
Lack
ofkn
owle
dge
col-
ors
resp
onde
ntat
titud
esan
dbe
havi
ors
and
mak
esde
cisi
ons
base
don
such
resp
onse
sve
ryris
ky
Res
pond
ents
may
answ
erqu
estio
nsab
outt
hepo
sitio
ning
ofa
prod
uctr
elat
ive
toits
com
-pe
titio
nw
ithou
tpos
sess
ing
any
know
ledg
eof
the
prod
uct,
mak
-in
gin
terp
reta
tion
ofth
epo
si-
tioni
ngm
apim
poss
ible
4.D
eter
min
atio
nof
pres
ent
resp
onde
ntbe
havi
orin
spec
ific
situ
atio
ns
Res
pond
ents
re-
port
ing
wha
tthe
yha
veal
read
ydo
ne
Res
pons
esto
ques
-tio
nsas
king
for
the
freq
uenc
yw
ithw
hich
spec
ific
beha
vior
sar
epe
rform
ed
Beh
avio
rac
tsas
am
ea-
sure
ofex
perie
nce
(or
know
ledg
e)w
ithth
eto
pic
asw
ella
sim
por-
tanc
eof
the
topi
c
Som
eone
who
smok
esre
veal
sm
ore
inth
atbe
havi
orth
anw
hat
mig
htbe
reve
aled
from
answ
er-
ing
attit
udes
abou
tsm
okin
g(e
.g.,
belie
ving
smok
ing
isde
le-
terio
usto
your
heal
th)
Sou
rce:
Ada
pted
from
Pat
ricia
Laba
w,A
dvan
ced
Que
stio
nnai
reD
esig
n(C
ambr
idge
,MA
:Abt
Boo
ks,1
980)
.

questions must provide the information that is necessary to answer the re-search questions and in a format that can be subjected to the appropriate an-alytical technique (techniques of analysis will be discussed in Chapters 10and 11).
Create Harmony and Rapport with the Respondent
A well-designed questionnaire targeted at the correct population sampleshould provide an enjoyable experience for the respondent. The frame ofreference of the respondent must be considered in the design, wording, andsequencing of a questionnaire. Occupational jargon, cultural background,educational level, and regional differences can alter the effectiveness of aquestionnaire if they are not taken into consideration. Not only should thequestionnaire appeal to the respondent, it should be designed so the respon-dent can easily understand it, be able to answer it, and be made willing to an-swer it.
Provide Just the Right Amount of Information:No More, No Less
This is a trite statement, but it has much truth to it. There are often honestdifferences of opinion on just how much information is needed to answer aset of research questions. However, in designing a questionnaire the two ba-sic mistakes are leaving an important question unasked, which makes thesurvey incomplete, and asking too many irrelevant questions, which makesthe survey too long and unwieldy. A researcher must learn to economize inasking questions to avoid respondent burnout, which leads to early termina-tions and incomplete and inaccurate information. However, care must betaken in the design process to be sure the proper quantity of information isgathered to accomplish the research objectives.
CLASSIFICATION OF QUESTIONS
Questions can be classified in terms of their degree of structure and dis-guise. By structure we mean the degree to which the question and the re-sponses are standardized at some point in the data-collection process. Whena questionnaire is classified according to disguise, it depends on how evi-dent the purpose of the question or questionnaire is. An undisguised question-naire is one in which the purpose of the research is obvious to the respondentbecause of the questions asked. A disguised questionnaire obscures the pur-pose of the research and tries to indirectly get at a respondent’s point ofview. Of course the sponsor of the research may or may not be revealed to

the respondent before he or she answers the questions, but this is not what ismeant by “disguise.”
Based on the classification of questions according to structure and dis-guise, the following general types emerge.
Structured-Undisguised Questions
Structured-undisguised questions are the most commonly used in re-search today. Every respondent is posed the same questions in the same se-quence, with the same opportunity of response. In most cases the purpose ofthe research is clearly stated in an introductory statement or is obvious fromthe questions asked. This type of instrument has the advantages of simplic-ity in administration, tabulation, and analysis; standardized data collection;objectivity; and reliability. The disadvantages include lack of flexibility inchanging questions “on the fly.”
Structured-Disguised Questions
Structured-disguised questions are probably the least used questions inmarket research. They maintain the advantages of structuring while at-tempting to add the advantage of disguise in eliminating possible bias fromthe respondent’s knowledge of the purpose of the survey. The main advan-tages of this type of questionnaire are ease of administration, coding, andtabulating. An additional advantage is to gain insight on a sensitive issuewithout “tipping” your hand to the respondent. The problem with this typeof research is the difficulties encountered in interpreting the respondent’sanswer. An example of a structured-disguised question would be:
Which of the following types of people would eat a lot and whichwould eat a little hot cereal?
Eat a lot Eat a little
professional athletes
Wall St. bankers
farmers
college teachers
The structure is obvious. The disguise is related to the purpose of thequestions, which is to use the responses to determine the image people haveof hot cereal. It is easy to tabulate the responses but considerably more diffi-cult to interpret what the responses mean with regard to the respondents’

image of the product (e.g., What does it mean that 23 percent of respondentssaid professional athletes eat a lot of hot cereal, while 18 percent said theyeat only a little compared to 31 percent and 22 percent respectively for col-lege teachers?).
Unstructured-Undisguised Questions
Unstructured-undisguised questions are appropriate for in-depth inter-views and focus group interviews. They allow the interviewer or moderatorto begin with a general question or series of questions and allow the discus-sion to develop following a general series of questions in a discussion guide.Because of the nature of these types of questions, the effectiveness of thedepth or focus group interview depends largely upon the skills of the inter-viewer or moderator. Advantages of this method are that more in-depth andaccurate responses can be obtained, particularly for complex and sensitiveissues, and greater cooperation and involvement can be obtained from therespondent. The unstructured-undisguised interview is well-suited for ex-ploratory research, gaining background, and generating and clarifying re-search questions.
Unstructured-Disguised Questions
Unstructured-disguised questions are often used in motivation researchto determine the “whys” of an individual’s behavior. Projective methods areoften used to get at the subtle issues that are not easily explored by directquestioning. Word association, storytelling, and sentence completion aremethods that can be used to try to gain information about a subject withoutrevealing the actual purpose of the research (see Chapter 2).
Descriptive-research questionnaires largely consist of structured-un-disguised questions. They are highly structured data-gathering instruments,compared to the less structured instruments used in focus groups or in-depthinterview guides. In the descriptive-research questionnaire each respondenthears (or sees) the same question, and has the same response options. This isobviously true with questions such as:
Would you say you eat away from home more often, less often, orabout the same as you did three years ago?
More _____ Less _____ Same _____
Here, both the question and the response categories are highly structured.Open-ended questions are structured but the response is not, at least at thepoint of gathering the data. An example of an open-ended question:

[If said “less”]Why do you eat away from home less often than you did three yearsago?
The respondent could give any explanation to the interviewer or write inany response if the respondent were completing the questionnaire alone.The responses become structured when the researcher develops categoriesof the answers based on the type and frequency of the responses (e.g., thenumber of times the researcher sees an answer such as “I work at home nowwhereas I used to eat lunch out every day at work” or “Our household in-come has decreased and we cannot afford to eat out as often”). The re-searcher may establish a number of different categories of responses afterconsidering all the responses and then tabulate the responses for all com-pleted questionnaires by categories. Thus, what appears to be an unstruc-tured question is in fact structured as a question before asked and as an an-swer after it has been asked.
Another way of collecting information is when the respondent hearswhat appears to be the same open-ended question in a phone or personal in-terview, but the interviewer categorizes the response into predeterminedcategories at the time the question is asked, such as:
[If “less often” indicated in previous question asked]Why do you eat away from home less often than you did three yearsago? [CHECK ALL THAT APPLY]
Economics/less money/lower incomeChange in household members/circumstanceChanged jobs, etc.Other [WRITE IN VERBATIM]
Instructions to the interviewer are in brackets. In this example the inter-viewer exercises the judgment in categorizing the response (the respondenthears only the questions, the responses are not read). Response categoriesmay have been established based on exploratory research or previous de-scriptive studies. If a response does not fit any of the given categories the in-terviewer is to record the verbatim response, allowing the researcher to laterestablish new categories to capture the unanticipated responses. The re-

searcher must balance the ease of tabulating and lower expense of havingstructured responses with the flexibility and “richness” of the more expen-sive open-ended responses that must later be structured.
DESIGNING A QUESTIONNAIRE
There is no single generally accepted method for designing a question-naire. Various research texts have suggested procedures ranging from fourto fourteen sequential steps. Questionnaire design, no matter how formal-ized, still requires a measure of science and a measure of art with a gooddose of humility mixed in. In designing a questionnaire, presumption mustbe set aside. Although for simplicity of format, the sequence for developinga questionnaire is given on a step-by-step basis, rarely is a questionnaireconstructed in such a routine way. Quite often it is necessary to skip fromone step to another and to loop back through a previous series of steps.
The following steps represent a sequential procedure that needs to beconsidered for the development of an effective survey instrument.
• Step 1: Determine the specific information needed to achieve the re-search objectives.
• Step 2: Identify the sources of the required information.• Step 3: Choose the method of administration that suits the informa-
tion required and the sources of information.• Step 4: Determine the types of questions to be used and form of re-
sponse.• Step 5: Develop the specific questions to be asked.• Step 6: Determine the sequence of the questions and the length of the
questionnaire.• Step 7: Predetermine coding.• Step 8: Pretest the questionnaire.• Step 9: Review and revise the questionnaire.
A brief discussion of each of the questionnaire development steps fol-lows.
Determine the Specific Information Needed
The initial step to be taken in the design of a questionnaire is to determinethe specific information needed to achieve the research objectives—answerthe research questions and test the hypotheses. Or, another way of thinkingof this step is that you are specifying the domain of the constructs of interestand determining the constructs’ attributes (Chapter 5). This task can bemade much easier if the earlier phases of the research process have beenprecisely accomplished. Clear study objectives facilitate this important de-

cision. One of the most common and costly errors of research is the omis-sion of an important question on the data-gathering instrument. Once thequestionnaire is fielded, it is too late to go back for additional informationwithout significant delay and additional cost.
The researcher must determine all of the information required before thequestionnaire is developed. Sometimes the articulation of research objec-tives into specific questions by setting up dummy tables to be used when an-alyzing the results will trigger a new idea or research question that should beincluded in the survey. Every effort needs to be marshalled at this point ofthe design process to ensure relevant results for the analysis phase of the re-search process. In some cases it is advisable to conduct exploratory researchto ensure that all of the relevant variables are identified. Focus groups, re-views of secondary sources of information, and some selected personal in-terviews are good ways of making sure that the pertinent variables are iden-tified. Also, contextualizing information such as is listed in Table 6.1should be determined.
Identify the Sources
Step two involves the important aspect of identifying the sources of theinformation requirements determined in step one. Sample selection will bediscussed in more detail in Chapter 7; however, the characteristics of thesample frame are extremely important in designing the data-gathering in-strument. The sophistication, intelligence, frame of reference, location, eth-nic background, and other characteristics of the potential respondents arevital to determining the type of questionnaire, the wording of questions, themeans of administration, as well as other aspects of the questionnaire. Con-sider, for example, the difference in the design of a questionnaire if thequestions are asked of ten-year-old children or twenty-year-old college stu-dents.
Choose the Method of Administration
Step three involves utilizing the results of steps one and two to decidewhether the Internet, a personal interview, telephone survey, or mail ques-tionnaire is most acceptable. Issues such as whether a stimulus is required,the length of the questionnaire, the complexity of the questions, and the na-ture of the issue being researched must be considered in choosing whichtype of survey is best. These decisions should be made with respect to theinformation required and the nature of the sources of the information. Otherconsiderations that affect this decision are the cost and time constraintsplaced on the research project (see Chapter 4).

Determine the Types of Questions
Step four involves choosing the types of questions to be used in the ques-tionnaire. To accomplish this the researcher must look both backward andforward. The researcher looks back to review the information required andthe nature of the respondents. This can dictate various decisions concerningthe types of questions selected. The researcher must also look forward to theanalysis stage of the research process to ensure that the right form of data isobtained to accommodate the proper analytical techniques.
There are four basic types of questions that might be used in a question-naire: (a)open-ended, (b) dichotomous, (c) multichotomous, and (d) scales.Most questionnaires have more than one type of question.
Open-Ended Questions
Open-ended questions such as “What did you like about the product?”provide an unlimited range of replies the respondent can make. The majoradvantages and uses of this type question are that they can be used when thepossible replies are unknown, when verbatim responses are desired, andwhen gaining deep insight into attitudes on sensitive issues is needed.Open-ended questions are also useful to break the ice with the respondentand provide background information for more detailed questions. As dis-cussed earlier, these questions are good for providing respondents withmaximum flexibility in answering questions regarding motivations (whythey behave as they do), or in explaining attitudes, behaviors, or intentionsin greater depth. Their responses can be categorized by the researcher afterthe questionnaire has been completed, but the extra time for collecting andcategorizing responses may add to the expense of the study (thousands ofdollars for each open-ended question).
Dichotomous Questions
Dichotomous questions give two choices: either yes or no, or a choice oftwo opposite alternatives. They are preferred for starting interviews, areeasy to tabulate, and can be used as a lead-in for more specific questions to aparticular group. A weakness of dichotomous questions is that they canforce a choice where none exists or lead to bias (such as the classic “Do youstill cheat on your taxes?”___ Yes ___ No). Another weakness is that fewquestions can be framed in terms of a dichotomy, particularly more com-plex questions.
Multichotomous Questions
Multichotomous questions provide several alternatives to respondents.In some cases they may be asked to select only one from a list or asked to se-

lect as many as are applicable. The advantages of the multichotomous ques-tion are: ease of administration, ease of tabulation, and flexibility for factualas well as attitudinal responses. Some disadvantages exist in the length ofthe list of alternative responses, response alternatives may not be mutuallyexclusive, or reading the list may lead the respondent to a particularresponse.
Scales
Although a scale can be considered a multichotomous question, it de-serves separate consideration. (Scaling was discussed and examples pro-vided in Chapter 5.) The benefit of a scale is that it permits the objectivemeasurement of attitudes and feelings. This allows for the identification ofsegments who are more favorably inclined toward a product, service, or is-sue. Scaling is somewhat subject to various frames of reference differencesand to the halo effect. Some debate exists concerning whether scales shouldbe balanced or unbalanced. Balanced scales have the same number of re-sponses on the positive side of the scale as on the negative side of the scale.Unbalanced scales have more possible responses on one side of the scalethan the other, usually the positive side. Some debate also exists overwhether to have a neutral response. Those who feel there should be a “neu-tral” option believe so because they think that this is a legitimate responsecategory and for the sake of accuracy the respondent should have that“ground to stand on.” People against having a neutral response category ar-gue that most individuals are unlikely to be authentically neutral on an is-sue. They consider the neutral as an easy way out or a “polite negative.”Consequently, they feel that it is much better to frame the issue so that therespondent is “forced” to indicate a preference, however slight.
The “don’t know,” or “no opinion” response should always be availableto respondents. An honest expression of a lack of awareness, experience, orthought given to an issue should be allowed so that these responses are notlumped together with those people who have considered the issue and findtheir position is the neutral point on the scale.
Earlier we mentioned that the researcher must look ahead to the analysisstage of the research process when determining the types of questions in or-der to ensure that the right levels of data are obtained to accommodate theplanned analytical techniques. By this we mean that the researcher whoplans to use specific analytical techniques (e.g., multiple regression, multi-dimensional scaling, conjoint analysis, analysis of variance, etc.) to test hy-potheses or determine the relationship between variables of interest (such asbetween sales volume and various attributes of the target market), musthave collected data in the form required by the analytical technique. In otherwords, one cannot just use any data as an input to these techniques. They re-

quire “raw data” in very specific forms before they can be run, just as a pro-duction process requires raw material to be in a very specific form to be ableto produce a product. It must be determined how to analyze the data evenbefore questions are written that will generate the data. In the interest ofsimplifying things somewhat, we will confine our questionnaire design sug-gestions to address analytical procedures no more complicated than cross-tabulation. As will be seen in Chapter 9, that technique is the most widelyused and useful approach to getting managerial answers to the research ob-jectives.
Develop the Specific Questions
Step five of the process of constructing a questionnaire is to actuallywrite the specific questions that will be asked (i.e., the operational defini-tions of our constructs’ attributes discussed in Chapter 5). The previoussteps regarding the information required and the choices made relative tothe types of questionnaire and questions will, to a large extent, control thecontent of the questions. The wording should be understandable and as ex-plicit as possible. Questions should be worded in ways that avoid leading,pressuring, or embarrassing the respondent. The questions should avoidambiguous words. Six basic rules for wording questions are:
1. Keep the questions short, simple, and to the point. Reasons for keep-ing the questions as brief as possible are that longer questions makethe response task more difficult, are more subject to error on the partof both interviewers and respondents, cause a loss of focus, and areless likely to be clear. One question should not ask more than onething at a time.
2. Avoid identifying the sponsor of the survey. In some cases, such ascustomer satisfaction surveys, the researcher may want to identify thesponsor of the survey. In most cases, however, it is best to not identifythe sponsor so more objective responses may be gathered.
3. Keep the questions as neutral as possible. Unless a question can beworded objectively, it should not be asked. Nonobjective questionstend to be leading because they suggest an answer.
4. Do not ask unnecessary questions. Always ask yourself, “Is this ques-tion necessary?” Each question should relate or add meaning to a spe-cific research objective. If the question falls in the “nice to know” but“not necessary” category, leave it out.
5. Avoid asking questions the respondent either cannot answer or willnot answer. Since respondents will answer most questions, it is impor-tant to determine if a respondent can be expected to know the informa-tion desired. On other occasions, respondents will have the informa-

tion required but may not be willing to divulge it. If a question appearsto be sensitive it may be best to leave it out. If it is crucial to the re-search objective, then it is best to ask the sensitive question later in thesurvey after a degree of trust has been established with the respondent.
6. Avoid asking leading or overly personal questions. Words or phrasesthat show bias are emotionally charged and will lead to inaccurate re-sults. When sensitive questions must be asked, they should be askedafter a warm-up period and/or hidden within a series of less personalquestions.
Researchers should refer to some of the standard texts on how to word ques-tions.3
Determine Question Sequence and Length of the Questionnaire
Step six can be extremely important in the completion rate of the survey.Excessive length may deter some respondents from completing the survey.This step can be equally important to the quality of the results acquired. Thesequence of the questions should follow a logical pattern so it flowssmoothly and effortlessly from one section to another. Another importantconsideration is to ensure that questions building on previous questions areplaced properly in the questionnaire. Generally, questions will flow fromthe general to the specific. This warms up the respondents and lets them re-flect appropriately before being asked specific questions that require goodrecall and some degree of detail. Skip patterns for branching questions needto be carefully designed. Quite often, a respondent must be directed to a spe-cific location in the questionnaire based on a previous question such as,“Have you baked brownies in the past three months?” “Yes” respondents goon to answer specific questions about the baking occasion while “No” re-spondents “skip” to a different part of the survey. Personal, telephone, andInternet surveys lend themselves more to branching than do mail question-naires.
Most questionnaires have three basic sections: (a) introduction, (b) body/content, and (c) classification section.
Introduction
The introduction tells the respondent who the researcher is, why he is re-questing the respondent’s information, and explains what is expected of therespondent. The introduction should explain the purpose of the question-naire and enlist the cooperation of the respondent. In the case of a mail sur-vey this may take place in an attached cover letter. On the phone this is ac-complished with a positive tone without sounding like a polished sales

pitch. Most people want to express their opinion as long as they know it isnot a sales gimmick. The introduction should promise to keep the respon-dent’s identity anonymous and his information confidential. Often the intro-duction will qualify the respondent in a special way to make sure that the in-terviewer is talking only to the right respondents. Qualification questionsmay include brand usage, age/sex categories, security issues such as whetherthe respondent or any member of his or her household works for a competi-tor of the client, an advertising agency or a marketing research company.
Body/Content
The body or main content of the questionnaire provides basic informa-tion required by the research objectives. This is usually the most substantialportion of the questionnaire. If the respondent has not been qualified in theintroduction, the first question of this section should identify the proper re-spondents and have instructions to end the survey for all others. This sectionshould begin with easy, direct questions. Place questions that are personalor reflect a sensitive issue well toward the end of the body. Once respon-dents have become interested in the survey, they are more likely to respondto personal or sensitive issues.
Classification Section
The final section is designed to obtain cross-classification informationsuch as sex, income, educational level, occupation, marital status, and age.These demographic data allow for comparisons among different types of re-spondents. Certain market segments may emerge through the use of thiscross-classification data. Many of these questions address the situational orenvironmental questions described in Table 6.1.
Predetermine Coding
Questionnaires should be precoded so that any difficulties encounteredin entering data into computer tabulation and analysis programs may besolved before the data are gathered. Once the questionnaires are completedand returned, the responses can be quickly entered into the database and re-sults generated.
Pretest the Questionnaire
The eighth step is an essential step that should not be ignored. Followingthe maxim, “the proof is in the pudding,” a questionnaire should be pre-tested before it is administered. A questionnaire may be too long, ambigu-

ous, incomplete, unclear, or biased in some way. Not only will a thoroughpretest help overcome these problems, but it will help refine any proceduralproblems a questionnaire might have. Some of the procedural problemsmight be improper skip patterns and misunderstanding the interviewer. Apretest will evaluate and fine-tune the questionnaire, estimate the time re-quired for completion of the interview, and allow for setup of coding refine-ments for tabulations. The pretest should be administered under actual fieldconditions to get an accurate response. If significant changes result from anoriginal pretest, it is advisable to conduct a second pretest after appropriaterevisions have been made. A relatively small number of interviews are suf-ficient to pretest a normal questionnaire. Once they have been completed,all interviewers who participated should report their findings. They will beable to determine whether the questions work and be able to make sugges-tions for revision.
Review and Revise the Questionnaire
Based on the pretest and a thorough review of all the previous steps, thequestionnaire should be revised. The bottom line for an effective data-gath-ering instrument is the accuracy of the data collected. Everything that canpossibly be done in advance should be done to ensure the accuracy of the in-strument.
The steps used to design an effective data-gathering instrument need tobe viewed as a dynamic outline and not a sequential step-by-step process.Each step should be applied with a sharp eye on the research objectives andthe data needs they require. The finished questionnaire is the result of re-articulating the study objectives into a set of effective questions for extract-ing the required information from the pertinent set of respondents.
SUMMARY
Good questionnaire design is both an art and a science. The questionnaireis a gestalt—more than the sum of its parts—and must be designed in such away that it generates meaningful data. Questions that provide answers to
Research Project Tip
Developing a good questionnaire requires both creativity and highlystructured, disciplined thought. You will go through numerous drafts ofthe questionnaire, so allow plenty of time for this part of the research.Pretest each version of the questionnaire. Refer to the books listed in thischapter’s notes for more on questionnaire design.

our research questions and test our hypotheses are necessary, but not totallysufficient to the construction of the questionnaire. We must also con-textualize the information gained from our research objective-related ques-tions if we are to gather meaningful data that leads to better decision mak-ing.


Chapter 7
Sampling Methods and Sample SizeSampling Methods and Sample Size
In the course of most research projects, the time usually comes when esti-mates must be made about the characteristics or attitudes of a large group.The large group of interest is called the population or universe. For exam-ple, all of the registered Republicans in Jefferson County or all of the headsof households in Madison, Indiana, would each constitute a universe.Examples of a population are all people in the United States, all householdsin the United States, or all left-handed Scandinavians in Biloxi, Mississippi.Once the determination of the study universe is decided, several courses ofaction might be taken. First, the decision might be made to survey all of theentities in the universe. If all of the members of the selected universe aresurveyed, this is called a census. With a census, direct, straightforward in-formation concerning the specific universe parameters or characteristics isobtained. A second course of action would be to survey a sample of the uni-verse (population). A sample is the term that refers to the group surveyedany time the survey is not administered to all members of the population oruniverse. The process of selecting a smaller group of people that have basi-cally the same characteristics and preferences as the total group from whichit is drawn is called sampling.
WHAT IS SAMPLING?
Sampling is something everyone has some experience with. Anyone whohas taken a bite of fruitcake and decided “never again!” or any child who af-ter a quick taste, has tried to hide his or her asparagus under the mashed po-tatoes has experienced sampling.
A famous quote from Cervantes states, “By a small sample we may judgethe whole piece.” Most of our everyday experiences with sampling are notscientific. However, our satisfaction with the results of our decisions, basedon sampling, depends on how representative they are. In marketing researchthe goal is to assess target segments efficiently and effectively by designingand executing representative sample plans.
Sampling consists of obtaining information from a portion of a largergroup or population. While making estimates from a sample of a larger pop-ulation has the advantages of lower cost, speed, and efficiency, it is notwithout risk. However, fortunately for researchers, this risk can be set verylow by using probability-sampling methods and appropriate estimatingtechniques, and by taking a sufficiently large sample. Thanks to the Euro-pean gamblers of several centuries ago who were eager to establish the oddson various games of chance, some of the best mathematical minds of the daywere dedicated to the task. This effort led to the fascinating branch of math-ematics known as probability theory. Development in this area laid thefoundation for modern scientific sampling.
WHY SAMPLING?
There are many reasons for selecting a sampling technique over a census.In most cases the study objects of interest consist of a large universe. Thisfact alone gives rise to many advantages of sampling. The most significantadvantages of sampling are:
1. Cost savings—Sampling a portion of the universe minimizes the fieldservice costs associated with the survey.
2. Time economy—Information can be collected, processed, and ana-lyzed much more quickly when a sample is utilized rather than a cen-sus. This saves additional monies and helps ensure that the informa-tion is not obsolete by the time it is available to answer the researchquestion.
3. More in-depth information—The act of sampling affords the re-searcher greater opportunity to carry the investigation in more depthto a smaller number of select population members. This may be donein the form of focus group, panel, personal, telephone, mail, orInternet surveys.
4. Less total error—As already discussed, a major problem in surveydata collection comes about as the result of nonsampling errors.Greater overall accuracy can be gained by using a sample adminis-tered by a better trained, supervised field-service group. In fact, theBureau of the Census used sampling (as opposed to a census) in theyear 2000 to improve the accuracy of their data.
5. Greater practicality—A census would not be practical when testingproducts from an assembly line, when the testing involves the destruc-tion of the product, such as durability or safety tests or when the popu-lation is extremely large. The U.S. government has great difficulty ac-complishing the U.S. Census every ten years.

6. Greater security—This is particularly true if a firm is researching anew product or concept. Sampling would be preferred to keep theproduct or concept a secret as long as possible.
SAMPLING ERROR, SAMPLE BIAS,AND NONSAMPLING ERROR
It may be somewhat disconcerting to the novice researcher to discoverthat even with all the attention to developing a valid and reliable data-collec-tion instrument (Chapter 5), there are still numerous ways error can contam-inate the research results. We can divide the sources of errors into two cate-gories:
Sampling Error
Sampling error occurs when the sample does not perfectly represent thepopulation under study. Sampling error occurs either from flaws in the de-sign or execution of drawing the sample, causing it to not be representativeof the population, or from chance, the random error that is introduced intoany sample that is taken from a population. Design or execution errors canbe minimized by careful attention to sample selection procedures. Randomerror cannot be avoided, but can be calculated and can be reduced by in-creasing the size of the sample. Convention restricts the definition of sam-pling error to that calculable error which occurs when a sample is drawnfrom a population. We will follow that convention by discussing the calcu-lation of sampling error in this chapter and discussing other errors intro-duced in the sampling process (e.g., such as the selection of a samplingframe) and nonsampling error in Chapter 8.
Sample bias is introduced into a sample when the sample varies in somesystematic way from the larger population. Examples are using the Internetto do a survey that is supposed to represent the entire population. Those whodo not have Internet access may vary in a number of ways from those whodo. The same is true for calling people at home during the day—they are dif-ferent from people who are not at home, asking only people who ride masstransit about their opinions of mass transit funding and believing you havemeasured the general public’s opinions, and so on. Obviously unlike sam-pling error, you can not reduce sample bias by increasing sample size. Infact, increasing sample size merely increases the bias of the results. Con-trolling sample bias is achieved by careful attention to the sampling pro-cess—defining a population of interest, carefully selecting the sample fromthe population that is representative, and having success in obtaining re-sponses from the sample group.

Nonsampling Error
Nonsampling error is introduced into the research results from anysource other than sampling. It can occur whenever research workers eitherintentionally (e.g., cheating, leading respondent) or unintentionally (e.g., bybelonging to an ethnic group, sex, age category, etc., which elicits a particu-lar response from respondents; misunderstanding a response; being tiredand missing a response, etc.) introduce errors into the data-gathering pro-cess; or can occur whenever respondents intentionally (e.g., lying or not re-sponding) or unintentionally (e.g., misunderstanding a question, guessingor answering with a response when “don’t know” is more accurate, becom-ing distracted or fatigued, etc.) introduce error into the responses. Other er-rors can enter the research at the recording, coding, tabulating, editing, oranalysis stages of data management.
We will discuss sampling error in this chapter and some ways of reduc-ing nonsampling error in Chapter 8.
SAMPLING DECISION MODEL
Sampling involves several specific decisions. This section briefly dis-cusses the steps of a sampling decision model (see Figure 7.1).
Step 1: Define the Population or Universe
Once the researcher has decided to apply sampling techniques ratherthan a census, he or she must make several important sampling decisions.The first decision is to define the population or universe. Since sampling isdesigned to gather data from a specific population, it is extremely importantthat the universe be identified accurately. Often this universe is called a tar-get population because of the importance of focusing on exactly who thestudy objects are and where they are located. Usually any effort expended todo a first-rate job of identifying the population pays generous dividendslater in terms of accurate and representative data.
The definition of the population of interest should be related directlyback to the original study objectives. Clues to identifying the target popula-tion can be found in the statement of research purpose. The research ques-tions and research hypotheses generated from the research purpose shouldrefine the definition of the target population. The sample must be reduced tothe most appropriate common denominator. Do the research questions re-quire selecting as sample elements individuals, households, purchase deci-sion makers, or product users? Defining a population improperly can intro-duce bias into the study. Professional staff experience and insight arerequired to properly specify the target population.
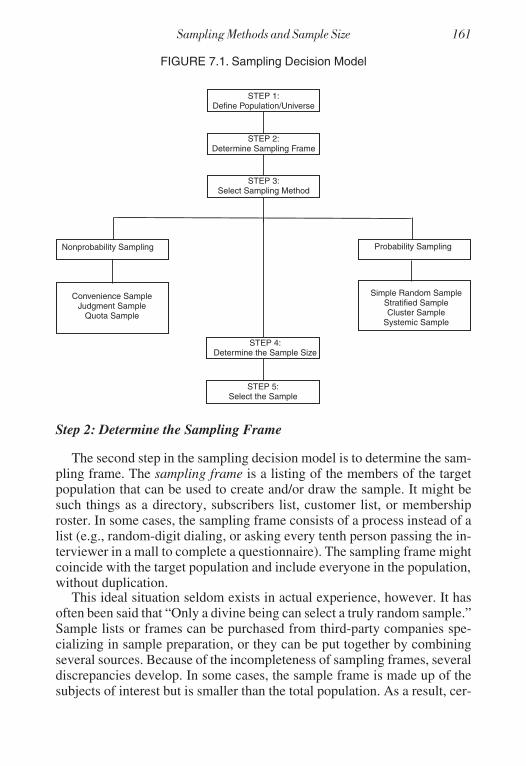
Step 2: Determine the Sampling Frame
The second step in the sampling decision model is to determine the sam-pling frame. The sampling frame is a listing of the members of the targetpopulation that can be used to create and/or draw the sample. It might besuch things as a directory, subscribers list, customer list, or membershiproster. In some cases, the sampling frame consists of a process instead of alist (e.g., random-digit dialing, or asking every tenth person passing the in-terviewer in a mall to complete a questionnaire). The sampling frame mightcoincide with the target population and include everyone in the population,without duplication.
This ideal situation seldom exists in actual experience, however. It hasoften been said that “Only a divine being can select a truly random sample.”Sample lists or frames can be purchased from third-party companies spe-cializing in sample preparation, or they can be put together by combiningseveral sources. Because of the incompleteness of sampling frames, severaldiscrepancies develop. In some cases, the sample frame is made up of thesubjects of interest but is smaller than the total population. As a result, cer-
STEP 1:Define Population/Universe
STEP 2:Determine Sampling Frame
STEP 3:Select Sampling Method
STEP 4:Determine the Sample Size
STEP 5:Select the Sample
Convenience SampleJudgment Sample
Quota Sample
Nonprobability Sampling
Simple Random SampleStratified SampleCluster Sample
Systemic Sample
Probability Sampling
FIGURE 7.1. Sampling Decision Model

tain elements of the population are omitted from the survey. In other cases,the sample frame includes all members of the population but is larger thanthe population. Duplications or inappropriate units are included in the sur-vey in these situations. A third situation occurs when some elements of thepopulation fall in the sampling frame and some elements of the samplingframe are not of the population. In this case, both omissions and undesiredinclusions occur.
For general population surveys, a traditional sample frame has been thetelephone directory. In the United States, 95 percent of potential respon-dents can be reached by telephone. However, the telephone directory is anincomplete sample frame because in some metropolitan areas almost two-thirds of the telephone subscribers have unlisted numbers. Not only doesthis condition cause a large number of people to be left out of the directory,the omission of elements is not proportional across geographical areas. As aresult, random digit designs, where phones are programmed to dial randomdigits, are often used to overcome the exclusion bias inherent in directory-based sampling designs. There are numerous sources of computer-gener-ated, random-digit sample frames for commercial use.
The goal of developing an appropriate sample frame is to get a listing ofelements of the target population that is as inclusive and proportionally rep-resentative as possible with a minimum of duplication.
Step 3: Select the Sampling Method
The third step in the sampling decision model is to select the samplingmethod. This decision logically follows the decisions to determine the tar-get population and to define the sampling frame. The initial consideration inthe selection of a sample is whether or not to employ a probability-samplingprocedure or a nonprobability-sampling procedure.
Step 4: Determine Sample Size
The size of the sample will be a function of the accuracy of the sample.Two criteria are used in measuring accuracy: the margin of error and thelevel of confidence. The first is determined as the tolerated-error range (alsoknown as sample precision) and the second is the probability that the samplewill fall within that tolerated-error range. A margin of error of 3 percent, forexample, means that out of all possible samples of a certain determined sizeof coin flips, 95 percent will differ from the actual population by no morethan three percentage points.
Sample-size determination ultimately is a reflection of the value of theinformation sought. Scientific journals require that reported results mustfall in the 95 to 99 percent confidence levels. When the risk involved in thedecision alternatives is high, then the 95 to 99 percent confidence levels will

be required. However, the sampling of well-known television ratings are atthe 66 percent confidence level. Even though the margin of error in theseratings is far greater than most scientific research, many advertising deci-sions are based on this result. Even low-budget studies, with low-risk deci-sion alternatives that serve as a glimpse into the market environment,should usually not consider a confidence level of less than 80 to 90 percent.The 95 percent confidence level is suggested for most research.
Step 5: Select the Sample
Once the target population has been identified, an appropriate samplingframe determined or compiled, all sampling procedures selected, and a sam-ple size determined, it is time for the final step in the sampling-decisionmode. The sampling process should be executed in an efficient and profes-sional way. Whether a sample is a probability sample or a nonprobabilitysample, the important aspect is to obtain as much representative informa-tion and eliminate as much sampling and nonsampling error as possible.Generally speaking, the sample size should be increased whenever the pop-ulation exhibits high variability or whenever high levels of confidence andprecision are required.
PROBABILITY SAMPLING
Probability samples are simply those samples where each element has aknown chance to be included in the sample. “Known” in this case simply re-fers to the theoretical ability to calculate the likelihood of inclusion in thesample, rather than actually knowing with precision the probability of in-clusion. With nonprobability samples there is no known way of estimatingthe probability of any given element being included in the sample. Withprobability sampling a random or a systematic, chance-based procedure isutilized to select the study elements. The researcher preselects the respon-dents in a mathematical way so that persons in the universe have an equal orknown chance of being selected. From a statistical point of view, probabil-ity sampling is preferred because it allows a calculation of the sampling error.Probability-sampling procedures tend to be more objective and allow theuse of statistical techniques.
Nonprobability sampling introduces certain biases, from an operationalperspective, and offers the advantage of being less expensive and quicker toimplement. However, the fact that a sample is a nonprobability sample doesnot mean that the sample must be less representative than a probability sam-ple. The problem is, with nonprobability samples we cannot compute thedegree to which they are representative, and therefore they cannot be usedto generate such desirable statistics as confidence intervals (i.e., we cannot
say such things as “We are 95 percent confident that 45 percent ± 2 percentof the respondents say they will definitely buy formulation A.”).
The most commonly used probability samples are simple random sam-ples, stratified samples, cluster samples, and systemic samples.
Simple Random Sample
A simple random sample is a technique that allows each element of thepopulation an equal and known chance of being selected as part of the sam-ple. The implementation is often accomplished by the use of a table of ran-dom numbers. Computer and calculator random numbers can also be gener-ated to assist in selecting random samples. A common analogy for a randomsample is the traditional drawing of a sample from a fishbowl containingslips of paper with the names of the elements of the sampling frame.
Stratified Samples
When subgroups of the population are of special interest to the re-searcher, a stratified sample may serve a better purpose than a simple ran-dom sample. A stratified sample is characterized by the fact that the totalpopulation is (1) divided into mutually exclusive subgroups (strata) and that(2) a simple random sample is then chosen from each subgroup. This is amodified type of random sample. The method of creating a stratified sampleensures that all important subgroups are represented in the sample. Thestratified random-sampling technique is good for classifying consumers byvarious demographic factors. Stratified samples can be divided into propor-tionately stratified samples or into disproportionately stratified samples. Aproportionately stratified sample allows for a breakdown where the numberof items randomly selected in each subgroup is proportionate to their inci-dence in the total population. A disproportionately stratified sample is asample where the allocation of sample elements is not established accordingto relative proportion. This may result in an equal number of elements persubgroup or it may result in the greater sampling of the subgroups that havethe greater potential for variability. This, however, requires prior knowl-edge of the characteristics of the population. Just as with a simple randomsample, there can be no stratified sample if there is no available samplingframe of elements of the population that breaks down the population into theappropriate subgroups.
Some specific reasons for choosing to stratify a population sample in-clude:
1. A desire to minimize variance and sampling error or to increase preci-sion. If a population is segmented into strata that are internally homo-geneous, overall variability may be reduced. The required sample size

for a well-designed stratified sample will usually be smaller than for awell-designed unstratified sample.
2. A desire to estimate the parameters of each of the stratum and have a“readable” sample size for each one.
3. A desire to keep the sample element selection process simple.
Cluster Samples
In some cases when stratified sampling is not possible or feasible, clustersampling can be utilized. The first step in selecting a cluster sample is thesame as in a stratified sample: the population is divided into mutually exclu-sive subgroups. However, the next step involves the selection of a randomsample of subgroups rather than a random sample from each subgroup.Cluster sampling may not be as statistically efficient as a stratified sample;however, it is usually more procedurally efficient in terms of cost and time.Cluster sampling is often associated with area sampling. In area sampling,each cluster is a different geographic area, census tract, or block.
Systematic Samples
A fourth technique of probability sampling is called systematic sam-pling. In this method of cluster sampling, every element has a known but notequal chance of being selected. Systematic sampling is an attempt to in-crease the efficiency of the sample at favorable costs. A systematic sampleis initiated by randomly selecting a digit, n, and then selecting a sample ele-ment at every nth interval, depending on the size of the population and thesample size requirement. This method is often used when selecting samplesfrom large directories. Some loss of statistical efficiency can occur withsystematic samples, particularly if there are hidden periodic sequences thatcause some systematic variances to occur at the intervals selected. A sys-tematic sample may be more representative than a simple random sampledepending on the clustering of objects within the sample frame. The ideallist will have elements with similar value on the key defining characteristicsof the sample close together and elements diverse in value in different loca-tions of the list.
NONPROBABILITY SAMPLES
Nonprobability samples are defined as any sampling techniques that donot involve the selection of sample elements by chance. The most com-monly utilized nonprobability sampling techniques are convenience sam-pling, judgment sampling, and quota sampling.

Convenience Sample
The least expensive and least time-consuming of sampling techniques isgenerally considered to be convenience sampling, which is any process thatquickly and easily selects sample elements. The sample element close athand is chosen and surveyed in the application of this technique. Man-on-the-street interviews are examples of this type of sampling. The greatestproblem with convenience sampling is the inability to know if the sample isrepresentative of the target population. Consequently, one cannot general-ize from the sample to the target population with a high degree of confi-dence.
Since the convenience sampling technique follows no predesignatedmethod, the sampling error cannot be calculated and specific precision andconfidence level estimates cannot be made. Even with the drawbacks ofconvenience sampling, it is frequently used, particularly for exploratory re-search.
Judgment Sample
The representativeness of a judgment sample depends on the skill, in-sight, and experience of the one choosing the sample. Although a judgmentsample is a subjective approach to sampling, the knowledge and experienceof a professional researcher can create a very representative sample. This isparticularly true in industrial studies where a knowledge of the industry dy-namics and decision-making procedures is necessary in identifying the cor-rect respondents. In the area of polling “expert opinion,” judgment samplescan be very effective. Even though judgment samples are more restrictiveand generally more representative than convenience samples, they have thesame weakness that does not permit direct generalization of conclusions de-rived to a target population. In the final analysis, representativeness of ajudgment sample depends on the experience, skill, knowledge, and insightof the one choosing the sample. Focus group recruitment is an example of ajudgment sampling process.
A particular kind of judgment sample is the “snowball sample.” Thesnowball sample relies on the researcher’s ability to locate an initial groupof respondents with the desired characteristics. Additional respondents areidentified on a referral basis, relying on the initial set of respondents to iden-tify other potential respondents.
Quota Sample
Quota sampling is the third type of nonprobability sampling; it is similarin some respects to stratified and cluster sampling. In quota sampling, theresearcher divides the target population into a number of subgroups. Using

his or her best judgment, the researcher then selects quotas for each sub-group. The quota method takes great effort to obtain a representative sampleby dividing the population and assigning appropriate quotas based on priorknowledge and understanding of the characteristics, of the population.Quite often the subgroups of the population are divided into categories suchas age, sex, occupation, or other known characteristics. Usually quotas areassigned based on known proportions for these characteristics, such as pro-vided by the U.S. Census. In this way, a quota sample can be drawn to repre-sent the population based on the defining characteristics selected. An exam-ple could be to establish quotas based on age/sex proportions provided bythe census and known product-usage patterns. While this would not ensurea representative sample, the researcher would know that the respondentscome in the same proportion as the total population among product usersand nonusers.
The difference between quota sampling and stratified sampling is thatquota samples do not use random sampling from the categories as we do instratified sampling. Also, in stratified sampling we must select the stratabased upon a correlation between the category and the respondent behaviorof interest (e.g., expenditures on furniture vary by age of head of house-hold). In quota sampling researcher judgment is used in establishing the cat-egories and choosing the sample from the categories.
The problems with quota sampling are the same as for other non-probability-sampling methods. The sampling error cannot be calculated andprojection to the total population is risky. A quota sample might be very rep-resentative of the quota-defining characteristics; however, there may besome other characteristic that is supremely important in defining the popu-lation that is not used to establish quotas. Consequently, this characteristicmay be disproportionately represented in the final sample. It is impracticalto impose too many cell categories on a quota sample. Despite some of itsdrawbacks, quota sampling is often used in market research projects.
PROBABILITY VERSUS NONPROBABILITY SAMPLING
The reader by now realizes that probability-sampling methods are themethods of choice for descriptive research and nonprobability methods forexploratory research. This fits our discussion in Chapter 2, when we said ex-ploratory research is best described as “flexible,” while descriptive is bestdescribed as “rigid.” It also makes sense when we remember the goal of ex-ploratory research is to generate ideas, insights, better focus the problem,etc.—all of which are best done by using a nonrandom-respondent selectionprocess, and choosing a smaller number of people than we would choose ifour goal is to measure or describe a population in terms of frequencies andcovariations as we do in descriptive research. For example, if we are screen-

ing people for inclusion in in-depth interviews or for focus groups, we wantto use a nonprobability (i.e., nonrandom) method of selection so we can talkto those people whose experience puts them in the best position to provideus with the insights, ideas, etc., we are looking for.
In contrast, when we do descriptive research we are ultimately measur-ing the frequency with which something occurs, or the extent to which twovariables co-vary (e.g., consumption rate varies with respondent age),which means we want to be able to report results using statistics (e.g., “Weare 95 percent confident that the average of our heavy users age is 35.2 ± 3years.”). The only sampling method that allows us to report statistical re-sults in this way is probability sampling, and hence, since we want to “de-scribe” our population in this way when doing descriptive research, wewant to use probability-sampling methods.
It is worth remembering that we previously mentioned that exploratoryresearch sometimes uses surveys, as does descriptive research. But the re-sults of an exploratory-research survey using nonprobability samplingcould not be reported the same way as descriptive-research results. Whereasthe descriptive research/probability survey results of a sample of 200 re-spondents might be stated as: “We are 95 percent confident that the averageage of our heavy users is 35.2 ± 3 years;” our exploratory/nonprobabilitysurvey results for a sample of 400 (i.e., sample size twice as large) couldonly be reported as: “Our heavy users are about in their midthirties.”
Our nonprobability sample may be as representative as our probabilitysample, but because it was chosen using a nonprobability method we are notable to calculate the sampling error, and therefore will never know if it wasas representative. But again, such a limitation is of no consequence if we aremerely looking for ideas, insights, generating hypotheses, etc. It is of con-siderable consequence if we are testing hypotheses, trying to establish fre-quencies, co-variation, etc.
STATISTICAL SAMPLING CONCEPTS
Statistical Determination of Sample Size
The sample size for a probability sample depends on the standard error ofthe mean, the precision desired from the estimate, and the desired degree ofconfidence associated with the estimate. The standard error of the meanmeasures sampling errors that arise from estimating a population from asample instead of including all of the essential information in the popula-tion. The size of the standard error is the function of the standard deviationof the population values and the size of the sample.

( )σ σx n= /
σ x = standard errorσ = standard deviationn = sample size
The precision is the size of the plus-or-minus interval around the populationparameter under consideration, and the degree of confidence is the percentagelevel of certainty (probability) that the true mean is within the plus-or-minus in-terval around the mean. Precision and confidence are interrelated and,within a given size sample, increasing one may be done only at the expenseof the other. In other words, the degree of confidence or the degree of preci-sion may be increased, but not both.
The main factors that have a direct influence on the size of the sampleare:
1. The desired degree of confidence associated with the estimate. Inother words, how confident does the researcher want to be in the re-sults of the survey? If the researcher wants 100 percent confidence, heor she must take a census. The more confident a researcher wants tobe, the larger the sample should be. This confidence is usually ex-pressed in terms of 90, 95, or 99 percent.
2. The size of the error the researcher is willing to accept. This width ofthe interval relates to the precision desired from the estimate. Thegreater the precision, or rather the smaller the plus-or-minus fluctua-tion around the sample mean or proportion, the larger the sample re-quirement.
The basic formula for calculating sample size for variables (such things asincome, age, weight, and height) is derived from the formula for standarderror:
σ σx
n=
nx
= σ
σ
2
2
The unknowns, in theσ σx n= / formula areσ x (standard error),σ (stan-dard deviation), and n (sample size). In order to calculate the sample size,the researcher must:
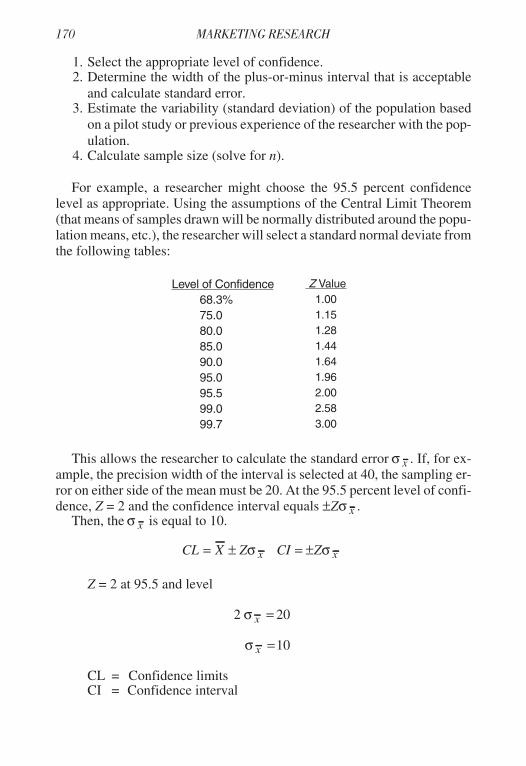
1. Select the appropriate level of confidence.2. Determine the width of the plus-or-minus interval that is acceptable
and calculate standard error.3. Estimate the variability (standard deviation) of the population based
on a pilot study or previous experience of the researcher with the pop-ulation.
4. Calculate sample size (solve for n).
For example, a researcher might choose the 95.5 percent confidencelevel as appropriate. Using the assumptions of the Central Limit Theorem(that means of samples drawn will be normally distributed around the popu-lation means, etc.), the researcher will select a standard normal deviate fromthe following tables:
Level of Confidence Z Value68.3% 1.0075.0 1.1580.0 1.2885.0 1.4490.0 1.6495.0 1.9695.5 2.0099.0 2.5899.7 3.00
This allows the researcher to calculate the standard error σ x . If, for ex-ample, the precision width of the interval is selected at 40, the sampling er-ror on either side of the mean must be 20. At the 95.5 percent level of confi-dence, Z = 2 and the confidence interval equals ±Z xσ .
Then, the σ x is equal to 10.
CL X Z CI Zx x= ± = ±σ σ
Z = 2 at 95.5 and level
2 20σ x =
σ x =10
CL = Confidence limitsCI = Confidence interval

Having calculated the standard error based on an appropriate level ofconfidence and desired interval width, we have two unknowns in the samplesize formula left, namely sample size (n) and standard deviation (�). Thestandard deviation of the sample must now be estimated. This can be doneby either taking a small pilot sample and computing the standard deviationor it can be estimated on the knowledge and experience the researcher has ofthe population. If you estimate the standard deviation as 200, the samplesize can be calculated as:
σ σ
σ
σ
x
x
n
n
n
n
n
=
=
=
=
=
2
2
2
2
200
10
40 000
100400
( )
( )
,
The sample size required to give a standard error of 10 at a 95.5 percentlevel of confidence is computed to be 400. This assumes that assumptionsconcerning the variability of the population were correct.
Another way of viewing the calculation of sample size required for agiven precision of a mean score is to use the following formula:
nZ
h=
2 2
2
σ
Z = value from normal distribution table for desired confidence levelσ = standard deviationn = sample sizeh = desired precision ±
Using the same information as used in the previous example, the same re-sult is obtained:
n = ( ) ( )
( )
2 200
20
2 2
2

n = ( )( , )
( )
4 40 000
400
n = 160 000
400
,
n = 400
Determining sample size for a question involving proportions or attrib-utes is very similar to the procedure followed for variables. Proportions in-volve such attributes as those who eat out/do not eat out, successes/failures,have checking accounts/do not have checking accounts, etc. The researchermust:
1. Select the appropriate level of confidence.2. Determine the width of the plus-or-minus interval that is acceptable
and calculated the standard error of the proportion ( )σ ρ .3. Estimate the population proportion based on a pilot study or previous
experience of the researcher with the population.4. Calculate the sample size (solve for n).
The basic formula for calculating sample size for proportions or attrib-utes is derived from the formula for standard error of the proportion:
σ ppq
n=
σ p = standard error of proportionp = percent of successq = percent of nonsuccess (l–p)
Assume that management has specified that there be a 95.5 percent con-fidence level and that the error in estimating the population proportion notbe greater than ±5 percent (p ± 0.05). In other words, the width of the inter-val is 10 percent. A pilot study has shown that 40 percent of the populationeats out over four times a week.
CI ZCI
p p= ± ±σ σ2
σ σp p= =005
20025
..

Substituting in:
σσ
pp
pq
nn
p q= = .2
( )( )( )
n n n= = =. .
.
.
.
40 60
025
24
00625384
2
Another way to view calculating the sample size required for a given pre-cision of a proportion score is to use the following formula:
nZ p q
h= ⋅2
2
( )
Z = value from normal distribution table for desired confidence levelp = obtained proportionq = l-ph = desired precision ±
Using the same information as used in the previous example, the same re-sult is obtained:
( )n =
( ) (. ) .
(. )
2 40 60
05
2
2
( )( )n =
4 24
0025
.
.
n = .
.
96
0025
n = 384
The sample size required to give a 95.5 percent level of confidence thatthe sample proportion is within ± 5 percent of the population proportion is 384.
Since sample size is predicated on a specific attribute, variable, propor-tion, or parameter, a study with multiple objectives will require differentsample sizes for the various objectives. Rarely is a study designed to deter-mine a single variable or proportion. Consequently, to get the desired preci-sion at the desired level of confidence for all variables, the larger samplesize must be selected. In some cases, however, one single variable might re-

quire a sample size significantly larger than any other variable. In this case,it is wise to concentrate on the most critical variables and choose a samplesize large enough to estimate them with the required precision and confi-dence level desired by the researchers/clients.
It should be noted that the statistical methods of establishing sample sizeapply only to probability samples. In the case of the nonprobability samplesmentioned earlier in this chapter, the chance of any element of the popula-tion being chosen for the sample is unknown. Consequently, the principlesof normal distribution and the central limit theorem do not apply. This elim-inates the possibility of being able to use the formulas discussed in thischapter to establish sample size. These formulas also are applicable only tosimple random samples (i.e., not to stratified, cluster, or systematic sam-pling).
The choice of sample size for a nonprobability sample is made on a sub-jective basis. This should not concern the researcher too much becausemany of the estimates made to calculate sample size for probability sampleswere also made on a subjective basis. In nonprobability samples, size is de-termined by the insight, judgment, experience, or financial resources of theresearcher.
Nonstatistical Determination of Sample Size
While the formulas previously listed are used to calculate sample size,frequently in marketing research studies one of the following nonstatisticalapproaches is used to establish the sample size for a research study.1 Recallthat our determination of sample size is a separate step in the sampling pro-cess from determination of sampling method (i.e., probability versus non-probability). Therefore, using one of these nonstatistical approaches to es-tablish the size of the sample does not change the way in which we wouldreport our findings from the sampled respondents, it merely affects the ulti-mate selection of sample size (and hence, with a probability sample, it af-fects the sampling error). So, using one of these nonstatistical approaches tosetting sample size might change a reported result using a probability sam-pling method from
“We are 95 percent confident that the average age of our heavy con-sumers is 35.2 ± 3 years.” (Sample of 200)
to“We are 95 percent confident that the average age of our heavy con-sumers is 35.7 ± 1.8 years.” (Sample of 350)
but using the nonstatistical approach does not alter our ability to report sta-tistical results as shown here.

Use Previous Sample Sizes
Companies that do repeated studies over time to gather similar informa-tion to compare data and determine trends might automatically use the samesample size every time the research is conducted. Also, if the same type ofstudy is done (e.g., concept tests of new product ideas), companies will of-ten use the same sample size. Researchers are cautioned against using thesame sample size for all research studies—it is possible to be spending toomuch or too little money compared to the value of the information.
Use “Typical” Sample Sizes
“Common wisdom” has led to an accepted sample size based upon thenumber of subgroups which might be used to analyze the data (see Table7.1). Another typical sample size determination based on the number ofsubgroups is that major subgroups should have 100 or more respondents(e.g., males and females = 2 major subgroups), and less important sub-groups should have approximately 50 respondents (e.g., males under 35 yearsold, 35-50 years old, 51+ years old, plus females under 35 years old, 35-50years old, 51+ years old = 6 subgroups). Using this rule-of-thumb, the anal-ysis of males versus females would mean a minimum sample size of 200(i.e., 2 × 100), while males versus females by age categories would mean aminimum sample size of 300 (i.e., 50 × 6).
Use a “Magic” Number
Decision makers unaccustomed to reviewing research findings before mak-ing decisions may be skeptical of research findings that reveal unexpected re-sults or that go against conventional wisdom. In such cases, researchers
Number ofSubgroups
Consumer or Households Institutions
NationalRegionalor Special National
Regionalor Special
0-4 850-1,500 200-500 50-500 50-200
5-10 1,500-2,500
500-1,000 350-1,000+ 150-500
Over 10 2,500+ 1,000+ 1,000+ 500+
TABLE 7.1. Typical Sample Sizes for Consumer and Institutional PopulationStudies
Source: Adapted from Seymour Sudman, Applied Sampling, Academic Press,New York, 1976.

should say something like “It is possible this research will produce findingswhich may be unexpected. What size sample would you need to see the re-sults as legitimate representations of the market and not a fluke?” Samplesizes should then exceed the number given by the decision makers who willreview findings in making their decisions.
Use Resource Simulations
Perhaps the most common method of selecting a sample size is “what-ever the budget will allow.” An example of determining sample size usingthis method:
Total amount allocated for research $30,000Minus fixed costs (research company fees, data analysiscosts, overhead, etc.) -16,000Amount available for variable costs $14,000Divide by cost of completed interview ÷ $15Equals number of interviews that can be conducted withinthe budget (i.e., the sample size) 933
Such an approach to determining sample size has appeal because it is ex-pressed in a language managers understand—dollars and cents. Of course, asample size determined in this way should be checked against the other re-search information needs to see if the size is satisfactory and efficient.
Ask an Expert
A final nonstatistical approach is to ask an expert in research for adviceon appropriate sample size. The expert will probably use one of the statisti-cal or nonstatistical approaches described here, but at least you will feelbetter about determining the sample size.
WHAT IS A “SIGNIFICANT” STATISTICALLYSIGNIFICANT DIFFERENCE?
Henry Clay once said, “Statistics are no substitute for judgment.” Justbecause two values can be adjudicated as statistically different does notmean that they are substantively different, and the reverse is also true. Sub-stantive significance refers to the strength of a relationship or the magnitudeof a difference between two values. Does the difference imply real-worldpracticality? If a very large sample is used, very small differences may beconcluded to be statistically different; however, they may not be different inany substantive way. On the other hand, the difference between two values

in a research project may not test as being statistically significant at a givenlevel of confidence, but if the difference holds up in the real world it couldbe substantively significant.
SUMMARY
Chapter 7 has presented the important aspects of sampling. The nature ofthe research project determines the type of sample, the sample size, the sam-ple frame, and the method necessary to correctly draw/select the sample. Insome projects, sampling consideration is a critical decision area because ofthe impact on costs and the need to draw inferences about the populationfrom which the sample is drawn.
Research Project Tip
You should address how you will select a sample(s) in your research,whether your research is exploratory, descriptive, causal, or any combi-nation of these designs. You might, for example, be using a non-probability sample to conduct in-depth interviews in the exploratoryphase of your research, and a probability approach for the descriptivephase. Describe the process you will use in each case, following the five-step process covered in this chapter.


Chapter 8
Fielding the Data-Gathering InstrumentFielding the Data-Gathering Instrument
Once the questionnaire has been completed, it is ready for the field. Thefield-operation phase of the research process is the occasion that the data-collection instrument is taken to the source of the information. The planningof the field work is closely related to the preparation of the questionnaire,and the sample selection. All three of these aspects of data gathering mustbe well conceived, planned, and executed in order to achieve the objectivesof a study. Error can occur in all three phases, and the field collection por-tion is no exception. The results of any excellently conceived questionnairedrawn from a scientifically selected representative sample can be nullifiedby errors in the fielding of the questionnaire. Consequently, the data-collec-tion phase of the marketing research process is extremely important. Apoorly executed data-collection effort can nullify the impact of a well-designed sampling scheme and data-collection instrument.
PLANNING
To minimize total error and to gather accurate information as efficientlyas possible, the field service of a questionnaire should be well planned.Time, money, and personnel must all be budgeted appropriately. Time forthe field portion of a research project is extremely important, since it mustfit into the overall time frame of the entire research project. The field serviceportion should have a realistic completion date with a little leeway built in.This will allow for timely and accurate completion. Since the field workmust be done before analysis can occur, good sequencing is necessary.
Budgets
Money must be appropriately budgeted for the field service effort. Costmust be assigned to all the component activities of the field-service phase.Cost estimates must be made for:

1. Wages of interviewers, supervisors, and general office support2. Telephone charges3. Postage/shipping4. Production of questionnaire and other forms5. Supplies
Staffing
Personnel is the key to successful field-service operations. Care must betaken to have the best possible personnel to accomplish the research task.There is no substitute for well-trained, experienced interviewers. Conse-quently, the personnel must not only be selected and scheduled for a project,they must have been trained in the techniques of interviewing. Some of thebasic rules of interviewing are discussed later in this chapter. Another im-portant part of preparing the personnel for a specific study is to ensure theyare thoroughly briefed on the specific aspects of the questionnaire that willbe administered. The personnel must have a clear understanding of the data-gathering instrument and what information is desired.
GUIDELINES FOR INTERVIEWERS
The field-service operation should include the following responsibilitiesto be carried out by the interviewer:
1. Cover the sample frame in accordance with instructions to ensure rep-resentative data. The proper areas and/or persons must be contacted.
2. Follow study procedures and administer the questionnaire as written.Be familiar with the questionnaire before beginning.
3. Write down open-ended responses verbatim. Record all other re-sponses according to instructions in the proper terms of measurement.
4. Probe, but do not lead. If a person does not understand the question,read it again, verbatim, perhaps more slowly or with more inflection.
5. Establish rapport with the interviewee. Be confident in what you aredoing and assume people will talk to you. Most people love to havethe opportunity to say what they think. Reflect enthusiasm in whatyou are doing, but do not lead the respondent.
6. Accomplish a field edit to ensure that the data are being collected inappropriate form.

TYPES OF INTERVIEWS
Personal Interviews
The requirement of personal interviews creates special problems fromthe field-service point of view. As discussed in Chapter 4, personal inter-views may be done through door-to-door, mall intercept, central location in-terviewing, or executive interviewing. Interviewers must be located, screened,hired, trained, briefed, and sent out in the proper geographic areas called forin the sampling plan in order to execute a door-to-door survey. A companywill often hire outside field-service organizations to conduct this type of in-terviewing. If a company has subcontracted the entire project to an outsideconsultant firm, it would be wise to make sure that the research firm has itsown in-house field-service personnel or at least has a good network of fieldservices that it subcontracts to. Interviewers must also be well trained in theart of interviewing, but quite often they must also understand technicalterms and jargon, particularly in industrial marketing research. This highdegree of competence and preparation of interviewers, as well as the timeand travel involved, make this door-to-door interviewing quite expensive.
Mall-intercept interviewing is a very popular way to execute personal in-terviews across a wide geographic area. This method of survey researchintercepts shoppers in the public areas of shopping malls and either inter-views them on the spot or executes a short screening survey and, if respon-dents qualify, they are invited to a permanent interviewing facility in themall to participate in a research study. Many different types of studies maybe conducted in shopping malls: concept studies, product placement/homeuse tests, taste tests, clipboard studies (short, simple surveys), simulatedcontrolled-store tests, and focus groups.
Another method of questionnaire administration that involves a personalinterview approach is a recruited central location test (CLT). A CLT usuallyinvolves the need for a probabilistic sample plan or a category of respondentthat has a low incidence that cannot be conveniently located by other ap-proaches. In this type of study, respondents are screened ahead of time andinvited to a location at a preset time for the actual interview. These locationsmay include an office, church, school, private facility, hotel/motel, or evena mall research facility.
In-store intercepts are sometimes done to personally interview survey re-spondents. These studies are usually accomplished in a retail establishmentcentral to the project’s objectives (e.g., in a tire store for discussion of tirepurchases).
Executive interviewing is the industrial equivalent of door-to-door inter-viewing. This type of interviewing requires very skilled interviewers who

are well versed on the subject matter of the project. Consequently, this typeof research is very expensive.
Telephone Interviews
Some of the same considerations involved with the development andmanagement of a group of personal interviewers applies to telephone inter-viewers. However, greater control of a telephone interviewing staff can bemaintained, particularly if the work is accomplished from a central tele-phone location. The entire interviewing effort can be monitored by a trainedsupervisor. On-the-spot questions can be answered and field editing can beaccomplished to allow for quick correction of any problems with the data-gathering instrument. Computer-assisted interviewing systems have greatlyautomated telephone survey research and allow for better supervision, sam-ple administration, and quality control. Currently, telephone interviewing isone of the most widely utilized types of survey communication, due to thetime and financial advantages of the method. Callbacks can be made muchmore easily and many people will talk on the phone when they would notopen their door to talk with a stranger. In addition, telephone interviewingcan execute a study design that requires a probability sample that would betoo costly to do in a door-to-door manner.
Mail Surveys
Mail surveys eliminate the problems of selecting, training, and supervis-ing interviewers. They are convenient, efficient, and inexpensive. However,they create some of their own problems such as lack of response and cover-age, inability to control the sample responding, time lags in response, in-ability to handle lengthy or complex material, and potential for misinterpre-tation of questions.
The procedure for mail-survey administration is the same for question-naire development, pretesting, finalization, and production. However, themail survey eliminates the field-service worker. In place of the personal ortelephone interview, there is a mailing or series of mailings of the question-naire. Postcard reminders, incentives, tokens, and follow-up questionnairescould be sent at appropriate times to encourage return of questionnaires.
Internet Surveys
The Internet is increasingly being used as a means of conducting market-ing research. Exploratory research is done by conducting Internet focusgroups, or by asking questions in “chat rooms.” Obviously, the objectivehere is the same as for all exploratory research—gain insights, ideas, clarifi-cations, etc. The Internet is also being used to conduct exploratory research

surveys. One firm that specializes in conducting marketing research overthe Internet is www.InsightExpress.com. Begun in December 1999 by apartnership of NFO and Engage Technologies, it allows companies of allsizes to conduct marketing research surveys at an average cost of $1,000.When a company signs up to do a survey, InsightExpress puts out bannerads to those consumers and businesses that are included in Engage’s 35 mil-lion profiles database that match the researcher’s desired characteristics forthe respondents. Respondents are given various incentives through Insight-Express’s alliance with Mypoints.com. InsightExpress says that initiallythey will provide qualitative and directional insight (i.e., exploratory re-search) into the needs, opinions, and behaviors of targeted consumers orcustomers, but that eventually they want to have statistically representativesamples (i.e., descriptive research). Until then, firms like InsightExpresscan be used for exploratory purposes to screen ideas, check the pulse of themarketplace, get a reaction to advertising copy, get a general idea of cus-tomer satisfaction, and so on. Other firms doing both exploratory and de-scriptive surveys over the Internet are <www.greenfieldonline.com> and<www.websurveyor.com>. More information on conducting Internet sur-veys can be found in Don Dillman’s, Mail and Internet Surveys.1
THE INTERVIEWING RELATIONSHIP
Cooperation
The first step in the interviewing process requires the interviewer to ob-tain the cooperation of the potential respondent to be interviewed and thento develop rapport with the respondent. If the interview is on an informal,conversational basis, the respondent will be at ease, and he or she will beless hesitant to voice real opinions. To be conversational and informal, aninterviewer need not lose control of the situation. A balance should besought between the stiff, formal inquisition, in which questions are grimlyread and answers methodically checked, and the situation where the inter-viewer is too friendly and is out of control. An interview in which twentyminutes is spent on the actual questions and twenty minutes more is devotedto irrelevancies and “conversation” is inefficient.
Rapport
The second step of the interviewer is to develop appropriate rapport withthe respondent. Rapport is the term used to describe the personal relation-ship of confidence and understanding between the interviewer and the re-spondent; rapport provides the foundation for good interviewing. A prereq-uisite to good rapport is that the respondent knows where he or she stands in

the interview. The interview is actually a new situation for most people,and, when it begins, the respondent does not know what is expected or howfar he or she can safely go in expressing opinions. Obviously, a respondentwill react more favorably and openly in a situation he or she understandsand accepts. The respondent should understand that the interview is confi-dential, that the interviewer is a friendly person ready to listen, that he or shecan discuss the interview topics in detail, and that the information beingprovided is important. Throughout the interview, and especially in its earlystages, the interviewer should make a careful effort to establish the tone ofthe interview in the respondent’s mind. The respondent will then have aclear idea of where he or she stands, and what roles he or she and the inter-viewer have. The respondent should be made to understand that there are noright or wrong answers, that the interviewer is only interested in unbiasedresponses to the questions. Most people like to share their opinions. Goodrapport, coupled with a well-designed data-gathering instrument, shouldserve the goal of making the interview a very positive experience for the re-spondent.
THE INTERVIEWING SITUATION
The Approach
The approach an interviewer takes in executing a survey is extremely im-portant. In order for the sample to be representative, it is important that po-tential respondents are not “lost” or passed by because of something an in-terviewer may do or say to cause the potential respondent to refuse toparticipate or be excluded from the sample.
How To, How Not To
The method of approach will vary a great deal according to circum-stances. As a general rule, the following scripted approach works well:
Hello. I’m (name) from (agency). We’re conducting a survey in thisarea on (subject), and I’d like your opinion.
Notice the introduction does not ask, “May I ask you some questions?”;“Are you busy?”; “Would you mind answering some questions?”; or“Could you spare a couple of minutes?” These are approaches that allow therespondent to say “No” easily and should be avoided.

Qualified Respondent
The interviewer should make sure that the respondent qualifies for thesurvey. If only certain types of people are specified for in the study, no com-promise can be made.
In most surveys, only one member per household should be interviewed.Including more than one interview per household will bias the survey. Theexception, of course, is when the study itself seeks to collect data from mul-tiple members of the same household, such as hearing from both husbandand wife regarding a purchase decision.
Time Factor
The respondent should not be misled about how long an interview mighttake. An accurate answer should be given if asked, or in long interviews it ishelpful to state the time required before an interview begins. However, theinterviewer need not call attention to time or the length of the interview un-less the respondent asks or appears to be in a hurry. For most respondents,time passes very quickly while they are engaged in responding to a survey.
Declines, “Too Busy”
Should a respondent initially decline to be interviewed, the interviewershould not give up too easily. He or she should be patient, calm, and pleas-antly conversational. Often a potential respondent who has initially refusedwill then agree to participate. If a person is completely opposed to being in-terviewed, the interviewer should go on to find another respondent.
In some cases, the selected respondent is actually too busy or is gettingready to go out so that an interview at that time is impossible. The inter-viewer should give a general introduction and try to stimulate the respon-dent’s interest to the extent that he or she will be willing to be interviewed ata later time. The interviewer may need to suggest several alternate times be-fore a convenient time for the interview can be agreed upon. If the survey isbeing done by telephone, an excellent technique to obtain later cooperationis to offer the respondent the option of calling back on a toll-free, 800 num-ber at his or her convenience. Callback appointment times can be noted onthe screening questionnaire/introduction page of the questionnaire.
Respondents may ask why they were selected. The interviewer shouldexplain that they were selected as one of a very small number of people inthe area to take part in the survey. The respondent should be told there are noright or wrong answers; the interviewer is only interested in candid opin-ions. The respondent should be told that responses are confidential, and that

identity will not be disclosed since responses will be grouped or tabulated aspart of a total with hundreds of other interviews.
THE ACTUAL INTERVIEW
If at all possible, the respondent should be interviewed alone. The pres-ence of other persons may influence the respondent’s answers. From time totime, the respondent may be accompanied by a friend who may begin to an-swer the questions with or for the respondent. The interviewer should re-mind them that he or she is interested in only the opinions of the respondent.
The Questionnaire
The interviewer should be completely familiar with the designed ques-tionnaire and all survey materials before conducting an interview. Practiceinterviews should be conducted to assure that the interviewer will not beawkward with his or her first respondents.
The interviewer should know and follow instructions that are actuallyprinted on the questionnaire or CRT screen in all capital letters or enclosedin parentheses. They will indicate:
1. Skip patterns (tell which questions to ask next when a specific answerto a question is given).
2. When to read or not read possible answer sets.3. When only one answer may be recorded or when multiple answers are
acceptable.
Legibility
This issue arises when interviewers are unable to input responses directlyinto the computer. Legibility is of paramount importance in filling out suchquestionnaires. Often a lot of time is wasted in the tabulation process by try-ing to decipher just what was written. The interviewer should always taketime at the end of the interview to scan the work and rewrite any words thatmay be difficult to read by someone else. Each interview should be checkedto see that it is entirely legible and understandable.
The interviewer should always use a lead pencil with sufficiently darklead to be easily read. Do not use colored pencils or any form of ink: a num-ber 2 lead pencil is preferable. Some forms to be scanned require blanks tobe filled in with a number 2 pencil.

Asking the Questions
Each question on a questionnaire has been designed for a specific pur-pose. If an interviewer were to record or put the questions into his or herown words, a bias would be introduced and the interviews would no longerbe like those of fellow interviewers who are asking the questions as statedon the questionnaire.
In the case where a respondent does not seem to understand the question,the interviewer should repeat the question to the respondent slowly, butagain, not explain it in his or her own words. If the respondent cannot an-swer or refuses to answer a question, the circumstances should be noted inthe margin and the interviewer should go on to the next question.
Do Not Lead the Respondent
The interviewer must not “lead” the respondent. By this we mean that theinterviewer should not ask the respondent anything that would direct the re-spondent to answer the way he or she thinks the interviewer would like. Theinterviewer should never suggest a word, phrasing, or idea to the respon-dent. An example of leading would be:
Respondent: It tasted good.
Interviewer: By good, do you mean fresh?
Respondent: Yes.
The interviewers’ correct clarification to a “It tasted good” responseshould be “What do you mean by ‘good’?”
Do Not Be Negative
It is human nature to ask a question in a negative way. By this we meanthat instead of asking, “What else do you remember?” as he or she should,the interviewer may ask inappropriately, “Don’t you remember anythingelse?” or “Can’t you remember anything else?” By asking a question in anegative way, the interviewer may put the respondent on the defensive, andcontinued negative questioning may lead to irritation and termination. Inaddition, the normal reply to a negative probe is a negative response . . . No.
Record the Response Verbatim
Not only should the questions be asked verbatim; the interviewer is to re-cord the answers verbatim. The interviewer will usually be able to keep up

with the respondent. If the answer rushes on, the interviewer may have to re-peat each of the respondent’s words as he or she writes. The respondent usu-ally slows down when this is done. Or, the interviewer may have to say,“You were saying something about. . . .” The respondent will usually goback and cover the point again.
Another way of slowing down the respondent is by explaining that his orher answer is very important and the interviewer wants to be sure to get ev-ery word down.
The exact words of the respondent capture more of the “flavor” of the re-sponse and the respondent than through the use of pet phrases and words.The interviewer must not edit or rephrase the respondent’s answer. Re-sponses are recorded in the first person, exactly as the respondent states hisor her answer.
“X” or Circle, Not a Check
Unless otherwise specified by specific survey instructions, closed-endresponses should be noted with an “X.” An “X” has been proven to be morelegible than a check.
If the instructions indicate that the interviewer is to circle a specifiednumber on the questionnaire to indicate a respondent’s answer to a ques-tion, it should be neatly circled and should not extend around a second wordor number. When a questionnaire uses a grid format for responses, careshould be taken to circle the answer in the column number corresponding tothe question number.
Interviewer Attitude
The interviewer must remain completely neutral. A respondent’s an-swers can easily be biased by the interviewer interjecting improper voice in-flections, biasing comments, or making facial gestures.
The respondent should not be rushed. Some people just do not think orconverse as rapidly as others. It should be recognized that the respondent isbeing asked for an opinion without prior preparation and about which he orshe has had very little time to think.
When interviewing, the interviewer does not have to have an expression-less face. He or she should develop the habit of encouraging the respondentto talk, without leading, and then listen carefully to what is said. There aremany ways to indicate that the interviewer is following the respondent’s re-marks. Sometimes the nod of the head is sufficient; sometimes unbiased re-marks such as “I see what you mean,” “I understand,” or “That’s interest-ing,” will keep the respondent expressing ideas and thinking further aboutthe topic without leading or biasing the data.

Closure
After completing the interview, the respondent should be thanked. Be-fore the interviewer leaves a respondent, he or she should review responsesto all questions to be certain that they have been answered correctly and theanswers are clear, meaningful, and legible. The interviewer should thenleave as quickly and pleasantly as possible.
Classification, Demographic, and Statistical Information
Generally, questionnaires include some classification questions such asincome, age, education level, occupation, number of children in household,etc. Most people answer such questions willingly. Refusals will be rare ifthese questions are asked properly in an unapologetic fashion. Respondentsmay also be told that the answers are tabulated by a computer and that noone answer will be looked at individually.
Validation
A validation questionnaire should be prepared for every project. Thisquestionnaire should include the original screening questions plus standardquestions on method of recruitment, acquaintance with the interviews, andparticipation in other studies. Validation should be completed within one totwo days of the end of fielding the real survey. This important quality checkon the fieldwork ensures that the interview has actually taken place. Ten to15 percent of all respondents who were reportedly interviewed are recon-tacted to verify their participation. If a respondent cannot answer the verifi-cation questions satisfactorily, then the interview that he or she allegedlycompleted is declared “invalid” and those results are not included in the ag-gregated tabulations. If more than one invalid survey is attributed to a spe-cific interviewer, all of that interviewer’s work is discarded.
FIELDING A RESEARCH PROJECT
Security of the Survey
The questionnaires, the responses, and all materials used in conjunctionwith the survey are confidential and should be returned to the supervisor atthe completion of interviewing. Respondents generally are not told forwhom the study is being conducted. The interviewer should not discuss in-terviews with family, friends, other interviewers, or anyone else. Confiden-tiality of the client and survey content and results is of utmost importance.

Briefings
Briefings, or training sessions, will be held before each project is initi-ated. The entire job will be discussed, giving both the supervisor and the in-terviewers an opportunity to carefully study job specifications and instruc-tions and to ask any questions pertaining to the job. Field instructions willbe reviewed and practice interviews will also be conducted to familiarize in-terviewers with the questionnaire. Individuals will be assigned quotas orspecific duties involved with the job.
Supervisor Assistance
Each research project must have adequate supervision. If a question orproblem arises, the interviewer should ask the job supervisor and not an-other interviewer for assistance. Once called to the supervisor’s attention,any questions or problems can be remedied for all interviewers on the job orcan be referred to the client for resolution.
Do Not Interview Friends or Acquaintances
A friend or acquaintance of the interviewer should never be interviewed.He or she might answer the questions in a manner that he or she thoughtwould “please” the interviewer, rather than give a candid response.
Adhere to the Study Specifications
The specifications of a study have been set forth for very definite rea-sons, and the specifications must be adhered to, to the letter. Therefore, ifthe interviewing method is personal, the interviewer cannot interview a re-spondent on the telephone; if the interviewer is to contact only one person inthe household, he or she cannot interview other family members; if the in-terviewer is to interview one person at a time, he or she cannot interview agroup of respondents. The interviewer cannot interview the same respon-dent on multiple studies at the same interview. By doing any of these things,the interviewer would not be following the specifications, and the inter-views would be rendered useless.
Follow All Study Procedures and Instructions
It is very important that each interview be conducted in the same mannerby all interviewers. Instructions about showing exhibit cards, posters, orkeeping products concealed must be obeyed the same way in all interviews.Detailed field instructions are designed to reiterate to supervisors and inter-viewers the technical aspect of executing the specific study, and are usually

provided for each project. These instructions come in many forms. A simplestudy may require an administrative guide, an interviewer’s guide, a tallysheet, and sample questionnaire. More complicated tests may require quotasheets, test plans, preparation instructions, product-handling procedures,exhibits, concept statements, and/or sorting boards.
The administrative guide is designed for the field supervisor of the study.It provides useful background information, a start and end date, quotas, re-spondent qualifications, procedures for conducting the study, personnel re-quirements, briefing instructions, and many other special instructions.
The interviewer guide is provided for each interviewer. The interviewerguide usually has some of the same information as the administrative guideas well as specific step-by-step, question-by-question instructions on howto administer the survey questionnaire.
Accurate Record Keeping
It is the interviewer’s responsibility to keep accurate records of all infor-mation required by the supervisor or the survey’s client. If the addition ofcolumns of numbers is required, it is the interviewer’s responsibility that theaddition be correct. Information collected through use of a tally sheet is of-ten just as important as information collected in the actual interview.
Complete Assignments on Time
An interviewer is responsible for completing assignments on time. Shouldunforeseen circumstances arise, or if the interviewer anticipates that the as-signment will not be completed within the specified time, the supervisorshould be notified immediately.
Work Efficiency
Two factors can affect the efficiency of work performance: speed andquality. Conducting interviews at a reasonable speed is important. How-ever, speed for the sake of numbers should never sacrifice quality. On theother hand, gaining desired information from the respondent is critical andcan be done without spending undue time on any one area or by undue con-versation with the respondent.
Probing
Many questions, particularly in in-depth interviews, are open-ended andrequire the interviewer to coax the answers from the respondent. Getting asmuch information as possible from open-ended questions often requiresskillful probing. The interviewer should never assume anything about what

the respondent is implying, but he or she should probe to get clear and com-plete answers to all parts of the question in the respondent’s own words. Thetwo basic purposes of probing are to clarify and develop additional informa-tion.
Clarify
The interviewer should get as much information as possible from open-ended questions. An answer that tells something specific is much morevaluable than getting several answers that are vague. The interviewer’s ob-jective should be to clarify why the respondent gave a particular answer toone of the questions. The more concrete and specific these reasons are, themore valuable the information becomes. For example, a respondent is talk-ing about a car that he or she believes would be “economical.” What does heor she mean by economical? He or she means that it is not very expensive tobuy, that it gets good gas mileage, that it is not very expensive to maintain,that it has a high trade-in value, or something else. It is up to the interviewerto find out precisely what the respondent means by “economical.”
The following is an example of how to probe for clarity.
Respondent: It’s not my kind of movie.
Interviewer: Why do you say that?
Respondent: It doesn’t look interesting.
Interviewer: What do you mean by “interesting?”
Respondent: The thread of the picture seems difficult to follow andthe action is slow and drawn out. I enjoy fast-paced, action-packedmovies.
Develop Additional Information
An interviewer must often get respondents to expand on an answer. “Itwould be true to life” or “It makes you think” and other general answersshould be probed by saying “Why do you say that?” or “Tell me more aboutthat.” Many of the best probes are on key words and the interviewer may re-peat the key words from the respondent’s answer as a question: “True tolife?” or “Makes you think?”
The following is an example of probing for additional information.
Respondent: They showed a bowl of soup.
Interviewer: What kind of soup was it?

Respondent: It looked like vegetable soup.
Interviewer: What else did they show?
Respondent: A little boy eating the soup and smiling because he liked it.
Interviewer: What did they say about the soup?
Respondent: They said this soup makes a warm and nutritious mealin itself.
Technical Aspects of Probing
1. When key words are probed, the word in the respondent’s answer be-ing probed should be underlined, e.g., “I thought the soup lookedtasty.”
2. Probing questions asked that are not tied to key words should be indi-cated by prefacing those questions with a “p” with a circle around it,signifying an interviewer probe.
3. Answers should always be recorded verbatim in the respondent’s ownwords. The interviewer should not edit, try to improve his or her Eng-lish, or put things in complete sentences for him or her. Abbreviationsmay be used when possible as long as they are obvious to anyone whomight see them. If they are not, go back after the interview and writethem out.
4. The interviewer should begin writing the minute the respondent be-gins to speak. Responses are much more easily recorded if started be-fore the respondent gets underway.
5. If necessary, the interviewer may ask the respondent to stop for a min-ute, or to repeat something he or she missed.
6. The interviewer should never lead the respondent. Legitimate probesmust be distinguished from leading questions. A leading questionwould be “Was it a bowl of vegetable soup?” or “Do you rememberthe little boy that was in the ad?” Anything that suggests somethingspecific about the subject is inadmissible.
Summary
Get specifics. Ask “what else” only after probing the original response.Do not accept an adjective or a thought—find out why the respondent feelsthat way. Get the respondents to expand on their answers. Details, whetherpositive or negative about the subject, are very important. Figure 8.1 illus-trates words to clarify and questions to help probe and clarify.
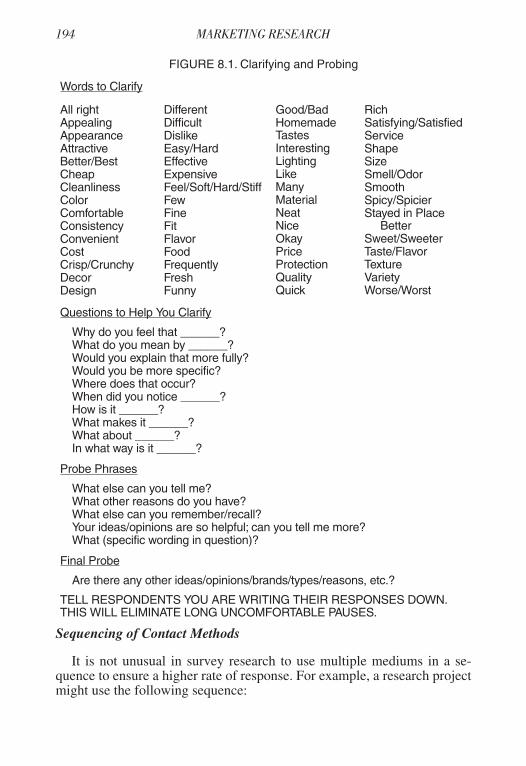
Sequencing of Contact Methods
It is not unusual in survey research to use multiple mediums in a se-quence to ensure a higher rate of response. For example, a research projectmight use the following sequence:
Words to Clarify
All rightAppealingAppearanceAttractiveBetter/BestCheapCleanlinessColorComfortableConsistencyConvenientCostCrisp/CrunchyDecorDesign
DifferentDifficultDislikeEasy/HardEffectiveExpensiveFeel/Soft/Hard/StiffFewFineFitFlavorFoodFrequentlyFreshFunny
Good/BadHomemadeTastesInterestingLightingLikeManyMaterialNeatNiceOkayPriceProtectionQualityQuick
RichSatisfying/SatisfiedServiceShapeSizeSmell/OdorSmoothSpicy/SpicierStayed in Place
BetterSweet/SweeterTaste/FlavorTextureVarietyWorse/Worst
Questions to Help You Clarify
Why do you feel that ______?What do you mean by ______?Would you explain that more fully?Would you be more specific?Where does that occur?When did you notice ______?How is it ______?What makes it ______?What about ______?In what way is it ______?
Probe Phrases
What else can you tell me?What other reasons do you have?What else can you remember/recall?Your ideas/opinions are so helpful; can you tell me more?What (specific wording in question)?
Final Probe
Are there any other ideas/opinions/brands/types/reasons, etc.?
TELL RESPONDENTS YOU ARE WRITING THEIR RESPONSES DOWN.THIS WILL ELIMINATE LONG UNCOMFORTABLE PAUSES.
FIGURE 8.1. Clarifying and Probing

1. Select respondents, obtain their phone number, mailing address, e-mailaddress.
2. Contact respondents by mail or e-mail telling them they have been se-lected for the study, asking them to go to a Web site or call an 800number to arrange a time for a phone interview, or tell them a ques-tionnaire will be mailed soon.
3. Phone interview conducted or questionnaire mailed or e-mailed.4. Phone, mail, or e-mail follow-up to ask for completion of survey if re-
sponse not received.
ERRORS IN DATA COLLECTION
The accuracy of any data provided in a research project depends on sev-eral interrelated things. First of all, there must have been clearly articulatedresearch objectives. Second, correct design must have been accomplished.Third, correct sampling techniques and procedures must have been used.Fourth, the data must have been collected well, and finally, the data must beanalyzed correctly. Mistakes or errors at any point can negate excellent de-sign sampling, survey technique, and questionnaire design. Figure 8.2 illus-trates the relationship between sampling and nonsampling error.
There are many types of errors generally classified as sampling andnonsampling errors. Sampling error was discussed in Chapter 7. However,nonsampling error, which results from some systematic bias being intro-duced during the research process, can be a bigger problem than samplingerror. Nonsampling errors are not a result of sampling. They include mis-takes that come from sampling frame errors, nonresponse errors, and dataerrors.2 Nonsampling errors commonly arise from errors in design, logic,interpretation, field service, or presentation.
Nonsampling errors are a numerous breed. They are pervasive in natureand are highly arbitrary. Nonsampling errors, unlike sampling errors, do notdecrease with sample size. In fact, they tend to increase as sample size in-
TOTAL ERROR
NonsamplingError
SamplingError
Sampling FrameErrors
NonresponseError
DataErrors
InterviewerError
MeasurementErrors
ProcessingErrors
NoncoverageErrors
OvercoverageErrors
FIGURE 8.2. Sources of Research Error

creases. While sampling errors can be estimated, the direction, magnitude,and impact of nonsampling errors are generally unknown. As a result ofthis, nonsampling errors are frequently the most significant errors that ariseduring a research project. Their reduction is not dependent on increasingsample size, but on improving methods and procedures dealing with thehandling of the data itself.
TYPES OF NONSAMPLING ERRORS
There are three basic types of nonsampling errors: sampling frame error,nonresponse error, and data error. Sampling frame errors occur when certainparts of the survey population are not represented or are overrepresented inthe study. This could result if part of the population of interest was not includedor if some portions of the population are overrepresented. Nonresponse errorsresult when there is a systematic difference between those who respond andthose who do not respond to a survey. Data errors occur because the infor-mation gathered is inaccurate or because mistakes are made while the data isbeing processed. Quite often nonsampling errors are made without the re-searcher being aware of them. This makes them potentially dangerous to theoutcome of the project. An understanding of these types of errors will helpthe researcher prevent or correct them.
Sampling Frame Errors
Sampling frame errors generally consist of noncoverage and overcoverageerrors. Noncoverage errors occur when some elements of the original popu-lation are not included in the sample. The bias from this type of error is thedifference in characteristics, attributes, and opinions between those who areincluded and those who are not included. This is a very troublesome prob-lem in marketing research because researchers do not know if there are sig-nificant and strategic differences between the ones who did not respond andthe ones who did when there is no information on the noncovered potentialrespondents. Noncoverage is basically a problem with the sampling frame.The sampling frame is simply a listing of all the possible members of thepopulation being studied. All of the basic survey methods depend on a list-ing of the members of the population under study. Telephone directories arenot complete frames of a city’s population because not every household hasa number. Furthermore, of those that do, many are unlisted, and many peo-ple are in transition at any given time. Mail surveys have the same noncoverageproblems, because there is rarely a list that exactly includes the total popula-tion under study.
The noncoverage of sample members is as important as the noncoveragethat results from not including all possible respondents in the sample frame.

This occurs when the listed sample units are not contacted and happens withboth personal and telephone surveys. Quite often this situation arises wheninterviewers do not follow instructions or do not make the appropriatecallbacks.
The most effective ways to limit the extent of noncoverage error is to rec-ognize its existence and to take conventional measures. These measures are:(1) improve the sample frame; (2) establish clear instructions concerningwho to interview, when to interview, and where to interview; (3) specifycallback requirements; and (4) when possible, verify or monitor interviews.
Overcoverage errors occur when there is duplication or overrepresent-ation of certain categories of sampling units in the sampling frame. In manycases, noncoverage of certain portions of the sample frame leads to over-coverage of other portions. Overcoverage can also occur when certain sam-ple units are listed more than once. This leads to double counting and studybias.
Nonresponse Errors
Nonresponse errors occur when some of the elements of the populationselected to be part of the sample do not respond. This happens most fre-quently among mail surveys, but can also occur in telephone surveys andpersonal interviews. The people originally chosen to be interviewed mightnot respond because they are not at home or because they refuse to partici-pate.
“Not at homes” result because the potential respondent is not at homewhen the interviewer calls. This source of nonresponse error tends to be onthe increase. Included in the “not at home” category of respondents arethose who are literally not at home and those who cannot be located. This in-cludes those who use their answering machines or caller ID to screen theircalls while they are out for the day, gone on an extended trip, or even thosewho have recently moved. There is some evidence that the “not at home”categories of respondents tend to have different characteristics than thosewho are more easily located. Dual-career households tend to aggravate theproblem. Care must be taken to account for the “not at home” factor or sur-vey results will be incomplete and biased. The segments less likely to behome will be underrepresented and the results skewed toward the morecommonly at home respondents.
Refusals occur when some respondents decline to participate or termi-nate prematurely after beginning the survey. The actual rate of refusal willdepend on the nature of the respondent, the subject of the research, the abil-ity of the interviewer, the length and design of the questionnaire, and thepersonal situation of the respondent. Mail surveys are particularly suscepti-ble to the refusal nonresponse error. Personal, telephone, and Internet inter-

views are also plagued with refusal nonresponse. Overall, the refusal rateappears to be increasing. More and more people are being interviewed andthe novelty of being surveyed is wearing off. Because of fraud and crime,people are leery of having interviewers come into their homes. The use ofthe phone for telemarketing sales pitches disguised as surveys has alsomade legitimate surveys more difficult to complete.
Fortunately, there are many effective methods of reducing nonresponseproblems. Some of the most common ones are:
1. Sell the respondent on the importance of his or her opinion and thevalue of the research.
2. Notify the respondent in advance and make an appointment for a call-back at a mutually agreeable time.
3. Ensure confidentiality.4. Maintain contact with a callback or a follow-up mailing.5. Include return postage and envelopes for mail surveys.6. Use tokens or money incentives.7. Provide a toll-free 800 number so the respondent can call back at his
or her convenience.
Careful usage of these techniques will increase the response rate of surveysand help avoid the problems associated with nonresponse error.
Data Errors
Data errors consist of interviewer errors, measurement errors, and pro-cessing errors. Usually these errors occur because inaccurate information isgathered from the respondent or the wrong information is recorded. Thiscan result from measurement instrument bias resulting from a poorly de-signed questionnaire. In some cases processing error is also introduced dur-ing the editing, coding, tabulating, and processing of the data. Interviewerbias occurs due to interaction between the interviewer and the respondent.Respondents may overstate or understate certain behaviors, either con-sciously or unconsciously. In some ways these types of errors are the mostdangerous because, unlike nonobservational errors, researchers have noidea when and how observational errors might arise. Careful training, su-pervision, monitoring, and editing is required to minimize this type of error.
A final type of data error that should be mentioned is cheating. Cheatingis the deliberate falsification of information by the interviewer. To avoidthis problem, adequate control and supervision must be exercised.

Research Project Tip
If your research project involves descriptive or causal research you mustdescribe in detail how you will obtain the desired information from the“field.” That is, you must describe the experimental design and the de-tails of its implementation for causal research (see Chapter 2), or how thedescriptive research will be carried out. Use the following checklist toensure you have a plan for taking the descriptive research questionnaireto the field:
1. Budgets—Has money been appropriated for the following?______ Wages of interviewers, supervisors, and general office support______ Telephone charges______ Postage/shipping______ Production of questionnaire and other forms______ Supplies
2. Guidelines for interviewers—Have the following been done?______ An introduction been written______ Interviewers know how much time the interview will take
when asked by respondent______ Provision has been made on the interview form for second
callback appointment______ Interviewer is thoroughly familiar with questionnaire______ Interviewer has been trained as to the proper way to ask
questions and probe for responses______ Interviewer records answers verbatim in legible handwriting______ Interviewer uses proper attitude in conducting interview
3. Validation______ Validation questionnaire has been designed______ Validation questionnaire has been used
4. Administrative Guide—The field supervisor has a guide that in-cludes the following:______ Background information on purpose and objective
of the research______ Start and end dates______ Quotas for interviewers______ Respondent qualifications______ Procedures for conducting the study
(continued)

SUMMARY
Once a data-gathering instrument is designed and the appropriate sampleframe and size selected, it is time to field the instrument and execute thedata-gathering process. To accomplish this smoothly and with a minimumof error, preplanning is a necessity. Proper budgeting and personnel recruit-ment lead the list of planning activities for the well-executed field-serviceeffort. Interviewers should be trained, briefed, and well supervised to obtainoptimum results.
The interviewing relationship requires special attention to ensure properrapport and understanding between the interviewer and respondent. Spe-cific guidelines should be followed by interviewers depending on the typeof interview being conducted.
General rules of interviewing must be maintained at all times. They in-clude: insuring security of the survey, providing proper training and brief-ing sessions, having close supervision, adhering to specific study specifica-tions, following all study procedures and instructions, keeping accuraterecords, completing assignments on time, working efficiently, probing ap-propriately, and achieving clarity.
______ Personnel requirements______ Briefing instructions
5. Interviewing—Probing______ Interviewers are familiar with when and how to probe to
clarify or obtain additional information
6. Nonsampling Errors—Have the following nonsampling errors beenaddressed through preplanned procedures to prevent or overcomethe problems?______ Sampling frame errors
______ Noncoverage______ Overcoverage
______ Nonresponse errors______ Not at home______ Refusals
______ Data errors______ Interviewing errors______ Coding______ Tabulating______ Processing
(continued)

Chapter 9
Introduction to Data AnalysisIntroduction to Data Analysis
Hamlet: Do you see yonder cloud that’s almost in shape of a camel?
Polonius: By the mass, and ’tis like a camel indeed.
Hamlet: Methinks it is like a weasel.
Polonius: It is backed like a weasel.
Hamlet: Or like a whale?
Polonius: Very like a whale.
Hamlet, Act III, Scene ii
Data, like cloud formations, can be made to appear in support of anynumber of conjectures. The fertile mind of the analyst can “see” conclu-sions to the data that may be more the creation of the imagination than anobjective reading of the information generated by the research. This givespause to the researcher/analyst, because it implies that, while there may bean ultimate truth, the analyst’s personal agenda, perceptual inclinations, ex-perience, and even personality can influence the interpretation of the re-search study’s results. Nevertheless, we must use all the means at our dis-posal to arrive at the most objective, concise, but also thorough analysispossible of the data generated by the research. However, the same observa-tion of objective data may be subject to multiple interpretations. Considerthe following apocryphal story:
An American shoe company sent three researchers to a Pacific Islandto see if the company could sell its shoes there. Upon returning theymade a presentation to management. The first researcher summed upthe findings this way. “The people there don’t wear shoes. There is nomarket.” The second researcher said: “The people there don’t wearshoes. There is a tremendous market!” The third researcher reported:

“The people there don’t wear shoes. However, they have bad feet andcould benefit from wearing shoes. We would need to redesign ourshoes, however, because they have smaller feet. We would have to ed-ucate the people about the benefits of wearing shoes. We would needto gain the tribal chief’s cooperation. The people don’t have anymoney, but they grow great pineapples. I’ve estimated the sales poten-tial over a three-year period and all of our costs including selling thepineapples to a European supermarket chain, and concluded that wecould make a 30 percent return on our money. I say we should pursuethe opportunity.”1
The three researchers reported the same results, but with different impli-cations. The term “data analysis” covers a huge number of techniques, sta-tistical programs, and processes that can be applied to the results generatedby the data-collection instrument(s) used in research. These can range frominterpreting respondents’ reactions to projective research (see Chapter 2), orthe conclusions drawn from conducting focus groups (see Chapter 4), to so-phisticated multivariate statistical techniques used to manipulate large data-bases. It is beyond the scope of this book to address these extremes of thedata-analysis continuum. The reader interested in such analytical processesshould read material that specifically addresses those topics.2 The discus-sion in this chapter will be limited to data analysis “basics” that will permitthe researcher/analyst to successfully draw useful information out of thetypes of data generated via a descriptive-research survey format.
FROM DATA TO DECISIONS
The manipulation and analysis of data generated by research becomes a“value-added” management activity when it takes place within a series oftasks leading to management decisions and, ultimately, to a market’s reac-tion to those decisions. Figure 9.1 suggests that the output of the data-analy-sis process is to always lead to better decision making than could have beendone without having conducted the research. This is consistent with the phi-losophy about the value of research presented throughout this book.3
An example may help to elucidate this process. Worthington Foods (nowowned by Kellogg’s), a company that markets egg substitutes (e.g., Scram-blers, Better ‘n’ Eggs) conducted survey research which in part, sought an-swers to the following research objectives:
1. Why do people control their cholesterol?2. How did people who use egg substitutes first hear about them?3. What is the trial-to-usage ratio for those cholesterol controllers who
have tried a brand of egg substitute?

A phone survey of a demographic cross section of the adult, U.S. popula-tion was conducted (2,000 respondents). Once respondents passed a set ofscreening questions identifying them as cholesterol controllers, they wereasked to respond to these and other relevant questions:
1. What is the primary reason you are controlling your cholesterol in-take?
2. Which of the following brands of egg substitutes have you ever tried?Which do you currently use?
3. From which of the following sources did you first hear about egg sub-stitutes?
The following is a sampling of the data bits generated from these ques-tions:
1. Reason for Controlling Cholesterol
On doctor’s orders 36%Family history of cholesterol problem 11%Concerned about future levels 53%
Research Analysis Decision Making Evaluation
DATA BITS
InformationPiece
InformationPiece
InformationPiece
ImplicationStatement
ImplicationStatement
ImplicationStatement
Alternative
Alternative
Alternative
Decision
Decision
Decision
Result
Result
Result
Tools Tools Tools Tools
Surveys
Experiments
Observations
Etc.
Univariate and MultivariateTechniques
Cross TabsFactor AnalysisANOVAEtc.
Models and Simulations
ManagementJudgement
Data-BasedManagement
FIGURE 9.1. Overview of the Data Analysis/Management Decision-MakingRelationship

2. Percentage of all cholesterol controllers trying and using egg substi-tutes brands:
Tried Currently UseEgg Beaters 72% 25%Scramblers 12% 7%Second Nature 4% 1%Eggs Supreme 1% —
3. Source of “first heard” for egg substitute triers:
Friend or Relative 26%Magazine ad 24%TV ad 13%Physician 10%Saw Product in Store 7%Hospital 2%
Each of the numbers listed in these sample tables represents a data bit.Obviously, even a short phone survey can generate thousands of these bitsof data. Although interesting by themselves, they become of even greatervalue when combined with each other to generate “information.” For exam-ple, if we know the number of people who have tried a particular egg substi-tute brand (a data bit) and which of these same people currently use thatbrand (another data bit), we can determine that brand’s retention ratio, thepercentage who have tried and still use, or the brands rejection ratio, the per-centage who tried and no longer use (i.e., information pieces).
Moreover, when multiple pieces of information are combined, some im-portant implications can be drawn. Consider, for example what is learnedwhen information is combined about the primary reason for controllingcholesterol with usage or nonusage of egg substitutes:
Egg SubstituteReason for controlling cholesterol Users Nonusers
On doctor’s orders 61% 32%Family history 12% 11%Future concern 27% 57%
Total 100% 100%
Here, the implication may be drawn that users of egg substitutes aremuch more likely to be under doctors’ orders to control cholesterol than arenonusers. Looking at the data from another angle, of all the cholesterol con-trollers under doctors’ orders to control cholesterol, the vast majority are us-
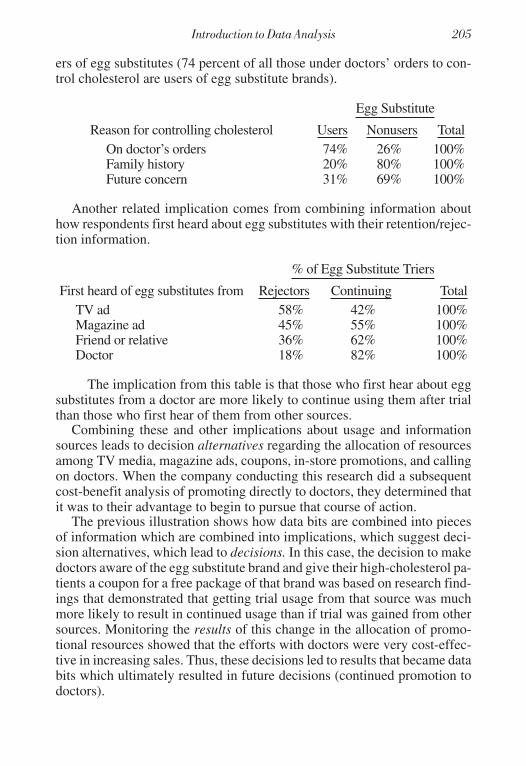
ers of egg substitutes (74 percent of all those under doctors’ orders to con-trol cholesterol are users of egg substitute brands).
Egg Substitute
Reason for controlling cholesterol Users Nonusers TotalOn doctor’s orders 74% 26% 100%Family history 20% 80% 100%Future concern 31% 69% 100%
Another related implication comes from combining information abouthow respondents first heard about egg substitutes with their retention/rejec-tion information.
% of Egg Substitute Triers
First heard of egg substitutes from Rejectors Continuing TotalTV ad 58% 42% 100%Magazine ad 45% 55% 100%Friend or relative 36% 62% 100%Doctor 18% 82% 100%
The implication from this table is that those who first hear about eggsubstitutes from a doctor are more likely to continue using them after trialthan those who first hear of them from other sources.
Combining these and other implications about usage and informationsources leads to decision alternatives regarding the allocation of resourcesamong TV media, magazine ads, coupons, in-store promotions, and callingon doctors. When the company conducting this research did a subsequentcost-benefit analysis of promoting directly to doctors, they determined thatit was to their advantage to begin to pursue that course of action.
The previous illustration shows how data bits are combined into piecesof information which are combined into implications, which suggest deci-sion alternatives, which lead to decisions. In this case, the decision to makedoctors aware of the egg substitute brand and give their high-cholesterol pa-tients a coupon for a free package of that brand was based on research find-ings that demonstrated that getting trial usage from that source was muchmore likely to result in continued usage than if trial was gained from othersources. Monitoring the results of this change in the allocation of promo-tional resources showed that the efforts with doctors were very cost-effec-tive in increasing sales. Thus, these decisions led to results that became databits which ultimately resulted in future decisions (continued promotion todoctors).

This example also demonstrates that data analysis goes beyond merelydetermining answers to research questions. The analytical aspects of thiscase did not stop with reporting answers to the original three research objec-tives, but rather sought to reveal the association that might exist between thethree questions. That is, the implications drawn between the informationpieces were what added real, significant value to the research findings. Theresearch analyst is acting as more than a reporter of findings; he or she isseeking to know the answer to such provoking questions as:
1. What does it mean that this (e.g., why they control cholesterol) andthis (e.g., a difference in retention rate) are both true simultaneously?
2. What does it matter that the researcher has discovered this associa-tion? Answer: It suggests doctors could play an important gate-keeping role in generating product trial for people who may prove tobe brand-loyal heavy users. Not reported in this example, but true forthe research, was the discovery of a direct correlation between eggsubstitute usage rate and doctor involvement.
Therefore, the researcher/analyst’s job is only half over once the researchis finished. The real value-added activities come with the data-analysistasks performed on the gathered data.
DATA SUMMARY METHODS
Developing a Plan of Analysis
For the purposes of this discussion we will assume that the researcher/an-alyst has successfully coded and entered data into the computer and now de-sires printouts that can be analyzed and interpreted.
The first step in generating summary data to be analyzed is to prepare aplan of analysis. Actually, the genesis of such a plan was started in the dis-cussion concerning how to state research questions and hypotheses (Chap-ter 1) and was further developed in the discussion of dummy tables (Chapter 2).Therefore, the heart of a plan of data analysis consists of:
• How to obtain answers to research questions.• How to test hypotheses to determine if they are supported by the data
or must be rejected.• The execution of the dummy tables that were used early in the re-
search design process to alert the researcher to the type and form thedescriptive survey data should take.
• How to display and incorporate into the analysis the results of the“contextualizing” information collected by the questionnaire (seeTable 6.1, p. 142).

However, as demonstrated by the egg substitute research example at thebeginning of this chapter, it may be necessary to go beyond obtaining an-swers to the research questions, testing existing hypotheses, and filling outdummy tables. In that example, a new hypothesis was generated during thedata analysis. The new hypothesis was that retention rates of egg substituteusage would vary by reason for controlling cholesterol and by source of firstmention of egg substitutes. Such an hypothesis could very well have beengenerated at the time the research purpose and objectives were stated at thevery start of the research process. However, it is inevitable that some hy-potheses or specific tabulations or analytical outputs will be initiated duringthe data-analysis process and not before.
Frequency Distributions
It is common for researchers to generate a set of frequency distributionsthat indicate how respondents answered the survey questions. For example:
Q: What is the primary reason you are controlling your cholesterolintake?
Number PercentageOn doctor’s orders 651 36%Family history 199 11%Future concern 959 53%Total 1,809 100%
Note that of the 2,000 respondents surveyed, only 1,809 answered thisquestion. The remaining 191 were omitted for the usual reasons (spoiledquestionnaire, refusal to answer, etc.). The percentage is best computed as100 percent for those respondents who did answer the question, rather thanbased on the full 2,000 respondents. However, the researcher may wish toknow why the 191 subjects were not included. If many could not easilychoose a primary reason (they were controlling cholesterol for two or threereasons), or were controlling cholesterol for reasons not given as a responseoption (e.g., because their spouse was controlling and prepared meals withreduced cholesterol), then the researcher would want to know this so he orshe could revise the question in the future to make provision for such prob-lems. Hopefully, exploratory research done before the survey would revealmost or all of the response categories needed. Also, offering a fourth option:
Other [Record]: __________________________________________
is an expensive, but effective means of learning of other reasons respon-dents control cholesterol. Nevertheless, if the analyst is primarily concerned
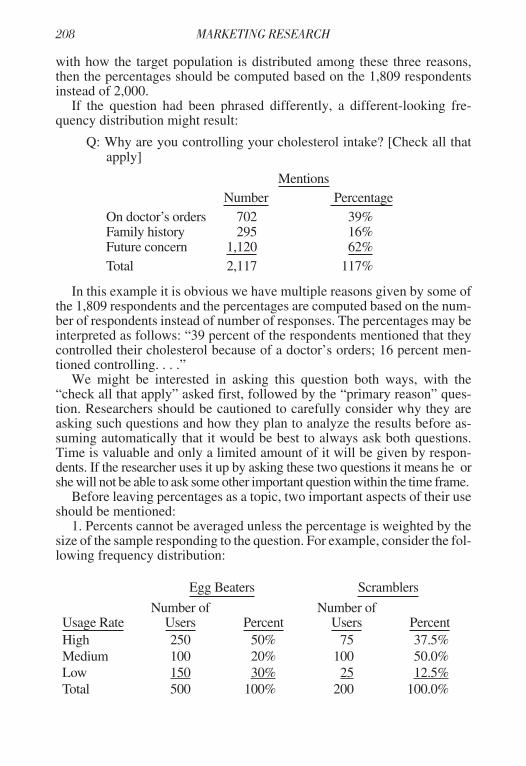
with how the target population is distributed among these three reasons,then the percentages should be computed based on the 1,809 respondentsinstead of 2,000.
If the question had been phrased differently, a different-looking fre-quency distribution might result:
Q: Why are you controlling your cholesterol intake? [Check all thatapply]
MentionsNumber Percentage
On doctor’s orders 702 39%Family history 295 16%Future concern 1,120 62%Total 2,117 117%
In this example it is obvious we have multiple reasons given by some ofthe 1,809 respondents and the percentages are computed based on the num-ber of respondents instead of number of responses. The percentages may beinterpreted as follows: “39 percent of the respondents mentioned that theycontrolled their cholesterol because of a doctor’s orders; 16 percent men-tioned controlling. . . .”
We might be interested in asking this question both ways, with the“check all that apply” asked first, followed by the “primary reason” ques-tion. Researchers should be cautioned to carefully consider why they areasking such questions and how they plan to analyze the results before as-suming automatically that it would be best to always ask both questions.Time is valuable and only a limited amount of it will be given by respon-dents. If the researcher uses it up by asking these two questions it means he orshe will not be able to ask some other important question within the time frame.
Before leaving percentages as a topic, two important aspects of their useshould be mentioned:
1. Percents cannot be averaged unless the percentage is weighted by thesize of the sample responding to the question. For example, consider the fol-lowing frequency distribution:
Egg Beaters Scramblers
Usage RateNumber of
Users PercentNumber of
Users PercentHigh 250 50% 75 37.5%Medium 100 20% 100 50.0%Low 150 30% 25 12.5%Total 500 100% 200 100.0%
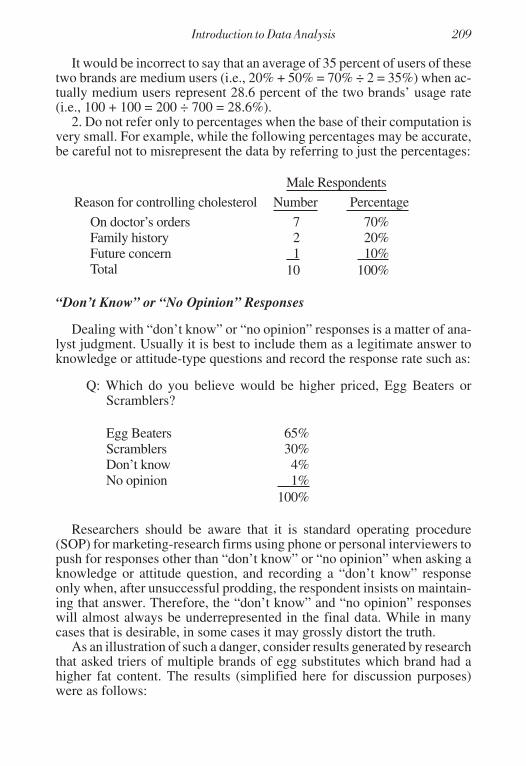
It would be incorrect to say that an average of 35 percent of users of thesetwo brands are medium users (i.e., 20% + 50% = 70% ÷ 2 = 35%) when ac-tually medium users represent 28.6 percent of the two brands’ usage rate(i.e., 100 + 100 = 200 ÷ 700 = 28.6%).
2. Do not refer only to percentages when the base of their computation isvery small. For example, while the following percentages may be accurate,be careful not to misrepresent the data by referring to just the percentages:
Male Respondents
Reason for controlling cholesterol Number Percentage
On doctor’s orders 7 70%Family history 2 20%Future concern 1 10%Total 10 100%
“Don’t Know” or “No Opinion” Responses
Dealing with “don’t know” or “no opinion” responses is a matter of ana-lyst judgment. Usually it is best to include them as a legitimate answer toknowledge or attitude-type questions and record the response rate such as:
Q: Which do you believe would be higher priced, Egg Beaters orScramblers?
Egg Beaters 65%Scramblers 30%Don’t know 4%No opinion 1%
100%
Researchers should be aware that it is standard operating procedure(SOP) for marketing-research firms using phone or personal interviewers topush for responses other than “don’t know” or “no opinion” when asking aknowledge or attitude question, and recording a “don’t know” responseonly when, after unsuccessful prodding, the respondent insists on maintain-ing that answer. Therefore, the “don’t know” and “no opinion” responseswill almost always be underrepresented in the final data. While in manycases that is desirable, in some cases it may grossly distort the truth.
As an illustration of such a danger, consider results generated by researchthat asked triers of multiple brands of egg substitutes which brand had ahigher fat content. The results (simplified here for discussion purposes)were as follows:

Percent Mentioned As High Fat
Brand A 17%Brand B 13%Don’t know 70%
100%
This distribution actually was a test of the researcher’s hypothesis thatthe low involvement of people in purchasing a product such as an egg sub-stitute brand would be reflected in their lack of knowledge about such attrib-utes as fat levels for the brands they had purchased. Consequently, inter-viewers were instructed to record the first response of the subjects and not touse SOP to push for an answer other than “don’t know.” The results sup-ported the hypothesis and suggested that altering some product attributeswould have a limited effect on brand demand. Therefore, researchers shouldconsider how they wish to deal with the “don’t know” and “no opinion” re-sponse percentages.
Central Tendency and Dispersion Measures
As seen in the discussion on measurement (Chapter 5), the measures ofcentral tendency that can be used to describe the data depend upon the typeof data we have generated (nominal, ordinal, interval, ratio). The frequencydistribution discussion in the previous section is pertinent to each of thesefour types of data.
In addition, Figure 9.2 displays the measures of central tendency and dis-persion that can be computed for the data types. The most commonly usedmeasures are:
• Mode: The most frequently occurring response.• Median: The response that separates the top half of response frequen-
cies from the bottom half.• Mean: The average of the responses computed by summing all re-
sponses and dividing by the number of responses.
FIGURE 9.2. Measures of Central Tendency and Dispersion
NominalOrdinalIntervalRatio
ModeMode, MedianMode, Median, Mean, Standard DeviationMode, Median, Mean, Standard Deviation, Geometricand Harmonic Mean

When the question involves indicating the frequency with which some-thing occurs (e.g., the number of times a person eats at a fast-food restaurantin a typical week), the frequency is multiplied by the number of respondentschecking that answer, those numbers are summed, and the mean is com-puted by dividing that sum by the number of total respondents. For an exam-ple see Table 9.1.
In this example, a judgment was made regarding how to code a range ofresponses. Since people are being asked to give an estimate of their behav-ior instead of requiring them to keep a diary or an accounting of their actualbehavior, researchers are dealing with approximate responses instead ofdocumented frequencies. Consequently, the coded midpoint of the range(e.g., 2 to 3 times per week coded as 2.5) is an estimate, and the mean of 1.85times per week is also an approximation. Researchers should not forget thisfact later when they are using this number in calculations and when drawingimplications from such calculations.
It is important to assess the mean’s ability to accurately reflect the sam-ple respondents’ responses by calculating a standard deviation for the re-sponses.
Standard deviation: The degree of “spread” of responses among theresponse categories. It tells us the range of answers that includesroughly 70 percent of the sampled respondents.4
So, if the mean is 1.85 times/wk and the standard deviation is .32, thenroughly 70 percent of respondents (and hence the population universe) eatat fast-food restaurants between 1.53 and 2.17 times per week (1.85 – .32 =1.53; 1.85 + .32 = 2.17). Obviously, the smaller the standard deviation is,the closer the actual responses are to the mean. If the standard deviation islarge relative to the range of responses, then the mean is not a very goodmeasure to use in understanding the data.
For example, if in the previous illustration the standard deviation were tobe 1.70 instead of .32, it is almost half of the range (4 times/wk – .5 time/wk
TABLE 9.1. Calculating Means for Frequencies
(1)Number of times eat at fast-food
restaurants/wk
(2)Number of
Respondents
(1) x (2)
Less than once a week (coded as .5)Once or twice a week (coded as 1.5)Two or three times a week (coded as 2.5)More than three times a week (coded as 4)
10025017550
50375
437.5200
T O T A L 575 1062.5Mean = 1.85 times per week (1062.5 ÷575)

= 3.5). The mean of 1.85 is relatively meaningless, since answers in thiscase are spread widely throughout the range of responses, and few peopleare actually near the mean. This could be an important observation whendealing with a highly segmented population. Consider Figure 9.3, which il-lustrates this idea.
In Figure 9.3, the market in question consists of five market segments.Graphically depicted is a mean that is the computation of the responses fromthe segment members, but there is no segment of respondents that actuallyis at the mean. The mean in this hypothetical example represents no one andis therefore highly misrepresentative of the data. Consequently, consideringthe standard deviation along with the mean as a measure of central tendencyhelps inform the analyst of the dispersion of the data and what precautionsto take when reporting the results.
CROSS-TABULATION
It is almost certainly true that virtually all sets of marketing data will re-veal only a fraction of the possible significant findings if viewed only interms of frequency distributions and measures of central tendency and dis-persion. As seen in the egg substitute market data, more is revealed aboutthe underlying relationship between variables of interest when two or morevariables are considered simultaneously. Cross-tabulation, probably themost frequently used analytical technique in marketing research, involvesexamination of one variable “crossed” by one or more other variables. In theegg substitute example, trial-to-usage or retention rates were examined foregg substitutes crossed by reasons for controlling cholesterol. Several ob-
Segment1
Segment2
Segment5
Segment4
Segment3
MEAN
FIGURE 9.3. Segmented Populations

servations about the use of cross-tabulations will help the analyst achievemaximum benefit from the use of this analytical tool.
Setting Up Cross-Tabulation Tables
We usually think of a cross-tabulation table as looking at two or possiblythree variables simultaneously. This is most often the case when a firm con-ducts the research project itself, including processing the data and usingsome software program such as SPSS to run each cross-tabbed table. If theresearcher has contracted with an independent marketing research firm todo the survey (i.e., send out and receive the mail questionnaires or do thephoning of respondents), the firm will likely be doing the data processing,including setting up the cross-tabs per the researcher’s instructions. If thefirm is responsible for the data collection and processing, then it will proba-bly include as part of the contracted price what will be referred to as an“eighteen-point” or “twenty-point” (or some other number) “banner” (seeFigure 9.4). This means the firm will provide a set of computer printoutpages that are eighteen or twenty columns wide for every question in thesurvey. Each question in the survey would appear down the side of a page,called the “stub.” For example, in a series of Likert-scaled attitude ques-tions, demographic questions, and other types of questions, each questionwould have a separate printout as shown in Figure 9.4.
The appeal of banners is obvious—they provide a simple way to look atsurvey questions crossed by the most important variables the researcher isinterested in exploring (e.g., gender and region in this example).
An eighteen-point banner means any combination of column headingsthat total eighteen can be used. It is usual practice to devote the left-mostcolumn to “Grand Total,” which in effect gives the frequency distributionfor each question. So, this column on Page 1 of the example in Figure 9.4 in-dicates the total number and percentage of people who answered StronglyAgree, Agree, etc., for that question. The remaining seventeen columnsmay be divided in any combination of columns desired. In Figure 9.4, a setof two columns is devoted to gender, followed by four columns for region ofthe country. How are the column headings selected? In a single cross-tabu-lated table such as education level by income, the “independent” variablewould normally be placed across the top and the “dependent” variable downthe side (see Figure 9.5).
We are maintaining that income “depends upon” education, so income isthe dependent variable and education is the independent variable. An easyway to identify the independent and dependent variables in any situation isto ask the question:

Does A depend upon B?A = Dependent variableB = Independent variable
If the researcher is wondering about the relationship between age and at-titude toward pop music, it makes sense to ask:
Does your attitude toward pop music depend upon your age?
The converse question:
Does your age depend upon your attitude toward pop music?
is obviously illogical—I cannot expect that my attitude will influence whatmy age is.
FIGURE 9.4. Sample Printouts

It is customary to have the banner headings consist of independent vari-ables that the research purpose, questions, and hypotheses suggest are mostlikely to be influencing the dependent measures of interest (such as atti-tudes, consumption rate, likelihood of purchase, membership or nonmem-bership, etc.). However, this is not an inviolate rule since the researcher maywish to examine some categories of dependent variables for numerousquestions in the survey. The researcher may want to see how heavy users,light users, and nonusers differ from each other in terms of their attitudes,demographics, behaviors, etc., and would therefore use those three catego-ries of a dependent variable (rate of consumption) as a set of three columnsin a banner. If it is decided to include some dependent variables as bannerpoints it is suggested that two banners be used—one eighteen- or twenty-point banner with all independent variables and a second eighteen- ortwenty-point banner with dependent variables. This will help prevent con-fusion of what the data are revealing, as will be shown shortly.
Another common practice in setting up a banner heading or single cross-tabbed table is to consistently move from low to high, moving from left toright in the banner; and from high to low, moving down the stub. Therefore,a banner heading for income would look like this:
<$15K $15-20K $20-25K $25K+
and a stub heading for income would look like this:
Income$25K+
$20-25K$15-20K
<$15K
If the variable is not a quantifiable number, but is rather one of an ex-pressed intensity of feeling, the same rule holds (see Figure 9.6).
IncomeGrandTotal
Education Level
Etc.< HS HSSomecollege
Col-legeGrad
SomeGrad
GradDegree
$25 K+$20-25 K$15-20 K< $15 K
FIGURE 9.5. Single Cross-Tabulations

FIGURE 9.6. Cross-Tabulations of Nonquantifiable Values
Agreement withStatement
Attitude Toward Product
Unfavorable Neutral FavorableStrongly Agree
Agree
NeitherDisagree
Strongly Disagree
Choosing Variables for Cross-Tabulations
It might be tempting to ask the data processors to “cross everything byeverything” so that a cross-tabbed table for every combination of two ques-tions in the survey is available. That way, no matter what the issue, one ormore tables are available to look at to help the researcher determine the rela-tionship between the variables of interest. Such a temptation should be re-sisted because it both fails to recognize all the valuable thinking about theproject prior to this point, and it also generates a surprising number of tables(e.g., 50 variables generates 1,225 two-way cross-tab tables, 100 variablesgenerates 4,950 two-way tables). Having a request for “every-thing crossedby everything” delivered as a four-foot stack of computer printouts is a sureway to dissuade the start of an analysis of the data!
Considerable thought has already been given to the variables of interestas delineated in the research questions, hypotheses, and dummy tables. Infact, a cross-tabbed table is merely inserting data into a dummy table, so theplan of analysis primarily consists of determining which variables (i.e.,questionnaire questions) should be simultaneously examined for possiblerelationships to get answers to questions, test hypotheses, or fill in dummytables. Although the researcher will think of relationships he or she wishesto examine during the analysis and not before, there is also a point at whichthe researcher must get on with the implications and alternative decisionsuggestions, which is the purpose of the research and its analysis. It is easyto become distracted by the almost infinite number of possible relationshipsso that one avoids drawing the conclusions necessary to move through theprocess shown in Figure 9.1. Finding some balance between focusing onlyon the original objectives of the research and adding to those objectives asthe analysis progresses must be achieved if conclusions are to be reported ina timely fashion.

Interpreting Cross-Tabulations
To this point, tables have been set up and a determination made concern-ing some finite number of relationships between variables to explore. It isnow necessary to discuss some important considerations involved with theirinterpretation. First, if the tables have been set up as suggested, it is possibleto analyze the pattern of percentages from left to right to see if there is a pos-itive or negative relationship between the independent and dependent vari-ables. If the percentages increase moving left to right, there is a positive re-lationship between the variables. If the percentages decrease, then therelationship is negative. For example, in Table 9.2 there is a positive rela-tionship between willingness to pay more to get the favorite brand of eggsubstitutes and consumption rate.
This can be seen by the percentages in the top row (“Strongly Agree orAgree”) going from 34 percent for low consumers to 54 percent for mediumconsumers, to 67 percent for high consumers. If the data had been reportedas a numerical representation of agreement (e.g., Strongly Agree = 5, Agree= 4, Neither = 3, Disagree = 2, Strongly Disagree = 1), we might have seenan average number representing agreement at the bottom of each columnsuch as low consumers = 2.8, medium = 3.6, high = 4.1. So, the same con-clusion would be drawn: amount of agreement with the statement increaseswith consumption rate (i.e., the average of agreement on a five-point scalegoes up as we move up from low to medium to high consumers). The advan-tage of using the averages on the five-point scale rather than the percentagesin the table as shown are that we can run statistical tests to determine if theaverages for the columns are statistically significantly different from oneanother (e.g., is the low consumer’s 2.8 average statistically different fromthe medium consumer’s 3.6 and the high consumer’s 4.1 on the five-pointagreement scale).
TABLE 9.2. Two-Way Cross-Tabulation
I will pay up to $.25 moreto get my favorite brand ofegg substitute.
Egg Substitute Consumption Rate
Low Medium High# % # % # %
Strongly Agree or AgreeNeither Agree
nor DisagreeStrongly Disagree
or Disagree
113
107
108
34
33
33
239
108
98
54
24
22
308
101
54
67
22
11Total 328 100 445 100 463 100

These conclusions are possible, of course, because we are examininghow the respondents answered two different questions in the questionnaire.The cross-tabulated data is showing how each respondent answered Ques-tion #9: “I will pay up to $ .25 more to get my favorite brand of egg substi-tute,” answered by checking a box indicating Strongly Agree or Agree; Nei-ther Agree Nor Disagree; or Strongly Disagree or Disagree, and answeredQuestion #21: “Indicate how frequently you eat egg substitutes in a typicalmonth,” answered by checking a box indicating frequencies such as AlmostDaily, Once to Twice a Week, etc. The analyst has established that re-sponses are to be classified as low, medium, and high and has had the datapresented in that format. Therefore, Table 9.2 shows an aggregation of datafor both columns and rows (i.e., the consumption frequencies have beengrouped into the low, medium, and high categories, and the five levels ofagreement have been grouped into the three categories shown).
Note that in this case it is merely being observed that a positive relation-ship exists between a willingness to pay more to get the favorite brand andconsumption rate without trying to make a claim that one variable causesthe other. In fact, causal relationships cannot be determined from cross-tab-ulated data, even if the demonstrated relationship is statistically significant(to be discussed shortly). That is true even if a correlation coefficient thatdetermined a very strong positive relationship between two intervallyscaled variables was calculated. While too involved to discuss in depth here,the reader should understand that evidence of a positive relationship be-tween variables does not provide evidence that the variables should bethought of as causally related. This is not necessarily a major problem in theanalysis, however, since it may in many cases be sufficient for managers toknow that a relationship exists to choose among alternative decisions (seediscussion in Chapter 2). Evidence of causality does not necessarily alterthe conclusions drawn nor the resulting decision.
Knowing that high consumers of our brand of egg substitutes believe it isworth paying more to get our brand has managerial significance apart fromthe issue of whether consumption rate causes attitude or attitude causes con-sumption. One additional conclusion that might come from such an obser-vation is that it is necessary to look more closely at the way the variables arerelated.
Three-Way Cross-Tabulation
Researchers who see a positive relationship between two variables of in-terest might wonder if there is a third variable that is possibly related to bothof these two variables and that may actually explain more about the exis-tence of this relationship. In the previous example, the researcher mightwonder if household income explains both attitude (willingness to pay more
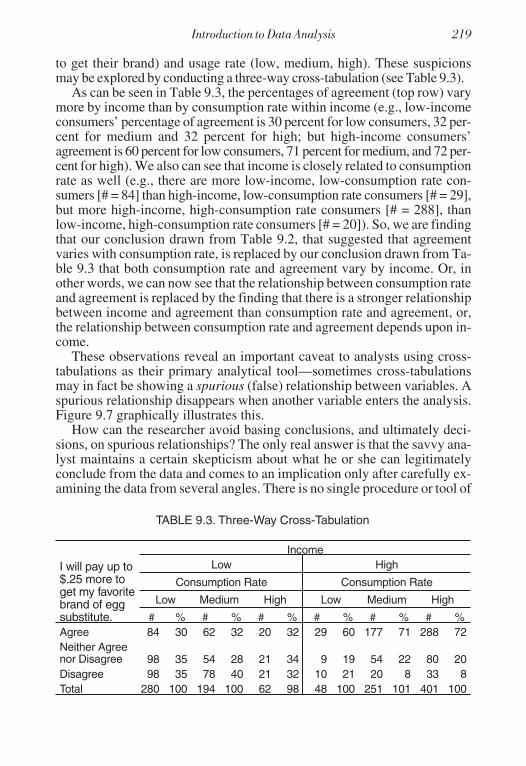
to get their brand) and usage rate (low, medium, high). These suspicionsmay be explored by conducting a three-way cross-tabulation (see Table 9.3).
As can be seen in Table 9.3, the percentages of agreement (top row) varymore by income than by consumption rate within income (e.g., low-incomeconsumers’ percentage of agreement is 30 percent for low consumers, 32 per-cent for medium and 32 percent for high; but high-income consumers’agreement is 60 percent for low consumers, 71 percent for medium, and 72 per-cent for high). We also can see that income is closely related to consumptionrate as well (e.g., there are more low-income, low-consumption rate con-sumers [# = 84] than high-income, low-consumption rate consumers [# = 29],but more high-income, high-consumption rate consumers [# = 288], thanlow-income, high-consumption rate consumers [# = 20]). So, we are findingthat our conclusion drawn from Table 9.2, that suggested that agreementvaries with consumption rate, is replaced by our conclusion drawn from Ta-ble 9.3 that both consumption rate and agreement vary by income. Or, inother words, we can now see that the relationship between consumption rateand agreement is replaced by the finding that there is a stronger relationshipbetween income and agreement than consumption rate and agreement, or,the relationship between consumption rate and agreement depends upon in-come.
These observations reveal an important caveat to analysts using cross-tabulations as their primary analytical tool—sometimes cross-tabulationsmay in fact be showing a spurious (false) relationship between variables. Aspurious relationship disappears when another variable enters the analysis.Figure 9.7 graphically illustrates this.
How can the researcher avoid basing conclusions, and ultimately deci-sions, on spurious relationships? The only real answer is that the savvy ana-lyst maintains a certain skepticism about what he or she can legitimatelyconclude from the data and comes to an implication only after carefully ex-amining the data from several angles. There is no single procedure or tool of
TABLE 9.3. Three-Way Cross-Tabulation
I will pay up to$.25 more toget my favoritebrand of eggsubstitute.
IncomeLow High
Consumption Rate Consumption Rate
Low Medium High Low Medium High
# % # % # % # % # % # %Agree 84 30 62 32 20 32 29 60 177 71 288 72Neither Agreenor Disagree 98 35 54 28 21 34 9 19 54 22 80 20Disagree 98 35 78 40 21 32 10 21 20 8 33 8Total 280 100 194 100 62 98 48 100 251 101 401 100

analysis that will avoid all erroneous conclusions. A healthy dose of skepti-cism is the analyst’s best defense against future regret and recrimination. AsThomas Huxley said: “Skepticism is the highest of duties, blind faith theone unpardonable sin.”5
One sure way to fall prey to spurious relationships, and at the same timebecome distracted from the objectives of the analysis, is to indiscriminatelygenerate cross-tabulations and begin to examine them for “meaningful rela-tionships.” The danger is that the analyst might encounter some table wherethere is a strong relationship between two variables that he or she would notordinarily examine or predict to have such a relationship. Fertile imagina-tion then takes hold and very plausible-sounding explanations are devisedfor what is in reality a spurious and meaningless association between vari-ables. This leads to the sort of fanciful conclusions that Hamlet and Poloniusengaged in as quoted at the beginning of the chapter. The analyst’s best“friends” in this case are the “theories” (research questions, hypotheses, re-lationships of interest) that originated at the beginning of the research.
Analysts would do well to remember that logic should drive data, notdata drive logic (i.e., let hypotheses, which are based on logical expecta-tions, be tested by the data; do not let a “blind empiricism” or indiscriminatedata review determine what is “logical”). This is not to say that data that isnot consistent with presuppositions should be ignored. Rather, it argues thatour “theories” of how consumers behave and the market operates, etc., arealtered only after multiple findings consistently and persuasively suggest ourold theories are wrong and new ones must be developed to explain the findings.
Statistical Significance in Cross-Tabulation
Analysts of cross-tabulated data do not have to wonder whether they arelooking at relationships that might or might not be statistically significant.
Apparent Relationship
Consumption Rate Agreement with Statement
Underlying Relationship
Income
Consumption Rate
Agreement with Statement
FIGURE 9.7. Spurious versus Real Relationships

A statistical test called chi-square will reveal whether the differences notedin the table are “real” or could be merely due to chance. Readers interestedin how chi-squares are calculated are referred to relevant works on the sub-ject.6 For our purposes here, most software programs such as SPSS that per-form cross-tabulations will print chi-square statistics at the bottom of the ta-ble, indicating whether the relationship between the table’s variables is“statistically significant” or could have occurred by chance due to samplingvariations. It should be noted here that chi-square tests require data that arecategorical rather than continuous (e.g., male versus female consumers in-stead of one, two, three, four, five, etc., times per week). The numbers ana-lyzed must be counts and not percentages, and there must be at least five ormore “counts” in each cell. (Other requirements are necessary, but these arethe ones of primary interest to readers of this book.)
Although they may be useful in helping to determine if the observed rela-tionship is statistically significant, the chi-square statistics will not informthe analyst if the statistically significant relationship is spurious or not. Theuse of statistical tests increases rather than decreases the need for theory,predetermined hypotheses, and common sense. More advanced statistical-analytical techniques, including chi-square analysis, will be discussed inChapter 10.
SUMMARY
Up to the point of data analysis, the research that has been conducted toaddress a management problem has merely generated costs, with no return.It is only with the advent of data analysis that research begins to generate areturn against those costs. Therefore, it is critically important to the successof the project that the researcher/analyst use all appropriate means of ex-tracting valuable insights from the data. While a “toolchest” of sophisticatedstatistical programs may be necessary in getting the most from a data set, it
Research Project Tip
Your descriptive research plan should include a discussion of how youwill analyze the data to arrive at recommendations for choosing amongthe decision alternatives facing management. That is, you should specifyexactly how the data are to be analyzed in order to:
• Obtain answers to research questions• Test hypotheses• Fill in dummy tables to allow the analyst to draw implications• Analyze answers to contextualize the data

is also true that many of the research objectives and hypotheses that drovethe research can be addressed with techniques as simple as cross-tabulation.Another valuable “tool” of data analysis is the analyst’s reluctance to drawimplications and make decisional recommendations until he or she is con-vinced, by looking at the data from a variety of perspectives, that the infor-mation truly suggests the validity of those implications and recommenda-tions.

Chapter 10
Advanced Data AnalysisAdvanced Data Analysis
Once you have collected data through descriptive or causal research, andhave run descriptive statistics and cross tabulations, you may wish to con-duct some of the statistical analyses described in this chapter. But first wewill discuss how marketing researchers approach the use of statistical testsin analyzing data.
MARKETING RESEARCH AND STATISTICAL ANALYSIS
Marketing research, as we well know by now, is conducted to help re-duce the uncertainty in decision making. If we could be certain of makingthe correct decision without conducting research, why would we ever wantto do research? Marketing research in such cases would not reduce uncer-tainty because there would be no uncertainty. You would always knowwhich decision would be best. However, we all know that managers are of-ten unsure which decisional alternative is best. Consequently, we conductresearch to help determine which alternative should be selected, given whatwe discover is the nature of the market from conducting the research.
Statistics help us to better understand the significance of marketplacecharacteristics. We should distinguish between statistical and managerialdifferences, however:
statistically significant differences: when a difference (e.g., betweentwo market segments, attitudes, likelihood of purchase between twoproducts, etc.) is big enough that it is unlikely to have occurred due tochance.
managerially significant differences: when any observed differencein findings is considered significant enough to influence managementdecisions. For example, some statistically significant differences areconsidered inconsequential to management, while some that do notcross a certain statistical threshold to be considered statistically sig-nificant may influence management decisions.

Marketing researchers run statistical analyses on the data they have col-lected in order to be able to reduce the uncertainty of management decisionsby identifying those measured variables that are managerially significantand also statistically significantly different from one another. For example,statistical analysis of marketing research data may reveal that a market con-sists of five consumer segments that differ from one another in ways signifi-cant to marketing managers making targeting and positioning decisions.Without the use of statistical analysis we would not have been able to iden-tify or define these segments or the important differences among them uponwhich marketing decisions will be based.
Before we begin a discussion of the kinds of statistical analytical proce-dures of value to researchers, let us briefly review how we arrived at thispoint of the research process, for we arrive at this point because of the re-search decisions we previously made.
Readers will remember that we devoted considerable time and effort tothe development of a statement of management problem/opportunity; iden-tification of the research purpose (which required stating the decision alter-natives and criteria); and the research objectives (research questions and hy-potheses), which have driven all of our subsequent research decisions. Ourresearch design, data-collection methods, measurement tools and methods,and data-collection instruments were all selected and developed as the mosteffective and efficient means possible of answering our research ques-tions/testing our hypotheses, which allow us to achieve our research pur-pose and thereby solve our management problem or capitalize on our man-agement opportunity. The statistical process we use at the analysis stage ismerely another step along this same path, leading from management prob-lem to data to decisions to problem solution. We emphasize this intercon-nectedness of the steps because it is easy for the novice researcher to be-come so overwhelmed by the variety and complexity of the statisticalprocedures that he or she fails to keep the “big picture” in mind. We are ana-lyzing data for a reason—to allow us to choose the best among the deci-sional alternatives that helps solve our problem. Statistical analysis merelyaids in that choice. Our discussion of statistics in this chapter is no substitutefor the kind of coverage you get in a statistics course, but rather covers themain topics of interest to marketing researchers seeking to reduce the uncer-tainty of management decision making.
HYPOTHESIS TESTING
As we noted in Chapter 1, hypotheses are speculations regarding specificfindings of the research. When researchers refer to “hypothesis testing” theyare referring to any means used, such as the use of cross-tabulated tables(see Chapter 9), to determine if the hypotheses we stated at the early stages

of the research are supported by the evidence. For example, H: First-timehome buyers spend more time researching how to determine constructionquality than people buying for the second, third, etc. time. When researchersspeak of “Hypothesis Testing” they are referring to a particular process andset of statistical tools used to determine the probability of observing a par-ticular result from the research if the stated hypothesis were actually true.This formal statistical process (i.e., “Hypotheses Testing”) is what we aredescribing.
We have hypotheses because we suspect our results will reveal somecharacteristic of the population under study. If we already knew the resultswould be a particular way we would not need to do the research. So, we ap-proach the testing of an hypothesis the same way we do research in general:we are not out to prove (or disprove) anything, but rather seek to discover,test, and learn the “truth.” We are testing our hypotheses to determinewhether they should be accepted as statements accurately portraying thepopulation’s characteristics, or rejected because the observed difference islikely due to sampling error and there really is no difference as we hypothe-sized.
The underlying rationale for testing the hypothesis is that we will makedifferent decisions based upon whether the results of the statistical tests leadus to conclude the hypothesis is supported or not. For example, if our hy-pothesis is that there is no difference between males and females in theirpreference for product design A or B, and that hypothesis is rejected (i.e.,the results indicate the preferences for males versus females are “real” andunlikely due to chance), then we would make different decisions on whichproduct design to introduce and how to target our marketing programs forthe product.
Hypothesis testing involves five steps:1
1. The hypotheses are stated, with decisions identified for the outcomeof the hypothesis test.
2. Determine the “costs” related to the two types of errors arising fromyour decisions.
3. Select the significance level (the alpha) you will use to determinewhether to reject or fail to reject (FTR) the null hypothesis.
4. Collect the data and conduct the appropriate statistical tests.5. Compare the results to your null hypothesis and make your decision.
The following example illustrates how marketing researchers could usethese steps to help marketing managers make better decisions. Assume youwork for a company that manufactures lightbulbs. Your R & D (researchand development) department has developed a new lightbulb (named theLonglast bulb) that they claim lasts much longer than traditional bulbs, but

could sell for only a 50 percent premium over traditional bulbs. The market-ing manager believes this bulb could have a competitive advantage in themarket, but to attract consumers the company will need to provide a moneyback guarantee for the minimum life expectancy of the bulb—if it does notlast at least thirty-six months the consumer gets a full refund. The companyneeds to know if such a guarantee makes economic sense, since they havedecided that if the average life of the bulb does not exceed thirty-six monthsit is not going to market the bulb (not enough of a competitive advantage).The decision is then to either market the bulb with the guarantee or not mar-ket the bulb.
Step 1: Stating the Hypotheses and Decisions
Hypotheses are stated in two forms:
Null hypothesis is stated in terms that indicate you expect to find “nodifference” or “no effect.”
Alternative hypothesis states that you expect to find a difference or ef-fect.
In our Longlast lightbulb case these hypotheses and the resulting decisionswould be:
Null hypothesis: The unknown mean (average) life of our Longlastbulb population is less than or equal to thirty-six months.
Decision NH: If we accept (or more appropriately fail to reject) thenull hypothesis we will not market the bulb.
Alternative hypothesis: The unknown mean life of our Longlast bulbpopulation is greater than thirty-six months.
Decision AH: If we accept the alternative hypothesis we will marketthe bulb.
The statement of a null hypothesis is in keeping with the “healthy skepti-cism” mentioned in Chapter 9. That is, while our R & D people claim theLonglast bulb will last more than 36 months (“Oh, no problem. Piece ofcake. Easily last more than 36 months,” as they put it.), you retain a healthydose of skepticism and the null hypothesis reflects that skepticism. We as-sume the null hypothesis is true until evidence suggests otherwise. The al-ternative hypothesis says what you hope will be true, that the R & D claimsare correct. These are competing hypotheses—only one can be true.

Step 2: Determine the Costs of Decision Errors
Since we are going to collect a sample of lightbulbs and determine theaverage life of the lightbulbs in the sample instead of testing every lightbulbproduced (which would not leave us any to market!), we are going to drawinferences from our research sample to the entire Longlast bulb population.These inferences can either be right or they can be wrong. Table 10.1 illus-trates the possible combinations of inferences made about the null hypothesis.
Type 1 Error: We reject the null hypothesis when it is actually true.
Type 2 Error: We accept the null hypothesis when it is actually false.
When testing a hypothesis in any particular study we can make either aType 1 error or a Type 2 error (or no error), but not both a Type 1 and Type 2error. Table 10.2 shows how this table looks for our Longlast example.
We all know (or at least suspect if we have not had personal experience)that making the wrong marketing decisions incurs costs. In the Longlastcase both Type 1 and Type 2 errors are costly, but in different ways. If wedecide to market the bulb because the average life of our sample (which wethought would also be true of the population) was longer than thirty-sixmonths, but its life was actually shorter than thirty-six months (a Type 1 er-ror), we will discover our error when people begin to return expired bulbsand get their money back in perhaps twenty-four or thirty months fromwhen they were first marketed. Lots of Longlast bulbs have been sold in thepast twenty-four to thirty months. The Wall Street Journal runs a front-pagestory of how we are flooded with returned bulbs and requests for refunds,consumer confidence in our other products begins to slip, we have trouble
TABLE 10.2. Longlast Example
Based Upon the Sample Evi-dence We Decide to
The Truth About the Longlast Bulb36 months or less Over 36 months
Not market the bulb Correct Decision 1 2 Type 2 ErrorMarket the bulb Type 1 Error 3 4 Correct Decision
TABLE 10.1. Possible Inferences About the Null Hypothesis
Based on the Sample EvidenceWe Decide to The Truth About the Population Parameter
Null Is True Null Is FalseAccept the Null (FTR the Null) Correct Decision Type 2 ErrorReject the Null Type 1 Error Correct Decision

recruiting good marketing people who do not want to be associated withsuch “losers,” and other unpleasantness occurs.
A Type 2 error would occur when we decide not to market a bulb whoseactual life is more than thirty-six months, but the lifetime of our sample wasless than thirty-six months. We had a winner on our hands but did not capi-talize on the opportunity. Depending on the number of people who wouldhave been interested in our competitive advantage, we might have missedout on a golden opportunity.
Step 3: Setting a Significance Level
No one wants to have significant bad decisions on their career track re-cord, but there always is the possibility that when we make decisions basedon inferring from a sample to our population, we were wrong. In hypothesistesting the significance level is the maximum risk you will accept of makinga Type 1 error (marketing the lightbulb when you should not have). It nowbecomes clear why Step 2 is so important:
We must consider how significant the costs are to making a mistakeby marketing the lightbulb when we should not have in order to knowhow low to set our maximum risk of making such an error of judg-ment.
or
The greater the costs associated with a Type 1 error, the lower weshould set our maximum risk.
Some guidelines help us determine how to set the level of significance:
1. If costs associated with a Type 1 error are high and a Type 2 error isnot costly, set the level of significance (i.e., the chance of making aType 1 error) very low—at .05 or below.
2. If costs associated with a Type 1 error are not very high, but making aType 2 error is costly, set the level of significance much higher (per-haps at .25 or above).
3. If both Type 1 and Type 2 errors are costly, set the level of signifi-cance very low and increase the sample size, reducing the chance of aType 2 error (however, this does increase the costs of the research).
In the Longlast lightbulb case the potential costs associated with makinga Type 1 error are of sufficient magnitude to justify setting the level of sig-nificance very low (say, .01). This means if you reject the null hypothesis(i.e., decide to market the lightbulb) the chance that you made a Type 1 error(decided to market it when you should not have because the average life ex-

pectancy was actually less than thirty-six months) is only one chance in ahundred. In other words you can be 99 percent confident that you made theright decision.
Step 4: Collect the Data and Conduct Statistical Tests
This is the step where the research is designed, data are collected, and theappropriate statistical tests are used to analyze the data. Our research designin this case would involve descriptive research since exploratory is not usedto collect data per se, and our hypothesis does not involve cause-effect rela-tionships. The research could run internal (within the company) tests of asample of lightbulbs, or we could conduct in-home tests, where consumersagree to try the product in typical consumer-usage situations. This approachprovides researchers with information about the product’s performance un-der actual market conditions and the subsequent research that tests consum-ers’ opinions, perceived benefits received, problems, future purchase intent,and the like provides valuable marketing targeting and positioning information.
In this case we will assume we select a random sample of 1,000 lightbulbs(we use probability sampling since we are doing descriptive research) for aninternal test and use a special testing technology that “speeds up” time sothat we do not have to wait thirty-six months for the results of our test of thebulbs’ lifetime. So, we run our test of 1,000 lightbulbs and determine the av-erage simulated lifetime of the bulbs in months. We discover the following:
Sample mean (written as x) = 37.7 months
Standard deviation (written as s) = .42 months
We use a t test in this case to determine if the null hypothesis should be re-jected or accepted (FTR) because we do not know the population’s standarddeviation. However, because the sample size is so large, the t value is thesame as the Z value.
A t test is constructed as follows:
t =Sample value – Hypothesized population valueStandard deviation of the sample value
In the Longlast lightbulb case the calculation would be
t = − =37 7 360
42405
. .
..
See Table 10.3 for the appropriate statistical tests for the different formsof hypotheses.

Step 5: Compare Results to the Null Hypothesis and Make a Decision
Looking at a t distribution table we see that the t value for n-1 degrees offreedom (999 in our case, but “infinity” on the table) and for an alpha (thelevel of significance, which was .01 in our case) in a “one-tail” test (on anormal curve, the area under the curve at only one end of the curve ratherthan both ends) was 2.326. Since our t value of 4.05 exceeded this 2.326value we can say we are more than 99 percent confident that our samplemean of 37.7 months is drawn from a population whose mean is more than36. Or, in other words, the chances that our sample mean would be 37.7when the actual population mean is 36 months is very, very unlikely (lessthan one in a hundred). Because the odds of the null hypothesis being true
TABLE 10.3. Statistical Tests for Hypothesis Testing
Types ofHypotheses
Number ofSubgroupsor Samples
Scale ofData
Test Requirements
Hypothesesabout fre-quency distri-bution
One Nominal Chi-square X2 Random sam-ple
Two or more Nominal Chi-square X2 Random, in-dependentsamples
One Ordinal Kolmogorov-Smirnov
Random
Hypothesesabout propor-tions (percent-ages)
One (largesample)
Interval orratio
Z test for oneproportion
Random sam-ple of thirty ormore
Two (largesample)
Interval orratio
Z test for twoproportions
Random sam-ple of thirty ormore
Hypothesesabout means
One (largesample)
Interval orratio
Z test for onemean
Random sam-ple of thirty ormore
One (smallsample)
Interval orratio
t test for onemean
Random sam-ple of lessthan thirty
Two (largesample)
Interval orratio
Z test for twomeans
Random sam-ple of thirty ormore
Three ormore (smallsample)
Interval orratio
One-way ANOVA(one independ-ent variable)
Random sam-ple
Source: Adapted from Carl McDaniel and Roger Gates, Contemporary Mar-keting Research (Cincinnati, OH: South-Western, 1999), pp. 516-517.

(i.e., that our population mean is 36 months or less) are so small, it is muchmore reasonable to assume that the reason our sample mean was 37.7 monthsis that the null hypothesis should be rejected and our alternative hypothesisshould be accepted (i.e., that the population mean is greater than 36 months).
In Step 1 we established a decision rule that said if we reject the null hy-pothesis and accept the alternative hypothesis we will market the Longlastlightbulb, so that is what we should do. Referring to Table 10.2, this deci-sion means we either will make the correct decision (cell 4), or will be mak-ing a Type 1 error (cell 3). The actual chance that we are making a Type 1 er-ror is called the “p value,” which in this case would be the likelihood ofgetting a sample mean of 37.7 months if the null hypothesis were true. Thisis very remote (less than 1 chance in 100), which is very reassuring of thecorrectness of our decision.
While our null hypothesis was stated as a test of means (i.e., Was oursample’s average of 37.7 months statistically significantly different fromthe hypothesized population’s average of 36 months?), we could state hy-potheses as frequency distribution, differences between subgroups (e.g.,men versus women), or proportions (e.g., percentages of college educatedversus noncollege graduates intending to buy our product). Table 10.3shows the appropriate statistical tests for different forms of hypotheses.Once you set up the hypothesis and go through the steps outlined here, a sta-tistical software program such as SPSS can be used to conduct the appropri-ate statistical tests. Otherwise, the same process (the five steps) are followedto arrive at a decision based on the marketing-research results. See Table10.4 for a list of statistical software sites on the web.
Concluding Thoughts on Hypothesis Testing
Hypothesis testing is very decision oriented, as demonstrated in this dis-cussion. In fact, the underlying reason for testing hypotheses is to get to the
TABLE 10.4. Statistical Software Sites on the Internet
Software Web Site DescriptionSPSS www.spss.com A popular, comprehensive statistical pack-
age with links to other sites and data sets.STATA www.stata.com Stata software for Windows, Apple, DOS,
and UNIX operating systems.UNISTAT www.unistat.com Comprehensive package compatible with
Windows Excel. Data handling, analysis, andgraphic presentation.
StatSoft www.statsoft.com Presents the STATISTICA range of statisticalanalysis products. Easy to use, yet is a pow-erful statistical package.

point (Step 5) where you can determine how confident you can be in choos-ing between two previously identified decision alternatives (e.g., to marketor not market the Longlast lightbulb). Some other thoughts on hypothesistesting are:
1. As described in Chapter 2, we use exploratory research to generatehypotheses, we use descriptive or causal research to test hypotheses.While the exploratory research “detective work” may allow us to“check out our hunches” by looking at secondary data and doing ex-ploratory communication or observation, and even provide us withenough information that we are willing to make a decision withoutfurther research, we can not claim we have “tested hypotheses” by do-ing exploratory research. This is true even if we conduct an explor-atory survey of thousands of people. The reason is that true Hypothe-sis Tests, as described here and listed in Table 10.3, all demandprobability samples that are the province of descriptive and causal re-search. If we have not obtained our sample using a probability samplingapproach (simple random, stratified, systematic, or cluster samplingmethods), the plain fact is that we can not conduct these HypothesesTests, no matter how large our sample. This is not to say that we cannot use exploratory survey results to make decisions. We simply can-not arrive at those decisions through statistical tests of our hypotheses.
2. There are two types of errors possible when conducting tests of hy-potheses. We must determine their respective costs and then set thelevel of significance consistent with the costs of making a Type 1 er-ror. In doing this we must understand that we do not want to automati-cally set the significance level very low (e.g., .05 or less) so we willnot make a Type 1 error. The fear of making a Type 1 error is only jus-tified when the costs of a Type 1 error are very high. Sometimes thecosts of a Type 2 error (e.g., not marketing the Longlast bulb when weshould have in our example) may be high as well and must be factoredinto our decision. As described in Step 3, when Type 2 error costs arehigh relative to Type 1 error costs, we should set our level of signifi-cance much higher (e.g., .25 or higher).
3. Doing causal research also may involve hypothesis testing. Althoughbeyond the scope of our discussion, one typical statistical test used indetermining the difference between experimental treatments is theANOVA test (Analysis of Variance, see Table 10.3). For example, wecan use an ANOVA test to determine if there is a statistically signifi-cant difference in the sales of a cereal brand that was tested in an ex-perimental design with three coupon levels: 35¢, 50¢, and 75¢. ANOVAis not used exclusively with experimental data (it can be used with de-

scriptive survey results), nor is it the only way to analyze experimentaldata, but it is a commonly used statistical test for experimental data.
MEASURES OF ASSOCIATION
Marketers frequently want to know how variables are associated witheach other. For example, Levi’s wants to know what types of people are in-terested in a more formal, dressy line of pants, iVillage.com wants to knowthe lifestyle characteristics of the women who visit their Web site so theycan change its content to satisfy customer needs, and IBM wants to knowwhich characteristics best describe their top salespeople. In such cases mar-keters are interested in using statistical analysis to determine the degree towhich two or more variables are associated with each other. Our discussionof cross-tabulation in Chapter 9 was an example of looking for associations.In this chapter we will examine other statistically measurable means of de-termining association among variables. We will examine bivariate (associa-tion between two variables) and multivariate (between three or more vari-ables) techniques.
Bivariate Association
The association between two variables can be graphically described in avariety of ways (see Figure 10.1):
• Nonmonotonic: there is no discernable direction to the association orrelationship between the two variables, but the relationship exists.
• Monotonic: there is a general direction to the association between thetwo variables.
• Curvilinear: the association between the variables can be describedby a curved line.
• Linear: a straight line can be drawn to describe the relationship be-tween the variables.
We will restrict our discussion to associations between variables that canbe described as linear. Linear relationships may either be positive or nega-tive in nature. In Figure 10.2(a) we see a positive relationship: as variable Aincreases (e.g., education) so does B (e.g., income). This association doesnot have to be perfect. There are examples of people with little educationbut very high income, and people with very high education but modest in-comes (your instructor, for an unfortunate example), but in general the rela-tionship is positive.
In Figure 10.2(b) we see a negative relationship: as variable A increases(e.g., price), variable B declines (e.g., sales of cellular phones).

Marketers are very interested in determining the association betweenvariables so they can use this information in making decisions. If buyer loy-alty for a personal computer manufacturer as measured by repeat purchasebehavior is associated with a buyer’s satisfaction with the company’s toll-free help line, and satisfaction with the help line is associated with the num-ber of trained customer service agents, the company may decide to hire andtrain more customer service agents. If the association between two variablesis strong, you can predict one variable by knowing the other one, but first
(c) Curvilinear
A
B
(a) Nonmonotonic
A
B
(d) Linear
A
B
(b) Monotonic
A
B
FIGURE 10.1. Graphic Representation of Bivariate Association
A
B
A
B
(a) Positive Relationship (b) Negative Relationship
FIGURE 10.2. Relationship Between Variables

you must be able to measure the degree of association. We will discuss theprimary statistical procedures used for measuring association. Readerswishing for a more comprehensive discussion of these and other statisticalmeasures of association should consult one of the standard works on thesubject.2
The choice of bivariate measures of association depends upon the scaleof the data being analyzed. Table 10.5 describes several common measures.
Pearson Product Moment Correlation
The Pearson product moment correlation is used to measure the degree towhich two variables are correlated or associated with each other when bothof those variables are metric (i.e., either intervally or ratio-scaled data). Theoutput of running this statistical analysis on two variables is a single numbercalled a correlation coefficient, which can range from –1.00 to +1.00. Thecloser the correlation coefficient is to –1.00 or +1.00, the stronger the asso-ciation is between the variables. Two variables are perfectly inversely cor-related when the coefficient is –1.00 and perfectly positively correlatedwhen it is +1.00. A correlation coefficient of 0.00 indicates there is no statis-tical association between the two variables. Statistical software packagessuch as SPSS will compute both the Pearson product moment correlationcoefficient (referred to as the r) and the statistical significance statistic (re-ferred to as the p) for two sets of metric-scaled data. The r measures thestrength of the association on the –1.00 to +1.00 scale, while the p indicatesthe likelihood that the association is due to chance (i.e., that the null hypoth-esis of no association between the two variables is supported).
A p = .05 says that the chance we would be seeing the strength of the r(i.e., the association or correlation between the two variables) as what wesee it for our sample data, when in fact there is no association (i.e., r = 0.00)between the two variables is only 5 chances in 100. So, a p of .05 or lowerwould indicate that the degree of association between the variables as mea-sured by the r is “real” and unlikely due to chance. Once we see that the p in-dicates that we are looking at a statistically significant association, we canlook at the r to determine the strength of the association. Physicists expect tosee perfect (or very near) correlations between the physical materials they
TABLE 10.5. Bivariate Measures of Association
Type of Data MeasuresInterval or ratio Pearson product moment correlationOrdinal Spearman rank-order correlationNominal Chi-square analysis

study. Marketers, as behavioral scientists, realize that people are far from“perfect” and so the correlations we measure between variables related tothe behavior of consumers are not going to be –1.00 or +1.00. Marketersmeasuring and correlating such variables of interest as:
consumption rate correlated with satisfaction with productattitude toward product correlated with intention to buyhousehold size correlated with frequency of usage
and many other correlations involving metric data of interest, are looking atcorrelations revealing various degrees of less-than-perfect association. Ta-ble 10.6 suggests some general rules of thumb for correlation coefficientsand implied strength of association.
Spearman Rank-Order Correlation
Marketing researchers may find that they seek to know the associationbetween two variables that are ordinally (i.e., rank ordered) rather thanintervally or ratio scaled. In such cases we should use the Spearman rank-order correlation rather than the Pearson product moment correlation. Forexample, we might want to know if there is any association between the waypeople rank ordered brands of automobiles based on “sportiness” and “liketo be seen driving.” The resulting correlation coefficient, rs , and the mea-sure of statistical significance are interpreted in the same way as we do forthe Pearson product moment correlation. That is, a higher rs indicateshigher degrees of association (or stronger inverse association if the coeffi-cient is a negative value).
Chi-Square Analysis
As shown in Table 10.3, chi-square tests are run when we are conductinghypothesis tests for nominally scaled variables. Chi-square tests are run on
TABLE 10.6. Correlation Coefficient and Strength of Association
Range of Correlation Coefficient Strength of Association
Greater than .80 Very Strong.61 to .80 Moderate to Strong.41 to .60 Weak to Moderate.21 to .40 Weak.00 to .20 Nonexistent to Very Weak

cross-tabulated data when we want to determine if the frequencies we see ineach cell of a cross-tabbed table fit an “expected” (i.e., hypothesized) pat-tern. Since the null hypothesis states that we expect not to find an associa-tion between the two variables, the chi-square tests tells us whether weshould accept the null hypothesis or not. So, for example, if we want toknow whether there is an association between the preferences of males ver-sus females for new product concept A or B, our cross-tabulated data maylook like this:
Preference forNew ProductConcept
Males Females Total
A 199 18 217B 40 43 83
TOTAL 239 61 300
The decision we want to make is whether or not to target the two newproducts to consumers on the basis of gender. The question of the statisticalanalysis then becomes, “Is there a statistically significant difference in thepreferences between males and females for the two new product concepts?”The null hypothesis for the chi-square test is then
Ho: There is no relationship between gender and new product conceptpreference.
And our alternative hypothesis is
Ha: There is a significant relationship between gender and new prod-uct concept preference.
When you enter the data in the cross-tabulated table (which must be in“counts” not percentages, and at least five or more counts must be in eachcell of the table) into a statistical program such as SPSS, the program thencalculates the probability you would find evidence in support of the null hy-pothesis if you repeatedly collected independent samples and got these re-sults. So, if the chi-square test showed a .01 probability for the null hypothe-sis, the conclusion would be that you would get these results only 1 time in100 occasions if the null hypothesis were true. That is highly unlikely, sothe null is rejected and the alternative hypothesis is accepted: There is a rela-tionship between gender and product concept preference. Chi-square doesnot tell the researcher the nature of the association (e.g., whether males pre-fer A and females B), only that the association exists by telling you the prob-ability of seeing such results if the null hypothesis were true. Researcherswould then need to study the association between the variables more closely
to discern the nature of the association between the variables and ultimately,along with other research findings, what decisions should be made aboutmarketing the new products.
Multivariate Association
Multivariate (multiple variable) association refers to the statistical meth-ods that simultaneously analyze multiple measurements of attitudes, attrib-utes, or behavior. Multivariate techniques are simply extensions of univariate(analysis of single variable distributions) and bivariate techniques (twovariable methods such as cross-tabulations, correlations, and simple regres-sion). For a research project to terminate prior to employing multivariatetechniques assumes that the purpose of the research was only to identify thevariables, or that the importance of the results for the decision informationrequired would need no more than the establishment of the associations be-tween two variables. Multivariate techniques serve to determine the rela-tionships that exist between multiple sets of variables. Multivariate method-ologies are clearly sometimes needed to examine the multiple constraintsand relationships among pertinent variables to obtain a more complete, real-istic understanding of the market environment for decision making.
Description and Application of Multivariate Techniques
The satisfactory utilization of multivariate methods assumes a degree ofunderstanding of the market dynamics or market behavior in order to con-ceptualize a realistic model. The identification of the variables whose rela-tionships are to be measured is foundational to an incisive multivariate ap-proach. The nature and number of variables to be examined will determinewhat type of multivariate method will be utilized.
The first commonly used method is known as multiple regression. Multi-ple regression allows for the prediction of the level or magnitude of a phe-nomenon such as market size or market share. Multiple regression has as itsobjective the identification of the optimum simultaneous relationship thatexists between a dependent variable and those of the many independentvariables. For example, frequency of listening to a particular radio stationmay well be a function of a number of marketing mix variables such as thetype of programming, listener loyalty, community promotionals, billboardadvertising, disc jockey personality, and tastefulness of the commercials.3
Another method is multiple discriminant analysis. Multiple discriminantanalysis has as its objective the identification of key descriptors on whichvarious predefined events will vary. It might be learned from a discriminateanalysis that middle-income families who work in a downtown area and
who have school-age children might be expected to be the first to move intoa new, rural, totally planned community housing development.
Canonical correlation analysis allows for the establishment of a predic-tive model that can simultaneously forecast or explain several phenomenabased on an understanding of their correlates. The canonical correlationanalysis differs from multiple regression analysis in that there is more thanone dependent variable. Whereas family income and family size might beused to predict the number of credit cards a family might have (by using amultiple regression technique), the canonical correlation analysis wouldalso be able to predict the average monthly charges on all of their creditcards.4
One of the more popular of the multivariate techniques is factor analysis.Fred Kerlinger states that the factor analysis might be called the queen ofanalytic techniques because of its power and elegance. He describes factoranalysis as a method for determining the number and nature of underlyingvariables among larger numbers of measures. It also serves to reduce largegroups of complex variables to their underlying and predictive entities. Factoranalytic techniques first gained prominence in psychological and psychiat-ric studies. For example, verbal ability, numerical ability, memory, abstractreasoning, and spatial reasoning have been found to underlie intelligence insome studies.5
The applications for factor analysis have been used extensively for be-havioral and attitudinal studies used in the marketplace. For example, a re-cent study that measured a large group of variables related to job satisfac-tion and morale among a certain group of engineers revealed the ability togrow professionally was the most important factor in morale and job satis-faction. This was followed closely by self-esteem as it related closely to thetype of firm they work for. The analysis revealed five central factors, whichin general terms, fit closely to Maslow’s hierarchy of organizational needs,except that the order of prominence for each of Maslow’s needs was foundto have a different sequence for the engineers surveyed. Factors identifiedby this technique, therefore, have served as a new dimension of segmenta-tion that focuses on shared agreement among respondents as the differentia-tion among the segments.
Multidimensional scaling addresses the problem of identifying the di-mensions upon which customers perceive or evaluate phenomena (prod-ucts, brands, or companies). Multidimensional scaling techniques result inperceptual maps that describe the “positioning” of companies or brands thatare compared relative to the “position” they occupy in the minds of custom-ers according to key attributes. These “maps” allow the decision maker toexamine underlying criteria or dimensions that people utilize to form per-ceptions about similarities between and preferences among various prod-ucts, services, brands, or companies. The question of positioning, as viewed

by multidimensional scaling (MDS) and perceptual mapping, deals withhow a firm compares to its competitors on key attributes, what the ideal setof attributes sought by the customer might be, or what positioning or reposi-tioning strategy should be developed for a specific sector of the marketplace.6A medium-sized bank might learn, for example, that the most effective wayto compete for commercial loan business with larger, more prestigiousbanks with a wider range of services, is by focusing on the genuine concerncommunicated by loan supervisors as well as the expertise they develop intheir knowledge of their client’s subsector of industry (see Figure 10.3).
Cluster analysis allows for the classification or segmentation of a largegroup of variables into homogeneous subgroups based on similarities on aprofile of information. Cluster analysis enables the description of topolo-gies or profiles according to attitudes toward preferences, appeals, etc., that
COMPANY C
COMPANY B
COMPANY D
COMPANY E
COMPANY A
ONLY INTERESTED IN PROFITS
MO
STW
AST
EFU
L
LAR
GE
ST
PR
OFI
TS
BEST
PROD
UC
TPER
FOR
MA
NC
E
DEVELOP NEWTECHNOLOGY
DOING MOST EXPLORATION
NAMEID
ENTIFI
CATION
LARG
EST
PRO
DUCE
R
PROTECT THE ENVIRONMENT
BESTREPUTATION
HO
NEST
WITH
PUB
LIC
CO
MM
ITME
NT
TO
EN
ER
GY
SO
LUTIO
N
FIGURE 10.3. Perceptual Map

might also include psychographic data. For example, this analysis might beused to describe psychographic profiles and interest in new transactionalservices among savings and loan customers.
The last major technique to be explained is conjoint analysis. Conjointanalysis, also known as trade-off analysis, is used for evaluating judgmentaldata where choices between attributes are involved. It is more commonlyused in measuring the trade-off values of purchase selection factor attrib-utes. Specifically, conjoint analysis is concerned with the joint effect of twoor more independent variables on the ordering of a dependent variable. Inessence, this method allows a determination of how consumers value vari-ous levels of purchase criteria and the extent to which they might tend toforego a high level of one attribute in order to obtain a high level of another.For example, the trade-off values of holding power, scent, nonstickiness,brand name, and price for hair spray might be cause for a conjoint evalua-tion.7
SUMMARY
Marketing researchers use statistical analysis of association to know howto interpret data describing the relationship between two or more variables.Ultimately, as suggested in Chapter 9, such analysis of data needs to provideus with answers to our research questions and lead us to choices among ourdecision alternatives. Statistical analysis gives us a window with which wecan view the results of our research see which decisions would be best. It isvery important that we use the appropriate statistical-analytical procedures,or the window we are looking out of can give us a distorted view of realityand our decisions based on that distorted view could be ill-chosen.
Research Project Tip
Make sure that your plan for analyzing your data conforms to the “rules”for use of the statistical techniques described in this chapter. If you planto use statistical tests, particularly multivariate tests, use the referencesfor this chapter for more information on how to use them correctly beforeactually analyzing the data.


Chapter 11
The Research ReportThe Research Report
INTRODUCTION
This chapter discusses the essentials of preparing the research report.The basic purpose of the research report is to communicate the results, con-clusions, and recommendations of the research project. (If a project encom-passes several phases or a long period of time, progress reports are normallysent to the purchaser or user of the research to inform them of the progress todate on a given project.) The key word in the preceding statement of pur-pose is communicate. The report must be an effective tool of communica-tion not only to accurately present the findings and conclusions, but also tostimulate the reader to some managerial action. The research project waspredicated on the need for information to aid in the decision-making pro-cess. Now the cycle has been completed and the report must address that de-cision and recommend a course of action in view of the research findings.The user or purchaser of the information must decide whether or not to heedthe advice given in the recommendation of the report, but the actions recom-mended by the researcher must be communicated.
As with any other instance in which you wish to communicate effec-tively, the marketing researcher should understand the target audience—itsobjectives for studying the research report, its tendencies for selective per-ception (selectively choosing to see what they want to see and ignoring whatthey do not), the time they will devote to the report, etc. Marketers and mar-keting researchers are trained to look at what they do through the eyes of the“target market,” and it is particularly important that those skills be appliedto the development of the research report.
In writing the report, the marketing researcher should keep two audi-ences in mind: the decision makers who commissioned the research in an ef-fort to reduce the uncertainty of their decisions, and those people, unac-quainted with the genesis of the research, who will pick up the reportsometime in the future and want to use the findings to help them better un-derstand something about the market. The report should serve as a guide tothose interested in immediately implementing the recommendations cited
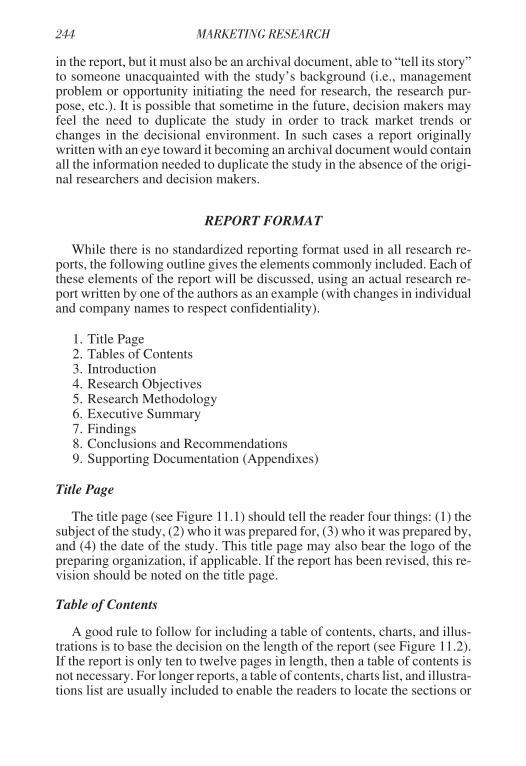
in the report, but it must also be an archival document, able to “tell its story”to someone unacquainted with the study’s background (i.e., managementproblem or opportunity initiating the need for research, the research pur-pose, etc.). It is possible that sometime in the future, decision makers mayfeel the need to duplicate the study in order to track market trends orchanges in the decisional environment. In such cases a report originallywritten with an eye toward it becoming an archival document would containall the information needed to duplicate the study in the absence of the origi-nal researchers and decision makers.
REPORT FORMAT
While there is no standardized reporting format used in all research re-ports, the following outline gives the elements commonly included. Each ofthese elements of the report will be discussed, using an actual research re-port written by one of the authors as an example (with changes in individualand company names to respect confidentiality).
1. Title Page2. Tables of Contents3. Introduction4. Research Objectives5. Research Methodology6. Executive Summary7. Findings8. Conclusions and Recommendations9. Supporting Documentation (Appendixes)
Title Page
The title page (see Figure 11.1) should tell the reader four things: (1) thesubject of the study, (2) who it was prepared for, (3) who it was prepared by,and (4) the date of the study. This title page may also bear the logo of thepreparing organization, if applicable. If the report has been revised, this re-vision should be noted on the title page.
Table of Contents
A good rule to follow for including a table of contents, charts, and illus-trations is to base the decision on the length of the report (see Figure 11.2).If the report is only ten to twelve pages in length, then a table of contents isnot necessary. For longer reports, a table of contents, charts list, and illustra-tions list are usually included to enable the readers to locate the sections or

illustrations in the report which they want to refer to at a given time. The ta-ble of contents should be detailed enough to serve as a guide to locating spe-cific sections in the report. Thus, subheadings should be listed if the sectionsare long and contain many different subsections. This is especially true ofthe “findings” section.
Introduction and Research Objectives
The introduction to the report should refer the reader to the basic purposeof the research and the specific objectives that were agreed upon in the re-search proposal (see Figure 11.3). In most cases it is advisable to list thestatements of management problem, research purpose (including decisionalternatives and criteria), along with your research objectives and hypothe-ses. This material should represent your latest thinking on these topics. Ifthe research study (particularly the exploratory research) has caused you tochange the objectives or list new hypotheses not identified in the original re-search proposal (see Chapter 1), these changes should be noted here (e.g.,state both original and new objectives).
Pilot Study ofFinancial Institutions
Prepared for:
Bill Berry, PresidentFinancial Institution
by
Marketing Research Associates101 Anystreet
Anytown, State(800) 555-1212
Date
FIGURE 11.1. Title Page

Research Methodology
This section should include a brief summary of the research methods (seeFigure 11.4). Remember the audience for the report—executives are not (orat least, rarely) interested in the small details of how the research was con-ducted. This description should be limited to mention of the primary meansof data collection (e.g., focus groups followed by a telephone survey, or theseries of experiments conducted, etc.); who were the respondents, howmany were contacted and where they were located; the type of instrumentused to collect the information (e.g., structured or unstructured surveys orinterview guides); and a general discussion of the analysis process.
TABLE OF CONTENTS
Introduction 1
Research Objectives 2
Research Methodology 3
Executive Summary 4
Findings 5Sample Characteristics 6Primary Institution/Services Utilized by Respondents 7Services Utilized at Secondary Financial Institution 8Changes in Primary Financial Institutions 9Images of Financial Institutions 10Advertising Awareness 11
Conclusions and Recommendations 12The Sample 13Primary Financial Institution 14Services Utilized at Primary Financial Institution 15Services Utilized at Secondary Financial Institution 16Changes in Primary Financial Institutions 17Images of Financial Institutions 18Advertising Most Remembered and Media Survey 19
Retail Banking Survey 20
FIGURE 11.2. Table of Contents
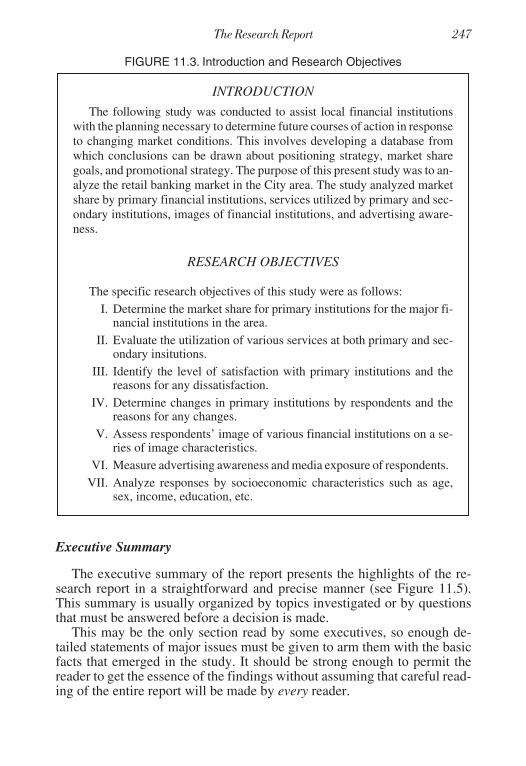
Executive Summary
The executive summary of the report presents the highlights of the re-search report in a straightforward and precise manner (see Figure 11.5).This summary is usually organized by topics investigated or by questionsthat must be answered before a decision is made.
This may be the only section read by some executives, so enough de-tailed statements of major issues must be given to arm them with the basicfacts that emerged in the study. It should be strong enough to permit thereader to get the essence of the findings without assuming that careful read-ing of the entire report will be made by every reader.
INTRODUCTION
The following study was conducted to assist local financial institutionswith the planning necessary to determine future courses of action in responseto changing market conditions. This involves developing a database fromwhich conclusions can be drawn about positioning strategy, market sharegoals, and promotional strategy. The purpose of this present study was to an-alyze the retail banking market in the City area. The study analyzed marketshare by primary financial institutions, services utilized by primary and sec-ondary institutions, images of financial institutions, and advertising aware-ness.
RESEARCH OBJECTIVES
The specific research objectives of this study were as follows:I. Determine the market share for primary institutions for the major fi-
nancial institutions in the area.II. Evaluate the utilization of various services at both primary and sec-
ondary insitutions.III. Identify the level of satisfaction with primary institutions and the
reasons for any dissatisfaction.IV. Determine changes in primary institutions by respondents and the
reasons for any changes.V. Assess respondents’ image of various financial institutions on a se-
ries of image characteristics.VI. Measure advertising awareness and media exposure of respondents.
VII. Analyze responses by socioeconomic characteristics such as age,sex, income, education, etc.
FIGURE 11.3. Introduction and Research Objectives

The summary should take the form of a detailed abstract in describing pur-pose, methodology, and findings. Usually two to three pages is the maximumlength for a good summary. It is best to photocopy the executive summary oncolored paper so it can easily be located by the busy executive who may ignorethe rest of the report.
Findings
This section of the report contains the detailed findings of the study (see Fig-ure 11.6). A great deal of detail is given in this section with supporting graphsand charts included as both references and sources of support for the statementsthat are made in the narrative of this section. This section is normally the largestsection of the report and should be organized in a logical way. A topically orga-nized format lends itself to both ease of preparation and reading. The major top-ics related to each research objective are presented so that the reader is taken ina step-by-step progression through all of the findings of the study. This alsoensures that all the objectives are covered in the write-up of the findings.
RESEARCH METHODOLOGY
To accomplish these objectives, telephone interviews were conducted with299 area residents who used the services of local financial institutions. Re-spondents were randomly selected from the City area telephone book to as-sure a representative sample was used as the basis of data analysis.
The respondents were surveyed using a structured questionnaire designedto respond to the project’s specific research objectives. The questionnairewas thoroughly pretested before being administered to improve the quality ofthe measuring instrument. the resulting data were edited, entered into com-puter files, and porocessed by a statistical-analysis program to provide acomprehensive set of tables and cross-tabulations for the study. the tables in-cluded number of respondents and percentages by response to each questionand chi-square analysis of the cross-tabulations of the data by primary finan-cial institution to identify differences in response patterns to the questionscontained in the questionnaire.
FIGURE 11.4. Research Methodology
EXECUTIVE SUMMARY
• A survey of 299 City area respondents was completed during the months ofApril and May 1993. The survey involved the use of a structured question-naire administered by telephone to randomly selected area residents whohad an account with a local financial institution. The questionnaire waspretested to assure the completeness and accuracy of responses. A typical
FIGURE 11.5. Executive Summary

respondent could be described as follows: married; male; between the agesof 35-44; lived in the area for 6-12 years; median income of between$35,000-$49,999; attended or graduated college.
• Each respondent was asked to identify his or her primary financial insti-tution. City Bank was by far the most frequently mentioned financial in-stitution (47 percent), followed by The First National Bank (14 percent)and Public Bank (11 percent).
• The services utilized most frequently at the primary financial institutionwere checking accounts, savings accounts, ATMs, and investment in-struments. Fifty-one percent of the respondents had done business at theirprimary institution for 6 or more years and 52 percent were highly satis-fied with their primary financial institution.
• Thirty-eight percent of the respondents reported having an account at asecondary institution. The most frequently utilized services were savings(18 percent), checking (14 percent), and investment instruments (13 per-cent). The majority of the respondents have done business with their sec-ondary financial institution for over 6 years. The high proportion of re-spondents with secondary institutions may indicate a preference for multiplefinancial relationships or a lack of cross-selling by primary institutions.
• Sixty-two (20.7 percent) of the respondents stated they had changed theirprimary financial institution since living in the area and of this group62.9 percent had done so in the last 5 years. This indicates the volatilityof the market with major changes (Public and The First National) duringthat time period. Based on this study and supplemental sources on depos-its, it appears that City Bank and The First National Bank have bothgained market share at the expense of Public Bank. Most respondentswho reported switching financial institutions changed from one bank toanother bank.
• The main reason respondents gave for switching primary financial insti-tutions was poor service. This theme was echoed in responses to anotherquestion on dissatisfaction with their current primary institution. Poorservice was named by 55 percent of the respondents who expressed dissat-isfaction with their current primary financial institution. Keeping currentcustomers satisfied with the service received appears to be a safeguardagainst dissatisfaction and ultimate switching from one financial institu-tion to another.
• Respondents were also asked to respond to 17 image characteristics tomeasure the image of several different institutions. City Bank was themost frequently mentioned institution on every item except “the one youwould never recommend.” City Bank was followed most closely by TheFirst National Bank, while Public Bank was a distant third.
• Respondents appear to see City Bank, the First National Bank, and tosome extent Public Bank as well-managed, progressive, innovative, cus-tomer-oriented institutions with a strong financial base, local, and in-volved in community activities. They were viewed as providing the bestservice, leaders among local financial institutions with friendly, knowl-

edgeable employees—the one they would recommend to others and bestfor people like themselves.
• Respondents were also asked questions to determine advertising aware-ness and media exposure for financial-institution advertising. When thethree financial institutions with the most active promotional campaigns(The First National Bank, Public Bank, and Premier Homestead) werecompared, 29 percent remembered seeing or hearing an ad for the FirstNational Bank, 22 percent remembered Public Bank, and 17 percent re-membered Premier Homestead. Media exposure for these campaignswere: (1) saw/heard TV ad—43 pecent; (2) heard radio ad—27 percent;and (3) saw newspaper ad—16 percent. All other media accounted for only14 percent.
FIGURE 11.5 (continued)
FINDINGS
This section presents the findings of the study. The first part shows thecharacteristics of the respondents who participated in the project. This is fol-lowed by a question-by-question analysis of the results of the study.
Sample Characteristics
FIGURE E-1LENGTH OF TIME RESPONDENTS HAVE LIVED IN AREA
Length of Time Frequency Percent0-2 years 40 133-5 years 67 236-12 years 52 1713-20 years 41 14Over 20 years 92 31Don’t Know/Refused 7 2Total 299 100
FIGURE E-2MARITAL STATUS OF RESPONDENTS
Marital Status Frequency PercentSingle with No Children 74 26Married with No Children 50 17Married with Children at HomeSingle with Children at Home
8612
304
Married with No Children at Home 53 18Single with No Children at Home 11 4Refused 4 1Total 290 100
FIGURE 11.6. Findings

FIGURE E-3AGE CATEGORY OF RESPONDENTS
Age Catgory Frequency Percent18-24 44 1525-34 84 2935-4445-54
5544
1915
55-64 28 1065 and older 20 7Refused 13 5Total 288 100
FIGURE E-4TOTAL FAMILY INCOME OF RESPONDENTS
Total Family Income Frequency PercentUnder $15,000 22 7$15,000-24,999 44 15$25,000-34,999$35,000-49,999
4849
1617
$50,000-64,999 33 11$65,000-79,999 7 2$80,000-94,999 – –$95,000-110,000 – –Over $110,000 8 3Don’t Know/Refused 88 29Total 299 100
FIGURE E-5EDUCATIONAL LEVEL OF RESPONDENTS
Educational Level Frequency PercentHigh School Graduate 52 17High School Graduate with Some Collge 88 30College GraduateCollege Graduate with Some Graduate School
10215
345
Graduate Degree Holder 18 6Don’t Know/Refused 24 8Total 299 100
FIGURE E-6SEX OF RESPONDENTS
Sex Frequency PercentMale 150 52Female 140 48Total 290 100

FIGURE E-7AVERAGE MONTHLY BALANCE IN CHECKING ACCOUNT
OF RESPONDENTS
Monthly Balance Frequency PercentUnder $250 24 8$250-500 43 14$501-1,000$1,001-2,000
6327
219
Over $2,000 51 17Don’t Know/Refused 91 31Total 299 100
FIGURE E-8AMOUNT RESPONDENTS HAVE INVESTED IN CDs, MONEYMARKET DEPOSIT ACCOUNTS, INDIVIDUAL RETIREMENT
ACCOUNTS, OR OTHER HIGH-YIELD INVESTMENTS
Amount Invested Frequency PercentNone 82 28Under $10,000 41 14$10,001-25,000$25,001-75,000
3827
139
Over $75,000 7 2Don’t Know/Refused 103 34Total 298 100
FIGURE E-9TYPICAL MONTHLY BALANCE FOR NONCHECKING
SAVINGS ACCOUNT OF RESPONDENTS
Monthly Balance Frequency PercentNone 32 11Under $2,500 38 13$2,501-5,000$5,001-7,500
3732
1211
$7,501-10,000 19 6Over $10,000 37 12Don’t Know/Refused 104 35Total 299 100
Primary Institution/Services Utilized by Respondents
Each respondent was asked to identify his or her Primary Financial Insti-tution. The results revealed the following statistics.
FIGURE 11.6 (continued)

FIGURE E-10RESPONDENT’S PRIMARY FINANCIAL INSTITUTION
Financial Institutions Frequency PercentCity Bank 136 47First Bank 25 9The First National BankPremier Homestead
3913
144
City Homestead 19 7Public Bank 33 11Other 24 8Total 289 100
Of the 289 customers interviewed, 136 or 47 percent stated that City Bankwas their primary financial institution. The First National Bank was the pri-mary financial insitution for 39 or 14 percent of the respondents. Of those sur-veyed, Public Bank was preferred by 11 percent or 33 of the respondents astheir primary financial institution.
The following figure shows the services utilized by respondents at theirprimary financial institutions.
FIGURE E-11SERVICES UTILIZED BY RESPONDENTS AT PRIMARY
FINANCIAL INSTITUTION
Services Frequency PercentAutomatic Teller Machine 162 54Personal Loan 48 16Automobile Loan 47 16Home (Mortgage) Loans 28 9Telephone Bill Paying Service 7 2VISA/MasterCard Service 85 28Safe Deposit Box 58 19Checking Account 286 96Savings Account 229 77Trust Account 11 4Money Market Deposit AccountCDs and Investment Instrument
23116
839
Individual Retirement Accounts (IRAs) 54 18Overdraft Protection 69 23Educational Loan 17 6Other 14 5
Of those surveyed, 286 or 96 percent have a checking account with theirprimary financial institution. A savings account was the second largest ser-vice utilized by 229 respondents or 77 percent. The automatic teller machinewas used by 162 respondents or 54 percent. CDs and other investment instru-ments were used by 116 or 39 percent of those surveyed at their primary fi-

nancial institution. Only 7 or 2 percent of those surveyed used the telephonebill paying service at their primary financial institution. Another infrequentlyused service by respondents is the trust account, used by 11 or 4 percent.
FIGURE E-12LENGTH OF TIME RESPONDENTS HAVE DONE BUSINESS WITH
THEIR PRIMARY FINANCIAL INSTITUTION
Length of Time Frequency PercentLess than 1 Year 34 121-2 years 30 103-5 years6-12 years
7982
2728
Over 12 years 67 23Total 292 100
Of those surveyed, 28 percent or 82 respondents have done business withtheir financial institution for 6 to 12 years. Seventy-nine respondents or 27 per-cent have done business with their primary financial institution for 3 to 5years. Of those surveyed, 51 percent have done business with their primary fi-nancial institution for 6 or more years.
Services Utilized at Secondary Financial Institution
Of those respondents interviewed, 112 or 38 percent have accounts at asecondary financial institution. The following figure outlines the servicesused by the respondents at their secondary financial institution.
FIGURE E-13SERVICES UTILIZED BY RESPONDENTS AT SECONDARY
FINANCIAL INSTITUTION
Services Frequency PercentAutomatic Teller Machine 8 3Personal Loan 11 4Automobile Loan 17 6Home (Mortgage) Loans 25 8Telephone Bill Paying Service 1 –VISA/MasterCard Service 15 5Safe Deposit Box 5 2Checking Account 42 14Savings Account 53 18Trust Account 3 1Money Market Deposit AccountCDs and Investment Instrument
338
113
Individual Retirement Accounts (IRAs) 17 6
FIGURE 11.6 (continued)

Overdraft Protection 1 –Educational Loan 6 2Other 2 1
Those respondents who have a secondary financial institution use a sav-ings account as the primary service (53 respondents or 18 percent). A check-ing account as a service at a secondary financial institution was used by 42 ofthe respondents or 14 percent. Of those surveyed, 38 or 13 percent utilizedCDs and investment instruments at their secondary financial institution. Theservices utilized least by respondents at their secondary financial institutionwere telephone bill paying service, overdraft protection, and trust accounts.
FIGURE E-14LENGTH OF TIME RESPONDENTS HAVE DONE BUSINESS WITH
THEIR SECONDARY FINANCIAL INSTITUTION
Length of Time Frequency PercentLess Than 1 Year 5 41-2 Years 14 122-5 Years6-12 Years
2832
2528
Over 12 Years 36 31Total 115 100
Of those surveyed who have secondary financial institutions, the majority(59 pecent) have done business with their secondary institution for over 6years. This indicates that either respondents prefer to have more than one fi-nancial institution or that primary institutions are not doing a good job ofcross-selling their services.
Changes in Primary Financial Institutions
Respondents were asked if they had changed primary financial institu-tions while living in this area. Of those surveyed, 62 or 21 pecent had changedprimary financial institutions. The following figure shows how long ago thechange was made.
FIGURE E-15HOW LONG AGO RESPONDENTS CHANGED PRIMARY
FINANCIAL INSTITUTIONS WHILE LIVING IN THIS AREA
How Long Ago Change Was Made Frequency PercentLess Than 1 year 13 211-2 Years 8 133-5 Years6-12 Years
1810
2916
Over 12 Years 13 21Total 62 100

Of those surveyed who changed primary financial institutions while liv-ing in this area, 18 or 29 percent made that change 3 to 5 years ago. This indi-cates a great deal of volatility in the customer base of financial institutions inthe area. In the last 5 years, 63 pecent have changed their primary financialinstitution.
The following figure states what type of change was made when respon-dents changed primary financial institution.
FIGURE E-16TYPE OF FINANCIAL INSTITUTION CHANGE MADE
BY RESPONDENTS
Categories Frequency PercentA Bank to a Savings and Loan 3 5A Bank to a Credit Union 2 3A Savings and Loan to a BankA Savings and Loan to a Credit Union
5–
8–
A Credit Union to a Bank – –A Credit Union to a Savings and Loan – –A Bank to Another Bank 50 84Total 60 100
Of those surveyed who changed primary financial institutions while liv-ing in this area, 84 percent or 50 respondents changed from one bank to an-other bank. The other types of changes made were from a savings and loan toa bank with 5 respondents or 8 percent making this type of change, 5 percentof the respondents changed from a bank to a savings and loan, and 3 percentchanged from a bank to a credit union.
The following figure will outline the main reason respondents changedprimary financial institutions while living in this area.
FIGURE E-17MAIN REASON RESPONDENTS CHANGED PRIMARY FINANCIAL
INSTITUTIONS
Reason for Change Frequency PercentPoor Service at Old 22 34Better Location at New 14 22Unsure of Stability/Felt Safer at NewInterest Rates Higher at New
95
148
Other 14 22Total 64 100
According to those surveyed, the most frequent reason to change primaryfinancial institutions was poor service. Twenty-two percent of respondentsalso stated that a better location was the reason they changed. Of those sur-veyed who have changed primary financial institutions, 14 percent changed
FIGURE 11.6 (continued)
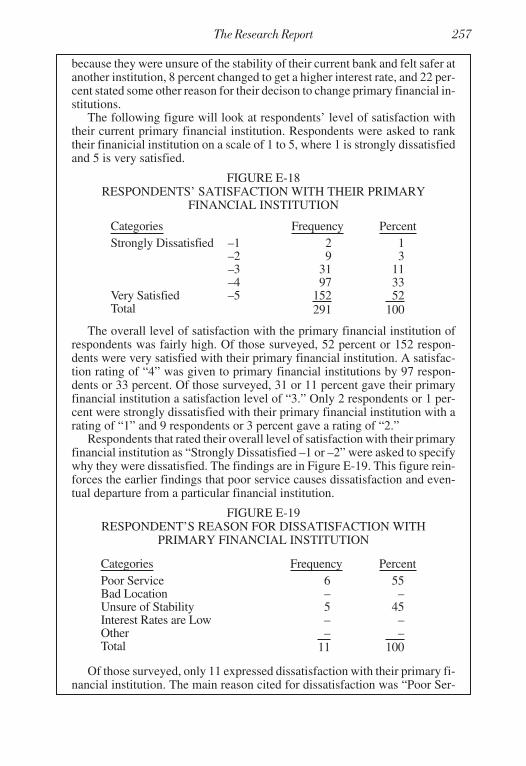
because they were unsure of the stability of their current bank and felt safer atanother institution, 8 percent changed to get a higher interest rate, and 22 per-cent stated some other reason for their decison to change primary financial in-stitutions.
The following figure will look at respondents’ level of satisfaction withtheir current primary financial institution. Respondents were asked to ranktheir finanicial institution on a scale of 1 to 5, where 1 is strongly dissatisfiedand 5 is very satisfied.
FIGURE E-18RESPONDENTS’ SATISFACTION WITH THEIR PRIMARY
FINANCIAL INSTITUTION
Categories Frequency PercentStrongly Dissatisfied –1 2 1
–2 9 3–3 31 11–4 97 33
Very Satisfied –5 152 52Total 291 100
The overall level of satisfaction with the primary financial institution ofrespondents was fairly high. Of those surveyed, 52 percent or 152 respon-dents were very satisfied with their primary financial institution. A satisfac-tion rating of “4” was given to primary financial institutions by 97 respon-dents or 33 percent. Of those surveyed, 31 or 11 percent gave their primaryfinancial institution a satisfaction level of “3.” Only 2 respondents or 1 per-cent were strongly dissatisfied with their primary financial institution with arating of “1” and 9 respondents or 3 percent gave a rating of “2.”
Respondents that rated their overall level of satisfaction with their primaryfinancial institution as “Strongly Dissatisfied –1 or –2” were asked to specifywhy they were dissatisfied. The findings are in Figure E-19. This figure rein-forces the earlier findings that poor service causes dissatisfaction and even-tual departure from a particular financial institution.
FIGURE E-19RESPONDENT’S REASON FOR DISSATISFACTION WITH
PRIMARY FINANCIAL INSTITUTION
Categories Frequency PercentPoor Service 6 55Bad Location – –Unsure of StabilityInterest Rates are Low
5–
45–
Other – –Total 11 100
Of those surveyed, only 11 expressed dissatisfaction with their primary fi-nancial institution. The main reason cited for dissatisfaction was “Poor Ser-
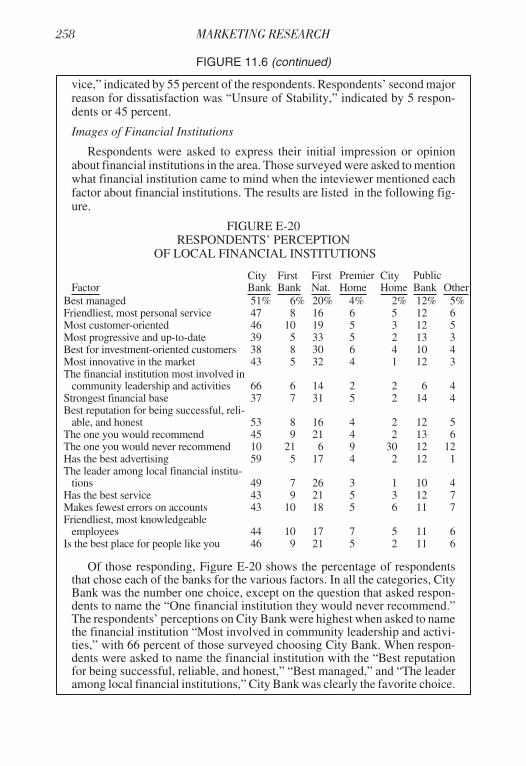
vice,” indicated by 55 percent of the respondents. Respondents’ second majorreason for dissatisfaction was “Unsure of Stability,” indicated by 5 respon-dents or 45 percent.
Images of Financial Institutions
Respondents were asked to express their initial impression or opinionabout financial institutions in the area. Those surveyed were asked to mentionwhat financial institution came to mind when the inteviewer mentioned eachfactor about financial institutions. The results are listed in the following fig-ure.
FIGURE E-20RESPONDENTS’ PERCEPTION
OF LOCAL FINANCIAL INSTITUTIONS
FactorCityBank
FirstBank
FirstNat.
PremierHome
CityHome
PublicBank Other
Best managed 51% 6% 20% 4% 2% 12% 5%Friendliest, most personal service 47 8 16 6 5 12 6Most customer-oriented 46 10 19 5 3 12 5Most progressive and up-to-date 39 5 33 5 2 13 3Best for investment-oriented customers 38 8 30 6 4 10 4Most innovative in the market 43 5 32 4 1 12 3The financial institution most involved in
community leadership and activities 66 6 14 2 2 6 4Strongest financial base 37 7 31 5 2 14 4Best reputation for being successful, reli-
able, and honest 53 8 16 4 2 12 5The one you would recommend 45 9 21 4 2 13 6The one you would never recommend 10 21 6 9 30 12 12Has the best advertising 59 5 17 4 2 12 1The leader among local financial institu-
tions 49 7 26 3 1 10 4Has the best service 43 9 21 5 3 12 7Makes fewest errors on accounts 43 10 18 5 6 11 7Friendliest, most knowledgeable
employees 44 10 17 7 5 11 6Is the best place for people like you 46 9 21 5 2 11 6
Of those responding, Figure E-20 shows the percentage of respondentsthat chose each of the banks for the various factors. In all the categories, CityBank was the number one choice, except on the question that asked respon-dents to name the “One financial institution they would never recommend.”The respondents’ perceptions on City Bank were highest when asked to namethe financial institution “Most involved in community leadership and activi-ties,” with 66 percent of those surveyed choosing City Bank. When respon-dents were asked to name the financial institution with the “Best reputationfor being successful, reliable, and honest,” “Best managed,” and “The leaderamong local financial institutions,” City Bank was clearly the favorite choice.
FIGURE 11.6 (continued)
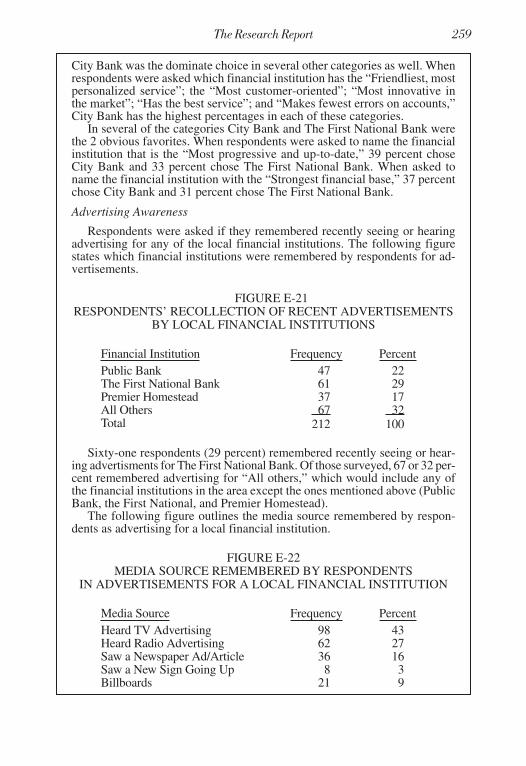
City Bank was the dominate choice in several other categories as well. Whenrespondents were asked which financial institution has the “Friendliest, mostpersonalized service”; the “Most customer-oriented”; “Most innovative inthe market”; “Has the best service”; and “Makes fewest errors on accounts,”City Bank has the highest percentages in each of these categories.
In several of the categories City Bank and The First National Bank werethe 2 obvious favorites. When respondents were asked to name the financialinstitution that is the “Most progressive and up-to-date,” 39 percent choseCity Bank and 33 percent chose The First National Bank. When asked toname the financial institution with the “Strongest financial base,” 37 percentchose City Bank and 31 percent chose The First National Bank.
Advertising Awareness
Respondents were asked if they remembered recently seeing or hearingadvertising for any of the local financial institutions. The following figurestates which financial institutions were remembered by respondents for ad-vertisements.
FIGURE E-21RESPONDENTS’ RECOLLECTION OF RECENT ADVERTISEMENTS
BY LOCAL FINANCIAL INSTITUTIONS
Financial Institution Frequency PercentPublic Bank 47 22The First National Bank 61 29Premier HomesteadAll Others
3767
1732
Total 212 100
Sixty-one respondents (29 percent) remembered recently seeing or hear-ing advertisments for The First National Bank. Of those surveyed, 67 or 32 per-cent remembered advertising for “All others,” which would include any ofthe financial institutions in the area except the ones mentioned above (PublicBank, the First National, and Premier Homestead).
The following figure outlines the media source remembered by respon-dents as advertising for a local financial institution.
FIGURE E-22MEDIA SOURCE REMEMBERED BY RESPONDENTS
IN ADVERTISEMENTS FOR A LOCAL FINANCIAL INSTITUTION
Media Source Frequency PercentHeard TV Advertising 98 43Heard Radio Advertising 62 27Saw a Newspaper Ad/Article 36 16Saw a New Sign Going Up 8 3Billboards 21 9

Conclusions and Recommendations
As mentioned earlier, the culmination of the research deals with thestatements given in reference to the decisions to be made based on the re-sults of the research (see Figure 11.7). This material could be given in thesummary but it will have more impact on the readers if it is separated into anew section. The researcher’s role is not just to present the facts, but to drawconclusions on the basis of the findings and to make recommendations onthe basis of the conclusions. The reader should be presented a set of conclu-sions and recommendations for managerial action. While no researcher canforce a manager to act on a set of recommendations, he or she should knowenough about the decision and the data collected to recommend a course ofaction. That is what the researcher is being paid for! To simply “present thefacts” and offer no recommendations is to lose the advantage gained by hav-ing someone who is not responsible for making the decision to at least sug-gest some alternative actions. The decision maker still has to “drive the car,”but the one who just reads the “road map” can surely offer some suggestionsabout which direction to go! (Actual recommendations were removed in thebanking study in the example in Figure 11.7).
CONCLUSIONS AND RECOMMENDATIONS
The Sample
The sample consisted of interviews with residents in the City area whohad an account with a local financial institution. Of the 299 area residens whowere surveyed, 52 percent were male and 48 percent were female. A typicalrespondent is described as a married male between the ages of 35-44, who haslived in this area for 6 to 12 years, with a median income of between $35,000and $49,999, and has attended or graduated from college.
FIGURE 11.7 Conclusions and Recommendations
Someone Told Me About It 3 1Other 2 1Total 230 100
Ninety-eight respondents (43 percent) cited TV as the media source re-membered for advertisments for a financial institution. Radio was the secondlargest media source remembered, cited by 62 respondents or 27 percent. Ad-vertising through the paper was remembered by 16 percent of the respon-dents.
FIGURE 11.6 (continued)
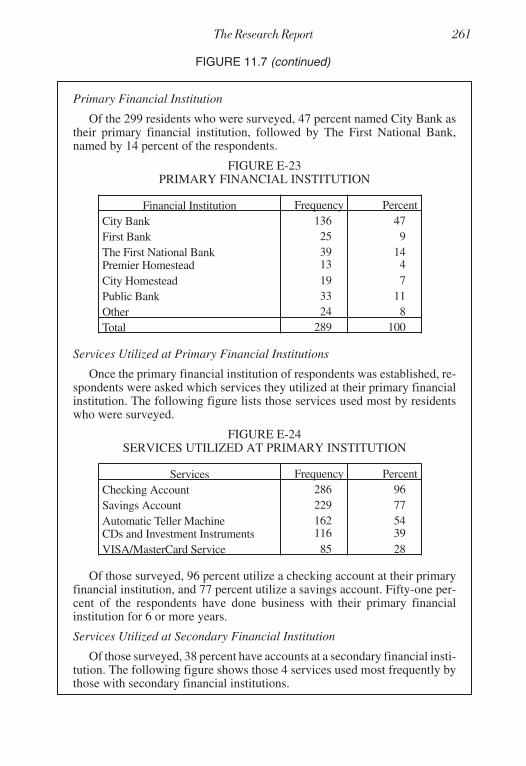
Primary Financial Institution
Of the 299 residents who were surveyed, 47 percent named City Bank astheir primary financial institution, followed by The First National Bank,named by 14 percent of the respondents.
FIGURE E-23PRIMARY FINANCIAL INSTITUTION
Financial Institution Frequency PercentCity Bank 136 47First Bank 25 9The First National BankPremier Homestead
3913
144
City Homestead 19 7Public Bank 33 11Other 24 8Total 289 100
Services Utilized at Primary Financial Institutions
Once the primary financial institution of respondents was established, re-spondents were asked which services they utilized at their primary financialinstitution. The following figure lists those services used most by residentswho were surveyed.
FIGURE E-24SERVICES UTILIZED AT PRIMARY INSTITUTION
Services Frequency PercentChecking Account 286 96Savings Account 229 77Automatic Teller MachineCDs and Investment Instruments
162116
5439
VISA/MasterCard Service 85 28
Of those surveyed, 96 percent utilize a checking account at their primaryfinancial institution, and 77 percent utilize a savings account. Fifty-one per-cent of the respondents have done business with their primary financialinstitution for 6 or more years.
Services Utilized at Secondary Financial Institution
Of those surveyed, 38 percent have accounts at a secondary financial insti-tution. The following figure shows those 4 services used most frequently bythose with secondary financial institutions.
FIGURE 11.7 (continued)

FIGURE E-25SERVICES UTILIZED AT SECONDARY INSTITUTION
Services Frequency PercentSavings Account 53 18Checking Account 42 14VISA/MasterCard Service 36 13Home (Mortgage) Loan 25 8
Of those respondents with secondary financial institutions, 59 percenthave done business with their financial institution for 6 or more years.
Changes in Primary Financial Institution
Of those surveyed, 21 percent had changed primary financial institutionwhile living in this area. Respondents were asked what type of change theymade, and 84 percent changed from one bank to another. The main reason re-spondents changed primary financial institutions while living in this area wasdue to poor service.
This finding coincides with respondents’ level of satisfaction or dissatisfac-tion with their primary financial institution. Fifty-two percent of those sur-veyed were very satisfied with their primary financial institution, while 4 per-cent of those surveyed were strongly dissatisfied. Those respondents whostated they were dissatisfied were then asked why they were dissatisfied.Fifty-five percent of those stated their main reason for dissatisfaction waspoor service.
Images of Financial Institution
Respondents were asked to express their initial impression about financialinstitutions in the area to deterine the image of several local financial institu-tions. The overall favorite in all of the categories (except for “the financial in-stitution you would never recommend”), was City Bank. Some of the charac-teristics respondents were asked about were: which local financial institutionis well managed, progressive, innovative, customer-oriented, with a strongfinancial base, and involved in the community. The local institution men-tioned first by the majority of the respondents was City Bank. The First Na-tional Bank was the respondents’ second most frequently mentioned, andPublic Bank came in a distant third.
Advertising Most Remembered and Media Source
To deterime advertising awareness and media exposure for local financialinstitutions, respondents were asked to identify financial institutions forwhich they recalled seeing or hearing advertising. When The First NationalBank, Public Bank, and Premier Homestead (the three local financial institu-tions with the most active promotional campaigns) were compared, 29 percentremembered seeing or hearing an ad for The First National Bank, 22 percent
FIGURE 11.7 (continued)

Supporting Documentation (Appendixes)
The appendixes can be used to present copies of questionnaires used inthe study, more detailed secondary data, or any other type of data or materialthat might be helpful to the user of the report (see Figure 11.8). In one studyof a new outdoor recreational concept, articles on innovative recreationalconcepts that had been previously introduced were given. This is only oneexample of how appendixes can be used. The researcher should avoid anyattempt to “pad” or build up the size of a report through the use of appen-dixes. This only takes away from the communicative force of the body ofthe report. However, detailed statistical analysis or even computer printoutscan be included in an appendix. It is also possible to provide this material ina separate volume for those who will make a detailed study of the report.
Presentation
We also recommend that the final report be bound. This is a relatively in-expensive way to add value to the report and at the same time provide evi-dence of professionalism and pride. Copies of such reports may be used foryears and binding ads protection to the contents. In general, a good rule ofthumb to use when considering what to say and where to say it in the writtenreport is to ask this question: “If someone totally unfamiliar with this re-search project were to take this report out of a file a month from now, wouldthe report be complete enough to give them enough information to make de-cisions in this area?” Supply a sufficient number of copies for everyone at-tending the oral presentation of findings, plus at least two copies for the filesof the primary recipient of the report and two copies for the researcher’s file.
Retail Banking Survey
[1-3] Hello. Am I speaking with the man/lady of the house? (IF NO, ASK TOSPEAK TO THAT PERSON.)
Hello, I’m____________. We’re conducting a marketing research projectwith area residents. This study deals with financial institutions and we needyour help in this project. your answers will be confidential and used only incombination with the responses of other people.
FIGURE 11.8. Supporting Documentation
remembered Public Bank, and 17 percent remembered Premier Homestead.Those who did recall seeing or hearing ads for financial institutions were alsoasked to identify the media sources where they saw or heard the ads. The me-dia source most frequently remembered was TV (43 percent), radio ads (27 per-cent), and newspaper ads (16 percent).

1a. Do you, or does a member of your household, work for a bank, savingsand loan, credit union, advertising, public relations, or market researchfirm?___YES (Terminate)___ NO
1b. Do you have a checking or savings account with a local financial institu-tion?___ YES___ NO (Terminate)
[4] 2. How long have you lived in this area?___ 0-2 Years1
___ 3-5 Years2
___ 6-12 Years3
___ 13-20 Years4
___ Over 20 Years5
[5] 3. What is the name of your primary financial institution?___ City Bank1
___ First Bank2
___ The First National Bank3
___ Premier Home Bank4
___ City Home Bank5
___ Public Bank6
___ Other7
4. What services are you currently utilizing at your primary financial insti-tution? (READ)
[6] ___ Automatic Teller Machine[7] ___ Personal Loans[8] ___ Automobile Loans[9] ___ Home (Mortgage) Loans
[10] ___ Telephone Bill Paying Service[11] ___ VISA/MasterCard Services[12] ___ Safe Deposit Box[13] ___ Checking Account[14] ___ Savings Account[15] ___ Trust Account[16] ___ Money Market Deposit Account[17] ___ CDs and Investment Instrument[18] ___ Individual Retirement Accounts (IRAs)[19] ___ Overdraft Protection[20] ___ Educational Loans[21] ___ Other
FIGURE 11.8 (continued)
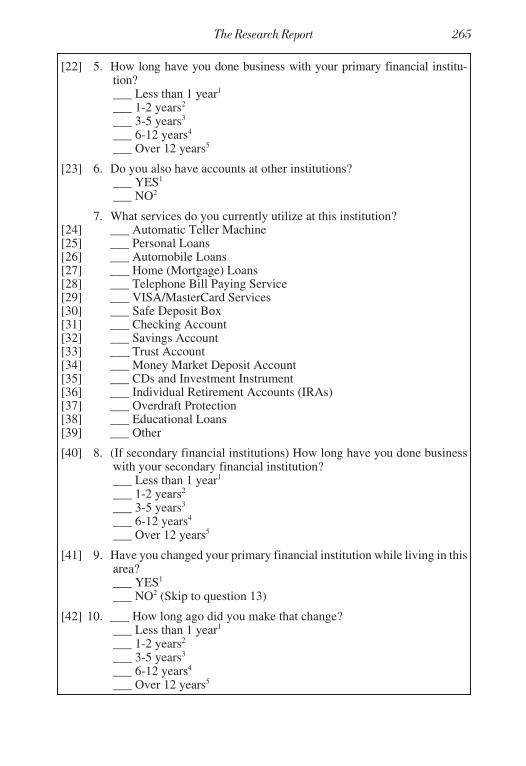
[22] 5. How long have you done business with your primary financial institu-tion?___ Less than 1 year1
___ 1-2 years2
___ 3-5 years3
___ 6-12 years4
___ Over 12 years5
[23] 6. Do you also have accounts at other institutions?___ YES1
___ NO2
7. What services do you currently utilize at this institution?[24] ___ Automatic Teller Machine[25] ___ Personal Loans[26] ___ Automobile Loans[27] ___ Home (Mortgage) Loans[28] ___ Telephone Bill Paying Service[29] ___ VISA/MasterCard Services[30] ___ Safe Deposit Box[31] ___ Checking Account[32] ___ Savings Account[33] ___ Trust Account[34] ___ Money Market Deposit Account[35] ___ CDs and Investment Instrument[36] ___ Individual Retirement Accounts (IRAs)[37] ___ Overdraft Protection[38] ___ Educational Loans[39] ___ Other
[40] 8. (If secondary financial institutions) How long have you done businesswith your secondary financial institution?___ Less than 1 year1
___ 1-2 years2
___ 3-5 years3
___ 6-12 years4
___ Over 12 years5
[41] 9. Have you changed your primary financial institution while living in thisarea?___ YES1
___ NO2 (Skip to question 13)
[42] 10. ___ How long ago did you make that change?___ Less than 1 year1
___ 1-2 years2
___ 3-5 years3
___ 6-12 years4
___ Over 12 years5
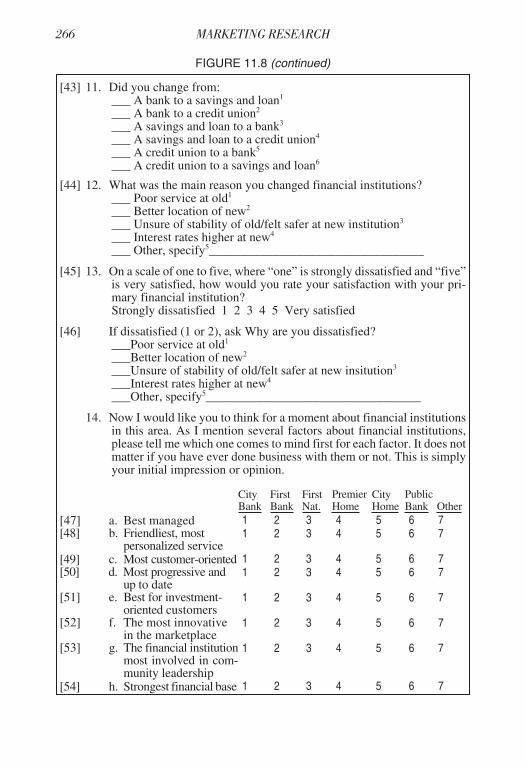
[43] 11. Did you change from:___ A bank to a savings and loan1
___ A bank to a credit union2
___ A savings and loan to a bank3
___ A savings and loan to a credit union4
___ A credit union to a bank5
___ A credit union to a savings and loan6
[44] 12. What was the main reason you changed financial institutions?___ Poor service at old1
___ Better location of new2
___ Unsure of stability of old/felt safer at new institution3
___ Interest rates higher at new4
___ Other, specify5__________________________________
[45] 13. On a scale of one to five, where “one” is strongly dissatisfied and “five”is very satisfied, how would you rate your satisfaction with your pri-mary financial institution?Strongly dissatisfied 1 2 3 4 5 Very satisfied
[46] If dissatisfied (1 or 2), ask Why are you dissatisfied?___Poor service at old1
___Better location of new2
___Unsure of stability of old/felt safer at new insitution3
___Interest rates higher at new4
___Other, specify5__________________________________
14. Now I would like you to think for a moment about financial institutionsin this area. As I mention several factors about financial institutions,please tell me which one comes to mind first for each factor. It does notmatter if you have ever done business with them or not. This is simplyyour initial impression or opinion.
CityBank
FirstBank
FirstNat.
PremierHome
CityHome
PublicBank Other
[47] a. Best managed 1 2 3 4 5 6 7[48] b. Friendliest, most
personalized service1 2 3 4 5 6 7
[49] c. Most customer-oriented 1 2 3 4 5 6 7[50] d. Most progressive and
up to date1 2 3 4 5 6 7
[51] e. Best for investment-oriented customers
1 2 3 4 5 6 7
[52] f. The most innovativein the marketplace
1 2 3 4 5 6 7
[53] g. The financial institutionmost involved in com-munity leadership
1 2 3 4 5 6 7
[54] h. Strongest financial base 1 2 3 4 5 6 7
FIGURE 11.8 (continued)

[55] i. Best reputation forbeing successful,reliable, and honest
1 2 3 4 5 6 7
[56] j. The one you wouldrecommend
1 2 3 4 5 6 7
[57] k. The one you wouldnever recommend
1 2 3 4 5 6 7
[58] l. Has the best advertis-ing
1 2 3 4 5 6 7
[59] m. The leader among lo-cal financial institutions
1 2 3 4 5 6 7
[60] n. Has the best service 1 2 3 4 5 6 7[61] o. Makes fewest errors
on accounts1 2 3 4 5 6 7
[62] p. Friendliest, most knowl-edgeable employees
1 2 3 4 5 6 7
[63] q. Is the best place forpeople like you
1 2 3 4 5 6 7
15. Do you remember recently seeing or hearing advertising for local finan-cial institutions? If yes, which ones?
[64] ___ Yes, Public[65] ___ Yes, First National[66] ___ Yes, Premier[67] ___ Yes, Other[68] ___ No (Skip to question 17)
16. On what media did you hear the advertising? (Mark all that apply)[69] ___ Heard TV advertising[70] ___ Heard radio advertising[71] ___ Saw a newspaper ad/article[72] ___ Saw new sign going up[73] ___ Billboards[74] ___ Someone told me about it[75] ___ Other
[76] 17. Now just a few more questions about you. Are you:___ Single with no children1
___ Married with no children2
___ Married with children at home3
___ Single with children at home4
___ Married with no children at home5
___ Single with no children at home6
___ Refused7
[77] 18. Which age category do you fit into?___ 18-241 ___ 56-645
___ 25-342 ___ 65 and older6
___ 35-443 ___ Refused7
___ 45-544
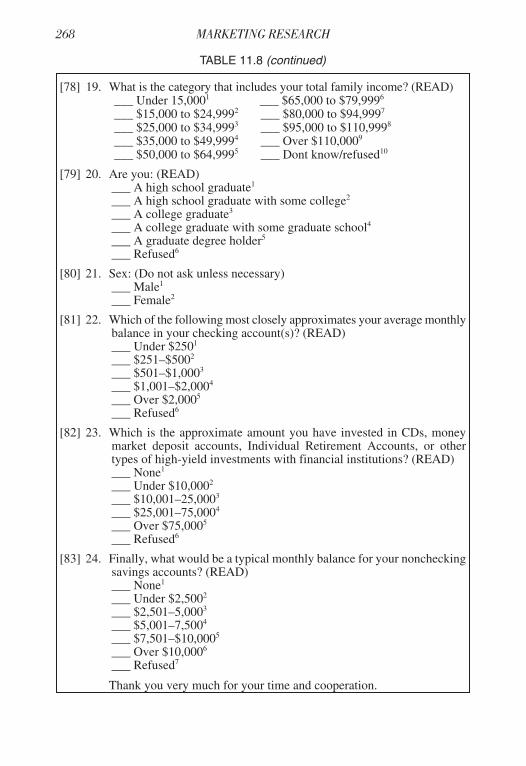
[78] 19. What is the category that includes your total family income? (READ)___ Under 15,0001 ___ $65,000 to $79,9996
___ $15,000 to $24,9992 ___ $80,000 to $94,9997
___ $25,000 to $34,9993 ___ $95,000 to $110,9998
___ $35,000 to $49,9994 ___ Over $110,0009
___ $50,000 to $64,9995 ___ Dont know/refused10
[79] 20. Are you: (READ)___ A high school graduate1
___ A high school graduate with some college2
___ A college graduate3
___ A college graduate with some graduate school4
___ A graduate degree holder5
___ Refused6
[80] 21. Sex: (Do not ask unless necessary)___ Male1
___ Female2
[81] 22. Which of the following most closely approximates your average monthlybalance in your checking account(s)? (READ)___ Under $2501
___ $251–$5002
___ $501–$1,0003
___ $1,001–$2,0004
___ Over $2,0005
___ Refused6
[82] 23. Which is the approximate amount you have invested in CDs, moneymarket deposit accounts, Individual Retirement Accounts, or othertypes of high-yield investments with financial institutions? (READ)___ None1
___ Under $10,0002
___ $10,001–25,0003
___ $25,001–75,0004
___ Over $75,0005
___ Refused6
[83] 24. Finally, what would be a typical monthly balance for your noncheckingsavings accounts? (READ)___ None1
___ Under $2,5002
___ $2,501–5,0003
___ $5,001–7,5004
___ $7,501–$10,0005
___ Over $10,0006
___ Refused7
Thank you very much for your time and cooperation.
TABLE 11.8 (continued)

GUIDELINES FOR THE WRITTEN REPORT
There are two methods used to present statistical data: tables and graphs.Both of these methods are commonly used in research reports. The type ofdata or the emphasis the researcher wishes to put on a given set of data de-termines which method to use.
Tables
A statistical table is a method of presenting and arranging data that havebeen broken down by one or more systems of classification. Analytical ta-bles are designed to aid in a formal analysis of interrelationships betweenvariables. A reference table is designed to be a repository of statistical data.The distinction between these two types of data is their intended use and nottheir construction. Table 11.1 is an example of an analytical table and Table11.2 is an example of a reference table.
Table 11.1 was prepared to analyze differences in preferences based onthe age of the respondents—an analytical table. Table 11.2 was prepared toreport to the reader the number of respondents of each sex that were inter-viewed—a reference table.
TABLE 11.1. Preferences for Motel-Related Restaurants by Age of Traveler*
Prefer Motel RestaurantsPrefer Nonmotel
RestaurantsTotalsby AgeNumber Percent Number Percent
Under 25 7 5.5 130 45.3 137
25-34 13 10.3 62 21.6 75
35-44 29 23.0 38 13.2 67
45-54 33 26.2 35 12.2 68
Over 55 44 34.9 22 7.7 66
Total 126 99.9** 287 100.0 413
Source: Survey data.
*Preference was defined as where they would eat if they were traveling and stay-ing at a motel with a restaurant.**Does not add up to 100 percent due to rounding.

TABLE 11.2. Sex of Travelers
Number Percent
MaleFemale
294119
71.128.9
Total 413 100.0
Source: Survey data.
Care should be taken in preparing tables to include proper headings,notes about discrepancies (percentages that add to more or slightly less than100, for example), and sources of data. This helps the reader interpret thedata contained in the tables and avoids obvious questions such as “Whydon’t the figures total 100 percent?”
Graphs
Many types of graphs can aid in presenting data. Three of the most com-monly used are bar charts, pie charts, and line charts. These three add a vi-sual magnitude to the presentation of the data. Graphics software packagesoffer a wide variety of options and are easy to use in creating a report withmore visual impact.
A bar chart is easily constructed and can be readily interpreted even bythose not familiar with charts. They are especially useful in showing differ-ences between groups. Consider, for example, how much more clear andimpactful the bar chart shown in Figure 11.9 is for communicating the find-ings of the data presented in Table 9.2. Here it is possible to visually repre-sent in a clear and convincing fashion our interpretation of the relationshipbetween the variables. Recall that in our Chapter 9 discussion we used Ta-ble 9.2 to identify a possible relationship between consumption rates andagreement to pay more to get your favorite brand of egg substitutes. The useof graphics to tell your analytical story can not only communicate your mes-sage more effectively, but also may leave more lasting recollection of thepoint you are making compared to use of tables full of numbers.
A pie chart is a useful graph in marketing studies especially when show-ing market share or market segments. Figure 11.10 presents a sample piechart. Adding color to highlight certain sections increases visual impact inpie charts. This permits identifying different shares held by different com-petitors also.
Figures 11.11 and 11.12 are line charts that are especially useful in show-ing trends in data and comparing trends for different products, customers,and market areas.

Low Medium High
0
50
100
150
200
250
300
350
Agree
Neither
Disagree
Number ofRespondents
Consumption Rate
FIGURE 11.9. Bar Chart of Table 9.2 Data
71.1%
28.9%
Male Female
FIGURE 11.10. Sex of Travelers (Pie Chart)
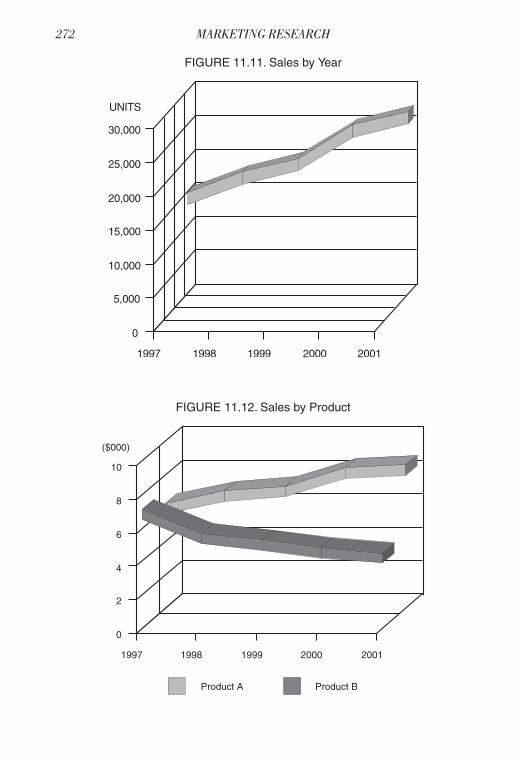
1997 1998 1999 2000 2001
0
5,000
10,000
15,000
20,000
25,000
30,000
UNITS
FIGURE 11.11. Sales by Year
Product A Product B
1997 1998 1999 2000 2001
0
2
4
6
8
10
($000)
FIGURE 11.12. Sales by Product

General Advice
Some general advice for preparing the written report is:
1. The written report represents you and your work. Make certain itleaves the impression you desire people to have about you as a professionalby ensuring the report is well written, with proper grammar, no errors, cor-rectly labeled tables, page numbers in table of contents matches text, and soon. Be obsessive about getting every detail correct and people will believethe report was written by the kind of true professional you are striving to be-come.
2. Do not organize the report by the stages of the research (e.g., a headingof “Literature Review Results, Case Analysis Results,” etc.). The decisionmakers reading the report do not want you to tell them what you discoveredin each phase of the research (e.g., “In the literature review we found . . .,”“In the in-depth interviews we discovered . . .”). They want you to put all thepieces together and discuss the overall findings, conclusions, and recom-mendations. Therefore, organize the report by key decisional areas andcombine all the findings from all sources and all stages of the research inyour discussion of that key decisional area. For example, if part of the re-search objectives related to making decisions about packaging, you mighttitle this section of the report “Packaging Decisions” and report findings onindustry trends discovered in your literature search, what inventory-manage-ment personnel of your key customer accounts said in in-depth interviews,the results of a descriptive-research sample survey of customers, and thefindings of an experiment testing the sales of two different package designsin this section, along with your conclusions and recommendations for pack-aging decisions.
3. Write for your audience. Some managers are interested in knowingthat you used factor analysis to determine the underlying attributes peopleuse to evaluate coffee brands, other managers perceive your telling themthis is “showing off,” irrelevant, and evidence that you are not part of the team.
4. Do not discuss exploratory reports using statistics (e.g., “42 percent offocus group participants liked this idea”). It is best to avoid heavy use of sta-tistics even when reporting the results of a large sample size exploratorysurvey. It is better, for example, to report a finding as “about a third of themales said they would be willing to try the product,” rather than
Would you be interested in trying this product?
Males FemalesYes 31% 27%No 60% 70%Not Sure 9% 3%

Reporting the results of an exploratory survey in the same way you wouldfor a descriptive research study will result in the reader of the report attribut-ing the same degree of precision and confidence in the exploratory as he orshe did to descriptive research. Remember, the purpose of exploratory is toprovide insights and ideas, and not measure frequencies and covariationwith calculable amounts of precision and confidence intervals as in the casewith descriptive research. Make sure the reader of the report understandshow the type of research you conducted is reflected in the way you reportthe findings, and correct someone (tactfully) when he or she misstates afinding by suggesting it is something it was never intended to be (e.g., a sta-tistic instead of a general observation).
5. Do not perform mathematical calculations on interval scaled data thatcan only be legitimately performed on ratio data. For example, let’s say youwere comparing your new brand of car wax to the market leader and askedpeople to indicate from their observation how shiny each wax made a car’shood look on the following scale:
Very shiny Shiny NeutralNot very
shinyNot at all
shiny
� � � � �5 4 3 2 1
If the average response for your brand of wax was 4.2 on the scale and yourcompetitor’s was 3.3, you could not claim your wax is “27 percent shinierthan the leading competitor.”
4.2 - 3.3 = .9 ÷ 3.3 = 27%
Why not? Because you are performing a calculation on intervally scale data,which is permissible only with ratio data. If the scale had looked like this
Very shiny Shiny NeutralNot very
shinyNot at all
shiny
� � � � �
+2 +1 0 –1 –2
your calculations would have been
1.2 - .3 = .9 ÷ .3 = 300%
Your wax is neither 27 percent nor 300 percent shinier than your competi-tor’s product because you can not use an interval scale to compute a ratiosuch as was done here.

6. Do not manipulate your graphs to mislead a reader in his or her inter-pretation of the research findings. Consider, for example, the impressionleft by the bar chart in Figure 11.13. The impression is that there has been asignificant downward trend in the percentage of sales dollars allocated toadvertising, when actually the decline is less than one percentage point ofsales. This misrepresentation would be even more egregious if actual adver-tising dollars had risen or remained the same from 1998 to 2000. Inten-tionally misleading the reader of your report is not only unethical, it bringsall of your findings, conclusions, and recommendations into question. Donot do it.
7. Unless you are divinely inspired, do not think your first draft of the re-port will be your last. Allow enough time before the report is due to makeseveral drafts. Have someone with good editing skills edit your work (ex-pect to pay them for this job). Have someone unfamiliar with the researchstudy read the report. If someone without a background in this particularproject can read and understand why you needed to do the research, whatyou did, what you found, and sees the conclusions and recommendations aslegitimate outcomes of the findings, then you probably have written a reportthat will actually influence decision making.
8. Quote respondents verbatim at appropriate points to “put a face on”your statistics. These quotes may be from statements made in the explor-atory research phase, such as in a focus group, or from an open-ended ques-tion in a descriptive survey. For example, you may have just reported thatonly 13 percent of people found the graphics in a print ad attractive. You
1998 1999 2000
0%
0.5%
1%
1.5%
2%
2.5%
3%
3.5%
4%
FIGURE 11.13. Advertising As a Percent of Sales

then might include some verbatim statements to illustrate the problem withthe ad:
“I give up. What is it supposed to be?”“Looks like one of those Rorschach tests.”“I’d tell you what I think I see but my mother would wash my mouthout with soap.”“You can’t be serious!”
Judicious use of concrete examples to illustrate abstract points makes yourfindings more memorable.
9. If 12 out of 17 people responded yes to a question, do not report the re-sults as Yes = 70.59 percent. Inevitably someone will ask for the samplesize and when you tell them you will at best look idiotic if not untrustwor-thy. Do not give results an aura of precision they do not deserve.
10. Make liberal use of headings and subheadings to aid the reader’s navi-gation through the report.
11. Use headings that communicate findings of interest to the decisionmakers. “Consumers Demand Quality” is better than “Findings Regardingthe Importance of Quality.”
12. Do all the other things you know you are supposed to do (e.g., use ac-tive instead of passive voice, say “we” instead of “I,” use present tense asmuch as possible, begin paragraphs with topic-revealing sentences, avoidresearcher jargon, use short words (e.g., “now” instead of “currently”),avoid clichés, do not use six words when two will do, etc.). Refer to one ofthe standard works on how to write well.1
ORAL REPORTS
Another effective way to present the results of a study is in an oral pre-sentation. The authors do not recommend this as a substitute for a written re-port, but as a supplement to the written document. The written report shouldbe seen as an archival document, and not just a cryptic written presentationfor those people thoroughly familiar with the project. If the oral presenta-tion is effectively done, it becomes a communication tool to reinforce whatis given in the written report. In many cases it becomes a technique to com-municate results to key executives who might not otherwise have interest oraccess to those who have been collecting data outside the organization.
With today’s audiovisual technology, no researcher should fail to usethese aids in an oral presentation. Plenty of evidence suggests that we re-member more of what we see and hear than of what we read only. Slides andtransparencies can be prepared at modest costs for most research budgetsand greatly add to the impact of the presentation. Again, computerized pre-

sentation graphics are easy to use and enable the researcher to customize thegraphics used in the oral presentation by including company logo, industrysymbols, etc. Short excerpts from videotaped focus group sessions can bevery effective in demonstrating with a specific example the broader findingand conclusions that tape segment is intended to illustrate. Remember, peo-ple are more likely to recall and use in formulating their own conclusionsthose bits of information presented in graphic or visual form rather than astables or numbers. The following is some general advice for preparing andpresenting an oral report:
1. There is increasing use of computerized presentation software such asPowerpoint, Aldus Persuasion, Astound, Harvard Graphics, Free-lance Graphics, and Presentations when making oral presentations.The use of such programs may be expected by your audience, anduse of “low-tech” presentation material such as overhead transpar-encies or flip charts may, unfortunately, label you as unsophisticated,inexperienced, or hopelessly behind the times. Check to see what isthe common practice for presentations to this audience. If you use acomputer software presentation package, ensure that you will be ableto run your presentation software, even if it means bringing your ownhardware.
2. Do not assume optimal conditions and equipment for your presenta-tion. In fact, do not assume anything except that you will get to theroom and none of your requests will have been met. Get there farenough ahead of the scheduled presentation that you can rearrange theseating, set up the screen and projector/computer that you brought incase your request for equipment was not met, ensure everything oper-ates as it should, etc.
3. Practice your presentation at least three times before making it in frontof the audience. Know your material in great detail. Be comfortablewith your material. Plan your presentation to take up only about two-thirds of the allotted time. Know where you need to be in your presen-tation by specific points in time (e.g., each fifteen minutes). If you arebehind schedule, skip less important material rather than rushingthrough everything.
4. Make sure you present your findings in an order that is consistent withthe way people draw connections between pieces of information andconstruct meaning for information. Have your presentation “tell thestory” that you have identified in the findings.
5. When appropriate, use visual aids (e.g., product packages, storyboards, etc.) to help the audience better relate to the research and find-ings. A good idea, for example, is to at different points in the presenta-tion play a few minutes of videotape from a focus group session to

demonstrate how actual consumers feel about the topic. This couldalso be done when discussing descriptive research results when a fewconsumers on the videotape express in a more visceral way what theemotionless data are revealing.
6. As with the written report, use charts and graphs whenever thatmethod of displaying the results communicates the findings more ef-fectively than tables.
7. Provide the audience with an outline of the presentation and papercopies of the key visuals (graphs, tables, conclusions, recommenda-tions, etc.).
8. Do all the other things common sense tells you you should do in a pre-sentation (e.g., tell them what you are going to tell them, tell them, tellthem what you told them; face the audience when describing a visual;make eye contact; do not make extravagant gestures, but do not seemstiff either; do not play with your pointer; make text on your visualslarge enough to read by the person farthest away from you; do not readfrom a script; make sure everyone hears a question from the audiencebefore answering it; etc.).
SUMMARY
This chapter has presented a brief overview of the steps involved in pre-paring a research report. The research report is not only a communicationtool, but is also a source document for future reference. The preparation ofthe report provides the researcher with the major vehicle to communicatefindings to management and to display the results of the work that went intocompleting the project.

CASES

CONTRIBUTORS
Henry Cole, PhD, is Assistant Professor of Marketing, University of Loui-siana at Monroe.
Edward L. Felton, PhD, is Professor of Management, College of Business,Samford University, Birmingham, Alabama.
Michael R. Luthy, PhD, is Associate Professor of Marketing, W. FieldingRubel School of Business, Bellarmine College, Louisville, Kentucky.
Marlene M. Reed, PhD, is Professor of Management, College of Business,Samford University, Birmingham, Alabama.
Bruce C. Walker, PhD, is Assistant Professor of Management, Universityof Louisiana at Monroe.
Stanley G. Williamson, PhD, is Associate Professor of Management, Uni-versity of Louisiana at Monroe.

Case 1
Lone Pine Kennel ClubLone Pine Kennel ClubStanley G. Williamson
Robert E. StevensDavid L. Loudon
Jack Thornton leaned back in his chair and scratched Blue, his favoritebird dog, behind the ear. Jack was the president of the Lone Pine KennelClub (LPKC) and a great believer in animal causes. In fact, Jack had takenthe lead in moving the club beyond its primary mission of training huntingand show dogs to putting together a foundation to raise financial support forthe local animal shelter. This Basic Animal Relief Foundation (BARF),however, was struggling with its fund-raising efforts.
LPKC is a voluntary organization made up of dog enthusiasts. The clubis located in a metropolitan area with a population of about 75,000 in an oth-erwise largely rural, southern state. Given the rural nature of the area, out-door recreational activities including hunting and fishing are a major pas-time for residents. Pickup trucks with a dog in the back are an everyday sight.
Unfortunately, being rural also means that the socioeconomic status ofthe local population was not particularly high, despite the club being locatedin a metropolitan area. And there were always plenty of good causes seek-ing donations from the populace at any given time.
Jack wondered how and to what extent these factors played into his cur-rent concerns about raising money for animal care. He believed that resi-dents probably had a soft spot in their hearts for dogs and other pets needinga proper home. But with money tight for many people and given the com-peting demands for the charitable dollar, Jack despaired that BARF wouldnot be able to reach its financial goals in support of animal relief.
BARF’s last fund-raiser produced modest results at best. Intuitively,Jack believed that not enough people actually knew enough about LPKCand BARF to give to its cause. He was willing to bet that although a greatmany people owned pets, this was their main focus as far as animals were

concerned. If true, this meant that not many people had ever been to the lo-cal animal shelter, much less adopted a pet from there or had given anythought to its support.
Although Jack harbored his suspicions about the situation, he truly be-lieved that taking care of derelict animals was a cause worth pursuing. Buthe also knew that his personal commitment to LPKC and his love of dogsmight be coloring his expectations about BARF and its fund-raising. Henow believed that a more objective view and analysis would be necessary toget to the bottom of the problems behind BARF. He wanted to bring in amarket research firm to do a study of the local situation as it relates toBARF’s efforts in support of the animal shelter.
To get his money’s worth out of the study, Jack knew he had some plan-ning to do. With pen in hand he began to jot down his thoughts. Jack saw thefundamental purpose of the study as improving donations to local animal re-lief efforts by determining the public’s awareness of the local animal shelterand BARF, and the populace’s willingness to contribute to animal controland care.
To more tightly focus the study, Jack next developed some goals for theresearch team to pursue. He believed they should uncover public opinionson the following:
1. Concern over stray animals2. Knowledge of animal shelter locations3. Condition and treatment of animals at the shelter4. Interest in adopting animals housed by the shelter5. BARF’s role in raising funds to support the shelter
And from the above, the research should:
6. Develop conclusions and recommendations to improve BARF’s per-formance
As Jack finished writing these notes, he felt as if he was on the right trackwith the market research idea and that he now had the plan basics that hecould talk to a research firm about and let them take it from there. He lookedover at Blue and smiled. As the dog stirred, Jack knew it was time for themto enjoy a walk together in the cool night air.
Discussion Questions/Assignments
1. Prepare a two- to three-page proposal outlining the major manage-ment issues, research objectives, and a research methodology.
2. Prepare a questionnaire to respond to the objectives you listed in yourproposal.

Case 2
Select Hotels of North AmericaSelect Hotels of North AmericaMichael R. Luthy
To gain experience in the hospitality industry, the sector of the economyJanet Huff wanted to enter after graduation, she applied for and was ac-cepted to the Select Hotels of North America summer internship program.This program is run by one of the premier hotel organizations in the field,managing seven different brand chains.
Over the last seven weeks she has experienced all phases of operations ata medium-size hotel in one of the company’s brand chains; maintenance,front desk operations, food preparation, housekeeping, banquet service, andreservations. With two weeks left in her internship she has been assigned tothe company’s headquarters. The goal of this portion of the internship is toexpose her to the strategy and operation of the organization in a larger sense.
On the first day of this stage of her internship, she was sent the followingmemo and numerical data:
(continued)
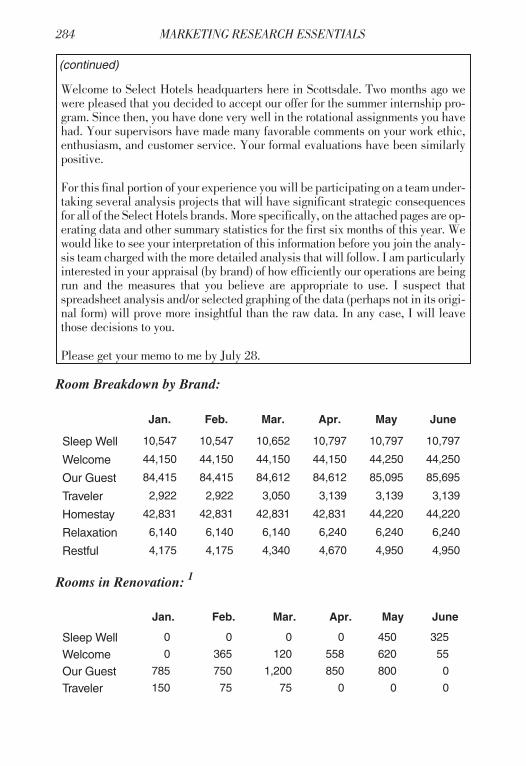
Room Breakdown by Brand:
Jan. Feb. Mar. Apr. May June
Sleep Well 10,547 10,547 10,652 10,797 10,797 10,797
Welcome 44,150 44,150 44,150 44,150 44,250 44,250
Our Guest 84,415 84,415 84,612 84,612 85,095 85,695
Traveler 2,922 2,922 3,050 3,139 3,139 3,139
Homestay 42,831 42,831 42,831 42,831 44,220 44,220
Relaxation 6,140 6,140 6,140 6,240 6,240 6,240
Restful 4,175 4,175 4,340 4,670 4,950 4,950
Rooms in Renovation: 1
Jan. Feb. Mar. Apr. May June
Sleep Well 0 0 0 0 450 325
Welcome 0 365 120 558 620 55
Our Guest 785 750 1,200 850 800 0
Traveler 150 75 75 0 0 0
(continued)

Homestay 2,000 2,500 0 0 0 0
Relaxation 0 600 0 0 0 0
Restful 0 0 250 200 200 0
Room Nights Rented: 2
Jan. Feb. Mar. Apr. May June
Sleep Well 312,585 271,982 315,280 299,814 302,859 298,712
Welcome 1,289,870 991,574 1,125,996 1,158,798 1,222,819 987,456
Our Guest 2,358,205 2,002,596 2,157,991 2,254,073 2,045,377 2,459,700
Traveler 84,872 73,580 89,054 87,598 95,870 74,198
Homestay 988,785 894,050 1,211,459 974,566 1,125,987 1,165,805
Relaxation 172,589 129,478 160,589 157,498 175,098 175,874
Restful 110,341 105,983 107,983 98,114 112,588 128,419
Average Room Rate:3
Jan. Feb. Mar. Apr. May June
Sleep Well $66 $66 $66 $66 $66 $66
Welcome $62 $62 $62 $62 $62 $62
Our Guest $54 $54 $54 $54 $54 $54
Traveler $46 $46 $46 $46 $46 $46
Homestay $39 $39 $39 $39 $39 $39
Relaxation $42 $42 $42 $42 $42 $42
Restful $30 $30 $30 $30 $30 $30
Average Room Rental Revenue Realized:4
Jan. Feb. Mar. Apr. May June
Sleep Well $63.95 $63.95 $63.95 $63.95 $61.45 $62.10
Welcome $50.88 $48.58 $48.95 $49.15 $50.88 $50.66
Our Guest $45.15 $47.92 $39.85 $45.60 $43.25 $46.65
Traveler $42.19 $43.25 $41.47 $42.81 $42.00 $39.87
Homestay $38.16 $38.54 $38.00 $36.45 $35.79 $36.87
Relaxation $41.11 $39.80 $40.25 $36.70 $41.75 $41.98
Restful $29.65 $29.54 $28.57 $27.50 $28.31 $26.50

Average Total Room Revenue Realized:5
Jan. Feb. Mar. Apr. May June
Sleep Well $72.26 $71.95 $70.81 $71.88 $64.27 $69.65
Welcome $54.25 $51.88 $52.31 $52.48 $54.40 $54.19
Our Guest $47.29 $50.20 $41.76 $47.68 $45.33 $48.71
Traveler $42.19 $43.25 $41.47 $42.81 $42.00 $39.87
Homestay $39.10 $39.46 $39.05 $37.28 $36.67 $37.54
Relaxation $41.11 $39.80 $40.25 $36.70 $41.75 $41.98
Restful $29.65 $29.54 $28.57 $27.50 $28.31 $26.50
Notes
1. Number of room units not available for nightly rental for the month.2. Summation of rooms rented each night across all nights in the month.3. Posted nightly room rate.4. Average room rate actually charged.5. Average total revenue linked to room rentals (includes mini-bar, va-
let/dry cleaning services, and hotel portion of local and long-distancetelephone charges as well as rack rate).
Discussion Questions
1. How well does each of the hotel chain brands perform if occupancyrate is used as the performance measure? Are there any drawbacks tousing this as the sole performance measure?
2. How well does each of the hotel chain brands perform if average roomrental revenue is used as the performance measure? Are there anydrawbacks to using this as the sole performance measure?
3. How well does each of the hotel chain brands perform if asset revenuegenerating efficiency (ARGE) is used as the performance measure?
4. Are there other issues or information not provided in this case thatmight affect your interpretation of the data? How could this additionalinformation affect your conclusions?

Case 3
River Pines School: ARiver Pines School: ABruce C. WalkerRobert E. StevensDavid L. Loudon
Tom Sanders, headmaster of River Pines School, sat in his office one af-ternoon pondering the state of his school. Even though the school reportedlyhas high academic standards and a long list of distinguished graduates whohave gone on to excel in college and life, enrollment was at dangerously lowlevels. It had been frustrating for Tom, who had been hired four years ago toturn the school around. It seems that every time a positive step was imple-mented or positive recognition was achieved, it was met, at best, with com-munity apathy and often was ignored by the local newspaper and televisionstations.
River Pines is a private, not-for-profit college preparatory school locatedin the northeast-central quadrant of a county of 250,000 people. The schooloffers classes in pre-Kindergarten through twelfth grade. The school hasfaced declining enrollment over the past six to eight years, falling from ahigh of 550 students to a low of nearly 200. Present enrollment is 235 stu-dents. River Pines’ high school is one of four private high schools in thecounty and the only private high school not affiliated with a religious orga-nization. A larger, religious-based private school is located five miles northof River Pines. In addition, there are five large, public high schools in thecounty. The school offers a variety of extracurricular activities at both themiddle school and high school, including athletics (football, basketball,softball, baseball, track, tennis, cheerleading/drill team) and personal en-richment (drama club, quiz bowl, debate team, French and Spanish Clubs,Fellowship of Christian Students, and choral competition). Academic re-quirements at River Pines exceed the requirements mandated by the state,and it is believed that academic standards and achievements of River Pinesstudents (in all grades) exceed those of other private and public schools, due

in part to a low student-teacher ratio. Over the past five years, the averagedollar amount of scholarships earned by River Pines graduating seniors hasexceeded the average dollar amount earned by the graduating seniors at allother area public and private high schools in the area.
Although River Pines has suffered major declines in enrollment, otherprivate schools have enjoyed significant gains, sometimes at the expense ofRiver Pines. A number of possible causes of enrollment decline have sur-faced, such as students wanting more social opportunities and extracurricu-lar activities not offered at River Pines (e.g., band, boys and girls soccer),however, no one at the school has been able to determine a root cause of theenrollment decline. A troublesome problem has surfaced, however. Parentshave been subjected to or have overheard negative rumors and other typesof “character assassination” by members of a rival private school. There ap-pears to be some credibility to the claim. Over the past five to seven years,not one student completing that rival middle school’s program has looked ator chosen River Pines as the high school of choice.
Tom knew that he and the school most likely needed a more focused mar-keting approach. It was obvious that word of mouth and internal recruitingefforts were failing. While the school was financially solvent—a minor mir-acle in view of the dramatic enrollment drops—very little money was avail-able for extras, such as an expensive marketing campaign. He knew, how-ever, that the school would have difficulty surviving and flourishing withthe present enrollment level. In addition, obtaining outside help was viewedas a necessity since Tom and members of the board of directors had no mar-keting expertise. The board gave Tom the approval to begin talks with out-side groups.
One particular firm in the area, Conceptual Dimensions, Inc. (CDI),seemed very interested and qualified to provide guidance and assistance toRiver Pines in this project. Becky Hutchinson, a senior marketing-researchprofessional, came to the school to meet with Tom and four key members ofhis staff. After touring the facilities, Becky asked the group some questions.She wanted to know what the school had done over the past few years to at-tract new students and to retain existing students. They described several at-tempts at attracting new students. These approaches included a sixty-secondvideo that aired on the local cable television channels, billboard advertisingprovided by a local bank that offered private-school financing programs tofamilies, and a program called Winterfest (held in January two years be-fore). This program featured several academic contests among River Pinesstudents along with a theme party. Students from schools of varying gradelevels were invited (along with parents) to come and observe the academiccompetition and participate in the theme party. River Pines indicated thatthey added three to five students as a result of the Winterfest program.

Student retention programs were virtually nonexistent. As mentionedearlier, students and parents stated that the reasons for leaving had to dowith programs that were not available to them at River Pines. Tom sus-pected that the stated reasons were only superficial, but he had not been ableto determine any other reasons. Becky Hutchinson suggested that obtainingmore information about why students and families left River Pines for otherschools would be critical information for the school to have in the develop-ment of marketing strategies. The committee agreed and asked Becky to puttogether ideas for them to review.
Discussion Questions/Assignment
1. Based on the information presented, what research objectives shouldBecky use to guide the study?
2. What methodology would be most appropriate for this project?3. Develop a questionnaire that would support achieving the research
objectives.


Case 4
River Pines School: BRiver Pines School: BBruce C. WalkerRobert E. StevensDavid L. Loudon
Tom Sanders, headmaster of River Pines School, sat in his office one af-ternoon pondering results of a market research survey concerning attributesof competitive private schools in the area to better understand factors in-volved in private-school selection decisions by parents and students. Theseresults were given to him by Becky Hutchinson, a senior marketing-researchprofessional with Conceptual Designs, Inc. (CDI), who came to the schoolto meet with Tom and four key members of his staff a few months back.
River Pines is a private, not-for-profit college preparatory school locatedin the northeast-central quadrant of a county of 250,000 people. The schooloffers classes in pre-Kindergarten through twelfth grade. The school hasfaced declining enrollment over the past six to eight years, falling from ahigh of 550 students down to a low of nearly 200. Present enrollment is 235.River Pines’ high school is one of four private high schools in the countyand the only private high school not affiliated with a religious organization.In addition, there are five large, public high schools in the county. Eventhough the school reportedly has the highest academic standards and a longlist of distinguished graduates who have gone on to excel in college and life,enrollment was at dangerously low levels. It had been frustrating for Tom,who had been hired four years ago to turn the school around.
It seems that every time a positive step was implemented or positive rec-ognition was achieved, it was met, at best, with community apathy and oftenwas ignored by the local newspaper and television stations. To make mat-ters worse, River Pines was the only major private school in the county withdeclining enrollment. The other schools had been enjoying significant gainsin their student body. River Pines had retained CDI to conduct market re-search to help the school attract and retain students.

River Pines currently provided students with a competitive variety of ex-tracurricular activities, including athletics (football, basketball, softball,baseball, track, tennis, cheerleading/drill team) and personal enrichment(drama club, quiz bowl, debate team, French and Spanish Clubs, Fellowshipof Christian Students, and choral competition). Academic requirements atRiver Pines not only exceed state requirements, but also appear to be thehighest in the county.
Tom and the board felt that a more focused marketing approach to attractand retain students was needed, since word of mouth, internal recruiting ef-forts, and other outside attempts at attracting students had either failed orwere marginally successful, at best. CDI had been retained to assist in thisprocess. CDI used both personal interviews and telephone surveys of thecounty’s private schools to address the following objectives:
1. Analyze River Pines’ current basic competitive position compared tothe other area private schools. This would include identifying eachschool’s offerings and evaluating how each school is marketing theirprograms and services; and, analyze River Pines’ position comparedto the other schools.
2. Use this information to make market share and enrollment recommen-dations.
Competitive information collected included levels of offered grades, pri-mary geographic area of students, numbers of students and faculty mem-bers, fees and fee structures, extracurricular activities, educational achieve-ments (ACT, SAT scores), scholarship offers, and whether or not theschools were religious- or secular-based. From this information, CDI wasable to develop a list of characteristics, including five-year enrollmenttrends, average student-teacher ratios, standardized test scores, perfor-mance-based or needs-based scholarship opportunities for existing and pro-spective students, to mention only a few. Results of the findings are in-cluded as tables C4.1 through C4.10.
TABLE C4.1. Grades Offered and Enrollment for 1997
Grade# of
schools Min Max MeanStandardDeviation
RiverPines
RP vs.average
Pre-K 11 1 150 38.91 45.67 9 –29.91
Kindergarten 14 2 52 26.00 17.08 12 –14.00
First 13 2 61 28.54 17.21 32 3.46
Second 13 2 60 23.62 16.23 18 –5.62
Third 12 2 60 27.17 17.11 21 6.17

Fourth 12 2 60 28.75 19.80 15 –13.75
Fifth 13 1 60 23.92 18.14 11 –12.92
Sixth 12 3 60 25.00 17.77 17 –8.00
Seventh 13 2 71 28.54 23.10 14 –14.54
Eighth 11 7 60 33.55 15.76 27 –6.55
Ninth 9 3 89 41.22 28.24 17 24.22
Tenth 9 2 96 39.56 29.00 15 –24.56
Eleventh 9 6 97 40.11 28.73 16 –24.11
Twelfth 9 2 85 37.11 26.55 23 –14.11
TABLE C4.2. Enrollment for the Past Five Years
Year# of
schools Min Max MeanStandardDeviation
RiverPines
RP vs.average
1992 14 30 589 269.71 172.76 364 94.291993 14 30 627 286.14 185.19 347 60.861994 15 30 627 281.40 197.67 323 41.601995 15 37 671 306.13 206.16 303 –3.131996 15 10 700 313.60 226.34 242 –71.60
TABLE C4.3. Geographical Areas of Students
# of schools Min % Max % Mean %Standard
Deviation %River
Pines %
Area 1 11 20 98 62.00 27.37 96
Area 2 12 1 100 33.67 30.83 1
Area 3 2 5 5 5.00 0.00 0
Area 4 3 2 80 29.00 44.19 2
Area 5 1 50 50 50.00 0.00 0
Area 6 2 1 54 27.50 37.48 1
Other 11 1 50 19.73 16.39 0
TABLE C4.4. Faculty Size and Student-Teacher Ratio
# ofschools Min Max Mean
StandardDeviation
RiverPines
RP vs.Avg.
Faculty Size 15 3 59 26.13 16.30 29 2.87
Student/Teacher Ratio
14 6 20 12.50 4.03 9 –3.50

TABLE C4.5. Sports Programs
IsOffered
NotOffered % Offering
StandardDeviation River Pines
Softball 6 8 42.86 0.4972 Offered
Baseball 6 8 42.86 0.5136 Offered
Football 10 4 71.43 0.4688 Offered
Basketball 12 2 85.71 0.3631 Offered
Soccer 5 9 35.71 0.1972 Not Offered
Track 7 7 50.00 0.5189 Offered
Tennis 4 10 28.57 0.1688 Offered
Cross-country 3 11 21.43 0.4258 Offered
Golf 7 7 50.00 0.5189 Offered
Other 6 9 42.86 0.5071 Offered
TABLE C4.6. Extracurricular Activities Offered
# of schools Percent River Pines
Few 6 42.9
Some 4 28.6
Many 4 28.6 yes
Total 14 100.0
TABLE C4.7. Average Test Scores
# of SchoolsResponding Min Max Mean
StandardDeviation
RiverPines
SAT 3 1200 1201 1200.5 0.7071 1201
ACT 7 17.2 25 21.79 2.53 23.7CAT 2 83 85 84 1.41 —
IOWA 2 75 98 83.6 12.55 —
StanfordAchievement
2 65 86 75.33 10.5 86
TABLE C4.8. Graduation, College, Scholarships
Min % Max % Mean % River Pines %
Graduation rates 98 100 99.75 100
% who enter college 75 100 90.88 100
% who receive scholarships 20 70 49.06 45-55
Average dollar amount/scholarships
$4,000 $25,000 $13,236 $24,223

TABLE C4.9. Religious Affiliation
# ofschools Percent
RiverPines
Not affiliated 3 20 yes
Affiliated 12 80
Total 15 100
TABLE C4.10. Tuition, Fees, Scholarships
# ofschools Min Max Mean
StandardDeviation
RiverPines
RP vs.average
Tuition 14 1400 3674 2471.93 682.231 2606 134.07
Fees 14 0 897 231.79 251.816 897 665.21
Scholarships 14 6 8 43% N/A Yes N/A
Discussion Questions/Assignments
1. Prepare a written analysis of the information given in these tables.2. Based on your analysis of this information, what recommendations
would you make to River Pines school?3. What types of data and aids would you use to present the findings to
River Pines?


Case 5
Gary Branch, CPAGary Branch, CPAHenry Cole
Robert E. StevensDavid L. Loudon
Over the past five to ten years, business firms in the local area have foundit difficult to attract and retain qualified employees with solid technical jobskills. As such, companies needed to reassess and often modify their em-ployment, compensation, and retirement packages to achieve these twogoals. In addition, Congress had passed legislation allowing different typesof retirement programs for smaller businesses as well as modifying whatconstituted qualifying expenses under the tax code. For most of these com-panies, the changes in the tax codes and modifications to employee pay andbenefit packages resulted in an overall increase in administrative and pay-roll costs. One major area of expense for employers was the fee they wererequired to pay to third-party administrators (TPAs) to manage and admin-ister retirement programs and funds.
Gary Branch has been in business as an independent certified public ac-countant (CPA) for twenty years. Over that time, he has built a respectablebusiness portfolio. As with most CPA firms, the majority of his business in-volved preparing federal and state income and related tax returns. Althoughthis business obviously has been lucrative for Branch, he recognized thattax-related work resulted in a “feast or famine” business operation. With themajority of his business related to taxes, this meant that he and his employ-ees were extremely busy from November through mid-April, and somewhatbored from mid-April through October. As the business grew, both in termsof client size and employee size, Branch realized that he was finding it moreand more difficult to keep up with the demands and responsibilities placedon him during the “feast” times. Therefore, he was looking for opportunitiesthat might help increase his business and revenue opportunities in areasother than income tax preparation.

For some time, Branch had been studying the role of TPAs and the de-mands placed on those providing such services. His basic research, gar-nered through readings and talking with his clients, revealed three majortypes of firms fulfilling the responsibility of a TPA, each with major draw-backs. First, a number of commercial banks were marketing themselves asTPAs. Banks were able to provide the administrative services that were re-quired; however, Branch’s clients who used commercial banks were be-coming more and more disappointed with their services because of the highvariable service cost, charged as a percentage of plan assets. In addition,brokerage firms and insurance companies provided administrative servicesas well as investment services. The fees charged by these groups appear tobe three to four times higher than those charged by the third major type ofprovider, the independent firm.
Branch felt that the clients that he spoke with were not happy with theselarge firms because of the firms’ inability to offer personal services that asmall independent or local banking operation might provide. With this in-formation, Branch suspected that his firm might be able to develop a nichemarket that could provide profitable, employee-friendly companies withvalue-added TPA services to his clients, resulting in a major business andrevenue source for his firm. Not only would he be able to provide additionalservices to existing clients, this might also generate new clients for bothTPA and tax services. He was excited about these possibilities and con-cluded that the next step would be to conduct independent market research.To begin that process, he turned to a client and personal friend, Dr. PaulCreighton, a market research professor and author at the local university.
Since Creighton taught a senior-level marketing research course at theuniversity, Branch felt this would be an outstanding project for a group ofhis students (with Creighton serving as the project director). Shortly afterBranch and Creighton met for lunch to discuss the project, Creighton in-vited Branch to attend one of his market research classes and present hisideas and supporting information to the students. He met for approximatelytwo hours with the group and the group was able to come up with three ma-jor research objectives. These objectives included:
1. Identify the continuing business needs of the firm in the area ofadministering retirement plans
2. Identify the types of plans being offered and their level of satisfactionassociated with the services being provided by the present TPA
3. Identify the potential target market through the use of NAICS codes
To accomplish these objectives, the students went through secondarydata sources available to them to determine the NAICS codes with whichthey should be concerned. The students conducted a stratified proportional

random sample of local industry and determined codes and percentage ofarea businesses within each code. These results are listed in Table C5.1.
Once this process was concluded, several interesting aspects surfaced.Three different NAICS codes were identified that contained more than 10 per-cent each of the local business establishments. The largest percentage of
TABLE C5.1. Percentage of Local Business by NAICS Code
SIC Code Industry Percentage
7538 Automotive Repair, Services, and Parts 7.2
1521 Building Construction 4.8
5211 Building Materials 3.6
7389 Business Services 7.2
5191 Chemicals and Allied Products 1.2
2899 Communications 1.2
1629 Construction/Special-Trade Contractors 1.2
5812 Eating and Drinking Places 15.7
8711 Engineering, Accounting, Research,Management, and Related Services
2.4
3498 Fabricated-Metal Products 1.2
5411 Food Stores 7.2
5712 Furniture and Fixtures 2.4
8011 Health Services 22.9
8041 Heavy Construction Contractors 1.2
6411 Insurance Agents, Brokers, and Ser-vices
13.3
8099 Legal Services 1.2
7699 Miscellaneous Repair Services 6.0

businesses categorized under one NAICS code was health services (22.9 per-cent). Most of the businesses in this category included individual doctors’offices and a few medical labs. In addition, there were four major hospitalsserving the immediate area. Of these four, only one was a locally owned, in-dependent (not-for-profit) hospital. The other three included a state hospital(employees covered under the state employees benefit and retirement pro-gram); a not-for-profit Catholic hospital (one of three major Catholic hospi-tals in a system); and a for-profit, national chain hospital. While these threehospitals represented a tremendous potential source of income and busi-ness, the reality was that being able to secure a contract with any of the threewould be a very time-consuming process.
The second largest percentage of business represented by a NAICS codewas found to be eating and drinking places (15.7 percent). Branch suspectedthat a large percentage of these businesses most likely did not offer retire-ment plans at all. Exceptions to this might involve two different organiza-tions that owned a series of “fast-food” businesses. He suspected that thosegroups did provide a retirement package to senior-level people and to res-taurant managers. Those two groups might be potential client companies.Finally, the third largest percentage (13.3 percent) was made up of insur-ance agents, brokers, and service companies, potential competitors for TPAbusiness.
Once the NAICS analysis was completed, the students developed astructured questionnaire that would be the basis for a telephone survey oflocal business establishments. The students decided to exclude from thissurvey businesses that were part of a franchise or chain, as well as Branch’sexisting clients. The questionnaire included questions concerning the typeof retirement plan offered by a business, who administered these plans, andbusiness-satisfaction levels with their present TPA and plan. See FigureC5.1 for a copy of the questionnaire.
Company
Person Interviewed
Interviewer
This is a survey for the owner or manager of the business.
Hello, I am , a student at the university and as a partof a class project we are conducting a market research project with the areabusinesses. This study deals with retirement plan administration. May I speakwith the person in charge of making these decisions for your company? Would
FIGURE C5.1. Retirement Plan Administration Survey Questionnaire

you take a few moments to answer a few questions for me? Your answers will beconfidential and used only in combination with the responses of other people.
[1] 1. Does your company offer any type of retirement plan for employees?______ Yes ______ No (If yes, skip question 2 and continue)
[2] 2. Are you thinking about offering such a plan?______ Yes ______ No (If this question is answered, terminate)
[3] 3. What other types of retirement plans are offered to employees?________ 401K________ Profit Sharing________ Pension Plan________ Other (Please specify)
[4] 4. Who administers the plan for your company?________ Self-Administered (If so, terminate)________ Outside Administration Bank________ Outside Administration Brokerage Firm________ Outside Administration Consulting Firm or CPA Firm________ Other (Please specify)
[5] 5. What other services are you currently receiving from this firm?________ Retirement Plan________ Profit Sharing Plan________ Other (Please specify)
[6] 6. Are there other retirement plan services you would like to receive, butare not available?________ Yes ________ No
7. Please rate the level of satisfaction you have with the form thatadministers your plan on each of the following characteristics usingexcellent, good, fair, or poor.
Excellent Good Fair Poor NR
[7] A. Courtesy 1 2 3 4 5
[8] B. Product knowledge 1 2 3 4 5
[9] C. Accuracy 1 2 3 4 5
[10] D. Speed 1 2 3 4 5
[11] E. Value for the cost 1 2 3 4 5
[12] F. Convenience 1 2 3 4 5
[13] 8. What are the fees that your company is being charged for theadministration of your retirement plan?________________________

Questions
1. Analyze the questionnaire shown in the case. What changes should bemade?
2. The case points out that the group conducted a telephone survey andexcluded franchise and chain operations, as well as Branch’s clients.Develop an alternative methodology that could be used to accomplishthe research objectives.
3. Should Branch’s clients have been excluded in this survey? Why orwhy not?
[14] 9. Given the number of available retirement plans to choose from, wouldyou say that you are:________ Very Satisfied________ Somewhat Satisfied________ Not Satisfied At All
[15] 10. Given the administrators knowledge of alternatives, would you sayyou are:________ Very Satisfied________ Somewhat Satisfied________ Not Satisfied At All
[16] 11. How would you rate your likelihood of changing retirement plan admin-istrator if a local firm, knowledgeable in retirement planning, offeredthis service at comparable rates? Would you say you would be:________ Very Likely to Change________ Somewhat Likely to Change________ Undecided________ Somewhat Unlikely to Change________ Very Unlikely to Change
[17] 12. What other plans have you been offered?____________________________________________________________________________________________________________
[18] 13. How many employees do you have?__________________________
[19] 14. Number of Full-time ____________
[20] 15. Number of Part-time ____________
[21] 16. SIC Code _____________________(To be filled in by the interviewer)
FIGURE C5.1 (continued)

SPSS Applications
Analyze the data found in the SPSS file and answer or complete the fol-lowing questions or assignments.
1. Develop tables and/or charts that provide the following information:Percent of firms in the area offering retirement plans.Percent of firms not providing a retirement plan who might beinterested in doing so.The breakout of different TPAs presently serving the local market.The likelihood that a business might be willing to change itspresent TPA.
2. What conclusions can be reached concerning respondent satisfactionlevels of present TPAs with regard to courtesy, product knowledge,accuracy, speed, value, and client convenience?
3. Based on the data, what recommendations would you make to GaryBranch, CPA?


Case 6
Juan Carlos’ Mexican RestaurantJuan Carlos’ Mexican RestaurantBruce C. WalkerRobert E. StevensDavid L. Loudon
Juan Carlos Garcia, owner of Juan Carlos’ Mexican Restaurant (JC),faced the same problem as many other small business owners. His idea ofsuccessfully operating a Mexican restaurant in a small- to medium-sizedcommunity had been largely successful up until six months ago. Since thattime, he noticed a small drop in the average weekly number of customersand that profits were suffering from that drop. He had made it a point tospend more time on the restaurant floor during peak-hours, to observe howwell and how effectively his employees were meeting the needs of the res-taurant patrons. He also would visit with diners during their meal to makesure their needs were being satisfied. Not only did he not find any issues orproblems, it seemed that his employees were exceeding his service expecta-tions, a point that customers generally verified. It also appeared that thefood quality was at the same level that it had been during the preceding threeyears. He also scanned the overall environment to try to determine if re-cently opened restaurants were hurting his business. One new Mexican res-taurant had opened about a year before, but he concluded that the proximityof the restaurant did not negatively affect his business, at least during thefirst six months of the new restaurant’s existence. The answer appeared tolie somewhere other than in the quality of food, quality of service, and out-side competition. He was at a loss to figure out what it might be.
Juan Carlos Garcia had opened his restaurant seven years before on ashoestring budget in a house that had been left to him through the estate ofhis uncle, Jose Gonzales Garcia. The house originally had been a single-family structure located in a residential neighborhood. Beginning in the mid1970s, the neighborhood began to see zoning conversions from single-fam-ily dwellings to zoning allowing for small commercial ventures. Jose saw

future opportunities in the zoning change. He convinced the city planningcommission to allow him to change his property’s zoning restriction fromsingle family to small commercial in order to operate a small commercialprinting operation out of the structure. Before his dream could be realized,Jose passed away, leaving the house and a vacant lot across the street fromthe structure to Juan Carlos. Juan Carlos fulfilled a lifelong dream of open-ing a restaurant in the structure and had the vacant lot paved to provide ap-proximately twenty parking spaces to be used exclusively by JC customers.
JC’s Mexican Restaurant is located in a two and one-half square mileolder, restored residential area in the center of a community of approxi-mately 75,000 people with average to above-average income levels. Beingcentrally located is advantageous to the restaurant because of the easy ac-cess. Several other small businesses are located within two blocks of therestaurant, including offices and a small nursing/medical supply companyand a barbershop. There were several restaurants within this two-block area.Those restaurants included a Chinese Restaurant, a somewhat trendy sit-down or take out “burger and fry” type restaurant, and a more upscale, sit-down restaurant named Jiving Java, which specialized in American cuisine.Jiving Java also held two or three fashion shows a month during the eve-ning. The only time this seemed to hurt Juan Carlos’ business was on thosenights that Jiving Java had a women’s lingerie fashion show. He felt thatthere was not much he could do on those nights, other than offer dinner spe-cials. All of these restaurants, including Juan Carlos’, served both lunch andevening meals.
Over the years, Juan Carlos had become a friend with Dr. LouiseGilmore, a frequent customer and a marketing professor at the local univer-sity. Juan Carlos invited Dr. Gilmore for dinner one night and visited withher during her meal. He explained in general terms the situation and asked ifshe might be able to help him or refer him to a group that could. Dr. Gilmoretold Juan Carlos that she was teaching a marketing research class and thatthis would be an excellent project for the students. Juan Carlos felt verycomfortable with Dr. Gilmore and felt sure that her research assistancewould provide him with information that would help him correct his prob-lem of declining profits. Dr. Gilmore committed to coming back next weekwith a student team to begin work on the research.
Dr. Gilmore and her team met with Garcia for approximately two to threehours the next week. During that time, Garcia gave the students the historyof the restaurant and all financial statements during that time. The studentsasked Juan Carlos a number of questions about the area’s restaurants, indus-try trends, and about any possible cyclical variations that might exist. Forthe most part, Garcia was able to provide the information that the team re-quested. One thing that he had not done, however, was to survey his cus-tomer base to see what type of appeal his restaurant and menu held for cus-

tomers. The group established the following objectives to guide the researchfor the restaurant:
1. To identify the most attractive features of JC’s Mexican Restaurant inthe areas of atmosphere, service, location, quality and quantity offood, and prices of the food
2. To evaluate the importance of satisfaction in the areas of atmosphere,service, location, quality and quantity of food, and prices of the food
3. To determine the factors involved in choosing Mexican restaurants inthe areas of atmosphere, service, location, quality and quantity offood, and prices of the food
4. To determine customer awareness and customers’ most likely re-sponse to future dining at the restaurant
5. To evaluate demographic and geographic profiles of the customersaccording to area and customer demographics (age, gender, maritalstatus, income level, education)
6. To develop strategic implications of the results
The team adopted a two-step sampling approach for these study areas.The first step involved sampling a group of restaurant employees. It was feltthat the information that was gathered in this step would assist the team inpreparing the questionnaire to be used in step two, which involved survey-ing a randomly selected group of restaurant customers using the question-naire shown in Figure C6.1.
The sample included randomly selected respondents on two differentweekdays between the hours of 5 and 7 p.m. A total of ninety-one useful re-sponses were received. The team first analyzed the data in general thencross-tabulated the results using SPSS to analyze specific questions relatedto specific demographic or individual characteristics. Frequencies, cross-tabulations, and percentages were used to provide for systematic analysis ofthe data and to determine respondent differences based on demographic andindividual difference characteristics. Based on the information collected,Tables C6.1 through C6.5 were developed.
Thank you for agreeing to participate in this survey. Our student marketing teamis working to help Juan Carlos improve his restaurant for you and others. Yourresponse to this survey will help in that effort. Your responses will be confidential.
1. How often do you eat lunch at Juan Carlos’ Mexican Restaurant?___ Once a month___ 2-4 times a month___ 5-8 times a month___ First time at Juan Carlos’
FIGURE C6.1. Questionnaire

2. How often do you eat dinner at Juan Carlos’ Mexican Restaurant?___ Once a month___ 2-4 times a month___ 5-8 times a month___ First time at Juan Carlos’
3. What other local Mexican restaurant have you eaten at in the last 6 months?(Mark all that apply)___ El Charro___ Pepe’s___ Chile Pepper___ Other, please specify ____________________________________
4. How did you first hear about Juan Carlos’?___ Friends___ Family___ Work___ Advertisements___ Other, please specify ____________________________________
5. Please rate Juan Carlos’ on each of the following items using a scale fromexcellent to poor.
Excellent Good Fair PoorFood Quality 1 2 3 4Food Quantity 1 2 3 4Food Taste 1 2 3 4Value for the Money 1 2 3 4Food Presentation 1 2 3 4Speed of Service 1 2 3 4Customer Satisfaction 1 2 3 4Store Appearance 1 2 3 4Store Atmosphere 1 2 3 4Location 1 2 3 4Parking 1 2 3 4Overall Rating 1 2 3 4
6. Considering all the characteristics in question 5, please rank the followingMexican Restaurants with 1 being the best, 2 being the second best,3 being the third best, and 4 being fourth best.___ Chile Pepper___ Juan Carlos’___ El Charro___ Pepe’s
7. Based on what you receive at Juan Carlos’, would you say their prices are:___ Lower than expected___ About as expected___ Higher than expected
FIGURE C6.1 (continued)

8. What items would you like to see added to the menu at Juan Carlos’?___________________________________________________________________________________________________________________________________________________________________________
9. What improvements could Juan Carlos’ make to increase your satisfactionas a customer?___________________________________________________________________________________________________________________________________________________________________________
Now just a few more questions about you:
10. Age:____ Under 20____ 21-30____ 31-40____ 41-50____ 51 and Over
11. Sex____Female____ Male
12. Marital Status____ Married____ Divorced____ Single
13. Education____ High School____ Some College____ College Degree____ Other
14. Income____ Under $10,000____ $10,000 to $24,999____ $25,000 to $34,999____ $35,000 to $49,999____ $50,000 to $69,9999____ $70,000 or more
15. What is your zip code? ___________________
16. Occupation____ Homemaker____ Student____ Laborer____ Skilled craftsman____ Business owner/manager____ Retired____ Other
Thank you for your time and cooperation.

TABLE C6.1. Local Mexican Restaurants Visited in the Last Six Months
Restaurant PercentageEl Charro, Chile Pepper, Pepe’s 16.9Pepe’s, Chile Picante 9.6El Charro, Pepe’s 9.6El Charro 21.7Chile Pepper 13.3Pepe’s 3.6El Charro, Chile Pepper 13.3None 8.4Other 3.6
TABLE C6.2. How Customers Rank Juan Carlos’ Mexican Restaurant
Rank PercentageThe Best 77Second Best 8Third Best 5Fourth Best 4
TABLE C6.3. Customers’ Suggestions for Juan Carlos’ Menu
Item PercentageSopapilla 2.7Dessert 2.7Chalupas 2.7Chimichanga 5.4Fajitas 56.8None 29.7
TABLE C6.4. Improvements Suggested for Juan Carlos’
Improvement PercentageParking 34.5Paint 17.2Atmosphere 13.8Kid’s Menu 10.3Location 6.9Mexican Music 17.2
TABLE C6.5. Satisfaction by Age
Age Excellent Good FairUnder 20 5 2 121-30 22 7 131-40 10 2 241-50 14 5 251 and Up 14 2 2

Questions
1. Is the methodology appropriate for the research objectives? What arethe disadvantages of the sampling plan and method of questionnaireadministration?
2. Review the questionnaire. What are its strong points? What areas orquestions do you believe need improvement? Does it seem to capturethe relevant information needed to meet research objectives?
SPSS Applications
1. Using the SPSS file located on the disk, develop a profile of respon-dents.
2. Are customers satisfied with the restaurant’s offerings?3. Are there significant differences among respondents on their satisfac-
tion with the restaurant based on age, sex, and income?

Case 7
Usedcars.comUsedcars.com
Henry ColeRobert E. StevensDavid L. Loudon
Bill Spencer is interested in determining the feasibility of starting a busi-ness that provides an Internet Web site designed for used car dealers in thisarea to display their cars on the Internet. Two keys to the success of the ideaare current Internet users’ interest in shopping for used cars on the Internetand the interest of used car dealers in the new advertising medium. Dealerswould provide information about their vehicles such as model, accessories,mileage, etc., and Usedcars.com would take a photograph of the car.
The photograph and the information on the vehicle would be displayedon the Usedcars.com Web site. A local marketing consultant was hired todevelop a survey to determine the following:
1. The most common uses of the Internet of residents who had access2. Average time spent online3. Their interest in shopping online4. The likelihood that the consumer would shop for a used vehicle on-line
This study would also determine the interest of used car dealers in advertis-ing their vehicles on the Internet. The dealer study would specifically deter-mine the following:
1. Interest level of the dealers in such a service2. Current advertising media of used car dealers3. Dealers’ satisfaction with their current Internet provider’s service if
they are already using such a service

The results of this survey would provide the basis for deciding whether ornot to launch the new business.
Study Objectives
The following objectives and methodology were developed by the con-sultant to guide the research effort:
I. Determine the consumer profile of Internet users in the studiedarea.A. Access to the InternetB. Time spent onlineC. Purchasing historyD. Common uses of the InternetE. Business or personal timeF. Likelihood of shopping for next used/new car onlineG. Other
II. Determine dealers’ interest in the Internet as an advertisingmedium.A. Willingness to participateB. Current advertising media of used car dealersC. Payment options
1. Monthly fee2. Annual fee
D. Dealership involvement in maintaining Web sites
III. Evaluate the importance of concerns involved in shopping for aused car.
IV. Analyze results of the consumer survey based on socioeconomiccharacteristics such as age, sex, income, education, and occupation.
Methodology
Two samples were used for the study. The first was a random sample ofmetropolitan area residents who were screened to include only Internet us-ers. The second was a random sample of used car dealerships from the area.The two samples included 100 Internet users and twenty dealerships.
The respondents were to be surveyed using a telephone survey designedto respond to the project’s specific study objectives. The questionnaires areshown in Figure C7.1.

FIGURE C7.1. Survey Questionnaires
Telephone Number Dealership
Person Interviewed Interviewer
Dealer Survey
Hi my name is. . . . Would you take a few moments and answer some questions?Any information you provide will be held in strict confidence and will be combinedwith the answers of others that participate in the survey.
1. Do you have access to the Internet in your business?___Yes1 ___No2 (If no, thank and terminate.)
2. Do you have computer training or a computer specialist on staff with yourcompany?
___Yes1 ___No2
3. What forms of advertising do you currently use for your dealership?(mark all that apply)
___ Newspaper ___ Car Magazine___ Internet ___ Radio___ TV ___ Other, please specify______________
(If Internet is selected go to question 5. If Internet was not selected go toquestion 4.)
4. How interested would you be in a service that would allow you to adver-tise, on the Internet, your cars based on price, model, year, and make?The service would be sustained by a full-scale Internet savvy team thatwould create the Web site for you or allow you to maintain your own Website. The service would entail a full color picture of cars chosen by thedealer with a detailed description and appraisal value of the car. Rate yourinterest: (then skip to question 11)
1 2 3 4 5No Little Somewhat Very Extremely
Interest Interest Interested Interested Interested
5. How satisfied are you with your current Internet advertising service pro-vider? Rate your interest on a scale of 1 to 5 with 1 being very dissatisfiedand 5 being very satisfied.
1 2 3 4 5
6. How are you billed for this service?___ A flat rate1
___ An average per car2
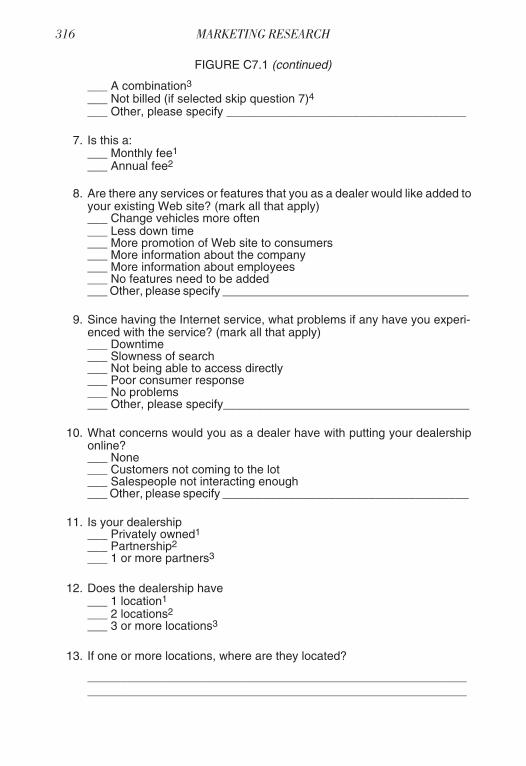
___ A combination3
___ Not billed (if selected skip question 7)4___ Other, please specify ____________________________________
7. Is this a:___ Monthly fee1
___ Annual fee2
8. Are there any services or features that you as a dealer would like added toyour existing Web site? (mark all that apply)___ Change vehicles more often___ Less down time___ More promotion of Web site to consumers___ More information about the company___ More information about employees___ No features need to be added___ Other, please specify _____________________________________
9. Since having the Internet service, what problems if any have you experi-enced with the service? (mark all that apply)___ Downtime___ Slowness of search___ Not being able to access directly___ Poor consumer response___ No problems___ Other, please specify_____________________________________
10. What concerns would you as a dealer have with putting your dealershiponline?___ None___ Customers not coming to the lot___ Salespeople not interacting enough___ Other, please specify _____________________________________
11. Is your dealership___ Privately owned1
___ Partnership2
___ 1 or more partners3
12. Does the dealership have___ 1 location1
___ 2 locations2
___ 3 or more locations3
13. If one or more locations, where are they located?
__________________________________________________________________________________________________________________
FIGURE C7.1 (continued)

14. Monthly sales volume of vehicles___ Under 101
___ 10 to 202
___ 21 to 303
___ 31 to 404
___ 41 to 505
___ 51 to 606
___ 61 to 707
___ 71 to 808
___ More than 809
Thank you very much for your time and cooperation.
Consumer Survey
Telephone NumberPerson InterviewedInterviewer
Hi, my name is . . . Would you take a few moments and answer some questions?Any information you provide will be held in strict confidence and will be combinedwith the answers of others that participate in the survey.
1. Do you have access to the Internet?___Yes1 ___ No2 (If no, thank and terminate.)
2. If yes, do you have access at:___ Home1 ___ Work2 ___ Both3
3. About how much time do you spend on the Internet each day?___ Less than 1 hour1___ 1-2 hours2
___ 2-3 hours3
___ 3-4 hours4
___ 4-5 hours5
___ 5 or more6
4. What are your most common uses of the Internet? (mark all that apply)___ News___ Weather___ Sports___ Information on products___ Information on people___ Chat___ Adult entertainment___ Research___ Other, please specify ____________________________________

5. Have you purchased anything over the Internet?___ Yes1 ___ No2 (If no, skip to question 7)
6. If yes, what products or services have you purchased? (mark all that ap-ply)___ Books___ Airline tickets___ Movie tickets___ Clothes___ Automobiles___ Applied for credit card___ Others, please specify ____________________________________
7. Assume that you were interested in buying a used car. How interestedwould you be in a service that would allow you to search on the Internet fora car, based on price, model, year, and make? The service would allowyou to view a full color picture of the car, detailed description, with the ap-praised value of the car. You would also be able to make an offer using e-mail. The dealer would pay for this service.
Please rate your interest in such a service on a scale of 1 to 5 with 1 beingnot interested at all and 5 being extremely interested.
1 2 3 4 5
8. (If a 4 or a 5 were selected ask) How would you use such a service to helpyou in shopping for a new car? (mark all that apply)___ Get information on specific cars___ Get information on what dealers have the cars___ Get information on both___ Get information prior to going to a dealership___ Purchase using the service___ Other, please specify _____________________________________
9. What would be your major concerns about the process of buying a carover the Internet? (mark all that apply)___ Not seeing the car in person___ No driving test___ Not being able to get trader’s information___ Not getting a good deal___ Inaccurate information on the Internet___ Other, please specify_____________________________________
10. Now assume that you want to sell a used car, how interested would you bein an Internet service that would allow you to sell your used car by featur-ing your own web page? The service would include a full color picture of
FIGURE C7.1 (continued)
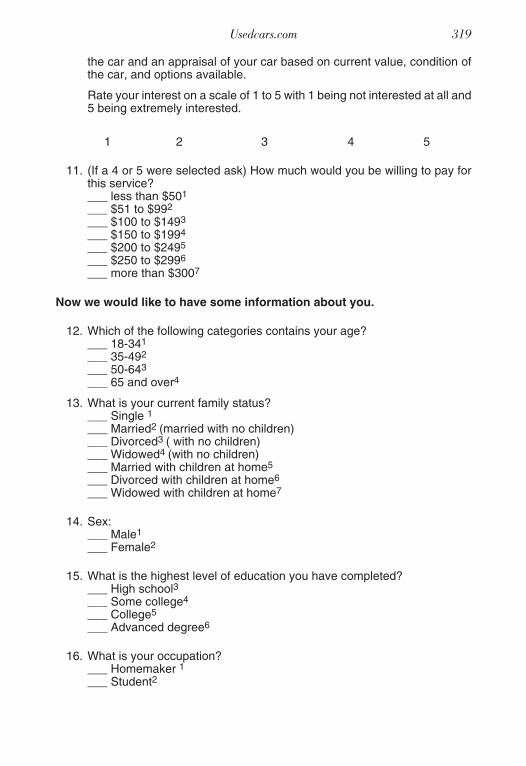
the car and an appraisal of your car based on current value, condition ofthe car, and options available.
Rate your interest on a scale of 1 to 5 with 1 being not interested at all and5 being extremely interested.
1 2 3 4 5
11. (If a 4 or 5 were selected ask) How much would you be willing to pay forthis service?___ less than $501
___ $51 to $992
___ $100 to $1493
___ $150 to $1994
___ $200 to $2495
___ $250 to $2996
___ more than $3007
Now we would like to have some information about you.
12. Which of the following categories contains your age?___ 18-341
___ 35-492
___ 50-643
___ 65 and over4
13. What is your current family status?___ Single 1
___ Married2 (married with no children)___ Divorced3 ( with no children)___ Widowed4 (with no children)___ Married with children at home5
___ Divorced with children at home6
___ Widowed with children at home7
14. Sex:___ Male1
___ Female2
15. What is the highest level of education you have completed?___ High school3___ Some college4
___ College5
___ Advanced degree6
16. What is your occupation?___ Homemaker 1
___ Student2

___ Laborer3___ Skilled4
___ Professional5___ Retired 6
17. Which of the following categories contains your family’s annual income?___ Less than $10,0001
___ $10,001-$30,000 2
___ $30,001-$50,0003
___ $50,001-$70,0004
___ $70,001-$90,0005
___ $90,001-$100,0006
___ Over $100,0002
Thank you very much for your time and cooperation.
Discussion Questions
1. Based on the information in the case, do the study objectives andmethodology address management’s information needs? Discuss.
2. Does the methodology fully describe how the research will be con-ducted? What needs to be added, if anything?
3. Provide a thorough evaluation of the questionnaires used in the re-search in terms of the research objectives, potential respondents, anddata analysis needs.
SPSS Applications
1. Use the SPSS data file to analyze the data and answer the followingquestions:a. Does the data support consumer interest in using the Internet for
used car shopping?b. Does the data support dealer interest in this advertising medium?
2. What conclusions would you draw on the basis of your analysis?3. Are there significant differences in male and female respondents’ in-
terest in using the Internet to shop for a car?
FIGURE C7.1 (continued)

Case 8
Welcome Home ChurchWelcome Home ChurchBruce C. WalkerRobert E. StevensDavid L. Loudon
Reverend Larry Love is pastor of the Welcome Home Church (WHC) lo-cated in a middle-class section of a city with a population of 50,000 people.Reverend Love was called as pastor of the church approximately four yearsago. He had high hopes of increasing overall membership in the congrega-tion, as well as expanding the church’s outreach ministry. Unfortunately,highly successful ideas and programs that he had implemented in his previ-ous churches had not achieved similar success levels, nor had the size of thecongregation shown any measurable increases during his four-year tenureat the church. Reverend Love felt at this time that he would need to take adifferent approach in order to achieve his vision for the church.
Reverend Love contacted Ms. Jennifer Odom of Outsource Solutions,Inc., an independent marketing research company located in the area. WhenLove and Odom met, she asked Reverend Love a series of questions. First,she asked him to describe the church’s mission, member profile, and sum-marize the types of programs that the church had implemented in the past.WHC’s mission was to reach as many people as possible in order to providea church home in which members could grow in their faith, knowledge, andlove of Christ. The types of programs that the church presently had in placecould be described as the standard types of programs that many churchesemploy. Specifically, WHC has two services on Sunday (one at 9:30 a.m.and one at 6:00 p.m.), and one service on Wednesday evening (6:30 p.m.).In addition, the church offers a Christian Education program for childrenand adults on Sunday morning, a Tuesday morning Bible study, and specialpreparatory classes as needed. The church has a very active women’s orga-nization, a small, but dynamic youth program, and a good volunteer pro-gram to visit the sick and the elderly.

The typical adult-member profile suggests that members tend to be eitherin their twenties or ages forty-five and up (approximately 5 percent of adultmembers are retired). Many of the adult members could be described as“working class,” and generally have high school degrees with some educa-tion following high school (either vocational-technical training or a coupleof years of college). Reverend Love indicated that the congregational popu-lation is somewhat racially diverse, a strength that the church had enjoyedfor years.
Ms. Odom asked Reverend Love about unsuccessful programs that hehad initiated during his four years, which had been successful in otherchurches. He disclosed that he had tried to initiate a men’s program thatwould allow male members to come together once a month and completehome improvement projects for less fortunate community and church mem-bers. This effort was met with only “lukewarm” enthusiasm, and was short-lived. Also, he had attempted to implement a “prayer buddy” program inwhich congregational members partnered with another church member tomake contact each day (most often by phone) and spend approximately fiveminutes in prayer with each other. Few adult members expressed any inter-est in this program. Finally, Reverend Love attempted to engage the churchmembers in a project to study the likelihood of building a youth hall, but thisendeavor never got past the preliminary discussion stage.
Odom then asked Love if the church had ever engaged in any type ofmember satisfaction survey or any type of community market researchstudy to determine if needs people had were being met by their presentchurch. Also, if a community member was not associated with a church,what might be the reasons for nonaffiliation? Love stated that he and hisstaff had conducted a small study of church members and that the responsesof members indicated that they generally were happy with the present pro-grams and that these programs tended to meet their personal needs. WhileReverend Love was happy with the overall response level of members, thefact remained that the congregation level had remained somewhat constant,showing no upward or downward trends of membership in any of the majorareas (youth, young families, singles, older members, etc.).
Odom made the observation that if Reverend Love wanted to see growthin his congregation, understanding the different factors and issues of bothpresent members and nonmembers would be very useful to determine futurechurch programs, initiatives, and direction. In addition, she suggested toLove that churches (and businesses) can fall into the trap of trying to be allthings to all people. Having a database of information would allow thechurch to decide how to focus its programs to attract a desired group of newmembers (e.g., members between the ages of thirty and forty-five, memberswith children ages ten to twenty, etc.). Odom shared an example of a churchin the Houston area which, after completing a market research project, be-

gan to target individuals, many of whom were homosexual, living in thearea who were dying from AIDS. The church used the research to develop atarget market, then made changes to its overall mission statement. A nega-tive outcome of this, however, was that some of the established membersleft the congregation. Reverend Love agreed that the church might have toprioritize the type of members it wished to attract and that a database of in-formation would be the most logical approach in addressing the growth is-sue. Reverend Love decided the market research idea was worth pursuingand that he and Odom would meet in a couple of weeks to begin the formalprocess.
Discussion Questions
1. What are the marketing-management problems facing WHC?2. What marketing research objectives would you propose?3. Based on the information presented in the case, what types of infor-
mation should Odom attempt to find?
SPSS Applications
Use the SPSS file to analyze the data and answer the following questions:
1. What is the demographic profile of respondents surveyed?2. What were respondents’ preferences for style of dress for church ser-
vices, style of services, and time preferences?3. What did respondents rate as the most important things in their lives?4. What percent of the respondents were aware of WHC? What percent
had attended a service? Of those who had attended, what percentranked the service as good?


Case 9
The Learning SourceThe Learning SourceHenry Cole
Robert E. StevensDavid L. Loudon
The Learning Source is a nine-month school for students in grades fivethrough eight who are not successful in a traditional classroom setting.Many of the students suffer from attention deficit disorder (ADD), attentiondeficit hyperactivity disorder (ADHD), or dyslexia. With a five-to-one stu-dent teacher ratio, children who are exceptional or learning-challenged havethe ability to excel in a nontraditional setting.
The Learning Source provides other educational services, such as educa-tional evaluations, homework labs, tutorials, study skills workshop, careermapping, computer training, test preparations, and summer programs. Inaddition, in-service training for teachers and workshops are also provided.In conjunction with area school systems and local businesses, The LearningSource provides speakers to aid parents throughout the community in edu-cating children.
The Learning Source is in the process of moving to a new location. Thenew facility is 7,500 square feet, almost tripling the size of the present facil-ity. In its new location, The Learning Source hopes to expand from twenty-one students to a full capacity of fifty. Also, The Learning Source wants toexpand its tutoring services, ACT preparation classes, and homework labs.
To aid in the development of the marketing plan, a marketing researchproject was contracted through a local research firm. The firm’s proposalincluded the objectives, methodology, and a questionnaire (Figure C9.1).
Detailed Study Objectives
The research objectives are:
1. Determine any problems that respondents’ children have experiencedin school
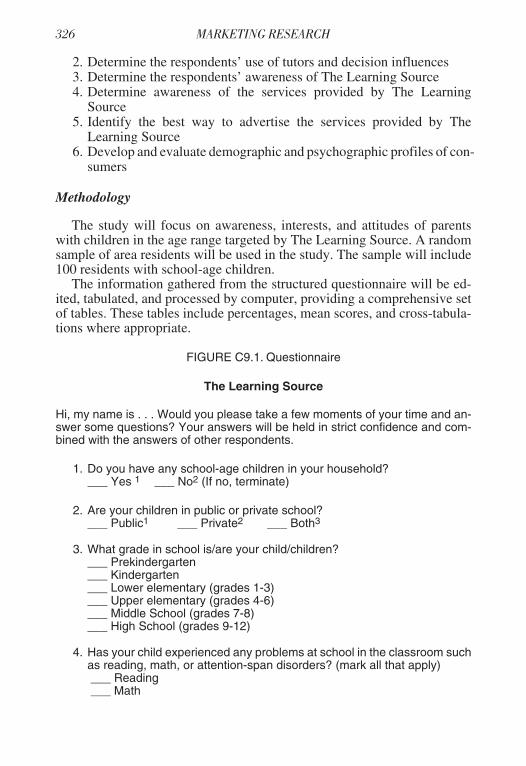
2. Determine the respondents’ use of tutors and decision influences3. Determine the respondents’ awareness of The Learning Source4. Determine awareness of the services provided by The Learning
Source5. Identify the best way to advertise the services provided by The
Learning Source6. Develop and evaluate demographic and psychographic profiles of con-
sumers
Methodology
The study will focus on awareness, interests, and attitudes of parentswith children in the age range targeted by The Learning Source. A randomsample of area residents will be used in the study. The sample will include100 residents with school-age children.
The information gathered from the structured questionnaire will be ed-ited, tabulated, and processed by computer, providing a comprehensive setof tables. These tables include percentages, mean scores, and cross-tabula-tions where appropriate.
FIGURE C9.1. Questionnaire
The Learning Source
Hi, my name is . . . Would you please take a few moments of your time and an-swer some questions? Your answers will be held in strict confidence and com-bined with the answers of other respondents.
1. Do you have any school-age children in your household?___ Yes 1 ___ No2 (If no, terminate)
2. Are your children in public or private school?___ Public1 ___ Private2 ___ Both3
3. What grade in school is/are your child/children?___ Prekindergarten___ Kindergarten___ Lower elementary (grades 1-3)___ Upper elementary (grades 4-6)___ Middle School (grades 7-8)___ High School (grades 9-12)
4. Has your child experienced any problems at school in the classroom suchas reading, math, or attention-span disorders? (mark all that apply)___ Reading___ Math
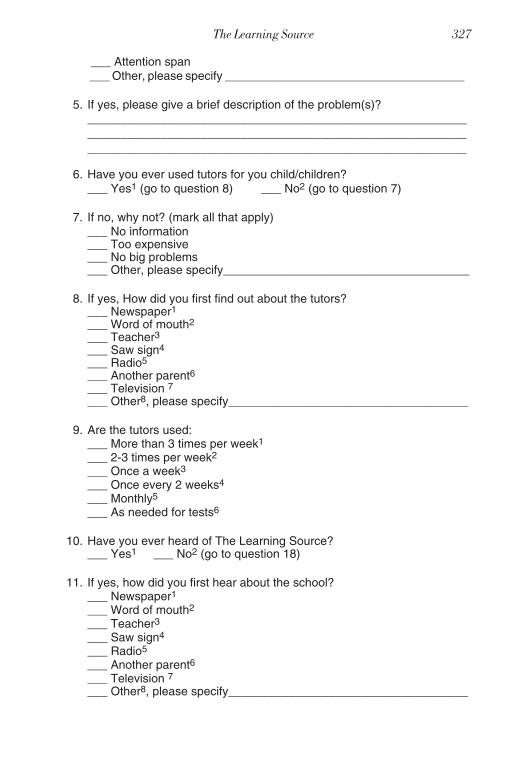
___ Attention span___ Other, please specify ____________________________________
5. If yes, please give a brief description of the problem(s)?___________________________________________________________________________________________________________________________________________________________________________
6. Have you ever used tutors for you child/children?___ Yes1 (go to question 8) ___ No2 (go to question 7)
7. If no, why not? (mark all that apply)___ No information___ Too expensive___ No big problems___ Other, please specify_____________________________________
8. If yes, How did you first find out about the tutors?___ Newspaper1___ Word of mouth2
___ Teacher3___ Saw sign4
___ Radio5
___ Another parent6___ Television 7
___ Other8, please specify____________________________________
9. Are the tutors used:___ More than 3 times per week1
___ 2-3 times per week2
___ Once a week3
___ Once every 2 weeks4
___ Monthly5
___ As needed for tests6
10. Have you ever heard of The Learning Source?___ Yes1 ___ No2 (go to question 18)
11. If yes, how did you first hear about the school?___ Newspaper1___ Word of mouth2
___ Teacher3___ Saw sign4
___ Radio5
___ Another parent6___ Television 7
___ Other8, please specify____________________________________
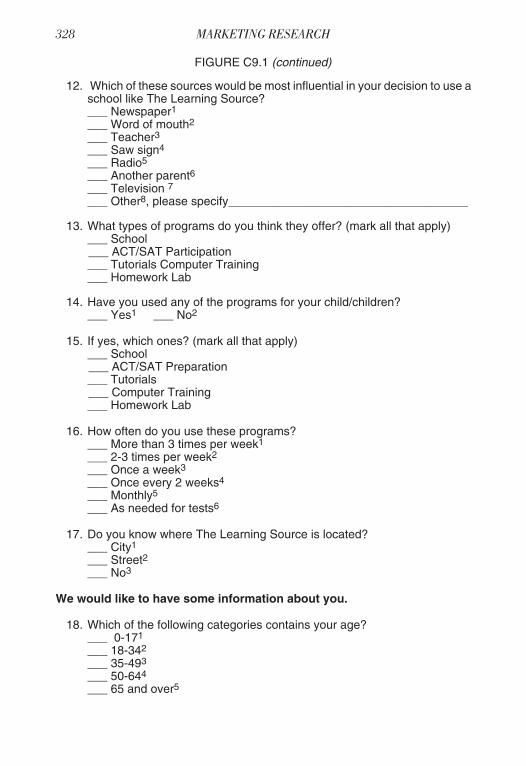
12. Which of these sources would be most influential in your decision to use aschool like The Learning Source?___ Newspaper1___ Word of mouth2
___ Teacher3___ Saw sign4
___ Radio5
___ Another parent6___ Television 7
___ Other8, please specify____________________________________
13. What types of programs do you think they offer? (mark all that apply)___ School___ ACT/SAT Participation___ Tutorials Computer Training___ Homework Lab
14. Have you used any of the programs for your child/children?___ Yes1 ___ No2
15. If yes, which ones? (mark all that apply)___ School___ ACT/SAT Preparation___ Tutorials___ Computer Training___ Homework Lab
16. How often do you use these programs?___ More than 3 times per week1
___ 2-3 times per week2
___ Once a week3
___ Once every 2 weeks4
___ Monthly5
___ As needed for tests6
17. Do you know where The Learning Source is located?___ City1
___ Street2___ No3
We would like to have some information about you.
18. Which of the following categories contains your age?___ 0-171
___ 18-342
___ 35-493
___ 50-644
___ 65 and over5
FIGURE C9.1 (continued)
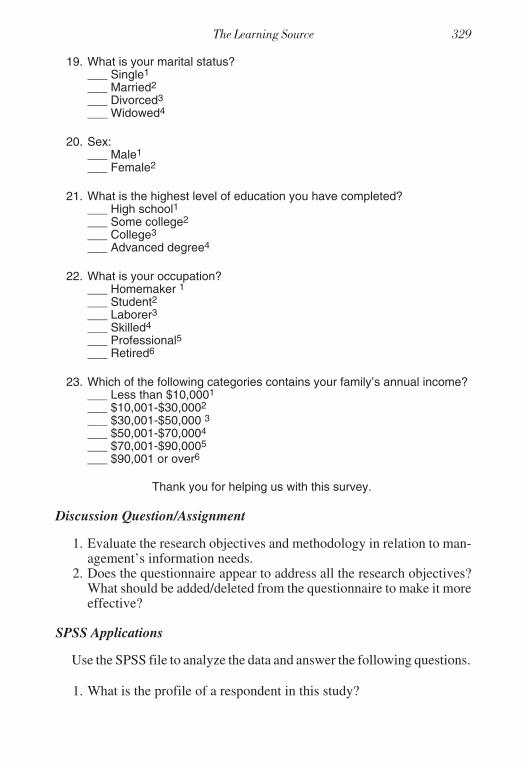
19. What is your marital status?___ Single1
___ Married2
___ Divorced3
___ Widowed4
20. Sex:___ Male1
___ Female2
21. What is the highest level of education you have completed?___ High school1___ Some college2
___ College3
___ Advanced degree4
22. What is your occupation?___ Homemaker 1
___ Student2___ Laborer3___ Skilled4
___ Professional5___ Retired6
23. Which of the following categories contains your family’s annual income?___ Less than $10,0001
___ $10,001-$30,0002
___ $30,001-$50,000 3
___ $50,001-$70,0004
___ $70,001-$90,0005
___ $90,001 or over6
Thank you for helping us with this survey.
Discussion Question/Assignment
1. Evaluate the research objectives and methodology in relation to man-agement’s information needs.
2. Does the questionnaire appear to address all the research objectives?What should be added/deleted from the questionnaire to make it moreeffective?
SPSS Applications
Use the SPSS file to analyze the data and answer the following questions.
1. What is the profile of a respondent in this study?

2. What proportion of respondents use tutors? How did they find thesetutors?
3. What is the level of awareness of The Learning Source? Programs?Location?
4. Based on your analysis, what major issues should be addressed in themarketing plan?

Case 10
Madison County Country ClubMadison County Country ClubBruce C. WalkerRobert E. StevensDavid L. Loudon
Clint Streep, the General Manager of the Madison County Country Club(MCCC), placed his golf ball on the number one tee. He and Board Chair-man Merrill Westwood were getting in a much-needed and well-deservedround of golf the day after a heated and brutal MCCC board meeting. Theoperating results for the MCCC had been disappointing for the secondstraight year, and there were a number of board members who blamedStreep for the results and were pushing for his termination. Fortunately,Westwood believed in Streep and was able to table, at least temporarily, themotion for Streep’s dismissal. This round of golf provided the two gentle-men the opportunity to revisit the situation and, more important, exploreideas to turn the negative results around.
Madison County is located in the northeast corner of a state known pri-marily for its rural economy and lifestyle. There is no large city within sev-enty-five miles of Barrington, the community where the MCCC is located.For years, the board felt that MCCC had some type of “monopoly” on thecounty’s golfing and social situations. After all, everyone who was anybodyin Madison County had been a member of the club for several generations.The fact that membership was declining was upsetting egos as well as bankaccounts.
The fact that operating results were down was not surprising. Member-ship in the MCCC had been declining for several years. Streep had beenpushing the board to give him the authority to seek outside assistance tohelp define the issues and secure data to help drive future operating deci-sions. The board had denied the request in previous years, but grudginglygranted Streep limited authority to seek outside help. The stipulation by theboard was that any decision to proceed with outside research had to be ap-

proved by Westwood and two other board members assigned to a specialcommittee to oversee Streep’s activities. The day’s golf match allowedStreep and Westwood to brainstorm as friends and colleagues with a vestedinterest in the success of the club.
During the course of the round, Westwood suggested that Streep contactProgressive Marketing, Inc. (PMI), and have representatives from the firmcome and visit with Streep and members of the board’s special committee.Westwood spoke highly of the firm, having used their services in his insur-ance company a few years back. Westwood mentioned that one of PMI’spartners, Steve Henry, had been especially resourceful in helping West-brook’s company identify its strengths and weaknesses, as well as marketand industry opportunities and threats. Once these factors were identified(referred to as SWOTs), PMI was able to help the company develop an ag-gressive marketing strategy that resulted in major gains for the firm.
During the following week, Steve Henry and an assistant, RebeccaChance, met with Streep and the three board committee members. Theyprovided PMI with a short history of the club, as well as the confidential op-erating results from the previous five years of operation. In addition, PMIwas provided with the club’s fee structure as well as a list of the club’smember services and activities. PMI asked a number of questions related tomember demographics (i.e., families, income levels, gender, educationallevels, occupations, proximity to the club, age, etc.). Streep and the commit-tee members were able to answer some of the inquiries; however, they ad-mitted that the majority of this information was based on a “gut feel” as op-posed to statistical data. The club also confessed that it had been years sinceany type of membership satisfaction survey had been conducted. Commit-tee members felt that the services provided generally were quite frequentlyutilized, and they also felt that member pricing provided country club mem-bers with a good entertainment value. The club was unable to provide muchin the way of specific data to back up their assumptions. MPI stated that atop priority would be to collect membership data that would provide MCCCwith information that would allow them to make sound operating decisions.
Two weeks later, Henry and Chance returned to meet with Streep and theboard’s committee. They provided a four-page survey questionnaire (seeFigure C10.1) that MPI claimed would capture the information needed toaccurately assess member satisfaction, as well as member demographic in-formation that would allow for more targeted program analysis. After dis-cussing the questionnaire, minor modifications to the instrument weremade, an appropriate fee structure was agreed upon, and completion timeta-bles were established. At this point, the board committee authorized PMI toproceed with the membership survey.

PMI mailed a questionnaire and cover letter to all current MCCC mem-bers (373 total). One hundred sixty (160) questionnaires were returned, pro-viding a 43 percent response rate.
FIGURE C10.1. Membership Response Survey Questionnaire
1. How long have you been a member of Madison County Country Club?____ 1-3 years____ 4-7 years____ 7-12 years____ 12-16 years____ 16-20 years____ Over 20 years
2. What was the major reason you joined Madison County Country Club?(Mark all that apply)____ Membership compatibility____ Location____ Service of club staff____ Highly recommended by friends____ Line of benefits offered____ Reputation of club____ Other (specify) __________________________________________________________________________________________________
3. What do you consider the most attractive features of the Club?(Mark all that apply)____ Golf course____ Pro shop____ Eating facilities____ Swimming facilities____ Tennis facilities____ Club-sponsored events____ Community events at the club____ Other (specify) __________________________________________________________________________________________________
4. What do you consider the least attractive features?(Mark all that apply)____ Golf course____ Pro shop____ Eating facilities____ Swimming facilities____ Tennis facilities____ Club-sponsored events____ Community events at the club____ Other (specify) _________________________________________

5. How important was the initiation fee in deciding your membership?____ Very important____ Somewhat important____ Not important____ No effect
6. How important were the monthly dues in deciding your membership?____ Very important____ Somewhat important____ Not important____ No effect
7. On a scale of 1 to 8 (1 being most important and 8 being of least impor-tance), what improvements do you feel need to be made to the Club in thefuture?____ Golf course quality____ Driving range quality____ Tennis facilities____ Swimming facilities____ Clubhouse quality____ Social events____ Tournaments____ Better management____ Others (specify)_________________________________________________________________________________________________
8. Rank in order from 1 to 6 (1 being most frequent and 6 being least fre-quent), how often you use the club services.____ Golf course____ Driving range____ Tennis facilities____ Swimming facilities____ Club events____ Bar/grill
9. How often do you use the club’s facilities on a monthly basis?____ Only once____ 2-4 times____ 5-7 times____ 8-10 times____ Over 10 times____ Never
10. Are you currently satisfied with current club practices?____ Very satisfied____ Somewhat satisfied____ Not satisfied
FIGURE C10.1 (continued)
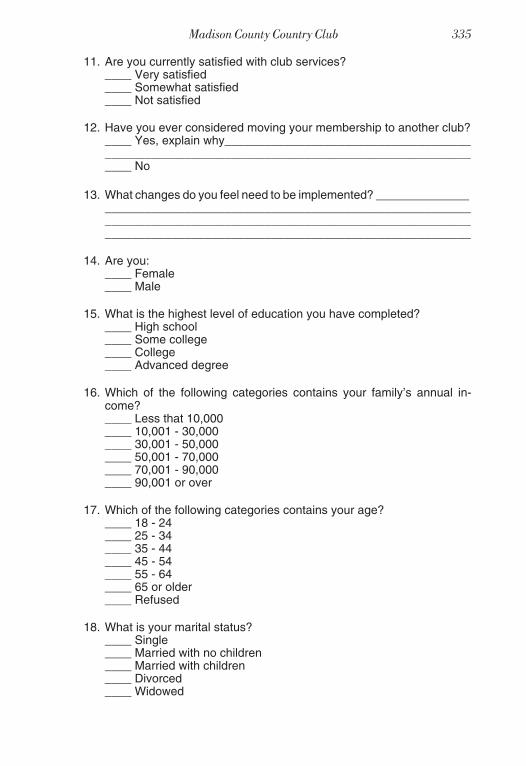
11. Are you currently satisfied with club services?____ Very satisfied____ Somewhat satisfied____ Not satisfied
12. Have you ever considered moving your membership to another club?____ Yes, explain why________________________________________________________________________________________________ No
13. What changes do you feel need to be implemented? ___________________________________________________________________________________________________________________________________________________________________________________
14. Are you:____ Female____ Male
15. What is the highest level of education you have completed?____ High school____ Some college____ College____ Advanced degree
16. Which of the following categories contains your family’s annual in-come?____ Less that 10,000____ 10,001 - 30,000____ 30,001 - 50,000____ 50,001 - 70,000____ 70,001 - 90,000____ 90,001 or over
17. Which of the following categories contains your age?____ 18 - 24____ 25 - 34____ 35 - 44____ 45 - 54____ 55 - 64____ 65 or older____ Refused
18. What is your marital status?____ Single____ Married with no children____ Married with children____ Divorced____ Widowed

19. What is your occupation?____ Homemaker____ Student____ Laborer____ Skilled worker (computer operator, truck driver, etc.)____ Professional (doctor, lawyer, etc.)____ Retired
Thank you for your time and cooperation.
Discussion Questions
1. What general information do you feel would be needed for MCCC tomake sound future operating decisions?
2. Does it appear that PMI’s survey would capture this information?What changes or additions would you make?
3. Evaluate the methodology used in the study. What other methodolo-gies are feasible? What about the response rate to the survey? What is-sues does this raise?
SPSS Application
1. What is the demographic profile of the typical respondent?2. What club features appear to be the most desirable? Least desirable?
What improvement recommendations should MCCC consider?3. What conclusions might be reached concerning member use and satis-
faction levels in view of the current pricing structure?4. Are there significant differences between “younger” and “older”
members in terms of needed improvements?
FIGURE C10.1 (continued)
Case 11
Plasco, Inc.Plasco, Inc.Henry Cole
Robert E. StevensDavid L. Loudon
Plasco, Inc., is a relatively new player in the plastic extrusion industry.Plastic extrusion companies use granular compounds to make plastic materi-als for fabrications such as plastic tubing and sheeting. The key to the produc-tion of extrusion products is expensive extrusion machinery used to convertthe compounds into material, which can be used in subsequent productionprocesses. Efficient production requires long production runs, necessitatingthe need for a customer base of conversion companies (sometimes calledfabricators) large enough to support long production runs.
Plasco, Inc., is preparing to aggressively expand over the next two yearsbut needs additional financing for the expansion. They have approachedseveral potential sources for funds, but all the financial sources want someevidence of Plasco’s potential to attract new customers. Plasco engaged alocal marketing firm to provide this necessary information on market poten-tial. The following are excerpts from the marketing report and the question-naire.
Study Objectives
The market research objectives were as follows:
I. Identify competitive suppliers of plastic extrusion products.A. Number of suppliersB. From which supplier do they make most of their purchases
II. Analyze strengths and weaknesses of these suppliers.A. Rate overall satisfaction

B. Determine if any specific problems have been experienced1. Quality of the goods2. Quality of service3. Cost4. On-time delivery5. Availability of goods
III. Determine what opportunities exist in the current plastic extrusionmarket for a new competitor.
IV. Determine the likelihood of existing plastic conversion companiespurchasing from a new plastic extrusion company.
V. Determine what quantities and products the plastic conversion com-panies are interested in purchasing.
VI. Evaluate the importance of factors that have an influence over pur-chases.A. Service qualityB. CostC. Transportation availabilityD. Location of the supplierE. Number of products availableF. Number of specialty products availableG. Size of the supplier
VII. Develop strategy implications of the results.
Methodology
A sample was prepared from two databases. The first sample came froma list of eight prospective companies provided by Plasco. The second sam-ple came from an electronic database categorized by NAICS (North Ameri-can Industry Classification System) codes. Only those NAICS codes per-taining to plastic companies were selected. A total of 100 companies wereinterviewed.
The prospective customers were surveyed using a telephone question-naire (see Figure C11.1). The questionnaire was administered using atrained interviewing staff.
Plasco personnel had final approval of the questionnaire. The informa-tion gathered from the structured telephone survey was edited, tabulated,and processed by computer to produce a comprehensive set of tables. Thisinformation provided percentages, mean scores, and cross-tabulations tounderstand relationships between variables.

FIGURE C11.1. Survey Questionnaire
Telephone numberPerson interviewedInterviewer
Plasco, Inc.
Am I speaking with the person responsible for purchasing? (If no, ask to speak tothat person). Hello, my name is ________. Would you please take a moment toanswer a few questions? Any information you provide will be held in strict confi-dence and will be combined with the answers of other participants in the survey.
1. Is your company primarily a:_____ Plastics conversion company 1
_____ Plastics extrusion company2
_____ Combination3
_____ Other4, please specify __________________________________
2. How many plastic extrusion suppliers are you currently using?_____ One1 ____ Five5
_____ Two2 ____ Six6
_____ Three3 ____ Seven or more7
_____ Four4 ____ None8 (skip to #11)
3. From which plastic extrusion suppliers do you make most of your purchases?__________________________________________________________________________________________________________________
4. How would you rate your overall satisfaction with your current suppliers?_____ Very dissatisfied1
_____ Somewhat dissatisfied2
_____ Neither dissatisfied nor satisfied3
_____ Somewhat satisfied4
_____ Very satisfied5
5. Have you experienced any problems with your plastic extrusion suppliers?____ Yes1
____ No2 (skip to question 7)
6. If yes, what specific types of problems have you experienced? (mark allthat apply)_____ Cost_____ Size of the company_____ Quality of the goods_____ Quality of the service_____ Availability of goods_____ On time delivery_____ None_____ Other, please specify___________________________________

7. How likely would you be to purchase from another plastic extrusion sup-plier offering better quality and service?_____ Very likely1
_____ Likely2
_____ Somewhat likely3
_____ Not likely4 (go to question 10)
8. Are there any plastic products that you are interested in purchasing thatare not currently being supplied?_____ Yes1 (ask what products) _____________________________________ No2 (skip to question 10)
9. What quantities would you purchase annually?______________________________________________________________________________________________________________________________________
10. Please rate the importance of the following factors that may have influ-ence over your choice of plastic extrusion suppliers using a scale from 1 to5, with 1 being the least important and 5 the most important.
(a) Cost 1 2 3 4 5(b) Size of the supplier 1 2 3 4 5(c) Location of the supplier 1 2 3 4 5(d) Transportation availability 1 2 3 4 5(e) Service quality 1 2 3 4 5(f) Number of products available 1 2 3 4 5(g) Specialty products available 1 2 3 4 5
11. Is your company:_____ Privately owned1
_____ Publicly owned2
12. What is your company’s zip code? __________
13. How many plants does your company operate? ________
14. Which of the following categories most closely represents your company’sannual sales volume?_____ Under $100,0001
_____ $100,000 to $500,0002
_____ $500,001 to $ 1,000,0003
_____ $1,000,001 to $5,000,0004
_____ $5,000,001 to $10,000,0005
_____ $10,000,001 to $50,000,0006
_____ $50,000,001 to $100,000,0007
_____ $100,000,001 and over8_____ Refused/don’t know9
Thank you for your time and cooperation.
FIGURE C11.1 (continued)

Discussion Questions
1. Assuming a diverse market for extrusion products, does the samplingplan reflect the information needs of Plasco, Inc.?
2. How will errors in the sampling plan affect results?
SPSS Applications
Use the SPSS file to answer the following questions.
1. Do most respondents use more than one supplier?2. Are most respondents satisfied with their current suppliers? What
types of problems have they experienced?3. Are these respondents likely to purchase from a new supplier?4. Which factors are most important/least important in selecting a sup-
plier?5. What is the profile of respondents in this study?6. Are there significant differences between smaller and larger compa-
nies’ ratings of the importance of factors involved in selecting a sup-plier?


Case 12
St. John’s SchoolSt. John’s SchoolRobert E. StevensDavid L. Loudon
St. John’s Catholic Church wants to determine the market potential andviability of moving its private school when the church is relocated. Thechurch has outgrown its current facility and has purchased land about tenmiles away. There is enough land and money to build a new school, but thenew school would need strong drawing power to increase enrollment byabout 20 percent. This may mean attracting non-Catholic families as part ofthe new student base. A major input into the decision is the results of a sur-vey of area residents. A survey was used to examine (1) the attitudes of thechurch members toward relocation, (2) the feasibility of beginning an earlychildhood program for age two, and (3) awareness of a center-based ap-proach to early childhood development. Consumers were also surveyed todetermine (1) whether teacher certification and class size are influential inchoosing a school for grades K through six, and (2) the price sensitivity tothe level of tuition.
Personnel from the Small Business Development Center at a local uni-versity helped develop the research objectives, methodology, and the ques-tionnaire used in the study.
Research Objectives
The marketing research objectives were as follows:
I. Determine the factors involved in the choice of a private school.A. Early childhood programB. LocationC. Tuition and feesD. Class size
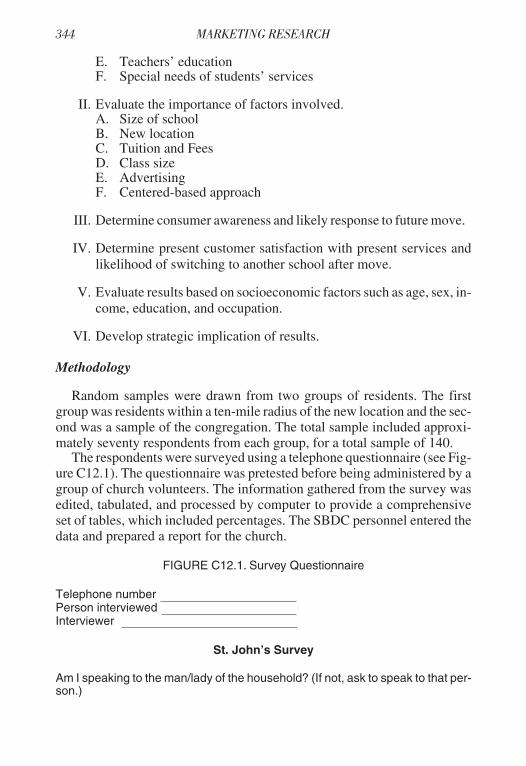
E. Teachers’ educationF. Special needs of students’ services
II. Evaluate the importance of factors involved.A. Size of schoolB. New locationC. Tuition and FeesD. Class sizeE. AdvertisingF. Centered-based approach
III. Determine consumer awareness and likely response to future move.
IV. Determine present customer satisfaction with present services andlikelihood of switching to another school after move.
V. Evaluate results based on socioeconomic factors such as age, sex, in-come, education, and occupation.
VI. Develop strategic implication of results.
Methodology
Random samples were drawn from two groups of residents. The firstgroup was residents within a ten-mile radius of the new location and the sec-ond was a sample of the congregation. The total sample included approxi-mately seventy respondents from each group, for a total sample of 140.
The respondents were surveyed using a telephone questionnaire (see Fig-ure C12.1). The questionnaire was pretested before being administered by agroup of church volunteers. The information gathered from the survey wasedited, tabulated, and processed by computer to provide a comprehensiveset of tables, which included percentages. The SBDC personnel entered thedata and prepared a report for the church.
FIGURE C12.1. Survey Questionnaire
Telephone numberPerson interviewedInterviewer
St. John’s Survey
Am I speaking to the man/lady of the household? (If not, ask to speak to that per-son.)

Hi! My name is . . . Would you take a few moments and answer some questions?Your answers will be held in strict confidence and combined with the answers ofother respondents.
1. Are you or anyone else living in your home presently employed by a publicor a private school?____ Yes1
____ No2 (if yes, thank and terminate)
2. Do you have any school-age children living at home?____ Yes1 (if yes, what age_____)____ No2 (if no, thank and terminate)
3. Which school do your children attend?____ St. John’s1
____ Riverwood2
____ Riverdale3
____ Oaklawn4
____ West Milton High5
____ West Milton Elementary6
____ West Middle School7____ St. Luke’s8
____ Other9 (Please specify__________________________________)
4. Do you plan to keep them in this (these) school(s)?____ Yes1
____ No2
____ Undecided3
5. Is this a public or a private school?____ Public1
____ Private2
____ Both3
6. Please rate the following factors on how they would influence the decisionto send your child to a private school. Please rate the factors on a scale of1 to 3, with 1 being not at all important to 3 being very important
Cost 1 2 3Size 1 2 3Location 1 2 3Religious affiliation 1 2 3Extracurricular activities 1 2 3Transportation availability 1 2 3Quality of education programs 1 2 3
7. Would you be interested in starting your child at age two in a developmen-tally appropriate early childhood program?____ Yes1
____ No2
____ Undecided3

8. Do you think that your area needs a developmentally appropriate, earlychildhood program?____ Yes1
____ No2
____ Undecided3
9. Are you aware of what a center-based approach to early childhood devel-opment is?____ Yes1
____ No2
____ Undecided3
10a. If yes, ask if this is important to him or her.____ Yes1
____ No2
____ Undecided3
10b. If no, explain center-based approach and then ask if this is important tothem.____ Yes1
____ No2
____ Undecided3
11. What do you think is the ideal number of students in a classroom?____ Less than 151
____ 15-252
____ More than 253
12. Do you think schools should employ uncertified teachers?____ Yes1
____ No2
____ Undecided3
13. Would you consider sending your child to a private elementary school inyour area?____ Yes1
____ No2
____ Undecided3
____ Depends on cost4____ Depends on location5
____ Depends on quality of school6____ Other7
14. If you were to send your child to a private school early in his or her educa-tion, please rate how important it is that he or she remain within the privateschool system, with 1 being unimportant and 5 being extremely important.(Circle one)
1 2 3 4 5
FIGURE C12.1 (continued)

15. Do you think religion classes are helpful in raising children with strong val-ues and morals?____ Yes1
____ No2
____ Undecided3
16. What is the maximum amount of tuition you could pay each month perchild to attend a private school? ________________________________
17. If the school that your child is currently attending were to relocate at leastfive to ten miles from the current location, would you want to continuesending your child there?____ Yes1
____ No2
Now just a few questions about you.
18. Which of the following contains your age?____ 18-341
____ 35-492
____ 50-643
____ 65 and over4
19. What is your marital status?____ Single1
____ Married2
____ Divorced3
____ Widowed4
20. Sex:____ Male1
____ Female2
21. What is the highest level of education you have obtained?____ Did not complete high school1____ High school graduate2
____ Some college3
____ College graduate4
____ College graduate with some graduate work5
____ Graduate degree holder6
22. What is the occupation of the chief wage earner in your household?____ Homemaker1____ Student2____ Laborer3____ Skilled craftsman4
____ Business owner/manager5____ Retired6
____ Other7
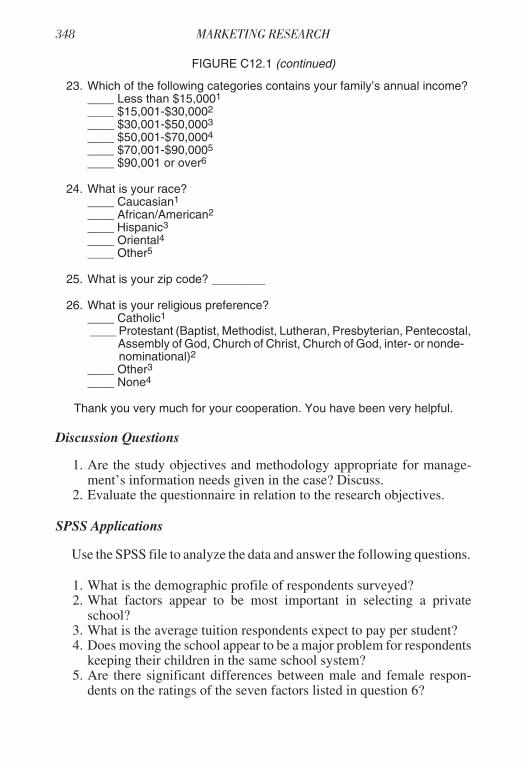
23. Which of the following categories contains your family’s annual income?____ Less than $15,0001
____ $15,001-$30,0002
____ $30,001-$50,0003
____ $50,001-$70,0004
____ $70,001-$90,0005
____ $90,001 or over6
24. What is your race?____ Caucasian1
____ African/American2
____ Hispanic3
____ Oriental4____ Other5
25. What is your zip code? ________
26. What is your religious preference?____ Catholic1
____ Protestant (Baptist, Methodist, Lutheran, Presbyterian, Pentecostal,Assembly of God, Church of Christ, Church of God, inter- or nonde-nominational)2
____ Other3____ None4
Thank you very much for your cooperation. You have been very helpful.
Discussion Questions
1. Are the study objectives and methodology appropriate for manage-ment’s information needs given in the case? Discuss.
2. Evaluate the questionnaire in relation to the research objectives.
SPSS Applications
Use the SPSS file to analyze the data and answer the following questions.
1. What is the demographic profile of respondents surveyed?2. What factors appear to be most important in selecting a private
school?3. What is the average tuition respondents expect to pay per student?4. Does moving the school appear to be a major problem for respondents
keeping their children in the same school system?5. Are there significant differences between male and female respon-
dents on the ratings of the seven factors listed in question 6?
FIGURE C12.1 (continued)

Case 13
The WebmastersThe WebmastersHenry Cole
Robert E. StevensDavid L. Loudon
Two recent college graduates who majored in computer science have justlaunched The Webmasters as a business. They have developed a client baseof twenty-five small businesses in a one-month period and are interested inexpanding this base as quickly as possible. They charge a flat fee that variesfrom $100 to $250, depending on the complexity of the site, and a monthlyservice fee of $15 to $25 to maintain the site. They want to focus on smallbusinesses, since such businesses are less likely to employ their own com-puter technicians. The young owners contracted with a consultant to pro-vide data on potential growth of the market. They calculated that theyneeded at least 200 clients to get their monthly maintenance fees up to alevel to support both of them in the business. There are about 8,000 smallbusinesses in the area.
The following are excerpts from the consultant’s report, along with thequestionnaire used in the study.
Project Purpose
This project focused on small business Internet usage in the metropolitanarea. Local small businesses were surveyed to determine what percentagesof businesses have access to the Internet, what percentage use the Internet,and how these businesses use the Internet. The study also sought informa-tion on Web site ownership, plans for a Web site, and characteristics of busi-nesses surveyed.
Project Objectives
The project objectives were as follows:
1. Determine what proportion of area small businesses have access to theInternet

2. Determine what ways these businesses use the Internet3. Determine what proportion of businesses have a Web site or are plan-
ning on having a Web site within the next year4. Determine how the company’s Web site is used and with what level of
success5. Identify characteristics of businesses that use the Internet
Methodology
A random sample of 120 small businesses was surveyed using a tele-phone questionnaire (see Figure C13.1). The questionnaire was pretested ona sample of twenty small businesses. A field service company was used tocollect the data. The information gathered from the survey was edited, tabu-lated, and processed by computer to provide a comprehensive set of tables.These tables included percentages and mean scores, which were used to an-swer the research questions.
FIGURE C13.1. Project Questionnaire
The Webmasters
May I speak with the owner? Hello, my name is_______________. Thissurvey deals with the Internet usage of small businesses in this area. Your an-swers will be confidential and used only in combination with the responses fromother businesses.
Computer Information:
1. Do you use a computer at your business?____ Yes1
____ No2
2. If yes, do you have access to the Internet at your business?____ Yes1 (go to question 4)____ No2
3. If no, why not?(mark all that apply)____ No need____ No interest____ Too expensive____ Other, please specify ___________________________________
4. Who is your Internet provider?____ AOL1
____ AT&T2
____ Bayou Internet3____ MCI4

____ Prodigy5
____ Other, please specify6___________________________________
5. In what way(s) is the Internet used in your business? (mark all that apply)____ General information (news, weather)____ Supplier information____ Competitive information____ Entertainment____ Customer information
6. In what ways has the Internet helped your company? (mark all that apply)____ Information on products/services____ Competitive information____ Information about suppliers____ Sales leads____ Other, please specify____________________________________
7. Does your company currently have a Web page?____ Yes1
____ No2 (go to question 12)
8. If yes, for how long?____ Less than six months1
____ More than six months but less than a year2____ A year3____ More than a year4
9. If yes, how is your Web page being used or how do you plan for it to beused? (mark all that apply)____ Selling over the Internet____ Advertise company products____ Display of general company or product information____ Dealers locations to buy your products____ Other, please specify____________________________________
10. As a result of your Web page, do you feel you have experienced:____ No change in sales1
____ An increase in sales2
____ A decrease in sales3
11. If an increase in sales volume has been experienced, how much increasehave you experienced?____ 5 percent -10 percent1____ 10 percent - 15 percent 2
____ More than 15 percent3
12. If no, do you plan on having a Web page within the next year?____ Yes1
____ No2

13. If no, why not?____ Too expensive1
____ No expertise2
____ Do not know how it would help3
Company Information:
14. Is your company primarily a:____ Manufacturer1____ Wholesaler2____ Retailer3____ Service organization4
____ Other, please specify5___________________________________
15. How many employees do you have?____ Less than 51
____ 5-152
____ 16-253
____ 26-354
____ 36-455
____ 46-506
____ Over 507
16. How long have you been in business?____ Less than 5 years1
____ 6-10 years2
____ 11-15 years3
____ 16-20 years4
____ More than 20 years5
17. What is your annual sales volume?____ Less than $100,0001
____ $100, 000-$249,0002
____ $250,000-$299,0003
____ $300,000-$349,0004
____ $350,000-$500,0005
____ More than $500,0006
Thank you for your time and cooperation.
Discussion Question/Assignment
1. Evaluate the research objectives and questionnaire in relation to man-agement’s information needs.
FIGURE C13.1 (continued)

2. Are the sample size and selection process appropriate for the objec-tives and methodology?
SPSS Applications
Use the SPSS file to answer the following questions.
1. What is the profile of respondents in this survey?2. What proportion of businesses have Internet access?3. How are respondents using the Internet in their business?4. What proportion are planning to get a Web page within the next year?5. Based on your analysis, does there appear to be sufficient market po-
tential for developing this business? Why?6. Is there a significant difference in the impact of having a Web site on
sales among respondents based on size or years in business?


Case 14
House of TopiaryHouse of TopiaryBruce C. WalkerRobert E. StevensDavid L. Loudon
Maurice Bernard had what he believed was a great idea. After being inthe floral arrangement business for years, he had ventured out to open a newenterprise, the House of Topiary (HT). He had started off rather modestlyand was quite pleased at his results in his first two years of operation.
Bernard had to overcome some significant challenges to achieve thepresent success level. First, many people viewed this business as just an-other florist in a 60,000- population community; as such, product differenti-ation had been an uphill battle. He had been fortunate that his reputation as aflorist and decorator provided him with opportunities that allowed him op-portunities to market and sell his topiary designs. Convincing clients andthe public that a small-leafed plant pruned and shaped into a design of ani-mals or other objects was in good taste had been quite challenging. Hebelieved that the hard work and sleepless nights of the past two years hadpaid off; there had been a steady increase in demand for his topiaries duringthe past six months. Now, he was considering expanding his business into alarger geographic area. This would require an increase in the size of hisshop, as well as hiring more employees. What was lacking at this point wasresearch that would support this decision. A good friend of Maurice’s sug-gested that he contact the Center of Marketing Excellence (CME) at the lo-cal university. The CME had worked with many different small businessesby providing student labor to complete market research services at little orno cost to area small businesses. The students benefited from this arrange-ment by having the opportunity to conduct market research and providevaluable services for the community.
Five students and their marketing professor, Dr. Bobby London, cameout to visit with Maurice about his business. Maurice gave the researchers

the history of the company and shared his vision and concerns about his an-ticipated expansion. After a ninety-minute meeting, the researchers sug-gested three major study objectives. First, the group felt that determiningoverall consumer awareness and the likely response to HT’s future expan-sion was very important. Second, the group felt that defining HT’s targetmarket (i.e., wholesalers and residential customers) would be a critical fac-tor. Finally, making a solid business decision would require a good under-standing of the demographic profiles of consumers and area florists. Bothparties agreed to allow the CME to conduct this research on behalf ofMaurice and the House of Topiary.
The CME team developed a residential questionnaire targeted to mid- toupper-level income families. The purpose of this questionnaire was to de-termine consumer demographics, such as location, education level, maritalstatus, occupation, income level, age, and location of potential customers. Asurvey of area florists also was conducted to assess the feasibility of HT’swholesale business potential. The survey sample was 100, including eightyconsumers and twenty florists. All data were collected using a structuredquestionnaire designed to meet the project’s specific research objectives.All information was collected by telephone.
After about two months, Dr. London and his students provided Mauricewith a written report that included the following information, charts, and ta-ble (see Table C14.1; Figures C14.1-C14.3).
TABLE C14.1. How Respondents Became Aware of the House of Topiary
Communication Method Percentage
Newspaper adFriendsRadio adDrove by storeFloristsOther
8.86.35.02.51.35.0
36%
64%
Aware
Unaware
FIGURE C14.1. Awareness of House of Topiary

Consumer Responses (n = 80)
• Lived in area fifteen years or more• Between thirty-five and forty-four years of age• Income range of $65,000 to $79,999• Had high school degree with some college• Female• Retired or homemaker• 18.8 percent of consumers had purchased a topiary at a cost of $5 to $25• Of the consumers making a purchase, 16.3 percent were very satis-
fied with the purchase• Eleven out of fifteen respondents who had previously purchased
topiaries stated that they would do so, again
30%
40%
30%
Make his or her own
Buy from supplier
Do not carrytopiaries
FIGURE C14.2. Business and Topiaries
65%
0%
10%
20%
30%
40%
50%
60%
70%
Tabletops
Small animals
Large animals
Landscapes
No response
FIGURE C14.3. Types of Topiaries Preferred

Floral Responses (n = 20)
• Located in area more than fifteen years• Currently have one to five employees• Annual sales volume of $60,000 or more per year• One out of seven florists who do not carry topiaries would be inter-
ested in carrying topiaries in their stores
Questions
1. Based on the information presented above, what different alternativesmight be considered?
2. What recommendations would you make to the House of Topiary?
Case 15
Professional Home InspectionProfessional Home InspectionBruce C. WalkerRobert E. StevensDavid L. Loudon
Arthur C. Doyle, owner of Professional Home Inspection (PHI), wasrather depressed. The community where he lived and operated his businesshad experienced a huge surge in existing home sales during the past fiveyears, yet the success of his business had not approached the level commen-surate with the market surge. Arthur had spent considerable time (andmoney) attempting to market his services to area realtors and the generalpublic, yet his sales had remained flat over the past five years. He was veryconcerned with what might happen to his business when the next major realestate slump occurred.
The professional home inspection industry in general and PHI specifi-cally, specializes in conducting thorough home inspections for owners andrealtors. The industry has enjoyed increased exposure during the past fewyears due to increased publicity about health and operational hazards thatcan surface in one’s home. Specifically, recent negative health reports in-volving the area’s water supply, radon and carbon monoxide levels in thehome, as well as a Surgeon General’s scathing report about the negativehealth consequences concerning indoor air pollution, had been widely re-ported. In addition, traditional home problems, such as electrical, plumbing,heating and air-conditioning unit efficiency, as well as structural problemsrelated to shifting, were ongoing concerns for homeowners. In spite of all ofthis, Doyle’s business had not experienced the growth rate that he felt itshould have experienced. He determined that he had to find out why, if hisbusiness was going to grow to the level he felt was appropriate.
PHI operated in Mason, Missouri, a city with a population of approxi-mately 125,000 people. Mason was the county seat, but the population that

lived outside of the city represented approximately 10 percent of the totalpopulation of the county. Due to that, Doyle had focused most of his timeand resources toward the Mason home market. The community was thriv-ing with a solid industrial tax base and a small, but growing university. Ac-cording to the Mason chamber of commerce, the average per capita incomein Mason was approximately $27,500 per year, up approximately 15 per-cent from about eight years ago. There had been a considerable number ofnew homes built during this time, and the sale of existing homes in the cityhad steadily increased.
In an attempt to determine whether or not he was using the right businessmodel, Doyle decided to contact and employ his cousin, Oliver W. Holmes,to conduct market research on behalf of PHI. Holmes had graduated with adegree in marketing from a highly rated university about fifteen years ago,and had operated his own market research firm for about ten years. Thisbusiness, Market Research Institute (MRI), had a strong history and reputa-tion for assisting small, struggling businesses in developing market nichesand strategies. After a lengthy phone conversation, Holmes and Doyle metin a two-hour lunch meeting to discuss specific issues related to Doyle’sbusiness and the role Holmes could play in assisting PHI.
Holmes asked Doyle to explain the various services that PHI offered. Af-ter hearing this, Holmes asked Doyle to describe his marketing strategy.Doyle explained that he used several different approaches to maximize ex-posure of his business and services provided. First, he used broadcast adver-tising on a limited basis. PHI was a cosponsor of a weekly business reviewprogram on cable TV, helped cosponsor realtor business meetings, and itgenerally set up an exhibitor’s booth at the annual homebuyers trade showheld at the local civic center. PHI also was a member of the local chamber ofcommerce, and advertised in many of the commercial chamber reports, es-pecially those related to real estate and economic development activities go-ing on in the community. Doyle also had conducted continuing educationseminars through the local university. In addition, Doyle utilized a directmail campaign geared to the local real estate brokers and agents to try to in-fluence them to recommend PHI to potential buyers of existing homes.Since Doyle was not happy with the success of his business, he wondered toHolmes whether a different advertising strategy could help.
Holmes then asked Doyle to describe the typical user of PHI services.Doyle had to admit at that point that he had no idea, other than the fact thatthe typical user had a purchase contract pending, generally on an existinghome (as opposed to new construction). Doyle rarely had been called to in-spect new construction, since the building requirements and the newness ofthe home’s operating systems tended to negate issues that generally sur-

faced in older, existing dwellings (i.e., plumbing, electrical, structural, sew-age problems). Doyle then questioned whether or not knowing a profile ofhis client was really that meaningful since PHI was inspecting homes as op-posed to providing services to individuals, even though individuals were re-quired to pay for such services.
Holmes explained to Doyle that having a customer profile might provideinsight as to future company services as well as clues as to what type of ad-vertising and promotions might be more effective. For example, if the typi-cal decision maker for these types of services is a thirty-five-year-old maleblue-collar worker, advertising or sponsoring activities such as in huntingand fishing programs, might result in greater exposure to his potential cus-tomers. On the other hand, if the typical decision maker is a fifty-year oldfemale professional, PHI might become more involved in advertising orpromoting through garden clubs or certain civic organizations. Doyle ad-mitted that he had never really thought about that.
At the close of the meeting, Doyle and Holmes agreed upon the follow-ing market research questions and objectives:
1. What are the factors involved in the choice of a home inspection com-pany?
2. How important are each of these factors?3. What is the most feasible and effective means of reaching home buy-
ers?4. What are the most attractive features of each PHI service, and what
are the selection considerations of consumers?5. What is the level of realtor satisfaction with PHI services?6. Develop and evaluate the demographic profiles of consumers accord-
ing to areas and consumer classifications.7. Determine the strategic implications of the findings.
MRI determined that the best and most cost-effective manner to capturethe information needed to accomplish the above objectives would bethrough telephone surveys that targeted two different groups: area realtorsand potential home buyers. It was felt that the responses of these two groupswould provide insight as to how PHI services were actually sold and whatfactors were important in the buying decision. MRI professionals devel-oped, pretested, and conducted a potential customer telephone survey (seeFigure C15.1) and a realtor telephone survey (see Figure 15.2). A total ofninety usable questionnaires were received, with thirty responses from arearealtors and sixty responses from potential customers.

FIGURE C15.1.Home Inspection Service Telephone Questionnaire (Homeowners)
Number called __________ Date of call __________ Time _______
Hello, am I speaking with man/lady of the house? (If no, ask to speak to that per-son.)
My name is _______________. I am with MRI, a marketing research companyand we are conducting a marketing research project with area residents. Thisstudy deals with home inspection services. Would you please help us by an-swering a few questions? Your answers will be confidential and used only incombination with the responses of other people.
1a. Do you own or rent your home?___ Own (go to 1c)1___ Rent (go to 1b) 2
1b. If rent, are you planning to buy a house in the next year?___ Yes1
___ No 2 (terminate)
1c. Do you or any members of your family work for a home inspectionservice or a realtor?___ Yes1 (terminate)___ No2
1d. Have you or any member of your family recently purchased a home?___ Yes1
___ No2
2. Are you aware of the availability of home inspection services?___ Yes1
___ No2
If yes, how found out? ______________________________________If no (explain), in home inspection an inspector comes to a home youmight purchase or sell and inspects it for damage or problem areas, suchas, electric, plumbing, the roof, the foundation, insulation, in addition tomany other minor areas.
3. When choosing such a service, what factors would most influence yourchoice of inspectors? (mark all that apply)___ Recommended by realtor___ Referrals from friends___ Word of mouth___ Good reputation___ Cost of service___ Money saving benefits

___ Inspector credentials___ Other
4a. (IF YES TO #2) When you were planning to buy your home, which of thefollowing would have been the most effective way to inform you of homeinspection services? (mark all that apply)___ Realtor___ Television ads___ Referrals___ Newspaper ads___ Business cards___ Direct mail/brochures___ Car sign___ Yellow pages___ Billboards___ Real estate magazine___ Other
4b. (IF NO TO #2) If you were in the market to buy a home, which of the fol-lowing would be the most effective way to inform you of home inspectionservices? (mark all that apply)___ Realtor___ Television ads___ Referrals___ Newspaper ads___ Business cards___ Direct mail/brochures___ Car sign___ Yellow pages___ Billboards___ Real estate magazine___ Other
5. Please rate your interest in the following home inspection services, usingvery interested, somewhat interested, or not interested:
a. Structure___ very interested1 ___ somewhat interested2 ___ not interested3
b. Electrical___ very interested1 ___ somewhat interested2 ___ not interested3
c. Plumbing___ very interested1 ___ somewhat interested2 ___ not interested3
d. Foundation___ very interested1 ___ somewhat interested2 ___ not interested3
e. Heating and air conditioning___ very interested1 ___ somewhat interested2 ___ not interested3
f. Lot grading (sloping of yard away from home)___ very interested1 ___ somewhat interested2 ___ not interested3

g. Carbon monoxide testing___ very interested1 ___ somewhat interested2 ___ not interested3
h. Combustible gas testing___ very interested1 ___ somewhat interested2 ___ not interested3
i. MO home energy rating and evaluation___ very interested1 ___ somewhat interested2 ___ not interested3
j. 203k consulting (inspection of a home for a first time buyer. The ex-penses to fix are included into first mortgage)
___ very interested1 ___ somewhat interested2 ___ not interested3
k. Radon testing___ very interested1 ___ somewhat interested2 ___ not interested3
l. Tap water testing___ very interested1 ___ somewhat interested2 ___ not interested3
m. Indoor air pollution testing___ very interested1 ___ somewhat interested2 ___ not interested3
6. Do you live in___ Mason1
___ East Mason2
7. How long have you lived in the area?___ 0-2 years1
___ 3-5 years2
___ 6-12 years3
___ 13-20 years4
___ Over 20 years5
___ Refused6
8. Now just a few more questions about you. Are you:___ Single with no children1
___ Married with no children2
___ Married with children at home3
___ Single with children at home4
___ Married with no children at home5
___ Single with no children at home6
___ Refused7
9. Which age category do you fit into?___ 18-241 ___ 55-645
___ 25-342 ___ 65 and older6___ 35-443 ___ Refused7
___ 45-544
10. What is the category that includes your total family income?___ Under 15,0001 ___ $65,000 to $79,9996
___ $15,000 to $24,9992 ___ $80,000 to $94,9997
FIGURE C15.1 (continued)

___ $25,000 to $34,9993 ___ $95,000 to $109,9998
___ $35,000 to $49,9994 ___ Over $110,0009
___ $50,000 t0 $64,9995 ___ Don’t know, refused10
11. Are you:___ A high school graduate1
___ A high school graduated with some college2
___ A college graduate3
___ A college graduate with some graduate school4___ A graduate degree holder5___ Refused6
12. Sex:___ Male1
___ Female2
13. What is the approximate amount you paid for your home?___ Less than $50,0001 ___ $150,001 to $175,0006
___ $50,000 to $75,0002 ___ $175,001 to $200,0007
___ $75,001 to $100,0003 ___ $200,001 to $225,0008
___ $100,001 to $125,0004 ___ $225,001 to $250,0009
___ $125,001 to $150,0005 ___ Over $250,00010
Thank you very much for your time and cooperation.
FIGURE C15.2. Home Inspection Survey Telephone Questionnaire (Realtors)
Number called Date of callInterviewer Realtor
Hello, am I speaking to the owner/manager?
My name is __________________. I am with MRI, a marketing research firm,and we are conducting a survey of area realtors. This survey deals with home in-spection services. Would you please help us by answering a few questions?Your answers will be confidential and used only in combination with responsesof other realtors.
1. Are you familiar with home inspection services?___ Yes1
___ No 2 (terminate)
2. Have you ever recommended a home inspection service to a homebuyer?___ Yes1
___ No2 if no, why? ________________________________(terminate)

3. If yes, which inspector do you recommend?________________________________________________________
4. Is the cost of a home a factor in recommending home inspection ser-vices?___ Yes1
___ No2
5. If yes, at what price level would you begin recommendations?___ Below $50,0001
___ $50,000 to $69,9992
___ $70,000 to $89,9993
___ $90,000 to $109,9994
___ Over $110,0005
___ Refused6
6. Have you ever used Professional Home Inspection Services? (ask ifDoyle not mentioned in question 3)___ Yes1
___ No2 (Terminate)
If they have not used PHI terminate. If they have used PHI, ask questions7 and 8.
7. If PHI was mentioned on question 3, ask “On a scale of 1 to 5, where 1 isvery dissatisfied and is very satisfied, how would you rate your satisfac-tion with Professional Home Inspections?1 2 3 4 5
8. If dissatisfied (1 or 2), why are you dissatisfied?___ Poor service1
___ Too expensive2
___ Other, specify3
Thank you very much for your time and cooperation.
Questions
1. Do you feel the consumer survey provided the information necessaryto meet the study’s objectives? Why or why not?
2. What major conclusions might be reached based on the realtor re-sponses?
FIGURE C15.2 (continued)

3. Based on the information received from the potential customer sur-vey, what recommendations would you give to Doyle concerningmarketing to this group?
SPSS Application
1. What were the factors that influenced the choice of a home inspector?Were these factors the same for those who were aware of home in-spection services as opposed to those who were unaware?
2. How interested were potential customers in inspection services re-lated to carbon monoxide, indoor air pollution, and radon testing?Based on these findings, should PHI strongly market this type of in-spection services?
3. Based on the information received from the survey, is PHI in a posi-tion to influence a realtor’s willingness to recommend PHI over itscompetitors? Why or why not?


Case 16
Europska DatabankaEuropska DatabankaMarlene M. ReedEdward L. Felton
Pavel Jisa, co-owner of Europska Databanka, shifted his weight andleaned forward in his chair as he contemplated the question that his friendRichard, the eighty-fourth Duke of Siebenlugner, had just asked him and hispartner, Dalibor Dusek. “Is there any way that you two might use marketingresearch to improve the operations of your company?” had been Richard’squery. The Europska Databanka office in Prague, Czech Republic, had beenlaunched in 1991. It was now May 1997. The company had been so success-ful that the question of marketing research had never been raised. But per-haps now was the time to determine whether engaging in some research onthe effectiveness of their organization might allow the partners to be evenmore efficient in their operations.
Background on Europska Databanka
Pavel let his mind race back to the launching of the company. The VelvetRevolution that had occurred in Czechoslovakia in November 1989, hadpresented unique opportunities to latent entrepreneurs in the country. Not infifty years had the possibility of beginning their own businesses existed forcitizens of Czechoslovakia. The Revolution was ushered in by hundreds ofthousands of citizens jingling their keys in the streets of Prague around thepopular Wenceslas Square and shouting, “Closing time,” or “We shallovercome.” The mood at that time in history resembled an endless carnival.
Before the Revolution, Pavel and Dalibor had worked for a transit com-pany that shipped goods transported in containers on the company’s trucksand scheduled the containers for shipment on railway cars when needed.Pavel was a computer technician and had the responsibility of working withthe logistics of using the company’s trucks in the most efficient manner.

Dalibor was the supervisor of the computer department on one of the threeshifts of the day and was Pavel’s supervisor. After the Velvet Revolution,Pavel and Dalibor began thinking about their business options. Dalibor hadsuggested, “It seems to me that there will be a great need for informationabout new companies that are producing specific goods and services thatcustomers may need. The Yellow Page directory published by the telephonecompany is only distributed once a year, and new businesses are starting ev-ery day.” Pavel had responded, “Since we have both been involved in get-ting goods on containers to the right place at the right time and keeping ac-curate records about the transportation of these goods, we should be able touse those skills to start a company that delivers information to people in atimely manner about companies that provide the goods and services thatthey desire.”
Someone had told Pavel and Dalibor about a man named Schwanzenwho had started a business in Brno, Czechoslovakia, similar to the one theywere thinking about launching. They contacted him, talked about their de-sire to start a similar company, and discovered that he was franchising hisbusiness throughout the Czech Republic and Slovakia.
They learned from Schwanzen that the company operated in the follow-ing manner:
1. Salespeople from Europska Databanka contacted businesses that of-fered goods or services to the public and agreed to represent them andrefer callers inquiring about such products or services to their offer-ings. They charged the companies that they represented a fee thatcould range from 5,000 korunas to 30,000 korunas per year based onthe size of the company and the number of their products. Not only didthey handle goods and services of companies, but also offered travelservices and accommodations to travelers. Some of the companiesthat had signed contracts with them were Skoda, VW Group, IBM,Hewlett-Packard, Credit Management, British Petrol Oil, Nissan,Citibank, and Dun and Bradstreet. Detailed information about the cli-ent firms was stored in the company’s databank in Germany and madeavailable to all of their foreign clients.
2. The company publicized its services to consumers through ads in vari-ous Yellow Pages, billboard messages along the highways, sponsor-ing a television show on aerobics, and advertising on the sides ofbuses and trams.
3. The company distributed information to consumers regarding theavailability of products and services they were interested in throughthe use of the following means of communication: a bank of telephonereceptionists who were available from 7:00 a.m. until 7:00 p.m. totake calls for information; a Web site on the Internet to offer the same

information; and compact disks also bearing information about thecompanies and their products. (See Exhibit C16.1 for the content offlyers distributed by the company explaining its products and ser-vices.) Unlike the 1-900 numbers in the United States that receivedrevenues by charging the caller a fee, this company secured their reve-nues from the companies they represented. The contracts from thecompanies were renegotiated each year.
WHO WE ARE
We would like to introduce to you one of the most important and most widelyused information services in the Czech and Slovak Republics:
You can reach our public telephone information service, the “EDB service phone,”at number 185 in 62 towns and cities throughout the Czech and Slovak Republics.
Every day we answer more than 9,500 calls on our EDB service phone, providinginformation about products, services, firms, travel agency offers,
and accommodation capacities.
We were the first and today are still the only information service thathelps Czech firms make almost 50,000 business contacts daily, with other Czech firms
and also with foreign companies.
We are the first company able to ensure the presentation of your firmin all modem ways; i.e. through our telephone information service,
through written profiles or in our membership journal.
* We are contract partners with over 18,000 firms from both republics, fromsmall- to medium-size business companies to industry giants.
* Our main job is to ensure a complex information service for all our clients’ businessactivities. Starting October 1995,
we are implementing into the entire EDB the “New Marketing System,”thus expanding the range of information services, on offer.
We are direct-contract partners with the European Union Commission. Signedcontracts enable us for entry into the world’s largest business contact
databases and on the other hand we enable our clientspresentation in these databases.
Also from the turnover point of view we are among the largest informationservices in the republic. The total turnover exceeds one hundred million Kc
with a steadily growing trend.
Since September 1996, we have been providing information on the Internet system,therefore anyone may find our databases at address:www.edb.cz.
EXHIBIT C16.1. Company Flyer

WHAT DO WE OFFER?
FIRM PRESENTATION:
Through 185—our service phone number
On INFOSERVIS EDB compact disc
* On the Internet
In the European Union databasesIn EDB-REVIEW—our membership journal
* In online information services
INFORMATION SERVICES FOR YOUR BUSINESS
From the Czech Republic:
Business and contact information on Czech and Slovak firmsThrough 185—our service phone number
* Written summaries from EDB databases
* Detailed profiles on Czech and Slovak firms
INFOSERVIS EDB compact discsEDB-REVIEW membership journal
* “Annual reports of companies” compact disc
Information on state administrative subjects and important institutions in the CRFrom online systems
from abroad:
Basic profiles on firms throughout Europe* Detailed profiles on foreign firms
Advice on business contacts to foreign firmsInformation on business contacts from the European Union databases
Service phone on number 185
Traditional service of the EUROPEAN DATABANK, which guarantees its customers thatanyone calling 185 in the Czech and Slovak Republics and looking for their firm, productsor offered service will find out about their firm.
Every day 270 operators are working at more than 60 places in the Czech and SlovakRepublics to mediate 50,000 contacts for businessmen and other customers.
One of the great advantages of the* EUROPEAN DATABANK programs is the ability toupdate information on every client at any EDB contact office.
Regular, three times a week, information transfers between branch offices create a permanentflow of fresh information on EUROPEAN DATABANK clients at all branch offices. Practically
EXHIBIT C16.1 (continued)

A separate EDB database is the accommodation facilities and travel agencies database.Firms providing accommodation services can specify in detail in the appendix the numberof beds and the amenities offered. Through the EUROPEAN DATABANK these firms canalso publicize the up-to-date list of tours offered by their travel agencies.
Every client of the EUROPEAN DATABANK has the opportunity to publicize informationon all branch outlets to the same extent as he or she does on his or her mother firm atadvantageous rates.
Presentation on the Internet
The EDB server has been accessible on the Internet since October 1997(the address is http://www.edb.cz). From this moment all information about our clients
has been accessible within the framework of EDB Product Database.Moreover, every client has an opportunity to create his or her own www pages on the
EDB server. Those pages will be accessable on the adress http://www.edb.cz /name ofthe company shortened into eight characters. So stored presentation will be accessible
either from EDB Product Database by entering a short address, or from specialdirectory placed on the www EDB client page. For our clients already having their ownwww pages, EDB offers a possibility to create a link directly from the record in the EDB
Product Database.
Presentation in online information services
In the Czech Republic the databases of the EUROPEAN DATABANK are displayed inthe EOTEL and Videotex online systems and in the database centre
of the National Information Centre.Information about your organization is thus available to all users of these online
information services daily, around the clock.
INFOSERVIS EDB Compact discEDB’s hit for 1995 was publishing the compact disc (CD-ROM)
INFOSERVIS EDB. This compact disc is chiefly meant for people working often withverified information -it enables them to look at information from different
points of view and selective criteria, to use alternative approaches, and logicaldata analysis. The system is built as a permanent partner for working with
information. Searching for information in the INFORSERVIS EDB system is possibleby indexes (SKP, SIC, EDB), filters, and the full-text method.
A new feature is built into the INFOSERVIS EDB compact disc -imaging; which extents the EDB clients’ selection to include the conveying of
information by means of graphics (advertisements, pricelists, schemes, products, etc.).Besides minor graphics manipulation (enlarging, minimalizing, cutting, turning)
it enables the INFOSERVIS EDB user to print out the graphics information.
The INFOSERVIS EDB information is brought up-to-date four times a year and offersnot just contact addresses, but also detailed information on the activity of the desired
subject and what is more, the imaging technology enables our clients to publish extensiveinformation about themselves. Publishing the INFOSERVIS EDB compact disc wasactivated by the growing demand for information among business men and women.
Therefore all data on EUROPEAN DATABANK clients is now accessibledaily, around the clock.
every day clients of the EDB may change information on their firm and the newestinformation is available for our customers.

Pavel and Dalibor were even more interested in the business after theirconversation with Schwanzen. They knew that beginning a new businesscould be risky, so they decided to put together a business plan to test the fea-sibility of such a franchise in Prague. After working on the business plan forthree months, they decided that a market existed for such a company inPrague, and they entered an agreement with Schwanzen for exclusive fran-chise rights in the city. (See Exhibit C16.2 for a list of locations of EuropskaDatabanka in the Czech Republic and in Slovakia.)
The first step Pavel and Dalibor took was to raise the needed 100,000Czech korunas that it would take to launch the business. Since the newly-formed private banks were not lending money to anyone, they raised theirstart-up capital from friends and relatives. They decided to borrow themoney rather than bringing in additional owners of the company.
Written summaries from EDB databases
The option of obtaining summaries from the ED 13 databases has been provided by theEUROPEAN DA T ABANK since its creation. Summaries are obtainable as print outs
or in electronic form on discettes. EDB nonclients can obtain only informationsummaries on EUROPEAN DATABANK clients, for our clients we offer information
from a list of 100,000 firms active on our market. It is enough to specifythe desired product or service and locality.
EXHIBIT C16.1 (continued)
EUROPEAN DATABANK
EVERYBODY’S INFORMATION
We are at your disposal in the following towns on the telephone number 185:
R
Beroun, B eclav, eské Bud jovice, Doma lice, Frýdek-Místek, Hodonín, HradecKrálové, Chomutov, Jablonec n/N., Ji ín, Jihlava, Jind ichuv Hradec, Karlovy Vary,
Karviná, Kladno, Kolín, Krom í , Kutná Hora, Liberec, M lník, Mladá Boleslav,Nymburk, Olomouc, Opava, Ostrava, Pardubice, Plze , Prost jov, P erov, P íbram,Ro nov p/R., Svitavy, Šumperk, Tábor, Teplice, Trutnov, T ebí , T inec, Uherské
Hradi t , Ústí n/L., Vla im, Vy kov, Zlín, Znojmo, amberk, dár n/Sázavou.
SR
Banská Bystrica, Bratislava, Duna ská Streda, Ko ice, Liptovský Mikulá , Nitra, NovéZámky, Pre ov, Prievidza, Ro ava, Rimavská Sobota, Tren ín, Trnava, Zilina.
EXHIBIT C16.2. List of Europska Databanka Locations

After the money had been raised, Pavel and Dalibor applied for a conces-sion (certificate or business license) with the Concession Office in Prague.They had to pay 1,000 Czech korunas for the concession. In addition to fill-ing out the form for the concession and paying the 1,000 koruna fee, theyalso had to bring with them a certificate from the court stating that neither ofthe partners had ever been convicted of a criminal offense. In one week,they received their certificate from the Concession Office. The next stepthey had to take was to present the business certificate to the Taxation De-partment and receive a tax number. Finally, they located a site for the busi-ness at No. 15 Husitska in the heart of the Prague business district.
Pavel had read in a publication for entrepreneurs that in the first six yearssince the Velvet Revolution, 1.5 million new business certificates had beenissued by the government. It had been estimated by the government that foronly 150,000 of these business certificate recipients would the business betheir primary jobs. For the rest, the ventures would merely be a way to sup-plement their full-time jobs.
Most businesses that were begun in 1990 had been launched by formercommunist leaders because they had the right contacts and sufficient moneyto begin a business. A popular saying in the United States, “It’s not whatyou know, but who you know,” applied also to the burgeoning new Czecheconomy. However, by 1991, other people were finding ways to raisemoney to begin their own businesses.
Privatization in Czechoslovakia
Before the revolutions that shook the countries of Eastern Europe in1989, there were basically two kinds of firms in operation: state-owned andcooperatives. Whereas Poland had a rather strong private sector with manycooperatives, Czechoslovakia did not. In fact, in 1986, 96.7 percent ofCzechoslovakia’s net national product was produced by the state-ownedfirms. East Germany, the Soviet Union, and Czechoslovakia had the highestpercentage of state production of all of the communist countries.
Czechoslovakia had several advantages as it moved toward a free-marketeconomy. The country’s annual inflation rate never exceeded 5 percentthroughout the decade of the 1980’s, the external debt of Czechoslovakiawas low by international standards, and the country had a well educated andskilled labor force. However, the country also had some major disadvan-tages. It had no private sector and all prices had been centrally controlled.Also, Czech exports had been aimed at the countries of the Soviet Unionand Eastern Europe. In fact, 40 percent of their exports had been to the So-viet Union. Most of their products were not saleable in Western markets be-cause of their poor quality.

By spring 1997, there was another problem that bothered economists,economic journalists, and politicians: the fraudulent activities that had re-cently surfaced in the economy. It was apparent that shady speculators weredestroying small investment funds by selling off their assets and “tunnel-ing” the money out of the country. Thomas Jezek, a godfather of speedy pri-vatization, used to say that, “We must be faster than the lawyers” to keep theprocess (of privatization) from bogging down in needless controls. By1997, the same Mr. Jezek, as Chairman of the Prague Stock Exchange,spoke in horror of the lack of controls on business in the new Czech Republic.
Emergence of the Czech Republic Economy
After the 1993 split between the northwestern, primarily Bohemian, sec-tion of Czechoslovakia into the Czech Republic and the southeastern,mostly Moravian, section of the country into Slovakia, the economy of theCzech Republic initially held up quite well. Although the Czech Gross Do-mestic Product (GDP) fell precipitously in 1991-1992 because of economicproblems in the Eastern markets that were formerly their primary customersand a fall in domestic demand as a result of rising prices, there were stillmany bright spots in the economy. Most encouraging was the very low un-employment rate and the growth of the private sector. A Czech economistnamed Kamil Janacek speculated, “One can infer that faster progress of theprivate sector in the Czech Republic is one of the reasons for the less ad-verse impact of transformation there. In the Czech Republic, private sec-tor’s share of the GDP was almost 10% in 1991 compared to 4% inSlovakia.”
However, in spring 1997, the Czech Republic was facing serious eco-nomic problems. To begin with, there had been very little restructuring inthe older, recently privatized Czech companies. This situation was respon-sible for the low unemployment rate in the country. The country’s trade def-icit had also grown. This was coupled with a concern about some under-handed dealings in the Czech capital markets and a compromised position atsome of the big banks. In January and February of 1997, industrial produc-tion slumped 4 percent, wages soared 16 percent, and the budget deficit hit8.5 billion korunas.
In response to the shocking financial news, an emergency economicpackage was unveiled by Prime Minister Vaclav Klaus in late spring of1997. The most striking provisions were for large budget cuts in investmentand welfare spending, a public sector wage growth limited to 7.3 percentwith pressure on the private sector to follow suit, the immediate introduc-tion of 20 percent import deposits on foodstuffs and consumer goods (tostop the hemorrhage in the balance of payments), and the completion of pri-vatization of government-owned businesses and sales to foreign strategicpartners or managerial groups.

One resource that had not been sufficiently utilized in solving many ofthe economic problems of the new economy was the brain power of the lo-cal schools of higher learning. Within Prague, there was the prestigiousCharles University that was well known for its programs in medicine, law,puppetry, and economics. Another school that drew many foreign studentswas the University of Economics in Prague. Also, technical schools hadbusiness programs.
The Challenges for Europska Databanka
The early months of Europska Databanka had been more successful thanPavel and Dalibor could have imagined. They had paid off all of their loansto friends and family within the first six months of operation. The companycontinued to grow, but they wondered if there were ways of making it growfaster.
Pavel and Dalibor had not been able to open a bank account initially be-cause the banks told them they would have to have 50,000 korunas beforethey could open an account. Even if they had that much cash, the bank sug-gested they did not have an account number to give them. They were in-structed to come back in a year and a half and perhaps then they would allowthe company to open a checking account. Most people in the Czech Repub-lic paid cash in all of their transactions, so a bank account was not a neces-sity. However, there were those who realized that a cash economy has veryfew controls for violating the tax laws.
There were other challenges for entrepreneurs in the new Czech Repub-lic. Although in the early years of the Czech free-market economy sole pro-prietorships and partnerships had limited liability, in 1996 the law hadchanged and proprietorships and partnerships now had unlimited liability.Pavel and Dalibor realized they could lose all of the money they had in-vested in the company plus anything else of value that they owned if thebusiness went under and they were sued by their creditors. The partnersknew unlimited liability made sense for an economy that was attempting toestablish sufficient ground rules to keep the possibility of fraud out, but itdid make their position much riskier.
By May 1997, the company had ten employees working on the tele-phones supplying information on goods and services to callers and tenothers working in the field as salespeople. The sales force called on pro-spective companies and attempted to get them to agree to sign a contractwith Europska Databanka. One of the primary problems of the business wasthe difficulty of hiring good employees. Because the unemployment rate inthe Czech Republic was so low, it was almost impossible to find qualifiedemployees. In fact, the company had recently run an advertisement in thenewspaper for new salespeople and had received fifty inquiries about the

position. However, only four people showed up for an interview, and onlyone of the four people was qualified for the job. The low unemployment ratealso meant that workers were not afraid to lose their jobs because of lowproductivity; they knew they could always get another job.
There were a few employment search agencies in Prague. However, theywere not utilized by the companies because the idea of search agencies wascompletely new. The primary customers of these agencies were foreignersseeking jobs in the Czech Republic.
As to competition, Pavel and Dalibor believed at the present time theonly competition was from the Yellow Pages. However, they also knewthere were few barriers to entry into the industry. Another entrepreneurcould simply observe what they were doing and copy their operations. Theprimary barrier to entry was the massive task of organizing all of the infor-mation about the companies that they represented. They wondered if therewere other barriers to entry that they could construct. Richard had suggestedto them that if they could offer superior customer service, this might proveto be a barrier to entry. Pavel liked the idea of customer service but had tolaugh when he thought of the lack of customer service that existed under theformer command economy. He remembered that customers were treated asslaves who had to beg for products from the government-owned businesses.He wondered how they could implement customer service in their operations.
Pavel reflected on a question that a young American named SusannaPierce had asked him. Susanna was a student at the University of Econom-ics in Prague and was keenly interested in the economic changes that weretaking place in the economy. Her question had been, “What do you considerto be the greatest challenges for new businesses in a country that has re-cently moved from a command economy to a free-market economy?” Hethought about the state of the former and present Czech economy and beganto formulate in his mind a response to that intriguing question.
Pavel’s thoughts came back to the present when Richard rose from thedesk on the mezzanine at No. 15 Husitska where the two of them andDalibor had been sitting. As Richard put his wide-brimmed black hat on hishead and moved toward the door, he suggested again that they consider uti-lizing market research to improve the performance of the company. Theremust be some way, he urged, to find out if consumers are actually taking thefirm’s advice and buying the products that it had recommended to them.Also, there must be a way of determining how the callers found out aboutthe company so that the company could be assured that it had used the mosteffective method of advertising. Pavel wondered how they would accom-plish these things.

Notes
NotesChapter 1
1. For a discussion of studies conducted on the value of being market orientedsee Bruce Wrenn, “The Marketing Orientation Construct: Measurement andScaling Issues,” Journal of Marketing Theory and Practice, 5(3, 1997), pp. 31-54.
2. “The Perils of Typecasting,” American Demographics, (February 1997),p. 60; Karen Benezra, “Fritos Around the World,” Brandweek, (March 27, 1995),p. 32; “Chinese Chee-tos,” The New York Times, (November 27, 1994), p. 31;“Chee-tos Make Debut in China but Lose Cheese in Translation,” USA Today, (Sep-tember 2, 1994), p. B-1.
3. See John Yokum, “Invest for Success: It’s Research That Makes WinningPrograms,” Marketing News, (June 6, 1994), p. 22.
4. Peter D. Bennett (Ed.), Dictionary of Marketing Terms (Chicago: AmericanMarketing Association, 1988), p. 117.
5. See William D. Neal, “ ‘Marketing’ or ‘Market’ Research?” The ResearchReport, (Summer 1989), p. 1.
6. See William D. Perreault, Jr., “The Shifting Paradigm in Marketing Re-search,” Journal of the Academy of Marketing Science, 20(4, 1992), pp. 369-381.
7. See N. B. Zabriskie and A. B. Hurellmantel, “Marketing Research As a Stra-tegic Tool,” Long-Range Planning, 27(1994), pp. 107-118.
8. Christine Moorman, Gerald Yaltman, and Rohit Desponde, “RelationshipsBetween Providers and Users of Marketing Research: The Dynamics of TrustWithin and Between Organizations,” Journal of Marketing Research, 24(3, 1992),pp. 314-328.
9. Adapted from Irving D. Canton, “Do You Know Who Your Customer Is?”Journal of Marketing, (April 1976), p. 83.
10. Discussion of Research Purpose and Research Objective is adapted from Da-vid Aaker, V. Kumar, and George Day, Marketing Research (New York: JohnWiley and Sons, 1998).
Chapter 2
1. William G. Zikmund, Exploring Marketing Research (Fort Worth, TX:Dryden Press, 1997), p. 145.

2. Adapted from Gilbert A. Churchill, Basic Marketing Research, Second Edi-tion (Fort Worth, TX: Dryden Press, 1992), pp. 130-131.
3. Robert Ferber, Donald F. Blankertz, and Stanley Hollander, Marketing Re-search (New York: The Ronald Press, 1964), p. 153.
4. Ibid., p. 171.5. For a discussion of the ethics of marketing research see N. Craig Smith and John
A. Quelch, “Ethical Issues in Researching and Targeting Consumers,” in N. CraigSmith and John A. Quelch (Eds.), Ethics in Marketing (Homewood, IL: Irwin,1993), pp. 145-195.
6. Thomas C. Kinnear and James R. Taylor, Marketing Research (New York:McGraw-Hill, 1991), p. 285.
7. William R. Dillon, Thomas J. Madden, and Heil H. Firtle, Marketing Re-search in a Marketing Environment, Third Edition (Burr Ridge, IL: Irwin, 1994),p. 180.
8. These points were taken from N. D. Cadbury, “When, Where, and How toTest Market,” Harvard Business Review, (May-June 1985), pp. 97-98.
9. “Test Marketing: What’s in Store?” Sales and Marketing Management, 128(March 15, 1982), pp. 57-58.
10. Donald S. Tull and Del L. Hawkins, Marketing Research, Sixth Edition (NewYork: Macmillan, 1993), pp. 252-258.
11. Material provided by the Burke Institute on their BASES simulated test-mar-keting program.
Chapter 3
1. See Marcia Stepanek, “Weblining,” Business Week E-Biz Supplement, (April3, 2000), pp. EB26-EB34.
2. See Heather Green, “The Information Gold Mine,” Business Week E-Biz Sup-plement, (July 26, 1999), pp. EB17-EB30.
Chapter 4
1. Richard A. Krueger, Focus Groups (Newbury Park, CA: Sage Publications,1990); Alfred E. Goldman and Susan Schwartz McDonald, The Group Depth Inter-view (Englewood Cliffs, NJ: Prentice-Hall, 1987).
2. Judith Langer, “Getting to Know the Customer Through Qualitative Re-search,” Management Review, (April 1987), pp. 42-46.
3. Ibid.4. Joe L. Welch, “Research Marketing Problems and Opportunities with Focus
Groups.” Industrial Marketing Management, (14, 1985), p. 248.5. Thomas L. Greenbaum, “Do You Have the Right Moderator for Your Focus
Groups? Here Are 10 Questions to Ask Yourself,” Bank Marketing, 23(1, 1991), p. 43.6. The Group Depth Interview, pp. 170-182.
7. The following sources were referred to in writing this section on Internet re-search: James Watt, “Using the Internet for Quantitative Survey Research,” Quirk’sMarketing Research Review, (June/July 1997), pp. 18-19, 67-71; “Pro and Con:Internet Interviewing,” Marketing Research, 11(2, 1999), pp. 33-37; Diane K. Bowers,“FAQs on Online Research,” Marketing Research, 10(4, Winter 1998/Spring 1999),pp. 45-49; Don Dillman, Mail and Internet Surveys (New York: John Wiley andSons, 2000), pp. 352-361.
8. Mail and Internet Surveys, p. 356.
Chapter 5
1. Jim C. Nunnally, Psychometric Theory, Second Edition (New York:McGraw-Hill, 1978), p. 3.
2. Shelby D. Hunt and Robert N. Morgan, “The Comparative Advantage The-ory of Competition,” Journal of Marketing, 59(April 1995), pp. 1-15.
3. Bruce Wrenn, “What Really Counts When Hospitals Adopt a Marketing Ori-entation: The Contribution of the Components of Marketing Orientation to HospitalPerformance,” Journal of NonProfit and Public Sector Marketing, 7(1/2, 1996),pp. 111-133.
4. Bernard J. Jaworski and Ajay K. Kohl, “Marketing Orientation: Antecedentsand Consequences,” Journal of Marketing, 57(July 1993), pp. 53-70.
5. Gilbert Churchill, “A Paradigm for Developing Better Measures of Mar-keting Constructs,” Journal of Marketing Research, 16(February 1979), pp. 64-73.
6. Robert D. Buzzell, Donald F. Cox, and Rex V. Brown, Marketing Researchand Information Systems: Text and Cases (New York: McGraw-Hill, 1969), p. 133.
7. Harry L. Davis and Benny P. Rigaux, “Perceptions of Marital Roles in Deci-sion Processes,” Journal of Consumer Research, (July 1974), p. 57.
8. Selina Guber, “The Teenage Mind,” American Demographics, (August1987), pp. 42-44.
9. Michael D. Hutt and Thomas W. Spegh, Industrial Marketing Management(Hinsdale, IL: The Dryden Press, 1985), pp. 65-69.
10. Thomas C. Kinnear and James R. Taylor, Marketing Research (New York:McGraw-Hill, 1996), p. 231.
11. For an in-depth discussion of the measure process see Jim C. Nunnally,Psychometric Theory, Second Edition (New York: McGraw-Hill, 1978); ClaireSelltiz, Lawrence S. Wrightsman, and Stuart W. Cook, Research Methods in SocialRelations, Third Edition (New York: Holt, Rinehart and Winston, 1976); Fred N.Kerlinger, Foundations of Behavioral Research, Third Edition (New York: Holt,Rinehart and Winston, 1986).
12. For a discussion of some of the associations between attitudes and behaviorsee Richard Lutz, “The Role of Attitude Theory in Marketing,” in HaroldKassarjian and Thomas Robertson (Eds.), Perspectives in Consumer Behavior,Fourth Edition (Upper Saddle River, NJ: Prentice-Hall, 1991), pp. 317-339; JohnMowen and Michael Minor, Consumer Behavior (Upper Saddle River, NJ:Prentice-Hall, 1998), p. 263.

13. Gilbert A. Churchill, Jr. and J. Paul Peter, “Research Design Effects on theReliability of Rating Scales: A Meta-Analysis,” Journal of Marketing Research, 21(November 1984), pp. 360-375.
14. Rensis Likert, “A Technique for the Measurement of Attitudes,” Archives ofPsychology, (140, 1932).
Chapter 6
1. Patricia Labaw, Advanced Questionnarie Design (Cambridge, MA: AbtBooks, 1980), p. 12.
2. Ibid., p. 61.3. See Stanley L. Payne, The Art of Asking Questions (Princeton, NJ: Princeton
University Press, 1951); Seymour Sudman and Norman M. Bradburn, Asking Ques-tions: A Practical Guide to Questionnaire Design (San Francisco: Josey-Bass,1982); Jean M. Converse and Stanley Presser, Survey Questions: Handcrafting theStandardized Questionnaire (Beverly Hills, CA: Sage Publications, 1986). Anothergood source on designing and implementing a mail or Internet questionnaire is DonDillman, Mail and Internet Surveys (New York: John Wiley and Sons, 2000).
Chapter 7
1. This section is based upon a discussion in Seymour Sudman and EdwardBlair, Marketing Research (New York: McGraw-Hill, 1998), pp. 375-378. Thisbook is an excellent reference for marketing research sampling issues.
Chapter 8
1. Don A. Dillman, Mail and Internet Surveys (New York: John Wiley andSons, 2000).
2. Technically, sampling frame error could be thought of as one subcategory ofsampling error. However, we will follow convention and describe it here as a non-sampling error, and leave sample error to be that random error described in Chapter 7.
Chapter 9
1. Adapted from Philip Kotler, Marketing Management, Eighth Edition(Englewood Cliffs, NJ: Prentice-Hall, 1994), p. 24.
2. Some reference works for those readers interested in a more in-depth discus-sion of analysis include: For analysis of qualitative research see Matthew B. Milesand A. Michael Huberman, Qualitative Data Analysis (Thousand Oaks, CA: Sage,1994); Norman K. Denzin and Yvonna S. Lincoln (Eds.), Handbook of QualitativeResearch (Thousand Oaks, CA: Sage, 1994); Harry F. Wolcott, Writing UpQualtitative Research (Thousand Oaks, CA: Sage, 1990). For statistical analysis,including multivariate statistical techniques, see Sam Kash Kachigan, StatisticalAnalysis (New York: Radius Press, 1986); Joseph F. Hair, Rolph E. Anderson, Ron-ald L. Tatham, and William C. Black, Multivariate Data Analysis, Fourth Edition

(Englewood Cliffs, NJ: Prentice-Hall, 1995); Harvey J. Brightman, Statistics inPlain English (Cincinnati, OH: South-Western Publishing Co., 1986).
3. It should be noted, however, that there is definitely a place for research find-ings that may not lead to an immediate decision, but which educate decision makersin a more general way. Well-informed, knowledgeable decision makers are valu-able by-products of the analysis of decision-oriented research information. There-fore, researchers would not fail to report findings that may not in themselvessuggest a decision, but which serve to edify management in important ways aboutthe company’s markets, customers, or significant trends in the environment.
4. We will assume that the researcher/analyst has a computer printout thatshows both the mean and standard deviation (and standard error of the mean) for theintervally scaled questions in the survey. Readers who desire more information onhow to compute and interpret standard deviations and other descriptive or inferen-tial statistics are referred to any of the standard statistical texts such as StatisticalAnalysis and Statistics in Plain English.
5. Quoted in Bartlett’s Familiar Quotations (Boston: Little, Brown and Co.,1980), p. 595.
6. See Statistical Analysis, pp. 342-356.
Chapter 10
1. Much of this discussion of hypothesis testing is adapted from Harvey J.Brightman’s Statistics in Plain English (Cincinnati, OH: South-Western PublishingCo., 1986), pp. 160-173.
2. See Paul Newbold, Statistics for Business and Economics (Englewood Cliffs,NJ: Prentice-Hall, 1991).
3. Fred N. Kerlinger, Foundations of Behavioral Research, Third Edition (NewYork: Holt, Rinehart and Winston, 1986).
4. Joseph F. Hair, Rolph E. Anderson, Ronald L. Tatham, and William C. Black,Multivariate Data Analysis, Fourth Edition (Englewood Cliffs, NJ: Prentice-Hall,1995).
5. Foundations of Behavioral Research.6. David A. Aaker and George S. Day, Marketing Research: Private and Public
Sector Dimensions (New York: John Wiley and Sons, Inc., 1980).7. Multivariate Data Analysis.
Chapter 11
1. Kenneth Roman and Joel Raphaelson, Writing That Works (New York:Harper and Row, 1981); William Strunk, Jr. and E. B.White, The Elements of Style,Third Edition (New York: Macmillan, 1979); William Zinsser, On Writing Well,Third Edition (New York: Harper and Row, 1985); Tim J. Saben, Practical Busi-ness Communications (Burr Ridge, IL: Irwin/Mirror Press, 1994); David Morrisand Satish Chandra, Guidelines for Writing a Research Report (Chicago: AmericanMarketing Association, 1993).


Index
Page numbers followed by the letter “e” indicate exhibits; those followed by theletter “f” indicate figures; and those followed by the letter “t” indicate tables.
Aaker, David A., 103Abstract, making real, 87-88A.C. Nielsen Company, 43, 57Accuracy, 65, 125-126, 125f. See also
Reliability; Validityin record keeping, 191
Ad hoc (one time), 99Administration of questionnaire,
method of, 148Advertising penetration, 7Age, 65AIOs, 81Almanac of Business and Industrial
Financial Ratios, 72Alsop, Ronald, 128Alternative form, measurement, 123Alternative hypothesis, 226, 237Alternatives, 4f, 5, 205American Marketing Association, 2American Statistics Index, 74Analysis
of research findings, 112f, 116written, 92
Analysis of variance, 45ANOVA (Analysis of Variance) test,
230, 232Anthropomorphicizing, 35“Anything goes” approach, 11Appendixes, section of report, 263,
263f-268fApproach, of interviewer, 184Arbitron radio market reports, 71Artificial settings, 49-50Assignment, sample, 20, 62Association, measures of, 233-241Attention to detail, importance of, 273
Attitude, interviewer, 188Attitude measurement, 127-131Attitudinal data, 4, 81Audience, 243Availability, 64Awareness, 82Ayer Directory of Publications, 74
Banks and Finance, 73Banner, 213-215, 214fBar chart, 270, 271fBarometer, 89Behavior
as measurement, 117, 117tmultiplicity of, 130predictable, 128e-129eand primary data, 83
BehaviorScan, 43, 71Beliefs, reinforcing, 88Bias, 23, 85, 159Binding final report, 263Bipolar scale, 133-134Bivariate association, 233-238, 234f,
235t, 238Body/content, questionnaire, 153Brand switching, 43-44, 44tBrand usage, 7Briefing, 190Budget, 179-180Bureau of the Census Catalog, 74Burke, test market firm, 59Business Conditions Digest, 74Business Cycle Developments, 74Business Periodicals Index, 74Business Publication Rates and Data, 77

Business Statistics, 74Buyers, as measure, 119Buying-center concept, 118-119
Canonical correlation, 239Case analysis, 33-34Causal research, 21, 44-46
data-collection methods used, 108tlimitations of, 55and observation, 60-61
Cause and effect, variables and, 29Cautionary notes, 29Census of Business, 74Census of Manufacturers, 74Census of Retail Trade, 75Census of Selected Service Industries,
75Census of the population, 71Census of Transportation, 75Census of Wholesale Trade, 75Central Limit Theorem, 170Central location interviewing, 101, 181Central location test (CLT), 181Central tendency measures, 210-212,
210fChat rooms, Internet surveys in, 182“Check all that apply,” 208Checklist, focus groups, 88Chee-tos, 1-2Chester Cheetah, 1-2Chi-square tests, 45, 221, 230t
and correlation, 236-238Choice, 5, 19Clarification, probing as, 191-193, 194fClassification section, questionnaire, 153Clay, Henry, 176Closure, 189Cluster analysis, 240-241Cluster samples, 165Coca-Cola, 128eCollages, 35Collection methods, 84-85. See also
Data collection; Data-collection instrument;Questionnaire
“Comfortable” research methods, 12Commodity Transportation Survey, 75Commodity Yearbook, 75Communication, report as form of, 243
Communication method, datacollection, 84-85, 86-96
Comparative rating scales, 135, 138tCompeting hypotheses, 226Competitive analysis, 8
and small organizations, 9Competitive data sources, 72-74Competitive pricing, 6Completely Automated Telephone
Surveys (CATS), 98Composition, focus group, 89Compton Company, 15-16, 17, 23, 29,
36-37Computer presentation, 276-277Computer survey, 96t, 102-106, 103t,
104tComputer-assisted data-collection
methods, 103t, 104t. See alsoInternet research
Computer-assisted telephoneinterviewing (CATI), 97
Concept testing, 6-7Conclusions, section of report, 260,
260f-263fConcomitant variation, 45Conjoint analysis, 241Consistency, internal, 123“Constant,” 46Construct(s) of interest, 111, 112fConstruct validity, 124-125Consumer data sources, 71-72Consumer market and magazine report,
71Content validity, 123Contextualizing information, 141, 142t,
206Continuous variables, 118Control, 45, 46Control group, 48, 52-53, 54Controlled store test markets, 58-59Convenience sample, 166Conventional research, 10-12, 11fCooperation
in interview, 183lack of, 85
Copies of final report, 263Copy testing, 7Correlation, 45
chi-square test, 236-238. See alsoChi-square tests

Correlation (continued)Pearson product moment, 235-236, 236tSpearman rank-order, 236
Cost, 84, 85, 158County and city data book, 72County Business Patterns, 75Cronbach’s alpha, 123Cross-sectional designs, 41-42, 43tCross-tabulation, 212-221Curle, David, 70Curvilinear, 233, 234fCustom Research, Inc., 59Customer research, 9Customer satisfaction studies, 9
Dacko, Scott G., 104Data bit, 203-204Data collection, 24
errors in, 195-196, 195fmethodology, 21and testing measures, 112f, 114-115
Data errors, 198Data mining, 66-67Data sources, 71-78Data summary, 206-212Data trustworthiness, 116Data-analysis, 20, 21-22
definition of, 202, 203fData-collection forms, designing, 22Data-collection instrument, 22, 139-141.
See also QuestionnaireDay, George S., 103“Debugged,” 24Deciders, as measure, 119Decision alternatives, identifying, 15-16Decision errors, cost of, 227-228Decision making, 3-5Decision model, sampling, 160-163,
161fDecisional criteria, determining, 16-17Demographic/socioeconomic data, 80-81Dependent variable, 214Descriptive communication, 95-96Descriptive research, 21, 28-29, 37-44
data-collection methods used, 108tand interviewing, 32-33and observation, 60-61, 85
Design, research, 20-21cross-sectional, 41-42, 43t
Design, research (continued)and defining by technique, 61-62,
61tlongitudinal studies, 43-44, 44t
Dichotomous questions, 149Dillman, Don, 105, 183Direct observation, 107Directories of Federal Statistics for
Local Areas, and for States,75
Directory of Corporate Affiliations, 72Directory of Directories, 66Directory of Federal Statistics for
Local Areas, 75Directory of Intercorporate Ownership,
72Discrete variables, 118Dispersion, 120, 210-212, 210fDistribution channel, 80Domain, specifying, 111-113-112f“Don’t know” response, 131-132, 150,
209-210Door-to-door interviewing, 100-101,
101t, 102t, 181Dummy tables, 40, 41t
EBSCOHOST, 67, 78Economic Almanac, 75Economic Census, 77Economic Indicators, 75Efficiency of interviewer, 191Egg substitute survey, 202-205E-mail surveys, 103Encyclopedia of Associations, 66, 78Environment, primary data and, 80Equal-appearing intervals, 22Error
reducing in decision making, 3in sampling, 158, 159, 160, 163
Ethics, 51Ex post facto research, 55-56Execution stages, 24Executive interviewing, 181-182Executive Summary, 92, 247-248,
248f-250fExperimental designs, 48Experimental research designs, 51-54Experimental treatments, 47Experimental units, 48

Experimentationdescription of, 46-47design symbols, 50-51and ethics, 51field versus laboratory, 50and research design, 51-54terminology of, 47-48and validity, 48-50
“Expert opinion,” 166, 176Exploration, 28Exploratory communication, 86-95Exploratory research, 21, 30-37
data-collection method used, 108tand observation, 60-61
External secondary data sources, 66External validity, 48, 49-50Eye tracking equipment, 107
F and S Index, 76Face-to-face method. See Personal
interviewsFactor analysis, 239Factors, eliminating causal, 46Fail to reject (FTR), 225False relationship, 219-220, 220fFax survey, 96t, 106Federal Reserve Bulletin, 76Field experiments, 50Field service operation, planning,
179-180Findings, section of report, 248,
250f-260fFive Ws, 38-39Flaschner, Alan B., 121Flexibility, 20-21, 31, 64Focus groups, 33, 86-95Follow-up questions, 30Formulas, sample size, 169-173Fortune Directory, 72Fortune Double 500 Directory, 73Frank, Nathalie, 76Frequency distributions, 207-209Friends, avoid interviewing, 190Frito-Lay, 1-2
Gatekeepers, 118Gates, Roger, 230General advice, written report, 273-276
Gillette Company, The, 88Goldman, Alfred E., 92Good measures, developing, 111-116,
112fGovernment Web sites, 70Grand Total column, 213Graphs, in written report, 270, 271f-272f,
275Gross national product (GNP), 75Group moderator, 33, 86Guide to Consumer Markets, 72Guidelines, written report, 269-276
Handbook of Economic Statistics, 76Harris survey, 71Hartley, Robert F., 121Headings
banner, 215in written report, 276
Healthy skepticism, 226Historical Statistics of the United States
from Colonial Times to 1957,72
History, as threat, 48-49Home telephone interviewing, 96-97, 96tThe Home Testing Institute, 42, 98Huxley, Thomas, 220Hypotheses, 18, 19-20, 38Hypothesis testing, five steps, 224-233,
230t
Idea generation, 87Identification
of alternative, 4f, 5of opportunity, 3-4, 4fof problem, 3-4, 4f
Image evaluation, 7Implications, information and, 204-205“In the field,” 46Independent variable, 214Index of business, Web, 67Influencers, 118Information, 4
as advantage in sampling, 158determining what is needed, 147-148providing right amount, 143strategic versus tactical, 6
Information pieces, 204Information systems, 24-25Informed decisions, 79Insight, 32In-store intercepts, 181Instructions, following all, 190-191Instrumentation, 49Intentions, 82Interactive Voice Response (IVR)
systems, 97Intercepts, 101Internal secondary data sources, 66Internal validity, 48-49Internet focus groups, 93-94Internet research, 102-103, 103t,
105-106Internet search strategies, articles for,
70Internet surveys, 182-183Interpretation, cross-tabulations, 217-218Interval scale, 120, 121t, 235t, 274Interview
central location, 101, 181closure, 189door-to-door, 100-101, 101t, 102t,
181executive, 181-182in-store intercepts, 181length of, 185-186mall-intercept, 101, 181personal, 32-33, 96t, 99-102, 101t,
102t, 181-182telephone, 96-98, 96t, 98t, 182types of, 181-183vendor/dealer/executive/
professionals, 101-102Interviewer
approach of, 184attitude of, 188bias, 85familiarity with questionnaire, 186guidelines for, 180and legibility, 186method of asking questions, 187negativity, avoiding, 187and probing, 14-16, 191-193, 194fand rapport, 100, 143, 183-184use of “X,” 188verbatim recording of responses,
187-188
Introductionquestionnaire, 152-153section of report, 245, 247f
IRC (Internet Relay Chat), 93Itemized rating scales, 131-133, 137t
Judgment sample, 166
Kerlinger, Fred, 239Key management issues, 13Kleenex, 22Klopper, Susan M., 70Kolmogorov-Smirnov test, 230tKumar, V., 103
Labaw, Patricia, 140, 142Laboratory experiments, 50Langer, Judith, 88Left-to-right notation, 51Legibility, interviewer, 186Length
focus group session, 89questionnaire, 152
Level of significance, decisions, 228-229Lexis, 68Likert, Rensis, 133Likert scales, 133-134, 137tLikert technique, 22Limitations, causal research, 55Line chart, 270, 272fLinear, 233, 234fLiterature review, 31-32Location studies, 8Lockbox approach, 99Longitudinal studies, 43-44, 44tLonglast lightbulb case, 225-231Low cost, 64
“Magic” number, sample size, 175-176Mail and Internet Surveys, 183Mail panel research, 99Mail surveys, 96t, 99, 100t, 182Mall-intercept interviewing, 101, 181

Managementand alternatives, 5and decision making, 4and research design, 28tstrategic versus tactical decisions, 6
Management problem, defining, 12-15Managerially significant differences, 223Manipulation, 45Man-on-the-street interviews, 166M/A/R/C, 59Market acceptance, rate of, 56. See also
Test marketMarket Analysis, 76Market data sources, 74-77Market Facts, 42, 97Market feasibility, 8Market Guide, 76Market measurement, 8Market oriented, 1Market research, Web sites, 69-70Market segmentation, 8, 212, 212fMarket sensitive, 1Market size studies, 8Marketing implications, 92Marketing Information Guide, 72“Marketing Information Portal
Company,” 69Marketing News, 129Marketing orientation, 111, 112-113Marketing research
and decision marking, 3-5definition of, 2nature of, 6-12types of. See Causal research;
Descriptive research;Exploratory research
Web sites for, 68-70Marketing research firms, Web sites, 70Marketing research project, steps in
analyze and interpret data, 24data collection, 21, 24data-analysis methods,
determination of, 21-22management problem, defining 12-15objectives, stating, 18-20research design, 20-21research purpose, specify, 15-18results, presenting, 24sampling methods, define, 22-24state research objectives, 18-20
Marketplace Information, 68Maslow’s hierarchy, 239Mass market, 105Maturation, 49McDaniel, Carl, 230McDonald, Susan S., 92Mean, 210, 211-212, 211t, 229Meaningful relationships, 220Measure, 45Measured value, 122Measurement
of characteristics of respondent,141, 143
definition of, 109-111process of, 111-116, 112fof psychological variables, 127-138reliability of, 122-123, 125-126scales, 119-121, 131-138types of, 117-118, 117tvalidity of, 123-126
Measures of association, 233-241Measuring Markets, 76Mechanical observation, 107Median, 210Merchandising, 76Meta-sites, Web, 68-69Metric variables, 235Middle Market Directory, 73Million Dollar Directory, 73Mode, 210Moderator, 33, 86, 91Money, 179-180Monotonic, 233, 234fMonthly Labor Review, 76Moody’s Industrial Manual, 73Moody’s Investors Services, Inc., 78Moody’s Manual of Investments, 73Morris, Betsy, 129Mortality, 49Motivation, 83Multichotomous questions, 149-150Multidimensional scaling (MDS),
239-240Multiple discriminate analysis, 238-239Multiple regression, 238Multiple variable, 238-241Multiplicity of attitudes, 1300Multiplicity of behaviors, 130Multivariate association, 238-241Municipals and Governments, 73Music association, 35

NAICS code, 81National Family Opinion (NFO), 42,
97-98National Purchase Diary Panel (NPD),
71National Travel Survey, 75Needs, consumer, 87
and use of neural network, 67Negative relationship, 233, 234fNegativity, avoiding, 187“New” Coke fiasco, 128eNewsgroups, Web, 67Nexis, 68NextCard, Inc., 67Nielsen retail index, 71Nielsen television index, 71“No opinion” response, 131-132, 150,
209-210Nominal scale, 119, 121t, 235tNonequivalent control group, 54Nonmonotonic, 233, 234fNonprobability, 23, 106Nonprobability samples, 165-167
versus probability, 167-168Nonquantifiable values, 215, 216fNonresponse errors, 197-198Nonsampling error, 160, 195
types of, 196-198Nonstatistical determination, 174-176“Not at home,” 197NPO Research, 59Null hypothesis, 226, 227t, 230-231,
237
O, design symbol, 51Objectives
of exploratory research, 31section of report, 245, 247fstating, 18-20, 141
Observation, 60-61, 106-107Observation method, data collection, 85Ojala, Marydee, 70Omnibus panels, 42One-group pretest-posttest, 52One-shot case study, 52Open-ended questions, 83, 145-146,
149Openings (options), 5Operational environment, 10
Operationalized measures, 112f, 113-114Opportunity
defining a, 4-5, 4f. See alsoExploratory study
identifying an, 3-4, 4fOptical scanners, 60Oral reports, 276-278Ordinal scale, 119-120, 121t, 235tOrganization, and primary data, 80
P, statistical significance statistic as,235
Parallel processing technology, 67Parker Pen, 42Pearson product moment correlation,
235-236, 236tPeople meter, 107Pepsi AM, 1-2Perceptual maps, 239-240, 240fPersonal interviews, 32-33, 96t, 99-102,
101t, 102t, 181-182Personnel, 180Phone banks, 96t, 97-98Pie chart, 270, 271fPlan of analysis, 206-207“Polite negative,” 150Poor fit, 65Population, of study, 22-23, 157
determining, 160, 161fPortals, Web, 67Positioning studies, 8Positive relationship, 233, 234fPostquantitative research, 87Posttest-only control group, 53Practical, sampling as, 158Pragmatic validity, 124Precoding, 153Predicasts, 76Predictive behavior, 128e-129ePredictive dialing, 97Predictive validity, 124Preexperiemnt, 52Presentation, report, 263Presentation software, 276-277Pretest, 5, 153-154Pretest-posttest control group, 52-53Pricing, competitive, 6Primary data
collection methods, 84-85

Primary data (continued)sources of, 80types of, 80-83
Probability, 23, 105Probability sampling, 163, 165, 229
versus nonprobability, 167-168Probing, 14-16, 191-193, 194fProblem
defining a, 4-5, 4f. See alsoExploratory study
identifying a, 3-4, 4fProduct placement, 7Product testing, 6-7Product usage, 7Professional interviewing, 101-102“Professional respondents,” 42Projective techniques, 34-35, 83Projects, research. See Tip boxesPrough, George E., 121Psychographics/lifestyle data, 81-82Public Affairs Information Services
Bulletin (PAIS), 76Public opinion surveys, 7Public Utilities, 73Purifying measures, 112f, 115
Quads, 93Quality, 65“Quantifiably precise,” 61Quantifier, descriptive research as, 38Quasi experiments, 53-54Questionnaire. See also Interview;
Interviewer; Questionsbody/content, 153classification section, 153coding of, 153as data-gathering instrument, 139-141designing a, 147-154and field-service operation, 179-180goals of, 141-143, 142tintroduction, 152-153length of, 152pretesting, 5, 153-154security of completed, 189structuring, 87validation, 189
Questions, 14-16, 18, 19-20classification of, 143-147continuum of answers to, 79f
Questions (continued)follow-up, 30method of asking, 187sequence of, 152types of, 149-151wording of, 151-152
Quota sample, 166-167Quotes, in report, 275-276
R, design symbol, 51R, Pearson product moment correlation
as, 235Rand McNally Commercial Atlas and
Marketing Guide, 72Random error, 159Random sample, 164, 230tRank-order scales, 134-135, 138tRapport, 100, 143, 183-184Ratio scale, 120-121, 121t, 274Reader’s Guide to Periodical
Literature, 77Recommendations, section of report,
260, 260f-263fRecord keeping, accuracy in, 191Recruitment, focus group, 90-91“Redlining,” 67Reference Book of Corporate
Managements, 73Refusal nonresponse, 197-198Regression, 45, 49“Reinventing the wheel,” 64Reliability, 122-123, 125-126Representative, 163Research, types of. See Causal
research; Descriptiveresearch; Exploratory research
Research associations, Web sites, 69Research methodology, report, 246,
248fResearch objectives, report, 245, 247fResearch projects. See also Tip boxes
fielding of, 189-195Research purpose, specifying, 15-18
sample, Compton Company, 17Research questions. See QuestionsResearch reports
format, 244-268guidelines for, 269-276Web sites, 68-69

Resource simulations, 176Respondents
choice of, 19measuring characteristics of, 141, 143qualified, 185rapport with, 100, 143
Results, researchof focus groups, 91-92presenting, 24
Retention rates, 204, 212Revision, report, 275-276Risk reduction, 5Roadmap, research design as, 27, 63Role-play, 35Roper reports, 71“Rules for assigning numbers,” 109-110
Sales Management Survey of BuyingPower, 72
Sample, selection of, 161f, 163Sample size, 23, 162-163, 161f, 168
and expert opinion, 176formulas, 169-174“magic” number, 175-176and resource simulations, 176using “typical,” 175, 175t
Sample survey, 41Sampling
advantages of, 158-159decision model, 160-163, 161fdefinition of, 157-158error in, 159methods, 22-25nonprobability, 165-167
versus probability, 167-168probability in, 163-165
versus non, 167-168statistics and, 168-177
Sampling error, 158, 159, 160, 163Sampling frame, 161-162, 161f
errors, 196-197Sampling method, 161f, 162Scales, 119-121, 131-138, 150-151Scanner, 60, 85, 95Schlitz beer, 30-31Search engines, Web, 67Search strategies, Web, 67Secondary data
advantages of, 64
Secondary data (continued)disadvantages of, 65external sources of, 66internal sources of, 66use of, 63-64Web resources, 67-70
Securityof questionnaire, 189sampling and, 159
Selectionalternative, 4f, 5as threat, 49
Semantic differential, 22scales, 135-136, 138t
Sentence completion, 34Separate sample pretest-posttest, 54Sequence, of questions, 152Sequencing
of contact methods, 194-195focus groups, 94-95
Set-up time, 105Seven-point scale, 133Sheldon’s Retail Directory of the
United States and Canada, 73“Shopping Mall for Market Research,”
68Significance level, decisions, 228-229Simmons MRB Media/marketing
service, 71Simulated test markets, 59Single cross-tabulations, 215fSlides, use of in oral reports, 276Small organization, marketing research
for, 9-10Snowball sample, 166Solutions, research design and, 28fSources, identifying, 148Spearman rank-order correlation, 236Specifications of study, 190Speed, 64, 84SPSS, software, 213, 221, 231t, 235, 237Spurious relationship, 219-220, 220fStaff, field-service operation, 180Standard and Poor’s Industry Survey, 77Standard and Poor’s Register of
Corporations, Directors, andExecutives, 73
Standard and Poor’s Trade andSecurities Statistics, 77
Standard Corporation Records, 78

Standard deviation, 229definition, 211formulas, 169-173
Standard error, 168,formulas, 169-173
Standard operating procedure (SOP),209
Standard test markets, 57-58Stapel scales, 136, 138tStarch readership reports, 71STATA, software, 231State Manufacturing Directories, 73States of being, 117, 117tStates of mind, 117, 117tStatic-group comparison, 52Statistical Abstract of the United States, 77Statistical analysis, 223-224, 229, 230tStatistical information, recording, 189Statistical regression, 49Statistical significance, 220-221Statistically significant differences, 223Statistics
avoiding heavy use of in reports,273-274
and sampling, 168-177Statistics of Income, 77StatSoft, software, 231tStep-by-step progression, 248, 250f-260fStorytelling, 34Strategic decisions, 6Strategic versus tactical information, 6Stratified samples, 164-165Strength of association, 236tStructured-disguised questions, 144-145Structured-undisguised questions, 144Stub, 213Subject selection, 49Sudman, Seymour, 175Supervisor assistance, 190Supporting documentation, report, 263,
263f-268fSurvey of Current Business, 77Survey research, 95-96
methods of, 96-106Survey Research Center, University of
Michigan, 82Surveys
by mail, 182via the Internet, 182-183
Symbols, experimental design, 50-51
Syndicated data sources, 70-71Systemic samples, 165
T test, 230tTable of contents, section of report,
244-245, 246fTables
cross-tabulations, 213-216in written report, 269-270, 269f, 270f
Tactical decisions, 6Taste test, 8Technique, 61-62, 61tTelephone communication, 98Telephone interviewing, 96-98, 96t,
98t, 182Test market, 5, 7
decision to, 57rate of market acceptance, 56types of, 57-59
Test site, selection of, 58Testing, as threat, 49Test-retest reliability, 122-123“Thinking like a decision maker,” 39Third-person technique, 35Thomas Register of American
Manufacturers, 73“Three-dimensional” perspective, 82, 88Three-way cross-tabulation, 218-220,
219tThree-way focus groups, 93Time economy, 158Time order of occurrence, 45Timing and significance, decisions, 17Tip boxes, 13
data analysis, 221descriptive research, 39exploratory research, 37field-service, 199-200and hypotheses, 20objectives, research, 10probing questions, 17questionnaires, 154research design choice, 30research questions, 18, 19research results, 86sampling, 177secondary data, 78statistical analysis, 241and validity, 126

Tip boxes (continued)“what if” questions, 16“why” questions, 15
“Tipping” your hand, 144Title page, section of report, 244, 245f“Too busy” response, 185-186Tracking study, 7Trade-off analysis, 241Training sessions, 190Transparencies, use of in oral reports, 276Transportation, 73Trends, focus groups, 92-94Trial-to-usage rates, 204, 212Truck Inventory and Use Survey, 75True differences, 123True experiment, 52-53True panels, 43True value, 122“Truth,” 10Two-way cross-tabulation, 217tTwo-way focus groups, 92Type 1 error, 227-228, 232Type 2 error, 227-228, 232“Typical” sample sizes, 175, 175t
Unconventional research, 1-12, 11fUNISTAT, software, 231tUnivariate technique, 238Universe, of study, 22-23, 157
determining, 160-161fUnstructured-disguised questions,
145-147Unstructured-undisguised questions, 145U.S. Industrial Outlook, 77“Useful marketing information,” 13User-provider interaction, 13Users, as measure, 118
Validation questionnaire, 189Validity
and experimentation, 48-50
Validity (continued)and measurement, 123-126tests, 112f, 115
Value, of exploratory research, 35-37Value-added management, 202Variables, cross tabulations, 216Verbatim, recording of responses,
187-188Versatility, 84Viable alternatives, 5Visual aids, 277-278Voluntary response, 106
Wall Street Journal Index, 74Web browsers, 67Web chat, 93Web sites
interviews and, 183secondary data sources, 67-70
Web surveys, 103, 105“Weblining,” 67“What if” questions, 15-16“Why” questions, 14-15. See also Five
WsWide area telephone service (WATS),
97Wilde, Oscar, 35Word association, 34“Work for,” hypotheses, 19-20Worthington Foods (Kellogg’s) survey,
202-205
X, design symbol, 50X, use of on questionnaires, 188
Yankelovich Clancy Shulman, 59
Z test, 230t
