markets and economic update - pasadena, california
TRANSCRIPT


CITY OF PASADENA 457 Deferred Compensation Plan
June 30, 2018 Performance Report

TABLE OF CONTENTS
Section 1 Market Overview
Section 2 Account Review Section 3 Investment Performance Review Section 4 Plan Fee/Revenue Review Section 5 Fund Attribution

Section 1

Markets and Economic Update Second Quarter 2018
TRADE WARS – “THE SAGA CONTINUES” In our first quarter market commentary, we touched on initially proposed trade sanctions and the risks of an escalating trade war between the US and China. Escalation continued during the second quarter and broadened in geographic scope. Incredibly, the historical meeting between US President Donald Trump and North Korean Supreme Leader Kim Jong-Un was largely overshadowed by the G7 summit in Quebec. The summit was marked by pointed disagreement between the US and other members on tariff levels and ended with the President leaving early and declining to endorse the joint statement from the summit. Shortly afterward, the US declared tariffs on Canada, Mexico, and the European Union on steel, aluminum and other products. Concurrently, but for different reasons, the US also announced that it would be implementing tariffs on a wider list of Chinese products in response to concerns about intellectual property theft. The recipients quickly responded in-kind, with tariffs on approximately $75 billion worth of American products. The US exports roughly $2.3 trillion worth of goods and services annually, over 30 times the value of the US products in question. Exports in turn are a relatively small component of GDP, which itself stands at roughly $20 trillion in nominal terms. US personal consumption, the major component of GDP, has grown at an average annual rate of nearly $500 billion. This is not to say that these trade impediments will not be harmful to some or ineffective on their targeted industries, rather their aggregate significance does not seem to have been given a proper context ($75 billion being slightly less than the annual gross domestic product of the state of New Hampshire). Despite the recent escalation of trade sanctions, the US financial markets have largely shrugged off any concerns. This would seem to reflect the relatively modest size of current sanctions and the strength of the US economy. History indicates that trade wars restrict long-term economic growth; the strength of the US economy provides the current administration with unique short-term leverage in its attempts to extract concessions from trading partners. The current administration looks poised to accept short-term pain, particularly in domestic agricultural production, in the pursuit of reduced long-term global trade imbalances, improved intellectual property rights and increased domestic manufacturing jobs. The current administration is also betting that the US economy can absorb the impacts of bilateral economic sanctions better than its trading partners. Economic figures would appear to back this up. The US economy is not only the largest economy in the world, it’s also one of the most diverse and dynamic. US personal consumption represents more than 70% of $20 trillion in domestic GDP while total exports represent just over 10% of the total. In short, the US is arguably economically positioned to better withstand the impacts of “tit-for-tat” trade sanctions. While that may be true from an economic position, it may be difficult for the current administration to survive extended protectionist policies. China would appear uniquely positioned to politically outlast any administration subject to public opinion/election. For now, the financial markets appear largely dismissive of the risk inherent in a long-term trade war and content to label the recent escalation as largely posturing.
1

GLOBAL ECONOMIC LANDSCAPE The US economic expansion is entering its 10th year, the second longest on record. The domestic economy added 213,000 jobs in June, but an influx of new jobseekers saw the unemployment rate climb from 3.8 to 4.0 percent. Wage
growth has been trending up modestly, but the current 2.7% growth rate remains well below the 6.2% 50-year average. In response to a continued strong labor market, the Federal Reserve increased the monthly rate at which its combined holdings of Treasury and Agency
securities “roll-off”, from $20 billion in March to $30 billion in May to $40 billion in June. The European Central Bank also announced on June 14th that it will reduce its monthly net purchases of €30 billion to none by year-end. These actions may reduce pricing pressure on conservative fixed income securities.
Five-year US inflation expectations nudged up from 1.92% to 2.07% during the second quarter. Recent quarter-by-quarter fluctuations in expectations have generally been lower than in years past; suggesting the markets believe the Fed will keep annual price increases close to its 2% target.
Eurozone growth topped 2.5% in 2017, the fastest growth rate in over a decade. However, the first quarter of 2018 saw a modest slowdown. While growth in the Eurozone and UK continues to be positive, the slower growth rates are tempering investor expectations for 2018.
At the same time, Eurozone unemployment continues to tick down to the lowest levels (8.4%) in nearly 10 years. Growth in Asia is also showing signs of slowing. The Chinese government recently announced an annualized economic growth target of 6.5% for the
remainder of 2018, down from 6.9%. This slowdown is set to coincide with efforts to reduce bad debt in the financial system while closing inefficient factories. The central government also intends to shrink its budget deficit to 2.6% of GDP from the current 3.0%.
GLOBAL FINANCIAL MARKETS The S&P 500 Index currently trades at 16.1x forward earnings, exactly equal to the 25-year average. Absolute earnings reached another high at the end of
the most recent quarter, noting that 43% of those earnings are generated from outside the US. Profit margins remain at 20-year highs. Strong earnings and profit margins have led to high levels of cash on corporate balance sheets. Flush with cash, dividend payouts and share buybacks are at
20-year highs. In addition, capital expenditures and M&A remain at elevated levels. Small Cap stocks handily outpaced mid and large cap stocks for the quarter and year-to-date periods. Growth stocks continue to dominate value stocks. The domestic yield curve continues to flatten as the Fed increases short-term rates and the long end of the curve remains largely unchanged. The current 5-
year Treasury yields 2.7% while the 30-year Treasury yields 3.0%. A flat yield curve suggests that investors are skeptical about the durability of the current late stage expansion.
The global bond market has grown from just over $10 trillion to over $100 trillion in the last 30 years. The US bond market has gone from representing 61% of the total market to 36%. Other developed market exposure has held steady at just over 40% while emerging market debt has increased from nearly zero to over 20% of the global bond market.
Global markets are increasingly struggling to interpret the impact of an escalating trade war. International developed equity markets broadly lagged US markets while emerging markets were particularly hard hit this quarter.
This report is being provided for informational purposed only. The information and opinions presented in this report do not constitute investment advice and have been obtained from sources believed by Hyas Group to be reliable. Hyas Group makes no representation as to their accuracy or completeness. All opinions expressed herein are subject to change. ©Hyas Group, 2018
2
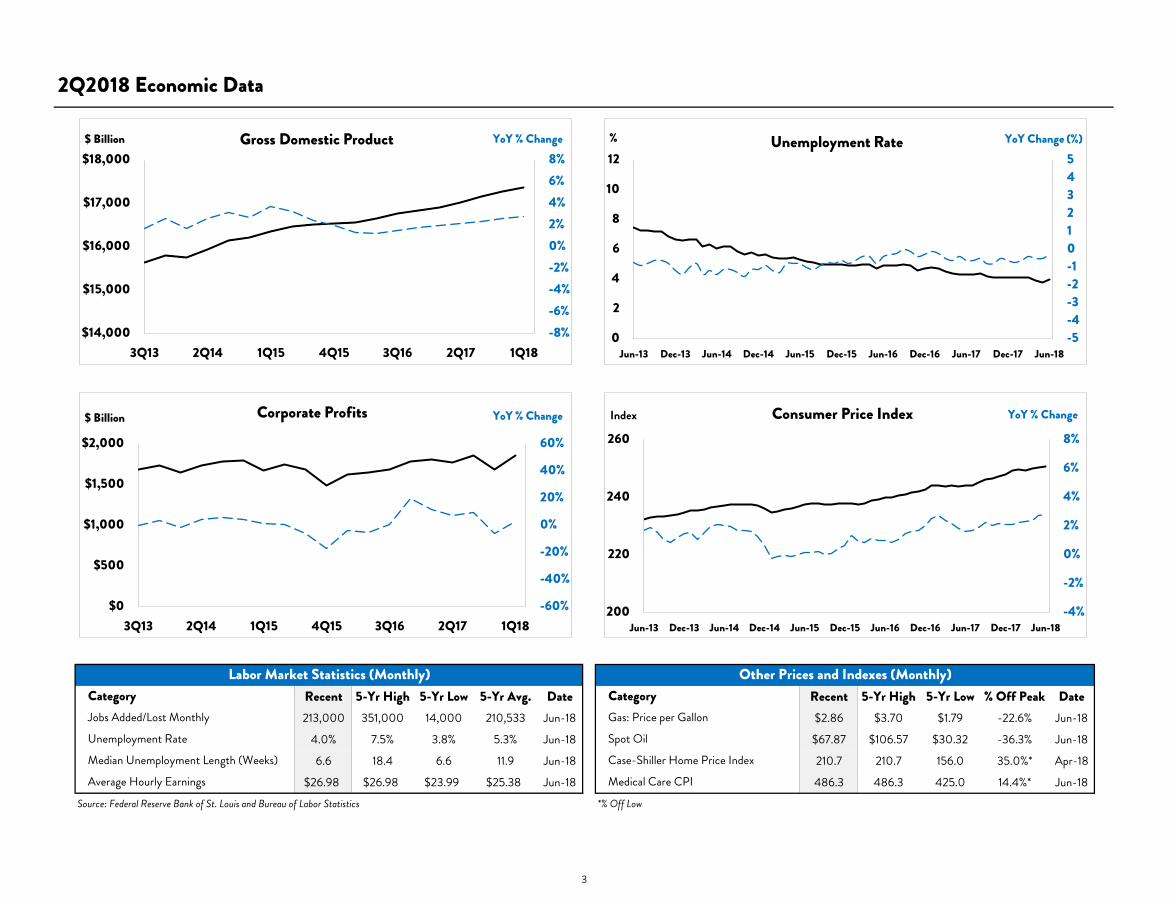
Recent 5-Yr High 5-Yr Low 5-Yr Avg. Date Recent 5-Yr High 5-Yr Low % Off Peak Date213,000 351,000 14,000 210,533 Jun-18 $2.86 $3.70 $1.79 -22.6% Jun-18
4.0% 7.5% 3.8% 5.3% Jun-18 $67.87 $106.57 $30.32 -36.3% Jun-18
6.6 18.4 6.6 11.9 Jun-18 210.7 210.7 156.0 35.0%* Apr-18
$26.98 $26.98 $23.99 $25.38 Jun-18 486.3 486.3 425.0 14.4%* Jun-18Source: Federal Reserve Bank of St. Louis and Bureau of Labor Statistics *% Off Low
2Q2018 Economic Data
Labor Market Statistics (Monthly)CategoryJobs Added/Lost Monthly
Unemployment Rate
Median Unemployment Length (Weeks)
Average Hourly Earnings
Other Prices and Indexes (Monthly)CategoryGas: Price per Gallon
Spot Oil
Case-Shiller Home Price Index
Medical Care CPI
-8%-6%-4%-2%0%2%4%6%8%
$14,000
$15,000
$16,000
$17,000
$18,000
3Q13 2Q14 1Q15 4Q15 3Q16 2Q17 1Q18
YoY % Change$ Billion Gross Domestic Product
-5-4-3-2-1012345
0
2
4
6
8
10
12
Jun-13 Dec-13 Jun-14 Dec-14 Jun-15 Dec-15 Jun-16 Dec-16 Jun-17 Dec-17 Jun-18
YoY Change (%)% Unemployment Rate
-60%
-40%
-20%
0%
20%
40%
60%
$0
$500
$1,000
$1,500
$2,000
3Q13 2Q14 1Q15 4Q15 3Q16 2Q17 1Q18
YoY % Change$ Billion Corporate Profits
-4%
-2%
0%
2%
4%
6%
8%
200
220
240
260
Jun-13 Dec-13 Jun-14 Dec-14 Jun-15 Dec-15 Jun-16 Dec-16 Jun-17 Dec-17 Jun-18
YoY % ChangeIndex Consumer Price Index
3

Index QTR YTD 1 yr. 3 yrs. 5 yrs. 10 yrs.90-Day T-Bill 0.42% 0.73% 1.20% 0.57% 0.36% 0.32%Barclays US Aggregate -0.16% -1.62% -0.40% 1.72% 2.27% 3.72%Barclays Short US Treasury 0.46% 0.78% 1.29% 0.72% 0.48% 0.49%Barclays Int. US Treasury 0.06% -0.69% -0.76% 0.62% 1.03% 2.43%Barclays Long US Treasury 0.31% -3.00% -0.13% 3.40% 4.55% 6.05%Barclays US TIPS 0.77% -0.02% 2.11% 1.93% 1.68% 3.03%Barclays US Credit -0.88% -2.99% -0.65% 2.86% 3.37% 5.15%Barclays US Mortgage-Backed 0.24% -0.95% 0.15% 1.46% 2.25% 3.54%Barclays US Asset-Backed 0.42% 0.03% 0.44% 1.26% 1.44% 3.24%Barclays US 20-Yr Municipal 0.93% -0.60% 2.70% 3.71% 4.68% 5.36%Barclays US High Yield 1.03% 0.16% 2.62% 5.53% 5.51% 8.19%Barclays Global -2.78% -1.46% 1.36% 2.58% 1.50% 2.58%Barclays International -4.76% -1.31% 2.78% 3.23% 0.88% 1.76%Barclays Emerging Market -2.40% -3.84% -1.04% 4.05% 4.46% 6.62%
2Q2018 Bond Market Data
1.77%1.93%
2.11%2.33%
2.52% 2.63% 2.73% 2.81% 2.85% 2.91% 2.98%
0.84%1.03% 1.14% 1.24%
1.38%1.55%
1.89%2.14%
2.31%2.61%
2.84%
0.00%
1.00%
2.00%
3.00%
4.00%
1 mo 3 mo 6 mo 1 yr 2 yr 3 yr 5 yr 7 yr 10 yr 20 yr 30 yr
US Treasury Yield Curve
6/30/2018 6/30/2017
0%
0%
0%
14%
12%
3%
70%
0% 30% 60% 90%
NR
B>
BB
BBB
A
AA
AAA
Barclays US Aggregate IndexCredit Quality
23%
16%
11%
11%
3%
4%
29%
3%
0% 20% 40%
1-3 yrs.
3-5 yrs.
5-7 yrs.
7-10 yrs.
10-15 yrs.
15-20 yrs.
20-30 yrs.
30+ yrs
Barclays US Aggregate IndexMaturity Breakdown
Duration 6.09 yrs.Average Credit Quality AASource: Morningstar Source: Morningstar Source: Morningstar Source: Federal Reserve / Bank of America
Source: Department of US Treasury
7.33
1.63
0.68
8.76
1.46
0.65
0.00 5.00 10.00
CCC
BBB
AAA
US Corporate Credit Spreads1 Yr. Ago Qtr End
3%
1%
0%
22%
27%
1%
46%
0% 50%
Other
CMBS
Non-AgencyMBS
Agency MBS
Corporate
Municipal
US Government
Barclays US Aggregate IndexSector Breakdown
4
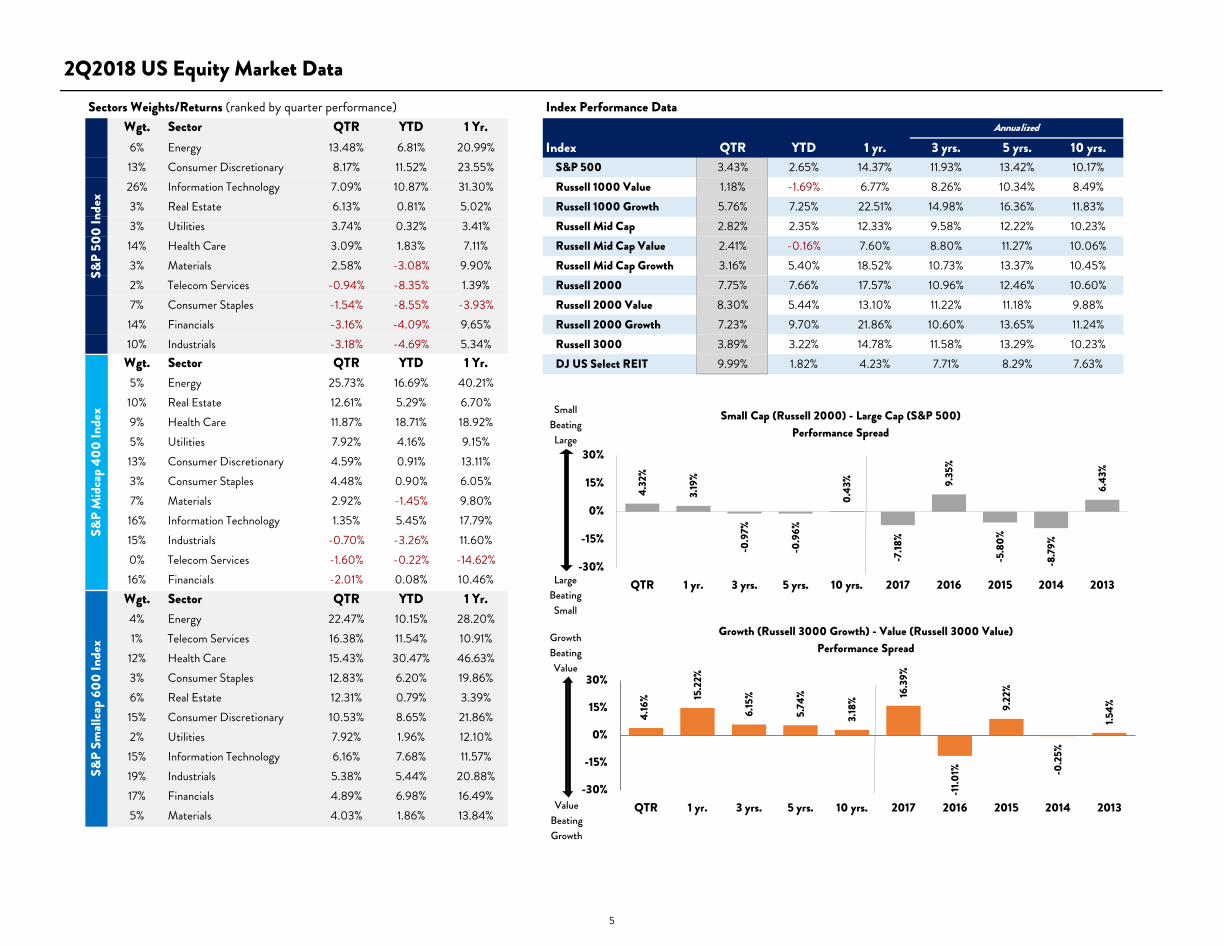
Wgt. Sector QTR YTD 1 Yr.6% Energy 13.48% 6.81% 20.99% Index QTR YTD 1 yr. 3 yrs. 5 yrs. 10 yrs.13% Consumer Discretionary 8.17% 11.52% 23.55% S&P 500 3.43% 2.65% 14.37% 11.93% 13.42% 10.17%26% Information Technology 7.09% 10.87% 31.30% Russell 1000 Value 1.18% -1.69% 6.77% 8.26% 10.34% 8.49%3% Real Estate 6.13% 0.81% 5.02% Russell 1000 Growth 5.76% 7.25% 22.51% 14.98% 16.36% 11.83%3% Utilities 3.74% 0.32% 3.41% Russell Mid Cap 2.82% 2.35% 12.33% 9.58% 12.22% 10.23%14% Health Care 3.09% 1.83% 7.11% Russell Mid Cap Value 2.41% -0.16% 7.60% 8.80% 11.27% 10.06%3% Materials 2.58% -3.08% 9.90% Russell Mid Cap Growth 3.16% 5.40% 18.52% 10.73% 13.37% 10.45%2% Telecom Services -0.94% -8.35% 1.39% Russell 2000 7.75% 7.66% 17.57% 10.96% 12.46% 10.60%7% Consumer Staples -1.54% -8.55% -3.93% Russell 2000 Value 8.30% 5.44% 13.10% 11.22% 11.18% 9.88%14% Financials -3.16% -4.09% 9.65% Russell 2000 Growth 7.23% 9.70% 21.86% 10.60% 13.65% 11.24%10% Industrials -3.18% -4.69% 5.34% Russell 3000 3.89% 3.22% 14.78% 11.58% 13.29% 10.23%
Wgt. Sector QTR YTD 1 Yr. DJ US Select REIT 9.99% 1.82% 4.23% 7.71% 8.29% 7.63%5% Energy 25.73% 16.69% 40.21%10% Real Estate 12.61% 5.29% 6.70%9% Health Care 11.87% 18.71% 18.92%5% Utilities 7.92% 4.16% 9.15%13% Consumer Discretionary 4.59% 0.91% 13.11%3% Consumer Staples 4.48% 0.90% 6.05%7% Materials 2.92% -1.45% 9.80%16% Information Technology 1.35% 5.45% 17.79%15% Industrials -0.70% -3.26% 11.60%0% Telecom Services -1.60% -0.22% -14.62%16% Financials -2.01% 0.08% 10.46%
Wgt. Sector QTR YTD 1 Yr.4% Energy 22.47% 10.15% 28.20%1% Telecom Services 16.38% 11.54% 10.91%
12% Health Care 15.43% 30.47% 46.63%3% Consumer Staples 12.83% 6.20% 19.86%6% Real Estate 12.31% 0.79% 3.39%15% Consumer Discretionary 10.53% 8.65% 21.86%2% Utilities 7.92% 1.96% 12.10%15% Information Technology 6.16% 7.68% 11.57%19% Industrials 5.38% 5.44% 20.88%17% Financials 4.89% 6.98% 16.49%5% Materials 4.03% 1.86% 13.84%
2Q2018 US Equity Market DataS&
P M
idca
p 40
0 In
dex
S&P
Small
cap
600
Inde
xSectors Weights/Returns (ranked by quarter performance) Index Performance Data
S&P
500
Inde
x
Annualized
4.32
%
3.19
%
-0.9
7%
-0.9
6%
0.43
%
-7.18
%
9.35
%
-5.8
0%
-8.7
9%
6.43
%
-30%
-15%
0%
15%
30%
QTR 1 yr. 3 yrs. 5 yrs. 10 yrs. 2017 2016 2015 2014 2013
Small Cap (Russell 2000) - Large Cap (S&P 500)Performance Spread
4.16
% 15.2
2%
6.15
%
5.74
%
3.18
% 16.3
9%
-11.0
1%
9.22
%
-0.2
5%
1.54%
-30%
-15%
0%
15%
30%
QTR 1 yr. 3 yrs. 5 yrs. 10 yrs. 2017 2016 2015 2014 2013
Growth (Russell 3000 Growth) - Value (Russell 3000 Value)Performance Spread
Small Beating Large
Large Beating Small
Growth Beating Value
Value Beating Growth
5

Index Performance Data (net) Top 10 Countries (MSCI AC World ex-USA)
Index (US$) QTR YTD 1 yr. 3 yrs. 5 yrs. 10 yrs. Japan 17%MSCI ACWI ex-US -2.61% -3.77% 7.28% 5.07% 5.99% 2.54% UK 12%MSCI EAFE -1.24% -2.75% 6.84% 4.90% 6.44% 2.84% China 9%Europe -1.27% -3.23% 5.28% 4.22% 6.21% 2.36% France 7%
United Kingdom 2.95% -1.05% 10.02% 3.09% 4.94% 2.66% Germany 7%Germany -3.95% -7.39% 2.55% 5.26% 6.41% 2.53% Canada 6%France -0.46% -0.13% 9.85% 8.66% 8.23% 2.33% Switzerland 5%
Pacific -1.35% -2.02% 9.91% 6.37% 6.93% 3.96% Australia 5%Japan -2.84% -2.03% 10.51% 6.25% 7.37% 3.54% South Korea 4%Hong Kong -1.18% -2.53% 9.18% 6.45% 9.80% 7.69% Taiwan 3%Australia 5.20% -1.27% 8.73% 7.10% 4.96% 3.50%
Canada 4.67% -3.02% 9.12% 4.54% 4.08% 0.66%MSCI EM -7.96% -6.66% 8.20% 5.60% 5.01% 2.26%MSCI EM Latin America -17.75% -11.15% -0.16% 2.00% -2.39% -3.68%MSCI EM Asia -5.85% -5.06% 10.09% 7.31% 8.26% 5.62%MSCI EM Eur/Mid East -8.80% -7.15% 4.89% 1.94% -3.04% -5.20%MSCI ACWI Value ex-US -3.84% -5.28% 4.64% 3.51% 4.75% 2.03%MSCI ACWI Growth ex-US -1.42% -2.28% 9.90% 6.56% 7.18% 3.01%MSCI ACWI Sm Cap ex-US -2.60% -2.94% 10.57% 7.94% 8.98% 5.77%
Exchange Rates QTR 4Q17 3Q17 2Q17 1Q17 4Q16Japanese Yen 110.71 112.69 112.64 112.40 111.41 116.80Euro 0.86 0.83 0.85 0.88 0.93 0.95British Pound 0.76 0.74 0.75 0.77 0.80 0.81Swiss Franc 0.99 0.97 0.97 0.96 1.00 1.02Chinese Yuan 6.62 6.51 6.65 6.78 6.88 6.94
2Q2018 International Market Data
-1.24%
6.84%
4.90%
6.44%
3.47%
6.12%
5.18%
8.93%
-20% 0% 20%
QTR
1 yr
3 yrs
5 yrs
MSCI EAFE Index Return
Local US$
-7.96%
8.20%
5.60%
5.01%
-3.51%
10.47%
7.48%
8.45%
-20% 0% 20%
QTR
1 yr
3 yrs
5 yrs
MSCI Emerging Index ReturnLocal US$
0.0% 3.3% 2.9% 3.0% 3.2%
-20%
0%
20%
QTR 1 yr 3 yrs 5 yrs 10 yrs
MSCI ACWI Ex USLarge v. Small Cap
Performance Spread
2.4% 5.3% 3.1% 2.4% 1.0%
-20%
0%
20%
QTR 1 yr 3 yrs 5 yrs 10 yrs
MSCI ACWI Ex USValue v. Growth
Performance Spread
-5%
2% 2%
-2%
-3%
-4%
1% 3%
-2% 0%
-6%
2%
-6% -3%
-4%
-4%
-4% -2% -1%
0%
-5%
2%
-2%
-2%
0%
-35%
0%
35%
QTR 1 Yr 3 Yr 5 Yr 10 Yr
Foreign Currency v. US$ ReturnsEuro Japanese Yen Pound Sterling Swiss Franc Chinese Yuan
Europe44%
Asia32%
Canada7%
Emerging18%
Regional ExposureMSCI ACWI ex-USA
Small Beating
Large
Large Beating
Small
Growth Beating Value
Value Beating Growth
6

2003 2004 2005 2006 2007 2008 2009 2010 2011 2012 2013 2014 2015 2016 2017 YTD 2Q18Emerging Markets 55.82%
Emerging Markets 25.55%
Emerging Markets 34.00%
Emerging Markets 32.14%
Emerging Markets 39.42%
US Bonds 5.24%
Emerging Markets 78.51%
Small Cap 26.85%
Core Real Estate 14.96%
Emerging Markets 18.22%
Small Cap 38.82%
Large Cap13.68%
Core Real Estate13.95%
Small Cap21.30%
Emerging Markets37.28%
Small Cap7.66%
Small Cap 7.75%
Small Cap 47.25%
Intl 20.91%
Commod. 21.36%
Intl 26.65%
Intl 16.65%
Global Bonds 4.79%
High Yield 58.21%
Mid Cap 25.48%
TIPS 13.56%
Mid Cap 17.28%
Mid Cap 34.76%
Mid Cap13.21%
Large Cap1.38%
High Yield17.12%
Intl27.19%
Core Real Estate3.83%
Large Cap 3.43%
Intl 40.83%
Mid Cap 20.22%
Core Real Estate 20.15%
Small Cap 18.37%
Commod. 16.23%
Cash 1.39%
Intl 41.45%
Emerging Markets 18.88%
US Bonds 7.84%
Intl 16.83%
Large Cap 32.39%
Core Real Estate11.44%
US Bonds0.55%
Mid Cap13.79%
Large Cap21.83%
Large Cap2.65%
Mid Cap 2.82%
Mid Cap 40.06%
Small Cap 18.33%
Intl 16.62%
Large Cap 15.79%
Core Real Estate
14.84%
TIPS -2.35%
Mid Cap 40.48%
Commod. 16.83%
Global Bonds 5.64%
Small Cap 16.35%
Intl 15.29%
US Bonds5.97%
Cash0.03%
Large Cap11.95%
Mid Cap18.52%
Mid Cap2.35%
Core Real Estate 1.82%
High Yield 28.97%
Global Balanced
12.18%
Mid Cap 12.65%
Core Real Estate 15.27%
TIPS 11.64%
Core Real Estate
-10.70%
Small Cap 27.17%
Core Real Estate 15.26%
High Yield 4.98%
Large Cap 16.00%
Global Balanced 14.46%
Small Cap4.89%
TIPS-1.43%
Commod.11.76
Global Balanced15.87%
Cash0.73%
High Yield 1.03%
Large Cap 28.68%
Core Real Estate
12.00%
Large Cap 4.91%
Mid Cap 15.26%
Global Bonds 9.48%
Global Balanced -24.51%
Large Cap 26.46%
High Yield 15.12%
Large Cap 2.11%
High Yield 15.81%
Core Real Estate 12.95%
TIPS3.64%
Global Balanced-1.45%
Emerging Markets11.18%
Small Cap14.65%
High Yield0.16%
TIPS 0.77%
Global Balanced 24.27%
High Yield 11.13%
Small Cap 4.55%
Global Balanced 14.53%
Global Balanced
9.07%
High Yield -26.16%
Global Balanced 20.49%
Large Cap 15.06%
Cash 0.06%
Global Balanced 11.06%
High Yield 7.44%
Global Balanced
3.17%
Mid Cap-2.43%
Core Real Estate7.76%
High Yield7.50%
Commod.0.00%
Cash 0.42%
Commod. 23.93%
Large Cap 10.88%
Global Balanced
4.16%
High Yield 11.85%
US Bonds 6.97%
Small Cap -33.79%
Commod. 18.91%
Intl 11.15%
Global Balanced -0.97%
Core Real Estate 9.76%
Cash 0.07%
High Yield2.45%
Global Bonds-3.15%
Global Balanced
5.38%
Global Bonds7.39%
TIPS-0.02%
Commod. 0.40%
Global Bonds 12.51%
Global Bonds 9.27%
Cash 3.25%
Global Bonds 6.64%
Mid Cap 5.60%
Commod.-35.65%
TIPS 11.41%
Global Balanced
9.40%
Mid Cap -1.55%
TIPS 6.98%
US Bonds -2.02%
Global Bonds0.59%
Small Cap-4.41%
TIPS4.68%
Core Real Estate6.66%
Global Balanced-0.19%
Global Balanced 0.09%
TIPS 8.40%
Commod. 9.15%
TIPS 2.84%
Cash 4.85%
Large Cap 5.49%
Large Cap -37.00%
Global Bonds 6.93%
US Bonds 6.54%
Small Cap -4.18%
Global Bonds 4.32%
Global Bonds
-2.60%
Cash0.04%
High Yield-4.46%
Intl4.50%
US Bonds3.54%
Global Bonds-1.46%
US Bonds -0.16%
Core Real Estate 8.28%
TIPS 8.46%
High Yield 2.74%
US Bonds 4.33%
Cash 4.44%
Mid Cap -41.46%
US Bonds 5.93%
TIPS 6.31%
Commod. -13.32%
US Bonds 4.21%
Emerging Markets -2.60%
Emerging Markets-2.18%
Intl-5.66%
US Bonds2.65%
TIPS3.01%
US Bonds-1.62%
Intl -2.61%
US Bonds 4.10%
US Bonds 4.34%
US Bonds 2.43%
Commod. 2.07%
High Yield 1.87%
Intl -45.53%
Cash 0.16%
Global Bonds 5.54%
Intl -13.71%
Cash 0.08%
TIPS -8.61%
Intl-3.86%
Emerging Markets-14.90%
Global Bonds2.09%
Commod.1.70%
Intl-3.77%
Global Bonds
-2.78%
Cash 1.03%
Cash 1.44%
Global Bonds
-4.49%
TIPS 0.41%
Small Cap -1.57%
Emerging Markets -53.33%
Core Real Estate
-30.40%
Cash 0.15%
Emerging Markets -18.42%
Commod. -1.06%
Commod. -9.52%
Commod.-17.00%
Commod.-24.60%
Cash0.25%
Cash0.71%
Emerging Markets-6.66%
Emerging Markets -7.96%
Global Balanced is composed of 60% MSCI World Stock Index, 35% Barclays Global Aggregate Bond Index, and 5% US 90-Day T-Bills.
Historical Market ReturnsRanked by Performance
7

This page left blank intentionally.
8

Section 2

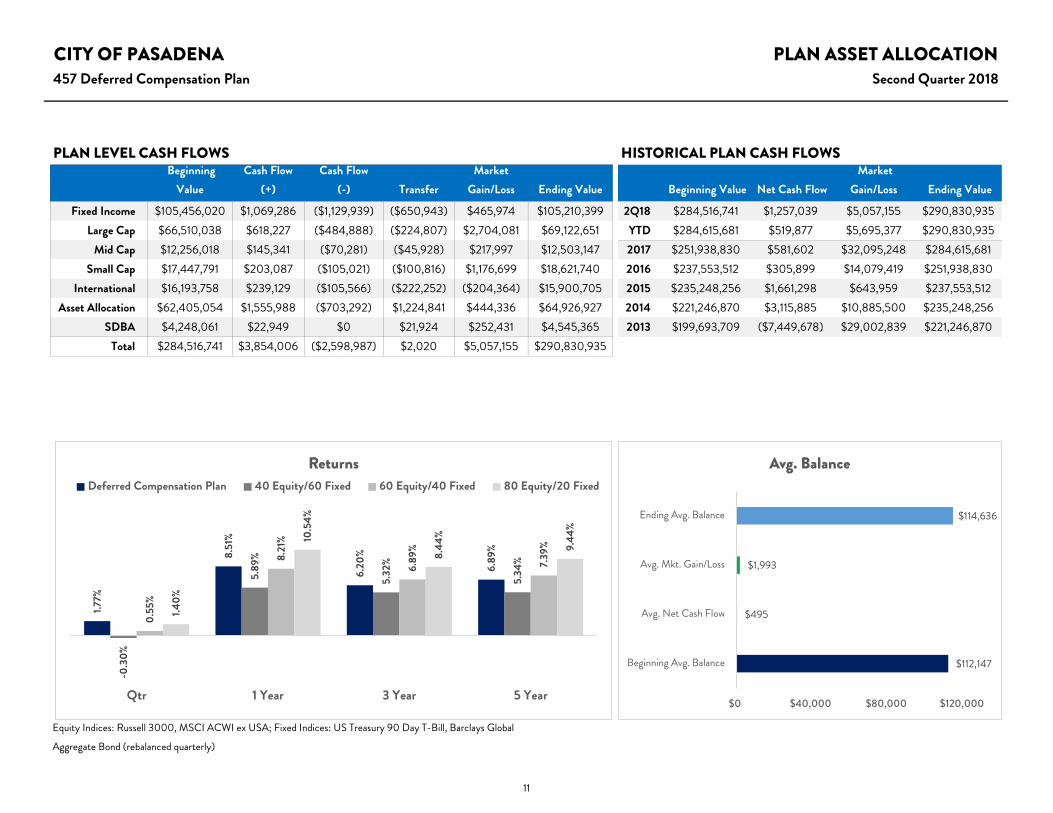
CITY OF PASADENA PLAN ASSET ALLOCATION457 Deferred Compensation Plan Second Quarter 2018
Fixed Income Ticker Assets % International Ticker Assets %Pasadena Custom Stable Value - $97,805,319 32.9% Oppenheimer Global I OGLIX $4,269,645 1.4%DFA Inflation Protection Securities I DIPSX $1,128,148 0.4% Vanguard International Value Inv VTRIX $2,769,343 0.9%BlackRock US Debt Index F - $1,037,145 0.3% Vanguard Total Intl Stock Index Adm VTIAX $857,739 0.3%Metropolitan West Total Return Bond Plan MWTSX $5,239,788 1.8% American Funds EuroPacific Growth R6 RERGX $4,242,536 1.4%
Total $105,210,399 35.4% MFS International New Discovery R6 MIDLX $3,761,441 1.3%Total $15,900,705 5.4%
Large Cap Ticker Assets %Becker Value Equity Instl BVEIX $15,116,847 5.1% Asset Allocation Ticker Assets %BlackRock Equity Index F - $27,686,888 9.3% Vanguard Target Retirement Income Inv VTINX $2,647,258 0.9%MFS Growth R6 MFEKX $26,318,916 8.9% Vanguard Target Retirement 2015 Inv VTXVX $4,990,064 1.7%
Total $69,122,651 23.3% Vanguard Target Retirement 2020 Inv VTWNX $12,305,110 4.1%Vanguard Target Retirement 2025 Inv VTTVX $11,391,042 3.8%
Mid Cap Ticker Assets % Vanguard Target Retirement 2030 Inv VTHRX $8,039,247 2.7%Wells Fargo Special Mid Cap Value R6 WFPRX $3,217,725 1.1% Vanguard Target Retirement 2035 Inv VTTHX $9,864,388 3.3%BlackRock Mid Cap Index F - $4,007,067 1.3% Vanguard Target Retirement 2040 Inv VFORX $4,901,644 1.6%Victory Munder Mid-Cap Core Growth R6 MGOSX $5,278,356 1.8% Vanguard Target Retirement 2045 Inv VTIVX $7,031,853 2.4%
Total $12,503,147 4.2% Vanguard Target Retirement 2050 Inv VFIFX $2,067,476 0.7%Vanguard Target Retirement 2055 Inv VFFVX $1,488,621 0.5%
Small Cap Ticker Assets % Vanguard Target Retirement 2060 Inv VTTSX $190,365 0.1%Victory Integrity Small-Cap Value R6 MVSSX $5,017,541 1.7% Vanguard Target Retirement 2065 Inv VLXVX $9,861 0.0%BlackRock Russell 2000 Index F - $3,227,450 1.1% Total $64,926,927 21.8%Vanguard Small Cap Growth Index I VSGIX $10,376,748 3.5%
Total $18,621,740 6.3% Miscellaneous Ticker Assets %Self-Directed Brokerage - $4,545,365 1.5%Participant Loans - $6,367,653 2.1%
Total $10,913,018 3.7%
TOTAL PLAN ASSETS $297,198,588
9

CITY OF PASADENA PLAN ASSET ALLOCATION457 Deferred Compensation Plan Second Quarter 2018
HISTORICAL PLAN ALLOCATIONAsset Class 2Q18 2017 2016 2015 2014 2013 2012 2011
Fixed Income 35.4% 36.4% 41.6% 42.4% 43.1% 45.7% 52.5% 55.6%Large Cap 23.3% 23.3% 22.5% 23.7% 25.3% 24.2% 21.3% 20.4%
Mid Cap 4.2% 4.5% 4.4% 4.3% 4.8% 4.7% 3.7% 3.6%Small Cap 6.3% 6.1% 6.0% 5.7% 6.0% 6.2% 4.7% 4.7%
International 5.4% 5.6% 4.7% 5.6% 5.7% 6.1% 5.5% 4.9%Asset Allocation 21.8% 20.2% 16.7% 14.1% 10.8% 9.1% 8.3% 7.3%
SDBA 1.5% 1.4% 1.2% 0.8% 0.9% 0.8% 0.7% 0.4%Loans 2.1% 2.5% 2.9% 3.4% 3.4% 3.2% 3.3% 3.1%
*Excludes Fixed Income, Asset Allocation, SDBA, and Loan assets
**Excludes Asset Allocation, SDBA, and Loan assets
Fixed Income35.4%
Equity 39.1%
Asset Allocation
21.8%
SDBA1.5%
Loans2.1%
34.5%34.4%31.3%
29.9%27.8%
25.2%25.9%27.2%
43.0%41.4%
42.9%46.4%
45.5%47.8%46.8%45.1%
22.5%24.2%25.8%23.7%
26.7%27.0%27.3%27.7%
2 Q 1 8
2 0 1 7
2 0 1 6
2 0 1 5
2 0 1 4
2 0 1 3
2 0 1 2
2 0 1 1
E Q U I T Y S T Y L E *
Core Growth Value
86.3%85.8%87.5%
85.8%86.4%85.2%84.3%85.3%
13.7%14.2%12.5%14.2%13.6%14.8%15.7%14.7%
2 Q 1 8
2 0 1 7
2 0 1 6
2 0 1 5
2 0 1 4
2 0 1 3
2 0 1 2
2 0 1 1
B Y E Q U I T Y R E G I O N *
US Non-US
78.7%79.0%80.4%80.9%82.1%83.8%
89.8%98.1%
21.3%21.0%19.6%19.1%17.9%16.2%10.2%
1.9%
2 Q 1 8
2 0 1 7
2 0 1 6
2 0 1 5
2 0 1 4
2 0 1 3
2 0 1 2
2 0 1 1
A C T I V E V P A S S I V E * *
Active Passive
10
CITY OF PASADENA PLAN ASSET ALLOCATION457 Deferred Compensation Plan Second Quarter 2018
PLAN LEVEL CASH FLOWS HISTORICAL PLAN CASH FLOWS Beginning
Value Cash Flow
(+)Cash Flow
(-) TransferMarket
Gain/Loss Ending Value Beginning Value Net Cash Flow Market
Gain/Loss Ending Value
Fixed Income $105,456,020 $1,069,286 ($1,129,939) ($650,943) $465,974 $105,210,399 2Q18 $284,516,741 $1,257,039 $5,057,155 $290,830,935 Large Cap $66,510,038 $618,227 ($484,888) ($224,807) $2,704,081 $69,122,651 YTD $284,615,681 $519,877 $5,695,377 $290,830,935
Mid Cap $12,256,018 $145,341 ($70,281) ($45,928) $217,997 $12,503,147 2017 $251,938,830 $581,602 $32,095,248 $284,615,681 Small Cap $17,447,791 $203,087 ($105,021) ($100,816) $1,176,699 $18,621,740 2016 $237,553,512 $305,899 $14,079,419 $251,938,830
International $16,193,758 $239,129 ($105,566) ($222,252) ($204,364) $15,900,705 2015 $235,248,256 $1,661,298 $643,959 $237,553,512 Asset Allocation $62,405,054 $1,555,988 ($703,292) $1,224,841 $444,336 $64,926,927 2014 $221,246,870 $3,115,885 $10,885,500 $235,248,256
SDBA $4,248,061 $22,949 $0 $21,924 $252,431 $4,545,365 2013 $199,693,709 ($7,449,678) $29,002,839 $221,246,870 Total $284,516,741 $3,854,006 ($2,598,987) $2,020 $5,057,155 $290,830,935
Equity Indices: Russell 3000, MSCI ACWI ex USA; Fixed Indices: US Treasury 90 Day T-Bill, Barclays Global
Aggregate Bond (rebalanced quarterly)
1.77%
8.51
%
6.20
%
6.89
%
-0.3
0%
5.89
%
5.32
%
5.34
%
0.55
%
8.21
%
6.89
%
7.39
%
1.40%
10.5
4%
8.44
%
9.44
%
Qtr 1 Year 3 Year 5 Year
ReturnsDeferred Compensation Plan 40 Equity/60 Fixed 60 Equity/40 Fixed 80 Equity/20 Fixed
$112,147
$495
$1,993
$114,636
$0 $40,000 $80,000 $120,000
Beginning Avg. Balance
Avg. Net Cash Flow
Avg. Mkt. Gain/Loss
Ending Avg. Balance
Avg. Balance
11

This page left blank intentionally.
12

Section 3
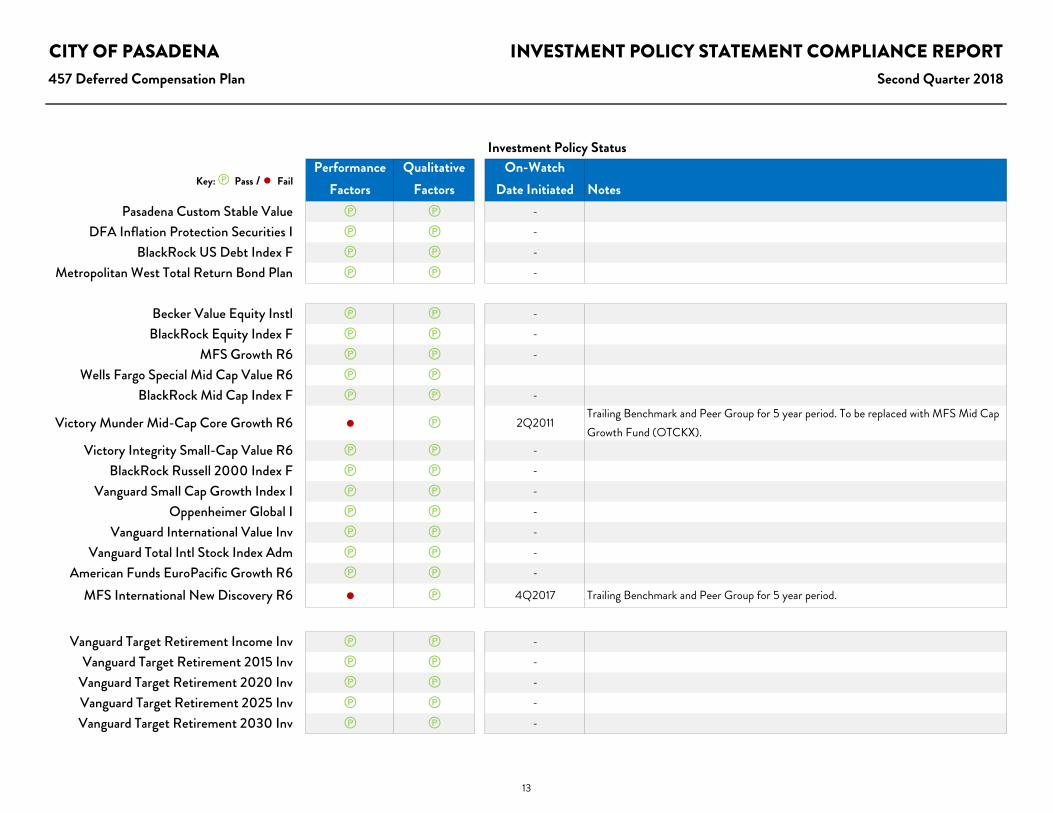
CITY OF PASADENA INVESTMENT POLICY STATEMENT COMPLIANCE REPORT457 Deferred Compensation Plan Second Quarter 2018
Key: ℗ Pass / ● Fail Performance
FactorsQualitative
FactorsOn-Watch
Date Initiated NotesPasadena Custom Stable Value ℗ ℗ -
DFA Inflation Protection Securities I ℗ ℗ -
BlackRock US Debt Index F ℗ ℗ -
Metropolitan West Total Return Bond Plan ℗ ℗ -
Becker Value Equity Instl ℗ ℗ -
BlackRock Equity Index F ℗ ℗ -
MFS Growth R6 ℗ ℗ -
Wells Fargo Special Mid Cap Value R6 ℗ ℗BlackRock Mid Cap Index F ℗ ℗ -
Victory Munder Mid-Cap Core Growth R6 ● ℗ 2Q2011Trailing Benchmark and Peer Group for 5 year period. To be replaced with MFS Mid Cap Growth Fund (OTCKX).
Victory Integrity Small-Cap Value R6 ℗ ℗ -
BlackRock Russell 2000 Index F ℗ ℗ -
Vanguard Small Cap Growth Index I ℗ ℗ -
Oppenheimer Global I ℗ ℗ -
Vanguard International Value Inv ℗ ℗ -
Vanguard Total Intl Stock Index Adm ℗ ℗ -
American Funds EuroPacific Growth R6 ℗ ℗ -
MFS International New Discovery R6 ● ℗ 4Q2017 Trailing Benchmark and Peer Group for 5 year period.
Vanguard Target Retirement Income Inv ℗ ℗ -
Vanguard Target Retirement 2015 Inv ℗ ℗ -
Vanguard Target Retirement 2020 Inv ℗ ℗ -
Vanguard Target Retirement 2025 Inv ℗ ℗ -
Vanguard Target Retirement 2030 Inv ℗ ℗ -
Investment Policy Status
13

CITY OF PASADENA INVESTMENT POLICY STATEMENT COMPLIANCE REPORT457 Deferred Compensation Plan Second Quarter 2018
Key: ℗ Pass / ● Fail Performance
FactorsQualitative
FactorsOn-Watch
Date Initiated Notes
Investment Policy Status
Vanguard Target Retirement 2035 Inv ℗ ℗ -
Vanguard Target Retirement 2040 Inv ℗ ℗ -
Vanguard Target Retirement 2045 Inv ℗ ℗ -
Vanguard Target Retirement 2050 Inv ℗ ℗ -
Vanguard Target Retirement 2055 Inv ℗ ℗ -
Vanguard Target Retirement 2060 Inv ℗ ℗ -
Vanguard Target Retirement 2065 Inv ℗ ℗ -
14

CITY OF PASADENA PERFORMANCE REVIEW457 Deferred Compensation Plan Second Quarter 2018
AnnualizedQTR YTD 1Yr 3Yr 5Yr 10Yr 2017 2016 2015 2014 2013 2012
Pasadena Custom Stable Value 0.47 0.91 1.78 1.69 1.66 - 1.70 1.64 1.58 1.46 2.00 -3 Yr Constant Maturity US Treasury Yield 0.65 1.22 2.06 1.46 1.22 1.10 1.58 1.05 1.02 0.90 0.54 0.38
US 90 Day T-Bill 0.46 0.85 1.41 0.71 0.44 0.31 0.93 0.32 0.05 0.03 0.06 0.08+/- Index (0.18) (0.31) (0.28) 0.23 0.44 - 0.12 0.59 0.56 0.56 1.46 -
US Stable Value 40 39 40 35 38 - 36 29 33 34 12 -
QTR YTD 1Yr 3Yr 5Yr 10Yr 2017 2016 2015 2014 2013 2012DFA Inflation Protection Securities I 0.76 -0.36 1.73 1.86 1.67 3.11 3.28 4.67 -1.22 3.37 -9.27 7.45
BBgBarc Capital US TIPS Index 0.77 -0.02 2.11 1.93 1.68 3.03 3.01 4.68 -1.44 3.64 -8.61 6.98+/- Index (0.01) (0.33) (0.38) (0.07) 0.00 0.07 0.27 (0.02) 0.22 (0.27) (0.66) 0.47
US Fund Inflation-Protected Bond 32 78 55 27 15 10 24 38 19 13 73 19
QTR YTD 1Yr 3Yr 5Yr 10Yr 2017 2016 2015 2014 2013 2012BlackRock US Debt Index F -0.13 -1.59 -0.33 1.80 2.37 3.81 3.63 2.69 0.57 6.18 -1.93 4.27
BBgBarc Capital US Aggregate Bond Index -0.16 -1.62 -0.40 1.72 2.27 3.72 3.54 2.65 0.55 5.97 -2.02 4.21+/- Index 0.03 0.02 0.07 0.09 0.10 0.09 0.09 0.04 0.02 0.21 0.09 0.06
US Fund Intermediate-Term Bond 30 42 39 40 41 60 52 64 17 21 63 82
QTR YTD 1Yr 3Yr 5Yr 10Yr 2017 2016 2015 2014 2013 2012Metropolitan West Total Return Bond Plan -0.01 -1.31 -0.19 1.63 2.54 5.45 3.49 2.56 0.25 6.16 0.45 11.54
BBgBarc Capital US Aggregate Bond Index -0.16 -1.62 -0.40 1.72 2.27 3.72 3.54 2.65 0.55 5.97 -2.02 4.21+/- Index 0.14 0.30 0.20 (0.09) 0.27 1.73 (0.05) (0.09) (0.30) 0.19 2.47 7.33
US Fund Intermediate-Term Bond 23 29 35 53 30 4 58 64 35 22 9 6
QTR YTD 1Yr 3Yr 5Yr 10Yr 2017 2016 2015 2014 2013 2012Becker Value Equity Instl 1.10 -0.97 8.29 7.73 10.81 8.75 15.23 18.79 -6.88 11.45 36.72 15.95
Russell 1000 Value Index 1.18 -1.69 6.77 8.26 10.34 8.49 13.66 17.34 -3.83 13.45 32.53 17.51+/- Index (0.08) 0.72 1.52 (0.53) 0.46 0.26 1.57 1.45 (3.05) (2.00) 4.19 (1.55)
US Fund Large Value 69 46 57 65 30 38 60 14 83 35 9 35
15

CITY OF PASADENA PERFORMANCE REVIEW457 Deferred Compensation Plan Second Quarter 2018
AnnualizedQTR YTD 1Yr 3Yr 5Yr 10Yr 2017 2016 2015 2014 2013 2012
BlackRock Equity Index F 3.44 2.66 14.40 11.96 13.47 10.28 21.84 11.97 1.43 13.72 32.42 15.87S&P 500 Index 3.43 2.65 14.37 11.93 13.42 10.17 21.83 11.96 1.38 13.69 32.39 16.00
+/- Index 0.01 0.01 0.03 0.03 0.05 0.11 0.01 0.01 0.05 0.03 0.03 (0.13)US Fund Large Blend 22 23 25 7 8 13 28 25 19 17 41 38
QTR YTD 1Yr 3Yr 5Yr 10Yr 2017 2016 2015 2014 2013 2012MFS Growth R6 6.58 12.13 25.47 15.99 16.71 11.14 30.99 2.55 7.49 8.88 36.74 17.39
Russell 1000 Growth Index 5.76 7.25 22.51 14.98 16.36 11.83 30.21 7.08 5.67 13.05 33.48 15.26+/- Index 0.82 4.88 2.95 1.01 0.35 (0.68) 0.78 (4.52) 1.82 (4.17) 3.26 2.13
US Fund Large Growth 23 14 21 11 19 33 28 54 18 65 21 26
QTR YTD 1Yr 3Yr 5Yr 10Yr 2017 2016 2015 2014 2013 2012Wells Fargo Special Mid Cap Value R6 0.51 -2.19 4.79 7.79 11.41 10.84 11.27 21.68 -2.65 12.12 39.13 18.91
Russell Mid Cap Value Index 2.41 -0.16 7.60 8.80 11.27 10.06 13.34 20.00 -4.78 14.75 33.46 18.51+/- Index (1.90) (2.03) (2.80) (1.01) 0.14 0.78 (2.07) 1.69 2.13 (2.63) 5.68 0.41
US Fund Mid-Cap Value 88 85 88 57 25 21 71 20 24 25 16 21
QTR YTD 1Yr 3Yr 5Yr 10Yr 2017 2016 2015 2014 2013 2012BlackRock Mid Cap Index F 4.32 3.53 13.59 10.97 12.77 10.86 16.26 20.75 -2.11 9.80 33.61 17.86
S&P Mid Cap 400 Index 4.29 3.49 13.50 10.89 12.69 10.78 16.24 20.74 -2.18 9.77 33.50 17.88+/- Index 0.02 0.04 0.09 0.08 0.08 0.08 0.02 0.01 0.07 0.03 0.11 (0.02)
US Fund Mid-Cap Blend 15 16 18 6 7 7 39 13 22 30 55 32
QTR YTD 1Yr 3Yr 5Yr 10Yr 2017 2016 2015 2014 2013 2012Victory Munder Mid-Cap Core Growth R6 0.73 0.43 12.56 7.01 10.70 8.68 24.73 7.58 -4.20 10.40 33.93 16.15
Russell Mid Cap Growth Index 3.16 5.40 18.52 10.73 13.37 10.45 25.27 7.33 -0.20 11.90 35.74 15.81+/- Index (2.43) (4.97) (5.96) (3.72) (2.67) (1.77) (0.54) 0.25 (4.00) (1.50) (1.81) 0.35
US Fund Mid-Cap Growth 95 93 87 85 82 70 43 29 79 22 59 28
16
CITY OF PASADENA PERFORMANCE REVIEW457 Deferred Compensation Plan Second Quarter 2018
AnnualizedQTR YTD 1Yr 3Yr 5Yr 10Yr 2017 2016 2015 2014 2013 2012
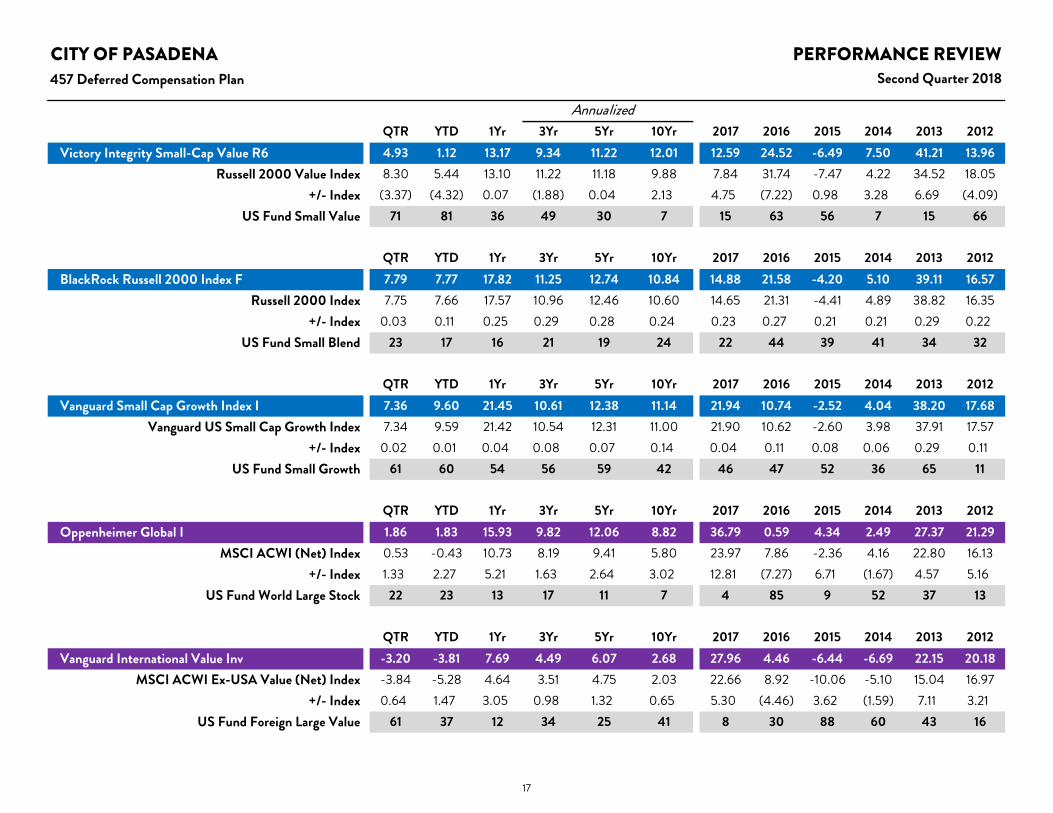
Victory Integrity Small-Cap Value R6 4.93 1.12 13.17 9.34 11.22 12.01 12.59 24.52 -6.49 7.50 41.21 13.96Russell 2000 Value Index 8.30 5.44 13.10 11.22 11.18 9.88 7.84 31.74 -7.47 4.22 34.52 18.05
+/- Index (3.37) (4.32) 0.07 (1.88) 0.04 2.13 4.75 (7.22) 0.98 3.28 6.69 (4.09)US Fund Small Value 71 81 36 49 30 7 15 63 56 7 15 66
QTR YTD 1Yr 3Yr 5Yr 10Yr 2017 2016 2015 2014 2013 2012BlackRock Russell 2000 Index F 7.79 7.77 17.82 11.25 12.74 10.84 14.88 21.58 -4.20 5.10 39.11 16.57
Russell 2000 Index 7.75 7.66 17.57 10.96 12.46 10.60 14.65 21.31 -4.41 4.89 38.82 16.35+/- Index 0.03 0.11 0.25 0.29 0.28 0.24 0.23 0.27 0.21 0.21 0.29 0.22
US Fund Small Blend 23 17 16 21 19 24 22 44 39 41 34 32
QTR YTD 1Yr 3Yr 5Yr 10Yr 2017 2016 2015 2014 2013 2012Vanguard Small Cap Growth Index I 7.36 9.60 21.45 10.61 12.38 11.14 21.94 10.74 -2.52 4.04 38.20 17.68
Vanguard US Small Cap Growth Index 7.34 9.59 21.42 10.54 12.31 11.00 21.90 10.62 -2.60 3.98 37.91 17.57+/- Index 0.02 0.01 0.04 0.08 0.07 0.14 0.04 0.11 0.08 0.06 0.29 0.11
US Fund Small Growth 61 60 54 56 59 42 46 47 52 36 65 11
QTR YTD 1Yr 3Yr 5Yr 10Yr 2017 2016 2015 2014 2013 2012Oppenheimer Global I 1.86 1.83 15.93 9.82 12.06 8.82 36.79 0.59 4.34 2.49 27.37 21.29
MSCI ACWI (Net) Index 0.53 -0.43 10.73 8.19 9.41 5.80 23.97 7.86 -2.36 4.16 22.80 16.13+/- Index 1.33 2.27 5.21 1.63 2.64 3.02 12.81 (7.27) 6.71 (1.67) 4.57 5.16
US Fund World Large Stock 22 23 13 17 11 7 4 85 9 52 37 13
QTR YTD 1Yr 3Yr 5Yr 10Yr 2017 2016 2015 2014 2013 2012Vanguard International Value Inv -3.20 -3.81 7.69 4.49 6.07 2.68 27.96 4.46 -6.44 -6.69 22.15 20.18
MSCI ACWI Ex-USA Value (Net) Index -3.84 -5.28 4.64 3.51 4.75 2.03 22.66 8.92 -10.06 -5.10 15.04 16.97+/- Index 0.64 1.47 3.05 0.98 1.32 0.65 5.30 (4.46) 3.62 (1.59) 7.11 3.21
US Fund Foreign Large Value 61 37 12 34 25 41 8 30 88 60 43 16
17

CITY OF PASADENA PERFORMANCE REVIEW457 Deferred Compensation Plan Second Quarter 2018
AnnualizedQTR YTD 1Yr 3Yr 5Yr 10Yr 2017 2016 2015 2014 2013 2012
Vanguard Total Intl Stock Index Adm -3.17 -3.62 7.10 5.33 6.42 2.72 27.55 4.67 -4.26 -4.17 15.14 18.21Vanguard Total International Stock Index -2.58 -3.69 7.58 5.47 6.54 2.77 27.41 4.72 -4.29 -3.39 15.76 17.04
+/- Index (0.60) 0.07 (0.49) (0.14) (0.11) (0.05) 0.14 (0.05) 0.03 (0.79) (0.62) 1.17US Fund Foreign Large Blend 74 68 33 32 36 45 23 12 79 33 83 49
QTR YTD 1Yr 3Yr 5Yr 10Yr 2017 2016 2015 2014 2013 2012American Funds EuroPacific Growth R6 -2.82 -1.82 9.35 6.51 8.34 4.82 31.17 1.01 -0.48 -2.29 20.58 19.64
MSCI AC World Ex-USA Growth (Net) Index -1.42 -2.28 9.90 6.56 7.18 3.01 32.01 0.12 -1.25 -2.65 15.49 16.67+/- Index (1.40) 0.46 (0.55) (0.06) 1.16 1.81 (0.84) 0.89 0.77 0.36 5.09 2.97
US Fund Foreign Large Growth 87 70 52 44 28 24 44 20 66 27 36 34
QTR YTD 1Yr 3Yr 5Yr 10Yr 2017 2016 2015 2014 2013 2012MFS International New Discovery R6 -1.07 0.87 13.20 9.30 8.96 7.22 32.16 0.65 2.85 -2.55 19.91 25.05
MSCI ACWI Ex-USA Small Growth (Net) Index -1.67 -0.84 13.67 8.57 9.73 5.40 33.64 -0.28 6.50 -3.59 18.52 16.87+/- Index 0.60 1.71 (0.47) 0.73 (0.77) 1.81 (1.48) 0.94 (3.65) 1.04 1.39 8.17
US Fund Foreign Small/Mid Growth 26 31 53 59 71 36 83 14 74 28 75 18
QTR YTD 1Yr 3Yr 5Yr 10Yr 2017 2016 2015 2014 2013 2012Vanguard Target Retirement Income Inv 0.43 -0.07 3.96 4.15 4.79 5.08 8.47 5.25 -0.17 5.54 5.87 8.23
Vanguard Retirement Income Index 0.50 -0.04 4.18 4.32 4.98 5.17 8.67 5.35 0.12 5.76 6.03 8.42+/- Index (0.07) (0.03) (0.22) (0.17) (0.19) (0.09) (0.19) (0.10) (0.30) (0.23) (0.15) (0.19)
US Fund Target-Date Retirement 44 21 36 28 33 25 62 41 7 19 56 67
QTR YTD 1Yr 3Yr 5Yr 10Yr 2017 2016 2015 2014 2013 2012Vanguard Target Retirement 2015 Inv 0.52 0.00 5.40 5.14 6.43 5.94 11.50 6.16 -0.46 6.56 13.00 11.37
Vanguard Retirement 2015 Index 0.63 0.04 5.60 5.32 6.63 6.00 11.61 6.40 -0.22 6.77 13.27 11.46+/- Index (0.11) (0.04) (0.20) (0.18) (0.20) (0.06) (0.11) (0.24) (0.24) (0.21) (0.27) (0.09)
US Fund Target-Date 2015 54 25 36 40 31 21 44 56 11 3 21 34
18

CITY OF PASADENA PERFORMANCE REVIEW457 Deferred Compensation Plan Second Quarter 2018
AnnualizedQTR YTD 1Yr 3Yr 5Yr 10Yr 2017 2016 2015 2014 2013 2012
Vanguard Target Retirement 2020 Inv 0.61 0.06 6.68 6.08 7.44 6.43 14.08 6.95 -0.68 7.11 15.85 12.35Vanguard Retirement 2020 Index 0.76 0.09 6.93 6.27 7.66 6.58 14.22 7.17 -0.40 7.37 16.21 12.47
+/- Index (0.15) (0.03) (0.26) (0.19) (0.22) (0.15) (0.14) (0.22) (0.28) (0.26) (0.36) (0.12)US Fund Target-Date 2020 49 35 20 12 9 11 17 29 23 1 18 36
QTR YTD 1Yr 3Yr 5Yr 10Yr 2017 2016 2015 2014 2013 2012Vanguard Target Retirement 2025 Inv 0.65 0.05 7.58 6.68 8.11 6.71 15.94 7.48 -0.85 7.17 18.14 13.29
Vanguard Retirement 2025 Index 0.86 0.14 7.89 6.88 8.34 6.88 16.08 7.66 -0.58 7.45 18.52 13.39+/- Index (0.21) (0.09) (0.31) (0.20) (0.22) (0.17) (0.14) (0.18) (0.27) (0.28) (0.38) (0.10)
US Fund Target-Date 2025 58 46 27 16 13 22 21 23 24 4 24 43
QTR YTD 1Yr 3Yr 5Yr 10Yr 2017 2016 2015 2014 2013 2012Vanguard Target Retirement 2030 Inv 0.78 0.21 8.48 7.19 8.71 6.96 17.52 7.85 -1.03 7.17 20.49 14.24
Vanguard Retirement 2030 Index 0.96 0.23 8.75 7.39 8.94 7.13 17.65 8.11 -0.80 7.51 20.88 14.31+/- Index (0.18) (0.02) (0.26) (0.20) (0.23) (0.17) (0.13) (0.26) (0.23) (0.34) (0.39) (0.07)
US Fund Target-Date 2030 60 44 33 24 16 20 34 32 31 5 25 38
QTR YTD 1Yr 3Yr 5Yr 10Yr 2017 2016 2015 2014 2013 2012Vanguard Target Retirement 2035 Inv 0.83 0.24 9.25 7.66 9.31 7.29 19.12 8.26 -1.26 7.24 22.82 15.16
Vanguard Retirement 2035 Index 1.05 0.30 9.58 7.89 9.54 7.45 19.24 8.55 -1.02 7.57 23.27 15.23+/- Index (0.22) (0.06) (0.34) (0.23) (0.23) (0.17) (0.12) (0.29) (0.24) (0.33) (0.45) (0.07)
US Fund Target-Date 2035 59 58 42 29 20 24 35 32 37 10 23 41
QTR YTD 1Yr 3Yr 5Yr 10Yr 2017 2016 2015 2014 2013 2012Vanguard Target Retirement 2040 Inv 0.90 0.36 10.14 8.14 9.79 7.61 20.71 8.73 -1.59 7.15 24.37 15.56
Vanguard Retirement 2040 Index 1.14 0.38 10.45 8.39 10.06 7.78 20.87 8.98 -1.25 7.61 24.79 15.58+/- Index (0.24) (0.02) (0.31) (0.25) (0.27) (0.16) (0.16) (0.25) (0.34) (0.46) (0.42) (0.02)
US Fund Target-Date 2040 62 53 33 27 15 20 25 27 43 12 16 31
19

CITY OF PASADENA PERFORMANCE REVIEW457 Deferred Compensation Plan Second Quarter 2018
AnnualizedQTR YTD 1Yr 3Yr 5Yr 10Yr 2017 2016 2015 2014 2013 2012
Vanguard Target Retirement 2045 Inv 0.94 0.36 10.51 8.40 9.95 7.68 21.42 8.87 -1.57 7.16 24.37 15.58Vanguard Retirement 2045 Index 1.20 0.43 10.86 8.65 10.22 7.85 21.54 9.13 -1.25 7.61 24.79 15.58
+/- Index (0.26) (0.08) (0.35) (0.25) (0.28) (0.18) (0.11) (0.26) (0.32) (0.45) (0.42) 0.00US Fund Target-Date 2045 58 62 39 27 19 18 26 28 42 12 27 43
QTR YTD 1Yr 3Yr 5Yr 10Yr 2017 2016 2015 2014 2013 2012Vanguard Target Retirement 2050 Inv 0.94 0.39 10.52 8.40 9.95 7.68 21.39 8.85 -1.58 7.18 24.34 15.58
Vanguard Retirement 2050 Index 1.20 0.43 10.86 8.65 10.22 7.85 21.54 9.13 -1.25 7.61 24.79 15.58+/- Index (0.26) (0.04) (0.34) (0.25) (0.27) (0.17) (0.14) (0.28) (0.32) (0.43) (0.45) 0.01
US Fund Target-Date 2050 59 54 44 31 20 23 38 29 45 16 30 44
QTR YTD 1Yr 3Yr 5Yr 10Yr 2017 2016 2015 2014 2013 2012Vanguard Target Retirement 2055 Inv 0.95 0.38 10.53 8.37 9.92 - 21.38 8.88 -1.72 7.19 24.33 15.58
Vanguard Retirement 2055 Index 1.20 0.43 10.86 8.65 10.22 - 21.54 9.13 -1.25 7.61 24.79 15.58+/- Index (0.25) (0.05) (0.33) (0.28) (0.30) - (0.16) (0.25) (0.46) (0.42) (0.46) 0.01
US Fund Target-Date 2055 59 62 52 39 27 - 48 27 53 16 36 48
QTR YTD 1Yr 3Yr 5Yr 10Yr 2017 2016 2015 2014 2013 2012Vanguard Target Retirement 2060 Inv 0.93 0.40 10.51 8.37 9.92 - 21.36 8.84 -1.68 7.16 24.35 -
Vanguard Retirement 2060 Index 1.20 0.43 10.86 8.65 10.22 - 21.54 9.13 -1.25 7.61 24.79 15.58+/- Index (0.27) (0.03) (0.35) (0.28) (0.30) - (0.18) (0.28) (0.43) (0.45) (0.44) -
US Fund Target-Date 2060+ 73 62 61 61 1 - 53 21 46 8 1 -
QTR YTD 1Yr 3Yr 5Yr 10Yr 2017 2016 2015 2014 2013 2012Vanguard Target Retirement 2065 Inv 0.97 0.37 - - - - - - - - - -
Vanguard Retirement 2065 Index 1.20 0.43 10.86 - - - - - - - - -+/- Index (0.23) (0.06) - - - - - - - - - -
US Fund Target-Date 2060+ 64 66 - - - - - - - - - -
20

Section 4

CITY OF PASADENA PLAN FEE ANALYSIS457 Deferred Compensation Plan Second Quarter 2018
$136 $161
$177 $2
67
$290 $311
$287
$290
$315
$313
$313$2
35 $265
$251
$83 $87
$68
$67
$71 $77
$79
$79
4Q09
4Q10
4Q11
4Q12
4Q13
4Q14
4Q15
4Q16
4Q17
1Q18
2Q18
$0
$50,000
$100,000
$150,000
Average Participant Balance and Cost ($)Avg. Investment Cost Avg. Admin Cost Avg. Part Balance
0.57
4%
0.58
7%
0.57
4%
0.42
3%
0.43
2%
0.39
3%
0.36
9%
0.35
4%
0.35
4%
0.34
8%
0.34
6%
0.73
1%
0.73
1%
0.74
0%
0.46
2%
0.45
6%
0.41
9%
0.41
0%
0.39
6%
0.37
9%
0.37
3%
0.37
3%
0.00%
0.50%
1.00%
4Q09
4Q10
4Q11
4Q12
4Q13
4Q14
4Q15
4Q16
4Q17
1Q18
2Q18
Annualized Plan Cost (%)Weighted Total Expense Ratio Average Total Expense Ratio
0.36
4%
0.36
5%
0.33
6%
0.10
0%
0.10
0%
0.07
0%
0.07
0%
0.07
0%
0.07
0%
0.07
0%
0.07
0%
0.35
7%
0.35
8%
0.32
8%
0.04
8%
0.04
4%
0.04
0%
0.04
0%
0.03
8%
0.03
5%
0.03
5%
0.03
4%
0.00%
0.25%
0.50%
4Q09
4Q10
4Q11
4Q12
4Q13
4Q14
4Q15
4Q16
4Q17
1Q18
2Q18
Annualized Contracted Revenue v. Revenue Received (as a % of total assets)
Revenue Received Contracted Revenue
0.21
0%
0.22
2%
0.23
8%
0.32
3%
0.33
2%
0.32
3%
0.29
9%
0.28
4%
0.28
4%
0.27
8%
0.27
6%
0.36
4%
0.36
5%
0.33
6%
0.10
0%
0.10
0%
0.07
0%
0.07
0%
0.07
0%
0.07
0%
0.07
0%
0.07
0%
0.00%
0.25%
0.50%
0.75%
4Q09
4Q10
4Q11
4Q12
4Q13
4Q14
4Q15
4Q16
4Q17
1Q18
2Q18
Annualized Investment Cost Summary(as a % of total assets)
Avg. Admin Cost per Participant Avg. Investment Cost per Participant
21

CITY OF PASADENA PLAN FEE ANALYSIS457 Deferred Compensation Plan Second Quarter 2018
Fund Ticker Quarter Average Assets Expense Ratio Admin Fee Est. Total Invest. Cost Est. Total Admin. CostPasadena Custom Stable Value - $97,861,683 0.19% 0.07% $185,937 $68,503DFA Inflation Protection Securities I DIPSX $1,119,293 0.12% 0.07% $1,343 $784BlackRock US Debt Index F - $1,053,817 0.04% 0.07% $422 $738Metropolitan West Total Return Bond Plan MWTSX $5,298,418 0.38% 0.07% $20,134 $3,709Becker Value Equity Instl BVEIX $15,089,378 0.68% 0.07% $102,608 $10,563BlackRock Equity Index F - $27,189,852 0.02% 0.07% $5,438 $19,033MFS Growth R6 MFEKX $25,537,115 0.60% 0.07% $153,223 $17,876Wells Fargo Special Mid Cap Value R6 WFPRX $3,205,673 0.75% 0.07% $24,043 $2,244BlackRock Mid Cap Index F - $3,895,885 0.04% 0.07% $1,558 $2,727Victory Munder Mid-Cap Core Growth R6 MGOSX $5,278,025 0.85% 0.07% $44,863 $3,695Victory Integrity Small-Cap Value R6 MVSSX $4,908,849 0.96% 0.07% $47,125 $3,436BlackRock Russell 2000 Index F - $3,095,125 0.04% 0.07% $1,238 $2,167Vanguard Small Cap Growth Index I VSGIX $10,030,792 0.06% 0.07% $6,018 $7,022Oppenheimer Global I OGLIX $4,267,246 0.70% 0.07% $29,871 $2,987Vanguard International Value Inv VTRIX $2,835,381 0.40% 0.07% $11,342 $1,985Vanguard Total Intl Stock Index Adm VTIAX $853,593 0.11% 0.07% $939 $598American Funds EuroPacific Growth R6 RERGX $4,309,789 0.49% 0.07% $21,118 $3,017MFS International New Discovery R6 MIDLX $3,781,223 0.95% 0.07% $35,922 $2,647Vanguard Target Retirement Income Inv VTINX $2,669,620 0.13% 0.07% $3,471 $1,869Vanguard Target Retirement 2015 Inv VTXVX $5,108,663 0.13% 0.07% $6,641 $3,576Vanguard Target Retirement 2020 Inv VTWNX $11,818,997 0.13% 0.07% $15,365 $8,273Vanguard Target Retirement 2025 Inv VTTVX $11,150,748 0.14% 0.07% $15,611 $7,806Vanguard Target Retirement 2030 Inv VTHRX $8,069,718 0.14% 0.07% $11,298 $5,649Vanguard Target Retirement 2035 Inv VTTHX $9,479,186 0.14% 0.07% $13,271 $6,635Vanguard Target Retirement 2040 Inv VFORX $4,822,374 0.15% 0.07% $7,234 $3,376Vanguard Target Retirement 2045 Inv VTIVX $6,900,143 0.15% 0.07% $10,350 $4,830Vanguard Target Retirement 2050 Inv VFIFX $1,999,858 0.15% 0.07% $3,000 $1,400Vanguard Target Retirement 2055 Inv VFFVX $1,450,689 0.15% 0.07% $2,176 $1,015Vanguard Target Retirement 2060 Inv VTTSX $186,333 0.15% 0.07% $279 $130Vanguard Target Retirement 2065 Inv VLXVX $9,663 0.15% 0.07% $14 $7Self-Directed Brokerage Assets - $4,396,713 - 0.07% - $3,078
TOTAL $287,673,838 $781,850 $201,372
Plan Administration Cost Quarter AnnualizedAdministrative Fee (0.07% annually - est): $50,343 $201,372
Recordkeeping Fee ($39 pp/yr - est): $24,736 $98,943Net Excess/(Deficit) (est): $25,607 $102,429
Annualized
22

Section 5

American Funds EuroPacific Growth Fund® Class R-6 RERGX Morningstar Analyst RatingŒ
NAV $ NAV Day Change % Yield TTM % Total Assets $ Status Min. Inv. Load Expenses Morningstar Rating TM Category Investment Style
54.31 ]0.12 | 0.22 0.99 167 Open $250 None 0.49% QQQQ Foreign LargeGrowth
7 Large Growth
Growth of 10,000 07-17-2008 - 07-17-2018
5K
10K
14K
18K
2009 2010 2011 2012 2013 2014 2015 2016 2017 2018
American Funds EuroPacificGrowth Fund® Class R-6$16,871.30Foreign Large Growth$15,227.05MSCI ACWI Ex USA NR USD$13,790.58
Investment Strategy
The investment seeks long-term growth of capital. The fund invests primarily in common stocks of issuers in Europe and the Pa-cific Basin that the investment adviser believes have the potential for growth. Growth stocks are stocks that the investment ad-viser believes have the potential for above-average capital appreciation. It normally will invest at least 80% of its net assets insecurities of issuers in Europe and the Pacific Basin. The fund may invest a portion of its assets in common stocks and other se-curities of companies in emerging markets.
Performance 07-17-2018
YTD 1 Mo 1 Yr 3Yr Ann 5Yr Ann 10Yr Ann
Growth of 10,000 9,965 9,903 10,811 12,038 14,568 16,708Fund -0.35 -0.97 8.11 6.38 7.81 5.27+/- MSCI ACWI Ex USA NRUSD
2.73 0.62 2.82 1.42 2.60 2.21
+/- Category -1.52 0.14 -1.82 -0.06 0.77 0.85% Rank in Cat 65 44 62 42 26 —# of Funds in Cat 427 437 420 340 301 215* Currency is displayed in USD
Top Holdings 06-30-2018Weight % Last Price Day Chg % 52 Week Range
Y AIA Group Ltd 2.64 67.70 USD -0.66 [ 56.95 - 75.00
T Airbus SE 2.45 107.20 USD -0.43 [ 68.42 - 109.10
T Samsung Electronics Co Ltd 2.31 — USD 1.53 ] 44,220.00 - 57,520.00
T HDFC Bank Ltd 2.17 — USD -0.03 [ 1,681.85 - 2,220.00
T Nintendo Co Ltd 2.07 — USD -2.03 [ 33,900.00 - 49,980.00
% Assets in Top 5 Holdings 11.65
TIncrease YDecrease RNew to Portfolio
Top Sectors 06-30-2018Fund 3 Yr High 3 Yr Low Cat Avg
a Technology 20.69 22.50 17.34 17.46
y Financial Services 18.28 19.55 18.28 17.96
t Consumer Cyclical 12.64 12.64 11.19 14.94
p Industrials 10.80 10.80 9.39 13.81
r Basic Materials 10.26 10.26 6.98 6.38
Fund Cat Avg
0 10 20 30 40
Dividend and Capital Gains DistributionsDistributionDate
DistributionNAV
Long-TermCapital Gain
Short-TermCaptial Gain
Return ofCapital
DividendIncome
DistributionTotal
06-13-2018 55.61 1.6190 0.0000 0.0000 0.0522 1.671212-21-2017 55.70 1.1693 0.0000 0.0000 0.5026 1.671906-14-2017 51.95 0.9630 0.0000 0.0000 0.1654 1.128412-22-2016 44.95 0.0000 0.0000 0.0000 0.7373 0.737312-23-2015 45.72 0.5900 0.0000 0.0000 0.9665 1.5565
3 Year Average Morningstar Risk Measures
Risk vs. Category -Avg
Low Avg High
(344)
Return vs. Category +Avg(344)
Pillars
Process ∞ PositivePerformance ∞ PositivePeople ∞ PositiveParent ∞ PositivePrice ∞ Positive
Rating Œ
Style Map
DeepVal
CoreVal
Core CoreGrow
HighGrow
Micro
Small
Medium
Large
Giant Weighted Averageof holdings
75% of fund’s stockholdings
Asset Allocation
Asset Class % Net
Cash 8.64US Stock 2.30Non US Stock 88.14Bond 0.76Other 0.17
ManagementStart Date
Mark E. Denning —Carl M. Kawaja —Nicholas J. Grace —Sung Lee —Jesper Lyckeus —Jonathan Knowles —Andrew B. Suzman —Christopher M.Thomsen —
Lawrence Kymisis —
Release date 07-18-2018
©2018 Morningstar. All Rights Reserved. Unless otherwise provided in a separate agreement, you may use this report only in the country in which its original distributor is based. Data as originally reported. Theinformation contained herein is not represented or warranted to be accurate, correct, complete, or timely. This report is for information purposes only, and should not be considered a solicitation to buy or sell any security.Redistribution is prohibited without written permission. To order reprints, call +1 312-696-6100. To license the research, call +1 312-696-6869. ß
®
Page 1 of 11Release date 07-18-2018
©2018 Morningstar. All Rights Reserved. Unless otherwise provided in a separate agreement, you may use this report only in the country in which its original distributor is based. Data as originally reported. Theinformation contained herein is not represented or warranted to be accurate, correct, complete, or timely. This report is for information purposes only, and should not be considered a solicitation to buy or sell any security.Redistribution is prohibited without written permission. To order reprints, call +1 312-696-6100. To license the research, call +1 312-696-6869. ß
®
Page 1 of 11
23

Becker Value Equity Fund Institutional Class BVEIX Morningstar Analyst Rating—
NAV $ NAV Day Change % Yield TTM % Total Assets $ Status Min. Inv. Load Expenses Morningstar Rating TM Category Investment Style
19.85 ]0.04 | 0.20 1.51 420 Open $250,000 None 0.68% QQQQ Large Value 1 Large Value
Growth of 10,000 07-17-2008 - 07-17-2018
6K
13K
21K
28K
2009 2010 2011 2012 2013 2014 2015 2016 2017 2018
Becker Value Equity FundInstitutional Class$24,186.99Large Value $22,496.08S&P 500 TR USD $27,975.70
Investment Strategy
The investment seeks long-term capital appreciation. The fund employs a value strategy and invests primarily in common andpreferred stocks whose market prices do not reflect their true values, as determined by the Advisor. The Advisor utilizes a bot-tom-up approach to stock selection, focusing on company fundamentals. The Advisor typically invests in companies with soundfundamentals that the Advisor believes are selling at discounted valuations and have low price-to-earnings ("P/E") ratios.
Performance 07-17-2018
YTD 1 Mo 1 Yr 3Yr Ann 5Yr Ann 10Yr Ann
Growth of 10,000 10,153 10,107 10,963 12,760 16,399 23,864Fund 1.53 1.07 9.63 8.46 10.40 9.09+/- S&P 500 TR USD -4.65 -0.13 -6.86 -3.57 -2.74 -1.62+/- Category 0.22 0.71 -0.82 -0.07 0.92 0.39% Rank in Cat 41 18 59 53 29 —# of Funds in Cat 1,269 1,283 1,240 1,075 929 671* Currency is displayed in USD
Top Holdings 04-30-2018Weight % Last Price Day Chg % 52 Week Range
Y JPMorgan Chase & Co 2.70 111.53 USD 0.93 ] 88.08 - 119.33
T Xerox Corp 2.65 25.33 USD 1.32 ] 23.52 - 37.42
Y Royal Dutch Shell PLC ADR Class A 2.60 68.90 USD 0.19 ] 53.64 - 73.86AstraZeneca PLC ADR 2.56 37.33 USD 0.43 ] 28.43 - 37.37State Street Corporation 2.54 95.33 USD 2.01 ] 89.25 - 114.27
% Assets in Top 5 Holdings 13.05
TIncrease YDecrease RNew to Portfolio
Top Sectors 04-30-2018Fund 3 Yr High 3 Yr Low Cat Avg
y Financial Services 20.95 21.24 20.86 22.84
d Healthcare 15.44 15.44 13.41 13.56
a Technology 14.17 17.18 14.17 11.87
o Energy 12.87 12.87 11.00 10.56
s Consumer Defensive 10.90 10.90 8.76 8.95
Fund Cat Avg
0 10 20 30 40
Dividend and Capital Gains DistributionsDistributionDate
DistributionNAV
Long-TermCapital Gain
Short-TermCaptial Gain
Return ofCapital
DividendIncome
DistributionTotal
12-15-2017 19.41 0.7085 0.0000 0.0000 0.3032 1.011712-16-2016 17.98 1.0708 0.0000 0.0000 0.3099 1.380712-18-2015 15.86 1.1132 0.0000 0.0000 0.2419 1.355112-19-2014 18.96 1.2129 0.0000 0.0000 0.3538 1.566712-20-2013 18.01 1.2130 0.0000 0.0000 0.2121 1.4251
3 Year Average Morningstar Risk Measures
Risk vs. Category Avg
Low Avg High
(1099)
Return vs. Category Avg(1099)
Pillars
Process — —Performance — —People — —Parent — —Price — —
Rating .
Style Map
DeepVal
CoreVal
Core CoreGrow
HighGrow
Micro
Small
Medium
Large
Giant Weighted Averageof holdings
75% of fund’s stockholdings
Asset Allocation
Asset Class % Net
Cash 2.84US Stock 86.65Non US Stock 10.51Bond 0.00Other 0.00
ManagementStart Date
Patrick E. Becker —Stephen D. Laveson —Michael A. McGarr —Marian L. Kessler —Andy Murray —Thomas (T.J.)McConville —
Sid Parakh —
Release date 07-18-2018
©2018 Morningstar. All Rights Reserved. Unless otherwise provided in a separate agreement, you may use this report only in the country in which its original distributor is based. Data as originally reported. Theinformation contained herein is not represented or warranted to be accurate, correct, complete, or timely. This report is for information purposes only, and should not be considered a solicitation to buy or sell any security.Redistribution is prohibited without written permission. To order reprints, call +1 312-696-6100. To license the research, call +1 312-696-6869. ß
®
Page 1 of 11Release date 07-18-2018
©2018 Morningstar. All Rights Reserved. Unless otherwise provided in a separate agreement, you may use this report only in the country in which its original distributor is based. Data as originally reported. Theinformation contained herein is not represented or warranted to be accurate, correct, complete, or timely. This report is for information purposes only, and should not be considered a solicitation to buy or sell any security.Redistribution is prohibited without written permission. To order reprints, call +1 312-696-6100. To license the research, call +1 312-696-6869. ß
®
Page 1 of 11
24

BlackRock Equity Index -Collective F
Volatility Meter*The Investment volatility, when shown,is a function of the investment option'sMorningstar 3-year Risk Rating. The AssetCategory volatility is based on the averagestandard deviation of investment options inthis asset category.
Low Moderate High▲Asset Category
*For illustrative purposes only.The Asset Category volatility measure willalways be displayed. If the Investmentvolatility measure is not displayed, theinvestment may have fewer than three yearsof history or the data may not be available.
Morningstar StyleStockStyle / CapitalizationLarge Blend
Large
Mid
Small
Value Blend Growth
Fund IssuerBlackRock Institutional TrustCompany, N.A.Portfolio ManagersBlackRock Institutional TrustCompany, NAAsset CategoryLarge Blend
Large Cap
Period Ending: 03/31/2018
Net Expense Ratio Gross Expense Ratio Total Net Assets (MM) Inception Date Data Effective Date.02% .02% $65,003.510 08/31/1973 03/31/2018
Please consider the investment objectives, risks, fees and expenses carefully before investing. For this and other important information aboutinvestments offered through your Plan, you may obtain mutual fund prospectuses for registered investment options and/or disclosure documents fromyour registered representative or Plan website. Read them carefully before investing.The gross and net expense ratio, if shown, reflect the most current data available at the time of production, which may differ from the data effective date. The Netexpense ratio shown is net of any fee waivers or expense reimbursements.FUNDOV 05/12/2018 Page 1 of 4 022318BlackRock Equity Index - Collective F GP22/533703525
Investment Objective & StrategyThe Fund is an "index fund" that seeks investment results that correspond generally to the price andyield performance, before fees and expenses, of a particular index (its "Underlying Index"). The Fund isa collective investment trust maintained and managed by BlackRock Institutional Trust Company, N.A.("BTC"). The Fund shall be invested and reinvested in a portfolio of equity securities with the objectiveof approximating as closely as practicable the capitalization weighted total rate of return of that segmentof the United States market for publicly traded equity securities represented by the larger capitalizedcompanies. The criterion for selection of investments shall be the S&P 500 Index. BTC uses a "passive"or indexing approach to try to achieve the Fund's investment objective. Unlike many funds, the Funddoes not try to outperform the index it seeks to track and does not seek temporary defensive positionswhen markets decline or appear overvalued. BTC uses a replication indexing strategy to manage theFund. "Replication" is an indexing strategy in which the Fund generally invests in substantially all ofthe securities in its Underlying Index in approximately the same proportions as in the Underlying Index.When deemed appropriate by BTC and unless otherwise provided in the Fund's investment strategies,BTC may invest all or any portion of the Fund in one or more futures contracts, forward contracts orother similar assets for the purpose of acting as a temporary substitute for investment in securities. TheFund may invest through one or a series of collective investment trusts maintained and managed byBTC. In the event of a conflict between this summary description of the Fund's investment objective andprincipal investment strategies and the Trust Document under which the Fund was established, the TrustDocument will govern. For more information related to the Fund, please see the Fund's Trust Document,Profile and most recent audited financial statements.
Risk ProfileLarge-cap investments may be most appropriate for someone willing to accept some degree of marketvolatility in return for potential long-term capital growth. Stock investments tend to be more volatile thanbond, stable value or money market investments.
Asset Allocation1
% of AssetsU.S. Stock........................... 98.90Non U.S. Stock...................... 0.80Cash...................................... 0.30
Equity Sector Diversification% of Assets
Technology................................. 22.16Financial Svc.............................. 16.91Healthcare.................................. 13.91Consumer Cyclical...................... 11.73Industrials................................... 10.64Consumer Defensive.................... 7.83Energy.......................................... 5.74Communication Svc..................... 3.29Utilities.......................................... 2.86Basic Materials............................. 2.68Real Estate................................... 2.25
Largest Holdings% of Assets
Apple Inc........................................3.77Microsoft Corp............................... 3.11Amazon.com Inc............................2.58Berkshire Hathaway Inc B............. 1.70Facebook Inc A............................. 1.70JPMorgan Chase & Co..................1.67Johnson & Johnson.......................1.52Exxon Mobil Corp.......................... 1.40Alphabet Inc C...............................1.39Alphabet Inc A...............................1.37Percent of Total Net Assets 20.21%Portfolio Turnover (%) 3.86%
25

BlackRock Equity Index -Collective F
Volatility Meter*The Investment volatility, when shown,is a function of the investment option'sMorningstar 3-year Risk Rating. The AssetCategory volatility is based on the averagestandard deviation of investment options inthis asset category.
Low Moderate High▲Asset Category
*For illustrative purposes only.The Asset Category volatility measure willalways be displayed. If the Investmentvolatility measure is not displayed, theinvestment may have fewer than three yearsof history or the data may not be available.
Morningstar StyleStockStyle / CapitalizationLarge Blend
Large
Mid
Small
Value Blend Growth
Fund IssuerBlackRock Institutional TrustCompany, N.A.Portfolio ManagersBlackRock Institutional TrustCompany, NAAsset CategoryLarge Blend
Large Cap
Period Ending: 03/31/2018
Net Expense Ratio Gross Expense Ratio Total Net Assets (MM) Inception Date Data Effective Date.02% .02% $65,003.510 08/31/1973 03/31/2018
Please consider the investment objectives, risks, fees and expenses carefully before investing. For this and other important information aboutinvestments offered through your Plan, you may obtain mutual fund prospectuses for registered investment options and/or disclosure documents fromyour registered representative or Plan website. Read them carefully before investing.The gross and net expense ratio, if shown, reflect the most current data available at the time of production, which may differ from the data effective date. The Netexpense ratio shown is net of any fee waivers or expense reimbursements.FUNDOV 05/12/2018 Page 2 of 4 022318BlackRock Equity Index - Collective F GP22/533703525
For more information about this investmentoption please go to www.blackrock.com.
26

BlackRock Mid Cap Equity Index -Coll F
Volatility Meter*The Investment volatility, when shown,is a function of the investment option'sMorningstar 3-year Risk Rating. The AssetCategory volatility is based on the averagestandard deviation of investment options inthis asset category.
Low Moderate High▲Asset Category
*For illustrative purposes only.The Asset Category volatility measure willalways be displayed. If the Investmentvolatility measure is not displayed, theinvestment may have fewer than three yearsof history or the data may not be available.
Morningstar StyleStockStyle / CapitalizationMid Blend
Large
Mid
Small
Value Blend Growth
Fund IssuerBlackRock Institutional TrustCompany, N.A.Portfolio ManagersBlackRock Institutional TrustCompany, NAAsset CategoryMid-Cap Blend
Mid C
apPeriod Ending: 03/31/2018
Net Expense Ratio Gross Expense Ratio Total Net Assets (MM) Inception Date Data Effective Date.04% .04% $4,465.340 06/16/1997 03/31/2018
Please consider the investment objectives, risks, fees and expenses carefully before investing. For this and other important information aboutinvestments offered through your Plan, you may obtain mutual fund prospectuses for registered investment options and/or disclosure documents fromyour registered representative or Plan website. Read them carefully before investing.The gross and net expense ratio, if shown, reflect the most current data available at the time of production, which may differ from the data effective date. The Netexpense ratio shown is net of any fee waivers or expense reimbursements.FUNDOV 05/12/2018 Page 1 of 4 022318BlackRock Mid Cap Equity Index - Coll F GP22/533703526
Investment Objective & StrategyThe Fund is an "index fund" that seeks investment results that correspond generally to the price andyield performance, before fees and expenses, of a particular index (its "Underlying Index"). The Fund isa collective investment trust maintained and managed by BlackRock Institutional Trust Company, N.A.("BTC"). The Fund shall be invested and reinvested primarily in a portfolio of equity securities with theobjective of approximating as closely as practicable the capitalization weighted total rate of return of thesegment of the United States market for publicly traded equity securities. The criterion for selection ofinvestments shall be the Dow Jones U.S. Completion Total Stock Market Index. BTC uses a "passive" orindexing approach to try to achieve the Fund's investment objective. Unlike many funds, the Fund doesnot try to outperform the index it seeks to track and does not seek temporary defensive positions whenmarkets decline or appear overvalued. BTC uses a representative sampling indexing strategy to manageFund. "Representative sampling" is an indexing strategy that involves investing in a representativesample of securities that collectively has an investment profile similar to the Fund's Underlying Index.The securities selected are expected to have, in the aggregate, investment characteristics (based onfactors such as market capitalization and industry weightings), fundamental characteristics (such asreturn variability and yield) and liquidity measures similar to those of the Underlying Index. The Fund mayor may not hold all of the securities that are included in the Underlying Index. When deemed appropriateby BTC and unless otherwise provided in the Fund's investment strategies, BTC may invest all or anyportion of the Fund in one or more futures contracts, forward contracts or other similar assets for thepurpose of acting as a temporary substitute for investment in securities. The Fund may invest throughone or a series of collective investment trusts maintained and managed by BTC. In the event of a conflictbetween this summary description of the Fund's investment objective and principal investment strategiesand the Trust Document under which the Fund was established, the Trust Document will govern. Formore information related to the Fund, please see the Fund's Trust Document, Profile and most recentaudited financial statements.
Risk ProfileMid-cap investments may be most appropriate for someone willing to accept a higher degree of marketvolatility in exchange for greater potential returns over time. Stock investments tend to be more volatilethan bond, stable value or money market investments. Equity securities of medium-sized companiesmay be more volatile than securities of larger, more established companies.
Asset Allocation1
% of AssetsU.S. Stock........................... 99.00Cash...................................... 0.70Non U.S. Stock...................... 0.30
Equity Sector Diversification% of Assets
Financial Svc.............................. 17.59Industrials................................... 16.68Technology................................. 15.94Consumer Cyclical..................... 13.43Real Estate................................... 8.51Healthcare.................................... 7.78Basic Materials............................. 6.09Utilities.......................................... 4.89Energy.......................................... 4.86Consumer Defensive.................... 3.75Communication Svc..................... 0.49
Largest Holdings% of Assets
MSCI Inc........................................0.78Broadridge Financial SolutionsInc.................................................. 0.74Abiomed Inc...................................0.70Teleflex Inc.....................................0.66IDEX Corp..................................... 0.63Steel Dynamics Inc........................0.60Copart Inc......................................0.59
27

BlackRock Mid Cap Equity Index -Coll F
Volatility Meter*The Investment volatility, when shown,is a function of the investment option'sMorningstar 3-year Risk Rating. The AssetCategory volatility is based on the averagestandard deviation of investment options inthis asset category.
Low Moderate High▲Asset Category
*For illustrative purposes only.The Asset Category volatility measure willalways be displayed. If the Investmentvolatility measure is not displayed, theinvestment may have fewer than three yearsof history or the data may not be available.
Morningstar StyleStockStyle / CapitalizationMid Blend
Large
Mid
Small
Value Blend Growth
Fund IssuerBlackRock Institutional TrustCompany, N.A.Portfolio ManagersBlackRock Institutional TrustCompany, NAAsset CategoryMid-Cap Blend
Mid C
apPeriod Ending: 03/31/2018
Net Expense Ratio Gross Expense Ratio Total Net Assets (MM) Inception Date Data Effective Date.04% .04% $4,465.340 06/16/1997 03/31/2018
Please consider the investment objectives, risks, fees and expenses carefully before investing. For this and other important information aboutinvestments offered through your Plan, you may obtain mutual fund prospectuses for registered investment options and/or disclosure documents fromyour registered representative or Plan website. Read them carefully before investing.The gross and net expense ratio, if shown, reflect the most current data available at the time of production, which may differ from the data effective date. The Netexpense ratio shown is net of any fee waivers or expense reimbursements.FUNDOV 05/12/2018 Page 2 of 4 022318BlackRock Mid Cap Equity Index - Coll F GP22/533703526
Largest Holdings% of Assets
Domino's Pizza Inc........................0.59Old Dominion Freight Lines Inc..... 0.58Keysight Technologies Inc.............0.57Percent of Total Net Assets 6.44%Portfolio Turnover (%) 23.95%
For more information about this investmentoption please go to www.blackrock.com.
28

BlackRock Russell 2000 IndexColl F
Volatility Meter*The Investment volatility, when shown,is a function of the investment option'sMorningstar 3-year Risk Rating. The AssetCategory volatility is based on the averagestandard deviation of investment options inthis asset category.
Low Moderate High▲Asset Category
*For illustrative purposes only.The Asset Category volatility measure willalways be displayed. If the Investmentvolatility measure is not displayed, theinvestment may have fewer than three yearsof history or the data may not be available.
Morningstar StyleStockStyle / CapitalizationLarge Blend
Large
Mid
Small
Value Blend Growth
Fund IssuerBlackRockAsset CategorySmall Blend
Small C
apPeriod Ending: 03/31/2018
Net Expense Ratio Gross Expense Ratio Total Net Assets (MM) Inception Date Data Effective Date.04% .04% $4,212.480 12/31/1997 03/31/2018
Please consider the investment objectives, risks, fees and expenses carefully before investing. For this and other important information aboutinvestments offered through your Plan, you may obtain mutual fund prospectuses for registered investment options and/or disclosure documents fromyour registered representative or Plan website. Read them carefully before investing.The gross and net expense ratio, if shown, reflect the most current data available at the time of production, which may differ from the data effective date. The Netexpense ratio shown is net of any fee waivers or expense reimbursements.FUNDOV 05/12/2018 Page 1 of 3 022318BlackRock Russell 2000 Index Coll F GP22/533703527
Investment Objective & StrategyThe BGI Russell 2000 Stock Index Fund seeks to match the performance of the Russell 2000 Index byinvesting in a diversified sample of the stocks that make up the index. The Index is comprised of the2000 smallest companies in the Russell 3000(R) Index and represents approximately 8% of the totalmarket capitalization of the Russell 3000 Index. The Russell 3000 Index represents 98% of the total USEquity market Capitalization.
Risk ProfileSmall-cap investments may be most appropriate for someone willing to accept a high degree of marketvolatility in exchange for greater potential returns over time. Stock investments tend to be more volatilethan bond, stable value or money market investments. Equity securities of small-sized companies maybe more volatile than securities of larger, more established companies.
Asset Allocation1
% of AssetsU.S. Stock........................... 97.10Cash...................................... 2.00Non U.S. Stock...................... 0.90
Equity Sector Diversification% of Assets
Technology................................. 17.44Financial Svc.............................. 17.41Healthcare.................................. 15.55Industrials................................... 14.25Consumer, Cyclical..................... 12.06Real Estate................................... 7.20Basic Materials............................. 5.67Utilities.......................................... 3.27Consumer Defensive.................... 3.19Energy.......................................... 3.01Communication Svc..................... 0.95
Largest Holdings% of Assets
Nektar Therapeutics Inc................ 0.75GrubHub Inc.................................. 0.41bluebird bio Inc..............................0.39
Largest Holdings% of Assets
Sage Therapeutics Inc.................. 0.32MKS Instruments Inc..................... 0.29Curtiss-Wright Corp....................... 0.28Aspen Technology Inc................... 0.27Swift Transportation Co................. 0.27EPAM Systems Inc........................0.27Catalent Inc................................... 0.26Percent of Total Net Assets 3.51%Portfolio Turnover (%) 20.91%
For more information about this investmentoption please go to www.blackrock.com.
29

BlackRock US Debt Index FundColl F
Volatility Meter*The Investment volatility, when shown,is a function of the investment option'sMorningstar 3-year Risk Rating. The AssetCategory volatility is based on the averagestandard deviation of investment options inthis asset category.
Low Moderate High▲Asset Category
*For illustrative purposes only.The Asset Category volatility measure willalways be displayed. If the Investmentvolatility measure is not displayed, theinvestment may have fewer than three yearsof history or the data may not be available.
Morningstar StyleFixed IncomeCredit Quality / Interest RateSensitivityModerate Sensitivity High Quality
High
Med
Low
Ltd Mod Ext
Fund IssuerBlackRock Institutional TrustCompany, N.A.Portfolio ManagersBlackRock Institutional TrustCompany, NAAsset CategoryIntermediate-Term Bond
BondPeriod Ending: 03/31/2018
Net Expense Ratio Gross Expense Ratio Total Net Assets (MM) Inception Date Data Effective Date.04% .04% $10,823.990 06/03/1996 03/31/2018
Please consider the investment objectives, risks, fees and expenses carefully before investing. For this and other important information aboutinvestments offered through your Plan, you may obtain mutual fund prospectuses for registered investment options and/or disclosure documents fromyour registered representative or Plan website. Read them carefully before investing.The gross and net expense ratio, if shown, reflect the most current data available at the time of production, which may differ from the data effective date. The Netexpense ratio shown is net of any fee waivers or expense reimbursements.FUNDOV 05/12/2018 Page 1 of 3 022318BlackRock US Debt Index Fund Coll F GP22/533703528
Investment Objective & StrategyThe Fund is an "index fund" that seeks investment results that correspond generally to the price andyield performance, before fees and expenses, of a particular index (its "Underlying Index"). The Fundis a collective investment trust maintained and managed by BlackRock Institutional Trust Company,N.A. ("BTC"). The Fund shall be invested and reinvested primarily in a portfolio of debt securities withthe objective of approximating as closely as practicable the total rate of return of the market for debtsecurities as defined by the Barclays U.S. Aggregate Bond Index. BTC uses a "passive" or indexingapproach to try to achieve the Fund's investment objective. Unlike many funds, the Fund does not try tooutperform the index it seeks to track and does not seek temporary defensive positions when marketsdecline or appear overvalued. BTC uses a representative sampling indexing strategy to manage theFund. Representative sampling" is an indexing strategy that involves investing in a representative sampleof securities that collectively has an investment profile similar to the Underlying Index. The securitiesselected are expected to have, in the aggregate, investment characteristics (based on factors such asmarket capitalization and industry weightings), fundamental characteristics (such as return variability andyield) and liquidity measures similar to those of the Underlying Index. The Fund may or may not holdall of the securities that are included in the Underlying Index. When deemed appropriate by BTC andunless otherwise provided in the Fund's investment strategies, BTC may invest all or any portion of theFund in one or more futures contracts, forward contracts or other similar assets for the purpose of actingas a temporary substitute for investment in securities. The Fund may invest through one or a series ofcollective investment trusts maintained and managed by BTC. In the event of a conflict between thissummary description of the Fund's investment objective and principal investment strategies and the TrustDocument under which the Fund was established, the Trust Document will govern. For more informationrelated to the Fund, please see the Fund's Trust Document, Profile and most recent audited financialstatements.
Risk ProfileBond investments may be most appropriate for someone seeking greater potential income than with amoney market or stable value investment and willing to accept a higher degree of risk. The investor mayalso desire to balance more aggressive investments with one providing potentially steady income. A bondfund's yield, share price and total return change daily and are based on changes in interest rates, marketconditions, economic and political news, and the quality and maturity of its investments. In general, bondprices fall when interest rates rise and vice versa.
Asset Allocation1
% of AssetsBonds.................................. 90.80Cash...................................... 9.20
Bond Sector Diversification% of Assets
Government................................ 42.29Corporate.................................... 24.83Securitized.................................. 23.10Municipal...................................... 0.62
Equity Sector Diversification% of Assets
Cash............................................. 9.15
Bond CharacteristicsAverage Effective Duration..... 5.86 yrsEffective Maturity.................... 8.18 yrs
For more information about this investmentoption please go to www.blackrock.com.
30

Glossary & Investment Option Disclosures
FUNDOV 05/12/2018 Page 2 of 3 022318BlackRock US Debt Index Fund Coll F GP22/533703528
3-YearRisk Rating
An annualized measure of a fund's downside volatility over a three-year period. Morningstar Risk Rating is derived directly from Morningstar Risk,which is an assessment of the variations in a fund's monthly returns, with an emphasis on downside variations, in comparison to similar funds. In eachMorningstar Category, the top 10% of investments earn a High rating, the next 22.5% Above Average, the middle 35% Average, the next 22.5% BelowAverage, and the bottom 10% Low. Investments with less than three years of performance history are not rated.
AlphaAlpha is a measure of the difference between a portfolio’s actual returns and its expected performance, given its level of risk as measured by beta. Apositive Alpha figure indicates the portfolio has performed better than its beta would predict. In contrast, a negative Alpha indicates the portfolio hasunderperformed, given the expectations established by beta.
Beta
Beta is a measure of a portfolio's sensitivity to market movements. The beta of the market is 1.00 by definition. Morningstar calculates beta bycomparing a portfolio's excess return over T-bills to the benchmark's excess return over T-bills, so a beta of 1.10 shows that the portfolio hasperformed 10% better than its benchmark in up markets and 10% worse in down markets, assuming all other factors remain constant. Conversely, abeta of 0.85 indicates that the portfolio's excess return is expected to perform 15% worse than the benchmark’s excess return during up markets and15% better during down markets.
EffectiveDuration
Effective duration for all long fixed income positions in a portfolio. Morningstar asks fund companies to calculate and send average effective duration(also known as “option adjusted duration”) for each of their fixed income or allocation funds. We ask for effective duration because the measure givesbetter estimation of how the price of bonds with embedded options, which are common in many mutual funds, will change as a result of changes ininterest rates. Effective duration takes into account expected mortgage prepayment or the likelihood that embedded options will be exercised if afund holds futures, other derivative securities, or other funds as assets, the aggregate effective duration should include the weighted impact of thoseexposures. Standard practice for calculating this data point requires determination of a security’s option-adjusted spread, including the use of optionmodels or Monte Carlo simulation, as well as interest-rate scenario testing Morningstar requests that the fund only report data in this field that hasbeen specifically labeled effective or option-adjusted duration, or that fund is certain has been calculated in the fashion described.
EffectiveMaturity
Average effective maturity is a weighted average of all the maturities of the bonds in a portfolio, computed by weighting each bond's effective maturityby the market value of the security. Average effective maturity takes into consideration all mortgage prepayments, puts, and adjustable coupons.Longer-maturity funds are generally considered more interest-rate sensitive than their shorter counterparts. We list Average Effective Maturity forTaxable Fixed-Income and Hybrid funds and Average Nominal Maturity for Municipal Bond Funds.
FixedIncomeStyle Box
The model for the fixed income style box is based on the two pillars of fixed-income performance: interest-rate sensitivity and credit quality. The threeinterest sensitivity groups are limited, moderate and extensive and the three credit quality groups are high, medium and low. These groupings displaya portfolio's effective duration and third party credit ratings to provide an overall representation of the fund's risk orientation given the sensitivity tointerest rate and credit rating of bonds in the portfolio. On a monthly basis Morningstar calculates duration breakpoints based around the 3 yeareffective duration of the Morningstar Core Bond Index (MCBI). By using the MCBI as the duration benchmark, Morningstar is letting the effectiveduration bands to fluctuate in lock-steps with the market which will minimize market-driven style box changes. Municipal bond funds with duration of4.5 years or less qualify as low; more than 4.5 years but less than 7 years, medium; and more than 7 years, high. For hybrid funds, both equity andfixed-income style boxes appear.
PortfolioTurnover
Portfolio turnover is a measure of the portfolio manager’s trading activity which is computed by taking the lesser of purchases or sales (excluding allsecurities with maturities of less than one year) and dividing by average monthly net assets. A turnover ratio of 100% or more does not necessarilysuggest that all securities in the portfolio have been traded. In practical terms, the resulting percentage loosely represents the percentage of theportfolio’s holdings that have changed over the past year.
R2
R-squaredR2, also known as the Coefficient of Determination, reflects the percentage of a portfolio's movement that can be explained by the movement of itsprimary benchmark over the past three years. An R-squared of 100 indicates that all movement of a fund can be explained by the movement of theindex.
SharpeRatio
A risk-adjusted measure developed by Nobel Laureate William Sharpe. It is calculated by using standard deviation and excess return to determinereward per unit of risk. The higher the Sharpe Ratio, the better the fund's historical risk-adjusted performance. The Sharpe ratio is calculated for thepast 36-month period by dividing a fund's annualized excess returns by the standard deviation of a fund's annualized excess returns. Since this ratiouses standard deviation as its risk measure, it is most appropriately applied when analyzing a fund that is an investor's sole holding. The Sharpe Ratiocan be used to compare two funds directly on how much risk a fund had to bear to earn excess return over the risk-free rate.
StandardDeviation
Standard deviation is a statistical measurement of dispersion about an average, which, for a mutual fund, depicts how widely the returns varied overthe past three years. Investors use the standard deviation of historical performance to try to predict the range of returns that are most likely for a givenfund. When a fund has a high standard deviation, the predicted range of performance is wide, implying greater volatility. Standard deviation is mostappropriate for measuring risk if it is for a fund that is an investor's only holding. The figure can not be combined for more than one fund becausethe standard deviation for a portfolio of multiple funds is a function of not only the individual standard deviations, but also of the degree of correlationamong the funds' returns. If a fund's returns follow a normal distribution, then approximately 68 percent of the time they will fall within one standarddeviation of the mean return for the fund, and 95 percent of the time within two standard deviations. Morningstar computes standard deviation usingthe trailing monthly total returns for the appropriate time period. All of the monthly standard deviations are then annualized.
All Glossary terms are sourced from Morningstar, Inc., except "Fixed" and/or"Stable Value" when shown.Core securities, when offered, are offered through GWFS Equities, Inc.and/or other broker dealers. GWFS Equities, Inc., Member FINRA/SIPC, is awholly owned subsidiary of Great-West Life & Annuity Insurance Company.Funds may impose redemption fees and/or transfer restrictions, if assets are heldfor less than the published holding period. For more information, see the fund’sprospectus and/or disclosure documents.All trademarks, logos, service marks, and design elements used are owned bytheir respective owners and are used by permission.Holdings and composition of holdings are subject to change.The responsibility for the content contained in the website(s) provided (if shown)is entirely that of the website owner. Endorsement is neither declared nor implied.Fee and performance information on the website(s) listed may differ for fundsoffered through an individual or group variable annuity.A benchmark index is not actively managed, does not have a defined investmentobjective, and does not incur fees or expenses. Therefore, performance of a fundwill generally be less than its benchmark index. You cannot invest directly in abenchmark index.The Inception Date listed is the date the fund began operations. The DataEffective Date is the date for which the most current data is available. ThePeriod Ending Date is the date for which the fund fact sheet is produced.
U.S. Treasury securities, where listed, are guaranteed as to the timely paymentof principal and interest if held to maturity. Investment options are neither issuednor guaranteed by the U.S. government.Although data is gathered from reliable sources, the completeness or accuracyof the data shown cannot be guaranteed. All information is the most currentas it is provided by the data source. Where data obtained from Morningstar,©2018 Morningstar, Inc. All Rights Reserved. The data: (1) is proprietary toMorningstar and/or its content providers; (2) may not be copied or distributed;and (3) is not warranted to be accurate, complete or timely. Neither Morningstarnor its content providers are responsible for any damages or losses arising fromany use of this information. Past performance is no guarantee of future results.Empower Retirement refers to the products and services offered in the retirementmarkets by Great-West Life & Annuity Insurance Company (GWL&A), CorporateHeadquarters: Greenwood Village, CO; Great-West Life & Annuity InsuranceCompany of New York, Home Office: New York, New York; and their subsidiariesand affiliates. The trademarks, logos, service marks, and design elements usedare owned by GWL&A.A collective fund is not a mutual fund and is exempt from SECregistration. Designed for and exclusively sold to qualified retirement plans andtheir participants, the funds are not available to individual retail investors.GWFS Equities, Inc., or one or more of its affiliates, may receive a fee from theinvestment option provider for providing certain recordkeeping, distribution andadministrative services.1The allocations shown here are subject to change. The fund allocations arebased on an investment strategy based on risk and return.
31

Glossary & Investment Option Disclosures
FUNDOV 05/12/2018 Page 3 of 3 022318BlackRock US Debt Index Fund Coll F GP22/533703528
PRINCIPAL RISKS:
Any of the principal risks summarized below may adversely affect the Fund'snet asset value, performance, and ability to meet its investment objective. Aninvestment in the Fund is not a bank deposit, is not guaranteed by BlackRock,Inc. or any of its affiliates, and is not insured by the Federal Deposit InsuranceCorporation or any other agency of the U.S. government.Underlying Fund Risk - The investment objective and strategies of a collectiveinvestment trust in which the Fund invests ("Underlying Fund") may differ fromthe Fund, and there is no assurance that an Underlying Fund will achieve itsobjective.Fixed Income Securities Risk - The Fund is subject to the risk that debtissuers may not honor their obligations. An increase in interest rates may causethe value of fixed-income securities held by the Fund to decline. The Fund'sincome may decline when interest rates fall. This decline can occur becausethe Fund must invest in lower-yielding bonds as bonds in its portfolio mature orthe Fund needs to purchase additional bonds. Securities that are rated belowinvestment grade may be more volatile than higher-rated securities of similarmaturity.Securities Lending Risk - The Fund may engage in securities lending.Securities lending involves the risk that the Fund may lose money because theborrower of the Fund's securities fails to return the securities in a timely manneror at all or in the event of a decline in the value of the collateral provided forloaned securities or a decline in the value of any investments made with cashcollateral.Derivatives Risk - Investments in derivatives (such as futures contracts,forward contracts, swaps and options) may reduce the Fund's returns and/orincrease volatility. Fluctuations in the values of derivatives may not correlateperfectly with the overall securities markets. Derivatives are also subject to therisk that the other party in the transaction will not fulfill its contractual obligation.The possible lack of a liquid secondary market for derivatives could expose theFund to losses.U.S. Government Issuers Risk - U.S. Treasury obligations may differ intheir interest rates, maturities, times of issuance and other characteristics.Obligations of U.S. government agencies and authorities are supported byvarying degrees of credit. Debentures issued by U.S. government agencies aregenerally backed only by the general creditworthiness and reputation of thegovernment agency issuing the debenture and are not backed by the full faithand credit of the U.S. government.Mortgage- and Asset-Backed Securities Risk - Mortgage- and asset-backedsecurities represent interests in "pools" of mortgages or other assets, includingconsumer loans or receivables held in trust. Mortgage- and asset-backedsecurities are subject to credit, interest rate, prepayment and extension risks.These securities also are subject to risk of default on the underlying mortgageor asset, particularly during periods of economic downturn. Small movementsin interest rates (both increases and decreases) may quickly and significantlyreduce the value of certain mortgage-backed securities.Unless otherwise noted, not insured by FDIC, NCUA/NCUASIF. Not adeposit or guaranteed by any bank affiliate or credit union. Not insured byany federal government agency. Funds may lose value. Not a condition ofany banking or credit union activity.
©2018 Great-West Life & Annuity Insurance Company. All rights reserved.
32

DFA Inflation-Protected Securities Portfolio Institutional Class DIPSX Morningstar Analyst Rating—
NAV $ NAV Day Change % Yield TTM % Total Assets $ Status Min. Inv. Load Expenses Morningstar Rating TM Category Investment Style
11.59 [-0.02 | -0.17 2.61 5 Open — None 0.12% QQQQQ Inflation-ProtectedBond
0
Growth of 10,000 07-17-2008 - 07-17-2018
9K
11K
13K
15K
2009 2010 2011 2012 2013 2014 2015 2016 2017 2018
DFA Inflation-ProtectedSecurities PortfolioInstitutional Class$13,480.53Inflation-Protected Bond$12,418.75BBgBarc US Agg Bond TRUSD $14,429.16
Performance 07-17-2018
YTD 1 Mo 1 Yr 3Yr Ann 5Yr Ann 10Yr Ann
Growth of 10,000 9,964 10,067 10,130 10,567 10,718 13,591Fund -0.36 0.67 1.30 1.86 1.40 3.12+/- BBgBarc US Agg BondTR USD
0.99 0.07 1.61 0.08 -0.87 -0.69
+/- Category -0.31 0.07 -0.46 0.21 0.40 0.57% Rank in Cat 80 36 61 32 19 10# of Funds in Cat 240 249 235 208 175 111* Currency is displayed in USD
Dividend and Capital Gains DistributionsDistributionDate
DistributionNAV
Long-TermCapital Gain
Short-TermCaptial Gain
Return ofCapital
DividendIncome
DistributionTotal
06-28-2018 11.59 0.0000 0.0000 0.0000 0.1179 0.117912-14-2017 11.71 0.0000 0.0000 0.0000 0.1538 0.153809-28-2017 11.80 0.0000 0.0000 0.0000 0.0307 0.030706-29-2017 11.72 0.0000 0.0000 0.0000 0.0904 0.090403-30-2017 11.79 0.0000 0.0000 0.0000 0.0352 0.0352
3 Year Average Morningstar Risk Measures
Risk vs. Category +Avg
Low Avg High
(211)
Return vs. Category High(211)
Pillars
Process — —Performance — —People — —Parent — —Price — —
Rating .
ManagementStart Date
David A. Plecha —Joseph F. Kolerich —Alan R. Hutchison —
Release date 07-18-2018
©2018 Morningstar. All Rights Reserved. Unless otherwise provided in a separate agreement, you may use this report only in the country in which its original distributor is based. Data as originally reported. Theinformation contained herein is not represented or warranted to be accurate, correct, complete, or timely. This report is for information purposes only, and should not be considered a solicitation to buy or sell any security.Redistribution is prohibited without written permission. To order reprints, call +1 312-696-6100. To license the research, call +1 312-696-6869. ß
®
Page 1 of 11Release date 07-18-2018
©2018 Morningstar. All Rights Reserved. Unless otherwise provided in a separate agreement, you may use this report only in the country in which its original distributor is based. Data as originally reported. Theinformation contained herein is not represented or warranted to be accurate, correct, complete, or timely. This report is for information purposes only, and should not be considered a solicitation to buy or sell any security.Redistribution is prohibited without written permission. To order reprints, call +1 312-696-6100. To license the research, call +1 312-696-6869. ß
®
Page 1 of 11
33

Metropolitan West Total Return Bond Fund Plan Class MWTSX Morningstar Analyst RatingŒ
NAV $ NAV Day Change % Yield TTM % Total Assets $ Bil Status Min. Inv. Load Expenses Morningstar Rating TM Category Investment Style
9.79 [0.00 | 0.01 2.47 74.9 Open $25 mil None 0.38% QQQQ Intermediate-TermBond
5 Med/Mod
Growth of 10,000 07-17-2008 - 07-17-2018
9K
12K
15K
17K
2009 2010 2011 2012 2013 2014 2015 2016 2017 2018
Metropolitan West TotalReturn Bond Fund Plan Class$17,148.85Intermediate-Term Bond$14,529.92BBgBarc US Agg Bond TRUSD $14,429.16
Investment Strategy
The investment seeks to maximize long-term total return. The fund pursues its objective by investing, under normal circum-stances, at least 80% of its net assets in investment grade fixed income securities or unrated securities that are determined bythe Adviser to be of similar quality. Up to 20% of the fund's net assets may be invested in securities rated below investmentgrade. The fund also invests at least 80% of its net assets plus borrowings for investment purposes in fixed income securities itregards as bonds.
Performance 07-17-2018
YTD 1 Mo 1 Yr 3Yr Ann 5Yr Ann 10Yr Ann
Growth of 10,000 9,901 10,064 10,005 10,522 11,334 17,311Fund -0.99 0.64 0.05 1.71 2.54 5.64+/- BBgBarc US Agg BondTR USD
0.36 0.04 0.36 -0.07 0.27 1.83
+/- Category 0.28 0.14 0.34 -0.06 0.33 1.58% Rank in Cat 24 11 29 52 30 —# of Funds in Cat 1,021 1,053 983 869 767 549* Currency is displayed in USD
Top Holdings 06-30-2018Weight % Maturity Date Amount Mil Value Mil
R Us 5yr Note (Cbt) Sep18 10.79 09-28-2018 0.09 9,829.25
R Us 2yr Note (Cbt) Sep18 9.64 09-28-2018 0.04 8,781.34
R United States Treasury Notes 2.75% 2.69 04-30-2023 2,445.93 2,448.50
R United States Treasury Bonds 3.12% 2.62 05-15-2048 2,324.23 2,389.19
R United States Treasury Notes 2.62% 2.32 06-30-2023 2,124.35 2,114.11
% Assets in Top 5 Holdings 28.05
T Increase Y Decrease R New to Portfolio
Top Sectors 06-30-2018Fund BMark Cat Avg
Corporate Bond 26.97 — 29.56Agency MBS Pass-Through 23.37 — 22.67Other Government Related 17.52 — 9.38U.S. Treasury 16.53 — 19.34Asset-Backed 7.27 — 8.65
Fund Cat Avg
0 10 20 30 40
Dividend and Capital Gains DistributionsDistributionDate
DistributionNAV
Long-TermCapital Gain
Short-TermCaptial Gain
Return ofCapital
DividendIncome
DistributionTotal
06-29-2018 9.77 0.0000 0.0000 0.0000 0.0235 0.023505-31-2018 9.81 0.0000 0.0000 0.0000 0.0230 0.023004-30-2018 9.76 0.0000 0.0000 0.0000 0.0220 0.022003-29-2018 9.84 0.0000 0.0000 0.0000 0.0224 0.022402-28-2018 9.80 0.0000 0.0000 0.0000 0.0183 0.0183
3 Year Average Morningstar Risk Measures
Risk vs. Category Avg
Low Avg High
(878)
Return vs. Category High(878)
Pillars
Process ∞ PositivePerformance ∞ PositivePeople ∞ PositiveParent ¶ NeutralPrice ∞ Positive
Rating Œ
Style Map 03-31-2018
Ltd Mod Ext
HighM
edLow
Bond Statistics Value
Average Effective Duration 6.09Average Effective Maturity (Years) 7.71Average Credit Quality BBBAverage Weighted Coupon 3.45Average Weighted Price 99.23
Asset Allocation
%Net
%Short
%Long
Benchmark
CatAvg
Cash -0.63 3.32 2.69 — -5.35US Stock 0.00 0.00 0.00 — 0.03Non US Stock 0.00 0.00 0.00 — 0.00Bond 100.29 2.91 103.20 —103.52Other 0.34 0.00 0.34 — 1.80
ManagementStart Date
Stephen M. Kane —Laird R. Landmann —Tad Rivelle —Bryan T. Whalen —
Release date 07-18-2018
©2018 Morningstar. All Rights Reserved. Unless otherwise provided in a separate agreement, you may use this report only in the country in which its original distributor is based. Data as originally reported. Theinformation contained herein is not represented or warranted to be accurate, correct, complete, or timely. This report is for information purposes only, and should not be considered a solicitation to buy or sell any security.Redistribution is prohibited without written permission. To order reprints, call +1 312-696-6100. To license the research, call +1 312-696-6869. ß
®
Page 1 of 11Release date 07-18-2018
©2018 Morningstar. All Rights Reserved. Unless otherwise provided in a separate agreement, you may use this report only in the country in which its original distributor is based. Data as originally reported. Theinformation contained herein is not represented or warranted to be accurate, correct, complete, or timely. This report is for information purposes only, and should not be considered a solicitation to buy or sell any security.Redistribution is prohibited without written permission. To order reprints, call +1 312-696-6100. To license the research, call +1 312-696-6869. ß
®
Page 1 of 11
34

MFS® Growth Fund Class R6 MFEKX Morningstar Analyst Rating„
NAV $ NAV Day Change % Yield TTM % Total Assets $ Status Min. Inv. Load Expenses Morningstar Rating TM Category Investment Style
111.40 ]0.78 | 0.71 0.15 20 Open — None 0.60% QQQQ Large Growth 7 Large Growth
Growth of 10,000 07-17-2008 - 07-17-2018
6K
14K
23K
31K
2009 2010 2011 2012 2013 2014 2015 2016 2017 2018
MFS® Growth Fund ClassR6 $31,070.49Large Growth $26,899.47S&P 500 TR USD $27,975.70
Investment Strategy
The investment seeks capital appreciation. The fund normally invests in equity securities. Equity securities include commonstocks and other securities that represent an ownership interest (or right to acquire an ownership interest) in a company or oth-er issuer. The adviser focuses on investing the fund's assets in the stocks of companies the advisor believes to have above av-erage earnings growth potential compared to other companies (growth companies).
Performance 07-17-2018
YTD 1 Mo 1 Yr 3Yr Ann 5Yr Ann 10Yr Ann
Growth of 10,000 11,699 10,177 12,733 15,481 21,454 30,875Fund 16.99 1.77 27.33 15.68 16.49 11.93+/- S&P 500 TR USD 10.81 0.57 10.84 3.65 3.36 1.23+/- Category 4.95 0.71 4.42 3.33 2.35 1.06% Rank in Cat 16 15 24 13 20 —# of Funds in Cat 1,453 1,475 1,421 1,235 1,114 805* Currency is displayed in USD
Top Holdings 05-31-2018Weight % Last Price Day Chg % 52 Week Range
T Amazon.com Inc 5.99 — USD -0.06 [ 931.75 - 1,858.88
T Microsoft Corp 5.82 105.12 USD -0.78 [ 71.28 - 106.50
T Facebook Inc A 4.69 209.36 USD -0.30 [ 149.02 - 210.99
T Visa Inc Class A 4.24 140.90 USD 0.90 ] 97.55 - 141.17
T Adobe Systems Inc 4.22 259.78 USD 0.57 ] 143.95 - 260.94
% Assets in Top 5 Holdings 24.97
TIncrease YDecrease RNew to Portfolio
Top Sectors 05-31-2018Fund 3 Yr High 3 Yr Low Cat Avg
a Technology 36.27 36.27 29.92 31.91
t Consumer Cyclical 15.94 16.81 13.35 17.80
y Financial Services 13.74 13.74 11.43 14.03
d Healthcare 11.72 13.18 11.72 13.07
p Industrials 11.42 12.34 10.54 10.30
Fund Cat Avg
0 10 20 30 40
Dividend and Capital Gains DistributionsDistributionDate
DistributionNAV
Long-TermCapital Gain
Short-TermCaptial Gain
Return ofCapital
DividendIncome
DistributionTotal
06-29-2018 106.77 0.1913 0.1254 0.0000 0.1649 0.481612-19-2017 96.24 2.3834 0.0000 0.0000 0.0000 2.383412-20-2016 76.09 1.1594 0.0000 0.0000 0.0000 1.159406-30-2016 74.19 0.0267 0.0000 0.0000 0.0842 0.110912-17-2015 74.17 2.5369 0.0000 0.0000 0.0000 2.5369
3 Year Average Morningstar Risk Measures
Risk vs. Category -Avg
Low Avg High
(1265)
Return vs. Category Avg(1265)
Pillars
Process ∞ PositivePerformance ∞ PositivePeople ∞ PositiveParent ∞ PositivePrice ∞ Positive
Rating „
Style Map
DeepVal
CoreVal
Core CoreGrow
HighGrow
Micro
Small
Medium
Large
Giant Weighted Averageof holdings
75% of fund’s stockholdings
Asset Allocation
%Net
%Short
%Long
Benchmark
CatAvg
Cash 1.89 0.14 2.03 0.00 1.82US Stock 96.26 0.00 96.26 99.43 92.06Non US Stock 1.85 0.00 1.85 0.57 5.55Bond 0.00 0.00 0.00 0.00 0.04Other 0.00 0.00 0.00 0.00 0.54
ManagementStart Date
Eric B. Fischman —Matthew D. Sabel —Paul J. Gordon —
Release date 07-18-2018
©2018 Morningstar. All Rights Reserved. Unless otherwise provided in a separate agreement, you may use this report only in the country in which its original distributor is based. Data as originally reported. Theinformation contained herein is not represented or warranted to be accurate, correct, complete, or timely. This report is for information purposes only, and should not be considered a solicitation to buy or sell any security.Redistribution is prohibited without written permission. To order reprints, call +1 312-696-6100. To license the research, call +1 312-696-6869. ß
®
Page 1 of 11Release date 07-18-2018
©2018 Morningstar. All Rights Reserved. Unless otherwise provided in a separate agreement, you may use this report only in the country in which its original distributor is based. Data as originally reported. Theinformation contained herein is not represented or warranted to be accurate, correct, complete, or timely. This report is for information purposes only, and should not be considered a solicitation to buy or sell any security.Redistribution is prohibited without written permission. To order reprints, call +1 312-696-6100. To license the research, call +1 312-696-6869. ß
®
Page 1 of 11
35

MFS® International New Discovery Fund Class R6 MIDLX Morningstar Analyst Rating„
NAV $ NAV Day Change % Yield TTM % Total Assets $ Status Min. Inv. Load Expenses Morningstar Rating TM Category Investment Style
36.37 ]0.14 | 0.39 1.09 7 Open — None 0.95% QQ Foreign Small/MidGrowth
8 Mid Growth
Growth of 10,000 07-17-2008 - 07-17-2018
5K
11K
16K
22K
2009 2010 2011 2012 2013 2014 2015 2016 2017 2018
MFS® International NewDiscovery Fund Class R6$21,507.26Foreign Small/Mid Growth$19,846.70MSCI ACWI Ex USA NR USD$13,790.58
Investment Strategy
The investment seeks capital appreciation. The fund normally invests its assets primarily in foreign equity securities, includingemerging market equity securities. Equity securities include common stocks and other securities that represent an ownershipinterest (or right to acquire an ownership interest) in a company or other issuer. The fund may invest a significant percentage ofthe fund's assets in issuers in a single industry, sector, country, or region.
Performance 07-17-2018
YTD 1 Mo 1 Yr 3Yr Ann 5Yr Ann 10Yr Ann
Growth of 10,000 10,176 9,830 11,279 13,032 14,851 21,212Fund 1.76 -1.70 12.79 9.23 8.23 7.81+/- MSCI ACWI Ex USA NRUSD
4.85 -0.12 7.51 4.27 3.02 4.75
+/- Category 0.66 0.39 -0.97 0.21 -1.06 0.37% Rank in Cat 26 26 43 56 70 —# of Funds in Cat 145 146 140 108 103 63* Currency is displayed in USD
Top Holdings 05-31-2018Weight % Last Price Day Chg % 52 Week Range
OBIC Co Ltd 2.27 — USD -0.84 [ 6,620.00 - 9,890.00
Y Bunzl PLC 2.11 — USD 0.22 ] 1,918.50 - 2,363.57Amadeus IT Group SA A 2.04 74.40 USD 2.06 ] 49.33 - 75.04Croda International PLC 1.57 — USD 1.71 ] 3,612.00 - 5,070.00Symrise AG 1.34 78.58 USD -0.28 [ 56.91 - 79.60
% Assets in Top 5 Holdings 9.32
TIncrease YDecrease RNew to Portfolio
Top Sectors 05-31-2018Fund 3 Yr High 3 Yr Low Cat Avg
t Consumer Cyclical 17.88 19.81 17.88 19.14
s Consumer Defensive 16.88 19.73 16.88 9.33
p Industrials 15.35 15.35 12.58 18.84
a Technology 15.23 15.23 13.47 18.00
y Financial Services 12.10 12.57 11.46 10.53
Fund Cat Avg
0 5 10 15 20
Dividend and Capital Gains DistributionsDistributionDate
DistributionNAV
Long-TermCapital Gain
Short-TermCaptial Gain
Return ofCapital
DividendIncome
DistributionTotal
12-12-2017 34.69 0.4651 0.1178 0.0000 0.4002 0.983112-13-2016 27.90 0.3021 0.0000 0.0000 0.4763 0.778412-10-2015 28.25 0.0000 0.0000 0.0000 0.3547 0.354712-11-2014 27.74 0.0000 0.0000 0.0000 0.4142 0.414212-10-2013 28.38 0.0000 0.0000 0.0000 0.3915 0.3915
3 Year Average Morningstar Risk Measures
Risk vs. Category Low
Low Avg High
(108)
Return vs. Category Avg(108)
Pillars
Process ∞ PositivePerformance ∞ PositivePeople ∞ PositiveParent ∞ PositivePrice ∞ Positive
Rating „
Style Map
DeepVal
CoreVal
Core CoreGrow
HighGrow
Micro
Small
Medium
Large
Giant Weighted Averageof holdings
75% of fund’s stockholdings
Asset Allocation
%Net
%Short
%Long
Benchmark
CatAvg
Cash 4.74 0.26 5.00 0.04 3.04US Stock 1.42 0.00 1.42 1.60 1.44Non US Stock 93.84 0.00 93.84 97.95 94.22Bond 0.00 0.00 0.00 0.00 1.01Other 0.00 0.00 0.00 0.42 0.29
ManagementStart Date
David A. Antonelli —Peter F. Fruzzetti —José Luis García —Robert W. Lau —
Release date 07-18-2018
©2018 Morningstar. All Rights Reserved. Unless otherwise provided in a separate agreement, you may use this report only in the country in which its original distributor is based. Data as originally reported. Theinformation contained herein is not represented or warranted to be accurate, correct, complete, or timely. This report is for information purposes only, and should not be considered a solicitation to buy or sell any security.Redistribution is prohibited without written permission. To order reprints, call +1 312-696-6100. To license the research, call +1 312-696-6869. ß
®
Page 1 of 11Release date 07-18-2018
©2018 Morningstar. All Rights Reserved. Unless otherwise provided in a separate agreement, you may use this report only in the country in which its original distributor is based. Data as originally reported. Theinformation contained herein is not represented or warranted to be accurate, correct, complete, or timely. This report is for information purposes only, and should not be considered a solicitation to buy or sell any security.Redistribution is prohibited without written permission. To order reprints, call +1 312-696-6100. To license the research, call +1 312-696-6869. ß
®
Page 1 of 11
36

Oppenheimer Global Fund Class I OGLIX Morningstar Analyst Rating‰
NAV $ NAV Day Change % Yield TTM % Total Assets $ Status Min. Inv. Load Expenses Morningstar Rating TM Category Investment Style
100.99 ]0.52 | 0.52 0.89 12 Open $1 None 0.70% QQQQ World Large Stock 7 Large Growth
Growth of 10,000 07-17-2008 - 07-17-2018
5K
12K
19K
25K
2009 2010 2011 2012 2013 2014 2015 2016 2017 2018
Oppenheimer Global FundClass I $24,808.49World Large Stock$18,793.80MSCI ACWI Ex USA NR USD$13,790.58
Investment Strategy
The investment seeks capital appreciation. The fund invests mainly in common stock of U.S. and foreign companies. It can in-vest without limit in foreign securities and can invest in any country, including countries with developing or emerging markets.However, the fund currently emphasizes its investments in developed markets such as the United States, Western Europeancountries and Japan. It does not limit its investments to companies in a particular capitalization range, but primarily invests inmid- and large-cap companies. The fund normally will invest in at least three countries (one of which may be the United States).
Performance 07-17-2018
YTD 1 Mo 1 Yr 3Yr Ann 5Yr Ann 10Yr Ann
Growth of 10,000 10,518 9,977 11,739 13,262 17,415 24,390Fund 5.18 -0.23 17.39 9.87 11.73 9.33+/- MSCI ACWI Ex USA NRUSD
8.26 1.35 12.10 4.91 6.52 6.27
+/- Category 2.64 -0.16 6.52 1.89 2.97 2.60% Rank in Cat 19 57 11 19 11 —# of Funds in Cat 913 929 864 712 590 335* Currency is displayed in USD
Top Holdings 05-31-2018Weight % Last Price Day Chg % 52 Week Range
Alphabet Inc A 5.92 — USD -0.01 [ 918.60 - 1,221.59LVMH Moet Hennessy Louis VuittonSE
3.26 298.80 USD 1.00 ] 211.90 - 313.70
Airbus SE 3.24 107.20 USD -0.43 [ 68.42 - 109.10Adobe Systems Inc 3.16 259.78 USD 0.57 ] 143.95 - 260.94S&P Global Inc 2.69 214.26 USD 0.79 ] 147.07 - 214.90
% Assets in Top 5 Holdings 18.27
TIncrease YDecrease RNew to Portfolio
Top Sectors 06-30-2018Fund 3 Yr High 3 Yr Low Cat Avg
a Technology 30.59 30.59 25.41 18.37
y Financial Services 17.61 19.02 17.61 18.67
d Healthcare 15.66 16.28 15.00 11.66
t Consumer Cyclical 13.98 14.93 13.98 13.13
p Industrials 13.45 15.71 13.45 10.61
Fund Cat Avg
0 10 20 30 40
Dividend and Capital Gains DistributionsDistributionDate
DistributionNAV
Long-TermCapital Gain
Short-TermCaptial Gain
Return ofCapital
DividendIncome
DistributionTotal
12-06-2017 93.72 5.1492 0.0000 0.0000 0.9155 6.064712-05-2016 74.43 0.0000 0.0000 0.0000 0.8516 0.851612-07-2015 75.62 3.3125 0.0507 0.0000 0.8750 4.238212-08-2014 77.77 3.8205 0.0000 0.0000 1.0202 4.840712-09-2013 76.44 2.2865 0.0000 0.0000 0.9715 3.2580
3 Year Average Morningstar Risk Measures
Risk vs. Category +Avg
Low Avg High
(721)
Return vs. Category High(721)
Pillars
Process ∞ PositivePerformance ∞ PositivePeople ¶ NeutralParent ¶ NeutralPrice ∞ Positive
Rating ‰
Style Map
DeepVal
CoreVal
Core CoreGrow
HighGrow
Micro
Small
Medium
Large
Giant Weighted Averageof holdings
75% of fund’s stockholdings
Asset Allocation
Asset Class % Net
Cash 0.15US Stock 48.46Non US Stock 51.05Bond 0.00Other 0.34
ManagementStart Date
Rajeev Bhaman —John C. Delano —
Release date 07-18-2018
©2018 Morningstar. All Rights Reserved. Unless otherwise provided in a separate agreement, you may use this report only in the country in which its original distributor is based. Data as originally reported. Theinformation contained herein is not represented or warranted to be accurate, correct, complete, or timely. This report is for information purposes only, and should not be considered a solicitation to buy or sell any security.Redistribution is prohibited without written permission. To order reprints, call +1 312-696-6100. To license the research, call +1 312-696-6869. ß
®
Page 1 of 11Release date 07-18-2018
©2018 Morningstar. All Rights Reserved. Unless otherwise provided in a separate agreement, you may use this report only in the country in which its original distributor is based. Data as originally reported. Theinformation contained herein is not represented or warranted to be accurate, correct, complete, or timely. This report is for information purposes only, and should not be considered a solicitation to buy or sell any security.Redistribution is prohibited without written permission. To order reprints, call +1 312-696-6100. To license the research, call +1 312-696-6869. ß
®
Page 1 of 11
37

Fees and Expenses
6/30/18 3/31/18 Investment Management Fee 0.04%Number of Long Term Holdings 152 154 Participant Book Value Guarantee (Wrap) Fee 0.15%Market Value of Assets $95.01 MM $95.42 MM Total Fees 0.19%Book Value Liabilities (participant account balances) $97.86 MM $98.03 MMMarket Value of Assets to Book Value of Liabilities 97.1% 97.3%Average Life 3.8 Years 4.0 YearsAverage Duration 3.1 Years 3.2 YearsCredited Rate 1.90% 2Q 2018 1.77% 1Q 2018Next Quarter Credited Rate 1.89% 3Q 2018
Average Rating (S&P / Moody's / Fitch)
Fund Allocation(in millions)
Market Value
% of Portfolio
Market Value
% of Portfolio
Agency MBS 46.37$ 48.8% 44.46$ 46.6%Agency CMO 3.79$ 4.0% 5.34$ 5.6%Agency CMBS 12.08$ 12.7% 12.79$ 13.4%Agency Securities 0.28$ 0.3% 0.67$ 0.7%Asset Backed Securities 5.76$ 6.1% 6.94$ 7.3%Non-Agency CMBS 9.23$ 9.7% 8.68$ 9.1%Corporate Bonds 16.94$ 17.8% 15.46$ 16.2%Total Market Value of Long Term Holdings 94.45$ 99.4% 94.33$ 98.9%Cash, Short term & Other 0.56$ 0.6% 1.09$ 1.1%Total Market Value of Assets 95.01$ 100.0% 95.42$ 100.0%
AA+/AAA/AAA
Pasadena Custom Stable Value FundQuarterly Statement as of
June 30, 2018
AA+/AAA/AAA
6/30/18 3/31/18
Fund Characteristics
Agency MBS49%
Agency CMO4%
Agency CMBS13%
Agency Securities
0%
Asset Backed Securities
6%
Non-Agency CMBS10%
Corporate Bonds18%
Cash0%
For Plan Sponsor use only - Not for use with Plan ParticipantsConfidential - Do not disclose or disseminate
38

Annual Performance 3-Month YTD 1-Yr 3-Yr 5-Yr 10-YrSince
InceptionPasadena Custom Stable Value Fund (net of fees) 0.47% 0.91% 1.78% 1.69% 1.72% N/A 1.71%
####### ####### ####### ####### 12/1/2013Calendar Year Performance 2017 2016 2015 2014 2013Pasadena Custom Stable Value Fund (net of fees) 1.70% 1.64% 1.58% 1.46% 2.00%
30-Jun 31-May 30-Apr 31-MarCurrent Yield of the Portfolio Based on BV of Assets 2.32% 2.25% 2.22% 2.22%Amortization of Realized G/L AND of Asset/Liability Differential -0.13% -0.11% -0.11% -0.11%Net Investment Performance 2.19% 2.14% 2.11% 2.11%Investment Management Fees -0.04% -0.04% -0.04% -0.04%Participant Book Value Guarantee (Wrap) Fee -0.15% -0.15% -0.15% -0.15%Investment Performance After Fees 2.00% 1.95% 1.92% 1.92%
Credited Rate History
1Q 2Q 3Q 4Q2018 1.77% 1.90%2017 1.66% 1.67% 1.71% 1.75%2016 1.72% 1.58% 1.60% 1.65%2015 1.46% 1.55% 1.63% 1.68%2014 1.73% 1.26% 1.41% 1.42%2013 1.92% 2.05% 2.04% 1.99%2012 N/A N/A 2.00% 1.95%
Performance/Credited Rates
Pasadena Custom Stable Value FundQuarterly Statement as of
June 30, 2018
For Plan Sponsor use only - Not for use with Plan ParticipantsConfidential - Do not disclose or disseminate
39

Vanguard International Value Fund Investor Shares VTRIX Morningstar Analyst Rating´
NAV $ NAV Day Change % Yield TTM % Total Assets $ Status Min. Inv. Load Expenses Morningstar Rating TM Category Investment Style
38.71 ]0.06 | 0.16 1.94 10 Open $3,000 None 0.40% QQQQ Foreign Large Value 4 Large Blend
Growth of 10,000 07-17-2008 - 07-17-2018
5K
9K
12K
15K
2009 2010 2011 2012 2013 2014 2015 2016 2017 2018
Vanguard International ValueFund Investor Shares$13,667.78Foreign Large Value$13,164.33MSCI ACWI Ex USA NR USD$13,790.58
Investment Strategy
The investment seeks to provide long-term capital appreciation. The fund invests mainly in common stocks of companies loc-ated outside the United States that are considered by an advisor to be undervalued. Such stocks, called value stocks, often areout of favor in periods when investors are drawn to companies with strong prospects for growth. It invests in large-, mid-, andsmall-capitalization companies and is expected to diversify its assets in countries across developed and emerging markets. Thefund uses multiple investment advisors.
Performance 07-17-2018
YTD 1 Mo 1 Yr 3Yr Ann 5Yr Ann 10Yr Ann
Growth of 10,000 9,707 9,890 10,664 11,334 12,858 13,498Fund -2.93 -1.10 6.64 4.26 5.16 3.04+/- MSCI ACWI Ex USA NRUSD
0.15 0.48 1.36 -0.69 -0.06 -0.01
+/- Category 0.86 0.37 3.95 0.90 0.95 0.51% Rank in Cat 28 31 8 31 26 36# of Funds in Cat 318 326 316 273 225 144* Currency is displayed in USD
Top Holdings 03-31-2018Weight % Last Price Day Chg % 52 Week Range
Y Novartis AG 1.91 80.66 USD 3.15 ] 71.84 - 88.30
Y DBS Group Holdings Ltd 1.73 25.86 USD -0.58 [ 20.01 - 31.28
Y Royal Dutch Shell PLC Class A 1.66 — USD 0.63 ] 2,040.50 - 2,755.00
T Sumitomo Mitsui Financial Group Inc 1.56 — USD 0.65 ] 3,973.00 - 5,333.00
T Total SA 1.50 52.90 USD 0.28 ] 42.22 - 54.95
% Assets in Top 5 Holdings 8.35
TIncrease YDecrease RNew to Portfolio
Top Sectors 03-31-2018Fund 3 Yr High 3 Yr Low Cat Avg
y Financial Services 24.22 24.67 20.70 23.77
a Technology 17.73 17.73 14.49 6.56
p Industrials 10.46 11.52 10.46 11.37
t Consumer Cyclical 10.45 13.34 10.45 11.66
o Energy 10.16 10.89 9.46 9.62
Fund Cat Avg
0 10 20 30 40
Dividend and Capital Gains DistributionsDistributionDate
DistributionNAV
Long-TermCapital Gain
Short-TermCaptial Gain
Return ofCapital
DividendIncome
DistributionTotal
12-18-2017 39.59 0.0000 0.0000 0.0000 0.7427 0.742712-23-2016 31.76 0.0000 0.0000 0.0000 0.7260 0.726012-18-2015 30.60 0.0000 0.0000 0.0000 0.6620 0.662012-26-2014 34.53 0.0000 0.0000 0.0000 0.9460 0.946012-26-2013 36.95 0.0000 0.0000 0.0000 0.6970 0.6970
3 Year Average Morningstar Risk Measures
Risk vs. Category Avg
Low Avg High
(271)
Return vs. Category Avg(271)
Pillars
Process ∞ PositivePerformance ¶ NeutralPeople ∞ PositiveParent ∞ PositivePrice ∞ Positive
Rating ´
Style Map
DeepVal
CoreVal
Core CoreGrow
HighGrow
Micro
Small
Medium
Large
Giant Weighted Averageof holdings
75% of fund’s stockholdings
Asset Allocation
Asset Class % Net
Cash 4.39US Stock 5.05Non US Stock 87.83Bond 0.60Other 2.12
ManagementStart Date
Sandy Nairn —Michael A. Bennett —Michael G. Fry —A. Rama Krishna —Steven Morrow —
Release date 07-18-2018
©2018 Morningstar. All Rights Reserved. Unless otherwise provided in a separate agreement, you may use this report only in the country in which its original distributor is based. Data as originally reported. Theinformation contained herein is not represented or warranted to be accurate, correct, complete, or timely. This report is for information purposes only, and should not be considered a solicitation to buy or sell any security.Redistribution is prohibited without written permission. To order reprints, call +1 312-696-6100. To license the research, call +1 312-696-6869. ß
®
Page 1 of 11Release date 07-18-2018
©2018 Morningstar. All Rights Reserved. Unless otherwise provided in a separate agreement, you may use this report only in the country in which its original distributor is based. Data as originally reported. Theinformation contained herein is not represented or warranted to be accurate, correct, complete, or timely. This report is for information purposes only, and should not be considered a solicitation to buy or sell any security.Redistribution is prohibited without written permission. To order reprints, call +1 312-696-6100. To license the research, call +1 312-696-6869. ß
®
Page 1 of 11
40
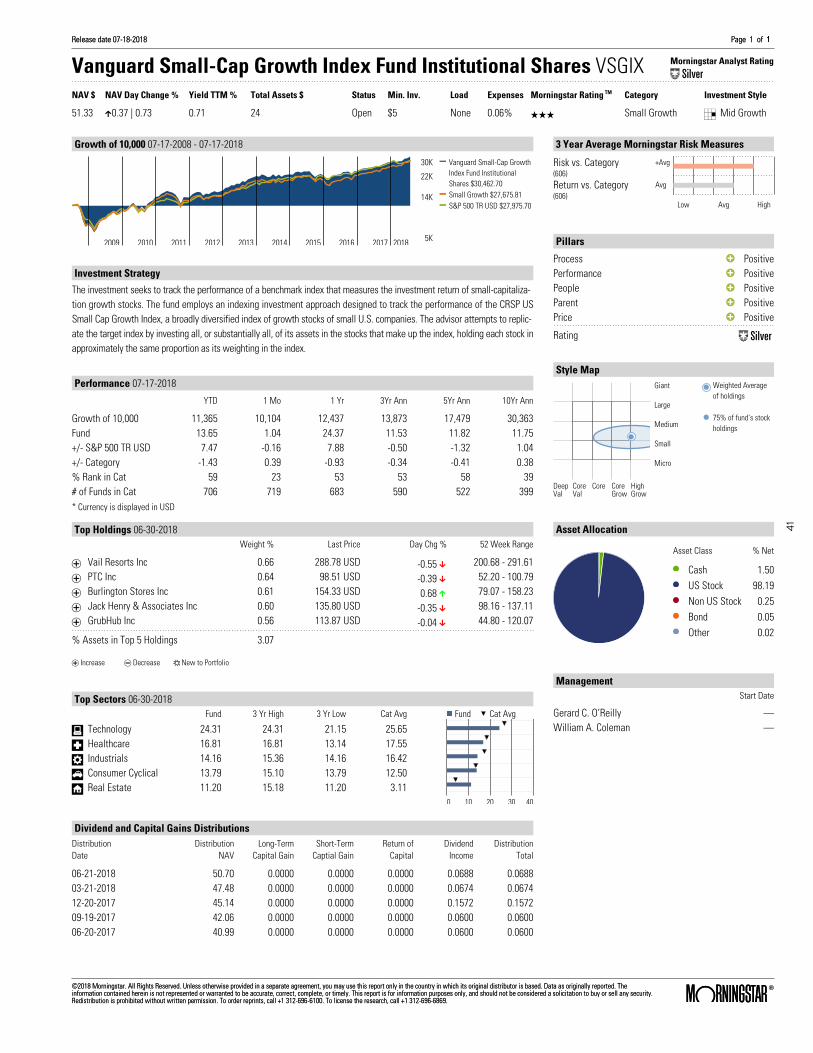
Vanguard Small-Cap Growth Index Fund Institutional Shares VSGIX Morningstar Analyst Rating„
NAV $ NAV Day Change % Yield TTM % Total Assets $ Status Min. Inv. Load Expenses Morningstar Rating TM Category Investment Style
51.33 ]0.37 | 0.73 0.71 24 Open $5 None 0.06% QQQ Small Growth 8 Mid Growth
Growth of 10,000 07-17-2008 - 07-17-2018
5K
14K
22K
30K
2009 2010 2011 2012 2013 2014 2015 2016 2017 2018
Vanguard Small-Cap GrowthIndex Fund InstitutionalShares $30,462.70Small Growth $27,675.81S&P 500 TR USD $27,975.70
Investment Strategy
The investment seeks to track the performance of a benchmark index that measures the investment return of small-capitaliza-tion growth stocks. The fund employs an indexing investment approach designed to track the performance of the CRSP USSmall Cap Growth Index, a broadly diversified index of growth stocks of small U.S. companies. The advisor attempts to replic-ate the target index by investing all, or substantially all, of its assets in the stocks that make up the index, holding each stock inapproximately the same proportion as its weighting in the index.
Performance 07-17-2018
YTD 1 Mo 1 Yr 3Yr Ann 5Yr Ann 10Yr Ann
Growth of 10,000 11,365 10,104 12,437 13,873 17,479 30,363Fund 13.65 1.04 24.37 11.53 11.82 11.75+/- S&P 500 TR USD 7.47 -0.16 7.88 -0.50 -1.32 1.04+/- Category -1.43 0.39 -0.93 -0.34 -0.41 0.38% Rank in Cat 59 23 53 53 58 39# of Funds in Cat 706 719 683 590 522 399* Currency is displayed in USD
Top Holdings 06-30-2018Weight % Last Price Day Chg % 52 Week Range
T Vail Resorts Inc 0.66 288.78 USD -0.55 [ 200.68 - 291.61
T PTC Inc 0.64 98.51 USD -0.39 [ 52.20 - 100.79
T Burlington Stores Inc 0.61 154.33 USD 0.68 ] 79.07 - 158.23
T Jack Henry & Associates Inc 0.60 135.80 USD -0.35 [ 98.16 - 137.11
T GrubHub Inc 0.56 113.87 USD -0.04 [ 44.80 - 120.07
% Assets in Top 5 Holdings 3.07
TIncrease YDecrease RNew to Portfolio
Top Sectors 06-30-2018Fund 3 Yr High 3 Yr Low Cat Avg
a Technology 24.31 24.31 21.15 25.65
d Healthcare 16.81 16.81 13.14 17.55
p Industrials 14.16 15.36 14.16 16.42
t Consumer Cyclical 13.79 15.10 13.79 12.50
u Real Estate 11.20 15.18 11.20 3.11
Fund Cat Avg
0 10 20 30 40
Dividend and Capital Gains DistributionsDistributionDate
DistributionNAV
Long-TermCapital Gain
Short-TermCaptial Gain
Return ofCapital
DividendIncome
DistributionTotal
06-21-2018 50.70 0.0000 0.0000 0.0000 0.0688 0.068803-21-2018 47.48 0.0000 0.0000 0.0000 0.0674 0.067412-20-2017 45.14 0.0000 0.0000 0.0000 0.1572 0.157209-19-2017 42.06 0.0000 0.0000 0.0000 0.0600 0.060006-20-2017 40.99 0.0000 0.0000 0.0000 0.0600 0.0600
3 Year Average Morningstar Risk Measures
Risk vs. Category +Avg
Low Avg High
(606)
Return vs. Category Avg(606)
Pillars
Process ∞ PositivePerformance ∞ PositivePeople ∞ PositiveParent ∞ PositivePrice ∞ Positive
Rating „
Style Map
DeepVal
CoreVal
Core CoreGrow
HighGrow
Micro
Small
Medium
Large
Giant Weighted Averageof holdings
75% of fund’s stockholdings
Asset Allocation
Asset Class % Net
Cash 1.50US Stock 98.19Non US Stock 0.25Bond 0.05Other 0.02
ManagementStart Date
Gerard C. O’Reilly —William A. Coleman —
Release date 07-18-2018
©2018 Morningstar. All Rights Reserved. Unless otherwise provided in a separate agreement, you may use this report only in the country in which its original distributor is based. Data as originally reported. Theinformation contained herein is not represented or warranted to be accurate, correct, complete, or timely. This report is for information purposes only, and should not be considered a solicitation to buy or sell any security.Redistribution is prohibited without written permission. To order reprints, call +1 312-696-6100. To license the research, call +1 312-696-6869. ß
®
Page 1 of 11Release date 07-18-2018
©2018 Morningstar. All Rights Reserved. Unless otherwise provided in a separate agreement, you may use this report only in the country in which its original distributor is based. Data as originally reported. Theinformation contained herein is not represented or warranted to be accurate, correct, complete, or timely. This report is for information purposes only, and should not be considered a solicitation to buy or sell any security.Redistribution is prohibited without written permission. To order reprints, call +1 312-696-6100. To license the research, call +1 312-696-6869. ß
®
Page 1 of 11
41
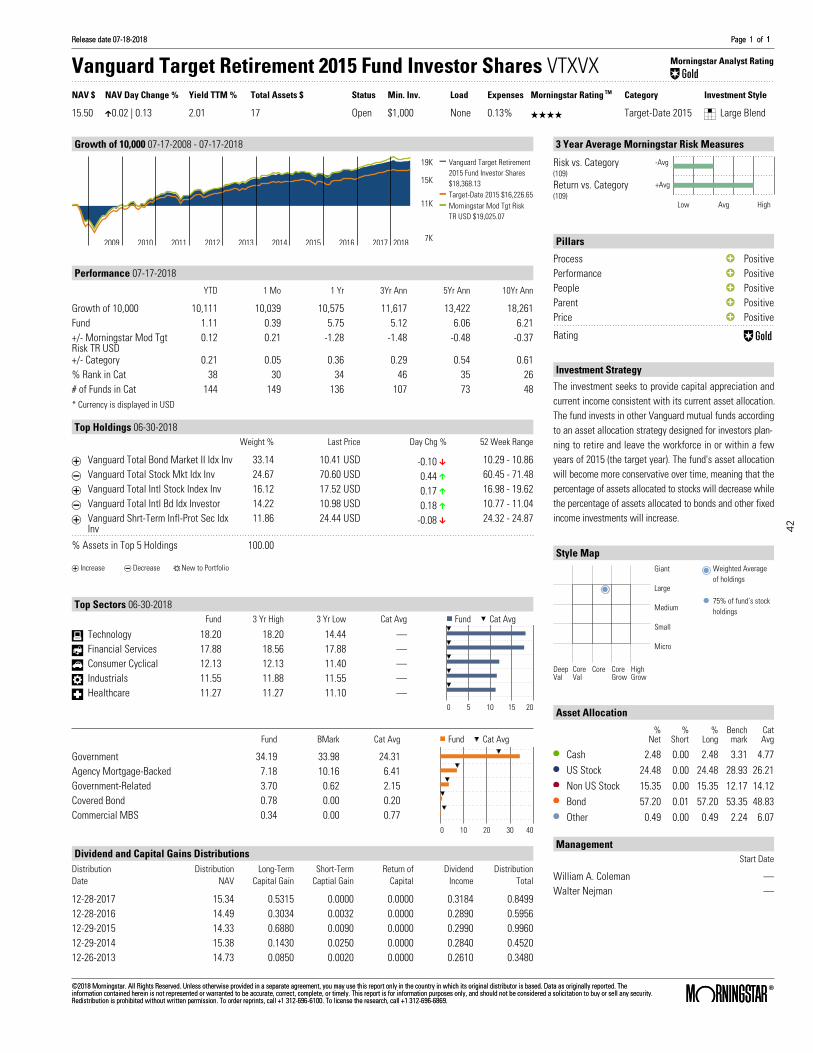
Vanguard Target Retirement 2015 Fund Investor Shares VTXVX Morningstar Analyst RatingŒ
NAV $ NAV Day Change % Yield TTM % Total Assets $ Status Min. Inv. Load Expenses Morningstar Rating TM Category Investment Style
15.50 ]0.02 | 0.13 2.01 17 Open $1,000 None 0.13% QQQQ Target-Date 2015 4 Large Blend
Growth of 10,000 07-17-2008 - 07-17-2018
7K
11K
15K
19K
2009 2010 2011 2012 2013 2014 2015 2016 2017 2018
Vanguard Target Retirement2015 Fund Investor Shares$18,368.13Target-Date 2015 $16,226.65Morningstar Mod Tgt RiskTR USD $19,025.07
Performance 07-17-2018
YTD 1 Mo 1 Yr 3Yr Ann 5Yr Ann 10Yr Ann
Growth of 10,000 10,111 10,039 10,575 11,617 13,422 18,261Fund 1.11 0.39 5.75 5.12 6.06 6.21+/- Morningstar Mod TgtRisk TR USD
0.12 0.21 -1.28 -1.48 -0.48 -0.37
+/- Category 0.21 0.05 0.36 0.29 0.54 0.61% Rank in Cat 38 30 34 46 35 26# of Funds in Cat 144 149 136 107 73 48* Currency is displayed in USD
Top Holdings 06-30-2018Weight % Last Price Day Chg % 52 Week Range
T Vanguard Total Bond Market II Idx Inv 33.14 10.41 USD -0.10 [ 10.29 - 10.86
Y Vanguard Total Stock Mkt Idx Inv 24.67 70.60 USD 0.44 ] 60.45 - 71.48
T Vanguard Total Intl Stock Index Inv 16.12 17.52 USD 0.17 ] 16.98 - 19.62
Y Vanguard Total Intl Bd Idx Investor 14.22 10.98 USD 0.18 ] 10.77 - 11.04
T Vanguard Shrt-Term Infl-Prot Sec IdxInv
11.86 24.44 USD -0.08 [ 24.32 - 24.87
% Assets in Top 5 Holdings 100.00
TIncrease YDecrease RNew to Portfolio
Top Sectors 06-30-2018Fund 3 Yr High 3 Yr Low Cat Avg
a Technology 18.20 18.20 14.44 —
y Financial Services 17.88 18.56 17.88 —
t Consumer Cyclical 12.13 12.13 11.40 —
p Industrials 11.55 11.88 11.55 —
d Healthcare 11.27 11.27 11.10 —
Fund Cat Avg
0 5 10 15 20
Fund BMark Cat Avg
Government 34.19 33.98 24.31Agency Mortgage-Backed 7.18 10.16 6.41Government-Related 3.70 0.62 2.15Covered Bond 0.78 0.00 0.20Commercial MBS 0.34 0.00 0.77
Fund Cat Avg
0 10 20 30 40
Dividend and Capital Gains DistributionsDistributionDate
DistributionNAV
Long-TermCapital Gain
Short-TermCaptial Gain
Return ofCapital
DividendIncome
DistributionTotal
12-28-2017 15.34 0.5315 0.0000 0.0000 0.3184 0.849912-28-2016 14.49 0.3034 0.0032 0.0000 0.2890 0.595612-29-2015 14.33 0.6880 0.0090 0.0000 0.2990 0.996012-29-2014 15.38 0.1430 0.0250 0.0000 0.2840 0.452012-26-2013 14.73 0.0850 0.0020 0.0000 0.2610 0.3480
3 Year Average Morningstar Risk Measures
Risk vs. Category -Avg
Low Avg High
(109)
Return vs. Category +Avg(109)
Pillars
Process ∞ PositivePerformance ∞ PositivePeople ∞ PositiveParent ∞ PositivePrice ∞ Positive
Rating Œ
Investment Strategy
The investment seeks to provide capital appreciation andcurrent income consistent with its current asset allocation.The fund invests in other Vanguard mutual funds accordingto an asset allocation strategy designed for investors plan-ning to retire and leave the workforce in or within a fewyears of 2015 (the target year). The fund's asset allocationwill become more conservative over time, meaning that thepercentage of assets allocated to stocks will decrease whilethe percentage of assets allocated to bonds and other fixedincome investments will increase.
Style Map
DeepVal
CoreVal
Core CoreGrow
HighGrow
Micro
Small
Medium
Large
Giant Weighted Averageof holdings
75% of fund’s stockholdings
Asset Allocation
%Net
%Short
%Long
Benchmark
CatAvg
Cash 2.48 0.00 2.48 3.31 4.77US Stock 24.48 0.00 24.48 28.93 26.21Non US Stock 15.35 0.00 15.35 12.17 14.12Bond 57.20 0.01 57.20 53.35 48.83Other 0.49 0.00 0.49 2.24 6.07
ManagementStart Date
William A. Coleman —Walter Nejman —
Release date 07-18-2018
©2018 Morningstar. All Rights Reserved. Unless otherwise provided in a separate agreement, you may use this report only in the country in which its original distributor is based. Data as originally reported. Theinformation contained herein is not represented or warranted to be accurate, correct, complete, or timely. This report is for information purposes only, and should not be considered a solicitation to buy or sell any security.Redistribution is prohibited without written permission. To order reprints, call +1 312-696-6100. To license the research, call +1 312-696-6869. ß
®
Page 1 of 11Release date 07-18-2018
©2018 Morningstar. All Rights Reserved. Unless otherwise provided in a separate agreement, you may use this report only in the country in which its original distributor is based. Data as originally reported. Theinformation contained herein is not represented or warranted to be accurate, correct, complete, or timely. This report is for information purposes only, and should not be considered a solicitation to buy or sell any security.Redistribution is prohibited without written permission. To order reprints, call +1 312-696-6100. To license the research, call +1 312-696-6869. ß
®
Page 1 of 11
42

Vanguard Target Retirement 2020 Fund Investor Shares VTWNX Morningstar Analyst RatingŒ
NAV $ NAV Day Change % Yield TTM % Total Assets $ Status Min. Inv. Load Expenses Morningstar Rating TM Category Investment Style
31.84 ]0.06 | 0.19 2.00 33 Open $1,000 None 0.13% QQQQQ Target-Date 2020 4 Large Blend
Growth of 10,000 07-17-2008 - 07-17-2018
7K
11K
15K
20K
2009 2010 2011 2012 2013 2014 2015 2016 2017 2018
Vanguard Target Retirement2020 Fund Investor Shares$19,332.86Target-Date 2020 $16,886.62Morningstar Mod Tgt RiskTR USD $19,025.07
Performance 07-17-2018
YTD 1 Mo 1 Yr 3Yr Ann 5Yr Ann 10Yr Ann
Growth of 10,000 10,147 10,028 10,711 11,943 14,070 19,206Fund 1.47 0.28 7.11 6.10 7.07 6.74+/- Morningstar Mod TgtRisk TR USD
0.48 0.10 0.08 -0.50 0.53 0.17
+/- Category 0.53 0.03 1.21 1.02 1.38 1.12% Rank in Cat 23 54 19 12 9 11# of Funds in Cat 262 268 252 203 165 106* Currency is displayed in USD
Top Holdings 06-30-2018Weight % Last Price Day Chg % 52 Week Range
Y Vanguard Total Stock Mkt Idx Inv 32.57 70.60 USD 0.44 ] 60.45 - 71.48
T Vanguard Total Bond Market II Idx Inv 29.17 10.41 USD -0.10 [ 10.29 - 10.86
T Vanguard Total Intl Stock Index Inv 21.03 17.52 USD 0.17 ] 16.98 - 19.62
T Vanguard Total Intl Bd Idx Investor 12.42 10.98 USD 0.18 ] 10.77 - 11.04
T Vanguard Shrt-Term Infl-Prot Sec IdxInv
4.83 24.44 USD -0.08 [ 24.32 - 24.87
% Assets in Top 5 Holdings 100.00
TIncrease YDecrease RNew to Portfolio
Top Sectors 06-30-2018Fund 3 Yr High 3 Yr Low Cat Avg
a Technology 18.23 18.23 14.46 —
y Financial Services 17.87 18.56 17.87 —
t Consumer Cyclical 12.13 12.13 11.40 —
p Industrials 11.55 11.88 11.55 —
d Healthcare 11.29 11.29 11.11 —
Fund Cat Avg
0 5 10 15 20
Fund BMark Cat Avg
Government 24.60 29.63 20.26Agency Mortgage-Backed 6.32 9.25 8.28Government-Related 3.25 0.60 1.73Covered Bond 0.68 0.00 0.03Commercial MBS 0.30 0.00 0.73
Fund Cat Avg
0 10 20 30 40
Dividend and Capital Gains DistributionsDistributionDate
DistributionNAV
Long-TermCapital Gain
Short-TermCaptial Gain
Return ofCapital
DividendIncome
DistributionTotal
12-28-2017 31.42 0.2164 0.0125 0.0000 0.6312 0.860112-28-2016 28.21 0.2069 0.0064 0.0000 0.5620 0.775312-29-2015 27.40 0.4840 0.0510 0.0000 0.5910 1.126012-29-2014 28.67 0.0040 0.0370 0.0000 0.5410 0.582012-26-2013 27.00 0.0070 0.0040 0.0000 0.4840 0.4950
3 Year Average Morningstar Risk Measures
Risk vs. Category Avg
Low Avg High
(203)
Return vs. Category +Avg(203)
Pillars
Process ∞ PositivePerformance ∞ PositivePeople ∞ PositiveParent ∞ PositivePrice ∞ Positive
Rating Œ
Investment Strategy
The investment seeks to provide capital appreciation andcurrent income consistent with its current asset allocation.The fund invests in other Vanguard mutual funds accordingto an asset allocation strategy designed for investors plan-ning to retire and leave the workforce in or within a fewyears of 2020 (the target year). The fund's asset allocationwill become more conservative over time, meaning that thepercentage of assets allocated to stocks will decrease whilethe percentage of assets allocated to bonds and other fixedincome investments will increase.
Style Map
DeepVal
CoreVal
Core CoreGrow
HighGrow
Micro
Small
Medium
Large
Giant Weighted Averageof holdings
75% of fund’s stockholdings
Asset Allocation
%Net
%Short
%Long
Benchmark
CatAvg
Cash 2.35 0.00 2.35 2.50 6.30US Stock 32.32 0.00 32.32 32.22 28.62Non US Stock 20.03 0.00 20.03 14.46 14.05Bond 44.83 0.00 44.83 48.49 45.08Other 0.49 0.00 0.49 2.33 5.96
ManagementStart Date
William A. Coleman —Walter Nejman —
Release date 07-18-2018
©2018 Morningstar. All Rights Reserved. Unless otherwise provided in a separate agreement, you may use this report only in the country in which its original distributor is based. Data as originally reported. Theinformation contained herein is not represented or warranted to be accurate, correct, complete, or timely. This report is for information purposes only, and should not be considered a solicitation to buy or sell any security.Redistribution is prohibited without written permission. To order reprints, call +1 312-696-6100. To license the research, call +1 312-696-6869. ß
®
Page 1 of 11Release date 07-18-2018
©2018 Morningstar. All Rights Reserved. Unless otherwise provided in a separate agreement, you may use this report only in the country in which its original distributor is based. Data as originally reported. Theinformation contained herein is not represented or warranted to be accurate, correct, complete, or timely. This report is for information purposes only, and should not be considered a solicitation to buy or sell any security.Redistribution is prohibited without written permission. To order reprints, call +1 312-696-6100. To license the research, call +1 312-696-6869. ß
®
Page 1 of 11
43

Vanguard Target Retirement 2025 Fund Investor Shares VTTVX Morningstar Analyst RatingŒ
NAV $ NAV Day Change % Yield TTM % Total Assets $ Status Min. Inv. Load Expenses Morningstar Rating TM Category Investment Style
18.81 ]0.04 | 0.21 1.99 41 Open $1,000 None 0.14% QQQQ Target-Date 2025 4 Large Blend
Growth of 10,000 07-17-2008 - 07-17-2018
6K
11K
16K
20K
2009 2010 2011 2012 2013 2014 2015 2016 2017 2018
Vanguard Target Retirement2025 Fund Investor Shares$19,935.89Target-Date 2025 $17,664.44Morningstar Mod Tgt RiskTR USD $19,025.07
Performance 07-17-2018
YTD 1 Mo 1 Yr 3Yr Ann 5Yr Ann 10Yr Ann
Growth of 10,000 10,168 10,027 10,810 12,158 14,497 19,775Fund 1.68 0.27 8.10 6.73 7.71 7.06+/- Morningstar Mod TgtRisk TR USD
0.69 0.08 1.07 0.13 1.17 0.48
+/- Category 0.34 0.02 0.98 0.88 1.19 0.75% Rank in Cat 38 44 24 14 10 23# of Funds in Cat 228 236 220 176 136 71* Currency is displayed in USD
Top Holdings 06-30-2018Weight % Last Price Day Chg % 52 Week Range
Y Vanguard Total Stock Mkt Idx Inv 38.02 70.60 USD 0.44 ] 60.45 - 71.48
T Vanguard Total Bond Market II Idx Inv 26.29 10.41 USD -0.10 [ 10.29 - 10.86
T Vanguard Total Intl Stock Index Inv 24.47 17.52 USD 0.17 ] 16.98 - 19.62
T Vanguard Total Intl Bd Idx Investor 11.22 10.98 USD 0.18 ] 10.77 - 11.04
% Assets in Top 5 Holdings 100.00
TIncrease YDecrease RNew to Portfolio
Top Sectors 06-30-2018Fund 3 Yr High 3 Yr Low Cat Avg
a Technology 18.24 18.24 14.57 —
y Financial Services 17.86 18.55 17.86 —
t Consumer Cyclical 12.13 12.13 11.40 —
p Industrials 11.55 11.95 11.55 —
d Healthcare 11.29 11.29 11.11 —
Fund Cat Avg
0 5 10 15 20
Fund BMark Cat Avg
Government 17.98 24.31 14.05Agency Mortgage-Backed 5.69 7.92 6.00Government-Related 2.93 0.55 1.07Covered Bond 0.61 0.00 0.04Commercial MBS 0.27 0.00 0.61
Fund Cat Avg
0 5 10 15 20
Dividend and Capital Gains DistributionsDistributionDate
DistributionNAV
Long-TermCapital Gain
Short-TermCaptial Gain
Return ofCapital
DividendIncome
DistributionTotal
12-28-2017 18.53 0.0773 0.0104 0.0000 0.3693 0.457012-28-2016 16.32 0.1079 0.0029 0.0000 0.3270 0.437812-29-2015 15.79 0.3980 0.0380 0.0000 0.3420 0.778012-29-2014 16.67 0.0090 0.0210 0.0000 0.3220 0.352012-26-2013 15.68 0.0000 0.0170 0.0000 0.2870 0.3040
3 Year Average Morningstar Risk Measures
Risk vs. Category Avg
Low Avg High
(178)
Return vs. Category +Avg(178)
Pillars
Process ∞ PositivePerformance ∞ PositivePeople ∞ PositiveParent ∞ PositivePrice ∞ Positive
Rating Œ
Investment Strategy
The investment seeks to provide capital appreciation andcurrent income consistent with its current asset allocation.The fund invests in other Vanguard mutual funds accordingto an asset allocation strategy designed for investors plan-ning to retire and leave the workforce in or within a fewyears of 2025 (the target year). The fund's asset allocationwill become more conservative over time, meaning that thepercentage of assets allocated to stocks will decrease whilethe percentage of assets allocated to bonds and other fixedincome investments will increase.
Style Map
DeepVal
CoreVal
Core CoreGrow
HighGrow
Micro
Small
Medium
Large
Giant Weighted Averageof holdings
75% of fund’s stockholdings
Asset Allocation
%Net
%Short
%Long
Benchmark
CatAvg
Cash 2.26 0.00 2.26 1.72 4.91US Stock 37.72 0.00 37.72 36.80 33.75Non US Stock 23.31 0.00 23.31 17.62 17.55Bond 36.23 0.00 36.24 41.44 33.47Other 0.48 0.00 0.48 2.42 10.32
ManagementStart Date
William A. Coleman —Walter Nejman —
Release date 07-18-2018
©2018 Morningstar. All Rights Reserved. Unless otherwise provided in a separate agreement, you may use this report only in the country in which its original distributor is based. Data as originally reported. Theinformation contained herein is not represented or warranted to be accurate, correct, complete, or timely. This report is for information purposes only, and should not be considered a solicitation to buy or sell any security.Redistribution is prohibited without written permission. To order reprints, call +1 312-696-6100. To license the research, call +1 312-696-6869. ß
®
Page 1 of 11Release date 07-18-2018
©2018 Morningstar. All Rights Reserved. Unless otherwise provided in a separate agreement, you may use this report only in the country in which its original distributor is based. Data as originally reported. Theinformation contained herein is not represented or warranted to be accurate, correct, complete, or timely. This report is for information purposes only, and should not be considered a solicitation to buy or sell any security.Redistribution is prohibited without written permission. To order reprints, call +1 312-696-6100. To license the research, call +1 312-696-6869. ß
®
Page 1 of 11
44

Vanguard Target Retirement 2030 Fund Investor Shares VTHRX Morningstar Analyst RatingŒ
NAV $ NAV Day Change % Yield TTM % Total Assets $ Status Min. Inv. Load Expenses Morningstar Rating TM Category Investment Style
34.29 ]0.08 | 0.23 1.99 34 Open $1,000 None 0.14% QQQQ Target-Date 2030 4 Large Blend
Growth of 10,000 07-17-2008 - 07-17-2018
6K
11K
16K
21K
2009 2010 2011 2012 2013 2014 2015 2016 2017 2018
Vanguard Target Retirement2030 Fund Investor Shares$20,485.99Target-Date 2030 $18,126.49Morningstar Mod Tgt RiskTR USD $19,025.07
Performance 07-17-2018
YTD 1 Mo 1 Yr 3Yr Ann 5Yr Ann 10Yr Ann
Growth of 10,000 10,196 10,020 10,897 12,332 14,874 20,303Fund 1.96 0.20 8.97 7.24 8.26 7.34+/- Morningstar Mod TgtRisk TR USD
0.98 0.02 1.94 0.64 1.72 0.76
+/- Category 0.30 0.05 0.71 0.73 1.08 0.91% Rank in Cat 44 48 34 24 16 20# of Funds in Cat 251 257 241 193 155 96* Currency is displayed in USD
Top Holdings 06-30-2018Weight % Last Price Day Chg % 52 Week Range
T Vanguard Total Stock Mkt Idx Inv 42.49 70.60 USD 0.44 ] 60.45 - 71.48
T Vanguard Total Intl Stock Index Inv 27.53 17.52 USD 0.17 ] 16.98 - 19.62
T Vanguard Total Bond Market II Idx Inv 20.99 10.41 USD -0.10 [ 10.29 - 10.86
T Vanguard Total Intl Bd Idx Investor 8.96 10.98 USD 0.18 ] 10.77 - 11.04
% Assets in Top 5 Holdings 99.97
TIncrease YDecrease RNew to Portfolio
Top Sectors 06-30-2018Fund 3 Yr High 3 Yr Low Cat Avg
a Technology 18.22 18.22 14.58 —
y Financial Services 17.87 18.55 17.87 —
t Consumer Cyclical 12.13 12.13 11.40 —
p Industrials 11.55 11.95 11.55 —
d Healthcare 11.29 11.29 11.12 —
Fund Cat Avg
0 5 10 15 20
Fund BMark Cat Avg
Government 14.36 17.86 10.03Agency Mortgage-Backed 4.55 6.07 4.81Government-Related 2.34 0.45 0.80Covered Bond 0.49 0.00 0.01Commercial MBS 0.22 0.00 0.46
Fund Cat Avg
0 5 10 15 20
Dividend and Capital Gains DistributionsDistributionDate
DistributionNAV
Long-TermCapital Gain
Short-TermCaptial Gain
Return ofCapital
DividendIncome
DistributionTotal
12-28-2017 33.69 0.0033 0.0157 0.0000 0.6695 0.688512-28-2016 29.17 0.0811 0.0387 0.0000 0.5760 0.695812-29-2015 28.04 0.3840 0.0510 0.0000 0.5970 1.032012-29-2014 29.32 0.0020 0.0270 0.0000 0.5580 0.587012-26-2013 27.51 0.0030 0.0330 0.0000 0.4910 0.5270
3 Year Average Morningstar Risk Measures
Risk vs. Category Avg
Low Avg High
(193)
Return vs. Category +Avg(193)
Pillars
Process ∞ PositivePerformance ∞ PositivePeople ∞ PositiveParent ∞ PositivePrice ∞ Positive
Rating Œ
Investment Strategy
The investment seeks to provide capital appreciation andcurrent income consistent with its current asset allocation.The fund invests in other Vanguard mutual funds accordingto an asset allocation strategy designed for investors plan-ning to retire and leave the workforce in or within a fewyears of 2030 (the target year). The fund's asset allocationwill become more conservative over time, meaning that thepercentage of assets allocated to stocks will decrease whilethe percentage of assets allocated to bonds and other fixedincome investments will increase.
Style Map
DeepVal
CoreVal
Core CoreGrow
HighGrow
Micro
Small
Medium
Large
Giant Weighted Averageof holdings
75% of fund’s stockholdings
Asset Allocation
%Net
%Short
%Long
Benchmark
CatAvg
Cash 2.23 0.00 2.23 1.01 3.98US Stock 42.17 0.00 42.17 42.84 39.72Non US Stock 26.22 0.00 26.22 21.89 21.23Bond 28.94 0.00 28.95 31.74 24.69Other 0.45 0.00 0.45 2.52 10.38
ManagementStart Date
William A. Coleman —Walter Nejman —
Release date 07-18-2018
©2018 Morningstar. All Rights Reserved. Unless otherwise provided in a separate agreement, you may use this report only in the country in which its original distributor is based. Data as originally reported. Theinformation contained herein is not represented or warranted to be accurate, correct, complete, or timely. This report is for information purposes only, and should not be considered a solicitation to buy or sell any security.Redistribution is prohibited without written permission. To order reprints, call +1 312-696-6100. To license the research, call +1 312-696-6869. ß
®
Page 1 of 11Release date 07-18-2018
©2018 Morningstar. All Rights Reserved. Unless otherwise provided in a separate agreement, you may use this report only in the country in which its original distributor is based. Data as originally reported. Theinformation contained herein is not represented or warranted to be accurate, correct, complete, or timely. This report is for information purposes only, and should not be considered a solicitation to buy or sell any security.Redistribution is prohibited without written permission. To order reprints, call +1 312-696-6100. To license the research, call +1 312-696-6869. ß
®
Page 1 of 11
45

Vanguard Target Retirement 2035 Fund Investor Shares VTTHX Morningstar Analyst RatingŒ
NAV $ NAV Day Change % Yield TTM % Total Assets $ Status Min. Inv. Load Expenses Morningstar Rating TM Category Investment Style
21.14 ]0.05 | 0.24 1.98 33 Open $1,000 None 0.14% QQQQ Target-Date 2035 4 Large Blend
Growth of 10,000 07-17-2008 - 07-17-2018
6K
11K
16K
22K
2009 2010 2011 2012 2013 2014 2015 2016 2017 2018
Vanguard Target Retirement2035 Fund Investor Shares$21,168.31Target-Date 2035 $19,234.21Morningstar Mod Tgt RiskTR USD $19,025.07
Performance 07-17-2018
YTD 1 Mo 1 Yr 3Yr Ann 5Yr Ann 10Yr Ann
Growth of 10,000 10,217 10,014 10,983 12,500 15,254 20,956Fund 2.17 0.14 9.83 7.72 8.81 7.68+/- Morningstar Mod TgtRisk TR USD
1.19 -0.04 2.80 1.12 2.27 1.10
+/- Category 0.06 0.02 0.44 0.56 0.92 0.65% Rank in Cat 52 49 38 31 22 26# of Funds in Cat 223 231 215 171 131 66* Currency is displayed in USD
Top Holdings 06-30-2018Weight % Last Price Day Chg % 52 Week Range
Y Vanguard Total Stock Mkt Idx Inv 46.91 70.60 USD 0.44 ] 60.45 - 71.48
T Vanguard Total Intl Stock Index Inv 30.60 17.52 USD 0.17 ] 16.98 - 19.62
T Vanguard Total Bond Market II Idx Inv 15.76 10.41 USD -0.10 [ 10.29 - 10.86
T Vanguard Total Intl Bd Idx Investor 6.71 10.98 USD 0.18 ] 10.77 - 11.04
% Assets in Top 5 Holdings 99.98
TIncrease YDecrease RNew to Portfolio
Top Sectors 06-30-2018Fund 3 Yr High 3 Yr Low Cat Avg
a Technology 18.20 18.20 14.58 —
y Financial Services 17.88 18.55 17.88 —
t Consumer Cyclical 12.13 12.13 11.40 —
p Industrials 11.55 11.95 11.55 —
d Healthcare 11.28 11.28 11.12 —
Fund Cat Avg
0 5 10 15 20
Fund BMark Cat Avg
Government 10.78 11.51 7.14Agency Mortgage-Backed 3.41 4.08 3.33Government-Related 1.75 0.32 0.57Covered Bond 0.37 0.00 0.02Commercial MBS 0.16 0.00 0.32
Fund Cat Avg
0 5 10 15 20
Dividend and Capital Gains DistributionsDistributionDate
DistributionNAV
Long-TermCapital Gain
Short-TermCaptial Gain
Return ofCapital
DividendIncome
DistributionTotal
12-28-2017 20.73 0.0188 0.0140 0.0000 0.4103 0.443112-28-2016 17.72 0.1315 0.0037 0.0000 0.3560 0.491212-29-2015 17.06 0.3870 0.0280 0.0000 0.3710 0.786012-29-2014 18.03 0.0000 0.0050 0.0000 0.3680 0.373012-26-2013 16.89 0.0000 0.0000 0.0000 0.3240 0.3240
3 Year Average Morningstar Risk Measures
Risk vs. Category Avg
Low Avg High
(173)
Return vs. Category +Avg(173)
Pillars
Process ∞ PositivePerformance ∞ PositivePeople ∞ PositiveParent ∞ PositivePrice ∞ Positive
Rating Œ
Investment Strategy
The investment seeks to provide capital appreciation andcurrent income consistent with its current asset allocation.The fund invests in other Vanguard mutual funds accordingto an asset allocation strategy designed for investors plan-ning to retire and leave the workforce in or within a fewyears of 2035 (the target year). The fund's asset allocationwill become more conservative over time, meaning that thepercentage of assets allocated to stocks will decrease whilethe percentage of assets allocated to bonds and other fixedincome investments will increase.
Style Map
DeepVal
CoreVal
Core CoreGrow
HighGrow
Micro
Small
Medium
Large
Giant Weighted Averageof holdings
75% of fund’s stockholdings
Asset Allocation
%Net
%Short
%Long
Benchmark
CatAvg
Cash 2.17 0.00 2.17 0.48 3.79US Stock 46.55 0.00 46.55 48.98 45.20Non US Stock 29.14 0.00 29.14 26.63 24.62Bond 21.73 0.00 21.73 21.30 17.13Other 0.41 0.00 0.41 2.61 9.26
ManagementStart Date
William A. Coleman —Walter Nejman —
Release date 07-18-2018
©2018 Morningstar. All Rights Reserved. Unless otherwise provided in a separate agreement, you may use this report only in the country in which its original distributor is based. Data as originally reported. Theinformation contained herein is not represented or warranted to be accurate, correct, complete, or timely. This report is for information purposes only, and should not be considered a solicitation to buy or sell any security.Redistribution is prohibited without written permission. To order reprints, call +1 312-696-6100. To license the research, call +1 312-696-6869. ß
®
Page 1 of 11Release date 07-18-2018
©2018 Morningstar. All Rights Reserved. Unless otherwise provided in a separate agreement, you may use this report only in the country in which its original distributor is based. Data as originally reported. Theinformation contained herein is not represented or warranted to be accurate, correct, complete, or timely. This report is for information purposes only, and should not be considered a solicitation to buy or sell any security.Redistribution is prohibited without written permission. To order reprints, call +1 312-696-6100. To license the research, call +1 312-696-6869. ß
®
Page 1 of 11
46

Vanguard Target Retirement 2040 Fund Investor Shares VFORX Morningstar Analyst RatingŒ
NAV $ NAV Day Change % Yield TTM % Total Assets $ Status Min. Inv. Load Expenses Morningstar Rating TM Category Investment Style
36.65 ]0.10 | 0.27 1.91 25 Open $1,000 None 0.15% QQQQ Target-Date 2040 4 Large Blend
Growth of 10,000 07-17-2008 - 07-17-2018
6K
11K
17K
22K
2009 2010 2011 2012 2013 2014 2015 2016 2017 2018
Vanguard Target Retirement2040 Fund Investor Shares$21,867.52Target-Date 2040 $19,227.27Morningstar Mod Tgt RiskTR USD $19,025.07
Performance 07-17-2018
YTD 1 Mo 1 Yr 3Yr Ann 5Yr Ann 10Yr Ann
Growth of 10,000 10,246 10,011 11,071 12,673 15,586 21,650Fund 2.46 0.11 10.71 8.22 9.28 8.03+/- Morningstar Mod TgtRisk TR USD
1.47 -0.07 3.68 1.62 2.74 1.45
+/- Category 0.22 0.08 0.68 0.73 1.07 1.05% Rank in Cat 48 40 32 24 17 20# of Funds in Cat 251 257 241 193 155 96* Currency is displayed in USD
Top Holdings 06-30-2018Weight % Last Price Day Chg % 52 Week Range
Y Vanguard Total Stock Mkt Idx Inv 51.52 70.60 USD 0.44 ] 60.45 - 71.48
T Vanguard Total Intl Stock Index Inv 33.53 17.52 USD 0.17 ] 16.98 - 19.62
T Vanguard Total Bond Market II Idx Inv 10.47 10.41 USD -0.10 [ 10.29 - 10.86
T Vanguard Total Intl Bd Idx Investor 4.46 10.98 USD 0.18 ] 10.77 - 11.04
% Assets in Top 5 Holdings 99.97
TIncrease YDecrease RNew to Portfolio
Top Sectors 06-30-2018Fund 3 Yr High 3 Yr Low Cat Avg
a Technology 18.21 18.21 14.56 —
y Financial Services 17.88 18.55 17.88 —
t Consumer Cyclical 12.13 12.13 11.40 —
p Industrials 11.55 11.95 11.55 —
d Healthcare 11.28 11.28 11.11 —
Fund Cat Avg
0 5 10 15 20
Fund BMark Cat Avg
Government 7.17 6.84 4.64Agency Mortgage-Backed 2.27 2.53 2.07Government-Related 1.17 0.20 0.38Covered Bond 0.24 0.00 0.01Commercial MBS 0.11 0.00 0.20
Fund Cat Avg
0 2 4 6 8
Dividend and Capital Gains DistributionsDistributionDate
DistributionNAV
Long-TermCapital Gain
Short-TermCaptial Gain
Return ofCapital
DividendIncome
DistributionTotal
12-28-2017 35.86 0.0007 0.0136 0.0000 0.6841 0.698412-28-2016 30.18 0.1063 0.0186 0.0000 0.5990 0.723912-29-2015 28.86 0.1900 0.0450 0.0000 0.6150 0.850012-29-2014 30.11 0.0010 0.0160 0.0000 0.5740 0.591012-26-2013 28.15 0.0060 0.0010 0.0000 0.5000 0.5070
3 Year Average Morningstar Risk Measures
Risk vs. Category Avg
Low Avg High
(193)
Return vs. Category +Avg(193)
Pillars
Process ∞ PositivePerformance ∞ PositivePeople ∞ PositiveParent ∞ PositivePrice ∞ Positive
Rating Œ
Investment Strategy
The investment seeks to provide capital appreciation andcurrent income consistent with its current asset allocation.The fund invests in other Vanguard mutual funds accordingto an asset allocation strategy designed for investors plan-ning to retire and leave the workforce in or within a fewyears of 2040 (the target year). The fund's asset allocationwill become more conservative over time, meaning that thepercentage of assets allocated to stocks will decrease whilethe percentage of assets allocated to bonds and other fixedincome investments will increase.
Style Map
DeepVal
CoreVal
Core CoreGrow
HighGrow
Micro
Small
Medium
Large
Giant Weighted Averageof holdings
75% of fund’s stockholdings
Asset Allocation
%Net
%Short
%Long
Benchmark
CatAvg
Cash 2.11 0.00 2.11 0.18 3.63US Stock 51.12 0.00 51.12 53.25 50.13Non US Stock 31.93 0.00 31.93 30.67 27.68Bond 14.46 0.00 14.46 13.19 11.08Other 0.38 0.00 0.38 2.71 7.48
ManagementStart Date
William A. Coleman —Walter Nejman —
Release date 07-18-2018
©2018 Morningstar. All Rights Reserved. Unless otherwise provided in a separate agreement, you may use this report only in the country in which its original distributor is based. Data as originally reported. Theinformation contained herein is not represented or warranted to be accurate, correct, complete, or timely. This report is for information purposes only, and should not be considered a solicitation to buy or sell any security.Redistribution is prohibited without written permission. To order reprints, call +1 312-696-6100. To license the research, call +1 312-696-6869. ß
®
Page 1 of 11Release date 07-18-2018
©2018 Morningstar. All Rights Reserved. Unless otherwise provided in a separate agreement, you may use this report only in the country in which its original distributor is based. Data as originally reported. Theinformation contained herein is not represented or warranted to be accurate, correct, complete, or timely. This report is for information purposes only, and should not be considered a solicitation to buy or sell any security.Redistribution is prohibited without written permission. To order reprints, call +1 312-696-6100. To license the research, call +1 312-696-6869. ß
®
Page 1 of 11
47

Vanguard Target Retirement 2045 Fund Investor Shares VTIVX Morningstar Analyst RatingŒ
NAV $ NAV Day Change % Yield TTM % Total Assets $ Bil Status Min. Inv. Load Expenses Morningstar Rating TM Category Investment Style
23.08 ]0.07 | 0.30 1.90 23.2 Open $1,000 None 0.15% QQQQ Target-Date 2045 4 Large Blend
Growth of 10,000 07-17-2008 - 07-17-2018
6K
11K
17K
22K
2009 2010 2011 2012 2013 2014 2015 2016 2017 2018
Vanguard Target Retirement2045 Fund Investor Shares$22,017.43Target-Date 2045 $19,928.29Morningstar Mod Tgt RiskTR USD $19,025.07
Performance 07-17-2018
YTD 1 Mo 1 Yr 3Yr Ann 5Yr Ann 10Yr Ann
Growth of 10,000 10,258 10,009 11,114 12,778 15,724 21,788Fund 2.58 0.09 11.14 8.52 9.47 8.10+/- Morningstar Mod TgtRisk TR USD
1.59 -0.10 4.11 1.92 2.93 1.52
+/- Category 0.04 0.04 0.50 0.67 0.90 0.82% Rank in Cat 52 37 34 27 16 22# of Funds in Cat 223 231 215 171 131 65* Currency is displayed in USD
Top Holdings 06-30-2018Weight % Last Price Day Chg % 52 Week Range
Y Vanguard Total Stock Mkt Idx Inv 54.32 70.60 USD 0.44 ] 60.45 - 71.48
T Vanguard Total Intl Stock Index Inv 35.50 17.52 USD 0.17 ] 16.98 - 19.62
Y Vanguard Total Bond Market II Idx Inv 7.18 10.41 USD -0.10 [ 10.29 - 10.86
T Vanguard Total Intl Bd Idx Investor 3.00 10.98 USD 0.18 ] 10.77 - 11.04
% Assets in Top 5 Holdings 99.99
TIncrease YDecrease RNew to Portfolio
Top Sectors 06-30-2018Fund 3 Yr High 3 Yr Low Cat Avg
a Technology 18.20 18.20 14.56 —
y Financial Services 17.88 18.55 17.88 —
t Consumer Cyclical 12.13 12.13 11.40 —
p Industrials 11.55 11.95 11.55 —
d Healthcare 11.27 11.27 11.11 —
Fund Cat Avg
0 5 10 15 20
Fund BMark Cat Avg
Government 4.89 4.45 3.24Agency Mortgage-Backed 1.55 1.72 1.23Government-Related 0.79 0.15 0.13Covered Bond 0.16 0.00 0.01Commercial MBS 0.07 0.00 0.14
Fund Cat Avg
0 2 4 6 8
Dividend and Capital Gains DistributionsDistributionDate
DistributionNAV
Long-TermCapital Gain
Short-TermCaptial Gain
Return ofCapital
DividendIncome
DistributionTotal
12-28-2017 22.56 0.0000 0.0101 0.0000 0.4281 0.438212-28-2016 18.88 0.0840 0.0079 0.0000 0.3750 0.466912-29-2015 18.04 0.1800 0.0190 0.0000 0.3860 0.585012-29-2014 18.87 0.0000 0.0030 0.0000 0.3830 0.386012-26-2013 17.66 0.0000 0.0000 0.0000 0.3340 0.3340
3 Year Average Morningstar Risk Measures
Risk vs. Category -Avg
Low Avg High
(173)
Return vs. Category +Avg(173)
Pillars
Process ∞ PositivePerformance ∞ PositivePeople ∞ PositiveParent ∞ PositivePrice ∞ Positive
Rating Œ
Investment Strategy
The investment seeks to provide capital appreciation andcurrent income consistent with its current asset allocation.The fund invests in other Vanguard mutual funds accordingto an asset allocation strategy designed for investors plan-ning to retire and leave the workforce in or within a fewyears of 2045 (the target year). The fund's asset allocationwill become more conservative over time, meaning that thepercentage of assets allocated to stocks will decrease whilethe percentage of assets allocated to bonds and other fixedincome investments will increase.
Style Map
DeepVal
CoreVal
Core CoreGrow
HighGrow
Micro
Small
Medium
Large
Giant Weighted Averageof holdings
75% of fund’s stockholdings
Asset Allocation
%Net
%Short
%Long
Benchmark
CatAvg
Cash 2.07 0.00 2.07 0.05 3.79US Stock 53.91 0.00 53.91 54.85 52.12Non US Stock 33.81 0.00 33.81 33.35 29.78Bond 9.87 0.00 9.87 8.95 7.24Other 0.35 0.00 0.35 2.80 7.08
ManagementStart Date
William A. Coleman —Walter Nejman —
Release date 07-18-2018
©2018 Morningstar. All Rights Reserved. Unless otherwise provided in a separate agreement, you may use this report only in the country in which its original distributor is based. Data as originally reported. Theinformation contained herein is not represented or warranted to be accurate, correct, complete, or timely. This report is for information purposes only, and should not be considered a solicitation to buy or sell any security.Redistribution is prohibited without written permission. To order reprints, call +1 312-696-6100. To license the research, call +1 312-696-6869. ß
®
Page 1 of 11Release date 07-18-2018
©2018 Morningstar. All Rights Reserved. Unless otherwise provided in a separate agreement, you may use this report only in the country in which its original distributor is based. Data as originally reported. Theinformation contained herein is not represented or warranted to be accurate, correct, complete, or timely. This report is for information purposes only, and should not be considered a solicitation to buy or sell any security.Redistribution is prohibited without written permission. To order reprints, call +1 312-696-6100. To license the research, call +1 312-696-6869. ß
®
Page 1 of 11
48

Vanguard Target Retirement 2050 Fund Investor Shares VFIFX Morningstar Analyst RatingŒ
NAV $ NAV Day Change % Yield TTM % Total Assets $ Status Min. Inv. Load Expenses Morningstar Rating TM Category Investment Style
37.14 ]0.11 | 0.30 1.88 16 Open $1,000 None 0.15% QQQQ Target-Date 2050 4 Large Blend
Growth of 10,000 07-17-2008 - 07-17-2018
6K
11K
17K
22K
2009 2010 2011 2012 2013 2014 2015 2016 2017 2018
Vanguard Target Retirement2050 Fund Investor Shares$22,027.81Target-Date 2050 $19,784.84Morningstar Mod Tgt RiskTR USD $19,025.07
Performance 07-17-2018
YTD 1 Mo 1 Yr 3Yr Ann 5Yr Ann 10Yr Ann
Growth of 10,000 10,260 10,008 11,116 12,778 15,719 21,809Fund 2.60 0.08 11.16 8.52 9.47 8.11+/- Morningstar Mod TgtRisk TR USD
1.61 -0.10 4.13 1.92 2.93 1.53
+/- Category 0.14 0.10 0.44 0.63 0.87 0.93% Rank in Cat 51 42 40 28 20 20# of Funds in Cat 247 253 237 188 149 73* Currency is displayed in USD
Top Holdings 06-30-2018Weight % Last Price Day Chg % 52 Week Range
Y Vanguard Total Stock Mkt Idx Inv 54.31 70.60 USD 0.44 ] 60.45 - 71.48
T Vanguard Total Intl Stock Index Inv 35.54 17.52 USD 0.17 ] 16.98 - 19.62
Y Vanguard Total Bond Market II Idx Inv 7.17 10.41 USD -0.10 [ 10.29 - 10.86
T Vanguard Total Intl Bd Idx Investor 2.99 10.98 USD 0.18 ] 10.77 - 11.04
% Assets in Top 5 Holdings 100.00
TIncrease YDecrease RNew to Portfolio
Top Sectors 06-30-2018Fund 3 Yr High 3 Yr Low Cat Avg
a Technology 18.20 18.20 14.54 —
y Financial Services 17.88 18.55 17.88 —
t Consumer Cyclical 12.13 12.13 11.40 —
p Industrials 11.55 11.96 11.55 —
d Healthcare 11.27 11.27 11.10 —
Fund Cat Avg
0 5 10 15 20
Fund BMark Cat Avg
Government 5.66 3.93 3.02Corporate 2.28 2.42 2.05Cash & Equivalents 2.05 0.00 3.70Securitized 1.84 1.37 1.46Municipal 0.05 0.00 0.03
Fund Cat Avg
0 2 4 6 8
Dividend and Capital Gains DistributionsDistributionDate
DistributionNAV
Long-TermCapital Gain
Short-TermCaptial Gain
Return ofCapital
DividendIncome
DistributionTotal
12-28-2017 36.30 0.0005 0.0092 0.0000 0.6836 0.693312-28-2016 30.37 0.0266 0.0076 0.0000 0.5870 0.621212-29-2015 28.90 0.0420 0.0460 0.0000 0.5850 0.673012-29-2014 29.97 0.0000 0.0040 0.0000 0.5960 0.600012-26-2013 28.03 0.0000 0.0000 0.0000 0.5180 0.5180
3 Year Average Morningstar Risk Measures
Risk vs. Category -Avg
Low Avg High
(188)
Return vs. Category +Avg(188)
Pillars
Process ∞ PositivePerformance ∞ PositivePeople ∞ PositiveParent ∞ PositivePrice ∞ Positive
Rating Œ
Investment Strategy
The investment seeks to provide capital appreciation andcurrent income consistent with its current asset allocation.The fund invests in other Vanguard mutual funds accordingto an asset allocation strategy designed for investors plan-ning to retire and leave the workforce in or within a fewyears of 2050 (the target year). The fund's asset allocationwill become more conservative over time, meaning that thepercentage of assets allocated to stocks will decrease whilethe percentage of assets allocated to bonds and other fixedincome investments will increase.
Style Map
DeepVal
CoreVal
Core CoreGrow
HighGrow
Micro
Small
Medium
Large
Giant Weighted Averageof holdings
75% of fund’s stockholdings
Asset Allocation
%Net
%Short
%Long
Benchmark
CatAvg
Cash 2.06 0.00 2.06 0.00 3.69US Stock 53.89 0.00 53.89 54.51 52.00Non US Stock 33.85 0.00 33.85 34.89 30.60Bond 9.85 0.00 9.85 7.72 6.49Other 0.35 0.00 0.35 2.89 7.23
ManagementStart Date
William A. Coleman —Walter Nejman —
Release date 07-18-2018
©2018 Morningstar. All Rights Reserved. Unless otherwise provided in a separate agreement, you may use this report only in the country in which its original distributor is based. Data as originally reported. Theinformation contained herein is not represented or warranted to be accurate, correct, complete, or timely. This report is for information purposes only, and should not be considered a solicitation to buy or sell any security.Redistribution is prohibited without written permission. To order reprints, call +1 312-696-6100. To license the research, call +1 312-696-6869. ß
®
Page 1 of 11Release date 07-18-2018
©2018 Morningstar. All Rights Reserved. Unless otherwise provided in a separate agreement, you may use this report only in the country in which its original distributor is based. Data as originally reported. Theinformation contained herein is not represented or warranted to be accurate, correct, complete, or timely. This report is for information purposes only, and should not be considered a solicitation to buy or sell any security.Redistribution is prohibited without written permission. To order reprints, call +1 312-696-6100. To license the research, call +1 312-696-6869. ß
®
Page 1 of 11
49

Vanguard Target Retirement 2055 Fund Investor Shares VFFVX Morningstar Analyst RatingŒ
NAV $ NAV Day Change % Yield TTM % Total Assets $ Status Min. Inv. Load Expenses Morningstar Rating TM Category Investment Style
40.24 ]0.12 | 0.30 1.82 7 Open $1,000 None 0.15% QQQQ Target-Date 2055 4 Large Blend
Growth of 10,000 08-18-2010 - 07-17-2018
10K
14K
19K
24K
2011 2012 2013 2014 2015 2016 2017 2018
Vanguard Target Retirement2055 Fund Investor Shares$23,066.52Target-Date 2055 $21,870.98Morningstar Mod Tgt RiskTR USD $18,412.70
Performance 07-17-2018
YTD 1 Mo 1 Yr 3Yr Ann 5Yr Ann 10Yr Ann
Growth of 10,000 10,257 10,007 11,116 12,771 15,698 —Fund 2.57 0.07 11.16 8.50 9.44 —+/- Morningstar Mod TgtRisk TR USD
1.59 -0.11 4.13 1.90 2.90 —
+/- Category -0.07 0.05 0.19 0.47 0.55 —% Rank in Cat 55 41 48 31 27 —# of Funds in Cat 223 231 215 169 106 9* Currency is displayed in USD
Top Holdings 06-30-2018Weight % Last Price Day Chg % 52 Week Range
T Vanguard Total Stock Mkt Idx Inv 54.33 70.60 USD 0.44 ] 60.45 - 71.48
T Vanguard Total Intl Stock Index Inv 35.47 17.52 USD 0.17 ] 16.98 - 19.62
T Vanguard Total Bond Market II Idx Inv 7.17 10.41 USD -0.10 [ 10.29 - 10.86
T Vanguard Total Intl Bd Idx Investor 2.98 10.98 USD 0.18 ] 10.77 - 11.04
% Assets in Top 5 Holdings 99.94
TIncrease YDecrease RNew to Portfolio
Top Sectors 06-30-2018Fund 3 Yr High 3 Yr Low Cat Avg
a Technology 18.20 18.20 14.54 —
y Financial Services 17.88 18.55 17.88 —
t Consumer Cyclical 12.13 12.13 11.40 —
p Industrials 11.55 11.96 11.55 —
d Healthcare 11.28 11.28 11.10 —
Fund Cat Avg
0 5 10 15 20
Fund BMark Cat Avg
Government 4.87 3.71 3.34Agency Mortgage-Backed 1.55 1.03 0.93Government-Related 0.79 0.13 0.29Covered Bond 0.16 0.00 0.05Commercial MBS 0.07 0.00 0.10
Fund Cat Avg
0 2 4 6 8
Dividend and Capital Gains DistributionsDistributionDate
DistributionNAV
Long-TermCapital Gain
Short-TermCaptial Gain
Return ofCapital
DividendIncome
DistributionTotal
12-28-2017 39.33 0.0000 0.0000 0.0000 0.7179 0.717912-28-2016 32.88 0.0000 0.0020 0.0000 0.6540 0.656012-29-2015 31.28 0.0150 0.0010 0.0000 0.5930 0.609012-29-2014 32.35 0.0010 0.0050 0.0000 0.5540 0.560012-26-2013 30.18 0.0040 0.0000 0.0000 0.4770 0.4810
3 Year Average Morningstar Risk Measures
Risk vs. Category -Avg
Low Avg High
(171)
Return vs. Category +Avg(171)
Pillars
Process ∞ PositivePerformance ∞ PositivePeople ∞ PositiveParent ∞ PositivePrice ∞ Positive
Rating Œ
Investment Strategy
The investment seeks to provide capital appreciation andcurrent income consistent with its current asset allocation.The fund invests in other Vanguard mutual funds accordingto an asset allocation strategy designed for investors plan-ning to retire and leave the workforce in or within a fewyears of 2055 (the target year). The fund's asset allocationwill become more conservative over time, meaning that thepercentage of assets allocated to stocks will decrease whilethe percentage of assets allocated to bonds and other fixedincome investments will increase.
Style Map
DeepVal
CoreVal
Core CoreGrow
HighGrow
Micro
Small
Medium
Large
Giant Weighted Averageof holdings
75% of fund’s stockholdings
Asset Allocation
%Net
%Short
%Long
Benchmark
CatAvg
Cash 2.11 0.00 2.11 0.00 3.73US Stock 53.91 0.00 53.91 53.64 53.75Non US Stock 33.78 0.00 33.78 36.10 31.41Bond 9.85 0.00 9.85 7.29 6.49Other 0.35 0.00 0.35 2.97 4.62
ManagementStart Date
William A. Coleman —Walter Nejman —
Release date 07-18-2018
©2018 Morningstar. All Rights Reserved. Unless otherwise provided in a separate agreement, you may use this report only in the country in which its original distributor is based. Data as originally reported. Theinformation contained herein is not represented or warranted to be accurate, correct, complete, or timely. This report is for information purposes only, and should not be considered a solicitation to buy or sell any security.Redistribution is prohibited without written permission. To order reprints, call +1 312-696-6100. To license the research, call +1 312-696-6869. ß
®
Page 1 of 11Release date 07-18-2018
©2018 Morningstar. All Rights Reserved. Unless otherwise provided in a separate agreement, you may use this report only in the country in which its original distributor is based. Data as originally reported. Theinformation contained herein is not represented or warranted to be accurate, correct, complete, or timely. This report is for information purposes only, and should not be considered a solicitation to buy or sell any security.Redistribution is prohibited without written permission. To order reprints, call +1 312-696-6100. To license the research, call +1 312-696-6869. ß
®
Page 1 of 11
50

Vanguard Target Retirement 2060 Fund Investor Shares VTTSX Morningstar Analyst RatingŒ
NAV $ NAV Day Change % Yield TTM % Total Assets $ Status Min. Inv. Load Expenses Morningstar Rating TM Category Investment Style
35.53 ]0.11 | 0.31 1.76 3 Open $1,000 None 0.15% QQQ Target-Date 2060+ 4 Large Blend
Growth of 10,000 01-19-2012 - 07-17-2018
10K
13K
17K
20K
2012 2013 2014 2015 2016 2017 2018
Vanguard Target Retirement2060 Fund Investor Shares$19,650.05Target-Date 2060+$19,419.72Morningstar Mod Tgt RiskTR USD $16,153.53
Performance 07-17-2018
YTD 1 Mo 1 Yr 3Yr Ann 5Yr Ann 10Yr Ann
Growth of 10,000 10,260 10,008 11,115 12,772 15,696 —Fund 2.60 0.08 11.15 8.50 9.44 —+/- Morningstar Mod TgtRisk TR USD
1.61 -0.10 4.12 1.90 2.90 —
+/- Category -0.13 0.04 -0.07 0.15 0.82 —% Rank in Cat 59 40 61 49 1 —# of Funds in Cat 200 213 176 60 9 0* Currency is displayed in USD
Top Holdings 06-30-2018Weight % Last Price Day Chg % 52 Week Range
T Vanguard Total Stock Mkt Idx Inv 54.18 70.60 USD 0.44 ] 60.45 - 71.48
T Vanguard Total Intl Stock Index Inv 35.68 17.52 USD 0.17 ] 16.98 - 19.62
T Vanguard Total Bond Market II Idx Inv 7.16 10.41 USD -0.10 [ 10.29 - 10.86
T Vanguard Total Intl Bd Idx Investor 2.96 10.98 USD 0.18 ] 10.77 - 11.04
% Assets in Top 5 Holdings 99.98
TIncrease YDecrease RNew to Portfolio
Top Sectors 06-30-2018Fund 3 Yr High 3 Yr Low Cat Avg
a Technology 18.18 18.18 14.53 —
y Financial Services 17.89 18.42 17.89 —
t Consumer Cyclical 12.13 12.13 11.50 —
p Industrials 11.55 11.96 11.55 —
d Healthcare 11.26 11.26 11.09 —
Fund Cat Avg
0 5 10 15 20
Fund BMark Cat Avg
Government 5.64 3.88 3.97Corporate 2.28 2.45 2.14Cash & Equivalents 2.07 0.00 3.40Securitized 1.84 0.86 1.42Municipal 0.05 0.00 0.03
Fund Cat Avg
0 2 4 6 8
Dividend and Capital Gains DistributionsDistributionDate
DistributionNAV
Long-TermCapital Gain
Short-TermCaptial Gain
Return ofCapital
DividendIncome
DistributionTotal
12-28-2017 34.73 0.0000 0.0000 0.0000 0.6133 0.613312-28-2016 29.01 0.0000 0.0018 0.0000 0.5740 0.575812-29-2015 27.60 0.0090 0.0110 0.0000 0.5030 0.523012-29-2014 28.53 0.0010 0.0060 0.0000 0.4640 0.471012-26-2013 26.59 0.0010 0.0000 0.0000 0.3670 0.3680
3 Year Average Morningstar Risk Measures
Risk vs. Category -Avg
Low Avg High
(65)
Return vs. Category Avg(65)
Pillars
Process ∞ PositivePerformance ∞ PositivePeople ∞ PositiveParent ∞ PositivePrice ∞ Positive
Rating Œ
Investment Strategy
The investment seeks to provide capital appreciation andcurrent income consistent with its current asset allocation.The fund invests in other Vanguard mutual funds accordingto an asset allocation strategy designed for investors plan-ning to retire and leave the workforce in or within a fewyears of 2060 (the target year). The fund's asset allocationwill become more conservative over time, meaning that thepercentage of assets allocated to stocks will decrease whilethe percentage of assets allocated to bonds and other fixedincome investments will increase.
Style Map
DeepVal
CoreVal
Core CoreGrow
HighGrow
Micro
Small
Medium
Large
Giant Weighted Averageof holdings
75% of fund’s stockholdings
Asset Allocation
%Net
%Short
%Long
Benchmark
CatAvg
Cash 2.08 0.00 2.08 0.00 3.40US Stock 53.77 0.00 53.77 52.59 51.58Non US Stock 33.98 0.00 33.98 37.17 31.78Bond 9.82 0.00 9.82 7.18 7.48Other 0.35 0.00 0.35 3.06 5.76
ManagementStart Date
William A. Coleman —Walter Nejman —
Release date 07-18-2018
©2018 Morningstar. All Rights Reserved. Unless otherwise provided in a separate agreement, you may use this report only in the country in which its original distributor is based. Data as originally reported. Theinformation contained herein is not represented or warranted to be accurate, correct, complete, or timely. This report is for information purposes only, and should not be considered a solicitation to buy or sell any security.Redistribution is prohibited without written permission. To order reprints, call +1 312-696-6100. To license the research, call +1 312-696-6869. ß
®
Page 1 of 11Release date 07-18-2018
©2018 Morningstar. All Rights Reserved. Unless otherwise provided in a separate agreement, you may use this report only in the country in which its original distributor is based. Data as originally reported. Theinformation contained herein is not represented or warranted to be accurate, correct, complete, or timely. This report is for information purposes only, and should not be considered a solicitation to buy or sell any security.Redistribution is prohibited without written permission. To order reprints, call +1 312-696-6100. To license the research, call +1 312-696-6869. ß
®
Page 1 of 11
51
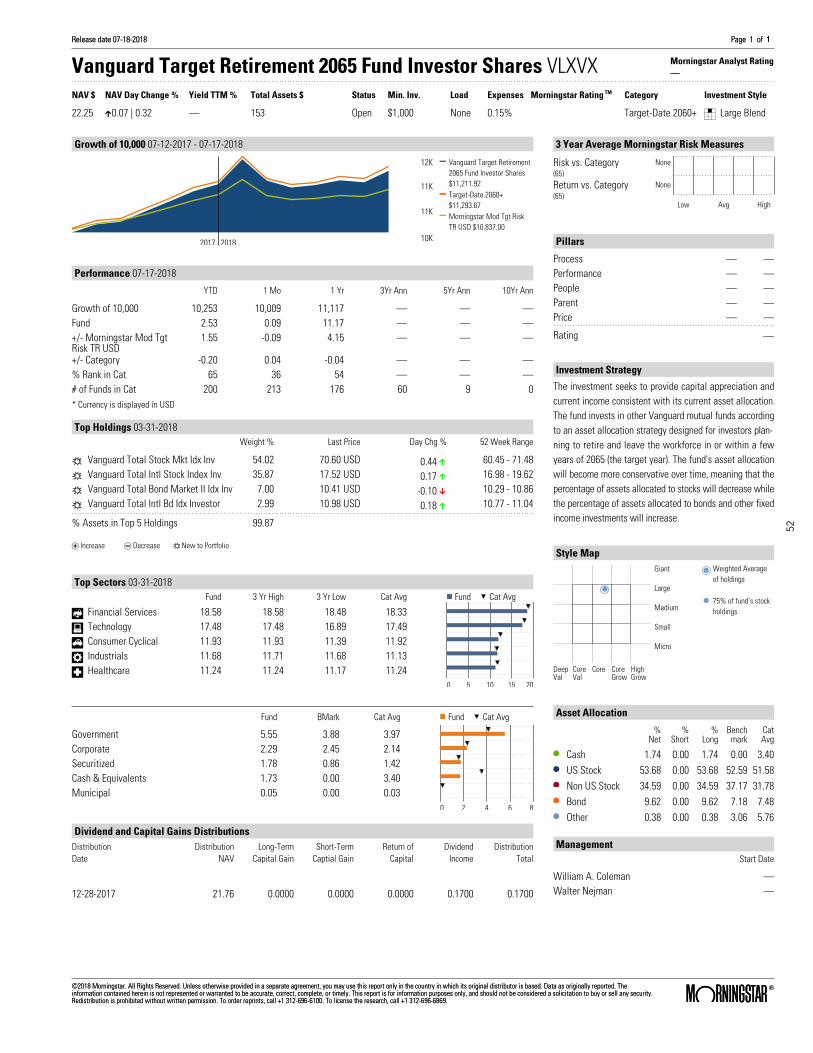
Vanguard Target Retirement 2065 Fund Investor Shares VLXVX Morningstar Analyst Rating—
NAV $ NAV Day Change % Yield TTM % Total Assets $ Status Min. Inv. Load Expenses Morningstar Rating TM Category Investment Style
22.25 ]0.07 | 0.32 — 153 Open $1,000 None 0.15% Target-Date 2060+ 4 Large Blend
Growth of 10,000 07-12-2017 - 07-17-2018
10K
11K
11K
12K
2017 2018
Vanguard Target Retirement2065 Fund Investor Shares$11,211.92Target-Date 2060+$11,293.67Morningstar Mod Tgt RiskTR USD $10,837.00
Performance 07-17-2018
YTD 1 Mo 1 Yr 3Yr Ann 5Yr Ann 10Yr Ann
Growth of 10,000 10,253 10,009 11,117 — — —Fund 2.53 0.09 11.17 — — —+/- Morningstar Mod TgtRisk TR USD
1.55 -0.09 4.15 — — —
+/- Category -0.20 0.04 -0.04 — — —% Rank in Cat 65 36 54 — — —# of Funds in Cat 200 213 176 60 9 0* Currency is displayed in USD
Top Holdings 03-31-2018Weight % Last Price Day Chg % 52 Week Range
R Vanguard Total Stock Mkt Idx Inv 54.02 70.60 USD 0.44 ] 60.45 - 71.48
R Vanguard Total Intl Stock Index Inv 35.87 17.52 USD 0.17 ] 16.98 - 19.62
R Vanguard Total Bond Market II Idx Inv 7.00 10.41 USD -0.10 [ 10.29 - 10.86
R Vanguard Total Intl Bd Idx Investor 2.99 10.98 USD 0.18 ] 10.77 - 11.04
% Assets in Top 5 Holdings 99.87
TIncrease YDecrease RNew to Portfolio
Top Sectors 03-31-2018Fund 3 Yr High 3 Yr Low Cat Avg
y Financial Services 18.58 18.58 18.48 18.33
a Technology 17.48 17.48 16.89 17.49
t Consumer Cyclical 11.93 11.93 11.39 11.92
p Industrials 11.68 11.71 11.68 11.13
d Healthcare 11.24 11.24 11.17 11.24
Fund Cat Avg
0 5 10 15 20
Fund BMark Cat Avg
Government 5.55 3.88 3.97Corporate 2.29 2.45 2.14Securitized 1.78 0.86 1.42Cash & Equivalents 1.73 0.00 3.40Municipal 0.05 0.00 0.03
Fund Cat Avg
0 2 4 6 8
Dividend and Capital Gains DistributionsDistributionDate
DistributionNAV
Long-TermCapital Gain
Short-TermCaptial Gain
Return ofCapital
DividendIncome
DistributionTotal
12-28-2017 21.76 0.0000 0.0000 0.0000 0.1700 0.1700
3 Year Average Morningstar Risk Measures
Risk vs. Category None
Low Avg High
(65)
Return vs. Category None(65)
Pillars
Process — —Performance — —People — —Parent — —Price — —
Rating .
Investment Strategy
The investment seeks to provide capital appreciation andcurrent income consistent with its current asset allocation.The fund invests in other Vanguard mutual funds accordingto an asset allocation strategy designed for investors plan-ning to retire and leave the workforce in or within a fewyears of 2065 (the target year). The fund's asset allocationwill become more conservative over time, meaning that thepercentage of assets allocated to stocks will decrease whilethe percentage of assets allocated to bonds and other fixedincome investments will increase.
Style Map
DeepVal
CoreVal
Core CoreGrow
HighGrow
Micro
Small
Medium
Large
Giant Weighted Averageof holdings
75% of fund’s stockholdings
Asset Allocation
%Net
%Short
%Long
Benchmark
CatAvg
Cash 1.74 0.00 1.74 0.00 3.40US Stock 53.68 0.00 53.68 52.59 51.58Non US Stock 34.59 0.00 34.59 37.17 31.78Bond 9.62 0.00 9.62 7.18 7.48Other 0.38 0.00 0.38 3.06 5.76
ManagementStart Date
William A. Coleman —Walter Nejman —
Release date 07-18-2018
©2018 Morningstar. All Rights Reserved. Unless otherwise provided in a separate agreement, you may use this report only in the country in which its original distributor is based. Data as originally reported. Theinformation contained herein is not represented or warranted to be accurate, correct, complete, or timely. This report is for information purposes only, and should not be considered a solicitation to buy or sell any security.Redistribution is prohibited without written permission. To order reprints, call +1 312-696-6100. To license the research, call +1 312-696-6869. ß
®
Page 1 of 11Release date 07-18-2018
©2018 Morningstar. All Rights Reserved. Unless otherwise provided in a separate agreement, you may use this report only in the country in which its original distributor is based. Data as originally reported. Theinformation contained herein is not represented or warranted to be accurate, correct, complete, or timely. This report is for information purposes only, and should not be considered a solicitation to buy or sell any security.Redistribution is prohibited without written permission. To order reprints, call +1 312-696-6100. To license the research, call +1 312-696-6869. ß
®
Page 1 of 11
52

Vanguard Target Retirement Income Fund Investor Shares VTINX Morningstar Analyst RatingŒ
NAV $ NAV Day Change % Yield TTM % Total Assets $ Status Min. Inv. Load Expenses Morningstar Rating TM Category Investment Style
13.53 ]0.01 | 0.07 2.22 17 Open $1,000 None 0.13% QQQQ Target-DateRetirement
4 Large Blend
Growth of 10,000 07-17-2008 - 07-17-2018
7K
11K
15K
19K
2009 2010 2011 2012 2013 2014 2015 2016 2017 2018
Vanguard Target RetirementIncome Fund Investor Shares$16,667.41Target-Date Retirement$15,661.23Morningstar Mod Tgt RiskTR USD $19,025.07
Performance 07-17-2018
YTD 1 Mo 1 Yr 3Yr Ann 5Yr Ann 10Yr Ann
Growth of 10,000 10,075 10,037 10,418 11,312 12,516 16,683Fund 0.75 0.37 4.18 4.19 4.59 5.25+/- Morningstar Mod TgtRisk TR USD
-0.24 0.19 -2.84 -2.40 -1.95 -1.33
+/- Category 0.56 0.10 0.55 0.50 0.56 0.61% Rank in Cat 20 32 33 29 32 25# of Funds in Cat 196 199 188 163 133 92* Currency is displayed in USD
Top Holdings 06-30-2018Weight % Last Price Day Chg % 52 Week Range
T Vanguard Total Bond Market II Idx Inv 37.41 10.41 USD -0.10 [ 10.29 - 10.86
Y Vanguard Total Stock Mkt Idx Inv 18.04 70.60 USD 0.44 ] 60.45 - 71.48
T Vanguard Shrt-Term Infl-Prot Sec IdxInv
16.89 24.44 USD -0.08 [ 24.32 - 24.87
T Vanguard Total Intl Bd Idx Investor 16.05 10.98 USD 0.18 ] 10.77 - 11.04
T Vanguard Total Intl Stock Index Inv 11.61 17.52 USD 0.17 ] 16.98 - 19.62
% Assets in Top 5 Holdings 99.99
TIncrease YDecrease RNew to Portfolio
Top Sectors 06-30-2018Fund 3 Yr High 3 Yr Low Cat Avg
a Technology 18.24 18.24 14.45 —
y Financial Services 17.86 18.56 17.86 —
t Consumer Cyclical 12.13 12.13 11.40 —
p Industrials 11.55 11.88 11.55 —
d Healthcare 11.29 11.29 11.11 —
Fund Cat Avg
0 5 10 15 20
Fund BMark Cat Avg
Government 41.98 41.94 27.53Agency Mortgage-Backed 8.10 11.30 8.99Government-Related 4.18 0.56 2.78Covered Bond 0.88 0.00 0.20Commercial MBS 0.39 0.00 0.71
Fund Cat Avg
0 15 30 45 60
Dividend and Capital Gains DistributionsDistributionDate
DistributionNAV
Long-TermCapital Gain
Short-TermCaptial Gain
Return ofCapital
DividendIncome
DistributionTotal
06-15-2018 13.48 0.0000 0.0000 0.0000 0.0780 0.078003-15-2018 13.52 0.0000 0.0000 0.0000 0.0430 0.043012-28-2017 13.56 0.0496 0.0059 0.0000 0.1280 0.183509-21-2017 13.44 0.0000 0.0000 0.0000 0.0500 0.050006-27-2017 13.27 0.0000 0.0000 0.0000 0.0620 0.0620
3 Year Average Morningstar Risk Measures
Risk vs. Category -Avg
Low Avg High
(163)
Return vs. Category +Avg(163)
Pillars
Process ∞ PositivePerformance ∞ PositivePeople ∞ PositiveParent ∞ PositivePrice ∞ Positive
Rating Œ
Investment Strategy
The investment seeks to provide current income and somecapital appreciation. The fund invests in other Vanguard mu-tual funds according to an asset allocation strategy de-signed for investors currently in retirement. Its indirect bondholdings are a diversified mix of short-, intermediate-, andlong-term U.S. government, U.S. agency, and investment-grade U.S. corporate bonds; inflation-protected public oblig-ations issued by the U.S. Treasury; mortgage-backed and as-set-backed securities; and government, agency, corporate,and securitized investment-grade foreign bonds issued incurrencies other than the U.S. dollar.
Style Map
DeepVal
CoreVal
Core CoreGrow
HighGrow
Micro
Small
Medium
Large
Giant Weighted Averageof holdings
75% of fund’s stockholdings
Asset Allocation
%Net
%Short
%Long
Benchmark
CatAvg
Cash 2.59 0.00 2.59 5.31 8.03US Stock 17.90 0.00 17.90 24.26 20.00Non US Stock 11.06 0.00 11.06 8.77 10.33Bond 67.95 0.01 67.95 59.65 56.16Other 0.51 0.00 0.51 2.02 5.48
ManagementStart Date
William A. Coleman —Walter Nejman —
Release date 07-18-2018
©2018 Morningstar. All Rights Reserved. Unless otherwise provided in a separate agreement, you may use this report only in the country in which its original distributor is based. Data as originally reported. Theinformation contained herein is not represented or warranted to be accurate, correct, complete, or timely. This report is for information purposes only, and should not be considered a solicitation to buy or sell any security.Redistribution is prohibited without written permission. To order reprints, call +1 312-696-6100. To license the research, call +1 312-696-6869. ß
®
Page 1 of 11Release date 07-18-2018
©2018 Morningstar. All Rights Reserved. Unless otherwise provided in a separate agreement, you may use this report only in the country in which its original distributor is based. Data as originally reported. Theinformation contained herein is not represented or warranted to be accurate, correct, complete, or timely. This report is for information purposes only, and should not be considered a solicitation to buy or sell any security.Redistribution is prohibited without written permission. To order reprints, call +1 312-696-6100. To license the research, call +1 312-696-6869. ß
®
Page 1 of 11
53

Vanguard Total International Stock Index Fund Admiral Shares VTIAX Morningstar Analyst RatingŒ
NAV $ NAV Day Change % Yield TTM % Total Assets $ Status Min. Inv. Load Expenses Morningstar Rating TM Category Investment Style
29.31 ]0.06 | 0.21 2.91 343 Open $10,000 None 0.11% QQQ Foreign Large Blend 4 Large Blend
Growth of 10,000 07-17-2008 - 07-17-2018
5K
8K
12K
15K
2009 2010 2011 2012 2013 2014 2015 2016 2017 2018
Vanguard Total InternationalStock Index Fund AdmiralShares $13,846.90Foreign Large Blend$13,415.00MSCI ACWI Ex USA NR USD$13,790.58
Investment Strategy
The investment seeks to track the performance of a benchmark index that measures the investment return of stocks issued bycompanies located in developed and emerging markets, excluding the United States. The fund employs an indexing investmentapproach designed to track the performance of the FTSE Global All Cap ex US Index, a float-adjusted market-capitalization-weighted index designed to measure equity market performance of companies located in developed and emerging markets, ex-cluding the United States. The index includes approximately 5,800 stocks of companies located in over 45 countries.
Performance 07-17-2018
YTD 1 Mo 1 Yr 3Yr Ann 5Yr Ann 10Yr Ann
Growth of 10,000 9,734 9,841 10,581 11,703 13,146 13,669Fund -2.66 -1.59 5.81 5.38 5.62 3.17+/- MSCI ACWI Ex USA NRUSD
0.42 -0.01 0.53 0.43 0.41 0.12
+/- Category -0.57 -0.17 0.73 1.08 0.45 0.03% Rank in Cat 64 63 40 21 35 —# of Funds in Cat 779 808 752 609 518 362* Currency is displayed in USD
Top Holdings 06-30-2018Weight % Last Price Day Chg % 52 Week Range
T Tencent Holdings Ltd 1.15 378.00 USD 0.59 ] 288.80 - 476.60
T Nestle SA 0.96 79.58 USD 0.73 ] 72.92 - 86.40
T Alibaba Group Holding Ltd ADR 0.81 190.79 USD -0.97 [ 147.50 - 211.70
T Samsung Electronics Co Ltd 0.79 — USD 1.53 ] 44,220.00 - 57,520.00
T HSBC Holdings PLC 0.76 717.40 USD 1.43 ] 650.60 - 798.60
% Assets in Top 5 Holdings 4.46
TIncrease YDecrease RNew to Portfolio
Top Sectors 06-30-2018Fund 3 Yr High 3 Yr Low Cat Avg
y Financial Services 20.47 21.42 20.47 20.53
a Technology 12.21 12.21 9.36 10.78
p Industrials 12.07 12.23 12.07 13.66
t Consumer Cyclical 11.71 11.71 11.42 11.79
s Consumer Defensive 9.51 9.68 9.51 10.70
Fund Cat Avg
0 10 20 30 40
Dividend and Capital Gains DistributionsDistributionDate
DistributionNAV
Long-TermCapital Gain
Short-TermCaptial Gain
Return ofCapital
DividendIncome
DistributionTotal
06-21-2018 29.07 0.0000 0.0000 0.0000 0.3187 0.318703-23-2018 29.66 0.0000 0.0000 0.0000 0.0765 0.076512-20-2017 30.06 0.0000 0.0000 0.0000 0.2896 0.289609-19-2017 29.52 0.0000 0.0000 0.0000 0.1600 0.160006-20-2017 27.73 0.0000 0.0000 0.0000 0.2990 0.2990
3 Year Average Morningstar Risk Measures
Risk vs. Category +Avg
Low Avg High
(623)
Return vs. Category Avg(623)
Pillars
Process ∞ PositivePerformance ¶ NeutralPeople ∞ PositiveParent ∞ PositivePrice ∞ Positive
Rating Œ
Style Map
DeepVal
CoreVal
Core CoreGrow
HighGrow
Micro
Small
Medium
Large
Giant Weighted Averageof holdings
75% of fund’s stockholdings
Asset Allocation
%Net
%Short
%Long
Benchmark
CatAvg
Cash 2.68 0.00 2.68 0.01 -0.17US Stock 0.81 0.00 0.81 0.80 2.58Non US Stock 95.41 0.00 95.41 99.11 94.41Bond 0.18 0.00 0.18 0.00 2.55Other 0.92 0.00 0.92 0.08 0.63
ManagementStart Date
Michael Perre —Christine D. Franquin —
Release date 07-18-2018
©2018 Morningstar. All Rights Reserved. Unless otherwise provided in a separate agreement, you may use this report only in the country in which its original distributor is based. Data as originally reported. Theinformation contained herein is not represented or warranted to be accurate, correct, complete, or timely. This report is for information purposes only, and should not be considered a solicitation to buy or sell any security.Redistribution is prohibited without written permission. To order reprints, call +1 312-696-6100. To license the research, call +1 312-696-6869. ß
®
Page 1 of 11Release date 07-18-2018
©2018 Morningstar. All Rights Reserved. Unless otherwise provided in a separate agreement, you may use this report only in the country in which its original distributor is based. Data as originally reported. Theinformation contained herein is not represented or warranted to be accurate, correct, complete, or timely. This report is for information purposes only, and should not be considered a solicitation to buy or sell any security.Redistribution is prohibited without written permission. To order reprints, call +1 312-696-6100. To license the research, call +1 312-696-6869. ß
®
Page 1 of 11
54

Victory Integrity Small-Cap Value Fund Class R6 MVSSX Morningstar Analyst Rating—
NAV $ NAV Day Change % Yield TTM % Total Assets $ Status Min. Inv. Load Expenses Morningstar Rating TM Category Investment Style
41.98 ]0.17 | 0.41 0.20 3 Open — None 0.96% QQQ Small Value 3 Small Value
Growth of 10,000 07-17-2008 - 07-17-2018
6K
15K
23K
32K
2009 2010 2011 2012 2013 2014 2015 2016 2017 2018
Victory Integrity Small-CapValue Fund Class R6$31,823.16Small Value $25,791.55S&P 500 TR USD $27,975.70
Investment Strategy
The investment seeks to provide long-term capital growth. The Adviser pursues the fund's investment objective by investing,under normal circumstances, at least 80% of the fund's net assets in equity securities (i.e., common stocks, preferred stocks,convertible securities and rights and warrants) of small-capitalization companies. Small-capitalization companies mean thosecompanies with market capitalizations within the range of companies included in the Russell 2000® Index.
Performance 07-17-2018
YTD 1 Mo 1 Yr 3Yr Ann 5Yr Ann 10Yr Ann
Growth of 10,000 10,227 9,934 11,271 13,269 16,162 31,263Fund 2.27 -0.66 12.71 9.89 10.08 12.07+/- S&P 500 TR USD -3.91 -1.86 -3.78 -2.15 -3.06 1.37+/- Category -2.86 -0.73 -0.18 -0.05 1.24 2.22% Rank in Cat 84 85 49 53 35 —# of Funds in Cat 413 422 406 353 310 223* Currency is displayed in USD
Top Holdings 06-30-2018Weight % Last Price Day Chg % 52 Week Range
R iShares Russell 2000 Value ETF 1.57 133.90 USD 0.35 ] 112.01 - 136.50
T IBERIABANK Corp 1.55 77.30 USD 1.71 ] 68.55 - 87.55
Y Synovus Financial Corp 1.21 53.91 USD 0.94 ] 40.27 - 57.40Stifel Financial Corp 1.13 54.28 USD 2.18 ] 44.44 - 68.76Conmed Corp 1.09 73.58 USD -0.54 [ 47.67 - 76.63
% Assets in Top 5 Holdings 6.56
TIncrease YDecrease RNew to Portfolio
Top Sectors 06-30-2018Fund 3 Yr High 3 Yr Low Cat Avg
y Financial Services 27.00 30.75 27.00 26.32
p Industrials 14.50 14.75 13.83 17.32
a Technology 11.94 13.27 8.83 10.58
t Consumer Cyclical 11.69 13.06 9.02 13.47
u Real Estate 9.73 9.73 7.12 7.38
Fund Cat Avg
0 10 20 30 40
Dividend and Capital Gains DistributionsDistributionDate
DistributionNAV
Long-TermCapital Gain
Short-TermCaptial Gain
Return ofCapital
DividendIncome
DistributionTotal
12-26-2017 41.26 0.0000 0.0000 0.0000 0.0890 0.089012-20-2017 41.20 2.1790 0.1778 0.0000 0.0000 2.356712-28-2016 38.84 0.0000 0.0000 0.0000 0.1354 0.135412-29-2015 31.78 0.4648 0.0000 0.0000 0.0492 0.514012-27-2013 31.40 0.0000 0.0000 0.0000 0.0759 0.0759
3 Year Average Morningstar Risk Measures
Risk vs. Category Avg
Low Avg High
(358)
Return vs. Category High(358)
Pillars
Process — —Performance — —People — —Parent — —Price — —
Rating .
Style Map
DeepVal
CoreVal
Core CoreGrow
HighGrow
Micro
Small
Medium
Large
Giant Weighted Averageof holdings
75% of fund’s stockholdings
Asset Allocation
Asset Class % Net
Cash 1.67US Stock 98.31Non US Stock 0.02Bond 0.00Other 0.00
ManagementStart Date
Daniel G. Bandi —Daniel J. DeMonica —Adam I. Friedman —Joe A. Gilbert —J. Bryan Tinsley —
Release date 07-18-2018
©2018 Morningstar. All Rights Reserved. Unless otherwise provided in a separate agreement, you may use this report only in the country in which its original distributor is based. Data as originally reported. Theinformation contained herein is not represented or warranted to be accurate, correct, complete, or timely. This report is for information purposes only, and should not be considered a solicitation to buy or sell any security.Redistribution is prohibited without written permission. To order reprints, call +1 312-696-6100. To license the research, call +1 312-696-6869. ß
®
Page 1 of 11Release date 07-18-2018
©2018 Morningstar. All Rights Reserved. Unless otherwise provided in a separate agreement, you may use this report only in the country in which its original distributor is based. Data as originally reported. Theinformation contained herein is not represented or warranted to be accurate, correct, complete, or timely. This report is for information purposes only, and should not be considered a solicitation to buy or sell any security.Redistribution is prohibited without written permission. To order reprints, call +1 312-696-6100. To license the research, call +1 312-696-6869. ß
®
Page 1 of 11
55

Victory Munder Mid-Cap Core Growth Fund Class R6 MGOSX Morningstar Analyst Rating‰
NAV $ NAV Day Change % Yield TTM % Total Assets $ Status Min. Inv. Load Expenses Morningstar Rating TM Category Investment Style
38.55 ]0.34 | 0.89 0.00 3 Open — None 0.85% QQ Mid-Cap Growth 8 Mid Growth
Growth of 10,000 07-17-2008 - 07-17-2018
6K
13K
21K
28K
2009 2010 2011 2012 2013 2014 2015 2016 2017 2018
Victory Munder Mid-CapCore Growth Fund Class R6$24,826.74Mid-Cap Growth $25,038.63S&P 500 TR USD $27,975.70
Investment Strategy
The investment seeks long-term capital appreciation. The Adviser pursues the fund's objective by investing, under normal cir-cumstances, at least 80% of the fund's net assets in equity securities (i.e., common stocks, preferred stocks, convertible secur-ities and rights and warrants) of mid-capitalization companies. Mid-capitalization companies mean those companies with mar-ket capitalizations within the range of companies included in the S&P MidCap 400® Index.
Performance 07-17-2018
YTD 1 Mo 1 Yr 3Yr Ann 5Yr Ann 10Yr Ann
Growth of 10,000 10,363 9,972 11,419 12,618 16,398 24,695Fund 3.63 -0.28 14.19 8.06 10.40 9.46+/- S&P 500 TR USD -2.55 -1.48 -2.30 -3.97 -2.74 -1.24+/- Category -6.71 -0.47 -6.41 -2.49 -1.69 -0.74% Rank in Cat 92 76 89 83 84 —# of Funds in Cat 601 610 589 526 467 337* Currency is displayed in USD
Top Holdings 06-30-2018Weight % Last Price Day Chg % 52 Week Range
T SPDR® S&P MidCap 400 ETF 3.85 364.05 USD 0.34 ] 307.28 - 366.70
Y Ross Stores Inc 2.73 87.02 USD 0.73 ] 52.85 - 87.22
Y SVB Financial Group 2.56 308.74 USD 0.18 ] 159.44 - 329.65
Y Fidelity National Information ServicesInc
2.51 108.97 USD 0.58 ] 88.97 - 109.15
Y XPO Logistics Inc 2.35 101.68 USD 1.71 ] 54.34 - 115.49
% Assets in Top 5 Holdings 14.01
TIncrease YDecrease RNew to Portfolio
Top Sectors 06-30-2018Fund 3 Yr High 3 Yr Low Cat Avg
a Technology 19.48 19.48 15.71 24.46
t Consumer Cyclical 16.33 16.95 16.06 16.69
p Industrials 14.65 14.67 9.35 17.18
d Healthcare 13.83 13.83 10.01 14.36
y Financial Services 13.18 14.76 13.18 11.71
Fund Cat Avg
0 10 20 30 40
Dividend and Capital Gains DistributionsDistributionDate
DistributionNAV
Long-TermCapital Gain
Short-TermCaptial Gain
Return ofCapital
DividendIncome
DistributionTotal
12-20-2017 36.99 6.5523 0.5361 0.0000 0.0000 7.088412-28-2016 35.67 4.4865 0.0000 0.0000 0.0000 4.486512-29-2015 37.78 3.7192 0.1650 0.0000 0.0000 3.884112-29-2014 43.44 4.6290 0.1990 0.0000 0.0259 4.853912-27-2013 42.89 0.7448 0.0428 0.0000 0.0146 0.8022
3 Year Average Morningstar Risk Measures
Risk vs. Category -Avg
Low Avg High
(541)
Return vs. Category -Avg(541)
Pillars
Process ¶ NeutralPerformance ¶ NeutralPeople ∞ PositiveParent ¶ NeutralPrice § Negative
Rating ‰
Style Map
DeepVal
CoreVal
Core CoreGrow
HighGrow
Micro
Small
Medium
Large
Giant Weighted Averageof holdings
75% of fund’s stockholdings
Asset Allocation
Asset Class % Net
Cash 0.00US Stock 99.81Non US Stock 0.02Bond 0.00Other 0.18
ManagementStart Date
Tony Y. Dong —Brian S. Matuszak —Gavin Hayman —Robert E. Crosby —Sean D. Wright —Robert D. Glise —
Release date 07-18-2018
©2018 Morningstar. All Rights Reserved. Unless otherwise provided in a separate agreement, you may use this report only in the country in which its original distributor is based. Data as originally reported. Theinformation contained herein is not represented or warranted to be accurate, correct, complete, or timely. This report is for information purposes only, and should not be considered a solicitation to buy or sell any security.Redistribution is prohibited without written permission. To order reprints, call +1 312-696-6100. To license the research, call +1 312-696-6869. ß
®
Page 1 of 11Release date 07-18-2018
©2018 Morningstar. All Rights Reserved. Unless otherwise provided in a separate agreement, you may use this report only in the country in which its original distributor is based. Data as originally reported. Theinformation contained herein is not represented or warranted to be accurate, correct, complete, or timely. This report is for information purposes only, and should not be considered a solicitation to buy or sell any security.Redistribution is prohibited without written permission. To order reprints, call +1 312-696-6100. To license the research, call +1 312-696-6869. ß
®
Page 1 of 11
56

Wells Fargo Special Mid Cap Value Fund - Class R6 WFPRX Morningstar Analyst Rating—
NAV $ NAV Day Change % Yield TTM % Total Assets $ Bil Status Min. Inv. Load Expenses Morningstar Rating TM Category Investment Style
38.21 ]0.14 | 0.37 1.02 8.7 Open — None 0.75% QQQQ Mid-Cap Value 2 Mid Value
Growth of 10,000 07-17-2008 - 07-17-2018
6K
14K
22K
31K
2009 2010 2011 2012 2013 2014 2015 2016 2017 2018
Wells Fargo Special Mid CapValue Fund - Class R6$29,585.33Mid-Cap Value $25,090.67S&P 500 TR USD $27,975.70
Investment Strategy
The investment seeks long-term capital appreciation. The fund normally invests at least 80% of its net assets in equity securit-ies of medium-capitalization companies. It invests principally in equity securities of medium-capitalization companies, whichthe manager defines as securities of companies with market capitalizations within the range of the Russell Midcap® Index atthe time of purchase.
Performance 07-17-2018
YTD 1 Mo 1 Yr 3Yr Ann 5Yr Ann 10Yr Ann
Growth of 10,000 9,963 10,079 10,590 12,723 16,591 28,927Fund -0.37 0.79 5.90 8.36 10.66 11.21+/- S&P 500 TR USD -6.54 -0.41 -10.59 -3.67 -2.48 0.50+/- Category -2.20 0.85 -3.24 -0.14 1.18 1.70% Rank in Cat 83 16 86 55 28 —# of Funds in Cat 422 428 402 358 305 219* Currency is displayed in USD
Top Holdings 05-31-2018Weight % Last Price Day Chg % 52 Week Range
Y Jacobs Engineering Group Inc 2.82 66.89 USD 1.35 ] 49.31 - 72.18Sealed Air Corp 2.56 42.92 USD 0.45 ] 40.76 - 49.94Kansas City Southern 2.42 106.55 USD 1.79 ] 99.47 - 114.91Fidelity National Information ServicesInc
2.40 108.97 USD 0.58 ] 88.97 - 109.15
Ameren Corp 2.40 61.07 USD -0.33 [ 51.89 - 64.89
% Assets in Top 5 Holdings 12.59
TIncrease YDecrease RNew to Portfolio
Top Sectors 05-31-2018Fund 3 Yr High 3 Yr Low Cat Avg
y Financial Services 20.51 22.02 20.51 20.65
p Industrials 15.76 17.84 15.76 13.74
t Consumer Cyclical 13.53 13.79 9.07 13.99
o Energy 9.67 10.23 8.20 8.55
a Technology 9.53 12.97 9.53 10.39
Fund Cat Avg
0 10 20 30 40
Dividend and Capital Gains DistributionsDistributionDate
DistributionNAV
Long-TermCapital Gain
Short-TermCaptial Gain
Return ofCapital
DividendIncome
DistributionTotal
12-15-2017 37.94 0.0000 0.0000 0.0000 0.3975 0.397512-13-2017 38.29 0.8426 0.4815 0.0000 0.0000 1.324212-14-2016 36.13 0.0000 0.0000 0.0000 0.3479 0.347912-09-2016 36.93 0.1290 0.0630 0.0000 0.0000 0.192012-16-2015 30.25 0.0000 0.0000 0.0000 0.2280 0.2280
3 Year Average Morningstar Risk Measures
Risk vs. Category -Avg
Low Avg High
(365)
Return vs. Category +Avg(365)
Pillars
Process — —Performance — —People — —Parent — —Price — —
Rating .
Style Map
DeepVal
CoreVal
Core CoreGrow
HighGrow
Micro
Small
Medium
Large
Giant Weighted Averageof holdings
75% of fund’s stockholdings
Asset Allocation
Asset Class % Net
Cash 6.47US Stock 92.53Non US Stock 1.00Bond 0.00Other 0.00
ManagementStart Date
Bryant VanCronkhite —James M. Tringas —
Release date 07-18-2018
©2018 Morningstar. All Rights Reserved. Unless otherwise provided in a separate agreement, you may use this report only in the country in which its original distributor is based. Data as originally reported. Theinformation contained herein is not represented or warranted to be accurate, correct, complete, or timely. This report is for information purposes only, and should not be considered a solicitation to buy or sell any security.Redistribution is prohibited without written permission. To order reprints, call +1 312-696-6100. To license the research, call +1 312-696-6869. ß
®
Page 1 of 11Release date 07-18-2018
©2018 Morningstar. All Rights Reserved. Unless otherwise provided in a separate agreement, you may use this report only in the country in which its original distributor is based. Data as originally reported. Theinformation contained herein is not represented or warranted to be accurate, correct, complete, or timely. This report is for information purposes only, and should not be considered a solicitation to buy or sell any security.Redistribution is prohibited without written permission. To order reprints, call +1 312-696-6100. To license the research, call +1 312-696-6869. ß
®
Page 1 of 11
57

CITY OF PASADENA457 DEFERRED COMPENSATION PLAN
2018 - 2019 Plan Budget
Calendar Year Calendar Year Calendar Year Calendar YearBudget Items 2017 2017 Adjusted 2018 2019
REVENUES *
Plan Expense Assessment: * 80,000$ 89,900$ 94,400$ 99,000$
* The Plan charges an asset-based adminstrative fee of 7 bps*. The Proceeds from this fee in excess of the Plan Provider's contracted fee of $39 per participant are used to cover plan related expenses as provided below. The amounts provided are estimates based upon 12/31/2016 Plan balances and an assumed growth in plan assets of 4% over the course of the next two years.
* The administrative fee was lowered from 10 bps in 3Q 2014. The current 7bps fee may need to be raised based on future budget expectaions.
Total Revenues 80,000$ 89,900$ 94,400$ 99,000$
EXPENSES
Staff:Plan Coordinator Salary and Benefits 59,000$ 59,000$ 59,000$ 59,000$ (CY16 50% loaded salary)Staff Sub-Total 59,000$ 59,000$ 59,000$ 59,000$
Consultant Support:Investment Advisory/Monitoring 35,500$ 70,000$ 35,500$ 35,500$ Third Party Administrator RFP -$ -$ -$ -$ Consultant Support Sub-Total 35,500$ 70,000$ 35,500$ 35,500$
Education/Advice and Communications: Participant Education/Advisory Services 1,250$ -$ 1,250$ 1,250$
Committee Education 1,200$ -$ 1,200$ 1,200$ Education and Communications Sub-Total 2,450$ -$ 2,450$ 2,450$
Dues and Training:Travel/Registration 2,000$ 2,000$ 2,000$ 2,000$ NAGDCA Membership 600$ 600$ 600$ 600$ Dues and Training Sub-Total 2,600$ 2,600$ 2,600$ 2,600$
Miscellaneous:Printing 500$ -$ 500$ 500$ Mailing 200$ -$ 200$ 200$ Miscellaneous Sub-Total 700$ -$ 700$ 700$
Total Expenses 100,250$ 131,600$ 100,250$ 100,250$
Revenue less Expenses (20,250)$ (41,700)$ (5,850)$ (1,250)$
Expected Cash/Reserves at Beginning of Year 191,800$ 191,800$ #REF! 171,550$
Expected Cash/Reserves at End of Year 171,550$ 150,100$ #REF! 170,300$

���
����������� ��������������� ��� ��� ������������������� ������!���!�� �"#���$�%�&���� ���������

������������� ������������������������������������������� ������������������� ������������������� ������������������������������������������� ��������� � !����� ���"� ��"��������������#$%&'()*+*,-.*/-(-00-,#'12-.+*%$'.)3*.456789:8 ;-2'0%$.<)-0$',=.,$.<>?.-@:AB:85 C'0)3*.D2'.+'0E+-F.3& )*<-B

������������� ���������������������������������� �!���"��#����������$�������������������� ��%&'()*')(+', ��%&+-)*+)(+'./01023342445 /06728552464 /05326652366/01521712559 /05426552138 /05928582:77;��<=�%> +')+')(+'-�%'()*')(+'-?���@"A��"���B"��@"A��"���C��?��DE��F /4025142489/4:245:2585/G0702630+')+')(+',�%'()*')(+', +')+')(+'.�%+-)*+)(+'./4024102899/4421852538/1602994 /820152164/126182078/73:2::1
��%&'()*')(+'-/921772699 /920332:08 /826392018
?"�H�I����!���B�I�@@�!?�JK�����"������56974G34 �K�@�"�L��@"�!M�!"�LN���:320346 E�@����OK����@P��Q��H ��L�:

������������� ��� ��������� �������������������� �!"��#$%&'�(� %)'#*!)'&��+'�)�,('�-�$%&'�(� %)'#.�'/0%�%)(�# ���������1 ���������234567 34588 5495554:8: 54:;7 54:5634<<: 34<5: 54889=��>?@ABC�&��)%'�D$%&'�(� %)'#.�'/0%�%)(�#$%&'�(� %)'#.�'/E!%)0%�%)(� ::8 6<F 86;�@��G��@�H���A� ����������$%&'�(� %'�!)I%'�,-�&%��$%&'�(� %)'$%"(/�(J*!)'&��+'�!)K!��%&,�!+)'LL,-�&%��$%&'�(� %)'$%"(/�(J*!)'&��+'�!)$�&(�)'%��I%'�L 7;MF8N 7;M37NOP, Q:96OP, <M<<N,-�&%��$%&'�(� %)'*!)'&��+'�!),�!+)'LLL,-�&%��$%&'�(� %)'0%�%)(� Q;43<FQ5<3489< Q84;65Q55F4<88���������1 ���������28:M<6NQ:;;<M<<NQ:4578Q55:47F7R)-�#'��)'S '�!)#�)$�%).�'/%0%�%)(� F5 F: F:TUVWXYZ[X\]UYXY[XYZY_[ab_U_c\XdbU\_bZ\ceYXY[\XU_VbYaUZYfgaYbZYXYcYX\eYha\ZZbXi\cjYXdZc\XbYZkXU[U\_\cYbkecUVWXYlZkbakWabU\_fLRm"!+& �%)!)�"%��!.# %&'�(� %)' %"(/�(J���('�!)#�"%�!+)'4'/�#.���&�m��('<NMLLRm"!+& �%)!)�"%��!.# %&'�(� %)' %"(/�(J���('�!)#�" �&(�)'4'/�#.���&�m��('Q<MLLL,-�&%��!m'!'%�(!)'&��+'�!)#D+&�)�'/�&� !&'�)� �&�!DM
6656;F6;;
*�'"!m$%#%D�)%K�m�&&�D*!� �)#%'�!)$�%)9;8:5n<5 I� !&'�)�$�&�!D�)D�)�o+)�F<43<5; p!&$�%)q !)#!&r#�S)�" $%��:

������������� ����������� ��������������������� ��� ��� ������������������� ���� !�� �������"#$%&'()*+�,-./0-1�/*234*5�0&46(37'63&4�89:4�%'(;*<�=*>&(61�?:()@�ABCDEFEGFHFFFHFFFEIFHFFFHFFFEJKFHFFFHFFFEJLFHFFFHFFFEKFFHFFFHFFFEKGFHFFFHFFFEKIFHFFFHFFFEMKFHFFFHFFF
JKNMJNKFJL JKNMJNKFJO LNMFNKFJI
P !������Q��� ���������� ����R��������!��������S���"�T ���������� ����R����R�!�����S�� ����R��� ���������� U������������ !��U����� U��������R������V���������� ��� ������� �����!���������"�T ����� ��� ����R����R�!�������� !��������W�� ���"����������XY�Z[\ ]�_����Y������������abcd�[�Ze�f�g��c���hiYZ���jk�kj��l�� ��mk�kj��n�jk�kj��m�� ��jk�kj��lo�� ���mk�kj��nV�U !������� �������MG������������ ��� ��"�"pp��j"ql�
����������r����s� �ssZb��t�ubsYZ��vZ���r����s�����������XY�Z[\�mk�kj��n wjplVmpmVqq�jk�kj��l wjp�VnppV��m�jk�kj��m wj�pV�q�Vpplxy�R�!����z����o�����{����R������oRR !���|��!R�� ��} ���{����R�~
������U� ��z������������������ �������� ��z���pnlq���� |�� ����W�z��� �������W��!����V�j��n �� � ��z������ �� ���������U z�W���

��������������� ���������� ��������������������������������������������� ����������������������������������������������� ��������!����"##$%�"&&'()%*'+"##$%�"&&'()%*'+ ,)+-.)/0�1)/-$%�2$%*/$3$+%�4567�8+9�:;< =>?@4A?5BB �A7 =>?@@5?5A> �AC6DECF 6DE4F"##$%�"&&'()%*'+ ,)+-.)/0�1)/-$%�2$%*/$3$+%�4545�8+9�:;< =66?56C?565 �6>4 =64?C57?665 �6>ECDBEF >D4CF"##$%�"&&'()%*'+ ,)+-.)/0�1)/-$%�2$%*/$3$+%�4547�8+9�:;< =65?774?7B4 �6EA =66?C@6?5>4 �6EBCDE6F CD@4F"##$%�"&&'()%*'+ ,)+-.)/0�1)/-$%�2$%*/$3$+%�45C5�8+9�:;< =A?76A?E4A �6>E =B?5C@?4>E �67A4D4@F 4DEAF"##$%�"&&'()%*'+ ,)+-.)/0�1)/-$%�2$%*/$3$+%�45C7�8+9�:;< =B?>EE?446 �454 =@?BA>?CBB �4644D@BF CDC@F"##$%�"&&'()%*'+ ,)+-.)/0�1)/-$%�2$%*/$3$+%�45>5�8+9�:;< =>?>@>?>B> �67A =>?@56?A>> �6AC6D7BF 6DA@F"##$%�"&&'()%*'+ ,)+-.)/0�1)/-$%�2$%*/$3$+%�45>7�8+9�:;< =A?@A>?E54 �44A =E?5C6?B7C �44@4D>7F 4D>4F"##$%�"&&'()%*'+ ,)+-.)/0�1)/-$%�2$%*/$3$+%�4575�8+9�:;< =6?E@4?B>A �B> =4?5AE?>EA �@A5DACF 5DE6F"##$%�"&&'()%*'+ ,)+-.)/0�1)/-$%�2$%*/$3$+%�4577�8+9�:;< =6?C4>?64> �E6 =6?>BB?A46 �E@5D>EF 5D76F"##$%�"&&'()%*'+ ,)+-.)/0�1)/-$%�2$%*/$3$+%�45A5�8+9�:;< =>E?C@A �7 =6@5?CA7 �6C5D54F 5D5EF"##$%�"&&'()%*'+ ,)+-.)/0�1)/-$%�2$%*/$3$+%�45A7�8+9�:;< =65?4BE �4 =@?BA6 �C5D55F 5D55F"##$%�"&&'()%*'+ ,)+-.)/0�1)/-$%�2$%*/$3$+%�8+('3$�8+9�:;< =4?EE7?6BA �7@ =4?A>E?47B �7B5D@EF 5D@6FGH�I�JKI�H� G�KIJ��IJ����L�J� ��L���8+%$/+)%*'+)&�M.+08+%$/+)%*'+)&�M.+0 "3$/*()+�M.+0#�N./'O)(*P*(�Q/�2A =>?>A7?>77 �4B4 =>?4>4?7CA �4E76D7EF 6D>AF8+%$/+)%*'+)&�M.+0 RMS�8+%$/+)%*'+)&�T$U�V*#('9$/W�2A =C?BAB?E5E �465 =C?EA6?>>6 �45B6DCAF 6D4@F8+%$/+)%*'+)&�M.+0 XYY$+Z$*3$/�Q&'[)&�8 =>?5@5?6C7 �454 =>?4A@?A>7 �45B6D>>F 6D>EF8+%$/+)%*'+)&�M.+0 ,)+-.)/0�8+%$/+)%*'+)&�,)&.$�O'/%P'&*' =C?5C4?B7> �6@B =4?EA@?C>C �6@46D5EF 5D@7F8+%$/+)%*'+)&�M.+0 ,)+-.)/0�1'%)&�8+%&�S%'(\�8+0$]�"03*/)& =@CE?476 �AE =B7E?EC@ �A75DCCF 5D4@FG��I�JKIK�� G�HIJ��I��HHL��� HLK��S3)&&�)YS3)&&�)Y _&)(\2'(\�2.##$&&�4555�8+0$]�'&&�M =4?@4>?7>B �67C =C?44E?>75 �67B6D5CF 6D66FS3)&&�)Y ,)+-.)/0�S3)&&�)Y�Q/'U%Z�8+0$]�8+#%& =@?E7A?7@4 �CE4 =65?CEA?E>B �CAECD>CF CD7EFS3)&&�)Y ,*(%'/W�8+%$-/*%W�S3)&&�)Y�,)&.$�2A =7?6B6?ABA �4BE =7?56E?7>6 �4EA6DB4F 6DE4FG��I���I��� G��I���I�K��L��� �LK��R*0�)YR*0�)Y _&)(\2'(\�R*0�)Y�N.*%W�8+0$]�a�'&&�M =C?EB6?A6B �6BC =>?55E?5AE �6B@6DCCF 6DCBFR*0�)Y ,*(%'/W�R.+0$/�R*0�)Y�'/$�Q/'U%Z�2A =7?747?BEA �4>E =7?4EB?C7A �4C@6D@>F 6DB6FR*0�)Y b$&&#�M)/-'�SY$(�R0�Y�,)&�2A =C?AB>?EAE �464 =C?46E?E47 �6@C6D4@F 6D66FG��IJJ�I��� G��IH��I�K�KLH�� KL���c)/-$�)Yc)/-$�)Y _$(\$/�,)&.$�N.*%W�8+#%*%.%*'+)& =6A?56>?77C �C@E =67?66A?B>E �CB77DACF 7D45Fc)/-$�)Y _&)(\2'(\�N.*%W�8+0$]�a�'&&$(%*9$�M =4E?BBA?>C@ �ABB =4E?ABA?BBB �AE>@DB5F @D74Fc)/-$�)Y RMS�Q/'U%Z�2A =4>?6E@?EC4 �7@@ =4A?C6B?@6A �7@>BD>@F @D57FG��I���I��K G�JI���I�H���LJ�� ��L���_'+0_'+0 _&)(\2'(\�dS�V$[%�8+0$]�M.+0�'&&�M =6?644?@64 �7A =6?5CE?6>7 �7E5DC@F 5DCAF_'+0 VM"�8+P&)%*'+aO/'%$(%$0�S$(./*%*$#�8 =6?654?CE6 �C@ =6?64B?6>B �C@5DC@F 5DC@F_'+0 R$%/'Y'&*%)+�b$#%�1'%)&�2$%./+�_'+0�O&)+ =7?>5E?4AB �C5E =7?4C@?EBB �C5C6D@5F 6DB5FG�I���IHH� G�IK�HI����L��� �LHH�M*]$0M*]$0 O)#)0$+)�.#%'3�S%)[&$�,)&.$�M.+0 =@B?A>5?5C> �6?77A =@E?BAC?>E4 �6?74>C>DA7F CCDA>FGJ�I�K�I��K GJ�I���IK���KL�H� ��L�K�_/'\$/)-$_/'\$/)-$ S(ZU)[�SV_�S$(./*%*$# =C?>4E?>45 �4A =>?5@>?475 �C56D45F 6D>6F_/'\$/)-$ S(ZU)[�SV_�S$(./*%*$#�2'%Z =BBC �6 =6B?4BE �C5D55F 5D56F_/'\$/)-$ S(ZU)[�SV_�SU$$Y�O/'-/)3 =EAE?744 �4B =>C4?7@E �C55D4EF 5D67F_/'\$/)-$ S(ZU)[�SV_�SU$$Y�O/'-/)3�2'%Z =7?@5> �4 =4C6 �C5D55F 5D55FGKI���I��� GKIHKHI��H�LK�� �LH�����*%W�'P�O)#)0$+)�V$P$//$0�'3Y$+#)%*'+�O&)+@BE>6a56 2$Y'/%*+-�O$/*'0�N+0*+-�e.+$�C5?�456B �� M'/�O&)+�SY'+#'/�d#$�X+&W O)-$�A

����������� ������������������������������������ ! "#$%&'((&)$) "#(*&$$(&*$$)**+**, )**+**,
���-./0�12�34546784�9727::76�-1;<7854/.18�3=48>?@ABCDB E7<1:/.8F�37:.16�G86.8F�HI87�JDK�LDB? �� M1:�3=48�N<1851:�O57�P8=0 34F7�@

����������� ������������������������������������ ! "#$%&'((&)$) "#(*&$$(&*$$)**+**, )**+**,
���-./0�12�34546784�9727::76�-1;<7854/.18�3=48>?@ABCDB E7<1:/.8F�37:.16�G86.8F�HI87�JDK�LDB? �� M1:�3=48�N<1851:�O57�P8=0 34F7�@

��������������
������������ ��� � ��������� �������� ����������� ��������� ���������� ���� �� ������ ����� ��� ��! ��" #$$�
%&'(�)*+,-.�/..01�/**&2+13&,45678�)+(13239+,1.
7�)+(13239+,1. ���#:��$�
/;0�<,=,&>,�:�?������$�
#����$� /;0�7@�A�7B������� ��� ��CD����E��� F�$�G�$G�$#:H
:������#���#�:� /;0�IJ4BKKK�)+(13239+,1. 84L�)+(13239+,1.6B4�)+(13239+,1.MLL�)+(13239+,1.
L7B�)+(13239+,1.
�����?��������
�N��� /;0�6@�A�6B#��������������#�
#� /;0�OJL@�:�?�?��������
����� /;0�M@�A�MB���PQRS�TU�VWXWYZ[W�\ZUZ]]ZY�PT _Z[XWRQT[�VW[abcdefge hZ_T]RQ[i�VZ]QTY�j[YQ[i�kl[Z�mgn�ogeb �� pT]�VW[�q_T[XT]�rXZ�s[S VWiZ�b

��������������� �������������������������������� ���������������������������������������������� �������� ������������������������������� ����������������� �������������������������������������� � �� ������!��"������"�����#�$�%&��'()*�%��+�,�$���)����-.��������������+�%�'�/�0���%*(���������+�1234135167�$�%&��'()*�%��+�,�$���)����-.�����+�%�89���&�����(���:����������+�1234135167
�&�;<=>?@�A�?>B@�A�B>C@�A�C>D<E@F�G�� �H�� I�)�� J�K��/�
�&� J�K��/�I�)��H��;<=>?@�A�?>B@�A�B>C@�A�C>D<E@F�G�� �1L11LM6L16LM5L15LM4L14LM
NO�5P 41�Q�4P R1�Q�RP M1�Q�MP SO�21 J�K��/� 1654RM
�$�%&��*T�U��V�%1L11LM6L16LM5L15LM4L14LMRL1
NO�5P 41�Q�4P R1�Q�RP M1�Q�MP SO�21 J�K��/� 1654RM
�$�%&��*T�U��V�%
�=�=�?�?�=�@ �W�=�?�?�=�@ �W�=�=�?�=�W�W�?�=�?�?�@�=�?�?�B�?�@ �=�=�?�?�?�WH�� I�)�� J�K��/����X��!����Y��������Z��������X������������Y���>[\BWA@W ]�������"�Y����������"�_����?@��=@W[ �� ���Y����a�������F���b��! Y�"��>

����������������������
��� �� �� �� �� �� �� ��� �������
������������������������������ !"#$%&'()*'#)+,-.)#(/)-(01("2-#'-+0(3)4,-.)#(/)-(01("2-#0(3)4,-.)#(/)-(01("2-#0-56 789:7; <79:<; 8<9:=; ::9:7; <9>7; =9==;:>9?8; 8@9>?;:A9A7; ?=98=; 8A9BA; ??9??;889>8; 7@9A:;??9A:; <>9@=; >B9A>; 7797@;!"#$%&'()*'#)+,-.)#(/)-(01("2-#0-56
C2D415'-E#1)4F)-('G)2H1'4("F"1'-(#IJ6'G)IK"(3J'5'-F)#"-!"#$%&'()*'#)+,-.)#(/)-(01("2-#'#K)55'#2(3)4"-.)#(/)-(21("2-#I"#"55D#(4'()+3)4)9
L"(62HM'#'+)-'&)H)44)+L2/1)-#'("2-M5'-AB@<:N=: !)124("-GM)4"2+O-+"-GPD-)?=I8=:B Q24M5'-R12-#24S#)0-56 M'G):=

�������������������� ���������������������������� ��������
�������������������� ���� !�"� �
�������������#����� ����$!�"�$�
���������%������� ����&!�"�&�
�����������
�� ����'�(!����)*+*,-*
����%�����%����������#�����
.�/012�31/���4��1�5���������6�7 ��.�/012�31/���4��1�5���������6�7 ��.�/012�31/���4��1�5���������6�7 %�.�/012�31/���4��1�5���������6�7 ���.�/012�31/���4��1�5���������6�7 �%�.�/012�31/���4��1�5���������6�7 ���.�/012�31/���4��1�5���������6�7 ���.�/012�31/���4��1�5���������6�7 ���.�/012�31/���4��1�5���������6�7 #�.�/012�31/���4��1�5���������6�7 ��.�/012�31/���4��1�5����6���5��6�7 ��3���8 ����
9�:;�*<=���,>�9=:<?;?@=*<A�-?<B�C=D=*;�A�?*E*��F?A+�G�H=<��C=A�I�J*K�A<L�*<�E@<?,*
MMMNOPQP�RQP�ST�URVRSWPX�YTQ�ZO[X�R\P�\QT]MMM
&_(�9=:<?;?@=*<A ( �9=:<?;?@=*<A�!�9=:<?;?@=*<A_$��9=:<?;?@=*<A
a��9=:<?;?@=*<A�$�9=:<?;?@=*<A!�9=:<?;?@=*<A
���b[Zc�TY�dRXRePSR�fPYPQQPe�bTg PSXRZ[TS�dVRShijklmnl oPTQZ[S\�dPQ[Te�pSe[S\�q]SP�rns�tnli �� uTQ�dVRS�vTSXTQ�wXP�xSVc dR\P�ll

���������������� ������������������������������������������������������ ������������������������������ ��������������� �����!�������������� �"������� ����������� ������#�$�#�#��������������� �����!����������� ��������%&'(�)'���(��*�+�����,��'�-.�%)' ��(��*�+�����,��'/'0�1��'2���(��*�+���34����$������5�!���#�6������ �����������������������������!������������� �����������78�99:�;<=>?@ABC�DEFGHEI�GBJKLBM�H>LN@KO?NK>L�PQRL�=?@SBT�UBV>@NI�WR@AX�YZ[\�� �����������]_]�� �����������������������������������a���!�9bcd9ce9f8g�h��!�������� ����������$������ �#���������$����$��� ���������������#�������������� ����������� ����������������������#���������������#�!� �����$��� �����������ijkij
_ijlijmij]iij
no�kh pi�q�ph _i�q�_h i�q�h ro�li ��s�t�u7v��!�6������ �����w����������������!�9bcd9ce9f8 dxf dux fx9 9xx7]kyp]yki]l ]kyp]yki]z ilypiyki]m
a���!�9bcd9ce9f8g������������������������!����� �����������z_{ij�
���6�����!�w���#����5�!����#�6� ����������w���u8|xf}9f ~���������w����#���#����� ���d9g�e9f8 �� ����w�������������������� w����fe

�������������� ��������������������������������������������������������������������������� ! "������������������#$%%�������������� �������������������������������������������������������#�������&���������'())������������������#$%%%%*������������������������������������������������������������������+����&����,����������������������������-�+���.�,$/�����������#��������������&�������0���������&�������#�����������������1�����#�2���������������������3$��-$%456789:;�<86=>?�5@A8>BCDEFGHIJ�K67B9>L�6=�MN:8>9AO�PQ?@�MBB7AL�578R:S�6=�<86=>?�5@A8>BC�ABT�EFGHIJ�<LABUO�VFGE' 'WX '(X 'YX ')X 'Z X
[\�W] �_�] ( �_�(] �_�] a\�Y bcdcefc
ghic�bjkhklijkecm���������������������������������������������&�������������������������$�m���������������������������������������������&������n����������������&����������������������#���#�#����������������&��������������������������������$opqrisq�girjktkuicj�vecjrkwxjkec�oyexcj�wz�osq gizt{qtd�vecjrkwxjkec�|c}eryijkecopqrisq�girjktkuicj�vecjrkwxjkec�oyexcj�wz�osqosq~����0�����0���3��0�3������������
W ZY.� ��� W Z� W Z).� ��.� ���.� �3.� ���.� .� ���.� ���.� ��.� ��.� ���.� . 3��. ���.� ���.� �3�.3 �.���� �����3���3ZW�Z�W ZY ZW�Z�W Z� Y� �W Z)�����2������������������������������������������2�����������#����1������#�2�&�������������������0�� ���������������#���#���������� ���� �� ������������������������� ������

����������������������������������������������
������� ������� ������� ������ � ����� � �����
������������� ���!"#$%&�'()*+,�)-.&)/.�')&0121')*0�3)()*2.�)*4�05.�)-.&)/.�*%63.&�$7�1*-.,06.*0�$'01$*,�5.(4�38�8$%&�'()*�')&0121')*0,�)&.�,5$9*�5.&.:;< ��= �������������>�!��� ?@AB ��CD�E�< "�A ���F���C�"G,�$7���H��H�� I��')&0121')*0,�1*�8$%&�'()*�5.(4�)*�)-.&)/.�$7��JK��1*-.,06.*0�$'01$*,:L5.�6)M$&108�$7�')&0121')*0,�5$(4�(.,,�05)*��:N�1*-.,06.*0�$'01$*,�1*�05.1&�O.71*.4�P$*0&13%01$*�'()*�)22$%*0:QRSTUVWXY�Z[\]SZ ]S _�XabcXd�eTcfVbgUfbTc�SUVhXij�klmnj�onp�Zqrcst�$7�u)&0121')*0,�9105�)�v)()*2. ���N ��N � ��N�����P108�$7�u),)4.*)�O.7.&&.4�P$6'.*,)01$*�u()*�I�� w� x.'$&01*/�u.&1$4�y*41*/�z%*.������� I �� {$&�u()*�|'$*,$&�},.�~*(8 u)/.� �

���������������� ����������������������������� ���!����"�#����"�����#����!�$������%&'���(������������)������*+&(� ,-.����� /012 /013/014&(�5678 9:;$::79:<$<=<977$><7?=@?8 9>$<?;9>$;789<$<><A������ 9:;:$:=89:;:$BC<9:B=$88BD6C= 9:B;$8;?9:B7$C<=9:7?$;>;;=@;8 9:=C$7><9:=?$?=C98=$<>CB=@B8 9;;$?B<9;C$:779;C$C:;&'���(������������&��-.��)������EFGHIJKLMNKIOPKQRSTUVWXOYMJJGHYZ[OXOYJK\[]MPKOY_KYHIK\RSQ\a[bccddHK[IeKf\gGhQi\MjIeXRSkhWhSlmMJJGHYZ[OXOYJKdOIKjOIZeJejOYZOJJGHYZnOXOYJKdoKXeYQRSTUVjXOYdOZZoKjOIZeJejOYZdpJHIIKYZKqjXG]KIdOYOIKYKZGfjXOYXGOYdhbKZeIKqKYZdONeYPdoKXeYjXOYdOZjIKNeGHdKqjXG]KIdGIIGXXKGNKIeYZGcbMdOIKYGZeYJXHKhr��s��"�#����"���"t�u����#�����=Cv?=v7=:> ::: BCC C?8 <7C ;87 ?1/wx1w/014 1/wx1w/012 04wx0w/013
9::B$C?C9::?$=<<9:=7$<8=y��y!��zt�� ���!����"�#����"�##���"�����#��������@���7=:B���9<C$78?%{|0|/0}000|~0}000|40}000|30}000|100}000|1/0}000|1~0}000|140}000
��/� x0�x� ~0�~� �0��� ��40 ����-����"���s�����������������������"���s���8><B:@=: �����"��!s����������!����?=$7=:> ���s����������A������ s�!�:;

���������������� ������������������������������������ � ��������������������������������������������������������� � ������������
���� !"#$%#"&$%&"'$%'"( )$*+,+-.+/��� 0�1��� 2�3��4�
��� 2�3��4�0�1���/���� !"#$%#"&$%&"'$%'"( )$*+,+-.+���������������������5-67897:;<;89+:=>9?@9+9?@79A@B9C9+<@-D9887-E;F9:@CGH��IJ���;+:>;=8C9+K
LM&N"&)LM"ON)MML)$N&)$LM!&N&!#LMOPNM#)L$ LM)N&&'LM)!N!""L'!NMPPLM$ON)O"LM'#N'POL$ LONM)PLMMPNP"&LM#NP#!L##N'#$L'&N&#&LPNO#'LMPN&$"LM&#N&$PL'#N##'LMM&N"$&LM')N'$OL$LM&N))MLMP$N'$"L)'N#OOLM#'N!M"LM""N)#ML$ L$L$L$L$L$/��� 0�1��� 2�3��4�
H�HI�J���H��J���H���J���H���J���H���J���QR�S ����S I��IS T��TS UR�� 2�3��4� H�H��J���HI�J���H��J���H��J���H���J���H���J���H�I�J���
��������VW��X��
H�HI�J���H��J���H���J���H���J���H���J���QR�S ����S I��IS T��TS UR�� 2�3��4� H�H��J���HI�J���H��J���H��J���H���J���H���J���H�I�J���
��������VW��X�� L'&N&#&Y;:G-DZ9=9[@+9\@D@77@[Y-F8@+=9:;-+ZC9+"PO&M%$M ]@8-7:;+AZ@7;-[+[;+A_6+@#$N!$MP -7ZC9+a8-+=-7*=@b+CG Z9A@M)
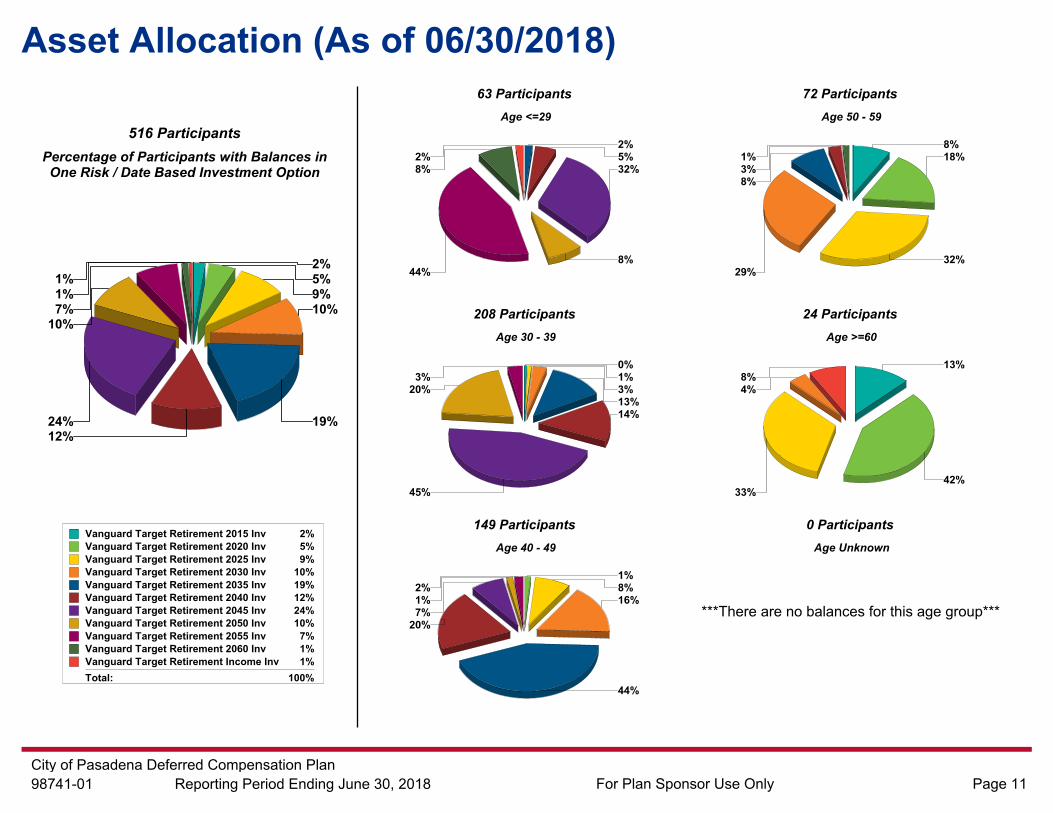

���������������� ������������������������������������ ����!������������"���������!���������������������������������������������#�$������������#����""������������%��������&�'(����������� )��*��+��',��-��������./'0,�������1�*��20'����3,��'� ,���&�*�����'./,43��'(����������� )��*��+��',��-��������./'0,�������1�*��20'����3,��'� ,���&�*�����'./'�50'����3,���&����������� 6789:;��$��������������� ��������������"��������������"$����������������������<=�"��%>�., ��1��������&�'(0'����3,���&����������� ?��!�����#��"$@AB��C������� ��D��������!����������������%EFGHIJKLMNOPQQRRILOJSLTUHVWXYZ[\L]X_PLSJLaLbcHbTSdLbKLGIJeLfg��� h�4��� i�2�')�j;kj;lj;mj;7j;njj;
opk9 :j5:9 lj5l9 6j569 qpmj i�2�')� j;6;nj;n6;kj;k6;:j;:6;lj;
��������&�31r��.��jlj7jnkjnmj
kjjkljk7j:kjopk9 :j5:9 lj5l9 6j569 qpmj i�2�')� jkjj
ljjmjjs'���31r��.��=��$��t�������<�������=�����������t"��uvwxAyzA {��������t�����|�����}���~z#�zAv ���t"������������?�"$ t���Aw

�������������� ������������ ������������������������������� ���������� ������������������ ��!��"�#! �������������$!�%�& ��!��"�#! '()'()*'(+������������(*),()*'(+-�.� ��/�01.�� �/�02���2����3� 4������ "��%& 56789:76;6595:<7:=95>9;7;:<5:7=<?7;::@(*ABC(A(+D 567;EE7=<8@(*A(C*A+DD5:7??<78=65E<;788:588<7E=659 5?7=E6786?@+A*CBACF(5?7>=>7>?<5EEE7?:=5=?7EEE59'()'()*'(D������������(*),()*'(D '()'()*'(F������������'+),')*'(FG!H��!�"%I JH�!��"%I K��L K�&&�M!� NO#&��!�@'@*A'''A'''@PA'''A'''@+A'''A'''@FA'''A'''@('A'''A'''@(*A'''A'''@(PA'''A'''
(*),()*'(+ (*),()*'(D +),')*'(F���Q�����.�R���S����T�.� �S�Q������������R���=><;8U98 2��� ���V�R� ��S�4�S��V�W����E97�?98> �� X� �R����Y����� �Z���[��� R�V��8>

��������������� ��� ����������������������������������������������������������������������������������������� ���������������� ���������������������� !���"����� ����������������������#!�$�"�����#%&&'(%))*+,(-*. /0/12 /0/324,.56,789,75'(:'(-7';'.(<=/3>.?@AB C/DEFG1= <G CH<F=H3 </%&&'(%))*+,(-*.%&&'(%))*+,(-*. D0/D2 10<<24,.56,789,75'(:'(-7';'.(<=<=>.?@AB CDE=FE3I ID C<G1F1/3 EH%&&'(%))*+,(-*. 10<<2 10IG24,.56,789,75'(:'(-7';'.(<=<3>.?@AB C3/<FHEE /// CD/=FGED IE%&&'(%))*+,(-*. D03H2 10GE24,.56,789,75'(:'(-7';'.(<=D=>.?@AB C1DDFE13 /=H C<I<FHHG ///%&&'(%))*+,(-*. G0=I2 H0E124,.56,789,75'(:'(-7';'.(<=D3>.?@AB CH1=FD<< /1/ C1I=F33I /1H%&&'(%))*+,(-*. 10GI2 10DG24,.56,789,75'(:'(-7';'.(<=1=>.?@AB C3GIF31E //E C<HDF=13 //3%&&'(%))*+,(-*. H0I<2 H01/24,.56,789,75'(:'(-7';'.(<=13>.?@AB CIGDF==3 /EE C1GDFG<< /HG%&&'(%))*+,(-*. <01D2 D0<D24,.56,789,75'(:'(-7';'.(<=3=>.?@AB C<I3F3=E G1 C<=<F1GI H=%&&'(%))*+,(-*. /0I=2 D0=E24,.56,789,75'(:'(-7';'.(<=33>.?@AB C<D=F3HH 33 C/IDF=H/ 3D%&&'(%))*+,(-*. =0=<2 =0D=24,.56,789,75'(:'(-7';'.(<=G=>.?@AB C<F/D1 3 C/IF==I /<%&&'(%))*+,(-*. =0=/2 =0=<24,.56,789,75'(:'(-7';'.(<=G3>.?@AB C/F=D1 / C/F33D <%&&'(%))*+,(-*. =0DE2 =0/I24,.56,789,75'(:'(-7';'.(>.+*;'>.?@AB C13FE=/ /3 C//FG1D E"JKJ�� L�KL$�MLN"�LN�$� M�NJOLNO��>.('7.,(-*.,)P6.8 /0D/2 /01<2%;'7-+,.P6.8&Q67*R,+-S-+T7:G C/3IFHHD /GD CEIF=/3 /1/>.('7.,(-*.,)P6.8>.('7.,(-*.,)P6.8 /0<H2 /0<<2UPV>.('7.,(-*.,)W'XY-&+*?'7Z:G C/31F3EH /<H CHGF=IH //1>.('7.,(-*.,)P6.8 /0=E2 /03/2[\\'.]'-;'7T)*,)> C/D/FHDH //= CI1F1EG /=H>.('7.,(-*.,)P6.8 /01/2 /0DD24,.56,78>.('7.,(-*.,)4,)6'R*7(S*)-* C/H/FDE1 /<< CEDF=</ /=/>.('7.,(-*.,)P6.8 =0H/2 =0H=24,.56,789*(,)>.()V(*+_>.8'%8;-7,) CEGF/3/ G/ C1DFI/E 3=JK O� $K�#�M �"N$"� M"#$NJ" V;,))a,\ /0/=2 /0/E2b),+_:*+_:6&&'))<===>.8'a*))P C/DDF1/= /=D CH1F=GD EIV;,))a,\V;,))a,\ <0I/2 <0E=24,.56,78V;,))a,\T7*X(]>.8'>.&() CD3DF1== <=E C/H3F<=D /E=V;,))a,\ /01I2 /0D324-+(*7Z>.('57-(ZV;,))a,\4,)6':G C/E/FD/1 /GH CE1F<GI /3/JKJ�� JK""�M$$#N��L M"""NJ"LU-8a,\ /0G32 /03I2b),+_:*+_U-8a,\Qc6-(Z>.8'da*))P C<==FIDG /<1 CIIFG/1 //IU-8a,\U-8a,\ /0DE2 /0=124-+(*7ZU6.8'7U-8a,\a*7'T7*X(]:G C/GHFH1E /<I CG3FD== ///U-8a,\ /0<H2 /0112e'))&P,75*V\'+U8a\4,):G C/31F/3G /DD CEIFEH< //3LK"�� LK� �MJ��N#"O M�JLN #$f,75'a,\ D0<H2 D0=32b'+_'74,)6'Qc6-(Z>.&(-(6(-*.,) CDIGFEGH </= C/I=FIHH /E=f,75'a,\f,75'a,\ H01G2 G0ID2b),+_:*+_Qc6-(Z>.8'da*))'+(-?'P CI=HF=HH 1/1 C1DDFGG1 DG/f,75'a,\ 30/H2 10HG2UPVT7*X(]:G CG<EFHIH <IE C<IHFI/I <H<�JKO�� �LK L�M�NO"�N L� MO��NJ$�b*.8 =0332 =0DI2b),+_:*+_gVY'(>.8'P6.8a*))P CGHF/H= 1= C<1F11H D<b*.8b*.8 =0312 =03H2YP%>.S),(-*.dR7*('+('8V'+67-(-'&> CGGF=3E <I CD3FGI< <3b*.8 /0GD2 /01/2U'(7*\*)-(,.e'&(9*(,):'(67.b*.8R),. C/IHFGD3 //1 CEEF/11 I<�K �� �K" �M""�N#$� M�L#N�#LP-'8 <I0HG2 <30/<2R,&,8'.,a6&(*;V(,)'4,)6'P6.8 CDFG/GF=HI H<3 C/F3H<F1== GDHP-'8 �OK $� �JK���M"N$�$N� O M�NJ �NL��b7*_'7,5' =03<2 =0H12V+]X,VYbVX''\R7*57,; CGDF3E= H C1GF<GI Hb7*_'7,5'b7*_'7,5' =0=/2 =0==2V+]X,VYbVX''\R7*57,;:*(] CHG= / C<I/ <�KJ"� �K L�M$LN"L� ML$NJ$�hijklmnopqrstuoknvwpxtrvytpvtntzvwjp{r|}~���������� M��N�J�N$ ���K��� M$N�JONJ#� ���K���a-(Z*SR,&,8'.,Y'S'77'8a*;\'.&,(-*.R),.IEH1/d=/ :'\*7(-.5R'7-*8Q.8-.5�6.'D=F<=/E P*7R),.V\*.&*7g&'[.)Z R,5'/I

����������������������������������������������������������������� ��� ������� ������� ������� � �� �������
����������������� !�!"�����#� $%&$��������������!�'��(���)��)���������)��)����"�����*����+&��������������!�'��(���)��)���������)��)����
�+&��,&�������������!-./0�120345412637�5.63048/39�26�2:902;9�.<������190�=920>??@:902;9�.<�3.32A�5.63048/34.67�B/046;�3C9�091.0346;�1904.B>D�E�!�� ��+&��,&��F#����$�G���!������������,H6�5.I12047.6J�8279B�.6�K@LMN@�7/0:9=�097/A37J�3C9�2:902;9�B9<9002A�<.0�;.:906I9632A�MN�1A267�47�28./3�OPJQRS>?TUVWXYZ[�\] _ ]a�_ZbcdZe�VdfXcgWfcVd�hijd�UWXkZl�mZnVXfa�ojXYp�qrstu��& '&(��& �������
����������������������������������������������+&��,&�� �v&�E&�
���������������������������������������� ��� ������� ������� ������� � �� ������� ���������������������������������������������������������
�+&��,&�� �v&�E&����N43=�.<�w272B962�M9<9009B�N.I1967234.6�wA26xyQzS{RS |91.0346;�w904.B�}6B46;�~/69��RJ��RSy �� �.0�wA26��1.67.0��79��6A= w2;9��R

������������� ��������������������������������� �!�����"#��$�%�#����&�#�'����'�$�(��#��'�)�����*��'������&��%���#�$&��&+�&�'���!(���'�#��&�'�� ��,��"�('�-
.����/0����1��23 �41 ����56785795:;<��3=>?�.����/0��� ��>����3��>��@1 ����>�>���A>����B�2��3 ��3=>?�.����/0��� ��>����3��>��@C��D�22�� �E����F���2 D�22�� E����F���21G>��A>���3=>?�.����/0���HIJ�KLJMKNJ�OJPJMMKQ�MKRJ�KSTUN�UTUVIWNIQX�YTSZJU[KRJO�ZKMRWYWZKUR[�WU�\JPWUJO�]TURMW_RWTU�ZQKU[�W[�abcdaefg�(�&������h���g����' ,i��j+k�l�('&����h�m"���&���no���m''(���g(�*�$��h����h���g����' ��'%�i��j+k����'���p��i
cdqdrdsdtddudvdbdwdqcxdyc�V�ryru�V�cyq�V�vyvu�V�qccyqcq�V�qryqru�V�qcyqq�V�qvyqvu�V�rccyrcq�V�rryrru�V�rczyrc
�sq�w�b�r�rr�t�qr�qu�q�r�bt
�c�c �caccd�c �caccd�c �caccd�c �caccd�c �caccd�c �caccd�c �caccd�c �caccd�c �caccd�c �caccd
�qsaucd�sawd�saqd�cabbd�waud�qavd�arud�vacrd�uabd�qcawud�suabtd
�caccd������������ �>�>��
���]WRX�TP�{K[KOJUK�\JPJMMJO�]TSZJU[KRWTU�{QKUwbvtqVcq |JZTMRWUN�{JMWTO�}UOWUN�~_UJ�sc��rcqb �� �TM�{QKU��ZTU[TM��[J��UQX {KNJ�rq

�������������� �������� ��� �������������������� ���������������� ������� ���������!����������� ������ �� ���"���� ������������ ���������������!�� ��� �� �����#���������������������"����� �����$�%&'����(���������������)���(�*+,-*,.*/01�������!������������� ��� ������" ���� ������������ ��$
������������2�3�&�45#45#6457�� �48#94#645745#45#645:�� �56#95#645:45#45#6458�� �56#95#6458 ;< 7<8 6=8;55 <8> >48;59 5>9 >8>99:<94<<: 94$9=?=5$>>?<4$<7?
@A����B�)C&�'D&�� ����!�� ������� ���������� ��� �� ���� �� ����������� ���� �������������������������!��<<E:4 �6<?����������������" ����������� �57?������� �������" ����� ����FG �9?��������H�� ��������� ��I����� �� ����������� ������"�� ���J �6>?������� �������������� ��"������������ ������6<?������� ��� ��������$KLMNOPQRS�TUVWXY�Z[[NP\O]\R_�]�\R�WNaaNbRP�VcPdR\�efghijk�3l'��D�k�33��������������%&'���1�������!������������� ��� ������" ���� ������������ ��$.mnm-+m
nomom�&'�p�q&&(�� �&�r��3�� @st&�C�u&%&���&3&� t&l'�'�����(�t&�C�u& v�p&�
�� ��48#94#6457*m.*mn*m+*m0*m/**m
%&���&3&� t&l'�'�����(�t&�C�u& @st&�C�u&w&�u&�'D&��(�����������)3����%�xx&A�vC&��,y�'�(&��&A)3���
%�xx�C&���,�y�'�(&�� w'B3&������t&x(<4$>5? 9=$6<? 8<$:<? 4$44? 544$44?=>$4>?���z���� ��1��������{��������z "������� ��1���>7:=5E45 G�� ����!�1��� ��|����!�}����94 �6457 �� ~ ��1������ �� ���������� 1�!��66

���������������� ���������������������������������������������������������������������������������������
������������ �� ���!���!
������������ �� ����""#�� ��$%$"&�""����'&()� $�*�*�������������*+� ����,�$���-��$����""#�� ��$%$"&�""����'&()� $�*�*�������������*��""$��
�$���-��$�������������./0123342567048403408091���:��;2<121=>=88018?61/74=?9=9742>>0712=9@ABC���-��$D��,(�����./0123342567048403408091���:��;2<121=>3=416E63=918?61/74=?9=9742>>0712=9@ABC���
�
(FF'(+GF'�H (IH&'J(+KH+H&(F(IH&'�&(�H L(+M��(IH&'J( JN(&FH))JN#(L �'�HF'�O'+PH)�IH+�)IH&&'FFFO+JN �&Q�H+�'(F )H'�&'P(�H�&Q)�J���������������������������������������������������������
(FF'(+GF'�H (IH&'J(+KH+H&(F(IH&'�&(�H L(+M��(IH&'J( JN(&FH))JN#(L�'�HF'�O'+PH)�IH+�)IH&&'FFFO+JN �&Q�H+�'(F )H'�&'P(�H�&Q)�J�R61S2<T=8=709=U0<04407R2V3098=1629T>=9WXYZ[\][ A0324169T04627_9769a90b]cd][X e24T>=9f329824g80h9>S T=0db
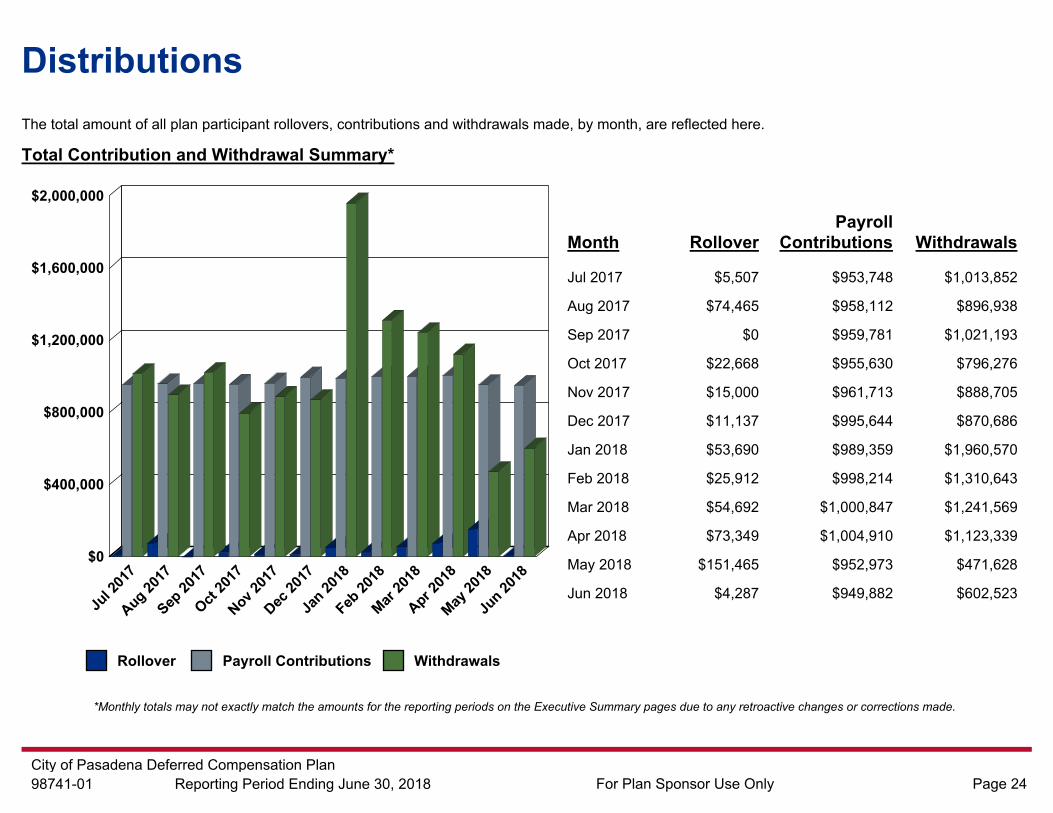
�������������� ����� ������ �� ��� ���� ����������� ���������� ������������� ��� ����������� ����� � ������ ��� ��������� ����!"��#$ %��������� #& '��(&�#)#$ *�++#�,- .��( /�$$�01� 2#,��$$%���������� '��(&�#)#$�
3456789: 757;9< =;: 657 >?;@79: =;7@8 78> ;=5A67< B5C 78> C>D5C7E6F D>CE5G< 56 78> H?>@A7EI> JA==;C: D;F>< GA> 75 ;6: C>7C5;@7EI> @8;6F>< 5C @5CC>@7E56< =;G>K/�$$�01� 2#,��$$ %���������� '��(&�#)#$�
LM�MNOLOP�PQMLNLRR�QQSLTM�NNNLTT�TUOLMU�QVNLRM�VTRLMP�QVRLOU�UPVLTMT�PQMLP�RSOLVMU�OPSLVMS�TTRLVMV�OSTLVMM�QUNLVQT�OTULVVM�QPPLVSV�UMVLVVS�RTPLT�NNN�SPOLT�NNP�VTNLVMR�VOULVPV�SSR
LT�NTU�SMRLSVQ�VUSLOVQ�ROQLSON�QSQLT�VQN�MONLT�UTN�QPULT�RPT�MQVLT�TRU�UUVLPOT�QRSLQNR�MRUW�� RNTOX�Y RNTOZ�� RNTO[�� RNTO\�� RNTO]�� RNTOW�� RNTS�� RNTS_�� RNTSX�� RNTS_� RNTSW�� RNTSabaacaaadaacaaaecfaacaaaecgaacaaafcaaacaaa
h�$ faeij�k faei*1l faeimn� faeio�0 faei�1n faeih# faedp1� faed.#� faedjl� faed.#, faedh� faedLT�NRT�TVULSSS�ONM
q�� �� r������� ]������� q����������� r���VSOPTsNT t�������Y r����� u����Y W��� UN� RNTS �� r��� Z������ v�� [�� r�Y� RP

���������������� ������������������������������������������������������ ��! �����������������������������
"� � ��#$����%�����&�'�!���������
(�� � �� )'��*�*��+���*,�+���*��+���*��+���*���+���
-.�/ ��0�/ ,�0,/ 1�01/ 2.�� )'�� �3��31�3��31�3��31�3��31,3�
-.�/ ��0�/ ,�0,/ 1�01/ 2.�� )'��
*�*1+���*��+���*�1+���*��+���*�1+���*��+���*�1+���*,�+���*,1+���-.�/ ��0�/ ,�0,/ 1�01/ 2.�� )'��456789:;<;=>?;@>9>AA>=48BC>?<;658?:D;?EFGHIJKI L>C8A65?M:>A58=N?=5?MOP?>QKRSKIF T8A:D;?UC8?<8AV<>W?D7 :;M>SX

����������� ��������������������������������������� �������������������������������������������������������������� ����! ������������������������������������������� �������������������"�#�$%&#�#��'(�)����*�$��+, ����-,#�($�.���/012/13/45�667��������������������������������������� ������������� �������������������������������������������������879:;6<�.���/012/13/45�99=>>?����������������������������������������@�����������������������������������4A�2/B�������������������������������������CDEFGHIJKLMNOELPOEPQRJSTUJVWFUXHTYGXTFUEGHZJ[\]_\PZJHabbQJcGbXcd,e�����/41/413/45��/012/13/45/41/413/4f��4312413/4f/41/413/40��4312413/40 -,g�&$#,'�����d&hi,j kh�&�#0l40A4lm n4�3m4�3mfn2�4/A�f3fn3�54/�033 d&hi,j kh�&�#54l45 n44l�AmAn343�2A0n222�lAA8>87:>>>:>>>89:>>>:>>>8;:>>>:>>>8<:>>>:>>>86:>>>:>>>8o:>>>:>>>8p:>>>:>>>8q:>>>:>>>
79r;7r9>7o 79r;7r9>7p or;>r9>7q
8p:6<<:qpp 8p:9>>:;9o 8o:q>p:96o
s��t���� l55 l52 ll4u����v�������w�������u�!��������v���m5fA4x/4 y�������v����z����{���2/�3/45 @��v���|������}��~��� v���30

���������������� ��� ������������������� ����������� ������������������� ����������� ������������������� ������������� ��� ���� ��� �� ��� �����������
��� ���������� �� ������ ����� �!"�#��
���$
������������
%� ���&'()*+(�,-./-01/�2.(). �34 �35 �5567/�/8�9:-(0/�;()'-1(�<(7)(.(0/*/-'( �5=4 �>?>5@ �=AAB8/*:�9*::. �>?C3A �>?5A> �>?D3>����� �� ������&118E0/�F*:*01( �CD �C> �>=&::81*/-80. �G �= �>HE0I�J*:E(. �4 �= �4K8*0. �AC4 �A@C �>G@<(LE(./�;/*/(M(0/. �> �4 �AB)*0.*1/-80�N-./8)O �DD �D> �>4���� ���� ���$%� ���P����� �!"�#��&::81*/-80. �4 �> �4HE0I�B)*0.Q(). �4 �4 �>K8*0�<(LE(./. �C4 �A> �3��� ��� ��%� ���P
���9-/O�8Q�R*.*I(0*�,(Q())(I�98M7(0.*/-80�R:*05G3C>S4> <(78)/-0+�R()-8I�T0I-0+�UE0(�A4?�D4>G �� H8)�R:*0�;780.8)�2.(�60:O R*+(�D3

��������������� �������������������� ���������������������� ����� �� �������������������� ���������������������� ���������������������� �������������� ���������������������������������������������� ��������������������������� ���� �� ����������� �����������!"#$%&'�(")*"+'$,"��������-%'.�/0*$&$'1.+�(")*"+'$,"���2����������������������3+&1+"�4.$+�5+1'1$'1.+��������4.$+�61&"�6""70�����8���2���
�9:;9<"0<"0<"0<"0 =.=>-=>-<"0<"0<"0=. ��������-%'.�/0*$&$'1.+�(")*"+'$,"�?$@1A%A =>-���������������� ����� <"0�������������������� =.������ ��B� ������� =.������������������� ���� <"0�������������������� <"0���C����D������ =.���E1'F�.#�($0$7"+$�!"#"))"7�E.AG"+0$'1.+�(&$+HIJKLMNL O"G.)'1+,�(")1.7�/+71+,�P%+"�QNR�;NLI �� 6.)�(&$+�SG.+0.)�T0"�3+&F ($,"�;I

������������������ ������������������������������������ ! "#����#$�$�����#%���&!��'!���#(��#������������!�(���)��$�������!�(��������&!�*���� !��+%!��!%������,-.-/��%!��� ���!�.�0������ ���!����1�!'(�#1!%���# 2��������+�(�% ���!������!�$3��%! �!��*%#2!%�+!�(%#�� ��4�����((�� �*�!.5��+�*�!�5'(�#1!!� 5'(�#1!!����#���&!�'!���+!������!%&� !�%!6��%!'!���������%!�� ��&!�1�!'(�#1!�.�0�!� #�������*��!���(#��!'(�#1!!���$#%'���#�����������*!!���%���'���!���#�#%���(���*1���!�(����#����!�%! #%�2!!(��+��1��!'.7���%�*���#�� 8���$��������(�%����������%������$#%�!&!%1����*�%�!'!���%!��#��������9�%!��#�� #�!.�:�������%!(#%�4���!�$�&!�'#��� #''#������%�*���#���1(!���%!�������%��!������&������1;���1�#��!%��1(!���%!� #'*��!�����#���!�<=��!%>� ��!+#%1.7!$����!��?#�� 8��#������������#�� �%%!���#�������#������!��'!���4���� ���%!���!�*1���!�(%�#%�6��%�!%3!��;���!�������# �%�4���!��#���������!$��������#$���!��!9��6��%�!%3!��.�0�!�#���������+��'#���������� %�!�����!%!������#$���!��!$��������!������*!���93%!(#%�!��$#%���!� ��!���%�1!�%������� ������!$����!�.8 #����@!�� ��#��?#�������� ! 0�!��#�����'#����#$������ ��&!4�#���������+��#�����!���*1�(����(�%�� �(����.�?#�����������&!�*!!��#$$�!��#%��!!'!�����������%�*���#���%!��#���� ���!�.8 ��&!���%�� �(��������������� !� �����(�%�� �(�������#��%!�� ��&!�1�!'(�#1!��������&!���*���� !."#��%�*���#�� 8'#������!(#���!��$#%�����'#�!1��1(!�4�*#���%!+���%�(�1%#����������+�!�%#��#&!%�.�8��!���������%!����!���#���!�(������%��+� #�&!%��#���#�#�%�%! #%�2!!(��+��1��!'�%!��#���� ���!�.?#�������� !�A8&!%�+!B 0�!��&!%�+!�#$�����#���������+��#���*���� !�������!�(���.�0������ ���!���!$����!���#���*���� !�4�*����#!���#���� ���!�#$$�!��#%��!!'!���#���*���� !�.���"��1�#$������!���7!$!%%!��"#'(!�����#������CDEF/3-/ @!(#%���+��!%�#��5����+�G��!�H-4�I-/D �� �#%������J(#��#%�K�!�=��1 ��+!�IC

��������������� ����������� ��������������������� ���������������� !�����"
��� #��$�%&'%�()����*��+���������*�,������-�.����*������-��������+��!���+/����+��+������!������������.��**������������-�.����*+��������!��������+���*�+��-��������!�*���0�*���-������������+�.���������*-��0�*�����0���������+�-�������������������������-1�2�*��������������-�.����*��0����+�����������������������34��������*�-�-1
5�����+��)*�6 7����*��8+�����*�������������+�*�++�����*�-�+���������+1�)��.����-��0����+���-�*������*����+������������*�-�-�������+���*��*�����1 �����������9�*������ !�����" 7����!��������*������.��**�����!�*���0�*���-���-����0�����-��*��������������+1�2�*����������������*����+����������:;1;3�������������������*�-�-1�7��+���*�����-��+��������*�-���������+���-����*�����0����+1 ������������������������ 0������ !�����" 7�������*��0������.��*���������������+�.����**�0���������+�-�!�-�-����������0�����.�������������������������+/�������������*���0�*���-�����0�*���-�-�������������������������-1 ����������� ���������������������<�**��� 0������ !�����" )����*��+���������*�,������-�.����*������-��������+��!���+/����+��+������!�������0������.��**�-�**����0�����-�.����*+��������!��������+���*�+��-��������!�*���0�*���-������������+�.���������*-��0�*�����0���������+�-�������������������������-1�2�*��������������-�.����*��0����+�����������������������:;1;3��������*�-�-1 ����������+������������� 7�����0�����.�����!�*���0�*���-��*��������������+�6�����!������*��������**�������������+�-�������������������������-1���������.� �+�-����<�.����-���0���+������ *��=>?@3A;3 ���������� ����-�B�-����C����D;/�E;3> �� )��� *���F���+���G+��2�*� ����D;

������������������ ���������������������������������� ��!�"�#����� �#���������������� !$������$�#$�%������#$&��'�()��!�*����(�#����+������������� ��!�,$���"�#���� �!���)�(���$-�����*��)�#��#���������������� !$�!�*�����$)��������%�#$���(�#����+��!������#)����������������� ��!���-�)#����#$���'�()���$����$�����#)���������������� ��!�$--����$���������#$���+�!����������%��$-��!���#�%�(#�����#$&����������������%�����!���#��.��!���-�%)����������*���(&���*����%��!���$��#��)�(���$-��$����()���%��������������(&��!���$��#��)�(���$-��#�%�(#�����#$&���+��!����������(�����)�$����������������-$�����$���!�������������������$�$�����)��(&��!���#���$���!�����$��/�����%��&����+�����������$��0�����&�������$�1�#- 2�������()��$���!��������/���-$����&�3)�#�-&��%�����$����� !��!��!��������()��$����$�����������������&�(#��������#&��$��!�������������+�#���2�����"�#���� 2��$##)��$-��##��$����()��$����������$�����&���'������-�������4�$)�'����������������*������'��!��%�����*�#)�'�-�������� ��!��� �#�'�����-$�-���)���������+0$##$*��� 2�������()��$���!��������/���-$����3)�#�-&��%�����$����� !��!��!��������()��$����$�����������$##���$*������$�����#�%�(#���#��'��������$��#�502�$��0$�!�502+�$��#�������������% �!���)�(���$-��#�%�(#�������������������*�#&��$����()���%��$�����������������%�����!���#��+��!����������(�����)�$����������������-$�����$���!�������������������$�$�����)��(&��!���#���$���!�����$��/�����%��&����+���6��&�$-����������7�-������6$��������$���#��89:;<=>< 0��$����%�����$��?����%�@)���A>'�B><9 �� C$���#���1�$��$��D���E�#& ��%��A<

������������������ ������������������� ������������ ���!��������"���� ����#��$��%��&����� �����'!�(!��!��)� (������������������������)��*�����$��)$�����������+� ��$�,$���������-�$��(� ��� $$�)� ���$$�( �������� ���������) �����%)��.��������������/� ��.����������������0������.�(!��&������0�$��.����������'��!���'�$�.������ ����������������)$����!��� ��$��* ���� ���$$��(��0�.� ���������&�)����(�)����$ ���+
1*) '���2�����*������������ ��!��)� ��(����������0�(��� �����������!��������*����*��"�����%�3����45����6����7�������%�8������(��9 *)��%�:3567�;.�9 �) �����<���#�������=�3����' ��>�$$�&�.�9?@�3����45����6����7�������%�8������(��9 *)��%� ��A�'�B �".�< *��?���(�=�AB.�AB@������!�������������������������$�����+��!�������*��"�.�$ & �.����0�(��*��"�.���������&���$�*�������������� '�����%��!�������)�(��0�� '�������������������%�)��*���� �+1*) '���2�����*������0�� �%�C��0�(������� ��������%���0������������3� �).�669�:��3;.���������$$%���&����������0���*������0���������'! $$%� '�������������%� ��3����45����6����7�������%�8������(��9 *)��%+�D ������ �*��� ���� �����3�(������� �������'''+��0������� +��(+& 0+���9��%� ��,��������E��������9 *)������ ��,$��FGHIJ4KJ 2�) ����&�,��� ��1����&�L����MK.�NKJG �� O ��,$���C) �� ��P���?�$% ,�&��MN

Fund Inception Date: July 2012Fund Investment Manager: Great-West Capital Management, LLCInvestment Policy Statement: Government & Corporate A
June 30, 2018
PasadenaCustom Stable Value Fund
Quarterly Report
Great-West FinancialSM refers to products and services provided by Great-West Life & Annuity Insurance Company (GWL&A), Corporate Headquarters: Greenwood Village, CO; Great-West Life & Annuity Insurance Company of New York (GWL&A of NY), Home Office: White Plains, NY; its subsidiaries and affiliates including Great-West Capital Management, LLC. The trademarks, logos, service marks, and design elements used are owned by GWL&A. ©2013 Great-West Life & Annuity Insurance Company. All rights reserved. 11/2013 PT187353
Core securities, when offered, are offered through GWFS Equities, Inc. and/or other broker dealers. GWFS Equities, Inc., Member FINRA/SIPC, is a wholly owned subsidiary of Great-West Life & Annuity Insurance Company.
CSVFSTMT13For Plan Sponsor use only - Not for use with Plan Participants
Confidential - Do not disclose or disseminate

Fees and Expenses
6/30/18 3/31/18 Investment Management Fee 0.04%Number of Long Term Holdings 152 154 Participant Book Value Guarantee (Wrap) Fee 0.15%Market Value of Assets $95.01 MM $95.42 MM Total Fees 0.19%Book Value Liabilities (participant account balances) $97.86 MM $98.03 MMMarket Value of Assets to Book Value of Liabilities 97.1% 97.3%Average Life 3.8 Years 4.0 YearsAverage Duration 3.1 Years 3.2 YearsCredited Rate 1.90% 2Q 2018 1.77% 1Q 2018Next Quarter Credited Rate 1.89% 3Q 2018
Average Rating (S&P / Moody's / Fitch)
Fund Allocation(in millions)
Market Value
% of Portfolio
Market Value
% of Portfolio
Agency MBS 46.37$ 48.8% 44.46$ 46.6%Agency CMO 3.79$ 4.0% 5.34$ 5.6%Agency CMBS 12.08$ 12.7% 12.79$ 13.4%Agency Securities 0.28$ 0.3% 0.67$ 0.7%Asset Backed Securities 5.76$ 6.1% 6.94$ 7.3%Non-Agency CMBS 9.23$ 9.7% 8.68$ 9.1%Corporate Bonds 16.94$ 17.8% 15.46$ 16.2%Total Market Value of Long Term Holdings 94.45$ 99.4% 94.33$ 98.9%Cash, Short term & Other 0.56$ 0.6% 1.09$ 1.1%Total Market Value of Assets 95.01$ 100.0% 95.42$ 100.0%
AA+/AAA/AAA
Pasadena Custom Stable Value FundQuarterly Statement as of
June 30, 2018
AA+/AAA/AAA
6/30/18 3/31/18
Fund Characteristics
Agency MBS49%
Agency CMO4%
Agency CMBS13%
Agency Securities
0%
Asset Backed Securities
6%
Non-Agency CMBS10%
Corporate Bonds18%
Cash0%
2For Plan Sponsor use only - Not for use with Plan Participants
Confidential - Do not disclose or disseminate

Performance

Annual Performance 3-Month YTD 1-Yr 3-Yr 5-Yr 10-YrSince
InceptionPasadena Custom Stable Value Fund (net of fees) 0.47% 0.91% 1.78% 1.69% 1.72% N/A 1.71%
####### ####### ####### ####### 12/1/2013Calendar Year Performance 2017 2016 2015 2014 2013Pasadena Custom Stable Value Fund (net of fees) 1.70% 1.64% 1.58% 1.46% 2.00%
30-Jun 31-May 30-Apr 31-MarCurrent Yield of the Portfolio Based on BV of Assets 2.32% 2.25% 2.22% 2.22%Amortization of Realized G/L AND of Asset/Liability Differential -0.13% -0.11% -0.11% -0.11%Net Investment Performance 2.19% 2.14% 2.11% 2.11%Investment Management Fees -0.04% -0.04% -0.04% -0.04%Participant Book Value Guarantee (Wrap) Fee -0.15% -0.15% -0.15% -0.15%Investment Performance After Fees 2.00% 1.95% 1.92% 1.92%
Credited Rate History
1Q 2Q 3Q 4Q2018 1.77% 1.90%2017 1.66% 1.67% 1.71% 1.75%2016 1.72% 1.58% 1.60% 1.65%2015 1.46% 1.55% 1.63% 1.68%2014 1.73% 1.26% 1.41% 1.42%2013 1.92% 2.05% 2.04% 1.99%2012 N/A N/A 2.00% 1.95%
Performance/Credited Rates
Pasadena Custom Stable Value FundQuarterly Statement as of
June 30, 2018
4For Plan Sponsor use only - Not for use with Plan Participants
Confidential - Do not disclose or disseminate

S&P Moodys FitchAAA 7.2% 77.4% 78.7%AA+ 65.4% 0.5% 1.6%AA 0.8% 3.3% 2.1%AA- 3.7% 1.3% 2.1%A+ 4.2% 4.7% 4.0%A 3.6% 3.4% 2.1%A- 2.4% 3.2% 0.5%BBB+ 0.5% 0.5% 0.0%BBB 0.5% 0.0% 0.5%BBB- 0.0% 0.0% 0.0%BB & below 0.0% 0.0% 0.0%NR 11.7% 5.7% 8.3%
* Estimated principal and interest flow from current securities in the portfolio.
Total Assets
Portfolio Quality
Pasadena Custom Stable Value FundQuarterly Statement as of
June 30, 2018
0.0%
10.0%
20.0%
30.0%
40.0%
50.0%
60.0%
70.0%
80.0%
90.0%
AAA AA+ AA AA- A+ A A- BBB+ BBB BBB- BB &below
NR
Portfolio Quality
S&P Moodys Fitch
0.00%
5.00%
10.00%
15.00%
20.00%
25.00%
2018 2019 2020 2021 2022 2023 2024 2025 2026 2027 2028 +
Estimated Cash Flow Schedule*
5For Plan Sponsor use only - Not for use with Plan Participants
Confidential - Do not disclose or disseminate

Holdings Detail

Long Term Holdings ReportJune 30, 2018
Pasadena Custom Stable Value Fund
Cusip Par Value Purchase Price Book Value Market Value * Purchase Date Book Yld S&P ** Moody's Fitch'sDescription023135AW6 AMAZON.COM INC SENIOR UNSECURED GLOBAL NOTES2.4% Due 2/22/2023 FA22 500,000.00 480,165.00 480,405.07 481,515.72 20180608 3.32 AA- Baa1 A+05723KAD2 BAKER HUGHES LLC/CO-OBL SENIOR UNSECURED GLOBAL NOTES2.773% Due 12/15/2022 JD15 500,000.00 491,250.00 491,949.43 484,895.30 20180201 3.16 A- A3 NR06051GGY9 BANK OF AMERICA CORP SENIOR UNSECURED NOTES Adj % Due 1/23/2022 JJ23 750,000.00 750,000.00 750,000.00 737,000.10 20180118 2.74 A- A3 A+06541XAA8 BANK 2017-BNK7 ABS SER.2017 BNK7 CL.A1 1.984% Due 9/15/2060 Mo-1 220,001.85 219,996.56 219,969.48 214,872.92 20170919 1.96 NR Aaa AAA06541XAB6 BANK 2017-BNK7 ABS SER.2017-BNK7 CL.A2 3.061% Due 9/15/2060 Mo-1 250,000.00 257,491.00 256,300.15 247,446.63 20170919 2.37 NR Aaa AAA08161HAA8 BENCHMARK MTGE TRUST 2018-B4 ABS SER.2018-B4 CL.A1 3 1/8% Due 7/15/2051 Mo-1 1,000,000.00 999,988.72 999,988.72 1,000,000.00 20180628 3.10 AAA NR AAA12189PAF9 BNSF RAILWAY COMPANY LLC PASS THRU CERTS SER.1999-2 7.57% Due 1/2/2021 JJ2 95,578.23 110,600.93 100,807.51 97,742.19 20131210 1.80 AA+ Aa2 NR12648XAH3 CREDIT SUISSE MTGE T 2014-WIN1 CMO SER.2014-WIN1 CL.1A1 3% Due 8/25/2029 Mo-1 206,707.15 211,261.16 210,509.21 203,130.17 20141117 2.30 AAA NR NR126802DN4 CABELA'S MASTER CREDIT CARD TR ABS SER.2016-1 CL.A1 1.78% Due 6/15/2022 Mo-15 750,000.00 749,883.75 749,570.51 742,092.08 20160623 1.80 AAA NR AAA15189XAP3 CENTERPOINT ENER HSTN ELEC LLC SECURED GENERAL REF MTGE NOTE1.85% Due 6/1/2021 JD1 1,000,000.00 998,750.00 999,257.22 961,337.55 20160513 1.88 A A1 A+166764AN0 CHEVRON CORP UNSECURED NOTES 2.193% Due 11/15/2019 MN15 250,000.00 250,000.00 250,000.00 248,270.00 20141110 2.19 AA- Aa2 NR17275RBJ0 CISCO SYSTEMS INC SENIOR UNSECURED GLOBAL NOTES1.85% Due 9/20/2021 MS20 500,000.00 499,930.00 499,948.89 477,295.93 20160913 1.85 AA- A1 NR17325FAJ7 CITIBANK NA SENIOR UNSECURED NOTES 2 1/8% Due 10/20/2020 AO20 500,000.00 499,825.00 499,857.82 487,742.78 20171013 2.14 A+ A1 A+23312VAA4 DB COMM MORTGAGE TR 2016-C3 ABS SER.2016-C3 CL.A1 1.502% Due 9/10/2049 Mo-1 738,883.08 738,868.81 738,786.76 722,070.46 20160726 1.49 NR Aaa AAA233851BR4 DAIMLER FINANCE NA LLC SENIOR UNSECURED NOTES 2 1/4% Due 3/2/2020 MS2 500,000.00 498,850.00 499,593.41 491,770.00 20150223 2.30 A A2 A-266893AA4 DURRAH MSN 35603 SECURED GLOBAL NOTES 1.684% Due 1/22/2025 JAJO2 292,254.88 292,254.88 292,254.88 279,448.05 20130116 1.69 NR NR NR29373LAB7 ENTERPRISE FLEET FIN 2018-1 ABS SER.2018-1 CL.A2 2.87% Due 10/20/2023 Mo-20 500,000.00 499,949.00 499,956.12 498,344.70 20180313 2.89 AAA NR AAA29736RAH3 ESTEE LAUDER COMPANY INC SENIOR UNSECURED GLOBAL NOTES1.7% Due 5/10/2021 MN10 500,000.00 499,880.00 499,926.47 481,924.53 20160505 1.71 A+ A2 NR30258EAA3 FHLMC ABS FLOAT SER.2017-KT01 CL.A Flt % Due 2/25/2020 Mo-25 1,250,000.00 1,250,000.00 1,250,000.00 1,252,879.13 20170131 1.51 AA+ Aaa AAA30294UAA3 FHLMC ABS SER.2016-SB17 CL.A5F 1.86% Due 6/25/2021 Mo-1 661,204.15 667,093.00 664,654.09 642,889.26 20160722 1.62 AA+ Aaa AAA30300KAA7 FRESB FHLMC GUARANTEED ABS SER.2017-SB28 CL.A5H Adj % Due 1/25/2037 Mo-1 1,221,122.64 1,227,003.55 1,225,097.71 1,204,796.60 20170315 2.56 AA+ Aaa AAA3128M9SN3 FHLMC GOLD POOL #G07425 GIANT 4% Due 6/1/2043 Mo-1 1,067,515.38 1,110,216.03 1,107,745.61 1,098,585.16 20140328 3.30 AA+ Aaa AAA3128MD3A9 FHLMC GOLD POOL #G15093 3% Due 4/1/2029 Mo-1 791,165.55 819,968.91 814,362.40 789,923.22 20140507 2.20 AA+ Aaa AAA3128MEDQ1 FHLMC GOLD POOL #G15311 3% Due 9/1/2027 Mo-1 525,790.88 551,998.26 546,809.69 525,874.05 20150515 1.87 AA+ Aaa AAA3128MEVE8 FHLMC POOL #G15813 3% Due 4/1/2031 Mo-1 1,091,455.93 1,129,486.37 1,127,579.87 1,085,331.12 20170810 2.26 AA+ Aaa AAA3128MFC22 FHLMC POOL #G16189 3% Due 7/1/2029 Mo-1 1,185,149.82 1,225,472.67 1,223,256.39 1,185,338.52 20170607 2.02 AA+ Aaa AAA3128MFC63 FHLMC POOL #G16193 3% Due 1/1/2029 Mo-1 397,955.32 410,453.59 409,704.23 398,018.69 20170713 2.13 AA+ Aaa AAA3128MFNG9 FHLMC POOL #G16491 3% Due 8/1/2028 Mo-1 974,741.66 974,741.66 974,741.66 974,879.24 20180608 2.99 AA+ Aaa AAA3128P75W9 FHLMC GOLD POOL #C91761 4% Due 5/1/2034 Mo-1 243,014.91 258,886.84 257,176.76 251,316.34 20140610 2.65 AA+ Aaa AAA3128P7R70 FHLMC GOLD POOL #C91410 4% Due 11/1/2031 Mo-1 352,043.24 373,798.40 370,974.31 364,064.93 20140318 2.53 AA+ Aaa AAA3128P7RY1 FHLMC GOLD POOL #C91403 3 1/2% Due 3/1/2032 Mo-1 992,056.25 1,050,494.54 1,040,882.09 1,006,065.20 20120703 2.22 AA+ Aaa AAA3128P7S20 FHLMC GOLD POOL #C91437 3 1/2% Due 4/1/2032 Mo-1 1,144,339.02 1,218,542.25 1,205,856.95 1,160,463.44 20120709 2.17 AA+ Aaa AAA3128P7TM5 FHLMC GOLD POOL #C91456 3 1/2% Due 6/1/2032 Mo-1 1,178,222.61 1,249,284.13 1,237,853.38 1,194,831.26 20120705 2.20 AA+ Aaa AAA3128P8CY5 FNMA POOL #C91887 3% Due 9/1/2036 Mo-1 507,028.16 533,567.92 532,036.65 499,751.16 20160826 2.11 AA+ Aaa AAA3128PXT71 FHLMC POOL #JI7774 3% Due 1/1/2027 Mo-1 373,422.09 385,616.66 384,481.67 373,481.12 20170406 2.00 AA+ Aaa AAA3128PYJD7 FHLMC GOLD POOL #J18360 3% Due 3/1/2027 Mo-1 534,744.42 559,309.24 552,341.76 534,829.06 20120629 1.91 AA+ Aaa AAA31294T7M2 FHLMC GOLD POOL #E09000 3% Due 6/1/2027 Mo-1 731,200.96 766,390.04 756,990.72 731,317.26 20120705 1.82 AA+ Aaa AAA31306XC84 FHLMC GOLD POOL #J20095 2 1/2% Due 8/1/2027 Mo-1 1,044,765.06 1,082,229.69 1,069,905.19 1,021,639.23 20120813 1.85 AA+ Aaa AAA31307QEL7 FHLMC GOLD POOL #J33739 3% Due 2/1/2031 Mo-1 564,708.45 591,179.19 588,217.11 560,893.23 20160226 2.06 AA+ Aaa AAA3136AK2A0 FNMA ABS SER.2014-M10 CL.ASQ2 2.17135% Due 9/25/2019 Mo- 668,221.45 668,221.18 667,502.94 662,847.55 20140910 2.15 AA+ Aaa AAA3136AKQG1 FNMA CMO SER.2014-42 CL.A 3% Due 8/25/2036 Mo-1 400,730.16 412,689.47 410,879.98 398,335.08 20140625 2.13 AA+ Aaa AAA3136ANLM7 FNMA ABS SER.2015-M6 CL.A1 Adj % Due 1/25/2026 Mo-1 788,403.46 831,642.45 820,226.95 786,507.11 20150410 1.82 AA+ Aaa AAA3136APJT0 FNMA CMO SER.2015-51 CL.CD 3% Due 7/25/2044 Mo-1 643,437.41 664,449.66 661,302.59 630,622.32 20150709 2.28 AA+ Aaa AAA3136AQC81 FNMA ABS SER.2015-M17 CL.A1 ACES 2.51951% Due 11/25/2025 Mo 557,213.52 562,785.55 560,780.91 549,255.06 20151211 2.31 AA+ Aaa AAA3136AQDQ0 FNMA ABS SER.2015-M13 CL.ASQ2 1.646% Due 9/25/2019 Mo-1 249,848.07 252,350.01 250,063.94 248,569.55 20151007 1.22 AA+ Aaa AAA3136ATNQ3 FNMA CMO SER.2016-66 CL.PA 3% Due 3/25/2046 Mo-1 655,281.35 680,161.56 675,490.69 650,860.43 20160805 2.28 AA+ Aaa AAA3136AUCH2 FNMA CMO SER.2016-85 CL.A 3% Due 6/25/2046 Mo-1 1,110,178.29 1,146,952.95 1,140,887.96 1,086,746.64 20161011 2.38 AA+ Aaa AAA3137ACK99 FHLMC CMO SER.3876 CL.CA 2 3/4% Due 6/15/2026 Mo-1 10,158.90 10,514.46 10,158.90 10,155.76 20131212 0.74 AA+ Aaa AAA3137AH6Q6 FHLMC ABS SER.K704 CL.A2 2.412% Due 8/25/2018 Mo-1 184,945.81 189,381.63 184,775.88 184,629.92 20141002 1.69 AA+ Aaa AAA3137AVE86 FHLMC ABS SER.K711 CL.A2 1.73% Due 7/25/2019 Mo-1 500,000.00 494,179.69 498,370.69 495,221.40 20141002 1.98 AA+ Aaa AAA3137B1BS0 FHLMC ABS SER.K026 CL.A2 2.51% Due 11/25/2022 Mo-1 1,000,000.00 1,018,593.75 1,010,025.38 978,137.00 20150122 2.23 AA+ Aaa AAA3137B3NA2 FHLMC ABS SER.K030 CL.A2 3 1/4% Due 4/25/2023 Mo-1 500,000.00 547,050.78 533,164.47 503,345.70 20160630 1.71 AA+ Aaa AAA3137B3NW4 FHLMC ABS SER.K031 CL.A1 2.778% Due 9/25/2022 Mo-1 401,627.59 420,234.24 413,014.53 400,133.62 20150402 1.38 AA+ Aaa AAA3137BAHA3 FHLMC ABS SER.K715 CL.A2 2.856% Due 1/25/2021 Mo-1 1,000,000.00 1,055,429.69 1,023,590.13 996,544.10 20150408 1.80 AA+ Aaa AAA3137BQBY2 FHLMC ABS SER.K722 CL.A1 2.183% Due 5/25/2022 Mo-1 712,748.03 726,987.31 721,622.97 695,545.50 20160622 1.74 AAA Aaa AAA3137BSRY1 FHLMC ABS SER.KJ09 CL.A1 2.016% Due 4/25/2022 Mo-1 525,871.38 525,861.39 525,680.63 515,757.66 20161117 1.97 AA+ Aaa AAA3137BYM23 FHLMC ABS FLOAT SER.KF31 CL.A Flt % Due 4/25/2024 Mo-25 485,982.01 485,982.01 485,982.01 486,742.91 20170601 1.46 AA+ Aaa AAA3137FBT97 FHLMC ABS SER.K728 CL.A1 2.741% Due 10/25/2023 Mo-1 991,716.24 1,011,548.59 1,009,153.35 982,446.37 20171031 2.03 AA+ Aaa AAA3137FEV56 FHLMC ABS FLOAT SER.J19L CL.AFL Flt % Due 11/25/2027 Mo-25 489,054.50 489,054.50 489,054.50 489,264.45 20180315 2.09 AA+ Aaa AAA3138A8KG0 FNMA POOL #AH6594 3 1/2% Due 3/1/2026 Mo-1 376,692.26 397,410.35 391,706.59 381,385.12 20140130 2.07 AA+ Aaa AAA3138AMV85 FNMA POOL #AI7838 3 1/2% Due 7/1/2026 Mo-1 135,739.45 143,120.28 141,824.29 137,449.65 20151125 1.88 AA+ Aaa AAA
7 of 12For Plan Sponsor use only - Not for use with Plan Participants
Confidential - Do not disclose or disseminate

Long Term Holdings ReportJune 30, 2018
Pasadena Custom Stable Value Fund
Cusip Par Value Purchase Price Book Value Market Value * Purchase Date Book Yld S&P ** Moody's Fitch'sDescription3138E1K48 FNMA POOL #AJ8414 4% Due 2/1/2042 Mo-1 966,211.69 1,037,016.91 1,032,352.18 992,189.56 20120710 2.43 AA+ Aaa AAA3138EH7H9 FNMA POOL #AL1795 MEGA 3% Due 4/1/2027 Mo-1 756,248.82 800,796.59 787,316.87 756,175.71 20120713 1.71 AA+ Aaa AAA3138ELFM0 FNMA POOL #AL3771 3% Due 6/1/2028 Mo-1 974,462.38 973,548.82 973,539.43 974,370.00 20180608 2.99 AA+ Aaa AAA3138ENC56 FNMA POOL #AL5491 4% Due 6/1/2034 Mo-1 396,571.70 426,128.67 423,048.37 410,247.21 20140828 2.45 AA+ Aaa AAA3138ENZ93 FNMA POOL #AL6167 3 1/2% Due 1/1/2044 Mo-1 - - - - 20160321 0.00 AA+ Aaa AAA3138EQLN0 FNMA POOL #AL7532 3% Due 11/1/2027 Mo-1 1,020,320.00 1,024,066.48 1,024,011.01 1,020,221.67 20180529 2.84 AA+ Aaa AAA3138EQZ96 FNMA POOL #AL7967 3% Due 7/1/2030 Mo-1 864,189.40 900,512.35 896,199.71 861,979.71 20160127 2.09 AA+ Aaa AAA3138ERW63 FNMA POOL #AL9668 3% Due 10/1/2030 Mo-1 575,311.07 593,109.74 592,186.59 575,255.30 20170425 2.08 AA+ Aaa AAA3138ERYG9 FNMA POOL #AL9710 3% Due 4/1/2029 Mo-1 1,135,574.10 1,172,835.11 1,169,639.66 1,135,115.98 20170109 2.17 AA+ Aaa AAA3138MKPM2 FNMA POOL #AQ4027 3% Due 11/1/2032 Mo-1 568,003.79 577,766.36 577,481.02 564,833.82 20171212 2.60 AA+ Aaa AAA3138W9UF5 FNMA POOL #AS0581 3% Due 9/1/2023 Mo-1 322,255.72 335,145.93 329,863.38 323,597.43 20131011 1.85 AA+ Aaa AAA3138WFZT6 FNMA POOL #AS6153 3% Due 11/1/2030 Mo-1 840,601.43 876,064.29 871,662.33 838,452.48 20160127 2.17 AA+ Aaa AAA3138WGQV9 FNMA POOL #AS6767 3% Due 3/1/2031 Mo-1 530,884.16 555,437.54 552,677.59 527,892.38 20160222 2.07 AA+ Aaa AAA3138WHJJ2 FNMA POOL #AS7464 3% Due 6/1/2031 Mo-1 1,481,219.20 1,550,651.34 1,544,519.41 1,472,874.09 20160617 1.97 AA+ Aaa AAA3138WZSH6 FNMA POOL #AU0519 3% Due 8/1/2028 Mo-1 518,197.59 534,634.16 532,897.86 517,988.67 20161213 2.22 AA+ Aaa AAA3140GVV28 FNMA POOL #BH6932 3% Due 4/1/2032 Mo-1 203,266.41 209,777.28 209,550.66 203,184.77 20170818 2.15 AA+ Aaa AAA3140GXTA9 FNMA POOL #BH8644 3% Due 8/1/2032 Mo-1 472,216.61 486,807.35 486,253.46 469,555.45 20170822 2.30 AA+ Aaa AAA3140J6FU6 FNMA POOL #BM1978 3% Due 10/1/2032 Mo-1 934,531.68 954,682.51 954,045.15 929,946.20 20171212 2.58 AA+ Aaa AAA3140J74X0 FNMA POOL #BM3537 3% Due 1/1/2031 Mo-1 278,471.76 279,864.11 279,833.13 278,445.23 20180405 2.81 AA+ Aaa AAA3140J8DF7 FNMA POOL #BM3701 3% Due 7/1/2030 Mo-1 715,063.95 716,851.61 716,821.12 715,858.29 20180529 2.88 AA+ Aaa AAA3140J8MA8 FNMA POOL #BM3952 3% Due 2/1/2029 Mo-1 1,230,815.81 1,233,700.54 1,233,659.07 1,232,535.06 20180530 2.91 AA+ Aaa AAA3140Q7GX9 FNMA POOL #CA0213 3% Due 8/1/2032 Mo-1 457,584.51 472,170.01 471,578.44 455,005.81 20170822 2.34 AA+ Aaa AAA3140Q7KF3 FNMA POOL #CA0293 3% Due 9/1/2032 Mo-1 952,878.21 977,221.27 976,383.67 947,508.30 20171109 2.46 AA+ Aaa AAA31410LRH7 FNMA POOL #890688 3% Due 8/1/2028 Mo-1 160,280.58 166,641.73 165,610.41 160,265.09 20150724 2.04 AA+ Aaa AAA31416XH37 FNMA POOL #AB2049 3% Due 1/1/2026 Mo-1 372,265.97 384,131.94 383,030.11 372,228.30 20170523 1.86 AA+ Aaa AAA31417AVC0 FNMA POOL #AB4210 3% Due 1/1/2027 Mo-1 241,275.80 241,426.60 241,415.74 241,252.40 20180430 2.96 AA+ Aaa AAA31417BRG4 FNMA POOL #AB4986 3 1/2% Due 4/1/2032 Mo-1 796,897.30 841,722.78 833,275.51 808,537.43 20120627 2.43 AA+ Aaa AAA31417BRU3 FNMA POOL #AB4998 3% Due 4/1/2027 Mo-1 790,225.44 829,736.72 817,789.93 790,149.21 20120705 1.90 AA+ Aaa AAA31417DJE4 FNMA POOL #AB6560 3% Due 10/1/2032 Mo-1 584,767.86 594,818.56 594,514.00 581,504.42 20171212 2.63 AA+ Aaa AAA31417FK98 FNMA POOL #AB8419 3% Due 2/1/2033 Mo-1 1,079,233.98 1,128,136.77 1,124,349.31 1,073,222.34 20160418 1.98 AA+ Aaa AAA31418ABT4 FNMA POOL #MA0949 3 1/2% Due 1/1/2032 Mo-1 535,705.44 566,173.67 561,031.28 543,538.75 20120629 2.25 AA+ Aaa AAA31418ACH9 FNMA POOL #MA0971 4% Due 2/1/2042 Mo-1 688,473.88 738,926.12 735,896.45 707,017.33 20120710 2.28 AA+ Aaa AAA31418ACN6 FNMA POOL #MA0976 3 1/2% Due 2/1/2032 Mo-1 643,467.66 681,472.47 674,549.94 652,899.26 20120703 2.31 AA+ Aaa AAA31418ADQ8 FNMA POOL #MA1010 3 1/2% Due 3/1/2032 Mo-1 410,563.43 434,812.33 430,407.62 416,581.15 20120705 2.32 AA+ Aaa AAA31418AE95 FNMA POOL #MA1059 3 1/2% Due 5/1/2032 Mo-1 834,710.98 884,011.11 875,186.90 846,960.85 20120705 2.33 AA+ Aaa AAA31418AF29 FNMA POOL #MA1084 3 1/2% Due 6/1/2032 Mo-1 739,916.34 781,652.26 774,907.45 750,768.95 20120627 2.26 AA+ Aaa AAA31418AF52 FNMA POOL #MA1087 4% Due 6/1/2042 Mo-1 827,963.19 890,319.13 886,373.14 850,266.17 20120712 2.40 AA+ Aaa AAA31418AFW3 FNMA POOL #MA1080 3% Due 6/1/2022 Mo-1 493,901.40 521,220.32 507,238.93 496,083.41 20120705 1.31 AA+ Aaa AAA31418AGW2 FNMA POOL #MA1112 4% Due 7/1/2042 Mo-1 183,912.04 196,872.06 196,148.63 188,832.23 20120628 2.27 AA+ Aaa AAA31418AHQ4 FNMA POOL #MA1138 3 1/2% Due 8/1/2032 Mo-1 998,031.40 1,062,123.76 1,052,345.73 1,012,637.39 20120706 2.04 AA+ Aaa AAA31418AHX9 FNMA POOL #MA1145 3% Due 8/1/2027 Mo-1 774,111.86 817,050.87 804,579.69 774,037.64 20120727 1.80 AA+ Aaa AAA31418ALT3 FNMA POOL #MA1237 3% Due 11/1/2032 Mo-1 946,763.66 959,485.80 959,164.04 941,482.59 20180111 2.68 AA+ Aaa AAA31418AWM6 FNMA POOL #MA1551 3% Due 8/1/2023 Mo-1 67,836.48 70,465.12 69,458.85 68,138.71 20130719 1.72 AA+ Aaa AAA31418CWC4 FNMA POOL #MA3342 3% Due 4/1/2028 Mo-1 724,994.48 726,580.42 726,517.21 725,599.92 20180320 2.91 AA+ Aaa AAA31418CYD0 FNMA POOL #MA3407 3% Due 6/1/2028 Mo-1 1,400,000.00 1,397,812.50 1,397,812.50 1,401,167.28 20180619 3.01 AA+ Aaa AAA31419AMS3 FNMA POOL #AE0368 3 1/2% Due 12/1/2025 Mo-1 351,988.60 371,567.97 367,794.42 356,373.70 20150908 1.71 AA+ Aaa AAA31419HC42 FNMA POOL #AE6390 4% Due 2/1/2041 Mo-1 1,103,213.58 1,194,745.86 1,187,615.11 1,132,967.67 20120712 2.40 AA+ Aaa AAA36192LAA3 GS MTG SECURITIES TR 2012-SHOP ABS SER.2012-SHOP CL.A 2.933% Due 6/5/2031 Mo-1 750,000.00 770,361.33 754,755.93 750,831.53 20150615 2.22 NR Aaa NR369550BA5 GENERAL DYNAMICS CORP SENIOR UNSECURED GLOBAL NOTES2 7/8% Due 5/11/2020 MN11 250,000.00 249,115.00 249,168.14 250,185.72 20180508 3.06 A+ A2 NR37331NAF8 GEORGIA PACIFIC LLC SENIOR UNSECURED NOTES 2.539% Due 11/15/2019 MN15 500,000.00 497,230.00 497,322.28 496,782.60 20180608 2.94 A+ A3 NR427866AY4 HERSHEY CO SENIOR UNSECURED GLOBAL NOTES2.9% Due 5/15/2020 MN15 200,000.00 199,868.00 199,872.58 199,743.42 20180503 2.93 A A1 NR42806DAD1 HERTZ VEHICLE FINANCING LLC ABS SER.2015-2A CL.A 2.02% Due 9/25/2019 Mo-25 500,000.00 499,893.50 499,991.17 499,179.95 20150930 2.04 NR Aaa AAA438516BM7 HONEYWELL INTERNATIONAL INC SENIOR UNSECURED GLOBAL NOTES1.85% Due 11/1/2021 MN1 500,000.00 499,975.00 499,978.46 479,463.85 20161024 1.85 A A2 A48125LRK0 JP MORGAN CHASE BANK NA SENIOR UNSECURED NOTES 2.604% Due 2/1/2021 FA1 750,000.00 750,000.00 750,000.00 743,438.98 20180129 2.60 A+ Aa3 AA57629WBW9 MASSMUTUAL GLOBAL FUNDING SECURED NOTES 2.45% Due 11/23/2020 MN23 500,000.00 499,440.00 499,716.77 491,827.42 20151118 2.47 AA+ Aa2 AA+594918BP8 MICROSOFT CORP SENIOR UNSECURED GLOBAL NOTES1.55% Due 8/8/2021 FA8 1,000,000.00 998,950.00 999,333.14 959,490.31 20160801 1.57 AAA Aaa AA+59981HAA9 MILL CITY MTGE TRUST 2017-1 ABS SER.2017-1 CL.A1 2 3/4% Due 11/25/2058 Mo-1 750,351.80 739,799.98 739,856.16 738,963.71 20180524 2.94 NR Aaa AAA60920LAA2 MONDELEZ INTL HLDINGS NE SENIOR UNSECURED NOTES 1 5/8% Due 10/28/2019 AO28 500,000.00 496,095.00 497,582.21 491,349.11 20170824 2.00 BBB A3 BBB61746BED4 MORGAN STANLEY SENIOR UNSECURED NOTES 2 5/8% Due 11/17/2021 MN17 500,000.00 497,445.00 498,226.76 485,359.26 20161114 2.74 BBB+ A3 A61763QAA9 MORG STAN CAPL I TR 2014-CPT ABS SER.2014-CPT CL.A. 3.35% Due 7/13/2029 Mo-1 750,000.00 771,093.75 760,663.36 752,513.18 20150626 2.84 AAA NR NR62888UAB6 NCUA GTD NOTES TRUST 2010-R2 CMO FLOAT SER.2010-R2 CL.2A Flt % Due 11/5/2020 Sched 342,928.00 345,178.47 348,574.38 344,459.79 20140122 0.66 AA+ Aaa AAA
8 of 12For Plan Sponsor use only - Not for use with Plan Participants
Confidential - Do not disclose or disseminate
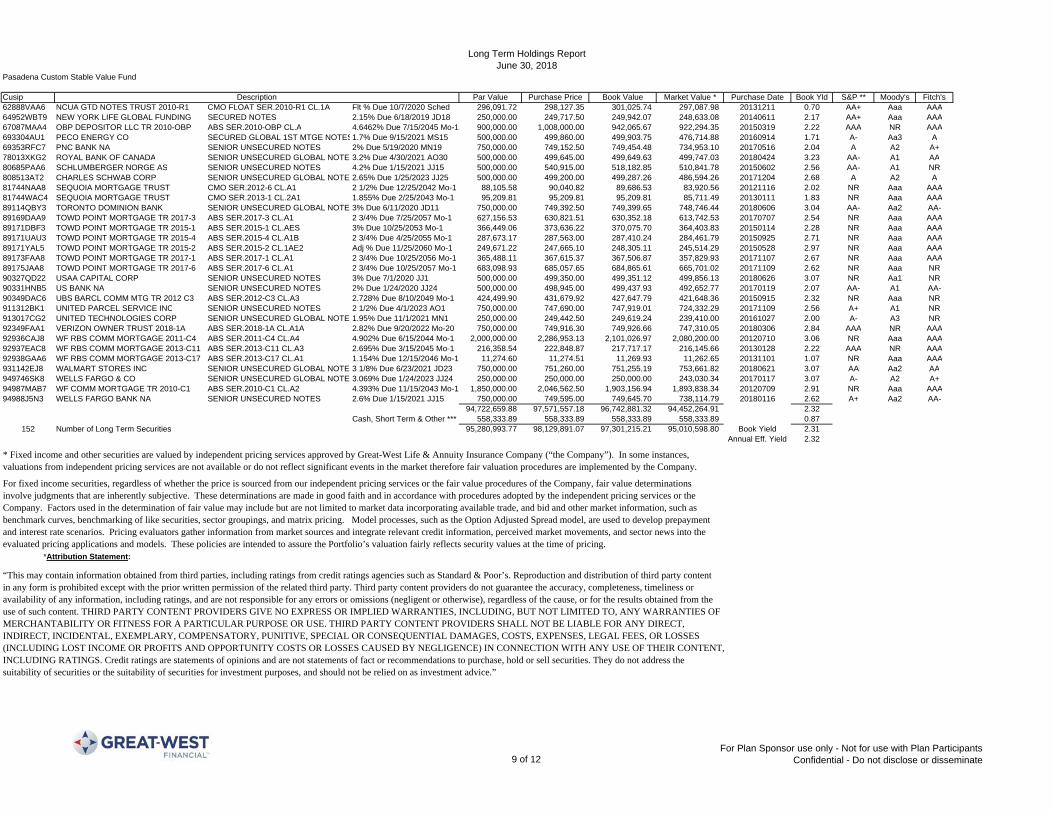
Long Term Holdings ReportJune 30, 2018
Pasadena Custom Stable Value Fund
Cusip Par Value Purchase Price Book Value Market Value * Purchase Date Book Yld S&P ** Moody's Fitch'sDescription62888VAA6 NCUA GTD NOTES TRUST 2010-R1 CMO FLOAT SER.2010-R1 CL.1A Flt % Due 10/7/2020 Sched 296,091.72 298,127.35 301,025.74 297,087.98 20131211 0.70 AA+ Aaa AAA64952WBT9 NEW YORK LIFE GLOBAL FUNDING SECURED NOTES 2.15% Due 6/18/2019 JD18 250,000.00 249,717.50 249,942.07 248,633.08 20140611 2.17 AA+ Aaa AAA67087MAA4 OBP DEPOSITOR LLC TR 2010-OBP ABS SER.2010-OBP CL.A 4.6462% Due 7/15/2045 Mo-1 900,000.00 1,008,000.00 942,065.67 922,294.35 20150319 2.22 AAA NR AAA693304AU1 PECO ENERGY CO SECURED GLOBAL 1ST MTGE NOTES1.7% Due 9/15/2021 MS15 500,000.00 499,860.00 499,903.75 476,714.88 20160914 1.71 A- Aa3 A69353RFC7 PNC BANK NA SENIOR UNSECURED NOTES 2% Due 5/19/2020 MN19 750,000.00 749,152.50 749,454.48 734,953.10 20170516 2.04 A A2 A+78013XKG2 ROYAL BANK OF CANADA SENIOR UNSECURED GLOBAL NOTES3.2% Due 4/30/2021 AO30 500,000.00 499,645.00 499,649.63 499,747.03 20180424 3.23 AA- A1 AA80685PAA6 SCHLUMBERGER NORGE AS SENIOR UNSECURED NOTES 4.2% Due 1/15/2021 JJ15 500,000.00 540,915.00 518,182.85 510,841.78 20150602 2.56 AA- A1 NR808513AT2 CHARLES SCHWAB CORP SENIOR UNSECURED GLOBAL NOTES2.65% Due 1/25/2023 JJ25 500,000.00 499,200.00 499,287.26 486,594.26 20171204 2.68 A A2 A81744NAA8 SEQUOIA MORTGAGE TRUST CMO SER.2012-6 CL.A1 2 1/2% Due 12/25/2042 Mo-1 88,105.58 90,040.82 89,686.53 83,920.56 20121116 2.02 NR Aaa AAA81744WAC4 SEQUOIA MORTGAGE TRUST CMO SER.2013-1 CL.2A1 1.855% Due 2/25/2043 Mo-1 95,209.81 95,209.81 95,209.81 85,711.49 20130111 1.83 NR Aaa AAA89114QBY3 TORONTO DOMINION BANK SENIOR UNSECURED GLOBAL NOTES3% Due 6/11/2020 JD11 750,000.00 749,392.50 749,399.65 748,746.44 20180606 3.04 AA- Aa2 AA-89169DAA9 TOWD POINT MORTGAGE TR 2017-3 ABS SER.2017-3 CL.A1 2 3/4% Due 7/25/2057 Mo-1 627,156.53 630,821.51 630,352.18 613,742.53 20170707 2.54 NR Aaa AAA89171DBF3 TOWD POINT MORTGAGE TR 2015-1 ABS SER.2015-1 CL.AES 3% Due 10/25/2053 Mo-1 366,449.06 373,636.22 370,075.70 364,403.83 20150114 2.28 NR Aaa AAA89171UAU3 TOWD POINT MORTGAGE TR 2015-4 ABS SER.2015-4 CL.A1B 2 3/4% Due 4/25/2055 Mo-1 287,673.17 287,563.00 287,410.24 284,461.79 20150925 2.71 NR Aaa AAA89171YAL5 TOWD POINT MORTGAGE TR 2015-2 ABS SER.2015-2 CL.1AE2 Adj % Due 11/25/2060 Mo-1 249,671.22 247,665.10 248,305.11 245,514.29 20150528 2.97 NR Aaa AAA89173FAA8 TOWD POINT MORTGAGE TR 2017-1 ABS SER.2017-1 CL.A1 2 3/4% Due 10/25/2056 Mo-1 365,488.11 367,615.37 367,506.87 357,829.93 20171107 2.67 NR Aaa AAA89175JAA8 TOWD POINT MORTGAGE TR 2017-6 ABS SER.2017-6 CL.A1 2 3/4% Due 10/25/2057 Mo-1 683,098.93 685,057.65 684,865.61 665,701.02 20171109 2.62 NR Aaa NR90327QD22 USAA CAPITAL CORP SENIOR UNSECURED NOTES 3% Due 7/1/2020 JJ1 500,000.00 499,350.00 499,351.12 499,856.13 20180626 3.07 NR Aa1 NR90331HNB5 US BANK NA SENIOR UNSECURED NOTES 2% Due 1/24/2020 JJ24 500,000.00 498,945.00 499,437.93 492,652.77 20170119 2.07 AA- A1 AA-90349DAC6 UBS BARCL COMM MTG TR 2012 C3 ABS SER.2012-C3 CL.A3 2.728% Due 8/10/2049 Mo-1 424,499.90 431,679.92 427,647.79 421,648.36 20150915 2.32 NR Aaa NR911312BK1 UNITED PARCEL SERVICE INC SENIOR UNSECURED NOTES 2 1/2% Due 4/1/2023 AO1 750,000.00 747,690.00 747,919.01 724,332.29 20171109 2.56 A+ A1 NR913017CG2 UNITED TECHNOLOGIES CORP SENIOR UNSECURED GLOBAL NOTES1.95% Due 11/1/2021 MN1 250,000.00 249,442.50 249,619.24 239,410.00 20161027 2.00 A- A3 NR92349FAA1 VERIZON OWNER TRUST 2018-1A ABS SER.2018-1A CL.A1A 2.82% Due 9/20/2022 Mo-20 750,000.00 749,916.30 749,926.66 747,310.05 20180306 2.84 AAA NR AAA92936CAJ8 WF RBS COMM MORTGAGE 2011-C4 ABS SER.2011-C4 CL.A4 4.902% Due 6/15/2044 Mo-1 2,000,000.00 2,286,953.13 2,101,026.97 2,080,200.00 20120710 3.06 NR Aaa AAA92937EAC8 WF RBS COMM MORTGAGE 2013-C11 ABS SER.2013-C11 CL.A3 2.695% Due 3/15/2045 Mo-1 216,358.54 222,848.87 217,717.17 216,145.66 20130128 2.22 AAA NR AAA92938GAA6 WF RBS COMM MORTGAGE 2013-C17 ABS SER.2013-C17 CL.A1 1.154% Due 12/15/2046 Mo-1 11,274.60 11,274.51 11,269.93 11,262.65 20131101 1.07 NR Aaa AAA931142EJ8 WALMART STORES INC SENIOR UNSECURED GLOBAL NOTES3 1/8% Due 6/23/2021 JD23 750,000.00 751,260.00 751,255.19 753,661.82 20180621 3.07 AA Aa2 AA949746SK8 WELLS FARGO & CO SENIOR UNSECURED GLOBAL NOTES3.069% Due 1/24/2023 JJ24 250,000.00 250,000.00 250,000.00 243,030.34 20170117 3.07 A- A2 A+94987MAB7 WF COMM MORTGAGE TR 2010-C1 ABS SER.2010-C1 CL.A2 4.393% Due 11/15/2043 Mo-1 1,850,000.00 2,046,562.50 1,903,156.94 1,893,838.34 20120709 2.91 NR Aaa AAA94988J5N3 WELLS FARGO BANK NA SENIOR UNSECURED NOTES 2.6% Due 1/15/2021 JJ15 750,000.00 749,595.00 749,645.70 738,114.79 20180116 2.62 A+ Aa2 AA-
94,722,659.88 97,571,557.18 96,742,881.32 94,452,264.91 2.32Cash, Short Term & Other *** 558,333.89 558,333.89 558,333.89 558,333.89 0.87
152 Number of Long Term Securities 95,280,993.77 98,129,891.07 97,301,215.21 95,010,598.80 Book Yield 2.31 0.023081Annual Eff. Yield 2.32
*Attribution Statement:
For fixed income securities, regardless of whether the price is sourced from our independent pricing services or the fair value procedures of the Company, fair value determinations involve judgments that are inherently subjective. These determinations are made in good faith and in accordance with procedures adopted by the independent pricing services or the Company. Factors used in the determination of fair value may include but are not limited to market data incorporating available trade, and bid and other market information, such as benchmark curves, benchmarking of like securities, sector groupings, and matrix pricing. Model processes, such as the Option Adjusted Spread model, are used to develop prepayment and interest rate scenarios. Pricing evaluators gather information from market sources and integrate relevant credit information, perceived market movements, and sector news into the evaluated pricing applications and models. These policies are intended to assure the Portfolio’s valuation fairly reflects security values at the time of pricing.
* Fixed income and other securities are valued by independent pricing services approved by Great-West Life & Annuity Insurance Company (“the Company”). In some instances, valuations from independent pricing services are not available or do not reflect significant events in the market therefore fair valuation procedures are implemented by the Company.
“This may contain information obtained from third parties, including ratings from credit ratings agencies such as Standard & Poor’s. Reproduction and distribution of third party content in any form is prohibited except with the prior written permission of the related third party. Third party content providers do not guarantee the accuracy, completeness, timeliness or availability of any information, including ratings, and are not responsible for any errors or omissions (negligent or otherwise), regardless of the cause, or for the results obtained from the use of such content. THIRD PARTY CONTENT PROVIDERS GIVE NO EXPRESS OR IMPLIED WARRANTIES, INCLUDING, BUT NOT LIMITED TO, ANY WARRANTIES OF MERCHANTABILITY OR FITNESS FOR A PARTICULAR PURPOSE OR USE. THIRD PARTY CONTENT PROVIDERS SHALL NOT BE LIABLE FOR ANY DIRECT, INDIRECT, INCIDENTAL, EXEMPLARY, COMPENSATORY, PUNITIVE, SPECIAL OR CONSEQUENTIAL DAMAGES, COSTS, EXPENSES, LEGAL FEES, OR LOSSES (INCLUDING LOST INCOME OR PROFITS AND OPPORTUNITY COSTS OR LOSSES CAUSED BY NEGLIGENCE) IN CONNECTION WITH ANY USE OF THEIR CONTENT, INCLUDING RATINGS. Credit ratings are statements of opinions and are not statements of fact or recommendations to purchase, hold or sell securities. They do not address the suitability of securities or the suitability of securities for investment purposes, and should not be relied on as investment advice.”
9 of 12For Plan Sponsor use only - Not for use with Plan Participants
Confidential - Do not disclose or disseminate

Long Term Holdings ReportJune 30, 2018
Pasadena Custom Stable Value Fund
Cusip Par Value Purchase Price Book Value Market Value * Purchase Date Book Yld S&P ** Moody's Fitch'sDescription
*** Cash, Short Term & Other includes cash, short-term investments, interest receivable, cash and/or securities received as collateral, receivable for cash posted as collateral, receivable for investments sold, collateral payable to counterparties, contract transactions receivable, payable for investments purchased, contract transactions payable and miscellaneous other receivable/payables, as applicable.
10 of 12For Plan Sponsor use only - Not for use with Plan Participants
Confidential - Do not disclose or disseminate

Glossary

Agency Securities:
Amortization of Realized Gains/Losses:Amortization of the Difference Between Assets and Liabilities:Asset Backed Securities (ABS):
Average Life:
Average Maturity:
Book Value Assets:
Book Value Liabilities:Collateralized Mortgage Obligations (CMO):Commercial Mortgage Backed Securities (CMBS):Corporates:Credit QualityCrediting RateDuration:FGLMC:FHLMC:FNMA:GNMA:GSE:Investment Grade:Investment GuidelinesMarket Value Assets:Mortgage Backed Securities (MBS):
Nationally Recognized Statistical Ratings Organization (NRSRO)
Par Value:Purchase Price:Treasury Notes:Vendee:
Yield To Maturity
Maturity value of the security.Original purchase price of the security less any reductions from principal payments.Intermediate securities issued by the United States Government with maturities of 1 to 10 years.Veterans Administration Mortgage.The rate of return anticipated on a security if it is held until the maturity date. The calculation takes into account the current market price, par value, coupon interest rate and the time to maturity and assumes that all coupons are reinvested at the same rate.
An asset backed security whose cash flows are backed by the principal and interest payments of a set of mortgage loans.A firm that evaluates the financial quality of an institution's debt, the claims paying ability of life insurance companies, and/or the deposit credit rating of banks. Examples of NRSROs include Standard & Poor's (S&P), Moody's Investors Service, and Fitch Ratings. For a list of all NRSROs, please visit www.sec.gov/divisions/marketreg/ratingagency.htm.
Government National Mortgage Association. Nicknamed Ginnie Mae.Government Sponsored EntityA security judged likely enough to meet payment obligations that banks are allowed to invest in it.Guidelines established between a plan sponsor or trustee and an investment manager that dictate the investment parameters and risk The cash value of a security could be sold for at a given price on the open market. Prices are determined by independent pricing services.
The measure of the financial soundness of an institution, indicating its ability to honor its financial obligations in a timely manner.The interest rate applied to the book value of the stable value fund liabilities, expressed as an effective annual yield.A theoretical measurement developed by Professor Frederic Macauley that measures the sensitivity of a financial instrument to changes in Federal Home Loan Mortgage Corporation - Gold pool. Nicknamed Freddie Mac.Federal Home Loan Mortgage Corporation. Nicknamed Freddie Mac.Federal National Mortgage Association. Nicknamed Fannie Mae.
The number of years until a bond pays back its principal.The amount owed by the issuer of the security to the security holder on behalf of the plan participants, subject to certain terms and conditions.The value of deposited principal, plus accrued interest, minus withdrawals and expenses
Mortgage backed bonds that separates mortgage pools into different maturity classes.
An asset backed security whose cash flows are backed by the principal and interest payments of commercial or multifamily property mortgage loans.A debt instrument issued by a private Corporation whose cash flows are backed by the issuing organization.
GlossaryDebt instruments issued by an agency of the Federal government. Though not general obligations of the U.S. Treasury such securities are sponsored by the government and therefore have high safety ratings.If applicable, The process of recognizing realized gains or losses that occurred due to the sale of assets or prepayment of securities that were faster or slower than expected via the crediting rate. Amortization period is typically the average duration of the portfolio.If applicable, the process of recognizing differences between what the fund has earned and the interest that was credited from inception to the statement date via the crediting rate. Amortization period is the average duration of the portfolio.A debt security whose cash flows are backed by a pool of receivables or other financial assets.
The average expected maturity date of the securities based on current pre-payment speeds and determined by an outside organization.
12For Plan Sponsor use only - Not for use with Plan Participants
Confidential - Do not disclose or disseminate