markets report - pjm
TRANSCRIPT

PJM©2019
Markets Report
www.pjm.com
Jennifer Warner-Freeman
Senior Economist, Operation Analysis & Compliance
MC Webinar
June 24, 2019

PJM©2019 2
Executive Summary
• PJM Wholesale Cost through May 2019 is $48.56/MWh, down from full-year 2018 costs of
$59.96/MWh. (Slides 5 & 6)
• Slides pertaining to weather conditions, in addition to slides showing average fuel prices,
generation on-line fuel mixes, and System Marginal Prices have been combined into a Market
Conditions section. (Slides 7- 16)
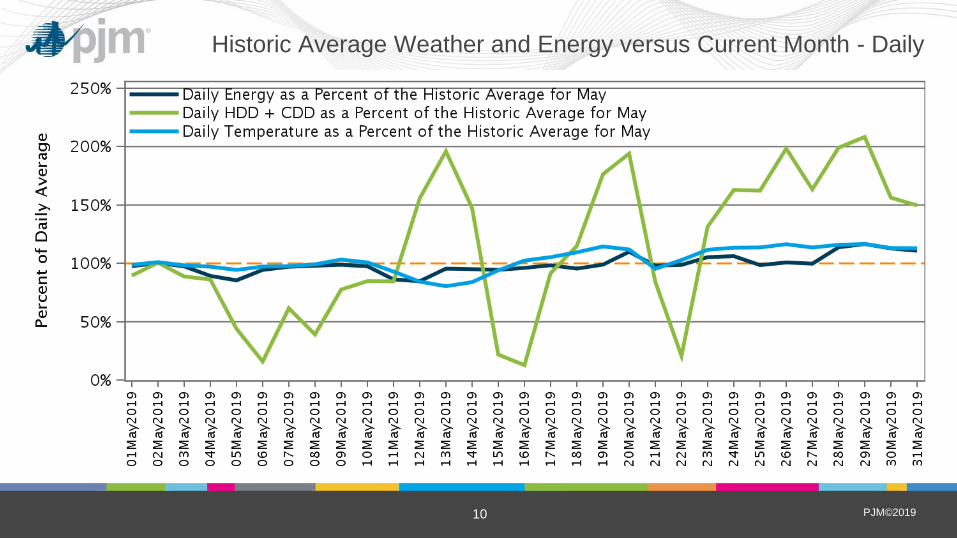
• In May, temperatures were at or below average at the start of the month, but above average for
the second half of the month. Thus, the sum of Heating and Cooling Degree Days was only
slightly above its historic average. (Slides 8-10)
• Because temperatures were slightly above average, but still very mild, Energy use was slightly
below its historic average. (Slides 8-10)
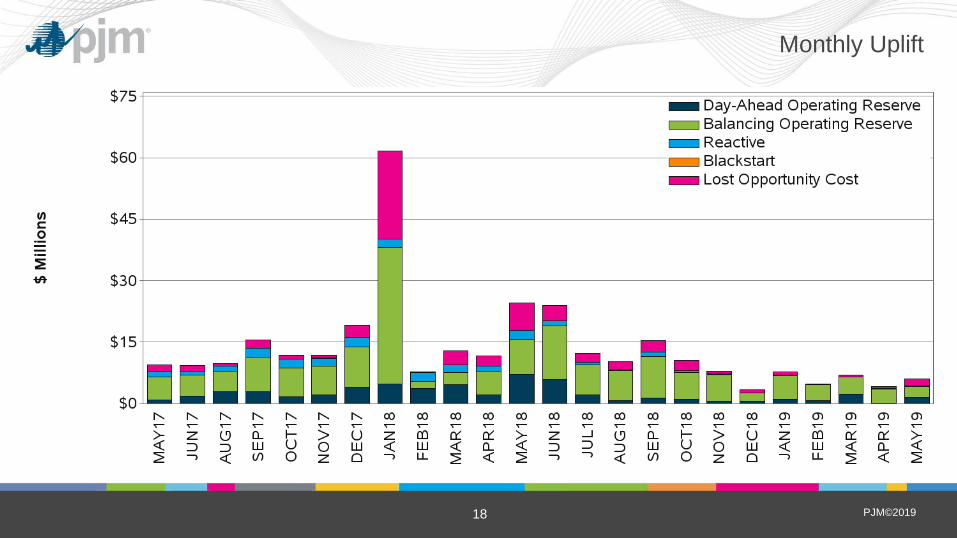
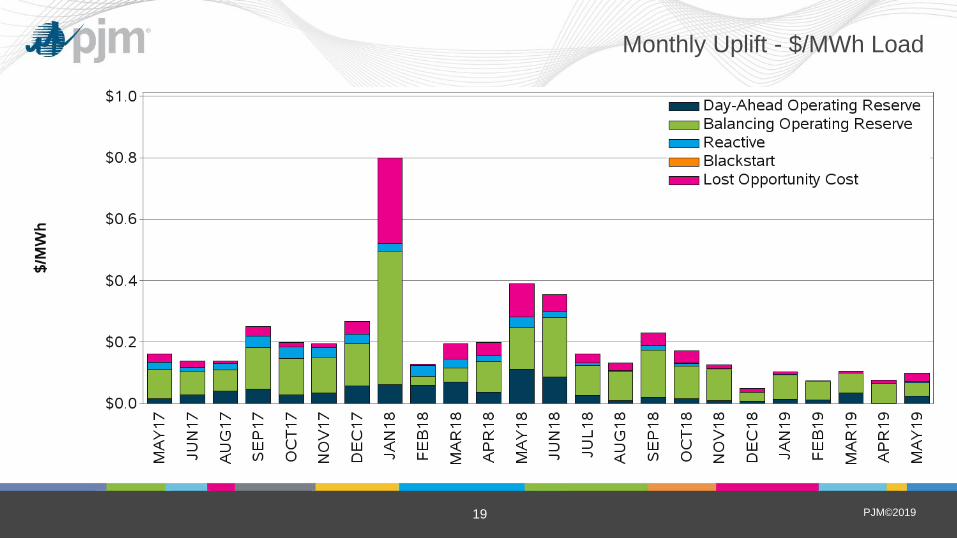
• In May uplift exceeded $800,000 on one day – May 23rd. (Slides 21 & 22)

PJM©2019 3
Executive Summary
• Load-weighted average LMP through May 2019 is $30.16/MWh: (Slides 28-29) – May 2019 was $24.20/MWh, which is considerably lower than both May 2018 ($38.30/MWh) and May 2017
($31.50/MWh).
– Since January 2011, only two months have a lower LMP: March 2016 and May 2016.
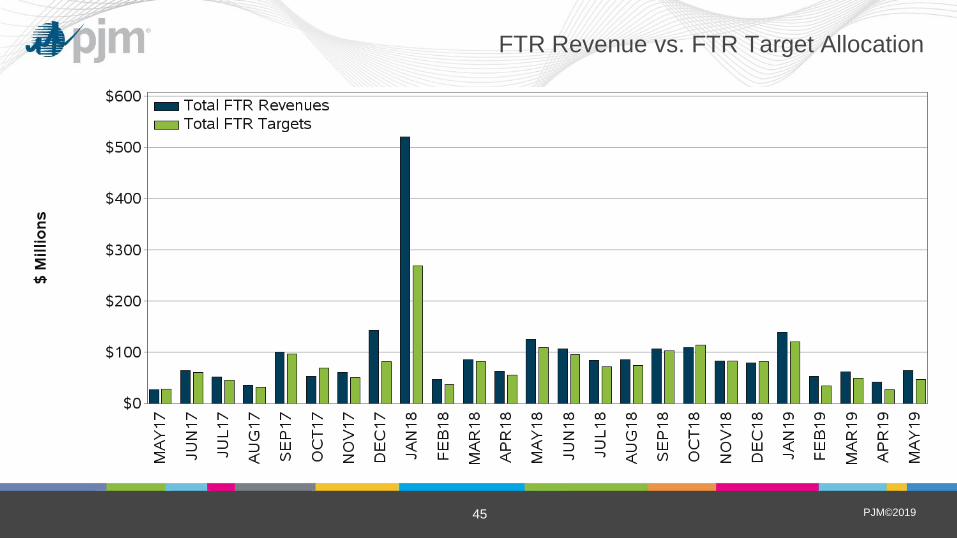
• In June 2017, the calculation of FTR surplus was changed to no longer include Balancing
congestion and Market to Market payments. (Slide 45)
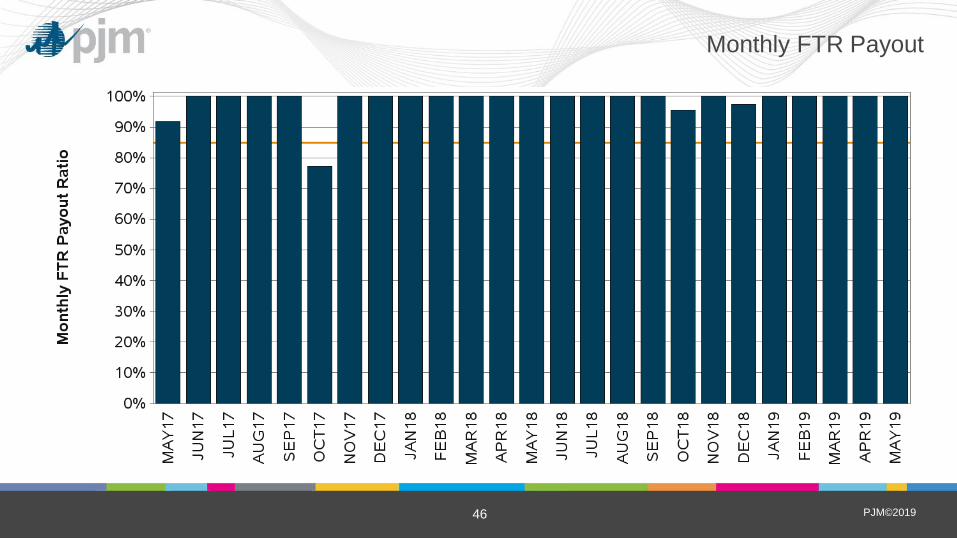
• FTR revenue adequacy for the month of May is 100% and the 2018-2019 Planning Year is
currently fully funded. (Slides 44-47)
• Congestion remained at relatively low levels in May. (Slide 45)
• Regulation and Synchronized Reserve market costs have generally tracked with energy prices
over time. (Slides 60-62)


PJM©2019 8
• • The weather parameter shown in the following slide is a monthly sum of daily Heating
Degree Days (HDD) and Cooling Degree Days (CDD). •
• Degree days represent a deviation from a baseline temperature, in this case 60 degrees
for HDD and 65 degrees for CDD. As temperatures get more extreme, colder or hotter,
either HDDs or CDDs, respectively, will increase. •
• Typically, winter months will only record HDDs, while summer months will only record
CDDs. Shoulder months may have both HDDs and CDDs. •
• Degree Days are calculated using a daily load weighting that weights values from stations
in each TO zone according to the zonal contribution to the RTO peak on that day. •
• Average values use data from 1998 to the most recent complete year, in this case, 2018.
Averages include load data for all of TO zones in the current RTO footprint.

PJM©2019 9
Historic Average Weather and Energy versus Current Month
PJM©2019 10
Historic Average Weather and Energy versus Current Month - Daily

PJM©2019 11
Average Fuel Prices - Daily
Fuel Price Source: S&P Global Platts
PJM©2019 12
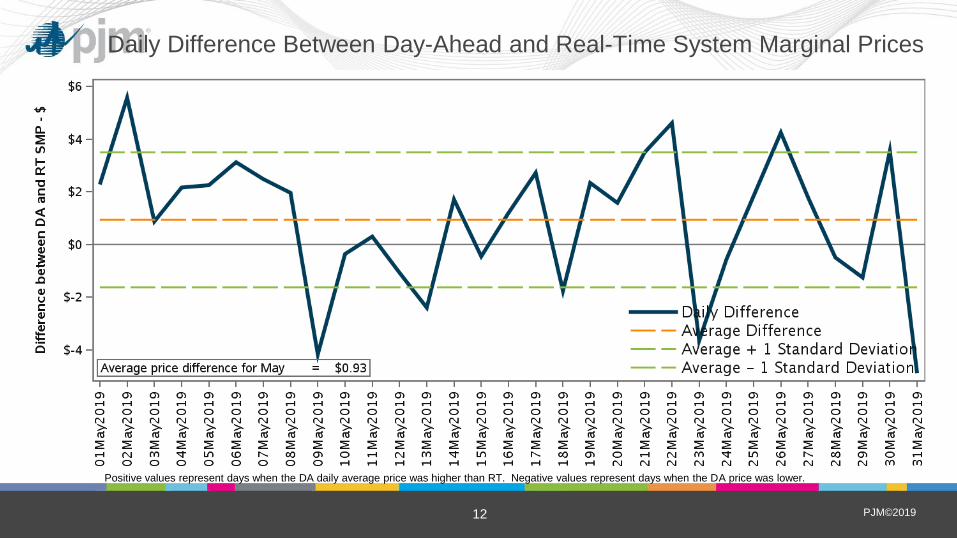
Daily Difference Between Day-Ahead and Real-Time System Marginal Prices
Positive values represent days when the DA daily average price was higher than RT. Negative values represent days when the DA price was lower.
PJM©2019 13
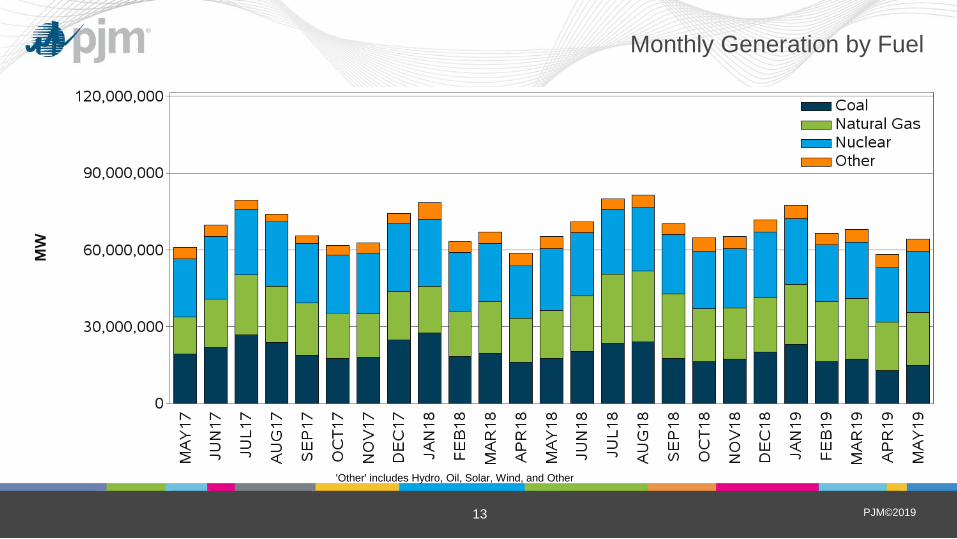
Monthly Generation by Fuel
'Other' includes Hydro, Oil, Solar, Wind, and Other
PJM©2019 14
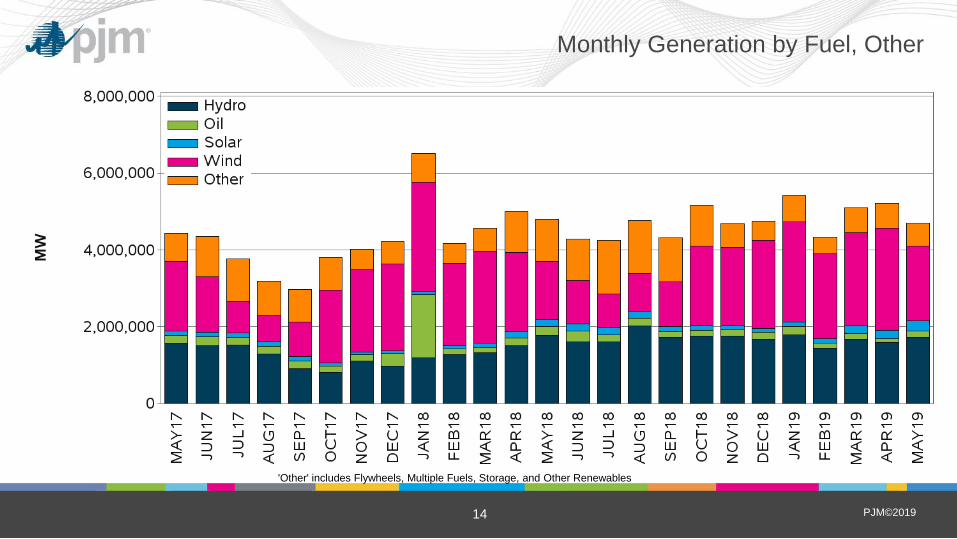
Monthly Generation by Fuel, Other
'Other' includes Flywheels, Multiple Fuels, Storage, and Other Renewables
PJM©2019 15
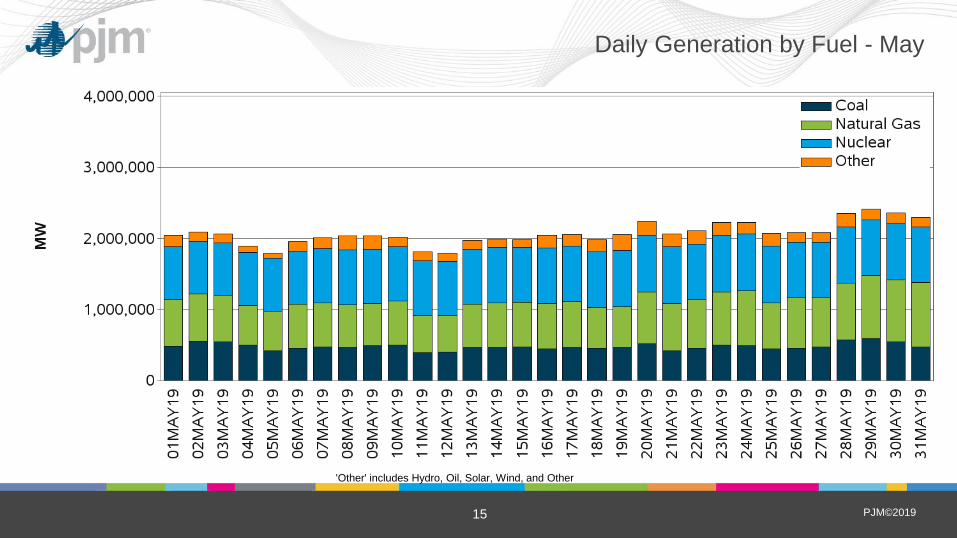
Daily Generation by Fuel - May
'Other' includes Hydro, Oil, Solar, Wind, and Other

PJM©2019 16
Daily Generation by Fuel, Other - May
'Other' includes Flywheels, Multiple Fuels, Storage, and Other Renewables

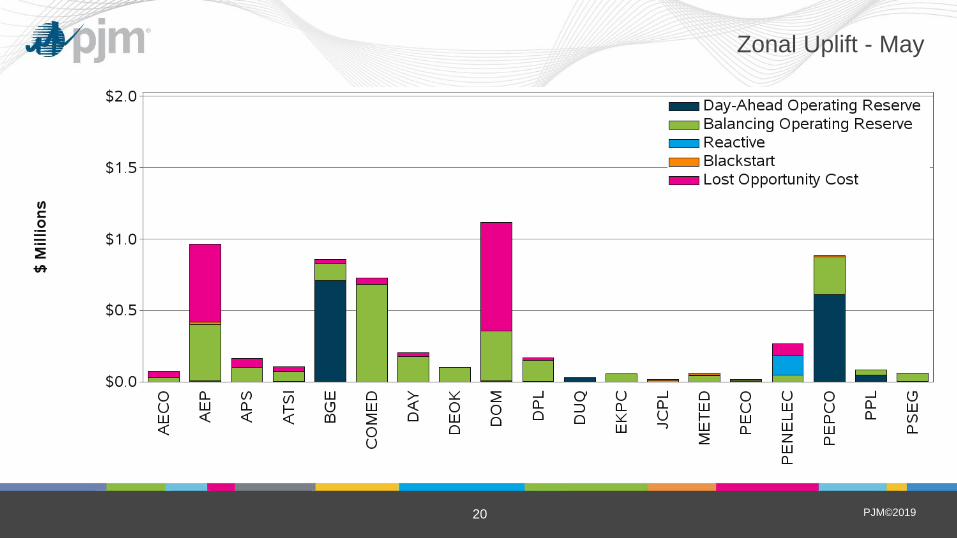


PJM©2019 22
Daily Uplift
• In May uplift exceeded $800,000 on one day; May 23rd.
• Contributing factors to uplift were:
– LMP volatility
www.pjm.com
More information on Uplift can be found on PJM’s
website at Drivers of Uplift
PJM©2019 23
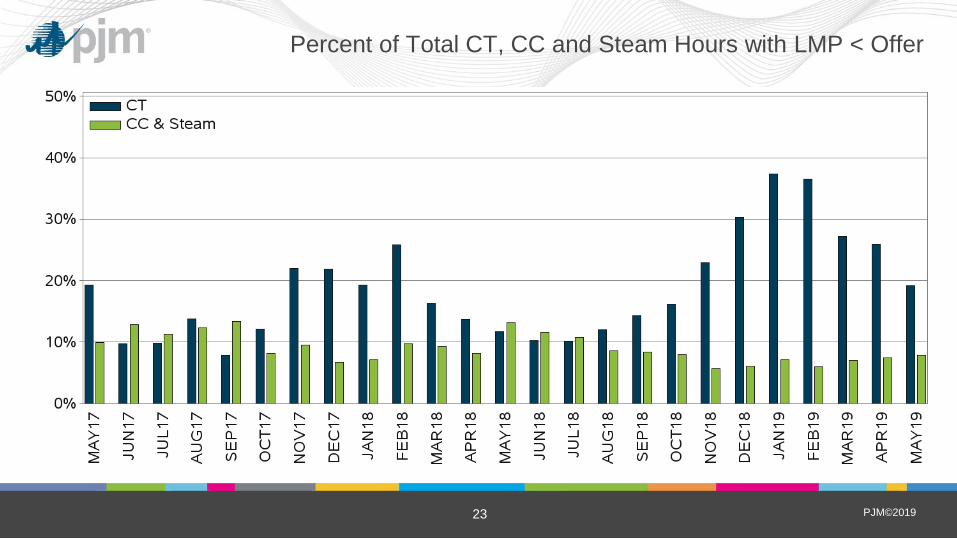
Percent of Total CT, CC and Steam Hours with LMP < Offer

PJM©2019 24
•
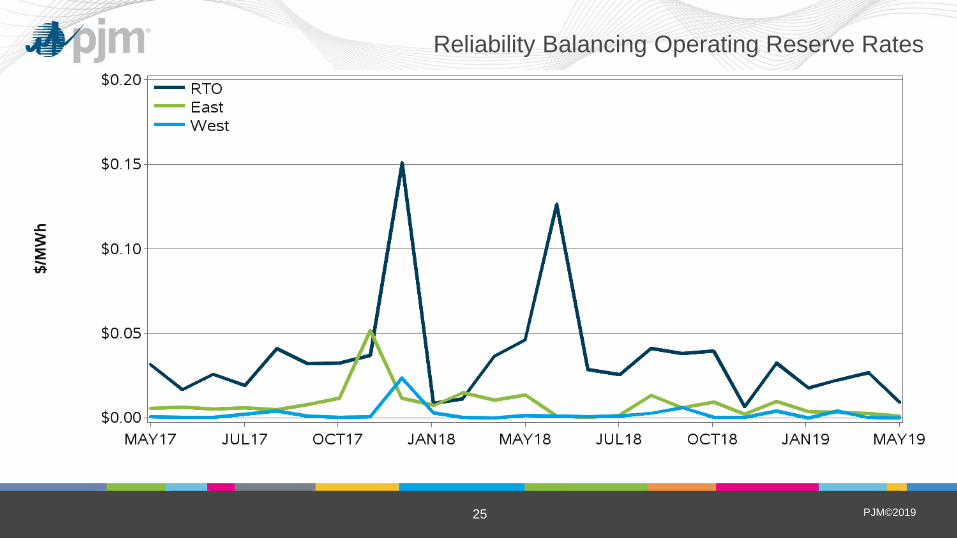
• • Beginning in December 2008, the daily Balancing Operating Reserves (BOR) rate
was replaced with six different BOR rates: RTO BOR for Reliability Rate, RTO BOR
for Deviations Rate, East BOR for Reliability Rate, East BOR for Deviations Rate,
West BOR for Reliability Rate, West BOR for Deviations Rate.
•
• Reliability rates are charged to all real-time load and exports, whereas deviation
rates, as before, are charged only to real-time deviations. RTO rates are charged to
the whole footprint, whereas East and West rate adders are charged based on
location.
PJM©2019 25
Reliability Balancing Operating Reserve Rates

PJM©2019 26
Deviations Balancing Operating Reserve Rates


PJM©2019 29
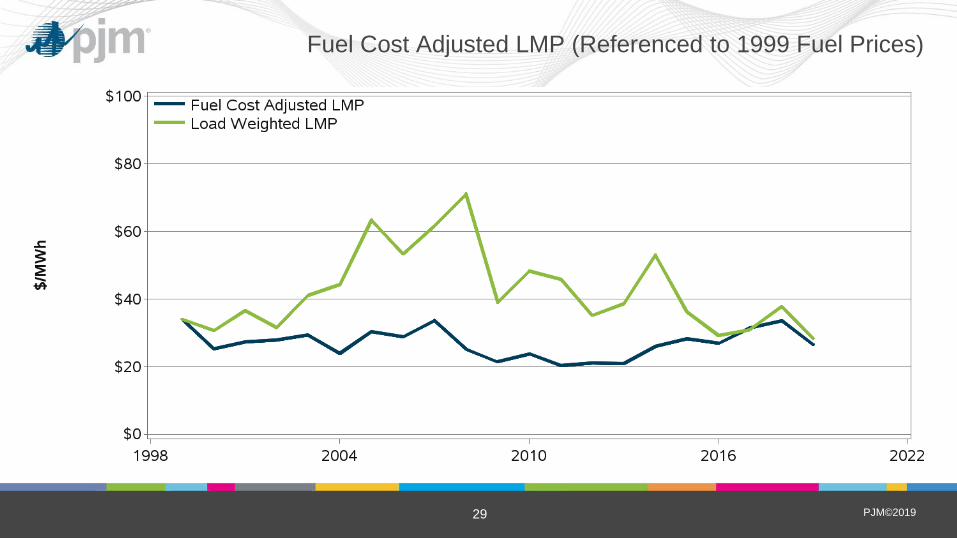
Fuel Cost Adjusted LMP (Referenced to 1999 Fuel Prices)

PJM©2019 30
LMP Price Posting Suspensions and Reruns
PJM©2019 31
Energy Market
Demand Response Summary
PJM©2019 32
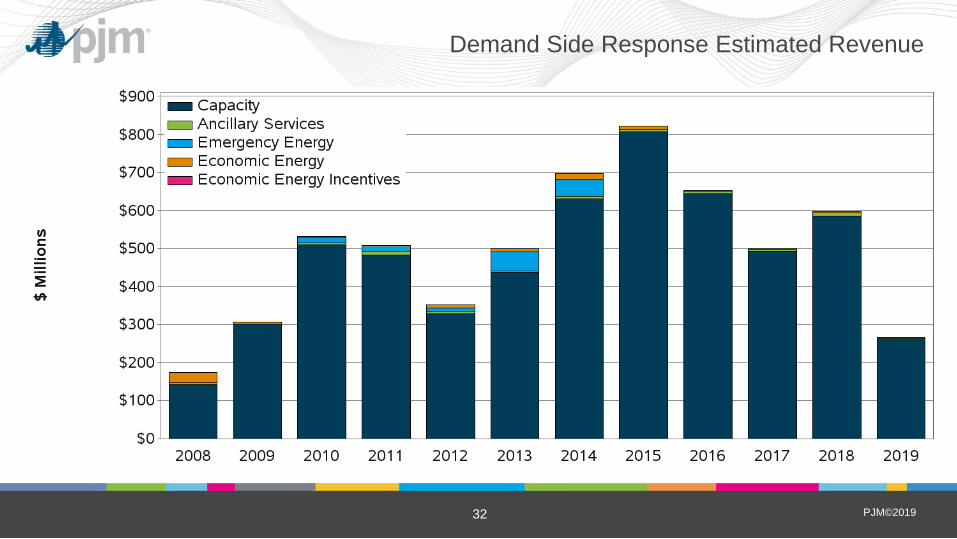
Demand Side Response Estimated Revenue

PJM©2019 33
Economic Demand Response Activity
*Data for the last few months are subject to significant change due to the settlement window.

PJM©2019 34
Total Registered MW in PJM's Economic Demand Response

PJM©2019 35
Energy Market
Virtual Activity Summary

PJM©2019 36
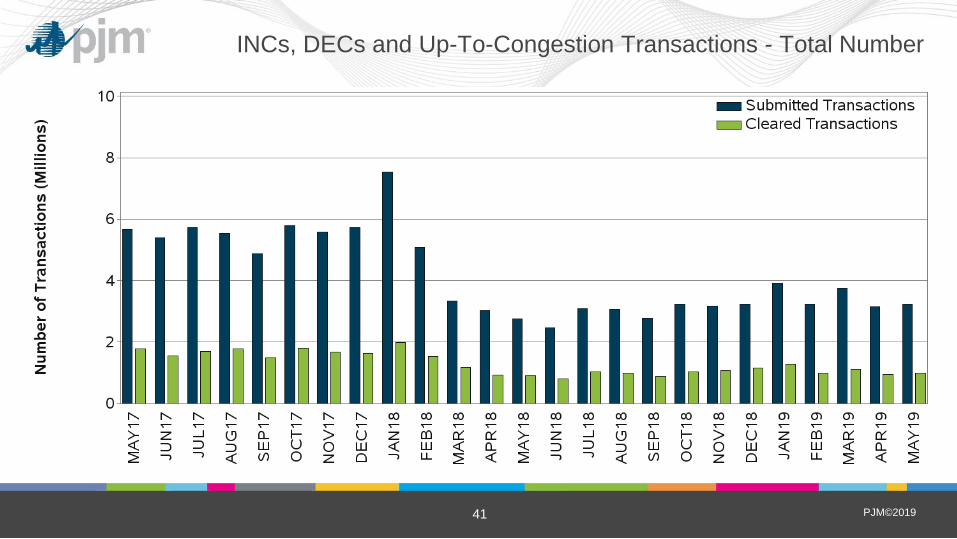
•
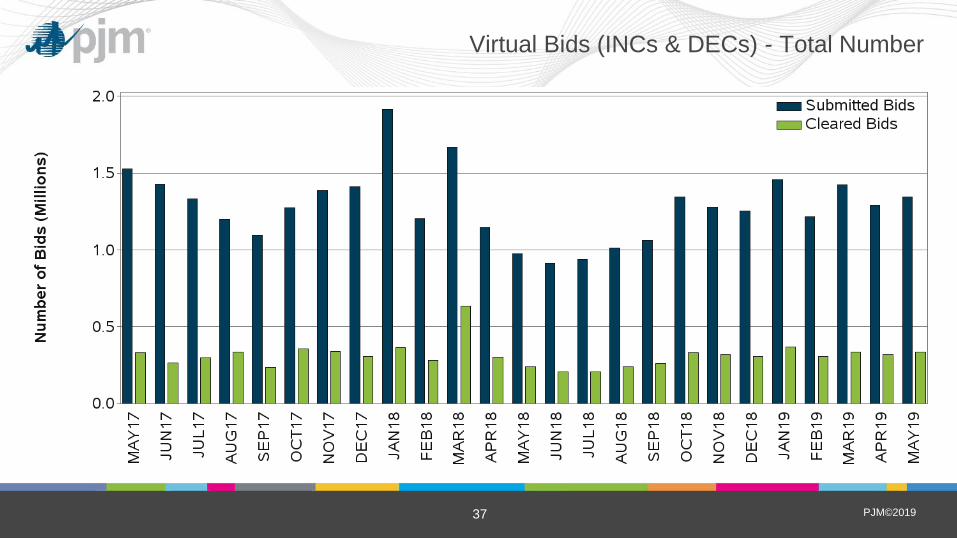
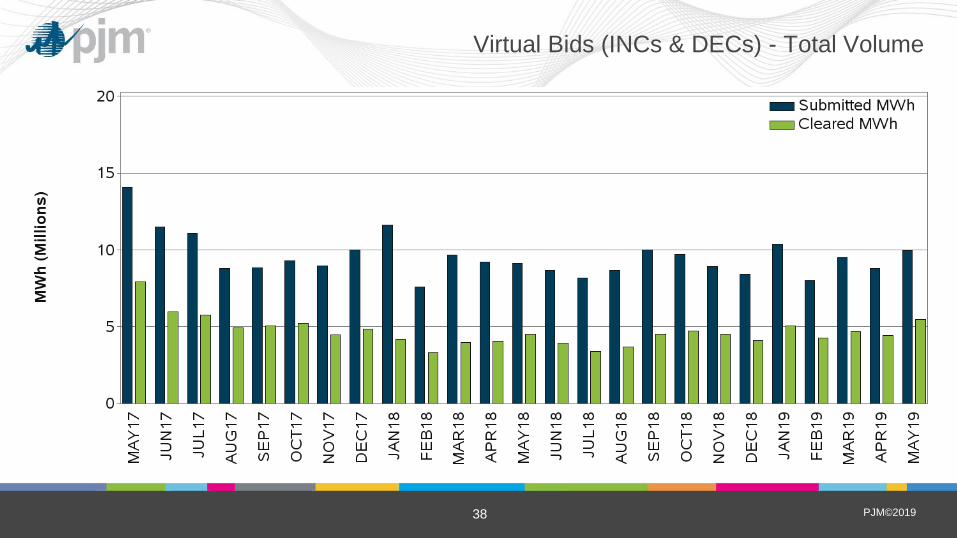
• The following six charts depict trends in submitted and cleared virtual and
up-to-congestion transactions, in terms of number and volume, into the PJM Energy
Market. The first two of these charts show the submitted and cleared increment and
decrement bids (virtual transactions or virtuals) and they are the same as what was
previously being presented in this report. The two charts after them display the trends in
submitted and cleared up-to-congestion transactions into the PJM Energy Market. The
last two of these six charts combine the virtual and up-to-congestion transactions and
show the sum of these two categories. •
• To clarify what a bid or transaction is, please consider the following example: An offer
(increment, decrement or up-to-congestion) of 10 MW, valid for eight hours for a given
day, is captured in the charts as eight submitted bids/transactions and 80 submitted
MWh. If this offer fully clears for three of the hours it was submitted for, it shows in the
charts as three cleared bids/transactions and 30 cleared MWh.
INCs, DECs and Up-To-Congestion Transactions
PJM©2019 37
Virtual Bids (INCs & DECs) - Total Number
PJM©2019 38
Virtual Bids (INCs & DECs) - Total Volume

PJM©2019 39
Up-To-Congestion Transactions - Total Number

PJM©2019 40
Up-To-Congestion Transactions - Total Volume
PJM©2019 41
INCs, DECs and Up-To-Congestion Transactions - Total Number
PJM©2019 42
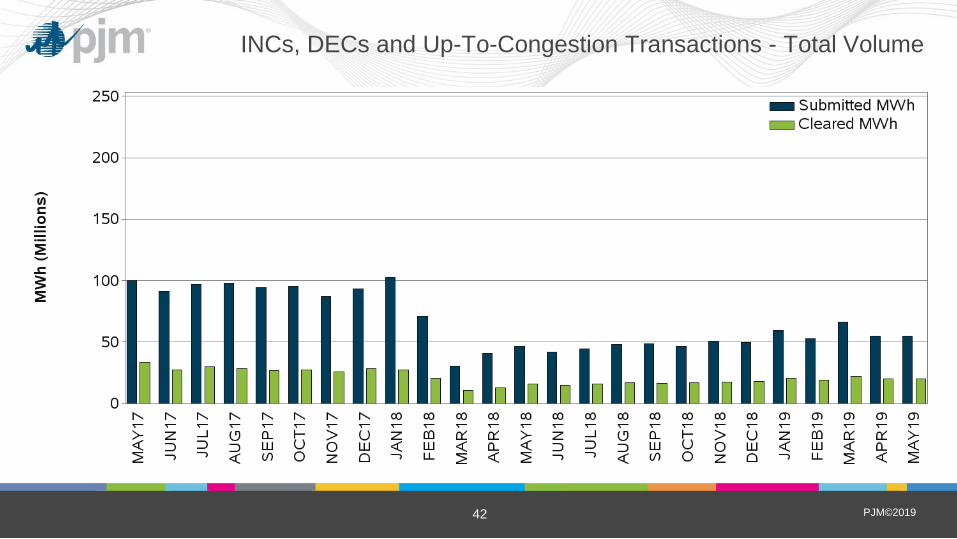
INCs, DECs and Up-To-Congestion Transactions - Total Volume

PJM©2019 43
Energy Market
Congestion and FTR Summary

PJM©2019 44
FTR Funding
Period Surplus / Underfunding Payout Ratio
May, 2019 $16,905,354 100%
2019 $79,799,837 100%
2018/2019 $111,676,817 100%
PJM©2019 45
FTR Revenue vs. FTR Target Allocation

PJM©2019 48
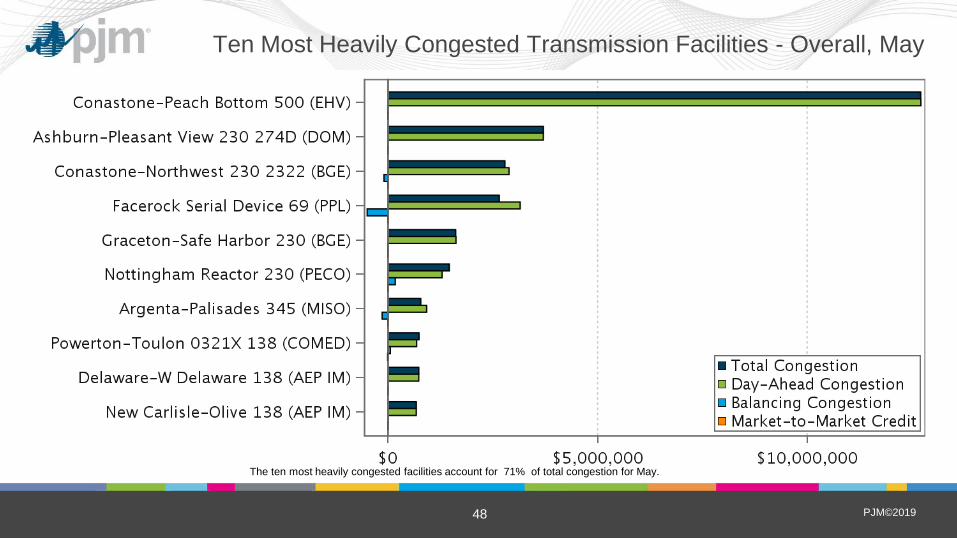
Ten Most Heavily Congested Transmission Facilities - Overall, May
The ten most heavily congested facilities account for 71% of total congestion for May.

PJM©2019 49
Ten Most Heavily Congested Transmission Facilities - Overall, 2019
The ten most heavily congested facilities account for 49% of total congestion for 2019.
PJM©2019 50
Energy Market
Interchange/Seams Summary
PJM©2019 51
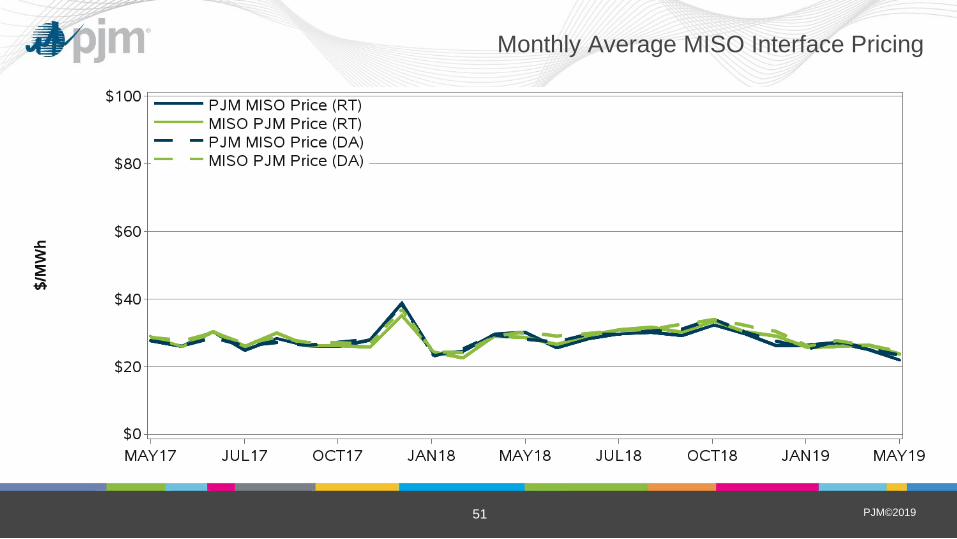
Monthly Average MISO Interface Pricing
PJM©2019 52
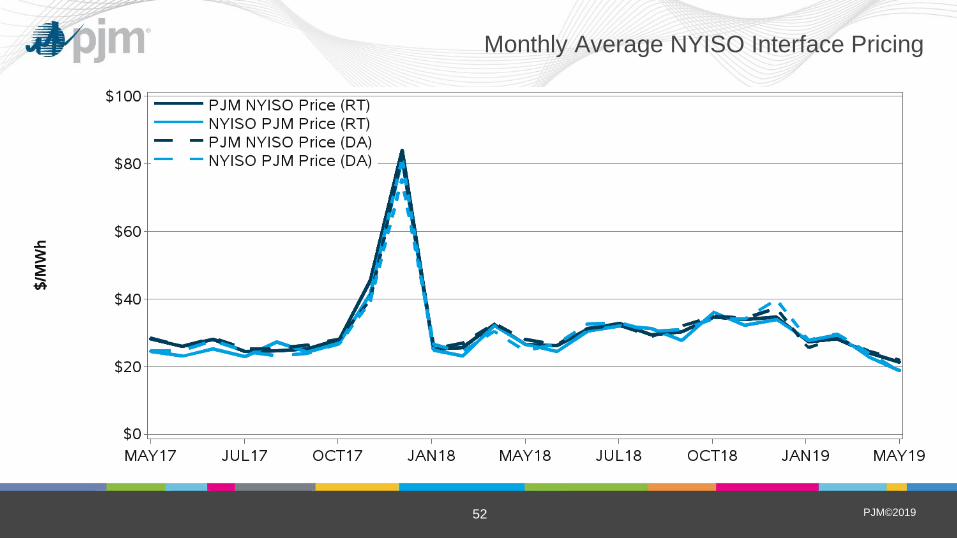
Monthly Average NYISO Interface Pricing
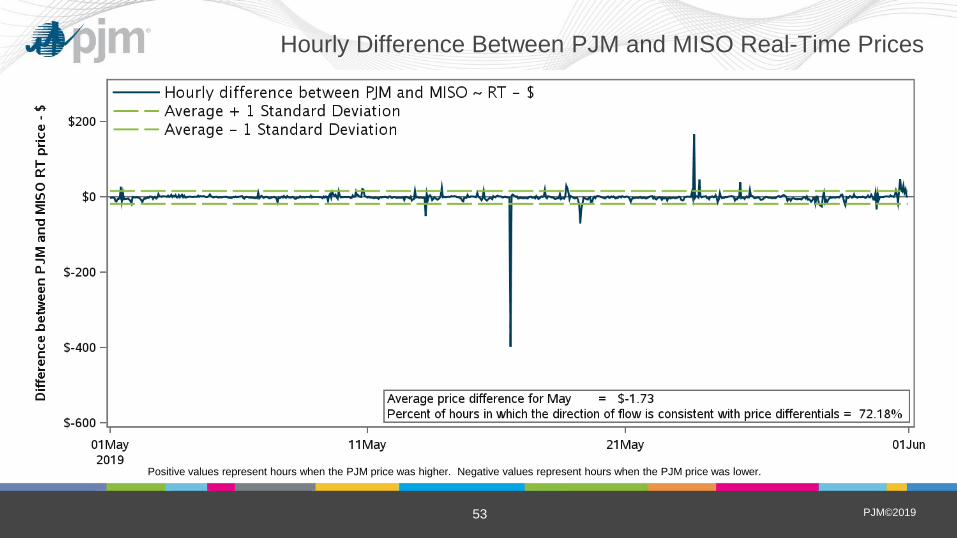
PJM©2019 53
Hourly Difference Between PJM and MISO Real-Time Prices
Positive values represent hours when the PJM price was higher. Negative values represent hours when the PJM price was lower.
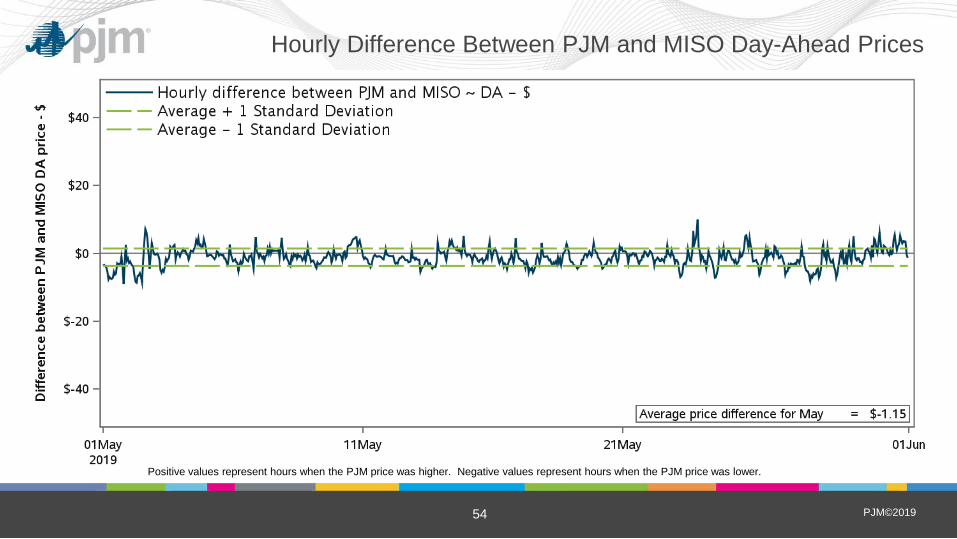
PJM©2019 54
Hourly Difference Between PJM and MISO Day-Ahead Prices
Positive values represent hours when the PJM price was higher. Negative values represent hours when the PJM price was lower.
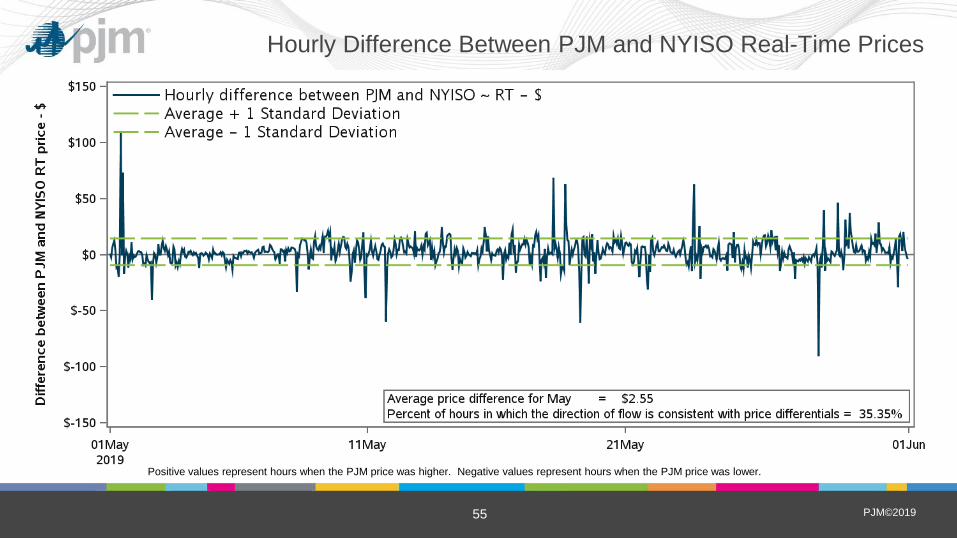
PJM©2019 55
Hourly Difference Between PJM and NYISO Real-Time Prices
Positive values represent hours when the PJM price was higher. Negative values represent hours when the PJM price was lower.
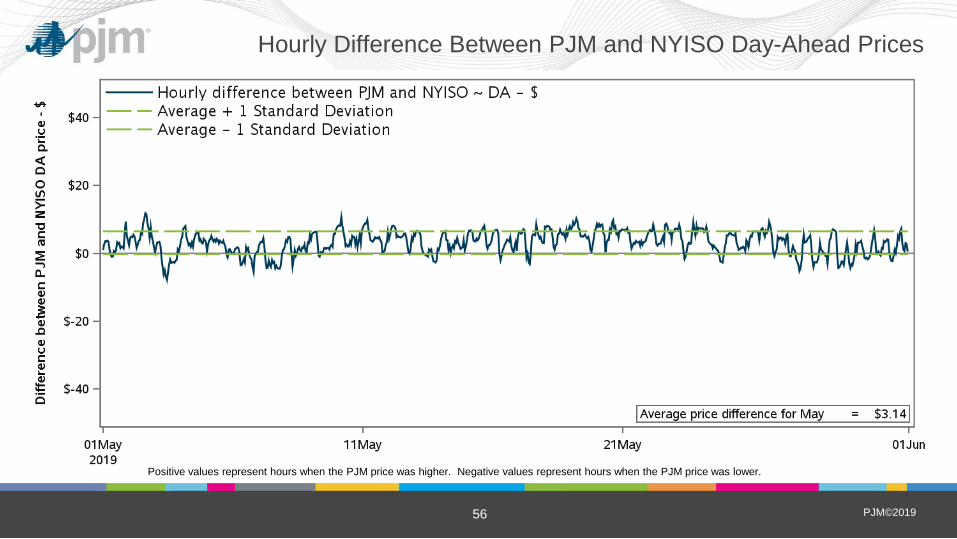
PJM©2019 56
Hourly Difference Between PJM and NYISO Day-Ahead Prices
Positive values represent hours when the PJM price was higher. Negative values represent hours when the PJM price was lower.
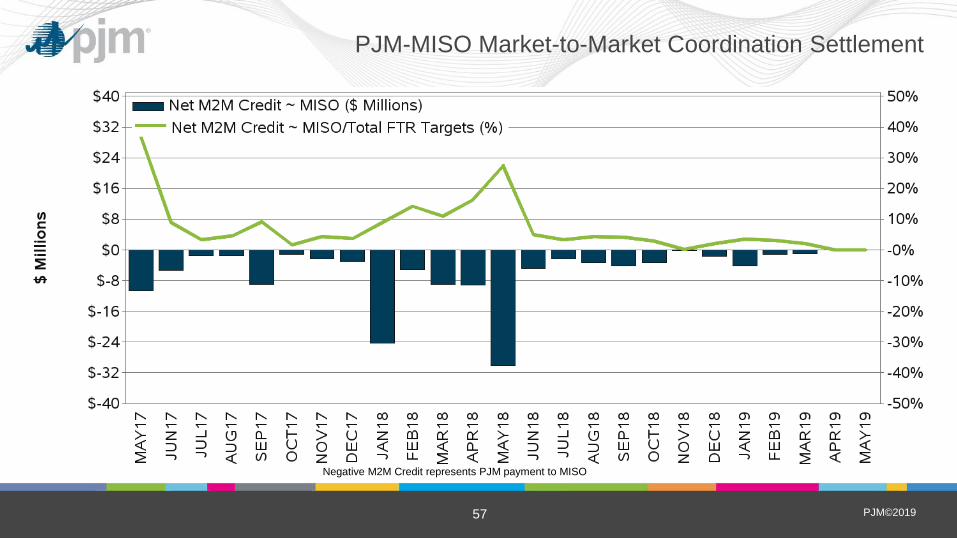
PJM©2019 57
PJM-MISO Market-to-Market Coordination Settlement
Negative M2M Credit represents PJM payment to MISO
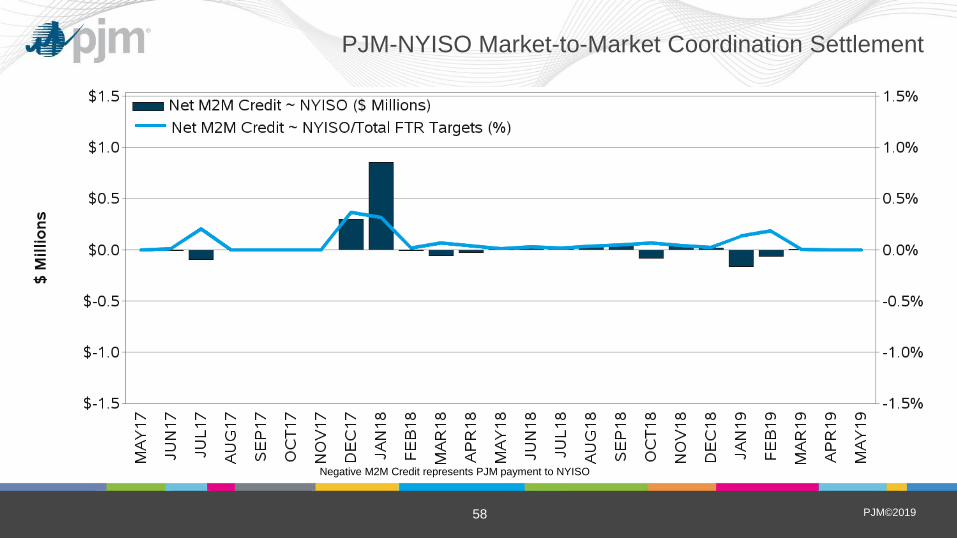
PJM©2019 58
PJM-NYISO Market-to-Market Coordination Settlement
Negative M2M Credit represents PJM payment to NYISO

PJM©2019 59
Ancillary Service Market
Summary


PJM©2019 61
Synchronized Reserve and Synchronous Condenser Costs
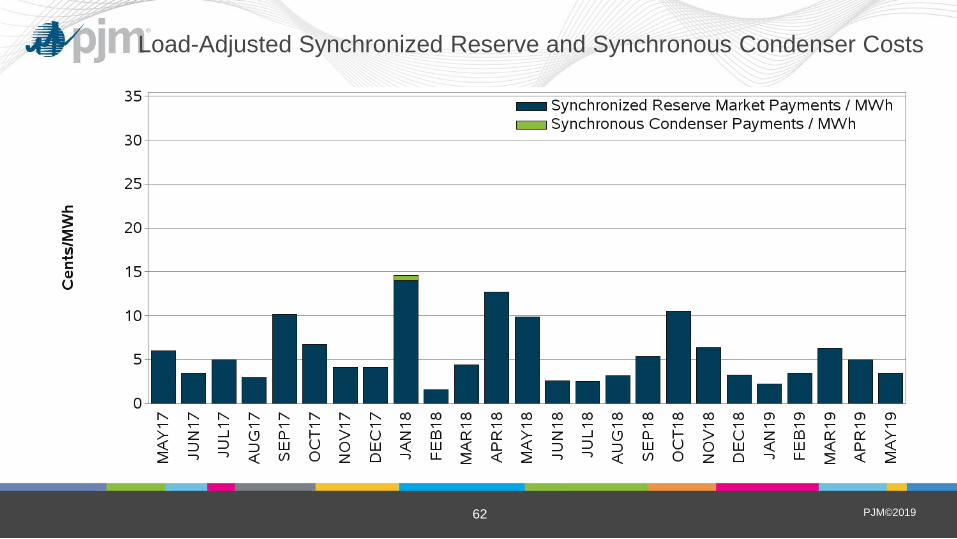
PJM©2019 62
Load-Adjusted Synchronized Reserve and Synchronous Condenser Costs

PJM©2019 63
DR Participation in PJM Regulation Markets
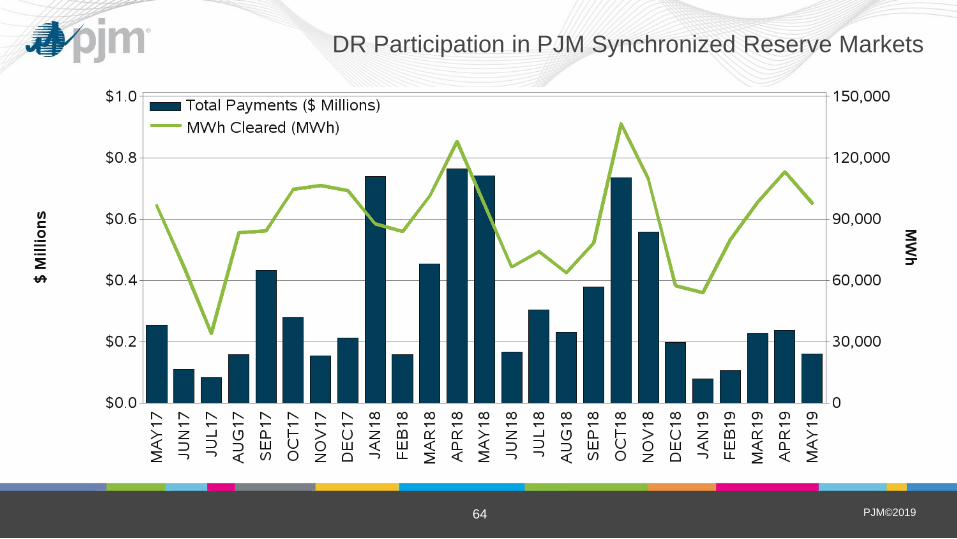
PJM©2019 64
DR Participation in PJM Synchronized Reserve Markets
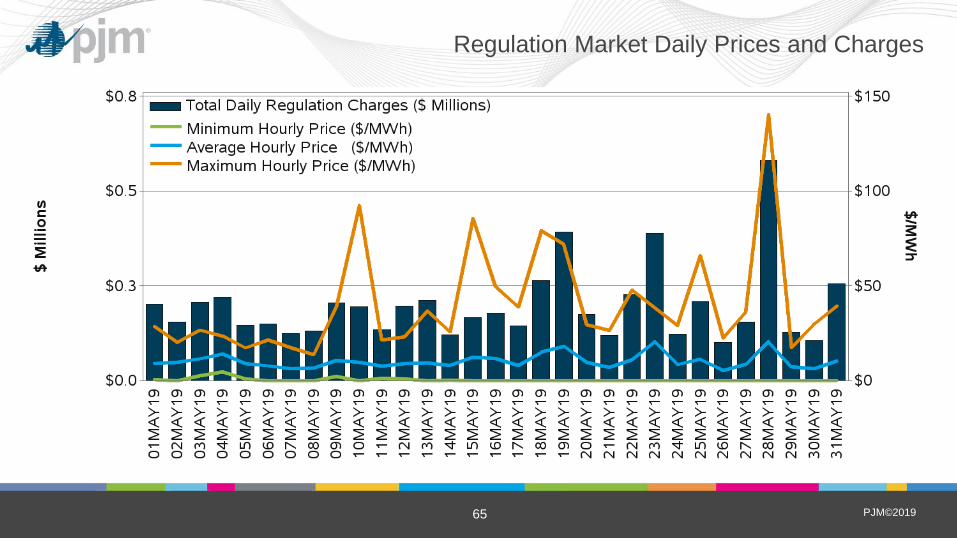
PJM©2019 65
Regulation Market Daily Prices and Charges

PJM©2019 66
Synchronized Reserve Market Daily Prices and Charges