marsh terracing as a wetland …courses.washington.edu/esrm479/marsh terracing.pdf327 wetlands, vol....
TRANSCRIPT
327
WETLANDS, Vol. 21, No. 3, September 2001, pp. 327–341q 2001, The Society of Wetland Scientists
MARSH TERRACING AS A WETLAND RESTORATION TOOL FOR CREATINGFISHERY HABITAT
Lawrence P. Rozas and Thomas J. MinelloNOAA/National Marine Fisheries Service
Southeast Fisheries Science Center4700 Avenue U
Galveston, Texas, USA 77551-5997E-mail: [email protected]
Abstract: Terracing is a relatively new wetland-restoration technique used to convert shallow subtidal bot-tom to marsh. This method uses existing bottom sediments to form terraces or ridges at marsh elevation. Aterrace field is constructed by arranging these ridges in some pattern that maximizes intertidal edge andminimizes fetch between ridges; the intertidal area is planted with marsh vegetation. We examined the habitatvalue of terracing for fishery species at Sabine National Wildlife Refuge, Louisiana (USA) in spring andfall 1999 by quantifying and comparing nekton densities in a 9-yr-old terrace field and nearby reference areausing a 1-m2 drop sampler. Decapod crustaceans were more abundant than fishes, composing 62% and 95%of all organisms we collected in spring and fall, respectively. White shrimp Litopenaeus setiferus, dagger-blade grass shrimp Palaemonetes pugio, blue crab Callinectes sapidus, and brown shrimp Farfantepenaeusaztecus accounted for 94% of all crustaceans, whereas 60% of all fishes were gulf menhaden Brevoortiapatronus. Mean densities of white shrimp (fall), daggerblade grass shrimp, blue crab, and brown shrimp(spring) were significantly greater in terrace marsh than on non-vegetated bottom in the reference pond.Densities of most nekton on non-vegetated bottom were similar in the terrace field and the reference pond,but gulf menhaden and white shrimp had higher densities at terrace pond sites and brown shrimp (spring)were more abundant at reference pond sites. The pattern for biomass was similar to that for density in thatthe mean biomass of most species was significantly greater at terrace marsh sites than reference pond sitesand similar at terrace and reference pond sites. Terrace marsh, however, was not functionally equivalent tonatural marsh, as mean densities of daggerblade grass shrimp (fall), brown shrimp (spring), and blue craband mean biomass of white shrimp (fall), striped mullet Mugil cephalus (spring), and spotted seatrout Cy-noscion nebulosus (fall) were greater at reference marsh sites than terrace marsh sites. Using these densityand biomass patterns and the percentage of marsh and pond area in the terrace field, we concluded thatterrace fields support higher standing crops of most fishery species compared with shallow marsh ponds ofsimilar size. Future restoration projects could include design changes to increase the proportion of marsh ina terrace field and enhance the habitat value of marsh terraces for fishery species.
Key Words: fishery species, Gulf of Mexico, habitat comparisons, habitat selection, nursery areas, penaeidshrimps, tidal marsh, restoration
INTRODUCTION
Estuarine marshes, and in particular the vegetationat the marsh-water interface (marsh edge), harbordense concentrations of young fishery species (Zim-merman and Minello 1984, Baltz et al. 1993, Cicchetti1998, Howe et al. 1999, Rozas and Zimmerman 2000).As nursery areas, these wetlands support valuablecoastal fisheries along the Gulf of Mexico and South-east Atlantic coasts of the U.S. (Kneib 1997, Zimmer-man et al. 2000). Over the last 50 years, the total areaof coastal marsh habitat has decreased substantially aswetlands were filled for development or converted toopen water through submergence (Mitsch and Gosse-link 1986).
In response to this large-scale loss of coastal wet-lands, a variety of techniques have been used to restorethese estuarine habitats. Structural marsh management,or the use of impoundments with water-control struc-tures, has been used as a wetland restoration techniquethat may be effective in restoring wetland vegetationin certain oligohaline areas (see Boyer 1997 for anevaluation of effectiveness), but evidence is strong thatthis approach has negative effects on habitat use bytransient fishery species (McGovern and Wenner 1990,Rogers et al. 1994, Rozas and Minello 1999). In directcontrast, wetland restoration through re-establishmentof tidal flow to diked marsh appears to positively affecthabitat use by fishery species (Gilmore et al. 1982, Reyet al. 1990, Chamberlain and Barnhart 1993, Peck et

328 WETLANDS, Volume 21, No. 3, 2001
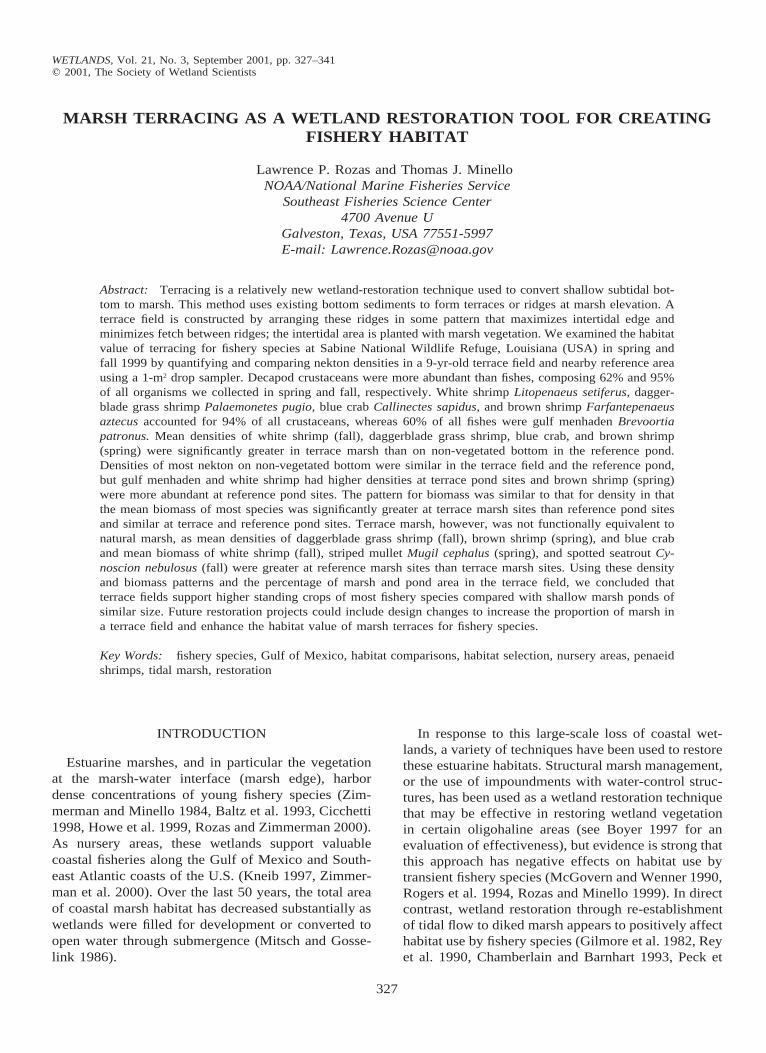
Figure 1. Aerial photograph of a terrace field at Sabine National Wildlife Refuge showing terraces laid out in a checkerboardpattern. Corners are open to allow movement of water and organisms through the terrace field. (Photograph taken January 16,2001 by Ron Boustany and Tommy Michot.)
al. 1994). Perhaps the most common restoration tech-nique, however, simply involves planting marsh veg-etation on dredged material or on scraped-down up-lands. In the southeastern United States, this approachappears to restore some habitat functions for estuarinenekton, but there is also evidence that these createdmarshes are not functionally equivalent to naturalmarshes (Moy and Levin 1991, Minello and Zimmer-man 1992, Meyer et al. 1993, Minello and Webb 1997,Minello 2000, Streever 2000). One important reasonfor this deficiency is that these created marshes (es-pecially those constructed on fine-grained dredged ma-terial) have relatively few creeks and ponds, and con-sequently little edge habitat (Minello et al. 1994, De-laney et al. 2000, Streever 2000).
Marsh terracing is a relatively new wetland-resto-ration technique that creates a substantial amount ofmarsh edge (Underwood et al. 1991). Terraces areridges or levees of sediment at marsh elevation thatare constructed by excavating subtidal bottom sedi-ments on site. The borrow areas created by terraceconstruction trap and eventually become filled withsediment. Terrace fields are developed by arranging aseries of these ridges in some pattern that maximizesintertidal edge and minimizes fetch between ridges.One arrangement is a checkerboard pattern with opencorners (Figure 1). Following construction, the inter-tidal levees are planted with marsh vegetation; and thesubtidal areas between terrace levees, may be plantedwith seagrasses or other species of submerged aquatic
vegetation (SAV). Marsh terracing has been promotedas a means of enhancing deposition and retention ofsuspended sediments, reducing turbidity, increasingmarsh-edge habitat, increasing overall primary andsecondary productivity, and maximizing access formarine organisms (Underwood et al. 1991, LDNR1993). Currently, marsh terracing appears to be re-stricted to restoration efforts along the northern Gulfof Mexico coast. However, the technique could be ap-plied in other areas with shallow water and suitablesubstrates. For example, land-reclamation methodsused for decades in Europe are quite similar to thetechniques used in marsh terracing (Kamps 1962).
The first terracing project in the U.S. was construct-ed at the Sabine National Wildlife Refuge (SabineNWR), Cameron Parish (county), Louisiana in 1990(Underwood et al. 1991, LDNR 1993). Spartina alter-niflora Loisel. was successfully established along theterrace levees in October 1990, and this species dom-inated well-established stands of marsh vegetation onthe terraces when we initiated our study in 1999. Aninitial attempt to establish SAV was apparently unsuc-cessful; three species of SAV (Ruppia maritima Lin-naeus, Halodule wrightii Ascherson, and Thalassiatestudinum Konig) were planted in experimental plotswithin the newly-constructed terrace ponds in June1991, but few plants had survived by August 1991(LDNR 1993).
A major goal of marsh terracing is to provide habitatfor fishery species, but the habitat value of terrace
Rozas & Minello, HABITAT VALUE OF MARSH TERRACING 329
fields has not been assessed. Specific objectives of ourstudy were to document the use of marsh terraces bynekton (dominant species of fishes and decapod crus-taceans) and to compare densities and biomasses offishery species (as a measure of habitat quality) in aterraced area and a nearby reference area at SabineNWR. Our use of animal density and biomass to mea-sure habitat quality is predicated on the assumptionthat animal distributions reflect the capacity of an areato provide essential habitat functions for species. Theresults from our research can be used to predict chang-es in habitat value that may be anticipated in areaswhere new terracing projects are now being planned.
MATERIALS AND METHODS
Study Area
The study area is in Southwest Louisiana within theSabine NWR and located on Calcasieu Lake (Figure2). Salinities at the study area are 10–15‰ in springand 15–20‰ in fall during years of average rainfall(Orlando et al. 1993). Tides in the estuary are predom-inantly diurnal and have a mean daily range of ,0.3m (U.S. Department of Commerce 1998). Salt marshdominated by Spartina alterniflora occupies much ofthe low intertidal zone within the study area.
Terrace fields were built in 1990 within two of threeshallow marsh ponds located on the north shore ofWest Cove, an arm of Calcasieu Lake (Figure 2).These terrace fields were constructed in a checker-board pattern with cells having 61-m-long sides (0.37-ha pond area). Intertidal terrace ridges within cellswere approximately 55 m long. We selected the pondwithout terraces as a reference area and the adjacentterraced pond as the two areas for comparison in ourstudy design (Figure 2). We identified four treatmentsfor sampling: two treatments were intertidal and veg-etated with Spartina alterniflora (terrace marsh andreference marsh) and two were subtidal open-water,mud bottom (terrace pond and reference pond). Mostof the shallow, open-water areas did not support SAV,but a few areas contained Ruppia maritima.
In each of two seasons (spring and fall), we col-lected a total of 60 samples from randomly selectedsites at the terrace and reference areas; the sites wereselected using random numbers and a grid placed overan aerial photograph. We took ten Spartina marshedge samples each on terrace levees (terrace marsh)and along the shoreline of the reference pond (refer-ence marsh). In addition, 20 samples each were takenin terrace ponds and the reference pond. We collectedtwice as many open-water samples as marsh samplesto ensure that at least some sites would contain SAV.Further, more samples are required to accurately rep-
resent non-vegetated areas because these sites containrelatively few organisms and variability among sites ishigh. We collected all samples in the day at high tideduring periods of tropical tides May 4–5 and Septem-ber 7–8 and 20, 1999.
Nekton Sampling
Fishes and decapod crustaceans (nekton) were quan-titatively sampled with a drop sampler using the pro-cedure described by Zimmerman et al. (1984). Wechose a drop sampler for this study because it is ef-fective in dense emergent vegetation, and the catchefficiency of this enclosure device does not appear tovary substantially with habitat characteristics typical ofshallow estuarine areas (Rozas and Minello 1997). Thesampler was a 1.14-m-diameter cylinder that wedropped from a boom attached to a shallow-draft boat.Two persons positioned the cylinder over a sample siteby slowly pushing from the boat’s stern. When re-leased from the boom, the cylinder rapidly entrappedorganisms within a 1.0-m2 sample area.
After the cylinder was dropped, we measured watertemperature, dissolved oxygen, salinity, and turbidityusing the methods described by Minello and Zimmer-man (1992). We determined water depth at each sam-ple site by averaging five depth measurements takenwithin the sampler. We also measured the distancefrom the sample area to the nearest marsh-water inter-face. At marsh sites, plant stems were clipped atground level, counted (dead and alive combined), andremoved from the cylinder. If SAV was present at ter-race or reference pond sites, we estimated coveragewithin the sampler (0–100%) and identified the speciesof plants present.
After measuring the environmental variables, wecaptured nekton trapped in the drop sampler by usingdip nets and filtering the water pumped out of the en-closure through a 1-mm-mesh net. When the samplerwas completely drained, any animals remaining on thebottom were removed by hand. Samples were pre-served in formalin and returned to the laboratory forprocessing.
In the laboratory, the samples were sorted, and an-imals were identified to lowest feasible taxon. We usedthe nomenclature of Perez-Farfante and Kensley(1997) for penaeid shrimps and identified species us-ing the protocol described in Rozas and Minello(1998). Thirty-one specimens of Farfantepenaeuscould not be reliably identified either because of theirsize (total length 13–18 mm) or because they weredamaged; these shrimps were assigned as brownshrimp F. aztecus (Ives) or pink shrimp F. duorarum(Burkenroad) based on the proportion of identifiedspecies in each sample. An additional 79 damaged
330 WETLANDS, Volume 21, No. 3, 2001
Rozas & Minello, HABITAT VALUE OF MARSH TERRACING 331
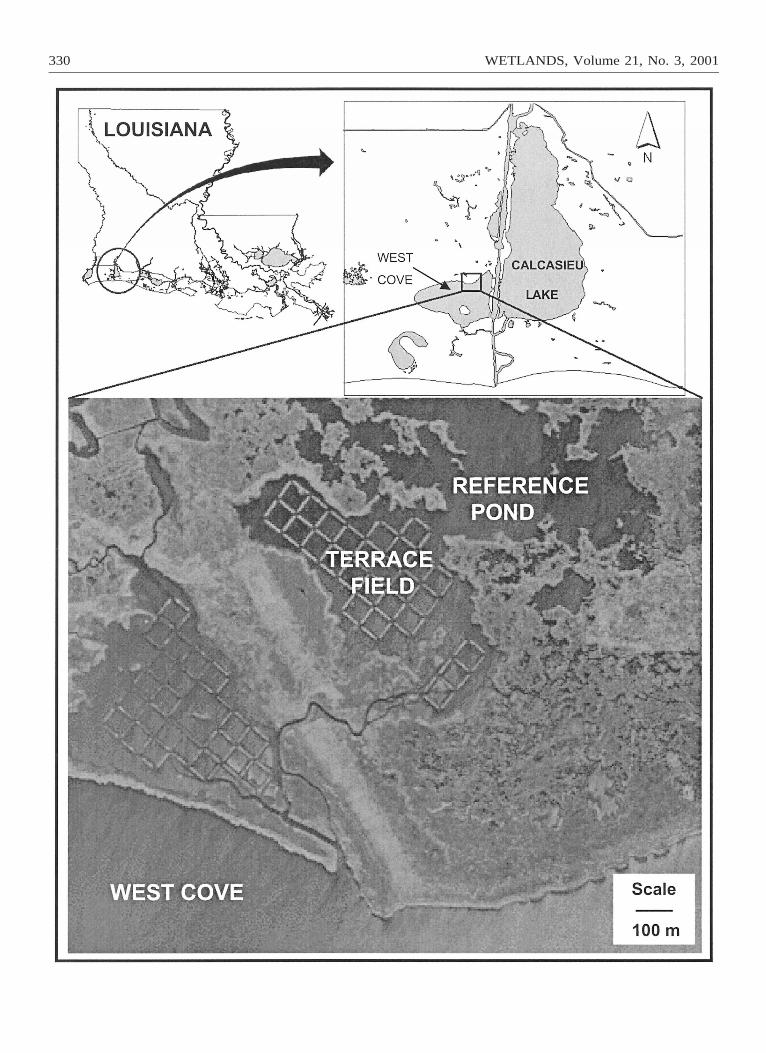
Table 1. Analysis of Variance (ANOVA) table for comparing the four treatment areas. Model includes the test for the main effect ofTreatment and the a priori contrasts that compare specific treatment effects. The dependent variable used in the example presented hereis total macrofauna (sum of total fishes and crustaceans).
Source dfSum ofSquares
MeanSquare F Value P Value
May 1999TREATMENT
CONTRASTSTerrace Marsh vs Reference PondTerrace Pond vs Reference PondTerrace Marsh vs Reference Marsh
RESIDUAL ERROR
3
111
56
58.451
29.8680.0520.003
64.142
19.484
29.8680.0520.0031.145
17.011
26.0760.0460.003
0.0001
0.00010.83160.9592
September 1999TREATMENT
CONTRASTSTerrace Marsh vs Reference PondTerrace Pond vs Reference PondTerrace Marsh vs Reference Marsh
RESIDUAL ERROR
3
111
56
55.395
25.8442.3521.204
18.098
18.465
25.8442.3521.2040.323
57.136
79.9697.2773.725
0.0001
0.00010.00920.0587
←
Figure 2. Map of the study area and its location on the north shore of West Cove in Southwest Louisiana. Study area islocated within the Calcasieu Lake estuary at approximately 29o 53’ N latitude and 93o 23’ W longitude.
shrimp could only be identified as penaeids and wereassigned to species (white shrimp Litopenaeus setifer-us (Linnaeus), brown shrimp, or pink shrimp) usingthis same procedure. Grass shrimp (146) that could notbe identified to species were similarly assigned to oneof two species (daggerblade grass shrimp Palaemo-netes pugio Holthuis, or brackish grass shrimp P. in-termedius Holthuis) identified from our samples. An-imals that could not be reliably identified, either dueto their size or because they were damaged, were notused in size analyses. Total length of fishes andshrimps and carapace width of crabs were measuredto the nearest mm. The biomass for each species wasdetermined by pooling individuals in a sample andmeasuring wet weight to the nearest 0.1g.
As a wetland restoration technique, terrace fields arebuilt to replace shallow open water in marsh ponds.Therefore, we also used our density data to comparestanding crops (in numbers of organisms and biomassfor selected taxa) between a 1-ha terrace field and areference pond of the same size. We used recent aerialphotography to calculate that 21% of the terraced areawas occupied by marsh and 79% by pond. We rec-ognize that a portion of each terrace ridge may havebeen exploited very little by aquatic organisms becausethe middle of the ridge was relatively high in eleva-tion. For this exercise, however, we assumed that theentire terrace ridge was equally used by fishery spe-cies. We estimated standing crops of animals within
the two 1-ha areas for May and September using av-erage animal densities and biomass determined fromour nekton samples and the total area of each habitattype within the terrace field and reference pond. Wealso used these data to simulate the effect of increasingthe proportion of marsh in a terrace field on brownshrimp standing crops (total numbers) in May.
Data Analyses
We used 1-way Analysis of Variance (ANOVA)followed by a priori contrasts to examine differencesin densities and biomass of selected organisms and en-vironmental characteristics (mean dissolved oxygen,salinity, water temperature, turbidity, water depth, anddistance to edge) among treatments (terrace marsh, ref-erence marsh, terrace pond, and reference pond) (Table1). We compared the following treatments with apriori contrasts (Table 1): Terrace Marsh vs ReferencePond, Terrace Pond vs Reference Pond, and TerraceMarsh vs Reference Marsh. These first two contrastswere selected because terrace marsh and terrace pondare habitat types created from the reference pond hab-itat type when terraces are constructed. The terracemarsh-reference marsh contrast was used to determinewhether created marsh in the terrace field was com-parable to natural marsh in supporting nekton.
In the ANOVA procedure, we analyzed the data col-lected during each season separately, because several
332 WETLANDS, Volume 21, No. 3, 2001
species were only abundant enough to include in thestatistical analysis in one season. We considered alphalevels of 0.05 to be significant in all results, but wealso assessed significance after adjusting alpha levelsfor the Treatment effect using the sequential Bonfer-roni method described by Rice (1989), which buffersagainst error introduced by making multiple compari-sons with the same sample set (i.e., testing a hypoth-esis for several species or variables). Densities andbiomass of animals were positively related to the stan-dard deviation; therefore, we performed a ln (x 1 1)transformation of the original values prior to analyses.Other variables were not transformed. All tabular andgraphical data presented in this paper are untrans-formed means. We conducted statistical analyses usingSuperANOVA (Version 5 Ed., Abacus Concepts, Inc.,Berkeley, California, 1989).
RESULTS
We collected a total of 1,344 animals (21 fish and9 decapod crustacean species) with a biomass of 2.21kg wet weight in May and 3,575 animals (18 fish and12 decapod crustacean species) and 0.8 kg wet weightin September (Tables 2 and 3). Fishes accounted for58% of the total biomass in May, whereas decapodcrustaceans composed most (83%) of the biomass inSeptember. Crustaceans outnumbered fishes in bothsampling periods, accounting for 62% and 95% of allorganisms taken in May and September, respectively.Species of decapod crustaceans in our samples wererelatively consistent between sampling periods (Table2). Daggerblade grass shrimp, brown shrimp, blue crabCallinectes sapidus Rathbun, brackish grass shrimp,and pink shrimp accounted for 98% of the crustaceanstaken in May. These same species, along with whiteshrimp, composed 99% of the crustaceans collected inSeptember. Other taxa infrequently taken in our sam-ples included the bigclaw snapping shrimp Alpheusheterochaelis Say, the lesser blue crab Callinectes sim-ilis Williams, the glabrous broadface crab Euryplaxnitida Stimpson, the xanthid crabs Rhithropanopeusharrisii (Gould) and Dyspanopeus texana (Stimpson),and the fiddler crabs Uca longisignalis Salmon andAtsaides and Uca rapax (Smith).
Abundant fishes differed between May and Septem-ber (Table 2). Most (86% of total) fishes taken in Maywere gulf menhaden Brevoortia patronus Goode andspot Leiostomus xanthurus Lacepede, whereas nakedgoby Gobiosoma bosc (Lacepede), code goby Gobio-soma robustum Ginsburg, and unidentified gobies(Family Gobiidae) were most abundant in September.Other less abundant but commonly collected speciesincluded Anchoa mitchilli (Valenciennes), Cynoscionnebulosus (Cuvier), Cyprinodon variegatus Lacepede,
Fundulus grandis Baird and Girard, Gobiesox stru-mosus Cope, Gobionellus boleosoma (Jordan and Gil-bert), Menidia beryllina (Cope), Micropogonias un-dulatus (Linnaeus), and Mugil cephalus Linnaeus. Inaddition, we infrequently collected (,5 individuals)Adinia xenica (Jordan and Gilbert), Citharichthys spi-lopterus Gunther, Cynoscion arenarius Ginsburg,Etropus crossotus Jordan and Gilbert, Evorthodus lyr-icus (Girard), Fundulus pulvereus (Evermann), Fun-dulus similis (Baird and Girard), Gobionellus oceani-cus (Pallas), Harengula jaguana Poey, Lagodon rhom-boides (Linnaeus), Lucania parva (Baird and Girard),Mugil curema Valenciennes, Myrophis punctatus Lut-ken, Paralichthys lethostigma Jordan and Gilbert, Poe-cilia latipinna (Lesueur), Sciaenops ocellatus (Linnae-us), Stellifer lanceolatus (Holbrook), and Symphurusplagiusa (Linnaeus) in the study area.
Mean densities of decapod crustaceans were greatestin intertidal marsh, and most species were significantlymore abundant at terrace marsh sites than referencepond sites (Table 2). Exceptions were brown shrimp(in September only) and brackish grass shrimp; den-sities at terrace marsh sites and reference pond sitesfor these species were not significantly different. Crus-tacean densities were generally low over all non-veg-etated bottom, and mean densities of most specieswere not significantly different between terrace pondand reference pond sites. Exceptions to this generalitywere brown shrimp (in May), which were more abun-dant at reference pond sites, and white shrimp (in Sep-tember), which were more abundant in terrace ponds.Four crustacean species had mean densities in the ter-race marsh that were only 11–54% of their densitiesin the reference marsh (brown shrimp519% and 54%,blue crab532% and 44%, brackish grass shrimp511%and 18%, and daggerblade grass shrimp in Septem-ber554%). Densities of daggerblade grass shrimp inMay and white shrimp in September, however, werenot significantly different between marsh treatments.Fishes did not follow such a consistent spatial pattern.Gulf menhaden was most abundant over non-vegetatedbottom, and mean densities of this species were greaterat terrace pond than reference pond sites (Table 2).Mean densities of naked goby and code goby weregreatest in the reference marsh; however, most un-identified gobies were taken in the reference pond (Ta-ble 2).
The pattern for biomass was similar to the densitypattern for most numerically-dominant species (Table3). Biomass and density patterns differed, however, forbrown shrimp, blue crab, and white shrimp. Mean bio-mass of brown shrimp (May) was greater at terracemarsh sites than reference pond sites and did not differsignificantly between terrace pond sites and referencepond sites (Table 3). Mean blue crab biomass at ref-
Rozas & Minello, HABITAT VALUE OF MARSH TERRACING 333
Tabl
e2.
Com
pari
son
ofde
nsiti
es(m
ean
m2
26
1SE
)of
the
mos
tab
unda
ntde
capo
dcr
usta
cean
san
dfis
hes
colle
cted
amon
gtr
eatm
ents
(ter
race
mar
sh,
refe
renc
em
arsh
,te
rrac
epo
nd,
and
refe
renc
epo
nd)
inM
ayan
dSe
ptem
ber
1999
.E
ach
mea
nis
estim
ated
from
10(m
arsh
)or
20(p
ond)
sam
ples
.T
heto
tal
num
ber
ofsp
ecie
sco
llect
edin
each
taxo
nom
icca
tego
ryal
sois
give
n.R
esul
ts(p
valu
es)
are
give
nfo
rA
NO
VA
anal
yses
we
used
toco
mpa
rem
ean
dens
ities
amon
gth
efo
urtr
eatm
ent
area
san
da
prio
rico
ntra
sts
test
ing
for
sign
ifica
ntdi
ffer
ence
sbe
twee
n:1
5te
rrac
em
arsh
and
refe
renc
epo
nd;
25
terr
ace
pond
and
refe
renc
epo
nd;
and
35
terr
ace
mar
shan
dre
fere
nce
mar
sh.
The
AN
OV
Am
odel
used
todo
thes
ean
alys
esis
show
nin
Tabl
e1.
An
*in
dica
tes
that
the
prob
abili
tyva
lue
was
sign
ifica
ntfo
rth
eov
eral
lA
NO
VA
afte
ral
pha
was
adju
sted
asde
scri
bed
byR
ice
(198
9).
Spec
ies
Terr
ace
Mar
sh
Mea
nSE
Ref
eren
ceM
arsh
Mea
nSE
Terr
ace
Pond
Mea
nSE
Ref
eren
cePo
nd
Mea
nSE
Tota
l%
Tota
lA
NO
VA
pV
alue
Con
tras
tp
Val
ues
(1)
TM
arsh
vsR
Pond
(2)
TPo
ndvs
RPo
nd
(3)
TM
arsh
vsR
Mar
sh
May
1999
Cru
stac
eans
(Tot
al5
9sp
ecie
s)D
agge
rbla
degr
ass
shri
mp
Bro
wn
shri
mp
Blu
ecr
abB
rack
ish
gras
ssh
rim
p
26.6 4.6
3.1
1.3
(6.5
2)(0
.40)
(0.5
3)(0
.91)
16.0 8.5
7.0
7.4
(2.4
7)(1
.15)
(1.5
9)(3
.54)
0.0
0.6
0.2
0.0
(0.0
0)(0
.17)
(0.0
8)(0
.00)
0.2
1.6
0.5
0.3
(0.1
1)(0
.50)
(0.2
0)(0
.30)
429
174
114 93
51.3
20.8
13.6
11.1
0.00
01*
0.00
01*
0.00
01*
0.00
06*
0.00
010.
0001
0.00
010.
2241
0.57
350.
0096
0.27
900.
6691
0.29
470.
0321
0.03
240.
0275
Pink
shri
mp
Tota
lC
rust
acea
nsFi
shes
(Tot
al5
21sp
ecie
s)G
ulf
men
hade
nSp
otTo
tal
Fish
es
0.8
37.1 2.6
0.8
5.5
(0.5
9)(6
.81)
(1.8
7)(0
.49)
(2.3
2)
0.3
39.7 0.0
0.2
2.1
(0.3
0)(4
.94)
(0.0
0)(0
.13)
(0.4
3)
0.0
0.8
15.3 0.2
15.9
(0.0
0)(0
.19)
(8.0
0)(0
.08)
(8.0
5)
0.1
2.7
4.4
0.3
5.7
(0.0
5)(1
.01)
(3.9
9)(0
.16)
(3.9
8)
13 837
418 19 507
1.6
82.4 3.7
0.00
01*
0.03
68
0.57
80
0.00
01
0.53
78
0.00
66
0.02
21
0.50
69
0.23
81
Sept
embe
r19
99C
rust
acea
ns(T
otal
512
spec
ies)
Whi
tesh
rim
pD
agge
rbla
degr
ass
shri
mp
Blu
ecr
ab
62.1
38.0 4.7
(11.
92)
(7.8
4)(0
.65)
64.2
70.8
14.6
(8.8
4)(1
3.02
)(1
.56)
19.6 0.4
2.6
(2.6
7)(0
.22)
(0.4
4)
7.8
0.2
2.0
(1.1
1)(0
.08)
(0.3
5)
1810
1098 285
53.5
32.4 8.4
0.00
01*
0.00
01*
0.00
01*
0.00
010.
0001
0.00
17
0.00
060.
6551
0.33
08
0.64
410.
0023
0.00
01B
rack
ish
gras
ssh
rim
pB
row
nsh
rim
pPi
nksh
rim
pTo
tal
Cru
stac
eans
Fish
es(T
otal
18sp
ecie
s)
0.8
0.6
0.0
107.
2
(0.7
0)(0
.40)
(0.0
0)(1
8.08
)
7.0
3.1
1.4
162.
4
(3.7
7)(0
.80)
(1.4
0)(1
9.22
)
0.6
0.2
0.2
23.5
(0.6
0)(0
.16)
(0.0
8)(3
.15)
0.0
0.6
0.2
10.9
(0.0
0)(0
.20)
(0.2
0)(1
.45)
90 52 2233
84
2.7
1.5
0.00
24*
0.00
01*
0.00
01*
0.32
950.
9236
0.00
01
0.57
950.
1721
0.00
13
0.01
510.
0001
0.06
99
Uni
dent
ified
goby
Nak
edgo
byC
ode
goby
Gul
fki
llifis
hTo
tal
Fish
es
0.1
0.0
0.0
1.1
3.1
(0.1
0)(0
.00)
(0.0
0)(0
.50)
(0.9
7)
0.5
0.9
1.0
0.2
4.9
(0.2
7)(0
.46)
(0.6
7)(0
.20)
(0.9
4)
0.2
0.3
0.0
0.0
1.8
(0.1
2)(0
.30)
(0.0
0)(0
.00)
(0.8
1)
1.5
0.6
0.7
0.0
3.8
(0.5
6)(0
.36)
(0.3
0)(0
.00)
(0.6
8)
39 26 23 13 191
20.4
13.6
12.0 6.8
0.00
82*
0.16
950.
0657
0.00
07*
0.00
58
0.38
53
0.00
26
0.00
09
0.32
19
0.10
51
334 WETLANDS, Volume 21, No. 3, 2001
Tabl
e3.
Com
pari
son
ofbi
omas
ses
(mea
n6
1SE
)in
gram
sof
dom
inan
t(c
ontr
ibut
ing
mos
tbi
omas
s)de
capo
dcr
usta
cean
san
dfis
hes
colle
cted
amon
gtr
eatm
ents
(ter
race
mar
sh,
refe
renc
em
arsh
,te
rrac
epo
nd,
and
refe
renc
epo
nd)
inM
ayan
dSe
ptem
ber
1999
.E
ach
mea
nis
estim
ated
from
10(m
arsh
)or
20(p
ond)
sam
ples
.R
esul
ts(p
valu
es)
are
give
nfo
rA
NO
VA
anal
yses
we
used
toco
mpa
rem
ean
biom
asse
sam
ong
the
four
trea
tmen
tar
eas
and
apr
iori
cont
rast
ste
stin
gfo
rsi
gnifi
cant
diff
eren
ces
betw
een:
15
terr
ace
mar
shan
dre
fere
nce
pond
;2
5te
rrac
epo
ndan
dre
fere
nce
pond
;an
d3
5te
rrac
em
arsh
and
refe
renc
em
arsh
.T
heA
NO
VA
mod
elus
edto
doth
ese
anal
yses
issh
own
inTa
ble
1.A
n*
indi
cate
sth
atth
epr
obab
ility
valu
ew
assi
gnifi
cant
for
the
over
all
AN
OV
Aaf
ter
alph
aw
asad
just
edas
desc
ribe
dby
Ric
e(1
989)
.
Spec
ies
Terr
ace
Mar
sh
Mea
nSE
Ref
eren
ceM
arsh
Mea
nSE
Terr
ace
Pond
Mea
nSE
Ref
eren
cePo
nd
Mea
nSE
Tota
l%
Tota
lA
NO
VA
pV
alue
Con
tras
tp
Val
ue
(1)
TM
arsh
vsR
Pond
(2)
TPo
ndvs
RPo
nd
(3)
TM
arsh
vsR
Mar
sh
May
1999
Cru
stac
eans
Blu
ecr
abB
row
nsh
rim
pD
agge
rbla
degr
ass
shri
mp
39.1 2.7
7.4
(26.
73)
(0.8
6)(2
.01)
3.8
9.7
5.4
(0.8
9)(1
.83)
(0.9
9)
8.3
0.7
0.0
(8.2
5)(0
.25)
(0.0
0)
0.1
1.1
0.0
(0.0
3)(0
.32)
(0.0
1)
596.
515
9.8
128.
1
64.8
17.3
13.9
0.00
01*
0.00
01*
0.00
01*
0.00
010.
0235
0.00
01
0.48
080.
2923
0.93
08
0.32
200.
0001
0.73
08B
rack
ish
gras
ssh
rim
pPi
nksh
rim
pTo
tal
Cru
stac
eans
Fish
es
0.2
0.0
50.8
(0.1
4)(0
.04)
(26.
67)
0.8
0.3
20.7
(0.4
1)(0
.29)
(2.2
8)
0.0
0.0
9.1
(0.0
0)(0
.00)
(8.3
0)
0.0
0.0
1.2
(0.0
3)(0
.00)
(0.3
3)
10.5 3.3
921.
0
1.1
0.00
10*
0.00
01*
0.21
60
0.00
01
0.80
21
0.87
78
0.03
24
0.84
05
Stri
ped
mul
let
Gul
fm
enha
den
Spot
Tota
lFi
shes
4.7
0.3
3.3
10.2
(4.7
1)(0
.18)
(1.8
3)(6
.55)
74.8 0.0
1.9
80.8
(39.
04)
(0.0
0)(1
.41)
(39.
09)
2.1
11.1 0.8
14.4
(2.1
4)(5
.92)
(0.4
3)(6
.05)
0.0
3.0
0.7
4.6
(0.0
0)(2
.92)
(0.4
8)(2
.93)
837.
428
6.2
81.5
1288
.9
65.0
22.2 6.3
0.00
11*
0.01
190.
2756
0.00
51*
0.43
130.
7838
0.34
61
0.63
770.
0109
0.16
78
0.00
600.
7046
0.01
82Se
ptem
ber
1999
Cru
stac
eans
Whi
tesh
rim
pB
lue
crab
Dag
gerb
lade
gras
ssh
rim
p
8.9
7.5
2.4
(2.0
5)(3
.62)
(0.6
4)
25.0 3.4
6.7
(5.1
3)(0
.65)
(2.0
4)
2.4
0.3
0.0
(0.3
6)(0
.09)
(0.0
3)
0.8
0.1
0.0
(0.2
4)(0
.03)
(0.0
1)
403.
511
5.9
92.3
62.1
17.8
14.2
0.00
01*
0.00
01*
0.00
01*
0.00
010.
0001
0.00
01
0.00
170.
6123
0.86
70
0.00
020.
8453
0.00
11B
rack
ish
gras
ssh
rim
pB
row
nsh
rim
pPi
nksh
rim
pTo
tal
Cru
stac
eans
Fish
es
0.0
0.1
0.0
18.8
(0.0
3)(0
.04)
(0.0
0)(3
.58)
1.5
1.0
0.2
37.5
(1.0
6)(0
.29)
(0.2
0)(7
.20)
0.0
0.0
0.0
2.7
(0.0
5)(0
.02)
(0.0
1)(0
.39)
0.0
0.2
0.0
1.2
(0.0
0)(0
.16)
(0.0
3)(0
.28)
16.5
15.6 2.8
649.
7
2.5
2.4
0.00
35*
0.00
01*
0.00
01*
0.77
120.
5513
0.00
01
0.75
820.
2451
0.00
22
0.00
540.
0001
0.00
68
Whi
tem
ulle
tSt
ripe
dm
ulle
tSp
otte
dse
atro
utG
ulf
killi
fish
Uni
dent
ified
goby
Tota
lFi
shes
0.0
2.6
0.0
1.0
0.3
5.1
(0.0
0)(1
.97)
(0.0
0)(0
.52)
(0.3
2)(2
.35)
3.1
0.0
1.8
0.2
0.0
6.8
(3.1
1)(0
.00)
(1.3
8)(0
.23)
(0.0
2)(3
.22)
0.0
0.0
0.0
0.0
0.0
0.2
(0.0
0)(0
.00)
(0.0
0)(0
.00)
(0.0
0)(0
.11)
0.0
0.0
0.0
0.0
0.0
0.3
(0.0
0)(0
.00)
(0.0
5)(0
.00)
(0.0
2)(0
.08)
31.1
26.0
18.6
12.3 4.3
129.
0
24.1
20.2
14.4 9.5
3.3
0.17
160.
0165
0.00
780.
0021
*0.
2690
0.00
01*
0.00
420.
8157
0.00
05
0.00
07
1.00
000.
8006
1.00
00
0.79
64
0.01
230.
0056
0.02
15
0.62
58
Rozas & Minello, HABITAT VALUE OF MARSH TERRACING 335
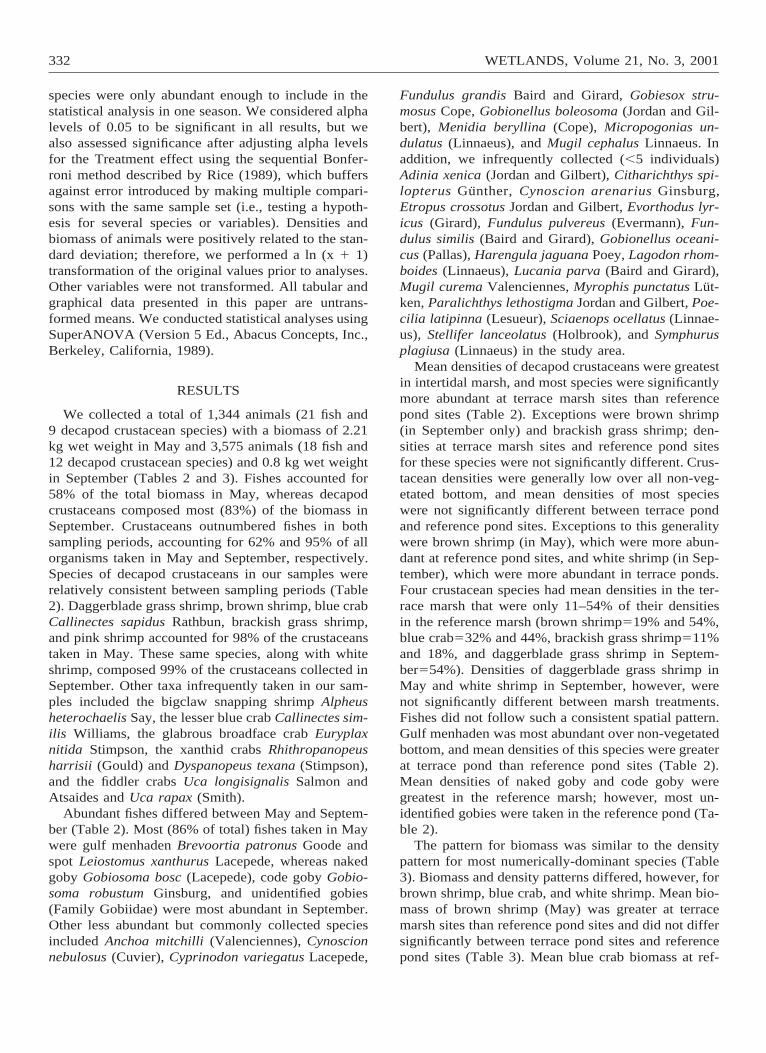
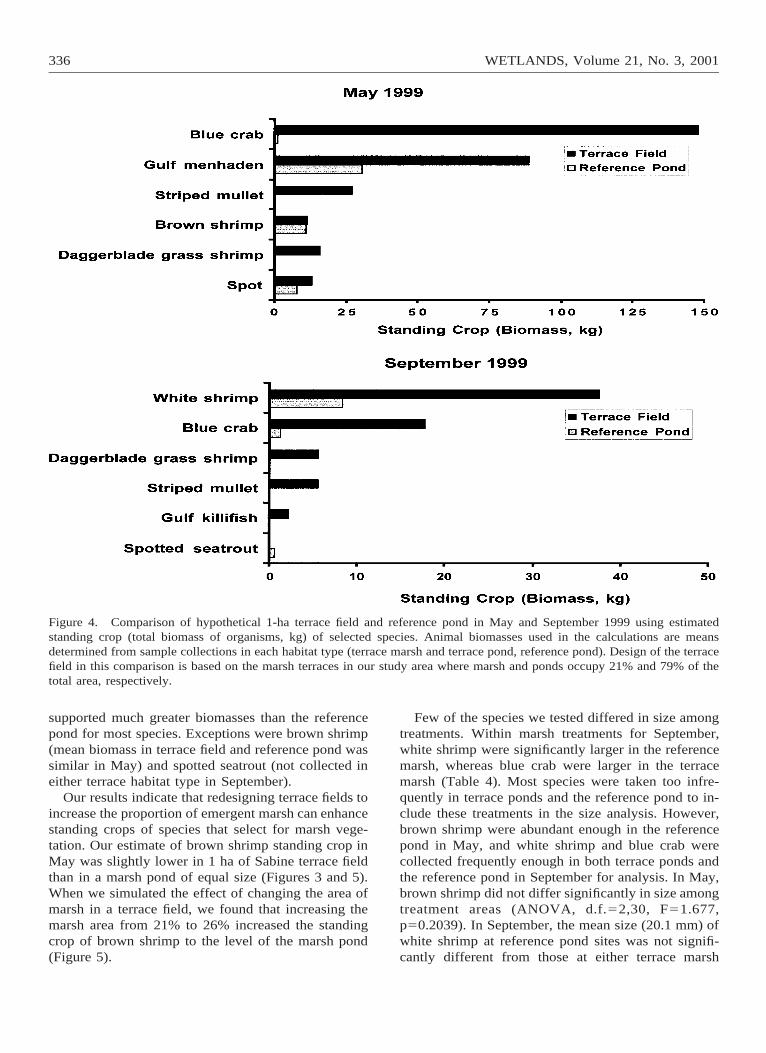
Figure 3. Comparison of hypothetical 1-ha terrace field and reference pond in May and September 1999 using estimatedstanding crop (total number of organisms) of abundant taxa. Animal densities used in the calculations are mean densitiesdetermined from sample collections in each habitat type (terrace marsh and terrace pond, reference pond). Design of the terracefield in this comparison is based on the marsh terraces in our study area where marsh and ponds occupy 21% and 79% of thetotal area, respectively.
erence marsh sites and terrace marsh sites was not sig-nificantly different, and mean biomass of white shrimp(September) was significantly greater at referencemarsh sites than terrace marsh sites (Table 3). Thereference marsh contributed most of the biomass ofthree fish species (striped mullet, white mullet, andspotted seatrout) that accounted for a substantial per-centage of the total biomass, even though they werenot abundant in our samples (Table 3). The mean bio-mass of striped mullet was significantly greater at ref-erence marsh sites than terrace marsh sites in May,although this species was collected exclusively at ter-race marsh sites in September (Table 3). Spotted sea-trout was taken almost exclusively in the referencemarsh, and white mullet was collected only in the ref-erence marsh (Table 3).
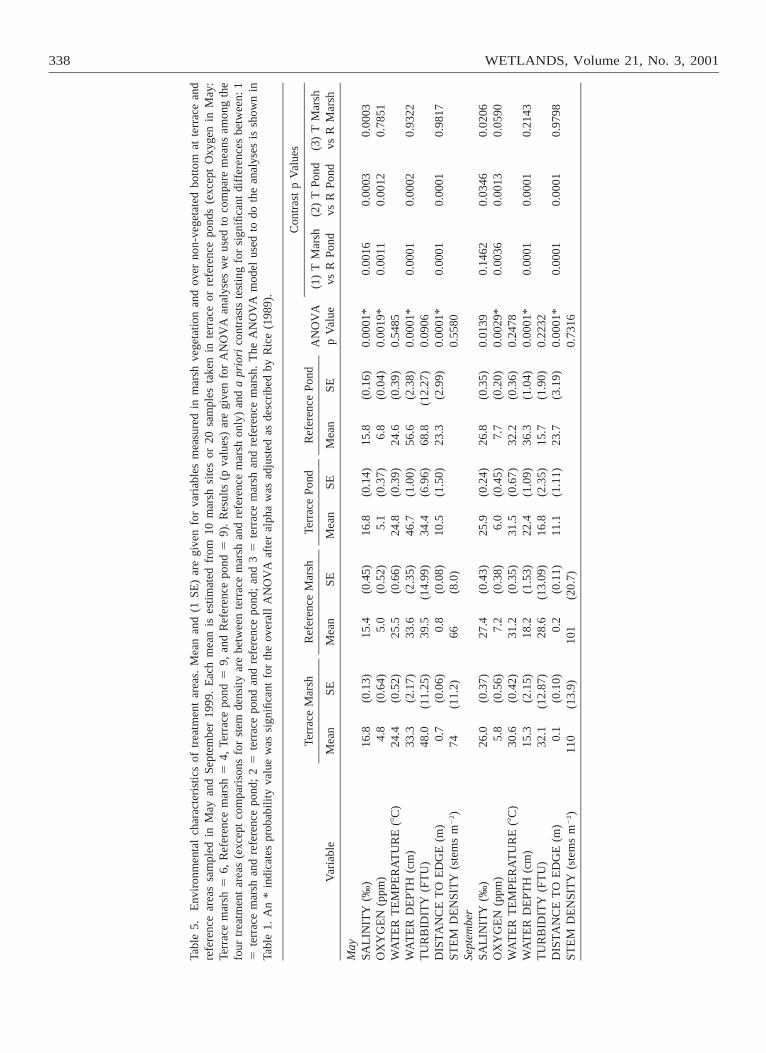
In comparisons between 1-ha areas of marsh terraceand reference pond, standing crops of most animalswere greater within the terrace field (Figures 3 and 4).Based on our density data for May, gulf menhaden,daggerblade grass shrimp, blue crab, and pink shrimpwere 2.9, 37.2, 1.5, and 3.4 times more abundant, re-spectively, in the terrace field than the reference pond.In September, white shrimp, daggerblade grass shrimp,and blue crab were 3.7, 55.0, and 1.5 times more abun-dant, respectively, in the terrace field. In contrast,standing crops (total numbers) of brown shrimp in theterrace field in May were 88% of those in the referencepond (Figure 3). Naked goby also was less abundantin the terrace field than in the reference pond. Com-parisons of standing crops using biomass data fol-lowed a similar pattern (Figure 4). The terrace field
336 WETLANDS, Volume 21, No. 3, 2001
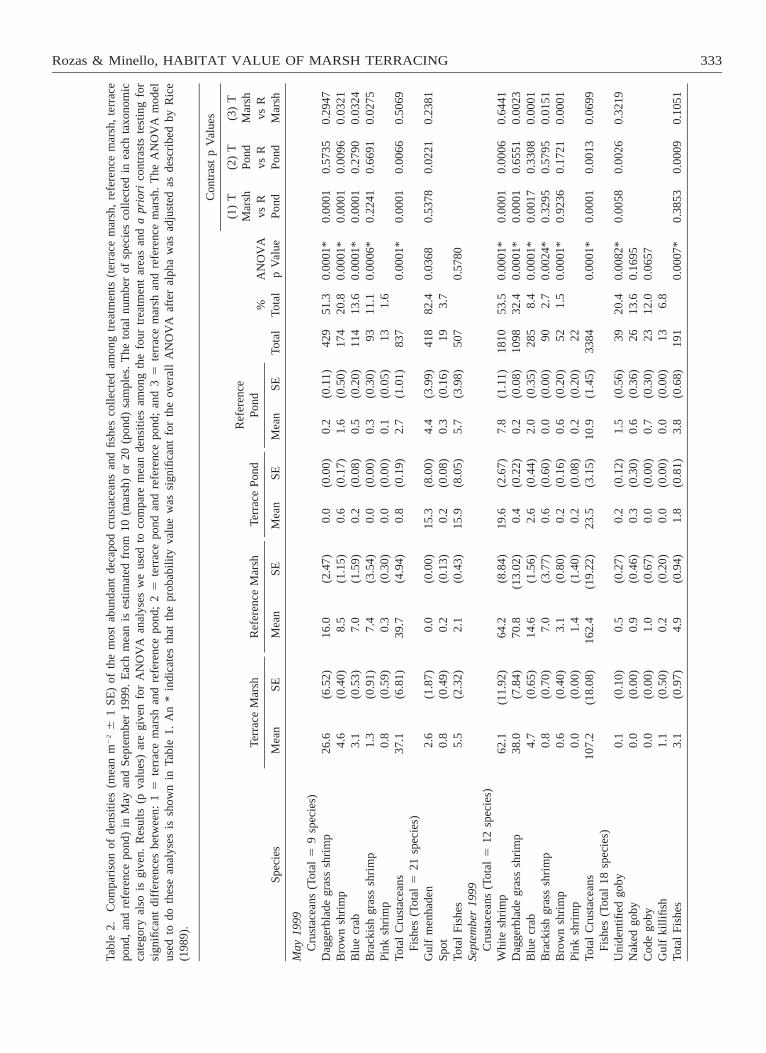
Figure 4. Comparison of hypothetical 1-ha terrace field and reference pond in May and September 1999 using estimatedstanding crop (total biomass of organisms, kg) of selected species. Animal biomasses used in the calculations are meansdetermined from sample collections in each habitat type (terrace marsh and terrace pond, reference pond). Design of the terracefield in this comparison is based on the marsh terraces in our study area where marsh and ponds occupy 21% and 79% of thetotal area, respectively.
supported much greater biomasses than the referencepond for most species. Exceptions were brown shrimp(mean biomass in terrace field and reference pond wassimilar in May) and spotted seatrout (not collected ineither terrace habitat type in September).
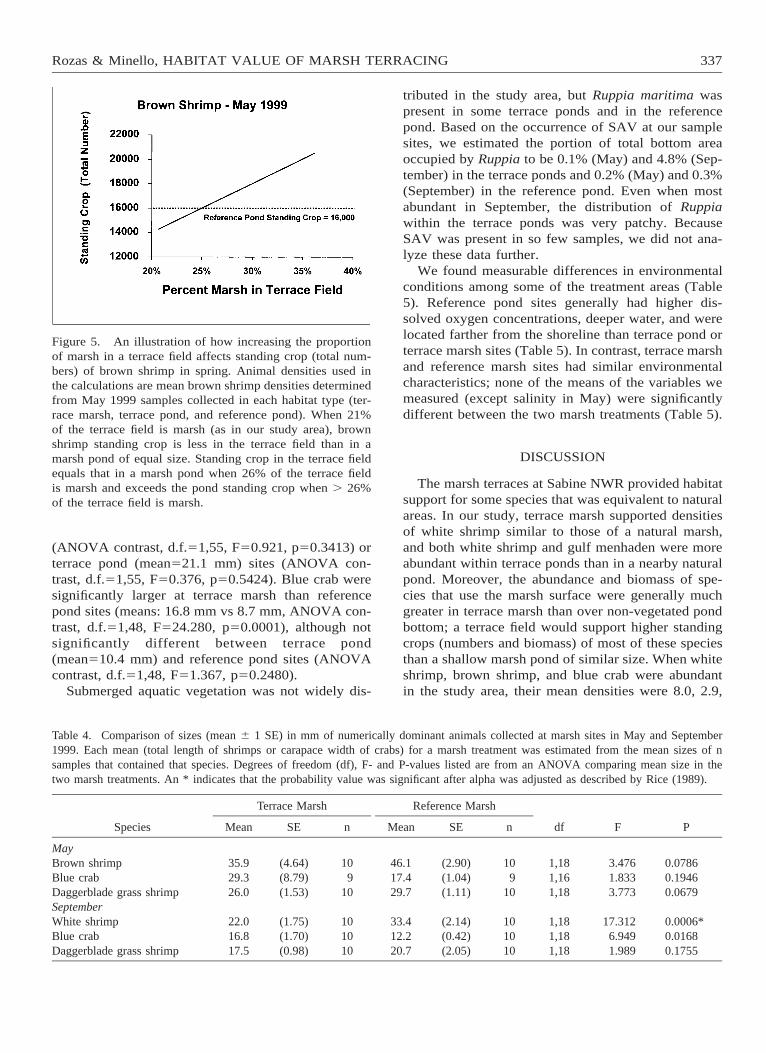
Our results indicate that redesigning terrace fields toincrease the proportion of emergent marsh can enhancestanding crops of species that select for marsh vege-tation. Our estimate of brown shrimp standing crop inMay was slightly lower in 1 ha of Sabine terrace fieldthan in a marsh pond of equal size (Figures 3 and 5).When we simulated the effect of changing the area ofmarsh in a terrace field, we found that increasing themarsh area from 21% to 26% increased the standingcrop of brown shrimp to the level of the marsh pond(Figure 5).
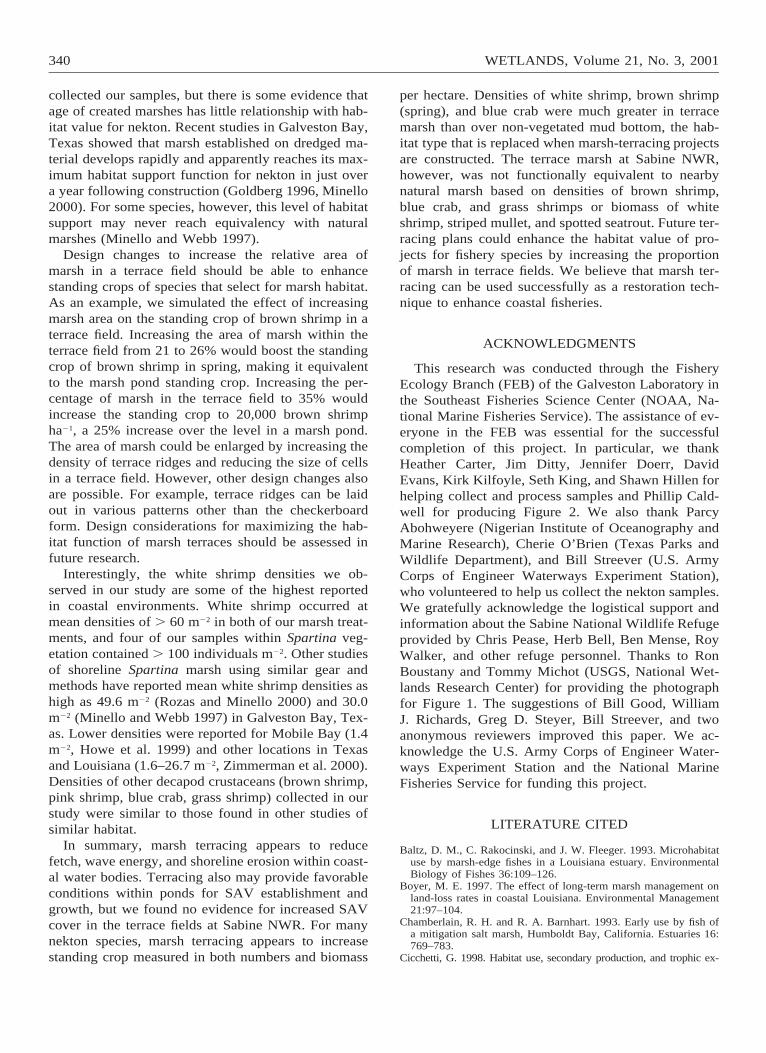
Few of the species we tested differed in size amongtreatments. Within marsh treatments for September,white shrimp were significantly larger in the referencemarsh, whereas blue crab were larger in the terracemarsh (Table 4). Most species were taken too infre-quently in terrace ponds and the reference pond to in-clude these treatments in the size analysis. However,brown shrimp were abundant enough in the referencepond in May, and white shrimp and blue crab werecollected frequently enough in both terrace ponds andthe reference pond in September for analysis. In May,brown shrimp did not differ significantly in size amongtreatment areas (ANOVA, d.f.52,30, F51.677,p50.2039). In September, the mean size (20.1 mm) ofwhite shrimp at reference pond sites was not signifi-cantly different from those at either terrace marsh
Rozas & Minello, HABITAT VALUE OF MARSH TERRACING 337
Figure 5. An illustration of how increasing the proportionof marsh in a terrace field affects standing crop (total num-bers) of brown shrimp in spring. Animal densities used inthe calculations are mean brown shrimp densities determinedfrom May 1999 samples collected in each habitat type (ter-race marsh, terrace pond, and reference pond). When 21%of the terrace field is marsh (as in our study area), brownshrimp standing crop is less in the terrace field than in amarsh pond of equal size. Standing crop in the terrace fieldequals that in a marsh pond when 26% of the terrace fieldis marsh and exceeds the pond standing crop when . 26%of the terrace field is marsh.
Table 4. Comparison of sizes (mean 6 1 SE) in mm of numerically dominant animals collected at marsh sites in May and September1999. Each mean (total length of shrimps or carapace width of crabs) for a marsh treatment was estimated from the mean sizes of nsamples that contained that species. Degrees of freedom (df), F- and P-values listed are from an ANOVA comparing mean size in thetwo marsh treatments. An * indicates that the probability value was significant after alpha was adjusted as described by Rice (1989).
Species
Terrace Marsh
Mean SE n
Reference Marsh
Mean SE n df F P
MayBrown shrimpBlue crabDaggerblade grass shrimp
35.929.326.0
(4.64)(8.79)(1.53)
109
10
46.117.429.7
(2.90)(1.04)(1.11)
109
10
1,181,161,18
3.4761.8333.773
0.07860.19460.0679
SeptemberWhite shrimpBlue crabDaggerblade grass shrimp
22.016.817.5
(1.75)(1.70)(0.98)
101010
33.412.220.7
(2.14)(0.42)(2.05)
101010
1,181,181,18
17.3126.9491.989
0.0006*0.01680.1755
(ANOVA contrast, d.f.51,55, F50.921, p50.3413) orterrace pond (mean521.1 mm) sites (ANOVA con-trast, d.f.51,55, F50.376, p50.5424). Blue crab weresignificantly larger at terrace marsh than referencepond sites (means: 16.8 mm vs 8.7 mm, ANOVA con-trast, d.f.51,48, F524.280, p50.0001), although notsignificantly different between terrace pond(mean510.4 mm) and reference pond sites (ANOVAcontrast, d.f.51,48, F51.367, p50.2480).
Submerged aquatic vegetation was not widely dis-
tributed in the study area, but Ruppia maritima waspresent in some terrace ponds and in the referencepond. Based on the occurrence of SAV at our samplesites, we estimated the portion of total bottom areaoccupied by Ruppia to be 0.1% (May) and 4.8% (Sep-tember) in the terrace ponds and 0.2% (May) and 0.3%(September) in the reference pond. Even when mostabundant in September, the distribution of Ruppiawithin the terrace ponds was very patchy. BecauseSAV was present in so few samples, we did not ana-lyze these data further.
We found measurable differences in environmentalconditions among some of the treatment areas (Table5). Reference pond sites generally had higher dis-solved oxygen concentrations, deeper water, and werelocated farther from the shoreline than terrace pond orterrace marsh sites (Table 5). In contrast, terrace marshand reference marsh sites had similar environmentalcharacteristics; none of the means of the variables wemeasured (except salinity in May) were significantlydifferent between the two marsh treatments (Table 5).
DISCUSSION
The marsh terraces at Sabine NWR provided habitatsupport for some species that was equivalent to naturalareas. In our study, terrace marsh supported densitiesof white shrimp similar to those of a natural marsh,and both white shrimp and gulf menhaden were moreabundant within terrace ponds than in a nearby naturalpond. Moreover, the abundance and biomass of spe-cies that use the marsh surface were generally muchgreater in terrace marsh than over non-vegetated pondbottom; a terrace field would support higher standingcrops (numbers and biomass) of most of these speciesthan a shallow marsh pond of similar size. When whiteshrimp, brown shrimp, and blue crab were abundantin the study area, their mean densities were 8.0, 2.9,
338 WETLANDS, Volume 21, No. 3, 2001
Tabl
e5.
Env
iron
men
tal
char
acte
rist
ics
oftr
eatm
ent
area
s.M
ean
and
(1SE
)ar
egi
ven
for
vari
able
sm
easu
red
inm
arsh
vege
tatio
nan
dov
erno
n-ve
geta
ted
botto
mat
terr
ace
and
refe
renc
ear
eas
sam
pled
inM
ayan
dSe
ptem
ber
1999
.E
ach
mea
nis
estim
ated
from
10m
arsh
site
sor
20sa
mpl
esta
ken
inte
rrac
eor
refe
renc
epo
nds
(exc
ept
Oxy
gen
inM
ay:
Terr
ace
mar
sh5
6,R
efer
ence
mar
sh5
4,Te
rrac
epo
nd5
9,an
dR
efer
ence
pond
59)
.R
esul
ts(p
valu
es)
are
give
nfo
rA
NO
VA
anal
yses
we
used
toco
mpa
rem
eans
amon
gth
efo
urtr
eatm
ent
area
s(e
xcep
tco
mpa
riso
nsfo
rst
emde
nsity
are
betw
een
terr
ace
mar
shan
dre
fere
nce
mar
shon
ly)
and
apr
iori
cont
rast
ste
stin
gfo
rsi
gnifi
cant
diff
eren
ces
betw
een:
15
terr
ace
mar
shan
dre
fere
nce
pond
;2
5te
rrac
epo
ndan
dre
fere
nce
pond
;an
d3
5te
rrac
em
arsh
and
refe
renc
em
arsh
.T
heA
NO
VA
mod
elus
edto
doth
ean
alys
esis
show
nin
Tabl
e1.
An
*in
dica
tes
prob
abili
tyva
lue
was
sign
ifica
ntfo
rth
eov
eral
lA
NO
VA
afte
ral
pha
was
adju
sted
asde
scri
bed
byR
ice
(198
9).
Var
iabl
e
Terr
ace
Mar
sh
Mea
nSE
Ref
eren
ceM
arsh
Mea
nSE
Terr
ace
Pond
Mea
nSE
Ref
eren
cePo
nd
Mea
nSE
AN
OV
Ap
Val
ue
Con
tras
tp
Val
ues
(1)
TM
arsh
vsR
Pond
(2)
TPo
ndvs
RPo
nd(3
)T
Mar
shvs
RM
arsh
May
SAL
INIT
Y(‰
)O
XY
GE
N(p
pm)
WA
TE
RT
EM
PER
AT
UR
E(8
C)
16.8 4.8
24.4
(0.1
3)(0
.64)
(0.5
2)
15.4 5.0
25.5
(0.4
5)(0
.52)
(0.6
6)
16.8 5.1
24.8
(0.1
4)(0
.37)
(0.3
9)
15.8 6.8
24.6
(0.1
6)(0
.04)
(0.3
9)
0.00
01*
0.00
19*
0.54
85
0.00
160.
0011
0.00
030.
0012
0.00
030.
7851
WA
TE
RD
EPT
H(c
m)
TU
RB
IDIT
Y(F
TU
)D
IST
AN
CE
TO
ED
GE
(m)
STE
MD
EN
SIT
Y(s
tem
sm
22 )
33.3
48.0 0.7
74
(2.1
7)(1
1.25
)(0
.06)
(11.
2)
33.6
39.5 0.8
66
(2.3
5)(1
4.99
)(0
.08)
(8.0
)
46.7
34.4
10.5
(1.0
0)(6
.96)
(1.5
0)
56.6
68.8
23.3
(2.3
8)(1
2.27
)(2
.99)
0.00
01*
0.09
060.
0001
*0.
5580
0.00
01
0.00
01
0.00
02
0.00
01
0.93
22
0.98
17
Sept
embe
rSA
LIN
ITY
(‰)
OX
YG
EN
(ppm
)W
AT
ER
TE
MPE
RA
TU
RE
(8C
)
26.0 5.8
30.6
(0.3
7)(0
.56)
(0.4
2)
27.4 7.2
31.2
(0.4
3)(0
.38)
(0.3
5)
25.9 6.0
31.5
(0.2
4)(0
.45)
(0.6
7)
26.8 7.7
32.2
(0.3
5)(0
.20)
(0.3
6)
0.01
390.
0029
*0.
2478
0.14
620.
0036
0.03
460.
0013
0.02
060.
0590
WA
TE
RD
EPT
H(c
m)
TU
RB
IDIT
Y(F
TU
)D
IST
AN
CE
TO
ED
GE
(m)
STE
MD
EN
SIT
Y(s
tem
sm
22 )
15.3
32.1 0.1
110
(2.1
5)(1
2.87
)(0
.10)
(13.
9)
18.2
28.6 0.2
101
(1.5
3)(1
3.09
)(0
.11)
(20.
7)
22.4
16.8
11.1
(1.0
9)(2
.35)
(1.1
1)
36.3
15.7
23.7
(1.0
4)(1
.90)
(3.1
9)
0.00
01*
0.22
320.
0001
*0.
7316
0.00
01
0.00
01
0.00
01
0.00
01
0.21
43
0.97
98

Rozas & Minello, HABITAT VALUE OF MARSH TERRACING 339
and 2.4 times greater, respectively, in terrace marshvegetation than in the reference pond. Because ourstudy only examined one terrace field in comparisonto one reference pond, it was not possible to examinevariability among terrace fields and reference ponds.This problem with pseudoreplication (Hurlbert 1984)is not uncommon in assessments of created wetlands(Minello and Zimmerman 1992, Streever 2000). How-ever, as documented in numerous studies elsewhere(Zimmerman and Minello 1984, Minello et al. 1994,Cicchetti 1998, Howe et al. 1999, Minello 1999, Rozasand Zimmerman 2000), penaeid shrimps and blue crabare strongly attracted to shoreline vegetation. Most ofthese species should clearly benefit by replacing someshallow, non-vegetated bottom with marsh terraces inestuaries where the area of emergent marsh has de-creased and restoration by marsh terracing is practical.
Marsh terraces constructed in non-vegetated areasshould provide animals with protection from largepredators by adding vegetation structure in the formof emergent marsh on terrace ridges and, perhaps, byfacilitating the growth of SAV within terrace ponds.Both emergent vegetation and submerged aquaticshave been shown to reduce predation rates on speciescollected in our study (Heck and Thoman 1981, Mi-nello and Zimmerman 1983, Wilson et al. 1987, 1990,Rozas and Odum 1988, Minello et al. 1989, Minello1993). Although SAV was not widely distributed with-in the terrace ponds when we sampled the sites at Sa-bine NWR, Ruppia may be more widespread there atother times.
Local sediment processes also may be affected bythe presence of terrace fields. Initial data collected atSabine NWR indicated that turbidity was reducedwithin the terrace ponds compared with surroundingopen-water areas (Underwood et al. 1991); results ofextended monitoring, however, did not show a signif-icant reduction in turbidity levels within the terraceponds (LDNR 1993). In our study, the mean turbiditylevel in terrace ponds was about half that of the ref-erence pond in May, but turbidity levels were not sig-nificantly different among treatments. In September,turbidity levels in ponds and the reference area werelow and very similar. Some evidence for accretionwithin terrace ponds was reported initially, but sub-sequent and more-detailed analyses were inconclusivebecause most of the feldspar plots placed in the areato measure sediment accretion could not be located(LDNR 1993). Accretion rates do not appear to havebeen high enough to facilitate expansion of Spartinaacross the terrace ponds, and we saw no evidence thatemergent vegetation will eventually cover the ponds.Initial monitoring of the Sabine NWR terracing didshow that the terraces reduced fetch, wave height, and
shoreline retreat within the terraced marsh ponds(LDNR 1993).
The Spartina marsh established on terrace levees atSabine NWR was not functionally equivalent to anadjacent natural marsh, even after 9 years of devel-opment. In our study, the terrace marsh supportedbrown shrimp, blue crab, daggerblade grass shrimp (inSeptember), and brackish grass shrimp at densitiesabout half or less those of the nearby natural marsh.Moreover, more striped mullet (May), white shrimp(September), and spotted seatrout (September) bio-mass was present in the natural marsh than in the ter-race marsh. Similarly, densities of daggerblade grassshrimp and juvenile brown shrimp were significantlyless in marshes constructed on dredged material thanin natural marshes in Texas (Minello and Zimmerman1992). In a more extensive study of 10 created marshesand five natural marshes in Galveston Bay, Minelloand Webb (1997) reported that densities of brownshrimp, blue crab, and white shrimp in created marsheswere only 25–40%, 5–56%, and 59%, respectively, ofthose in natural marshes. Interestingly, when they re-peated the comparison for white shrimp after removingdata from created marshes with relatively high surfaceelevations and low flooding duration, densities be-tween created marshes and natural marshes were notsignificantly different (Minello and Webb 1997). Thischange did not occur for brown shrimp and blue crab;densities of these two species were still significantlygreater in natural marshes even when the high-eleva-tion created marshes were removed from the analysis.Perhaps white shrimp will use created marsh as readilyas natural marsh when the marsh is constructed at anelevation similar to natural marsh. Results from otherstudies suggest that marsh surface elevation can influ-ence habitat use by white shrimp and other species(Rozas and Reed 1993, Rozas and Zimmerman 2000).In our study, terrace marsh and reference marsh siteswere similar in mean water depth, and mean densitiesof white shrimp in these two habitat types were nearlyequal. Measures of water depth in our study are a goodproxy for relative elevation because tidal fluctuationswere low and our samples of the two marsh types wereinterspersed in time.
Comparisons of animal size between natural andcreated marshes may indicate differences in growthrates and habitat quality. Minello and Webb (1997)suggested that grass shrimp may have been smaller increated marshes due to inadequate food supply in thesemarshes. In our study, we detected few differences inthe mean size of animals between the terrace marshand the reference marsh. White shrimp, however, weresignificantly smaller in terrace marsh than naturalmarsh.
The terrace marsh was about 9 years old when we
340 WETLANDS, Volume 21, No. 3, 2001
collected our samples, but there is some evidence thatage of created marshes has little relationship with hab-itat value for nekton. Recent studies in Galveston Bay,Texas showed that marsh established on dredged ma-terial develops rapidly and apparently reaches its max-imum habitat support function for nekton in just overa year following construction (Goldberg 1996, Minello2000). For some species, however, this level of habitatsupport may never reach equivalency with naturalmarshes (Minello and Webb 1997).
Design changes to increase the relative area ofmarsh in a terrace field should be able to enhancestanding crops of species that select for marsh habitat.As an example, we simulated the effect of increasingmarsh area on the standing crop of brown shrimp in aterrace field. Increasing the area of marsh within theterrace field from 21 to 26% would boost the standingcrop of brown shrimp in spring, making it equivalentto the marsh pond standing crop. Increasing the per-centage of marsh in the terrace field to 35% wouldincrease the standing crop to 20,000 brown shrimpha21, a 25% increase over the level in a marsh pond.The area of marsh could be enlarged by increasing thedensity of terrace ridges and reducing the size of cellsin a terrace field. However, other design changes alsoare possible. For example, terrace ridges can be laidout in various patterns other than the checkerboardform. Design considerations for maximizing the hab-itat function of marsh terraces should be assessed infuture research.
Interestingly, the white shrimp densities we ob-served in our study are some of the highest reportedin coastal environments. White shrimp occurred atmean densities of . 60 m22 in both of our marsh treat-ments, and four of our samples within Spartina veg-etation contained . 100 individuals m22. Other studiesof shoreline Spartina marsh using similar gear andmethods have reported mean white shrimp densities ashigh as 49.6 m22 (Rozas and Minello 2000) and 30.0m22 (Minello and Webb 1997) in Galveston Bay, Tex-as. Lower densities were reported for Mobile Bay (1.4m22, Howe et al. 1999) and other locations in Texasand Louisiana (1.6–26.7 m22, Zimmerman et al. 2000).Densities of other decapod crustaceans (brown shrimp,pink shrimp, blue crab, grass shrimp) collected in ourstudy were similar to those found in other studies ofsimilar habitat.
In summary, marsh terracing appears to reducefetch, wave energy, and shoreline erosion within coast-al water bodies. Terracing also may provide favorableconditions within ponds for SAV establishment andgrowth, but we found no evidence for increased SAVcover in the terrace fields at Sabine NWR. For manynekton species, marsh terracing appears to increasestanding crop measured in both numbers and biomass
per hectare. Densities of white shrimp, brown shrimp(spring), and blue crab were much greater in terracemarsh than over non-vegetated mud bottom, the hab-itat type that is replaced when marsh-terracing projectsare constructed. The terrace marsh at Sabine NWR,however, was not functionally equivalent to nearbynatural marsh based on densities of brown shrimp,blue crab, and grass shrimps or biomass of whiteshrimp, striped mullet, and spotted seatrout. Future ter-racing plans could enhance the habitat value of pro-jects for fishery species by increasing the proportionof marsh in terrace fields. We believe that marsh ter-racing can be used successfully as a restoration tech-nique to enhance coastal fisheries.
ACKNOWLEDGMENTS
This research was conducted through the FisheryEcology Branch (FEB) of the Galveston Laboratory inthe Southeast Fisheries Science Center (NOAA, Na-tional Marine Fisheries Service). The assistance of ev-eryone in the FEB was essential for the successfulcompletion of this project. In particular, we thankHeather Carter, Jim Ditty, Jennifer Doerr, DavidEvans, Kirk Kilfoyle, Seth King, and Shawn Hillen forhelping collect and process samples and Phillip Cald-well for producing Figure 2. We also thank ParcyAbohweyere (Nigerian Institute of Oceanography andMarine Research), Cherie O’Brien (Texas Parks andWildlife Department), and Bill Streever (U.S. ArmyCorps of Engineer Waterways Experiment Station),who volunteered to help us collect the nekton samples.We gratefully acknowledge the logistical support andinformation about the Sabine National Wildlife Refugeprovided by Chris Pease, Herb Bell, Ben Mense, RoyWalker, and other refuge personnel. Thanks to RonBoustany and Tommy Michot (USGS, National Wet-lands Research Center) for providing the photographfor Figure 1. The suggestions of Bill Good, WilliamJ. Richards, Greg D. Steyer, Bill Streever, and twoanonymous reviewers improved this paper. We ac-knowledge the U.S. Army Corps of Engineer Water-ways Experiment Station and the National MarineFisheries Service for funding this project.
LITERATURE CITED
Baltz, D. M., C. Rakocinski, and J. W. Fleeger. 1993. Microhabitatuse by marsh-edge fishes in a Louisiana estuary. EnvironmentalBiology of Fishes 36:109–126.
Boyer, M. E. 1997. The effect of long-term marsh management onland-loss rates in coastal Louisiana. Environmental Management21:97–104.
Chamberlain, R. H. and R. A. Barnhart. 1993. Early use by fish ofa mitigation salt marsh, Humboldt Bay, California. Estuaries 16:769–783.
Cicchetti, G. 1998. Habitat use, secondary production, and trophic ex-
Rozas & Minello, HABITAT VALUE OF MARSH TERRACING 341
port by salt marsh nekton in shallow water. Ph.D. Dissertation. TheCollege of William and Mary in Virginia, Williamsburg, VA, USA.
Delaney, T. P., J. W. Webb, and T. J. Minello. 2000. Comparisonof physical characteristics between created and natural estuarinemarshes in Galveston Bay, Texas. Wetlands Ecology and Man-agement 8:343–352.
Gilmore, R. G., D. W. Cooke, and C. J. Donohoe. 1982. A com-parison of the fish populations and habitat in open and closed saltmarsh impoundments in east-central Florida. Northeast Gulf Sci-ence 5:25–37.
Goldberg, A. R. 1996. Development of infaunal populations andbelow-ground organic matter from three created Spartina alter-niflora marshes in Galveston Bay, Texas. M.S. Thesis. TexasA&M University, College Station, TX, USA.
Heck, K. L. and T. A. Thoman. 1981. Experiments on predator-preyinteractions in vegetated aquatic habitats. Journal of ExperimentalMarine Biology and Ecology 53:125–134.
Howe, J. C., R. K. Wallace, and F. S. Rikard. 1999. Habitat utili-zation by postlarval and juvenile penaeid shrimps in Mobile Bay,Alabama. Estuaries 22:971–979.
Hurlbert, S. H. 1984. Pseudoreplication and the design of ecologicalfield experiments. Ecological Monographs 54:187–211.
Kamps, L. F. 1962. Mud Distribution and Land Reclamation in theEastern Wadden Shallows. Rijkswaterstaad Communications, TheHague, The Netherlands.
Kneib, R. T. 1997. The role of tidal marshes in the ecology ofestuarine nekton. Oceanography and Marine Biology: an AnnualReview 35:163–220.
LDNR. 1993. Sabine Terracing Project Final Report. Coastal Res-toration Division, Louisiana Department of Natural Resources,Baton Rouge, LA, USA. DNR Project No. 4351089.
McGovern, J. C. and C. A. Wenner. 1990. Seasonal recruitment oflarval and juvenile fishes into impounded and non-impoundedmarshes. Wetlands 10:203–221.
Meyer, D. L., M. S. Fonseca, V. G. Thayer, W. J. Kenworthy, andD. R. Colby. 1993. Faunal use of restored marsh and seagrasshabitat. p. 1858–1863. In O.T. Magoon, H. Converse, D. Miner,L. T. Tobin, and D. Clark (eds.) Coastal Zone ’93, Vol 4. Pro-ceedings of the 8th symposium on coastal ocean management.American Society of Civil Engineers, New York, NY, USA.
Minello, T. J. 1993. Chronographic tethering: a technique for mea-suring prey survival time and testing predation pressure in aquatichabitats. Marine Ecology Progress Series 101:99–104.
Minello, T. J. 1999. Nekton densities in shallow estuarine habitatsof Texas and Louisiana and the identification of Essential FishHabitat. p. 43–75. In L. Benaka (ed.) Fish Habitat: Essential FishHabitat and Habitat Rehabilitation. American Fisheries SocietySymposium 22, Bethesda, MD, USA.
Minello, T. J. 2000. Temporal development of salt marsh value fornekton and epifauna: utilization of dredged material marshes in Gal-veston Bay, Texas. Wetlands Ecology and Management 8:327–341.
Minello, T. J. and J. W. Webb Jr. 1997. Use of natural and createdSpartina alterniflora salt marshes by fishery species and otheraquatic fauna in Galveston Bay, Texas, USA. Marine EcologyProgress Series 151:165–179.
Minello, T. J. and R. J. Zimmerman. 1983. Fish predation on ju-venile brown shrimp, Penaeus aztecus Ives: the effect of simulatedSpartina structure on predation rates. Journal of Experimental Ma-rine Biology and Ecology 72:211–231.
Minello, T. J. and R. J. Zimmerman. 1992. Utilization of naturaland transplanted Texas salt marshes by fish and decapod crusta-ceans. Marine Ecology Progress Series 90:273–285.
Minello, T. J., R. J. Zimmerman, and E. X. Martinez. 1989. Mor-tality of young brown shrimp Penaeus aztecus in estuarine nurs-eries. Transactions of the American Fisheries Society 118:693–708.
Minello, T. J., R. J. Zimmerman, and R. Medina. 1994. The impor-tance of edge for natant macrofauna in a created salt marsh. Wet-lands 14:184–198.
Mitsch, W. J. and J. G. Gosselink. 1986. Wetlands. Van NostrandReinhold Company Inc., New York, NY, USA.
Moy, L. D. and L. A. Levin. 1991. Are Spartina marshes a replace-able resource? A functional approach to evaluation of marsh cre-ation efforts. Estuaries 14:1–16.
Orlando, S. P. Jr, L. P. Rozas, G. H. Ward, and C. J. Klein. 1993.Salinity characteristics of Gulf of Mexico estuaries. NOAA Officeof Ocean Resources Conservation and Assessment, Silver Spring,MD, USA.
Peck, M. A., P. E. Fell, E. A. Allen, J. A. Gieg, C. R. Guthke, andM. D. Newkirk. 1994. Evaluation of tidal marsh restoration: com-parison of selected macroinvertebrate populations on a restoredimpounded valley marsh and an unimpounded valley marsh withinthe same salt marsh system in Connecticut, USA. EnvironmentalManagement 18:283–293.
Perez-Farfante, I. and B. Kensley. 1997. Penaeoid and sergestoidshrimps and prawns of the world: Keys and diagnoses for thefamilies and genera. Memoires du Museum National d’HistorieNaturelle, Tome 175, Paris, France.
Rey, J. R., J. Shaffer, D. Tremain, R. A. Crossman, and T. Kain.1990. Effects of re-establishing tidal connections in two impound-ed subtropical marshes on fishes and physical conditions. Wet-lands 10:27–45.
Rice, W. R. 1989. Analyzing tables of statistical tests. Evolution 43:223–225.
Rogers, D. R., B. D. Rogers, and W. H. Herke. 1994. Structuralmarsh management effects on coastal fishes and crustaceans. En-vironmental Management 18:351–369.
Rozas, L. P. and T. J. Minello. 1997. Estimating densities of smallfishes and decapod crustaceans in shallow estuarine habitats: areview of sampling design with focus on gear selection. Estuaries20:199–213.
Rozas, L. P. and T. J. Minello. 1998. Nekton use of salt marsh,seagrass, and nonvegetated habitats in a South Texas (USA) es-tuary. Bulletin of Marine Science 63:481–501.
Rozas, L. P. and T. J. Minello. 1999. Effects of structural marsh man-agement on fishery species and other nekton before and during aspring drawdown. Wetlands Ecology and Management 7:121–139.
Rozas, L. P. and W. E. Odum. 1988. Occupation of submergedaquatic vegetation by fishes: testing the roles of food and refuge.Oecologia 77:101–106.
Rozas, L. P. and D. J. Reed. 1993. Nekton use of marsh-surfacehabitats in Louisiana (USA) deltaic salt marshes undergoing sub-mergence. Marine Ecology Progress Series 96:147–157.
Rozas, L. P. and R. J. Zimmerman. 2000. Small-scale patterns ofnekton use among marsh and adjacent shallow nonvegetated areasof the Galveston Bay Estuary, Texas (USA). Marine Ecology Pro-gress Series 193:217–239.
Streever, W. 2000. Spartina alterniflora marshes on dredged mate-rial: a critical review of the ongoing debate over success. WetlandsEcology and Management 8:295–316.
Underwood, S. G., G. D. Steyer, B. Good, and D. Chambers. 1991.Bay bottom terracing and vegetative planting: an innovative ap-proach for habitat and water quality enhancement. p. 164–173. InF. J. Webb, Jr. (ed.) Annual Conference on Wetlands Restorationand Creation. Hillsborough Community College, Tampa, FL, USA.
U.S. Department of Commerce. 1998. Tide tables 1999 (high and lowwater predictions) east coast of North and South America, includingGreenland. NOAA National Ocean Service, Rockville, MD, USA.
Wilson, K. A., K. W. Able, and K. L. Heck. 1990. Predation rateson juvenile blue crabs in estuarine nursery habitats: evidence forthe importance of macroalgae (Ulva lactuca). Marine EcologyProgress Series 58:243–251.
Wilson, K. A., K. L. Heck, and K. W. Able. 1987. Juvenile bluecrab, Callinectes sapidus, survival: an evaluation of eelgrass, Zos-tera marina, as refuge. Fishery Bulletin, US 85:53–58.
Zimmerman, R. J. and T. J. Minello. 1984. Densities of Penaeusaztecus, Penaeus setiferus, and other natant macrofauna in a Texassalt marsh. Estuaries 7:421–433.
Zimmerman, R. J., T. J. Minello, and L. P. Rozas. 2000. Salt marshlinkages to productivity of penaeid shrimps and blue crabs in thenorthern Gulf of Mexico. p. 293–314. In M. P. Weinstein and D.A. Kreeger (eds.) Concepts and controversies in tidal marsh ecol-ogy. Kluwer Academic Publishers, The Netherlands.
Zimmerman, R. J., T. J. Minello, and G. Zamora. 1984. Selectionof vegetated habitat by brown shrimp, Penaeus aztecus, in a Gal-veston Bay salt marsh. Fishery Bulletin, US 82:325–336.
Manuscript received 10 October 2000; revisions received 12 March2001; accepted 20 April 2001.