martian atmospheric effects on radio wave
TRANSCRIPT

MARTIAN ATMOSPHERIC EFFECTS ON RADIO WAVE PROPAGATION
C. M. Ho, M. K. Sue, and N. Golshan Jet Propulsion Laboratory, California Institute of Technology, Pasadena, CA, USA christian.ho@,ipl.nasa.gov
Because Mars has very low atmospheric pressure (less than 1% of Earth's), the Martian atmospheric radio refractivity is about two orders of magnitude smaller than that of Earth. Ray bending effect on microwave is not obvious. The optical depths of Martian clouds and fogs are about 1 .O at visual wavelengths. In the limiting case, the Martian clouds are expected to be similar to terrestrial high-level cirrus clouds. The total attenuation due to Martian clouds, fog and aerosols should be less than 0.3 dB at Ka-band. Dust storms in Mars can significantly affect a communication link. A large dust storm can cause at least a 3-dB loss at Ka-band. Most large storms occur in the southern hemisphere during later spring and early summer. The Martian atmospheric gaseous attenuation at Ka-band is less than 1 dB due to very low concentrations of gaseous H20 and 0 2 . Martian gaseous absorption is at least three orders of magnitude lower than at Earth. Radio noise emissions at Mars are'mainly from its atmospheric emission and surface noise. For a downward-looking antenna, the total noise temperature is about the same as the Earth's for all frequency bands of interest. For an upward looking antenna, the sky noise temperature is the highest at UHF (about 55 K) and lowest at X- and Ka-band (about 5 K). The sky noise temperature, however, is only a small part the total receiving-system noise temperature, which is dominated by receiver thermal noise.
1. Martian Atmospheric (Tropospheric) Refractivity and Cloud Optical
Depths
Based on measurements of Martian atmospheric pressure and temperature, calculated
refractivity profile can be fitted using a function
N(h) = No exp(-h I HN)
where No (3.9 N unit) is the surface value of N when altitude h = 0, and HN (1 1 .O km) is
the refractivity scale height. The refractive index of the Martian troposphere at the
surface is about two orders of magnitude smaller than that of Earth. Even though the
Martian tropospheric radio refractivity has a small value, it can still cause ray bending
1

and multipath effects. Only when the wave angle is very close (p < 0.3) to the horizontal,
can the wave ray be trapped by a horizontal duct. Because Mars is only about half the
size of Earth and because Mars has a larger surface curvature than Earth, it is expected
that the signals reflected at Mars surface will have a greater defocussing loss.
Tropospheric scintillation caused by the refiaction index variation fluctuations in Martian
troposphere should be only about 0.5% of that in the Earth atmosphere, if temperature
fluctuation is the same for Mars and Earth.
Midlatitude Martian Atmospheric Model
(Left) The atmospheric density profiles derived from the Mars Pathfinder accelerometer data. Results from the VL-1 atmospheric structure instrument (ASI) and the Viking 1 upper atmosphere mass spectrometer (UAMS) are also plotted for comparison. (Right) The atmospheric temperature profiles derived from the Pathfinder measurements and from the VL-1 ASI, UAMS experiments, and the CO, condensation. The surface density and temperature measured by the Pathfinder MET instrument (oval) are also shown.
Radio Refractivity:
N = ( n - 1 ) x 1 O 6 = 7 7 . 6 P / T (Nunit)
2

where n is refiactive index. Ray bending curvature C
1 dn dn dN C="" n dh dh dh
for low elevation angle (p> propagation.
cosp =-- =--
1 horizontal
A cartoon showing how low elevation angle incident wave is bended.
- - - ReMvi ty N, based on MGS Measurement - Model fitting using N = 3.9 exp ( 4 1 1 .O)
2 3 4 5 6 7 0 9 0.1 1
N, Radio Refractivity (N units)
Radio refractivity for Martian atmosphere. Dry air pressure and temperature profiles are used for the refractivity calculation.
Martian Clouds and Fogs:
Although not as pronounced as on Earth, clouds are a common feature on Mars. The
Martian atmosphere has only a trace of water vapor; however, the temperature and
pressure are such that the atmosphere is usually close to saturation and produces clouds.
Even fiom Earth-based telescopes, clouds have been observed by transient brightening on
3

the surface of Mars. Numerous cloud patterns have been seen from the Mariner and
Viking spacecraft and have been classified into various categories. The optical depths of
Martian clouds and fogs are small (- 1.0 at visual wavelengths). Ice depolarization
effects due to Martian clouds on radio waves are still unknown, but they are expected to
be small because of the lower optical depth and the thinner cloud layer. Attenuation due
to clouds and fog depends largely on their water contents. So far we have little
knowledge because direct cloud measurements are not yet available. However, Martian
clouds are expected to have relatively less water liquid content because the clouds have a
small optical depth. Martian aerosol attenuation effect on radio wave propagation is
smaller than that of the Martian clouds .
In general, the Martian atmospheric environment is quite good for optical
communications because of its thinner atmosphere, except during dust storms because the
optical depth of Martian clouds is only one fifth of Earth clouds. Martian aerosols can
cause some attenuation to laser beams; however, this effect is very small compared with
that of aerosols at Earth.
Optical Depths of Clouds and Fogs on Earth and Mars* (at Visual Wavelengths) I I Atmospheric
Condition
++id- covera e
~ places Aerosol
rovided rovided
Storms provided provided
*Adapted from Annis [ 19871
Ma Optical Depth
-1 .o
-0.001 -1 .o -0.2 -1 .o
~~
0.5
10.0
rs Distribution Winter polar; behind high places Many places Winter polar Morning
Valleys & crater bottoms
Everywhere
Southern Hemisphere or global

2. Communication Blackout during Martian Atmosphere Entry Phase
During spacecraft atmospheric entry, signal transmissions will be significantly degraded
(blackout). A 30-second communication disruption at X-band occurred during Mars
Pathfinder decent was probably caused by plasmasheath blackout. The main cause of
blackout is reflection or absorption of electromagnetic wave energy at all communication
frequencies (f> lower than the local plasma frequency G), where& (MHz) = 9.0 x
N1’2 ( ~ m - ~ ) . For f < fp a plasma behaves like a conductor, while for f > fp the plasma is
practically transparent. The critical plasma densities for various frequencies of signals
from UHF to Ka band are listed below.
Critical Plasma Densities and Communication Frequencies Signal UHF S-band X-band Ka-band Frequency 381 MHz 2.295 GHz 8.43 GHz 32 GHz
I Plasma Density I 1 . 8 ~ 1 0 ~ ~ r n - ~ I 6 . 5 ~ 1 0 ’ ~ cm” I 8.8~10” cm-3 I I .27x1 013 cm” 1 Using this computer program and an isothermal Martian atmospheric density profile and
assuming the lander has an entry speed of 8.1 km/s, the electron density in the wake was
found with a peak value of about 3 ~ 1 0 ’ ~ ~ r n - ~ . This density is higher than critical density
for X-band communication and leads to a 10.2 sec communication blackout. A denser
atmosphere will generate a longer blackout duration. Two basic directions for reduction
of the problem are indicated: (1) Increase the signal frequency to a point where its value
is higher than the plasma frequency value (i.e., Ka band); (2) Reduce the plasma electron
density by modifying the plasma.

.
Propagation
7 I /0/ /
Diagrammed view of a blunt hypersonic spacecraft entering the Martian atmosphere. A plasmasheath generated around the capsule blacks out the communication signals.
Electron density caused by atmospheric impacting ionization for a shock velocity
between 4.0 and 9.0 km/s at stagnation and at the wake region of the capsule.
ne,s = 1.5 X 10 p
ne,s = 1.83 X 10 p 0.95~10*37 at wake region
10 0.95v11.8 at stagnation point
6

I I 1 I I I 1
Electron densities in the capsule wake region vs. time from entry for various entry velocities and for entry angle, yE=9O0.
I I I I I I
I I I I 1 I I -2Ooo -1500 -1 Ooo -500 0 500 loo0
FREQUENCY RATE, Hz/$
Tracking signals during Mars Pathfinder atmospheric entry phase. The plot shows the Doppler frequency peak ramp rate (i.e., signal derivative) vs. time for the peak deceleration event. There was a 30-s signal outage beginning at 17:03:20 UTC (1 100 sec past 16:45:00) (from Wood et al., 1998).
7
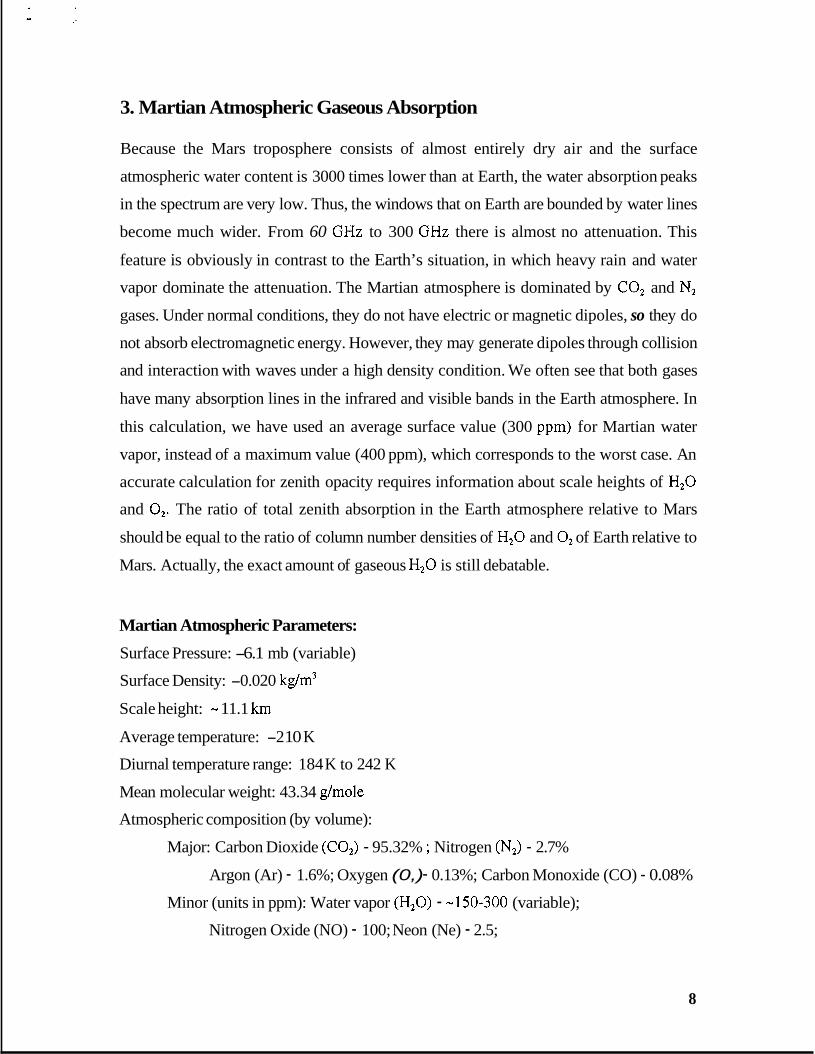
3. Martian Atmospheric Gaseous Absorption
Because the Mars troposphere consists of almost entirely dry air and the surface
atmospheric water content is 3000 times lower than at Earth, the water absorption peaks
in the spectrum are very low. Thus, the windows that on Earth are bounded by water lines
become much wider. From 60 GHz to 300 GHz there is almost no attenuation. This
feature is obviously in contrast to the Earth’s situation, in which heavy rain and water
vapor dominate the attenuation. The Martian atmosphere is dominated by CO, and N,
gases. Under normal conditions, they do not have electric or magnetic dipoles, so they do
not absorb electromagnetic energy. However, they may generate dipoles through collision
and interaction with waves under a high density condition. We often see that both gases
have many absorption lines in the infrared and visible bands in the Earth atmosphere. In
this calculation, we have used an average surface value (300 ppm) for Martian water
vapor, instead of a maximum value (400 ppm), which corresponds to the worst case. An
accurate calculation for zenith opacity requires information about scale heights of H,O
and 0,. The ratio of total zenith absorption in the Earth atmosphere relative to Mars
should be equal to the ratio of column number densities of H,O and 0, of Earth relative to
Mars. Actually, the exact amount of gaseous H,O is still debatable.
Martian Atmospheric Parameters:
Surface Pressure: -6.1 mb (variable)
Surface Density: -0.020 kg/m3
Scale height: - 1 1.1 km
Average temperature: -2 10 K
Diurnal temperature range: 184 K to 242 K
Mean molecular weight: 43.34 g/mole
Atmospheric composition (by volume):
Major: Carbon Dioxide (CO,) - 95.32% ; Nitrogen (N2) - 2.7%
Argon (Ar) - 1.6%; Oxygen (0,) - 0.13%; Carbon Monoxide (CO) - 0.08%
Minor (units in ppm): Water vapor (H,O) - -150-300 (variable);
Nitrogen Oxide (NO) - 100; Neon (Ne) - 2.5;
8

Hydrogen-Deuterium-Oxygen (HDO) - 0.85; Krypton (Kr) - 0.3;
Xenon (Xe) - 0.08, Ozone (0,) - 0.04 - 0.2.
where ppm is part(s) per million.
Surface Atmospheric Parameters at Mars and Earth
Planet density densip molecule perature pressure volume height (mb)
-11.1 2 . 1 ~ 1 0 ~ 2 . 8 5 ~ 1 0 ~ ~ 0.021 43.34 a/mole 210 6.1 Mars (km) ( m3/kmole) ( m-3) (kg/m ) weight (K)
PI HI scale Vm, mole N, number p, mass MI mean T, tem-
Earth -9.5 8.61 glmolel 1.29 I 2 . 7 ~ 1 0 ~ ~ I 22 1013
Ratios of Atmospheric Compositions between Earth and Mars
Ratios (EarthIMars)
50.4 3 . 9 ~ 1 O4 244 0.88 44 6 . 4 ~ 1 0' for pi (fraction by volume)
33.3 2 . 4 ~ 1 0' 161 0.58 28.9 4.2~10' for Fi H20 co 0 2 Ar N2 C02
(fraction by weight) for piand ni 0.04 2704 54 1 . 4 ~ 1 O4
(density) 3068 0.024
Gaseous Absorption at Surfaces of Earth and Mars
9

1 o3
1 o2
10'
1 oo
1 0"
1 o-2
1 o - ~
1 o - ~
1 o-'
1 o-6
1 " " 1 " " 1 " " 1 " " 1 ' " ' 1 " " ,......... Earth 0, only - - - Earth H,O only
-- Earth (H20+02 )Total
1 o-7 50 i o0 150 200 250 300 350
Frequency (GHz)
Gaseous specific absorption attenuation by water vapor, oxygen, and both at the surface of Earth and Mars. The upper three thin lines are for attenuation at Earth, while lower three thick lines are for Mars.
10
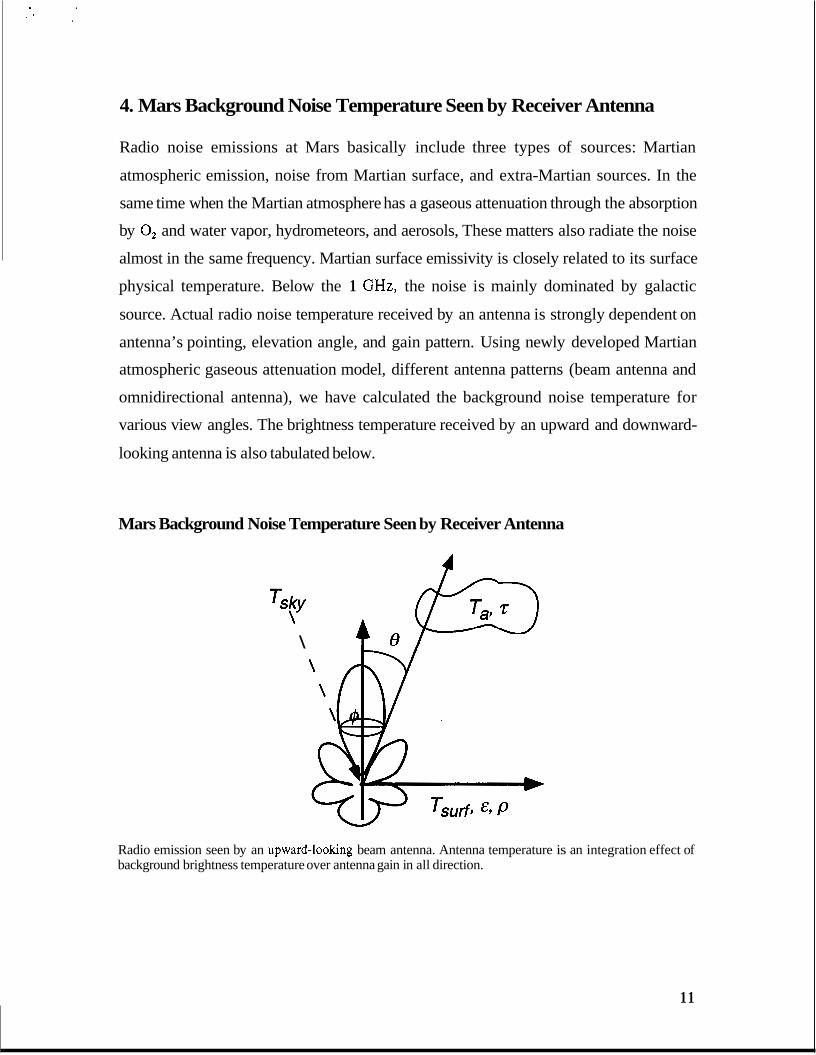
4. Mars Background Noise Temperature Seen by Receiver Antenna
Radio noise emissions at Mars basically include three types of sources: Martian
atmospheric emission, noise from Martian surface, and extra-Martian sources. In the
same time when the Martian atmosphere has a gaseous attenuation through the absorption
by O2 and water vapor, hydrometeors, and aerosols, These matters also radiate the noise
almost in the same frequency. Martian surface emissivity is closely related to its surface
physical temperature. Below the 1 GHz, the noise is mainly dominated by galactic
source. Actual radio noise temperature received by an antenna is strongly dependent on
antenna’s pointing, elevation angle, and gain pattern. Using newly developed Martian
atmospheric gaseous attenuation model, different antenna patterns (beam antenna and
omnidirectional antenna), we have calculated the background noise temperature for
various view angles. The brightness temperature received by an upward and downward-
looking antenna is also tabulated below.
Mars Background Noise Temperature Seen by Receiver Antenna
\
Radio emission seen by an upward-looking beam antenna. Antenna temperature is an integration effect of background brightness temperature over antenna gain in all direction.
11

. .
where jdQ = [$:“sin OdOd@ sz
where T,: received noise average temperature;
G,: receiver antenna pattern;
Te: brightness temperature;
dQ solid angle (all solid angle j’ dS2 = 4 ~ ) ;
8.- polar angle;
@: azimuth angle (2n).
Background Temperatures for Two Special Antenna Pointings:
1 . Downward-looking Antenna:
Tgd = eT,e-’ + Ta(1 -e-’)
2. Upward-looking Antenna:
Tgu = Tsbe-’ -I- Ta(1- e-’)
where:
E: Surface emissivity, a function of view angle and frequency (0 I E < 1 ) , also
depending on surface soil type, roughness, dielectric constant, moisture, etc.;
T,: Surface physical temperature (210 K on Mars; 300 K on Earth);
z: Atmosphere optical depth, a function of wave frequency, depending on cloud,
gaseous absorption, etc. A transparent object has a very small Z, where z = A(”
dB/4.34.
12

T , : Atmospheric temperature at one scale height (200 K on Mars, 220 K on Earth);
TSb: Sky temperature as a function of wave frequency;
p: Surface reflectivity (~+p= 1).
Antenna Maximum and Minimum Gains for Different Frequency Bands UHF band Ornni-directional Ka-band X-band S-band
f G H Z ) 32 8.4 2.3 0.4
d(cm) 0.94 3.6 13 75
D/d 106 27.7 7.7 1.3
%ax(dB) -1 -13 - 10.2 -7.4 -3.6 G,,(dB)
3 47 36 25.4 12
2 I 2 5
External noise figure F, (in dB) and antenna temperature t, (K) versus frequency.
13

Optical depth due to Atmospheric Gaseous Absorption
,-z - -A(f)dB/4.34 - lo-A(f)dB/lO - e -
z = A( f)dB 14.34
where A(" is one-way vertical gaseous attenuation
A(f 1 = 1; Kg(f ,z)dz = q f 9Z)Hg
where K~ is specific attenuation (dB/km) and Hg is scale height of absorption gases.
Parameter Values and Ranges on Mars and Earth Mars Earth
&
P
0.40-0.85 0.86-0.97
220 K 200 K T A
300 (210-320) K 2 10 (1 84-242) K Ts
0.15-0.60 0.03-0.13
Z 0.1-5.0 0.001-1.0 5.0 (for duststorm)
4 9.5 km 11.1 km
E: Surface emissivity, Mars values were obtained from Earth-based Radar observations in
frequency ranges from UHF to Ka bands.
p: Surface reflectivity (&+p= 1).
T,: Surface physical temperature (2 10 K on Mars; 300 K on Earth);
T,: Atmospheric temperature at one scale height (200 K on Mars, 220 K on Earth);
Z: Atmosphere optical depth, a function of wave frequency, depending on cloud, gaseous
absorption, etc. A transparent object has a very small 7.
14

Brightness Temperature (in Kelvin) for Different Antenna Pointing UHF Ka band X band S band
Emissivity I Mars I 0.9 I 0.91 I 0.92 I 0.93
& I Earth I 0.6 I 0.62 I 0.64 I 0.68
Reflectivity I Mars I 0.1 I 0.09 I 0.08 I 0.07
P 0.32 0.36 0.38 0.4 Earth
One-way attenuation 3.0~10" 1 .2x10" 0 . 8 ~ 1 0 ~ 0 . 4 ~ 10" Mars
A07 dB 2.5 0.6 0.4 0.2 Earth
Optical depth 0.7~10" 0 . 3 ~ 1 0 ~ 0.2x10" 0.1~10" Mars
z 0.58 0.14 0.09 0.05 Earth
Sky Brightness I Mars I 29 I 2.9 I 2.9 I 2.9
Temperature T'@ I Earth I 2.9 1 2.9 I 2.9 I 2o I
Downward 195 193 191 189 Mars
Looking T B d 210 196 188 182 Earth I
Upward 117 32 22 40 Earth Looking TBu
2.9 2.9 2.9 29 Mars
Antenna Temperature (in Kelvin) for Various Antenna Pointing and Frequency Bands at Both Mars and Earth
UHF Omnidir Ka band X band S band
Downward
85 117 32 27 88 Earth looking
79 3 4 9 54 Mars Upward
210 193 180 150 Earth looking
193 191 185 155 Mars
Receiver Thermal 462 462 462 462 462 Temperature
15

5. Mars Dust Storm and its Effects on Propagation
The Mars wind can frequently generate large dust storms. This happens especially during
late spring or early summer seasons for the southern Martian hemisphere, when Mars is
at its perihelion. For a normal dust storm, the attenuation is about 1 dB. At the worst
situation, Martian dust storms have a 3 dB attenuation on Ka-band radio wave. Lower
frequency signals will suffer significant less loss. The attenuation depends largely on dust
mass loading, dust size distribution, etc. Currently we still have little information about
these factors. When the spacecraft lands in the southern hemisphere, at least a 3-dB
margin should be considered for lander and rover communication.
Local and Regional Dust Storms:
A local dust storm observed by Mariner 9 at the edge of the south polar ice cap, just visibl right. The time is that of perihelion, L, = 250".
e at the lower
16

A local dust storm in the Solis Planum region at Ls = 227". The season is midsouthern spring, between the two 1977 global storms.
Martian Dust Storm Attenuation
A(d) = 54.6221 3 E" ,,2 J a (et+2) + E
1.029 x lo6 e" A(d) = N7-F3 a [( E' +2)2 + &It2 3
where A(A) is in dB/km, r is particle radius in meter, and d is wavelength in meter, z is
the optical depth.
Dielectric Permittivity Index of Dust Particles Index 10 GHz* 10 GHz 10 GHz S band** 32 GHz 8.8 GHz Dust at Dust at
E' 4.56 7.42 3.35 4.56 2.5 2.5 2.0 3 .O E Clay Sand Clay*** Clay
(+o. 11, (+I -73, (+0.03)
(+0.074, (+0.597, (M.02) -0.066) -0.437)
-0.24) - 1.22) E" 2.5 1 1.119 0.042 0.25 1 0.06 0.02 0.4 0.1
* Ghobrial[1980] ** Goldhirsh [1982] *** Smith and Flock [1986]
17

A Comparison of Dust Storm Parameters between Earth and Mars N T p Mean SizeMaximum Visibility Path Attenuation Mass m-3 dm3 (pm) Size (pm) (m) Length at 32 GHz Loading
Earth lo8 2 . 6 ~ 1 0 ~ 30-40 80-300 5.1-3.8 lOkm 65 dB 40-60 dm3 Mars 3x10⁷ 3 . 0 ~ 1 0 ~ 1-10 20 184 1Okm 3 dB 0.4 dm3
6. Summary Because both Earth and Mars have ionosphere and atmospheres, radio waves suffer some
losses in additional to the free space loss which has a range from 277 dB (for minimum
distance) to 294 dB (for maximum distance) between Mars and Earth. At Earth, for 99%
of the time, weather conditions are such that the total tropospheric attenuation for Ka
band is about 5 dB for vertical propagation. This loss includes gaseous absorption, rain
and cloud scattering, etc. Among these losses, the dominant loss is due to rain scattering
and absorption, about 3 - 4 dB under normal conditions. At Mars, the dominant
attenuation factor is dust storms. For a worst-case (large mass loading), attenuation can
be 3 dB or higher at Ka band. However, this type of storm rarely occurs. Dust storms
mostly occur in the southern hemisphere during spring/summer seasons. Under normal
conditions, a storm can cause at most about a 1 dB loss.
At Mars no rain observation has been reported yet. Even though it is possible to have
rain, the rain would be so light that it would not cause any significant attenuation to radio
waves. It is estimated that total tropospheric losses, including gaseous attenuation, cloud,
fog, and tropospheric scattering (scintillation and turbulence), etc., are about 0.4 dB at Ka
band. Thus, under normal conditions, the attenuation combined from a dust storm and the
troposphere is about 1.4 to 2 dB, for a vertically propagating wave (compared with about
5 dB at Earth). The total attenuation will be about 3.4 dB for the worst case.
The Martian ionosphere will have some absorption and scintillation effects on VHF wave
transmission just as the Earth’s ionosphere does. At Earth, these losses are about 3.0 to 10
18
dB for at 127 MHz. At Mars, this type of loss will be much smaller, because the Martian
ionosphere is one order of magnitude thinner than Earth’s.
Another important attenuation factor for Martian surface communication is multipath due
to reflections from rocks and canyon walls. Because there have been no experiments yet
to measure these parameters on Mars., we can extrapolate fiom Earth-based experiments.
We do not expect that there are any big differences in attenuation between rocks at Mars
and Earth. In Earth’s canyon and hilly environments, for 870 MHz waves, attenuation has
a range of 2-7 dB, while for L band (1.7 GHz), the attenuation is 2-8 dB. At higher
frequency, higher loss should be expected. Thus, surface rock attenuation is a potentially
a large attenuation source on Mars.
For surface-to-surface propagation, we do not know what the actual loss is because there
is no any rock attenuation experimental data yet. The total propagation loss between Mars
and Earth is free-space loss, plus about a 8-dB atmospheric loss from both planets.
Finally, based on the Martian atmospheric environment, we strongly recommend using
optical links for future Mars communications. Because of the thinner Martian atmosphere
and the almost transparent Martian clouds, optical communication is almost perfect for
links between Mars orbiters, between orbiters and landers, and even between Mars surface
robots. Laser beams in the Martian atmosphere will have much less attenuation relative to
those used in the Earth environment. We also suggest using low frequency (4.0 MHz)
radio waves for Martian surface communication because the Martian ionosphere can
effectively reflect these waves forward to areas beyond the line of sight. This will make
Martian surface global communication possible.
19

Acknowledgements
This work was performed at the Jet Propulsion Laboratory, California Institute of Technology, Pasadena, under contract with the National Aeronautics and Space Administration.
References
Annis, J., The atmosphere of Mars and optical communications, TDA Progress Report 42-91, Jet Propulsion Laboratory, Pasadena, CA, pp. 124, November 15, 1987.
Ghobrial, S.F., The effect of sandstorm on microwave propagation, Proc. Nut. telecomm. Con., Houston, TX, 2,43.5.1, 1980.
Goldhirsh, J., A parameter review and assessment of attenuation and backscatter properties associated with dust storms over desert regions in the frequency range of 1 to 10 GHz, IEEE Trans. Ant. Propuga., AP-30, 1 12 1, 1982.
Smith, E.K., and W.L. Flock, Propagation through Martian dust at X- and Ka-band, TDA Progress Report 42-87, Jet Propulsion Laboratory, Pasadena, CA, 291, July- September 1986.
Wood, G.E., et al., Mars Pathfinder entry, descent, and landing communications, TDA Progress Report 42-131, Jet Propulsion Laboratory, Pasadena, CA, 1-19, November 15, 1997.
20