maryland state iay mobiit eot
TRANSCRIPT

II.B.8
2015 M A RY L A N D STATE HIGHWAY MOBILITY REPORT
The MD 175 project in Odenton provided the highest benefits associated with any of the 29 signal system upgrades. The network delay reduction associated with this project amounted to an estimated 102,000 vehicle hours annually. Overall, the signal retiming and optimization modifications provided an estimated reduction of 866,000 hours of delay for motorists and saving almost 300,000 gallons of gasoline. The fuel, delay and emissions savings resulted in approximately $29.6 million total annual user cost savings.
2. MULTI-MODAL
a. Park and Ride
Park and ride lots reduce single occupant vehicles on the roadway network and encourage transit use and ride-sharing. The SHA and MDTA have established a park and ride lot network in Maryland. SHA partners with the Maryland Transit Administration and local transit agencies to encourage transit connections to the lots. The mutually beneficial relationship increases transit trips and reduces congestion. Together SHA and MDTA operate 104 park and ride lots in 20 counties providing a total of 13,062 spaces, ranging in size from less than 15 spaces to more than 800 spaces (MD 5 in the Waldorf area of Charles County and MD 665 at Riva Road in the Annapolis area of Anne Arundel County are the largest). A new 98 space park and ride lot was constructed in 2014 in Washington County at I-81 and MD 68. Other expansions include 75 new spaces at MD 4 at MD 408 in Anne Arundel County, 50 additional spaces at the I-83 at MD 439 lot in northern Baltimore County and 99 new spaces at I-70 at MD 17 in Frederick County. The lot in Charles County at MD 231 and the County Fairgrounds was eliminated resulting in a loss of 20 spaces. Other minor adjustments occurred in the number of spaces in the network.
The 104 lots were surveyed during the spring and fall of 2014 to determine the number of occupied spaces. Over 7,500 spaces were utilized on a given day accounting for about 60% of the total spaces. The park and ride lots which saw the largest increase in the number of motorists parking were:
• MD 210 @ MD 373
• I-70 @ MD 65
• I-195 @ MD 166
• I-95 @ I-495
• MD 32 @ Broken Land Parkway
• I-95 @ MD 152
MD 166 Park and Ride
II.B.9
SHA/MDTA PARK AND RIDE SAVINGS TO MOTORISTS (MILLIONS)
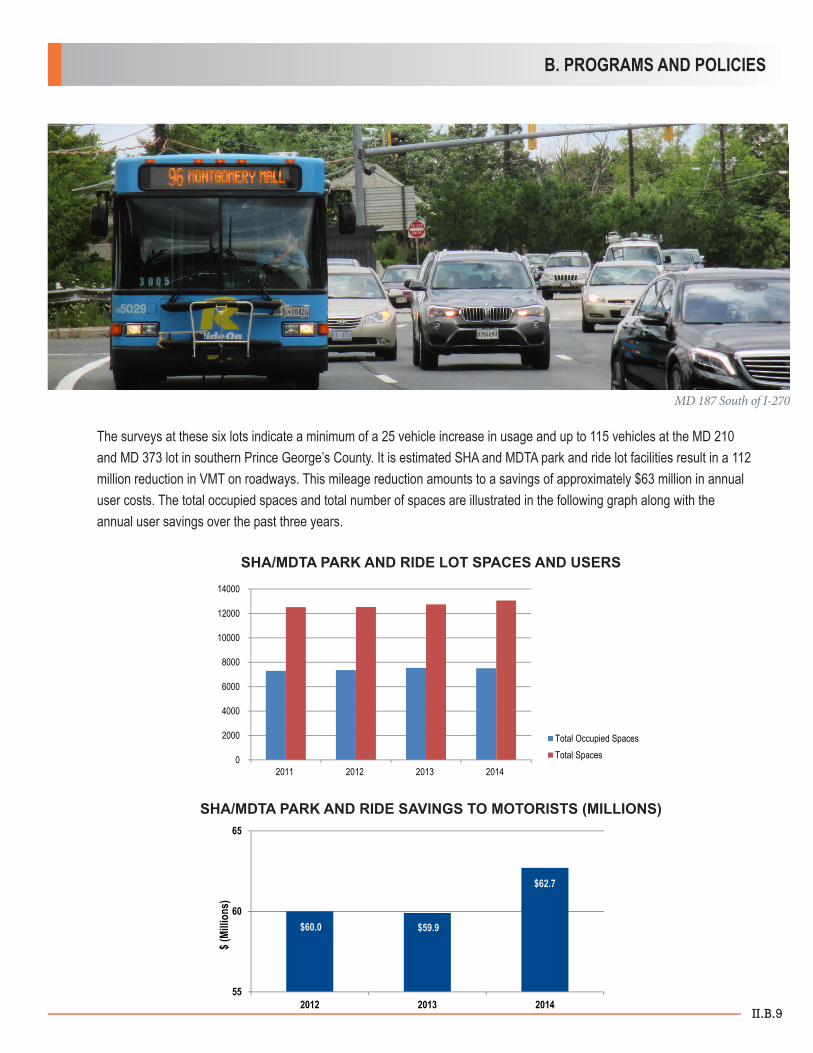
The surveys at these six lots indicate a minimum of a 25 vehicle increase in usage and up to 115 vehicles at the MD 210 and MD 373 lot in southern Prince George’s County. It is estimated SHA and MDTA park and ride lot facilities result in a 112 million reduction in VMT on roadways. This mileage reduction amounts to a savings of approximately $63 million in annual user costs. The total occupied spaces and total number of spaces are illustrated in the following graph along with the annual user savings over the past three years.
0
2000
4000
6000
8000
10000
12000
14000
2011 2012 2013 2014
SHA/MDTA Park and Ride
Total Occupied SpacesTotal Spaces
Lot Spaces and Users
2012 60.02013 59.92014 62.7
SHA/MDTA PARK AND RIDE SAVINGS TO MOTORISTS
$60.0 $59.9
$62.7
55
60
65
2012 2013 2014
SHA/MDTA PARK AND RIDE SAVINGS TO MOTORISTS
$ (Mi
llions
)
SHA/MDTA PARK AND RIDE LOT SPACES AND USERS
B. PROGRAMS AND POLICIES
MD 187 South of I-270

II.B.10
2015 M A RY L A N D STATE HIGHWAY MOBILITY REPORT
b. HOV Lane Operation
High occupancy vehicle lanes (HOV) are in use in two locations in Maryland. These lanes maximize person throughput by offering a travel time savings for multiple occupant vehicles over single occupant vehicles. In Maryland, HOV lanes restrict access to vehicles with two or more occupants, transit vehicles, motorcycles or plug-in electric vehicles (permits required). The goal of this mobility measure is to allow the HOV lanes to operate near free flow speeds when the general purpose lanes experience congestion and lower travel speeds. The HOV lanes are mostly separated by pavement markings from the general purpose lanes although, a few sections along I-270 have a physical separation between the lanes.
The I-270 HOV lanes operate southbound from 6:00 to 9:00 AM and northbound from 3:30 to 6:30 PM while the US 50 HOV lanes function the entire day. HOV lanes, in combination with park and ride lots, increase person throughput and provide a viable alternative transportation mode for commuters in Maryland. This provides an effective Active Travel Demand Management (ATDM) strategy.
US 50 - US 301 to I-95I-270 Northbound I-495 to MD 121
I-270 Southbound MD 117 to I-495
HOV LOCATIONS
I-270 North of Rockledge Drive

II.B.11
Surveys were performed along I-270 to evaluate the effectiveness of the HOV lanes, including analyzing person throughput and travel time savings. Person throughput evaluates the total number of people moved in each lane. On I-270 the HOV lanes transported approximately 200 to 1,500 additional people compared to an average general purpose lane.
The HOV lane carries as much as 3,500 persons per lane per hour as shown in the following chart:
Motorists utilizing the I-270 HOV lanes experienced a significant savings in travel time. In the morning peak period, this amounted to up to 10 minutes with an average of 6 minutes. The afternoon peak period provided even greater travel time savings with a maximum of approximately 16 minutes and an average of 8 minutes. This resulted in a 131,000 person-hour time savings amounting to $4.75 million dollars. These savings were calculated using travel time data collected from permanent Bluetooth sensors on I-270. It is estimated that 182,000 gallons of gasoline were saved by the HOV lanes. The following figures show the average travel time savings on the HOV lanes during the AM and PM peak period of operation.
I-270 PERSON THROUGHPUT PER LANE PER HOUR
Short summary for inclusion in Maryland Mobility Report 2015 7
• US 50 – US I‐95 to US 301 (Eastbound)
• US 50 – US 301 to I‐95 (Westbound)
The I‐270 HOV lanes operate southbound from 6:00 to 9:00 AM and northbound from 3:30 to 6:30 PM while the US 50 HOV lanes operate 24 hours a day. The HOV lanes are restricted to two or more occupants per vehicles, transit vehicles, motorcycles, or plug‐in hybrid vehicles (permit required). HOV lanes in combination with park and ride lots increase person throughput and provide a viable alternative transportation mode for commuters.
The person throughput is higher in the HOV lanes than the non‐HOV or general purpose lanes even though the number of vehicles traversing the HOV lanes is lower.
The HOV lanes also provide for a significant time savings. In the afternoon, motorists on I‐270 can save up to 16 minutes utilizing the high occupancy vehicle lanes versus the general purpose lanes for travelling the entire length of the facility. A travel time savings of up to 10 minutes occurs in the morning peak period using the I‐270 HOV lanes. HOV lanes on I‐270 northbound resulted in 1,275,516 person‐minute time saving which has a value of $3.6 million (based on the value of time equal to $31.36 per hour). This number for I‐270 southbound is $0.52 million. Data analysis shows that 93% of the time average speed on HOV lanes has been above 45 mph.
0
500
1000
1500
2000
2500
3000
3500
4000
I270 N of Democracy AM I270 N of Democracy PM IS 270 S of MD 121 PM IS 270 S of Middlebrook RdPM
I-270 Person Throughput Per Lane
HOV Lanes Non-HOV Lanes
B. PROGRAMS AND POLICIES
Short summary for inclusion in Maryland Mobility Report 2015 8
The US‐50 HOV lanes operate 24 hours a day, however peak hours are considered from 6:00 to 9:00 AM for eastbound and from 3:30 to 6:30 PM for the westbound directions. The following shows person throughput summary for the US‐50 based on SHA’s portable traffic count data for May 28 and 29, 2014. Average occupancy for the general purpose and HOV lanes is assumed 1.1 and 2 respectively.
05
10152025303540
6:00 6:30 7:00 7:30 8:00 8:30 9:00 9:30 10:00
South
boun
d Tra
vel T
ime (
Minu
tes)
Time of Day
I-270 Morning Travel Times (Southbound)
Non-HOV lanes HOV Lanes
05
1015202530354045
15:00 15:30 16:00 16:30 17:00 17:30 18:00 18:30 19:00North
boun
d Tra
vel T
ime (
Minu
tes)
Time of Day
I-270 Afternoon Travel Times (Northbound)
Non-HOV lanes HOV Lanes
The travel time savings on US 50 for the HOV lanes versus the non-HOV lanes is relatively nominal. It is estimated that the HOV lanes on US 50 provide $380,000 in annual benefits. This means a total of over $5.13 million in savings for both HOV facilities in Maryland.

II.B.12
2015 M A RY L A N D STATE HIGHWAY MOBILITY REPORT
c. Reversible Lane Operation
There are selected corridors in Maryland with high directional traffic volumes in the peak periods. In order to maximize vehicle throughput, reversible lanes are utilized. Reversible lanes operate through the use of overhead lane control signals designating the middle lane(s) to alternate with the peak flow of traffic. This improves capacity in the section where the reversible lanes are utilized, decreases congestion and can assist in reducing congestion related crashes. The reversible lanes are usually limited to certain hours of the day.
Reversible lane operations are in use along:
• US 29 from Sligo Creek Parkway to MD 97 (Georgia Ave) (Montgomery County) - 1.0 miles
• US 50/US 301 Bay Bridge (Anne Arundel/Queen Anne’s County) - 4.5 miles
• MD 97 from I-495 to MD 390 (16th Street) (Montgomery County) - 0.5 miles
• MD 177 from MD 100 to West of South Carolina Avenue (Anne Arundel County) - 1.6 miles
The most recognizable reversible lane operation is on the US 50/US 301 Bay Bridge. Traffic on the two lane eastbound span and the three lane westbound span alternates through the use of overhead lane signing. This allows for three eastbound lanes and two westbound lanes. The changeover occurs as needed during the PM peak period and on Saturdays mornings during the summer. The US 29 and MD 97 reversible lane operations improve traffic flow from residential areas into the downtown Silver Spring employment center and the WMATA METRO Red Line. The lanes operate southbound in the morning and returning northbound in the PM peak period. MD 177 is the main roadway leading to Lake Shore and Gibson Island. Traffic volumes are directional leading off the island in the morning and returning home in the evening. This three lane roadway is converted from two lanes westbound in the AM peak period to two lanes eastbound in the PM peak period.
MD 177
II.B.13
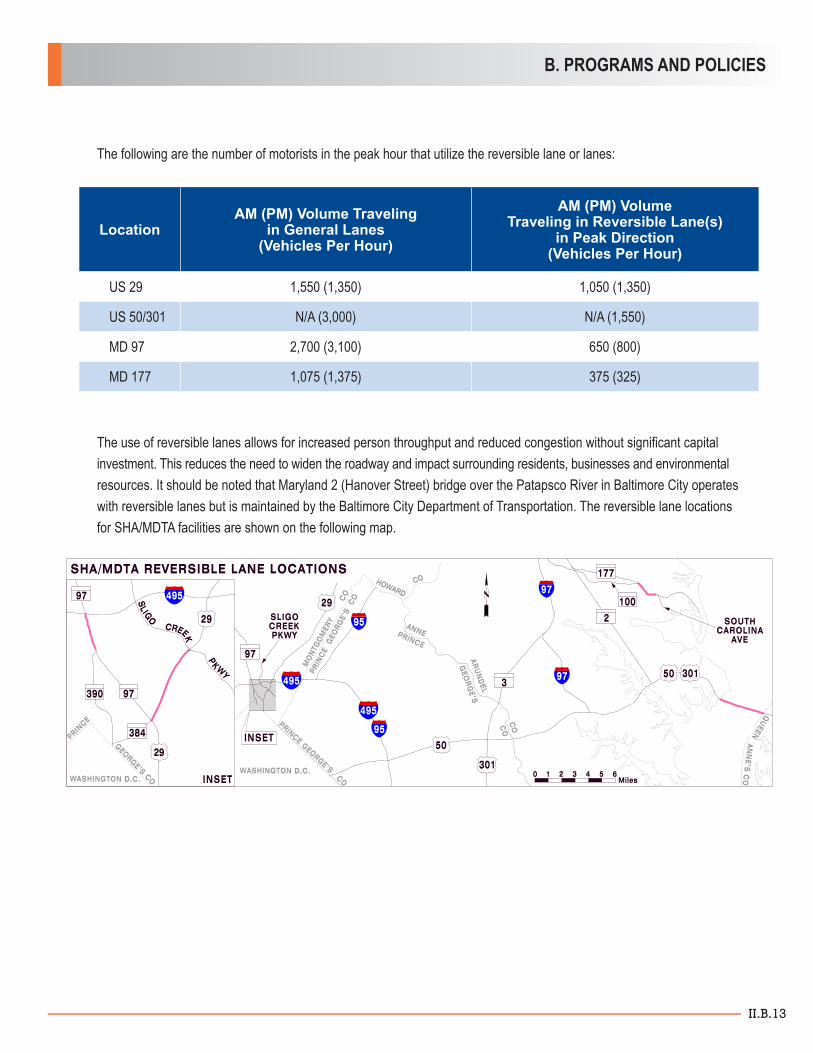
The following are the number of motorists in the peak hour that utilize the reversible lane or lanes:
The use of reversible lanes allows for increased person throughput and reduced congestion without significant capital investment. This reduces the need to widen the roadway and impact surrounding residents, businesses and environmental resources. It should be noted that Maryland 2 (Hanover Street) bridge over the Patapsco River in Baltimore City operates with reversible lanes but is maintained by the Baltimore City Department of Transportation. The reversible lane locations for SHA/MDTA facilities are shown on the following map.
LocationAM (PM) Volume Traveling
in General Lanes(Vehicles Per Hour)
AM (PM) Volume Traveling in Reversible Lane(s)
in Peak Direction (Vehicles Per Hour)
US 29 1,550 (1,350) 1,050 (1,350)
US 50/301 N/A (3,000) N/A (1,550)
MD 97 2,700 (3,100) 650 (800)
MD 177 1,075 (1,375) 375 (325)
B. PROGRAMS AND POLICIES

II.B.14
2015 M A RY L A N D STATE HIGHWAY MOBILITY REPORT
d. Bicycles and Pedestrians
Safe and efficient bicycle and pedestrian accommodations are crucial to creating a transportation network that accommodates all users of the road. Bicycle and pedestrian facilities are increasingly important in urban areas and near transit stations where there are significant numbers of pedestrians and cyclists. MDOT completed the “Maryland Twenty Year Bicycle and Pedestrian Master Plan” in January 2014. The master plan provides the vision and direction for bicycle and pedestrian improvements in Maryland.
The Maryland SHA incorporates a Complete Streets policy to create a transportation system that balances all users of the roadway, including pedestrians, transit, bicyclists, and motorists. By incorporating a Complete Streets policy, this impacts all areas in SHA. The construction of bicycle and pedestrian facilities is implemented through the planning, design, and construction phases from project development to design to construction.
Maryland SHA has developed various programs to implement the planning, design, and construction of bicycle and pedestrian facilities throughout the state, including:
Sidewalk Retrofit
The sidewalk retrofit program improves mobility for the general population and persons with disabilities by removing barriers that impede movement of citizens and lower potential safety risks. This program advances MDOT’s vision of multi-modal transportation by providing pedestrian facilities and enhancing access along state routes in existing communities as viable and safe modes of transportation. The major emphasis is to provide new sidewalks as part of a request from a local government, or due to a high rate of pedestrian crashes at a location.
MD 144 West of I-695

II.B.15
Bicycle Retrofit
The Bicycle Retrofit program ensures bicycling remains a viable mode of transportation. The program identifies projects along state roadways that enhance bicycle mobility and safety while minimizing the impacts to environmental features or requiring private property (right-of-way). The range of improvements could include minor enhancements to safety such as signing and marking corridors for bicycle access, remarking wide curb lanes or shoulders as bike lanes, changing the typical section of the roadway to accommodate bicyclists or creating new off-road bike trails parallel to a roadway within the context of performing practical design.
Bicycle and Pedestrian Priority Areas (BPPA)
Safe and efficient bicycle and pedestrian accommodations are important to creating a transportation network that accommodates all users of the road. These facilities become increasingly important in urban areas and at transit stations where there are significant numbers of pedestrians and cyclists. MDOT completed the “Maryland Twenty Year Bicycle and Pedestrian Master Plan” in January 2014. The master plan provides the direction for bicycle and pedestrian improvements for the State of Maryland including the Bicycle and Pedestrian Priority Areas (BPPA’s). The designation allows the state and the local counties to emphasize bicycle and pedestrian improvements and requires a plan be developed in cooperation between the counties and MDOT. MDOT will release further guidance and criteria for designation by the end of 2015.
Transportation Alternatives Program
This program involves various projects including the construction of bicycle/pedestrian facilities, construction of safe routes for non-drivers, converting abandoned rail lines to bicycle/pedestrian trails and the planning/design of pedestrian/bicycle facilities. The projects associated with this program provides for the enhancement of cultural, aesthetic, historic and environmental aspects of the intermodal transportation system.
Recreational Trails Program
The construction of new trails or the maintenance/rehabilitation of existing trails is the primary purpose of the Recreational Trails Program. The program is federally funded and can be utilized for trails that support hiking, biking, water sports, snow sports, in-line skating and equestrian usage. It is part of the Transportation Alternatives Program but has its own dedicated funding source at SHA.
Safe Routes to School Program
The promotion and safety for children in kindergarten to eighth grade to walk to school is the goal of the Safe Routes To School Program. Elements of this program include education, enforcement near schools and public awareness campaigns. Construction projects could include sidewalk improvements, traffic calming, bike/pedestrian crossing improvements, on and off street paths and traffic diversion. This program is included as part of the Transportation Alternatives Program.
ADA Retrofit Program
This fund was established to upgrade existing sidewalks, curb ramps, intersections and driveway entrances along state roadways for compliance with the Americans With Disabilities Act (ADA). The location of these projects are not limited to priority funding areas.
Urban Reconstruction Program
Urban Reconstruction Program projects are located in priority funding areas. These projects promote safety and economic development in communities. The local entity must support the project through maintenance of the sidewalks after completion of the construction.
B. PROGRAMS AND POLICIES
II.B.16
2015 M A RY L A N D STATE HIGHWAY MOBILITY REPORT
e. Transit Oriented Development
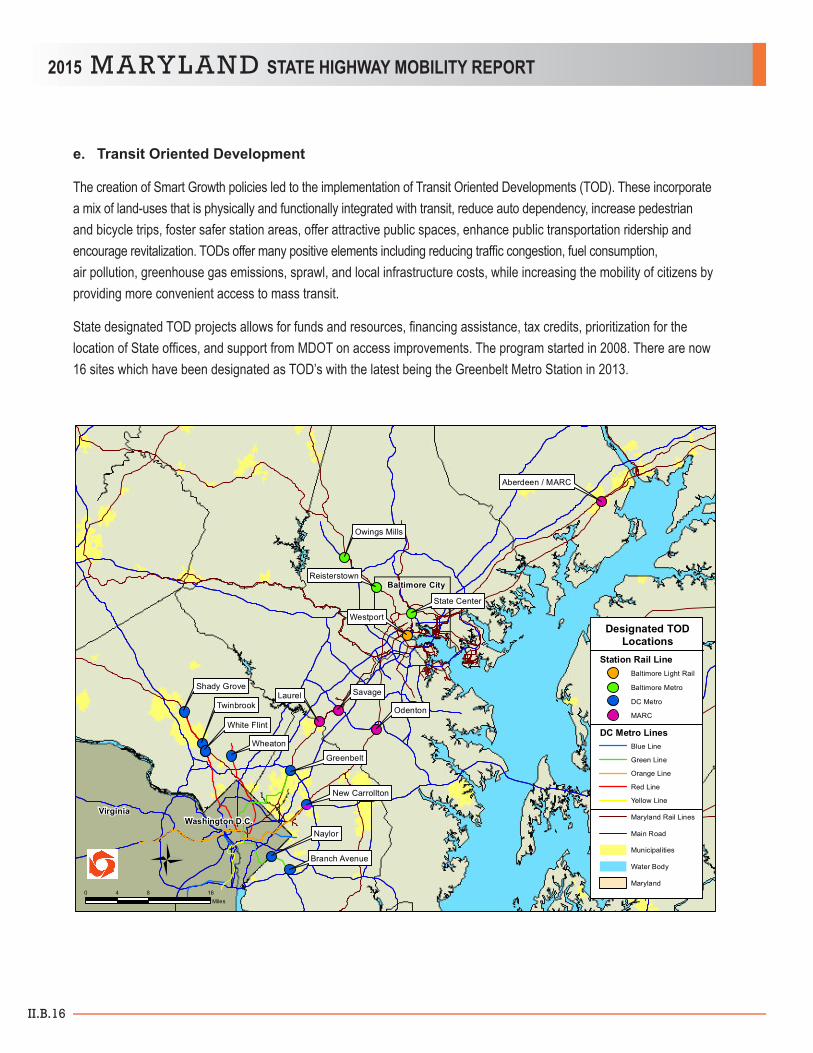
The creation of Smart Growth policies led to the implementation of Transit Oriented Developments (TOD). These incorporate a mix of land-uses that is physically and functionally integrated with transit, reduce auto dependency, increase pedestrian and bicycle trips, foster safer station areas, offer attractive public spaces, enhance public transportation ridership and encourage revitalization. TODs offer many positive elements including reducing traffic congestion, fuel consumption, air pollution, greenhouse gas emissions, sprawl, and local infrastructure costs, while increasing the mobility of citizens by providing more convenient access to mass transit.
State designated TOD projects allows for funds and resources, financing assistance, tax credits, prioritization for the location of State offices, and support from MDOT on access improvements. The program started in 2008. There are now 16 sites which have been designated as TOD’s with the latest being the Greenbelt Metro Station in 2013.
0 8 164Miles
Designated TODLocations
Station Rail LineBaltimore Light Rail
Baltimore Metro
DC Metro
MARC
DC Metro LinesBlue Line
Green Line
Orange Line
Red Line
Yellow Line
Maryland Rail Lines
Main Road
Municipalities
Water Body
Maryland
Branch Avenue
Naylor
New Carrollton
TwinbrookLaurel Savage
Odenton
Westport
State Center
Reisterstown
Owings Mills
Washington D.C.
Baltimore City
Shady Grove
Wheaton
Virginia
Aberdeen / MARC
2
White Flint
Greenbelt

II.B.17
A joint effort has been established by MDOT and the Washington Metropolitan Area Transit Authority (WMATA) to develop and refine processes and policies to support TOD development. These documents detail the State’s role in promoting TOD’s and provide guidance to developers, county and local jurisdictions, and citizens on the TOD process in Maryland. This was developed not only for official designated sites but also for TOD at non-designated transit stations.
Various TODs are at different stages of occupancy and construction. The Owings Mills Metro Station is one of the most active TOD’s. The Baltimore County Library and the Baltimore Community College have branches at this TOD. The first phase of the METRO Crossing Apartments are being rented. A new parking garage was constructed in 2014. Another on going TOD project is at Odenton/Annapolis Junction. Construction is taking place on a mixture of housing and retail, set to open in 2015. The remainder of the development will proceed as the market dictates.
B. PROGRAMS AND POLICIES
Odenton TOD