masaki nakagome, kazuo maki, and hideto ide (2014), “framing … · 2016-11-24 · masaki...
TRANSCRIPT

Masaki Nakagome, Kazuo Maki, and Hideto Ide (2014), “Framing Effects Cannot
Effectively Weaken Herd Mentality: Reconsidered,” Working Paper Series, Institute of
Economic Research, Aoyama-gakuin University, no.2014-5.

Framing Effects Cannot Effectively Weaken Herd Mentality: Reconsidered
Masaki Nakagome*, Kazuo Maki*, and Hideto Ide**
Author Note
Affiliations: * College of Economics, Aoyama Gakuin University
** College of Science and Engineering, Aoyama Gakuin University
Corresponding Author: Masaki Nakagome, College of Economics,
Aoyama Gakuin University, 4-4-25, Shibuya, Tokyo, 150-8366, Japan
Keywords: framing effect; herd mentality; attribute framing;
brain decoding; neuroeconomic experiment
Classification Codes: D87

Abstract
Earlier studies considered the effects of framing on individual decision making;
however, the framing effects on herd behavior have not been studied. We conducted a
neuroeconomic experiment to examine the strength of framing effects on herd mentality,
the psychological basis of herd behavior in financial decisions. We focused on attribute
framing and considered a case in which the identical financial problem was expressed
differently by a gain or loss frame. Our experimental results implied that framing effects
could not effectively weaken herd mentality to influence subjects to rely primarily on
common information for decision making. We suggest that framing effects are
sufficiently strong to change individual decision making; however, they are too weak to
affect herd mentality. The strength of herd mentality overcomes framing effects. We
used a powerful brain reading method of brain decoding to examine which of the two
types of information, private or common, was used by the minds of the subjects. We
discussed another interpretation of the experimental results to extend the understanding
of attribute framing.

Introduction
Background
Framing effects on individual decision making have been studied in behavioral
economics since the publication of such seminal manuscripts as those of
Kahneman-Tversky (1979), Kahneman-Slovic-Tversky (1982), and Tversky
-Kahneman (1981, 1986). Agents are likely to change their decisions when affected by
the use of different frames that are the expressive styles of decision problems.
There are at least three types of frames. Levin-Schneider-Gaeth (1998) claimed that
“all frames are not created equal.” They classified frames into the following types that
have different cognitive properties: risky-choice framing, attribute framing, and goal
framing. Attribute framing is the simplest and most robust of the three. Levin-Gaeth
(1988), Marteau (1989), and Krishnamurthya-Carterb-Blair (2001) provided typical
examples for attribute framing that are observable in everyday life. The problem of
attribute framing presents a case in which the same problem is expressed differently, for
example, by a gain or a loss frame. If agents were perfectly rational, they would react
identically to a problem regardless of it being expressed by different frames. Boundedly
rational agents, however, show cognitive bias produced by the frames of their decision
making. We focused on attribute framing and examined the relationship between
framing and the psychological basis of financial decisions.
A limitation of earlier studies is that they have only considered framing effects on
individual decision making. The nature of the relationship between framing effects and
psychologically based herd behavior is unknown. We conducted a neuroeconomic

experiment to examine the strength of framing effects on herd mentality in financial
decisions.
According to the survey article by Hirshleifer-Teoh (2003), the study of herd
behavior has a long history. Moreover, recent developments in the study of herd
behavior have been remarkable.1 The recent studies use the methods of experimental
economics and interpret their results using the rational assumptions of individual
profit-maximization behavior. The use of the rational assumption provides clear
interpretations and understanding of the experimental results; however, it restricts our
research interest to a narrow field. The assumption allows us to consider only the
perfectly rational agents who show neither an anomalous framing effect nor herd
mentality in decision making. The use of the rational assumption might produce an
underestimation of the actual possibility of herd behavior. To evade the underestimation,
we should abandon the rational assumption and adopt the concept of boundedly rational
agents to allow new interpretations of the experimental results. The study of framing
effect on herd mentality provides a good example that allows us to consider bounded
rational agents.
The purpose of this study
The purpose of this study was to extend the scope of earlier studies of framing effect
and herd behavior. Focusing on attribute framing, we presented a new experimental
1 The theoretical studies on herd behavior are those by authors including Banerjee (1992), Bikhchandani et al. (1992), and Welch (1992). However, as Cipriani-Guarino (2005) correctly notes, it is difficult to test the theoretical results with empirical studies. Because of the lack of data on private information available to traders, it is difficult to determine whether traders would disregard their private information in favor of common information. The seminal studies by Cipriani-Guarino (2005, 2009) have overcome the research difficulty by conducting experimental studies.

study to examine the strength of framing effect on herd mentality, the psychological
basis of herd behavior. To accomplish the goal of this study, we used a powerful brain
decoding method to examine which of the two types of information, private or common,
was used by the minds of the subjects. When herd mentality was strong, that mentality
would influence subjects to rely primarily on common information for decision making.
The method of brain decoding was executed by the following three steps: (1) we
conducted preliminary games that produced neural data to be used in learning and
training the neural network architecture to accurately recognize the typical pattern of
neural activity when subjects used private or common information for decision making,
(2) we examined the credibility of the neural network architecture to recognize the
typical neural pattern by using an additional check program, and (3) we executed a core
game to obtain the neural data that were compared with the typical patterns by a pattern
recognition method using the checked neural network architecture. In the core game, the
subjects could freely choose whether they would use private or common information for
decision making. The rate of matching for the neural pattern taught us which
information was used for free decision making.
Four cases (2 x 2 cases) with two-dimensional framing effects
We analyzed the complex cases in which private and common information are
simultaneously expressed by different types of frames. This situation reflects “a
two-dimensional problem of framing effects.” Table 1 illustrates four cases (2 x 2 cases)
with two-dimensional framing effects. Cases 1 and 4 are expressed only by a single
frame, whereas Cases 2 and 3 are expressed by mixed frames. Earlier behavioral

economics studies analyzed single-framed cases and did not consider cases with mixed
frames. We considered the mixed frames and examined the results that were produced
in Cases 2 and 3. In the later section, we demonstrate that focusing on Cases 2 and 3
would be more productive for obtaining significant insights than studying other cases.
Material and Methods
Subjects and Tools for Brain Decoding
Eighteen healthy right-handed subjects (nine males; nine females) aged 20-24 years
played the experimental games. All subjects were students at Aoyama Gakuin
University. While each subject played the games, we obtained the necessary brain
decoding data. The subjects were not allowed to eat for two hours before the experiment
to ensure clear neural reactions to the experimental tasks. Before beginning the
experiment, the experimental procedures, safety, security information, and procedure
for obtaining payment for participation were explained to the subjects, and informed
consent was obtained from each participant. Our experimental plans and procedures
were approved by the Research Ethics Committee of Aoyama Gakuin University,
Tokyo, Japan.
As illustrated in Figure 1, we used functional near-infrared spectroscopy (fNIRS), a
simpler and more convenient tool for examining brain activation than the more widely
used functional magnetic resonance imaging (fMRI). The use of fNIRS results in
minimal stress to the subjects. For fNIRS, we used the Spectratech OEG-SpO2 model
(updated from the OEG-16 model, with a sampling rate of 6.10 Hz, manufactured by
Spectratech, Inc., Tokyo and Yokohama, Japan), which is based on the modified
Beer-Lambert law, to scan the frontal cortex of the brain. This fNIRS equipment uses
small, lightweight, 16-channel digital sensors on a headband to obtain event data
through a dynamic, high-sensitivity optical signal that reflects how in vivo hemoglobin
combines with oxygen in blood vessels with high or low cortical activation. fNIRS
provides three types of event-related neural data: changes in oxyhemoglobin
(ΔCoxyHb), changes in de-oxyhemoglobin (ΔCdeoxyHb), and aggregate changes in the
two types of hemoglobin (ΔCoxyHb + ΔCdeoxyHb). We used the changes in
oxyhemoglobin for brain decoding. Strangman et al. (2002) found a strong correlation
between fMRI variables and fNIRS measures, with oxyhemoglobin data providing the
strongest correlation. Therefore, using oxyhemoglobin data will produce results for
fNIRS brain decoding that correspond to those of fMRI studies. We claim that this
method enables us to perform efficient and low-stress brain decoding experiments.
The 16-channel digital sensors were fixed on the frontal cortex by the headband
during the experiment. After each subject completed the experiment, the location of
each sensor was measured using 3-D positioning with FN-1000 software (manufactured
by Topcon Corporation, Tokyo, Japan) and a digital camera (Nikon D5100) calibrated
using FN-Calib software (manufactured by Topcon) to confirm that the channels were
properly located on the frontal cortex of the brain. Figure 2 illustrates the locations of
the sensors for the first subject mapped onto a canonical brain using NIRS-SPM
software, which is a MATLAB-based software for performing statistical analysis of
brain imaging data from fNIRS signals (developed at the Bio Imaging Signal Processing

Lab in Korea). We obtained event-related, high-sensitivity optical signals from these
channels.
Experimental Tasks
We examined the framing effect on herd behavior in Cases 2 and 3, which were
complex cases in which private and common information were expressed differently by
the gain frame and the loss frame.
The basic structure of the experimental task in Case 2 was identical to that in Case 3.
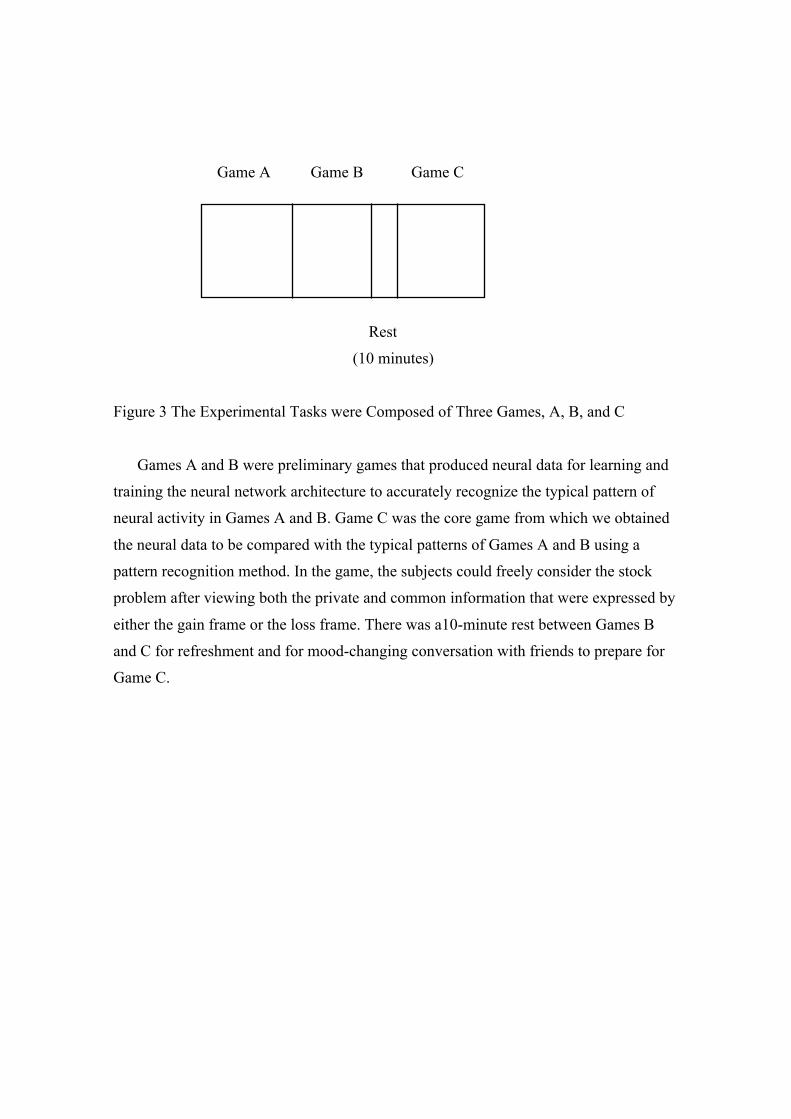
Figure 3 illustrates that the tasks were composed of three parts, Games A, B, and C.
There was a 10-minute rest between Games B and C for refreshment and for
mood-changing conversation with friends to prepare for Game C. We presented the
subjects with the tasks to be executed via a computer monitor and obtained neural data
while the subjects were executing the tasks.
As already explained, the method of brain decoding was executed in three steps. In
the first step, we executed Games A and B, which produced neural data for learning and
training the neural network architecture to accurately recognize the typical pattern of
neural activity in Games A and B. Figure 4 illustrates the concept of learning the neural
network architecture. Using the “nntraintool” in the Neural Network Tool Box, we
defined a hidden layer 10 and an output layer 2. The input was the neural data obtained
in Games A and B. The output was the vector (1,0) when the input was the data from
Game A and the vector (0,1) when the input was the data from Game B. The neural
network architecture was determined by training with the input data to recognize the

typical patterns of neural activity for either vector (1,0) or (0,1). This approach is a
so-called “supervised learning method.”
In Game A, the subjects were asked to consider the problem of whether to buy
financial stock after viewing private information via a computer monitor. As Table 1
illustrates, the private information was expressed by the gain frame in Case 2 and by the
loss frame in Case 3. We expected the subjects to make their decisions in light of the
private information. Common information was not displayed on the computer monitor.
We expected that the subjects in Game B would consider the identical problem in light
of common information. The common information was expressed by the loss frame in
Case 2 and by the gain frame in Case 3.
In the second step, using an additional check program, we examined the credibility
of the neural network architecture to recognize the typical neural patterns within fNIRS
data. The check program was executed to examine whether new activity data randomly
sampled from Games A and B would be properly classified again into the original data
groups of Games A and B using the trained neural network architecture. After we
checked the credibility of the neural network architecture, we progressed to the next
stage.
In the third step, we executed Game C, the core game from which we obtained the
neural data to be compared with the typical patterns of Games A and B using a pattern
recognition method. In the game, the subjects could freely consider the stock problem
after viewing both the private and common information that were expressed by either
the gain frame or the loss frame. We expected the subjects to freely choose whether

they would ignore the private information and accept only the common information.
The data obtained in Games C were compared with the two typical neural patterns
previously identified in Games A and B to obtain a rate of matching. If the rate of
matching for the neural pattern of Game B was larger than that of Game A, the subject
mainly used common information for financial decision making in the stock market.
Figure 5 illustrates the monitor screens presented in the short tasks of Games A, B,
and C in Cases 2 and 3. First, we explain the short task in Case 2. Before playing the
game, we explained to the subjects that there was a financial stock that provided a
chance for either gaining or losing $10 and asked the subjects to decide whether to buy
the stock. Then, the game began. The first screen of the computer monitor displayed a
white cross on a black ground to indicate that the subjects should begin the game in a
state of relaxation. After 10 seconds, Game A began. Game A presented the subjects
with private information for 7 seconds to allow them to consider the stock problem. The
private information was expressed by the gain frame, and the message on the monitor
was “ This is your private information. If you buy the stock, you will get $10 with a
60% probability. Do you buy the stock?”2 Neural data were obtained by fNIRS during
this consideration period. Figure 5 illustrates with gray areas the period for obtaining
neural data. After the presentation, the subjects were asked to press the “Y” key for yes
or the “N” key for no within 3 seconds. To evade emotional upset, the results of their
2 To make our experiment effective, we presented an incentive plan to the subjects. The subjects were informed about the possibility that their paycheck from participating in the experiment would be changed with the results of their decisions in the games. After each subject finished all of the games, we randomly selected two results from all results to be realized and determined his/her final paycheck. This changeable bonus paycheck was added to (or deducted from) the basic paycheck already determined in the contract. The luckiest bonus was $20, and the unluckiest bonus was -$20.

decisions were revealed after they had finished all of the games. Game A was repeated
3 times.
Game B presented the subjects with common information for 7 seconds, allowing
them to consider the problem. The common information was expressed by the loss
frame, and the message on the monitor was “ This is the common information to be
known by everyone. If you buy the financial stock, you will lose $10 with a 40%
probability. Do you buy the stock?” After the presentation, the subjects were asked to
press “Y” or “N” within 3 seconds. Game B was repeated 3 times.
Game C simultaneously presented the subjects with private and common
information on the same screen for 7 seconds. The private information was expressed
by the gain frame, and the common information was expressed by the loss frame. The
subject could freely select either the private information or the common information in
considering the problem. Neural data were obtained during the consideration period.
After the simultaneous presentation of the two types of information, the subjects were
asked to press “Y” or “N” within 3 seconds. Game C was repeated 3 times.
Next, we explain the short task in Case 3. The structure of the short task in Case 3
was basically the same as that in Case 2. Case 3 was only different from Case 2 in the
frames that expressed the private and common information. The private information
was expressed by the loss frame in Case 3 and by the gain frame in Case 2. The
common information was expressed by the gain frame in Case 3 and by the loss frame
in Case 2.
Random Selection of Neural Data for Brain Decoding

For the brain decoding, as Figure 6 illustrates, we randomly selected samples of
neural data points in three steps. First, we randomly selected a sample of 40 neural data
points per subject from Games A and B in Cases 2 and 3 to determine the neural
network architecture and to establish the typical neural patterns. Second, we randomly
selected a sample of 20 neural data points per subject from Games A and B in Cases 2
and 3 to examine the credibility of the determined neural network architecture. Finally,
we randomly selected a sample of 10 data points per subject from Game C in Cases 2
and 3. Each of the 10 data points was matched by pattern recognition with the two
typical neural patterns to obtain the rates of matching. If the rate of matching with
Game B was larger than the rate of matching with Game A, the subject mainly used the
common information for financial decision making. The random selection was
conducted for all 18 subjects. Data were collected for 180 cases of brain decoding with
pattern recognition.
Results
We obtained the following results from the three steps of experiments. In the first
step, we obtained neural activity data from 18 subjects in Games A and B in Cases 2
and 3. Figure 7a illustrates the neural activity data from the first subject obtained from
16 channels in Case 2. Baseline drifts in the neural data were removed. Trigger signals
showed the starting points of 7- second short tasks and 3-second pauses between the
tasks of pressing “Y” or “N”. First, Game A was repeated three times, and then Game B
was repeated three times. In Figure 7a, red and blue graphs illustrate the changes in
oxyhemoglobin (ΔCoxyHb) and de-oxyhemoglobin (ΔCdeoxyHb). We used the

changes in oxyhemoglobin for brain decoding after noise cancelling by the following
procedure: Figure 7b shows the result of frequency analysis of the neural activity data.
We eliminated spike noises in the red graph (77-94 pulse/min in Figure 7b) that were
produced by pulse-waves. The elimination of spike noises improved the effectiveness of
the event-related neural activity data in learning and training the neural network
architecture to accurately recognize the typical pattern of neural activity in Games A
and B.
We randomly selected a sample of 40 neural data points per subject from the
changes in oxyhemoglobin in Games A and B of Cases 2 and 3 for brain decoding after
eliminating spike noises. We trained the neural network architecture to recognize each
subject’s typical neural patterns in Games A and B, using the algorithms and the
progress stop conditions of the Neural Network Tool Box listed in Table 2a. Table 2b
lists the seed numbers that were used to generate a random number sequence for the
neural network weights initialization and to partition the initial data into a training set
for learning and a validation set. The seed numbers were determined to maximize the
performance in determining the neural network architecture. The numbers enable the
reproduction of our analytical results when the same numbers are used with the same
experimental data.
In the second step, we examined the credibility of the neural network architecture to
recognize the typical neural patterns. The check program was executed in each
experiment of Cases 2 and 3 for all subjects to examine whether new activity data points
randomly sampled from Games A and B would be properly classified into the original

data groups of Games A and B using the trained neural network architecture. Figure 8
shows the result for the first subject of the experiment in Case 2. As Figure 4 shows, the
output should be the vector (1,0) when the input was the data from Game A and the
vector (0,1) when the input was the data from Game B. Figure 8 shows that new activity
data randomly sampled from Games A and B were properly classified into the two data
groups within the neighborhoods of the vectors (1,0) and (0,1). We executed a t-test to
confirm the statistical significance of the difference between the averages in the two
classified data groups (p < 0.001). We also examined the results from all 18 subjects in
the experiment in Cases 2 and 3 using t-tests to confirm statistical significance (p <
0.001). The credibility of the trained neural network architecture was established.
In the third step, we executed Game C, the core game in which the subjects freely
chose whether they would ignore the private information and accept only the common
information. For each subject, 10 randomly selected neural data points from Game C
were matched with the two typical neural patterns previously identified by the checked
neural network in Games A and B to obtain a rate of matching. Figures 9a and 9b
illustrate the rates of matching in Cases 2 and 3, respectively. The horizontal axis of the
diagrams measures the rate of matching with the typical neural pattern of Game A,
which corresponds to the probability of utilizing the private information for the
financial decision making. The vertical axis measures the rate of matching with Game B,
which implies the probability of utilizing the common information. Figures 9a and 9b
were not identical: however, the average matching rates with Games A and B in the two
scatter diagrams were quite similar. In Figure 9a, the average matching rate with the

typical pattern of Game A was 0.184928 and that of Game B was 0.827050. In Figure
9b, the average matching rate of Game A was 0.142892 and that of Game B was
0.839575. Figure 10 illustrates a small difference between the average matching rates of
Figures 9a and 9b. We executed a t-test to examine the statistical significance of the
difference between Points X (0.184928, 0.827050) and Y (0.142892, 0.839575) in
Figure 10. The p values of the differences in the average matching rates between
0.184928 and 0.142892 and between 0.827050 and 0.839575 were, respectively, p =
0.245106 and p = 0.727220, and they were not statistically significant (p > 0.05). The
difference between Points X and Y was too small to be statistically significant.
The average matching rates with the typical pattern of Game B (i.e., 0.827050 and
0.839575) continued to be higher than the average matching rates with that of Game A
(i.e., 0.184928 and 0.142892) in Cases 2 and 3, illustrated by Figures 9a and 9b. The
continuously higher values of the matching rates with Game B imply that the subjects
continued to rely more strongly on common information than private information for
their decision making. The strong reliance on common information was herd mentality
inducing the agents to be likely to choose the same action as the others. The framing
effect produced by the use of different gain and loss frames did not effectively weaken
herd mentality in financial decision making.
Discussion
Implications of the Results
We built a bridge from the study of framing effects to the study of herd behavior,
which until now have been developed separately. Framing effects have been described

in the seminal manuscripts of Kahneman-Tversky (1979), Kahneman-Slovic-Tversky
(1982), and Tversky-Kahneman (1981, 1986). The earlier studies, however, only
considered framing effects on individual decision making. The nature of the relationship
between framing effects and psychologically based herd behavior is unknown.
According to the survey article by Hirshleifer-Teoh (2003), the study of herd behavior
also has a long history. Recent developments in studies of herd behavior have been
remarkable. The recent studies use the methods of experimental economics and interpret
their results by using the rational assumptions of individual profit-maximization
behavior. To further develop the study of herd behavior, we should explicitly adopt the
concept of boundedly rational agents to provide us new interpretations of the
experimental results. Our study of the relationship between framing effects and herd
mentality provides a good example for considering boundedly rational agents who are
likely to change their decision making as a result of spontaneous and irrational
motivation. The bridge from the study of framing effect to the study of herd behavior is
useful to researchers studying either of the two subjects.
Our experimental results have new implications for the strength of framing effects.
Focusing on attribute framing, a simple and robust frame, we considered a case in
which the identical financial problem was expressed differently by a gain or loss frame.
Levin-Gaeth (1988), Marteau (1989), Levin-Schneider-Gaeth (1998), and
Krishnamurthya-Carterb-Blair (2001) showed that agents are likely to change their
individual decision making when affected by attribute framing in everyday life.
Framing effects are sufficiently strong to change individual decision making. Our

results, however, suggested that framing effects are too week to affect herd mentality.
The results strongly suggested the existence of a new restriction on effective cases in
which framing effects change agents’ decision making.
We can interpret the experimental results in another way. Judging the value of
information for decision making, the subjects heuristically and strongly relied on the
labels of “individually obtained” or “commonly obtained” that defined the attributes of
information. The strong adherence to the difference between individual information and
common information can be interpreted to produce another type of attribute framing
that affects decision making. The new type of attribute framing was strong enough to
exclude the attribute framing effect previously discussed, which was produced from the
different expressive styles in a gain or loss frame of the identical decision problem.
There was a “lexicographic order” between the cases in which different types of
attribute framing have actual effects on decision making. In the interpretation of another
type of attribute framing, we should withdraw our previous suggestion that framing
effects were restricted. Our experimental results can be newly understood to show that
attribute framing was generally observed and that different types of attribute framing
had actual effects on decision making depending upon the existence or absence of herd
mentality.
Rationale for Focusing on Cases 2 and 3
We focus on Cases 2 and 3 with mixed frames, ignoring Cases 1 and 4 with a single
frame. In this section, we consider the reason for focusing on Cases 2 and 3. The

problem is whether our focusing on Cases 2 and 3 can be justified when we examine the
magnitude of framing effects on herd mentality.
We consider the following alternative cases, (A) and (B), in which framing effects
theoretically change the use of private and common information for decision making.
(A) We consider the case in which agents prefer a gain frame to a loss frame. Agents
increase the use of information with a gain frame and decrease the use of information
with a loss frame. In Case 3, common information is expressed by a gain frame, and
private information is expressed by a loss frame. The possibility of using common
information is maximized in Case 3. Conversely, in Case 2, common information is
expressed by a loss frame, and private information is expressed by a gain frame. The
possibility of using common information is minimized in Case 2. The change of the
possibility of using common information implies the change in the strength of the herd
mentality, that is, a framing effect produced by the preference for a gain frame over a
loss frame. To examine whether the framing effect on herd mentality is strong or weak,
we should compare the maximized and minimized possibilities of using common
information in Cases 2 and 3. If the difference between the maximized and minimized
possibilities of using common information is too small to be statistically significant, we
conclude that framing effects cannot affect herd mentality in financial decision making.
Conversely, if the difference is sufficiently large, we conclude that framing effects
markedly affect herd mentality.
(B) We consider the other case in which agents pay more attention to a loss frame than a
gain frame when making a decision. This case is dealt with in the same manner as

discussed above. The possibility of using common information is maximized in Case 2
and minimized in Case 3. To examine whether the framing effect on herd mentality is
strong or weak, we should compare the maximized and minimized possibilities of using
common information in Cases 2 and 3.
The above discussions of (A) and (B) justify that we focus on Cases 2 and 3 with
mixed frames and ignore Cases 1 and 4 with a single frame. We can obtain sufficient
results by analyzing Cases 2 and 3 to examine the strength of framing effects on herd
mentality for financial decision making.
Concluding Remarks
Previous studies have considered the framing effect on individual decision making;
however, the effect of frames on herd mentality and herd behavior has not been studied.
We conducted a neuroeconomic experiment to address the new unsolved problem. We
focused on the concept of attribute framing, a simple and strong framing, to consider the
case in which the same financial problem was expressed by a gain or a loss frame. Our
problem was to examine whether attribute framing would have substantial effects on
herd mentality, as well as on individual decision making. Our results implied that the
framing effect did not affect the herd mentality to primarily rely on common
information, inducing agents to be likely to choose the same action as others. We claim
that the framing effect is sufficiently strong to change individual decision making;
however, it is too weak to affect herd mentality.
The above conclusion strongly suggested that framing effect exerted a significant
effect only in a restrictive case of individual decision making. There is, however,

another interpretation of the experimental results. We already discussed that
psychologically based herd behavior could be interpreted as being produced by another
type of attribute framing that was labeled by information sources as “commonly
obtained” or “individually obtained” to affect decision making. In the alternative
interpretation of the results, we should withdraw our previous suggestion that framing
effects were restricted by herd mentality. We can understand that framing effects were
generally observed not only in individual decision making but also in psychologically
based herd behavior that was associated with heuristic and boundedly rational
adherence to common information for decision making.
The experimental results allow us the alternative interpretations. However, both of
the interpretations are based on the same fact that adherence to common information has
strong effects on decision making. The adherence to common information may be
produced by biases in social mind to value the social relationship among agents above
everything else. Sherman-Gawronski-Trope (2014) show that dual-process theories are
useful to investigate the reason why social mind dominates private mind. Our
experimental results will be more deeply explained by dual-process theories in future
researches.
In this experiment, we executed a brain reading method using a neural network
architecture that used a pattern recognition method to match the neural activity data in
the core game C with the typical neural activity data in the preliminary games A and B.
In the pattern recognition method, we examined the difference between the neural
activity data not only by comparing the most activated brain regions but also by

comparing the relationship among multiple brain regions with correlated activations.
The pattern recognition is a more effective method to investigate the function of the
brain than earlier methods that tried to specify only the most activated brain region
during the execution of experiments. Brain reading using the pattern recognition method
is useful for carefully examining similarities or differences between neural activity data
to broaden the research horizon of neuroeconomic studies.

Acknowledgments:
This study was supported in part by a grant from the Japanese Ministry of Education,
Culture, Sport, Science, and Technology (Grant in Aid for Scientific Research,
No.2020002) awarded to Masaki Nakagome and by a grant from the Research Institute
at Aoyama Gakuin University (Grant in Aid for Research in Social Science Areas)
awarded to Masaki Nakagome and Hideto Ide. Many thanks are expressed to Tetsuji
Oyama for his technical support to develop our brain reading method.

References
Banerjee, A. V. (1992), “A Simple Model of Herd Behavior,” Quarterly Journal of
Economics, vol.107, no.3, pp.797-817.Bikhchandani, S., Hirshleifer, D., and Welch, I.
(1992), “A Theory of Fads, Fashion, Custom, and Cultural Change in Informational
Cascades,” Journal of Political Economy, vol.100, no.5, pp.992-1026.
Cipriani, M. and Guarino, A. (2005), “Herd Behavior in a Laboratory Financial Market,”
American Economic Review, vol.95, pp.1427-1443.
Cipriani, M. and Guarino, A. (2009), “Herd Behavior in Financial Markets: An
Experiment with Financial Market Professionals,” Journal of European Economic
Association, vol.7, no.1, pp.206-233.
Hirshleifer, D. and Teoh, S.H. (2003), “Herd Behaviour and Cascading in Capital
Markets: a Review and Synthesis,” European Financial Management, vol.9, no.1,
pp.25-66.
Kahneman, D. and Tversky, A. (1979), "Prospect Theory: An Analysis of Decision
under Risk," Econometrica, vol.47, pp.263-291.
Kahneman, D. , Slovic, P., and Tversky, A. (1982), Judgment Under Uncertainty:
Heuristics and Biases, New York: Cambridge University Press.
Krishnamurthya, P., Carterb, P., and Blair, E. (2001), “Attribute Framing and Goal
Framing Effects in Health Decisions,” Organizational Behavior and Human Decision
Process, vol.85, pp.382-399.
Levin, I.P. and Gaeth, G.J. (1988), “Framing of Attribute Information Before and After
Consuming the Product,” Journal of Consumer Research, vol.15, pp.374-378.

Levin, I.P., Schneider, S.L., and Gaeth, G.J. (1998), “All Frames are not Created Equal:
A Typology and Critical Analysis of Framing Effects,” Organizational Behavior and
Human Decision Processes, vol.76, pp.149-188.
Marteau, T.M. (1989), “Framing of Information: Its Influence upon Decisions of
Doctors and Patients,” British Journal of Social Psychology, vol.28, pp.89-94.
Sherman, J.W., Gawronski, B., and Trope, Y. (2014), Dual-Process Theories of the
Social Mind, New York: Guilford Press.
Strangman, G., Culver, J.P., Thompson, J.H., and Boas, D.A. (2002), “A Quantitative
Comparison of Simultaneous BOLD fMRI and NIRS Recordings During Functional
Brain Activation,” Neuro Image, vol.17, pp.719-731.
Tversky, A. and Kahneman, D. (1981),"The Framing of Decisions and the Psychology
of Choice," Science, vol.211, 453-458.
Tversky, A. and Kahneman, D. (1986), "Rational Choice and the Framing of
Decisions," Journal of Business, vol.59, pp251-278.
Welch, I. (1992), “Sequential States, Learning, and Cascades,” Journal of Finance,
vol.47, no.2, pp.695-732.

common information
expressed by
a gain frame
common information
expressed by
a loss frame
private information
expressed by
a gain frame
Case 1
Case 2
private information
expressed by
a loss frame
Case 3
Case 4
Table1 Four Cases with Private and Common Information Expressed by a Gain or Loss
Frame
There are four cases (2 x 2 cases) with two-dimensional framing effects. Cases 1
and 4 are expressed only by a single frame, whereas Cases 2 and 3 are expressed by
mixed frames.

Algorithms
Data division function: random data division function
Training function: scaled conjugate gradient training function
Performance function: mean squared error performance function
Derivative function: default derivative function
The Progress Stop Conditions for Learning
Epoch: 1000
Performance: 0.00
Gradient: 1.00 e-10
Validation Checks: 6
Table 2a The Algorithms and the Progress Stop Conditions for Determining the Neural
Network Architecture Using the Neural Network Tool Box (nntraintool)
We trained the neural network architecture to recognize each subject’s typical neural
patterns in Games A and B, using the algorithms and the progress stop conditions of the
Neural Network Tool Box listed in Table 2a.

(Case 2)
subject 1 2 3 4 5 6 7 8 9
seed 10 -4 8 -11 1 9 0 1 -9
subject 10 11 12 13 14 15 16 17 18
seed 15 11 9 14 -10 11 -1 9 -12
(Case 3)
subject 1 2 3 4 5 6 7 8 9
seed 15 16 -14 -5 -11 -14 -14 12 5
subject 10 11 12 13 14 15 16 17 18
seed 16 -8 -13 9 0 2 15 -12 -6
Table 2b The Seed Numbers Used to Generate a Random Number Sequence for Each
Subject in Cases 2 and 3
The seed numbers were used to generate a random number sequence for the neural
network weights initialization and to partition the initial data into a training set for
learning and a validation set. The seed numbers were determined to maximize the
performance in determining the neural network architecture. The numbers enable the
reproduction of our analytical results when the same numbers are used with the same
experimental data.

Figure 1 fNIRS Multi-channel Digital Sensors on a Headband For fNIRS, we used the Spectratech OEG-SpO2 model (updated from the OEG-16
model, with a sampling rate of 6.10Hz, manufactured by Spectratech, Inc., Tokyo and
Yokohama, Japan), which is based on the modified Beer-Lambert law, to scan the
frontal cortex of the brain. This fNIRS equipment uses small, lightweight, 16-channel
digital sensors on a headband.

Figure 2 The Locations of the 16 fNIRS Channels for the First Subject, Mapped onto a
Canonical Brain
The 16-channel digital sensors were fixed on the frontal cortex by the headband
during the experiment. After each subject completed the experiment, the location of
each sensor was measured using 3-D positioning with FN-1000 software (manufactured
by Topcon Corporation, Tokyo, Japan) and a digital camera (Nikon D5100) calibrated
using FN-Calib software (manufactured by Topcon) to confirm that the channels were
properly located on the frontal cortex of the brain. Figure 2 illustrates the locations of
the sensors for the first subject mapped onto a canonical brain using NIRS-SPM
software, which is a MATLAB-based software for performing statistical analysis of
brain imaging data from fNIRS signals (developed at the Bio Imaging Signal Processing
Lab in Korea). We obtained event-related, high-sensitivity optical signals from these
channels.
Game A Game B Game C
Rest
(10 minutes)
Figure 3 The Experimental Tasks were Composed of Three Games, A, B, and C
Games A and B were preliminary games that produced neural data for learning and
training the neural network architecture to accurately recognize the typical pattern of
neural activity in Games A and B. Game C was the core game from which we obtained
the neural data to be compared with the typical patterns of Games A and B using a
pattern recognition method. In the game, the subjects could freely consider the stock
problem after viewing both the private and common information that were expressed by
either the gain frame or the loss frame. There was a10-minute rest between Games B
and C for refreshment and for mood-changing conversation with friends to prepare for
Game C.

Input Neural Network Architecture Output
Neural data Hidden Layer (10) (1,0) when input is the data from Game A
obtained in Output Layer (2) (0,1) when input is the data from Game B
Games A and B
Figure 4 The Concept of Learning and Training the Neural Network Architecture Using
the Neural Activity Data Obtained in Games A and B
Figure 4 illustrates the concept of learning the neural network architecture. Using
the “nntraintool” in the Neural Network Tool Box, we defined a hidden layer 10 and an
output layer 2. The input was the neural data obtained in Games A and B. The output
was the vector (1,0) when the input was the data from Game A and the vector (0,1)
when the input was the data from Game B. The neural network architecture was
determined by training with the input data to recognize the typical patterns of neural
activity for either vector (1,0) or (0,1). This approach is a so-called “supervised learning
method.”

Case 2 Case 3
Start
(10 seconds)
Game A
(7+3 seconds,
repeated 3
times)
Press “Y” or “N”. (3 seconds) Press “Y” or “N”. (3 seconds)
Game B
(7+3 seconds,
repeated 3
times)
Press “Y” or “N”. (3 seconds) Press “Y” or “N”. (3 seconds)
Game C
(7+3 seconds,
repeated 3
times)
Press “Y” or “N”. (3 seconds) Press “Y” or “N”. (3 seconds)
Figure 5 The Monitor Screens Presented in Short Tasks of Games A, B, and C in Cases 2 and 3
If you buythe stock,you will get $10with a 60%probability.
This is your private information.Do you buy the stock? (7 seconds)
If you buy the stock, you willlose $10 with a 40% probability.
This is your private information.Do you buy the stock? (7 seconds)
If you buy the stock, you willlose $10 with a 40% probability.
This is the common information to be known by everyone. Do you buy the stock? (7 seconds)
If you buythe stock,you will get $10with a 60%probability.
This is the common information to be known by everyone. Do you buy the stock? (7 seconds)
If you buythe stock,you will get $10with a 60%probability.
This is your private information.Do you buy the stock? (7 seconds)
If you buy the stock, you willlose $10 with a 40% probability.
This is the common information to be known by everyone. Do you buy the stock? (7 seconds)
If you buy the stock, you willlose $10 with a 40% probability.
This is your private information.Do you buy the stock? (7 seconds)
If you buythe stock,you will get $10with a 60%probability.
This is the common information to be known by everyone. Do you buy the stock? (7 seconds)

Figure 6 Random Selection of Neural Data Points for Brain Decoding in Three Steps
For the brain decoding, we randomly selected samples of neural data points in three
steps. First, we randomly selected a sample of 40 neural data points per subject from
Games A and B in Cases 2 and 3 to determine the neural network architecture and to
establish the typical neural patterns. Second, we randomly selected a sample of 20
neural data points per subject from Games A and B in Cases 2 and 3 to examine the
credibility of the determined neural network architecture. Finally, we randomly selected
a sample of 10 data points per subject from Game C in Cases 2 and 3. Each of the 10
data points was matched by pattern recognition with the two typical neural patterns to
obtain the rates of matching.

Figure 7a The Neural Activity Data from the First Subject Obtained from 16 Channels in Case 2.
Red and blue graphs illustrate the changes in oxyhemoglobin (ΔCoxyHb) and
de-oxyhemoglobin (ΔCdeoxyHb). We used the changes in oxyhemoglobin for brain
decoding after eliminating spike noises produced by pulse-waves.
Figure 7b The Result of Frequency Analysis of the Neural Activity Data from the First Subject in Case 2
Figure 7b was the result of frequency analysis of the neural activity data. We
eliminated spike noises in the red graph (77-94 pulse/min in Figure 7b) that were
produced by pulse-waves. The elimination of spike noises improved the effectiveness of
the event related neural activity data in learning and training the neural network
architecture to accurately recognize the typical pattern of neural activity in Games A
and B.

Figure 8 The Results of the Check Program to Examine the Credibility of the Neural
Network Architecture for the First Subject of the Experiment in Case 2
Figure 8 illustrates the results of the check program executed for the first subject of
the experiment in Case 2 to examine the credibility of the neural network architecture to
recognize the typical neural patterns of Games A and B. Figure 8 shows that new
activity data points randomly sampled from Games A and B were properly classified
into the two data groups within the neighborhoods of the vectors (1,0) and (0,1). The
credibility of the trained neural network architecture was established.

Figure 9a The Rates of Matching Illustrated in the Scatter Diagram Obtained by Brain
Decoding of Neural Data of 18 Subjects in Case 2
For each subject, 10 randomly selected neural data points from Game C were
matched with the two typical neural patterns previously identified by the checked neural
network in Games A and B to obtain a rate of matching. The horizontal axis of the
diagram measures the rate of matching with the typical neural pattern of Game A, which
corresponds to the probability of utilizing the private information for the financial
decision making. The vertical axis measures the rate of matching with Game B, which
implies the probability of utilizing the common information.
0.0
0.1
0.2
0.3
0.4
0.5
0.6
0.7
0.8
0.9
1.0
0.0 0.1 0.2 0.3 0.4 0.5 0.6 0.7 0.8 0.9 1.0
the
mat
chin
g ra
te w
ith th
e ty
pica
l pat
tern
of G
ame
B
the matching rate with the typical pattern of Game A

Figure 9b The Rates of Matching Illustrated in the Scatter Diagram Obtained by Brain
Decoding of Neural Data of 18 Subjects in Case 3
0.0
0.1
0.2
0.3
0.4
0.5
0.6
0.7
0.8
0.9
1.0
0.0 0.1 0.2 0.3 0.4 0.5 0.6 0.7 0.8 0.9 1.0
the
mat
chin
g ra
te w
ith th
e ty
pica
l pat
tern
of G
ame
B
the matching rate with the typical pattern of Game A

the average matching rate with the typical
neural pattern of Game B
the average matching rate with the typical
neural pattern of Game A X: a point representing the average matching rate in Case 2 where private information
was expressed by a gain frame and common information was expressed by a loss frame
Y: a point representing the average matching rate in Case 3 where private information
was expressed by a loss frame and common information was expressed by a gain frame
Figure 10 A Small Difference Between the Average Matching Rates in Cases 2 and 3
Figure 10 illustrates a small difference between the average matching rates in Cases
2 and 3. The difference between Points X and Y was too small to be statistically
significant. The average matching rates with the typical pattern of Game B continued to
be higher than the average matching rates with that of Game A The framing effect
produced by the use of different gain and loss frames did not effectively weaken herd
mentality in financial decision making.