mass balance and thermodynamic description of solid state fermentation of lignocellulosics...
TRANSCRIPT

Journal of Industrial Microbiology, (1995) 15, 25-31 �9 1995 Society for Industrial Microbiology 0169-4146/95/S12.00
Mass balance and thermodynamic description of solid state fermentation of lignocellulosics by Pleurotus ostreatus for animal feed production P Das and MN Karim
Department of Chemical and Bioresource Engineering, Colorado State University, Fort Collins, Colorado 80523, USA
This study was focused primarily on the degradation of lignin in water hyacinth and barley straw for animal-feed production. The experiment was performed in a 1.5-L Applikon fermenter for 30 days, varying the air flow rate from 0.022 VVM/0.047 VMM to 0.048 VVM/0.102 VMM. A novel approach was introduced for prediction of a kinetic model by using instantaneous respiratory quotient (RQ) measurements and steady state elemental balances. Growth kin- etics were determined for the fungus in a 30-day fermentation with a mixture of barley straw and water hyacinth as the substrate. The instantaneous heat-interaction profile was predicted from steady state balances. Fermentation data were checked for consistency using the entropy balance inequality, and thermodynamic efficiency was calcu- lated to show that degradation of lignocellulosics by Pleurotus ostreatus followed more than one metabolic pathway during the course of the fermentation. Growth of P. ostreatus on lignocellulosics, such as water hyacinth and barley straw, was di-auxic or possibly tri-auxic during the 30 days of fermentation.
Keywords: protein to lignin ratio; in vitro dry matter enzyme digestibility; entropy balance model
Introducticm
White-rot fungi, such as Pleurotus ostreatus, degrade lig- nin. There are other lignin-degrading fungi, such as Phanerochaete crysosporium, that utilize more cellulose and hemice]lulose than lignin; however, the rumen can digest cellulose and hemicellulose but not lignin. Lignin limits rumen digestibility of the lignocellulosics. A com- pletely lignin-specific fungus is needed. However, lignin degradation is complicated and not yet completely under- stood.
In a tropical climate, the water hyacinth is a common agricultural weed that is rich in lignocellulose. The organ- ism could be used for generating animal fodder for developing countries such as Bangladesh, where the water- hyacinth is a problem because it clogs waterways. In this study, attempts were made to convert water hyacinth to a protein-rich animal feed and to give a thermodynamic description of the solid state fermentation process.
Materials and methods
Organism and inoculum Pleurotus ostreatus, ATCC 32783, was cultured in slants containing ]0 ml of yeast malt agar (3.8 g per 100 ml water) at 30 ~ C. After 10 days of incubation, the fungus was transfe[red to petri plates containing 10 ml yeast malt agar. Barley grain (10% of the wet weight of the substrate) was sterilized in 10 1-L canning jars (each jar containing equal amounts of grain), and the sample was autoclaved for 30 min at 120 ~ C. Each jar was inoculated with 6-8
Correspondence: MN Karim, Department of Chemical and Resource Engineering, Colorado State University, Fort Collins, CO 80523, USA Received 13 December 1993; accepted 9 February 1995
plugs (no. 9 cork-borer) of the fungus cultured in the petri plates and incubated for 2 weeks at ambient temperatures (28-29 ~ C).
Substrate preparation Water hyacinth plants, excluding roots, were separated into leaves and bulbs. The plants, originally from Florida, were obtained from Raymond E. Smith, Fort Collins, Colorado. The leaves, bulbs and barley straw were chopped according to the following size distribution: leaves (2.5-3.8 x 1.3- 2.5cm), bulbs (2-2.5 • 1.3-2.5cm) and straw (1.3- 2.5 cm). The pH was adjusted to 6.0 using 90% tris hydroxy methyl-amino methane hydrogen chloride. The pH was measured using a pH meter and taking a 10-g sample, dilut- ing it with 90 ml of water and soaking it for 1 h.
Analytical methods Neutral Detergent Fiber (NDF), Acid Detergent Fiber (ADF) and Acid Detergent Lignin (ADL) of the straw were determined according to the procedure of Agricultural Handbook No. 379 [4]. Total protein was estimated by measuring trichloroacetic acid (TCA)-soluble Kjeldahl pro- tein, and in vitro dry matter enzyme digestibility (INVDMED) was determined by the procedure reviewed by Rajarathnam and Bano [8]. Analysis of oxygen and carbon dioxide was accomplished using a gas chromatograph made by Gow-Mac Instrument Company (Madison, N J, USA, model no. 69-550), using a thermal conductivity detector.
Experimental Experiments were performed in a 1.5-L Applikon fermenter (model no. Z81305C001, Foster City, CA, USA). The inlet air was humidified by a humidifying column ( l l5-cm length, 5.5-cm OD) containing Rashig rings. The flow rate of water passing through the column was 100 ml rain 1.

26
Fermentation of lignocellulosics by Pleurotus ostreatus P Das and MN Karim
The outlet gas was dried by passing it through a silica-gel dryer (22 cm length, 4 cm outer diameter). The fermenter was insulated with 1.25-cm thick fiber glass insulation, and the temperature in the fermenter was maintained at 28- 30 ~ C. Figure 1 illustrates the experimental set-up. The fer- menter was loaded as follows: wet water hyacinth weighing 450 g (36% leaves and 64% bulbs/stems) was mixed with 22.5 g of dry barley straw. Eighty milliliters of 90% buffer solution (tris-hydroxy methyl-amino methane hydrogen chloride in water) and 105 ml of water were added to the mixture. The mixture was then placed in an autoclavable bag and autoclaved for 30 min at 121 ~ C. Thirty-five grams of mycelium and 16.4 g of barley grain with Pleurotus mycelium were added to the bag and thoroughly mixed. Pure mycelium was obtained by inoculating the canning jars which contained 14.8 g of barley grain, incubating the jars for 30 days, and scratching the mycelium from the glass surface. The mixture was then transferred to the fer- menter. Initially, the moisture content in the substrate was 75.9%, and the air flow rate in the fermenter varied from 33.5-72.5 mlmin -~ (0.022 VVM/0.047 VMM to 0.048 VVM/0.102 VMM). VVM is defined as the volumetric air flow rate (ml rain -1) divided by the volume of the fer- menter (ml). Similarly, VMM is defined as the volumetric air flow rate (ml rain t) divided by the total mass of the wet material (g) in the fermenter.
Modeling Solid state fermentation (SSF) is a complex system, and it is difficult to model a solid state fermentation process via the chemical reaction engineering approach due to the het- erogeneity of the substrates, the discrepancy in composition because of its agricultural origin, and the very poor mixing environment in the fermenter. A novel approach was pro- posed that requires only the measurement of gaseous components from the fermenter by using a black-box approach. Thermodynamic analysis of biological systems is an active field because [1,9]:
�9 Biological systems are often not understood from the microbial physiology point of view.
�9 If metabolic pathways are known, the physical and chemical properties must be assumed because pertinent information is not available in the literature.
�9 Understanding the microbial system is important in
Water in ]'hermoc
Saturate=~d 26 air
Water out ~1 ~s tg te
Insulati6n j = Air in
Humidifier Fermentor
Air out
:ouple
Silica Gel Column
Figure 1 Experimental set-up for 30-day fermentation
developing a generalized tool for the analysis of bio- chemical reactions without knowing the complex intra- cellular processes. The thermodynamic approach is well suited to this type of analysis because the system can be modeled from a macroscopic point of view. All biologi- cal systems proceed via non-equilibrium processes; thus, non-equilibrium thermodynamics must be used instead of equilibrium thermodynamics.
For these reasons, researchers use the black-box approach to model metabolic processes [6,11]. Among the various black box parameters cited in the literature [1], degree of reduction was taken into consideration in this study. As mentioned earlier, solid state fermentation is a complex system, and the analysis of the solid samples from the fermenter does not provide precise information of the reaction. Attempts have been made in this study to obtain kinetic information from stoichiometric information incor- porated with the instantaneous respiratory quotient (RQ) measurements.
Prediction of growth kinetics from steady state balances The fermenter was assumed to be a black-box containing an initial amount of substrate. Saturated air is then pumped into it. Fermentation produces biomass and carbon dioxide. A schematic of the fermenter system as well as the black- box model are shown in Figures 1 and 2, respectively. The fermenter mass balances are determined via elemental analysis, based on one mole of carbon, and assuming the chemical formula of the substrate and the biomass as CHaObN o and CHxOyNz, respectively.
Introducing Aq5 i = ~bj - qS5, where j is any species other than water and i is any stream in the fermenter (Figure 2) and defining 2xqSw = qSw + qSwv - qS~ for water, elemental balances for carbon, oxygen, hydrogen and nitrogen can be obtained as follows:
Ybo -- Yso -F RQ = 0
Y �9 Ybo -F 2 �9 RQ + Ywo = 2 + b �9 Yso
a- Y~o = x �9 Ybo + 2 ' Ywo
c 'Yso = z- Ybo
(1)
(2)
(3)
(4)
The yield coefficients can be defined as follows:
moles biomass produced Ybo =
moles 02 consumed
moles substrate consumed Yso
moles O2 consumed
moles moisture produced Ywo =
t~Q=
moles 0 2 consumed
moles COz produced
moles 02 consumed
The compositional formula of the substrate (dry water hya- cinth and barley straw mixture) and the fungus (biomass)

Figure 2
Fermentation of lignocellulosics by Pleurotus ostreatus P Das and MN Karirn
Total moles, @2
Moles fed initially
Total moles, ~ l Substrate (moles), r
Water (moles), r
l Moles at any t ime
Total moles, @3 Substrate (moles), ~b, Biomass (moles), Cb Water (moles), r
Oxygen (moles), r Nitrogen (moles), ~N.2 t
Carbon dioxide (moles), q~bO~ = 0
Heat j), Q Shaft worl (Kj), W
Total moles, r B ,
Oxygen (moles), ~07 Nitrogen (moles), r
Carbon dioxide (moles), 4~co2 Water vapor (moles), r
Black-box representation of a fermenter
27
has been obtained from elemental analysis of the dry sub- strate and the fungus. A large quantity of substrate (200 g) and fungal mycelium (100 g) was vacuum-dried at 40~ and milled before performing the elemental analysis. The total dry matter used for the elemental analysis of the substrate and biomass was 10 g for each case. The chemical composition of the fungus varies depending on the maturity of the fungus; however, there is no way to obtain the instan- taneous biomass composition. Similarly, the substrate (lignocellulosic mixture) chemical formula depends on the maturity of the plant and the proportion of leaves and stems used in the substrate. The best approximation is to assume a constant chemical formula for the biomass and the sub- strate. Coefficients of substrate (CHaObNo) and biomass (CHxOyNz), on the basis of 1 mole of carbon, are: a - - 1.692, b = 0.72, c -- 0.05, x = 0.17, y = 0.64, and z = 0.08. Solving Equations (1-4) simultaneously and sub- stituting the values of a, b, c, x, y and z in Equations 1-4, provides the following relationships:
Yso = 2.667 (RQ) (5)
Ybo = 1.667 (RQ) (6)
Ywo = 2.115 (RQ) (7)
Thus, measuring the oxygen consumed and the carbon dioxide evolution rate, different yield coefficients can be calculated. From these yield coefficients, the concentrations of biomass and substrate can be calculated.
Energy ancl entropy balances The generalized degree of reduction is the number of equiv- alents of oxygen required for the complete oxidation of that quantity of organic compound contained in 1 gram atom
of carbon. This parameter can be used advantageously to simplify the fermenter energy and entropy balances [11]. To perform this simplification, assume: (i) CO2 and N2 are in the gaseous state, and HzO is in the liquid state at stan- dard temperature and pressure; (ii)heat capacity remains constant in the experimental temperature range; (iii)the inlet temperature equals the fermenter temperature; and (iv) the heat of combustion is expressed as Ah~ = -109 .04 . y~kJmo1-1 [11]. These assumptions give the simplified energy balance of the fermenter. Equ- ation 8 represents the final expression for energy balance of the fermenter with these assumptions.
Q + W = 109.4. (A4)~y N + A4Ny N + A~bbYb) (8)
Here, h% is heat of combustion of species i at 298 K, % is the degree of reduction of species i, Q and W are the fer- menter heat input and the shaft work input, respectively. Division by (-A~bo2), substitution of Aqbi's in terms of yield coefficients as defined earlier and insertion of the %'s (% = 4.25 and % = 2.89) into Equation 8 gives:
Q/( - A4)o2 ) = 109.04. (2.89. Ybo -- 4.25 "Yso) i9)
Equation 10, which is the entropy balance on the fermenter, can be obtained from the following assumptions: (i) all the assumptions from which Equation 7 were obtained; (ii) the substrate components behave as an ideal mixture, and (iii) the Gibb's free energy of combustion can be described as: Ag~ = - 110.23.% kJmo1-1 [11].
% " Y~o - % " Ywo + ~ / o 2 - - ~ / c o 2 ' RQ + % �9 Y b o ~ 0 (10)

28
Fermentation of lignocellulosics by Pleurotus ostreatus P Das and MN Karim
With the insertion of Yso, Ybo and Yz values into Equation 10, Equation 11 is obtained.
T . Sg ..... ~,o,/( - A4)o2) = 6.517. RQ + 4.0 >- 0 (11)
Here, Sg . . . . . ,~o, is entropy generated in the fermentation pro- cess. Another important thermodynamic paraneter, ~, is the thermodynamic efficiency of the system. Roels and Suijdam [10] proposed a definition of the thermodynamic efficiency (Equation 12).
T - S . . . . . . .o J ( - A+o~)
= 1 - --jYF'~ Y j Y j o - - Z g c ' ~ " ' ~ Y i Y j o (12)
The relationship between the thermodynamic parameters derived in this section with the fermentation experimental results are established later.
R e s u l t s
Solid state fermentation is a very heterogeneous system, and it was pointed out above that it is very difficult to col- lect precise information by measuring solid samples from the fermenter. In order to circumvent this problem, only gaseous components were measured. The implication of these measurements will be described in this section.
The fermenter is aerated from the top via a tube with an outer diameter of 0.5 cm (Figure 1). When aeration is performed in one section of the fermenter, oxygen diffusion to other sections is minimal; hence, the sections can be considered independent from one another. Moreover, no stirring is performed because the fungal mycelium of the P. ostearatus is extremely sensitive to shear force [7]. The performance of the fermenter is determined by day-to-day measurements of the respiratory quotient (RQ). The RQ is calculated from the ratio of evolved carbon dioxide and consumed oxygen. Figure 3 illustrates the RQ values versus
+ +g 1 -
0 ~ - ' , I , , , I . . . . I , , , , I , , , ,
0 5 10 15 20 25 30
Time (day)
Figure 3 Respiratory coefficient profile for the Applikon fermenter
sampling time. Each point is the average of two fermented samples that were analyzed in duplicate via gas chromato- graphy. The error bar is calculated by dividing the standard deviation by the mean of the four measurements. Generally, Figure 3 shows a relatively large error for a given RQ measurement, which indicates that the biological fermen- tation varies during the growth due to inhomogeneities in the fermented material. Even if no solid samples are with- drawn and analyzed during the fermentation period of 30 days, one assumes that both anaerobic and aerobic fermen- tation are operative in some regions of the fermenter. This statement is not unreasonable because thermodynamic efficiencies vary with time, and as mentioned by Dawes [3], this can only be explained by the presence of an anaerobic metabolic process. Three maxima can be observed from the RQ profile in Figure 3. These peaks in fermentation activity are in the vicinity of 4, 10, and 25 days. The presence of these peaks indicates that more than one component is pre- sent in the growth substrate. Inhomogeneities in the sub- strate can also be invoked to rationalize this behavior. Due to the heterogeneity of the fermentation environment, anaerobic processes will be dominant in some regions of the fermenter, and because the fermentation proceeds read- ily this implies that in the oxygen-poor regions the fungus adapts and survives, and carries the reaction via a second- ary metabolic pathway.
At the end of the fermentation period (30 days), the total fermented matter was dried overnight at 100 ~ C. The deter- mination of the residual components (lignin, cellulose, hemicellulose, and soluble sugars) are summarized in Table 1. After fermentation, reduction in all the residual compo- nents was observed (Table 1). This decrease indicates an effective fermentation process. Fermentation led to con- sumption of 63% of the lignin, 85% of the cellulose, 65% of the hemicellulose, and 43% of the soluble sugars on the basis of the original amount of each component (Table 1). One of the objectives of this study was to find a fungus that would specifically degrade lignin. The results were not satisfying because the P. ostreatus is not lignin-specific. Nevertheless, the results show that the fungus degrades twice the amount of lignin relative to the total amount of cellulose and hemicellulose. The reduction of the protein content relative to the control is a bit surprising, but this may be due to the loss of soluble protein during analysis and the production of volatile nitrogenous fermentation by-products.
In view of the objectives, the fermented matter also should exhibit a protein enrichment. It is clear that this objective was not fully achieved (Table 1), but if the protein to lignin ratio is calculated (Table 2), it is shown that this ratio increased by a factor of 2 relative to the control. Although after fermentation the absolute content in proteins decreased, the second objective was met because the P. ostreatus led to an effective increase of the proteins relative to the lignin. The in vitro enzyme digestibility test, INVDMED, is a convenient way to characterize how rumi- nants will digest the feed. However, these determinations are fraught with experimental uncertainties. The determi- nation of the INVDMED from the fungus-treated feed was usually lower relative to the control (Table 2).
Fermentation of Iignocellulosics by Pleurotus ostreatus P Das and MN Karim
Table 1 Fiber components on a wet basis after 30 days of fermentation
Sample Lignin Cellulose Hemicellulose Soluble Proteins (%) (%) (%) sugar (%)
(%)
Control 0.60 3.4 2.8 13 4.4 After 30 days 0.22 0.50 0.96 7.2 3.4
29
Table 2 Relevant parameters determined after 30 days of fermentation
Sample INVDMED ~ Proteins to lignin ratio
(%) (%)
Control 88 7.4 After 30 days 83 15
aThe INVDMED abbreviation represents in vitro dry matter enzyme digestibility
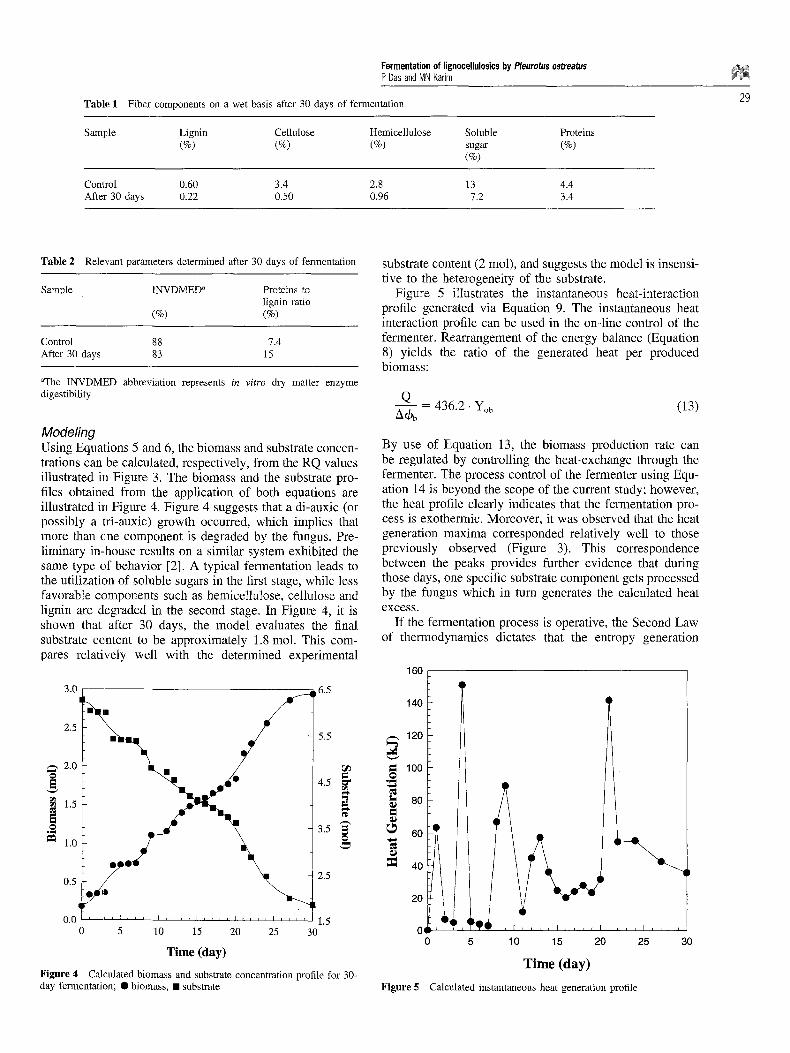
Modeling Using Equations 5 and 6, the biomass and substrate concen- trations can be calculated, respectively, from the RQ values illustrated in Figure 3. The biomass and the substrate pro- files obtained from the application of both equations are illustrated in Figure 4. Figure 4 suggests that a di-auxic (or possibly a tri-auxic) growth occurred, which implies that more than one component is degraded by the fungus. Pre- liminary in-house results on a similar system exhibited the same type of behavior [2]. A typical fermentation leads to the utilization of soluble sugars in the first stage, while less favorable components such as hemicellulose, cellulose and lignin are degraded in the second stage. In Figure 4, it is shown that after 30 days, the model evaluates the final substrate content to be approximately 1.8 mol. This com- pares relatively well with the determined experimental
3.0 6.5
2.5
2.0
i 1.5
~I 1.0
0.5
0,0
: n o �9 �9
5.5
4.5 g
g,
3.5 w
2.5
, , , ~ I . . . . I ~ , , , I p , ~ ~ I , , , f I ~ , , 1 .5
5 10 15 20 25 30
Time (day)
Figure 4 Calculated biomass and substrate concentration profile for 30- day fermentation; �9 biomass, �9 substrate
substrate content (2 tool), and suggests the model is insensi- tive to the heterogeneity of the substrate.
Figure 5 illustrates the instantaneous heat-interaction profile generated via Equation 9. The instantaneous heat interaction profile can be used in the on-line control of the fermenter. Rearrangement of the energy balance (Equation 8) yields the ratio of the generated heat per produced biomass:
Q - 436.2. Yob (13)
Acbb
By use of Equation 13, the biomass production rate can be regulated by controlling the heat-exchange through the fermenter. The process control of the fermenter using Equ- ation 14 is beyond the scope of the current study; however, the heat profile clearly indicates that the fermentation pro- cess is exothermic. Moreover, it was observed that the heat generation maxima corresponded relatively well to those previously observed (Figure 3). This correspondence between the peaks provides further evidence that during those days, one specific substrate component gets processed by the fungus which in turn generates the calculated heat excess.
If the fermentation process is operative, the Second Law of thermodynamics dictates that the entropy generation
160
140
, - . 120
= 100
80
60
Figure 5
40
20
0," , , , n r n n n n f I n ~ n n I a J r
5 10 15 20 25 30
Time (day)
Calculated instantaneous heat generation profile

30
F e r m e n t a t i o n of l ignocetlulosics by Pleurotus ostreatus P Das and MN Karim
0.06
i r ~
0.05
0.04
0.0,'
0.01 1 ,~
,-,,-,,.,-- . . . . i . . . . I , , , , I . . . . , . . . . J , , , U ~ J V . = . . . . . . .
0 5 10 15 20 25 30
Time (day)
Figure 6 Entropy generation profile for 30-day fermentation
must be positive. As discussed by SchrOdinger, microorgan- isms feed on negative entropy [5]. This is ascertained by the application of Equation 11 to the experimental RQ values. Results from Equation 11 give rise to the entropy gener- ation profile illustrated in Figure 6. All the generated entropy values are positive indicating that the measured values are consistent, and the fermentation process is viable,
Data presented in Figure 4 can be expressed in terms of the, specific growth rate. Figure 7 illustrates the specific growth profile for the fermentation. As expected, higher growth rates are observed at the beginning of the fermen- tation, ie between 0.8 and 1 day -1. The low growth rate
values centered around 6.2 mol are due to the initial insta- bility of the fermenter. At approximately 5 mol of substrate, the growth rate decreases dramatically, and growth exhibits a plateau. The average value of the plateau oscillates at 0.1 day-~. In view of previous discussions and Figures 3 and 5, Figure 7 shows that the soluble sugars are degraded at a higher rate relative to the other substrate components (hemicellulose, cellulose or lignin). Moreover, since the growth rate levels off, this implies that the remaining components are degraded at similar rates.
Figure 8 shows the thermodynamic efficiency profile obtained using Equation 12. In the early stages of the fer- mentation (up to 10 days), the thermodynamic efficiency profile varied (0.93 to 0.99). After this period, the efficiency levelled off at about 0.985. This behavior is almost identical to that observed in Figure 7 and can be rationalized using the same arguments mentioned above.
Conclusions
It has been shown how P. ostreatus degrades an agricultural substrate. The main objectives of the project were only par- tially achieved and can be summarized as follows: (i)the fungus did not degrade the lignin specifically, (ii)the in vitro digestibility decreased slightly, (iii)the amount of protein increased relative to lignin. The results suggest the degradation process is tri-anxic. Moreover, it was deter- mined that the most probable degradation sequence starts with degradation of soluble sugars, followed by hemicellu- lose and/or cellulose, and finally, by tignin. It also was shown that from a macroscopic point of view, the thermo- dynamic approach is well suited for the analysis of the fer- mentation process. Thermodynamic parameters determined from the experimental data support the proposed degra- dation scheme.
t ,0 1.00
0,9 0.99 I
. ,-. 0,8 o98
~ Jj , ~ 0.7 "ca 0.97 ,
0,6 0.96
o 9 , 0,4 ,.~
. ~ 0.3 ~ ~ 0.93 . t . .
0.2 0.92
0.1 0.91
0.0 ' ' 0.90 , , ~ , I , , r r P , , , , I ~ , , , ~ , ~ , , I , , , , 1.5 2.5 3.5 4.5 5.8 6.5 0 5 10 15 20 25 30
Substrate (mol) Time (day)
Figure 7 Calculated specific growth rate profile Figure 8 Thermodynamic efficiency profile

Acknowledgements
Most of the funding for this project was obtained fi'om the USAID PSTC program. Additional funding was provided by Colorado State University Experiment Station. The authors are also indebted to Ms Sharon Patterson and Dr Francis Boss6 for their assistance with the final draft of the manusciipt.
References
1 Bailey, J.E. and D.F. OUis. 1986. Biochemical Engineering Fundamen- tals. pp. 173-280, McGraw Hill, New York, NY.
2 Das, P.K. 1993. Degradation of Lignin in Water Hyacinth by Pleurotus ostreatus for Animal Feed Production. pp. 30-37, M.S. Thesis, Color- ado State University, Fort Collins.
3 Dawes, E.A. 1986. Microbial Energetics. pp. 40-60, Chapman and Hall, New York, NY.
4 Goering, H.K. and P.J. Van Soest. 1970. Forage fiber analysis appar-
Fermentation of lignocellulosics by Pleurotus ostreatus P Das and MN Karim
atus: reagents, procedures, and applications. In: Agricultural Handbook No. 379, 20 pp., United States Department of Agriculture, Wash- ington, DC.
5 Hasse, R. i990. Thermodynamics of Ineversible Processes. pp. 493- 495, Dover Publications, New York, NY.
6 Heijnen, JJ. and I2. Van Dijken. 1992. In search of the thermody- namic description of biomass yields for the chemotrophic growth of microorganisms. Biotech. Bioengin. 39: 833.
7 Manu-Tawiah, W. and A.M. Martin. 1987. Study of operational vari- ables in the submerged growth of Pleurotus ostreatus mushroom mycelium. Appl. Biochem. Biotech. 14: 221.
8 Rajarathnam, S. and Z. Bano. 1989. Pleurotus mushrooms, part 3. In: Biotransformations of Natural Lignocellulosic Wastes: Commercial Applications and Implications. CRC Crit. Rev. Food Sci. Nutri. 28 (1): 33.
9 Roels, J.A. 1980. Application of macroscopic principles to microbial metabolism. Biotech. Bioengin. 22: 2457.
10 Roels, J.A. and J.C. Van Suijdam. 1980. Energetic efficiency of a microbial process with an external power input: thermodynamic approach. Biotech. Bioengin. 22: 463.
11 Sandler, S.I. and H. Orbey. 1991. On the thermodynamics of microbial growth processes. Biotech. Bioengin. 38: 697.
31