mass flow and variability in screw feeding of biomass powders – relations...
TRANSCRIPT

MASS FLOW AND VARIABILITY IN SCREW FEEDING OF BIOMASS
POWDERS – RELATIONS TO PARTICLE AND BULK PROPERTIES
1Joel Falk, 2Robert J. Berry, 3Markus Broström, *1Sylvia H. Larsson
1Swedish University of Agricultural Sciences, Department of Forest Biomaterials and
Technology, SE–90183 Umeå, Sweden
2The Wolfson Centre for Bulk Solids Handling Technology, University of Greenwich,
Central Avenue, Chatham Maritime, Chatham, Kent, ME4 4TB, UK.
3Umeå University, Department of Applied Physics and Electronics, Thermochemical
Energy Conversion Laboratory, SE-90187 Umeå, Sweden;
*Corresponding author: E-mail: [email protected]; Phone: +46-90-7868790
ABSTRACT
Biomass powders are often cohesive, have low bulk density and poor material flow characteristics which
causes interruptions and variations in feeding systems. In this study, a range of biomasses - commercial charcoal,
torrefied Norway spruce stem wood, non-treated Norway spruce stem wood, and reed canary grass - was milled
(screen size: 1 mm) using two different milling methods; cutting mill and hammer mill, to form eight types of
biomass powders. Powders were analyzed for loose density, Hausner ratio, compression ratio, angle of repose
and for size and shape distributions. Size and shape were determined by mechanical sieving and optical particle
size and shape analysis. Additionally, yield loci and wall yield loci were determined through standard bulk solids
testing methods. Screw feeding properties of the eight biomass powders were determined by feeding the
materials in a twin screw feeder - at constant rpm and at a constant feeding rate of 1 kg/h. Correlation analysis
and principal component loadings were used to describe relations between material properties and feeding
characteristics. When materials were fed at a constant rpm, feeding variability was closely correlated to the
powders’ angle of repose (long time step) and Hausner and compression ratio (short time step).
Keywords: biomass powder feeding, particle properties
1

1. INTRODUCTION
To avoid feeding related downtime in an industrial process, it is important to foresee if a
new feedstock will be prone to causing flow related problems. There are several test methods
capturing different aspect of powder flow behavior that might be used for the prediction of
flow and feeding properties to see if better or worse behavior is to be expected with a new
material. These include:
• free surface flow behaviour e.g. angle of repose (AoR) for the discharge from the
screw,
• bulk density based measurements e.g. compressibility and Hausner ratio as a screw
feeder is a volumetric device, and
• shear cell tests to measure fundamental flow properties friction, cohesive strength /
flow function that can be used to calculate stresses acting in the vessel under
idealized conditions.
The AoR test is a simple procedure that is useful for powder characterization [1]. Its
strength lies in the short measurement time which can be done in as little as 15 minutes and it
does not require expensive equipment. One of the drawbacks of AoR is lack of a test standard.
There are a variety of procedures proposed and usually the results cannot be compared with
each other [2]. AoR is sensitive to several test parameters such as pouring velocity and sample
size as well as the design and handling of the measuring equipment itself.
The Hausner ratio is the ratio between the tapped and loose density of a powder and it has a
long history of use in industrial practice. A Hausner ratio above 1.4 indicates poor flowability
and a ratio below 1.25 indicates good flowability [3]. One of the major problems with using
the Hausner ratio is that there is no standard saying which loose density to use, and there are
several to choose between (aerated, poured, and apparent density). There is also some

difficulty with the tapped density as it is sensitive to the procedure. Further, the Hausner ratio
is not able to differentiate flowability for highly cohesive materials [4].
Shear testing is an effective although time consuming method for testing powder properties.
However, recent studies show that the method is not well suited for biomass bulk solids [5, 6].
The underlying assumption of spherical particles in Jenike’s theories [7] works well with soil
and most pharmaceutical and metallic powders, but do not comply with flaky, elastic and
fibrous biomass particles. Barletta et al. [8] tried to differentiate three different biomass fuels
with regards to their arching behavior. Flow functions based on standard shear tests could not
predict differences in flow behavior and resulting silo designs were heavily over-dimensioned
compared to the results of actual arching tests. As a result, hoppers designed using the Jenike
approach would have outlet sizes that would generate feed rates far in excess of those
required. The common industrial approach in this situation is to use an agitated screw feeder,
whereby the discharge of a poor flowing material through an outlet far below the critical
dimension for gravity flow, is encouraged by the sweep of a rotary agitator. Industrial
experience suggests that the vast majority of materials will discharge from these types of
feeder. However, cohesive, elastic and low bulk density powders, such as biomass, still show
a lot of problems with flow fluctuations, rat-holing and bridging causing either reduced flow
rate or complete feeding blockage.
As mentioned above, previous studies show that traditional silo and feeding equipment
design methods have insufficient reliability for biomass materials. Lacking reliable prediction
and analysis methods for biomass bulk handling and feeding causes construction delays and
insufficient functionality in the uprising biobased industry. Thus, there is an outspoken need
for more work towards better understanding and developed functional tools for prediction of
feeding performance and flow properties for biomass powders (i.e. within the European
Federation of Chemical Engineering Working Party on Mechanics of Particulate Solids).

Dai et al. [9] investigated biomass screw feeding at mass flow rates of 20-600 kg/h and
found that hopper filling level and high compressibility was positively correlated to feeding
efficiency (i.e. materials were fed at a high densities) until a maximum level was reached
when the torque is increased and blockages were triggered. Raw material moisture content
was negatively related to mass flow. High moisture content as well as irregular particle size
and shape increased torque and tendencies for blockage. Further, torque was nearly
independent of screw speed. Additional to above mentioned feeding properties, occurrence of
feeding disturbances, expressed as the flow variability (%) around the average mass flow, are
detrimental for the process being fed. A general rule-of-the-thumb method to determine screw
feeding variability is by measuring every 60 seconds for 30 consecutive minutes [10], but for
high precision processes fed at rates around 0.5-5 kg/h, such as lab scale powder flame
combustion, variations in feeding can affect the performance in less than a second. Thus,
feeding variability has to be expressed at a relevant timescale.
Correlation and principal component analyses [11] are helpful tools for finding structural
patterns in data sets. When starting fresh in the search for relevant prediction methods for
biomass flow and feeding behavior, such analyses can provide relevant information and give
input on where to put efforts in further work.
In this study, four biomass powders; one grass, one non-treated wood, and two levels of
thermally treated wood were milled in two different mills; a cutting mill and a hammer mill,
to form eight different biomass powders for feeding of a lab scale drop tube furnace reactor.
The aim was to: i) determine particle and bulk properties and screw feeding performance for a
range of different biomass powders, ii) perform correlation analysis for particle and bulk
properties and feeding performance, displayed both numerically in correlation tables and
visually through principal component analysis (PCA) to assess the most useful predictors for
the actual feeding behaviors iii) make qualitative comparisons between material
characteristics and feeding performance and describe mechanistically how the material is
flowing in the hopper/feeder to explain the observed results, iv) discuss particular difficulties
with biomass particle and bulk property determination.
2. MATERIALS AND METHODS
2.1. Materials
Four types of biomass materials were evaluated in the study; Norway spruce (Picea abies
Karst.) stem wood, torrefied Norway spruce stem wood, commercial charcoal, and reed
canary grass (RCG) (Phalaris arundinacea L.). The Norway spruce stem wood and torrefied
Norway spruce stem wood had a chip size of several centimeters. The torrefied Norway
spruce was lightly torrefied to a mass yield of 76%. The charcoal, commercial BBQ coal (ICA
Grillkol, ICA, Poland) consisted of charred hardwood and had a particle size of several
centimeters. The RCG was spring harvested and shredded (screen size: 15 mm).
The studied materials were milled in two different mills: a cutting mill (Retsch SM200,
Haan, Germany) and a hammer mill (Kamas Bac-50, Malmö, Sweden), both with screen sizes
of 1 mm.
2.2. Characterization methods
2.2.1. Particle size and shape distributions
The particle mass size distributions were determined using a stack of sieves, mounted in
decreasing order, with mesh sizes of 800, 720, 600, 400, 300, and 200 µm. All biomass
powders were sieved in triplicates for 20 minutes, using a Fritsch Analysette 3 sieve shaker
(Fritsch, Idar-Oberstein, Germany). Each material was sieved at individual optimal amplitude,
determined in a short test at 4 levels (0.4, 0.8, 1.2, and 1.6 mm). For each sieving, the mass-%
was calculated for 1000-800, 800-720, 720-600, 600-400, 400-300, 300-200, and 200-0 µm.

For each material, average values from the mass-% triplicates was calculated.
To provide information about particle length and shape, mechanical sieving was
complemented with optical particle size analysis (QicPic, Sympatec Gmbh, Germany).
Particle shape and size were determined using computer algorithms that condense irregular
contour data into several different particle size and shape factors. Min and max Feret
diameters (μm) were extracted, defined as the shortest (min Feret) and the longest (max Feret)
distance between the two parallel planes that restrict a 2-dimensional projection of a particle.
Min and max Feret data was represented in cumulative size distributions, and the Feret
diameter sizes (μm) at 10, 16, 50, 84, 90 and 99 % of the number of particles, were chosen for
further correlation analysis.
2.2.2. Loose bulk density, Hausner ratio, compression ratio and angle of repose
Milled powders were analyzed for loose and tapped bulk densities according to the
following procedure: Biomass powder was poured until overfilling into a pre-weighed
cylindrical container of known volume (96.3 cm3). Excess material was carefully scraped off
before weighing and determining the loose bulk density (kg/m3). For tapped bulk density, a
removable extension ring with the same internal diameter as the container was mounted on
top of the container, increasing the volume of the cylinder to roughly 190 cm3, and the whole
volume was filled with powder. The container was then tapped (dropped from a height of 1½
cm using a cam mechanism on a rotary drive) repeatedly until no noticeable volume change
could be observed (charcoal ~450, torrefied spruce~700, spruce ~500, RCG ~500 times).
After tapping, the extension ring was removed, excess material scraped off, and the container
weighed for determination of tapped bulk density (kg/m3). An average Hausner ratio value
was calculated from triplicate pairwise measurements.

The compression ratio was determined from the shear test procedure by dividing the bulk
density at 4.2 kPa preshear stress with the, into the shear cell, loosely poured density. Thus, at
the compressed state, both normal and shear stress was applied.
The angle of repose (AoR) was determined with a Mark 4 AoR tester (D Geldart, West
Yorkshire, United Kingdom) by feeding powder at a controlled height and mass flow rate
onto a plate [1]. Through this procedure, material was formed into a small half cone at the
base of the wall. By using the inverse tangent of the height divided by the radius of the cone,
the AoR (°) was calculated according to (Equation (1). Four replicates were undertaken for
each material and an average value was calculated.
𝐴𝐴𝐴𝐴𝐴𝐴 = 𝑡𝑡𝑡𝑡𝑡𝑡−1 �ℎ𝑟𝑟� Equation (1)
2.2.3. Shear testing and flowability calculations
Shear tests were performed for determination of the initial and steady state force needed to
shear a powder against itself and against a steel surface under different consolidation stresses.
Yield loci and wall yield loci for the powders were obtained using a manually operated ring
shear tester (RST -01.01, Dietmar Schulze Schüttgutmesstechnik, Wolfenbüttel, Germany)
following the ASTM standard procedure [12]. Yield loci were determined at five preshear
normal stresses: 208, 1042, 2084, 3126, and 4168 Pa with four shear to failure tests at stresses
40 %, 60%, 80%, and 100% of the preshear stress. Wall yield loci were determined by
shearing the material against a standard stainless steel surface, 2B cold rolled surface finish, at
normal stresses of 434, 1737, 3473, 5210, 6946, and 8683 Pa, while logging the shear stress.
Two replicates were made for hammer milled RCG whereas other samples were tested only
once. Yield loci and wall yield loci terms were calculated using the program RSV v2
(Dietmar Schulze Schüttgutmesstechnik, Wolfenbüttel, Germany).

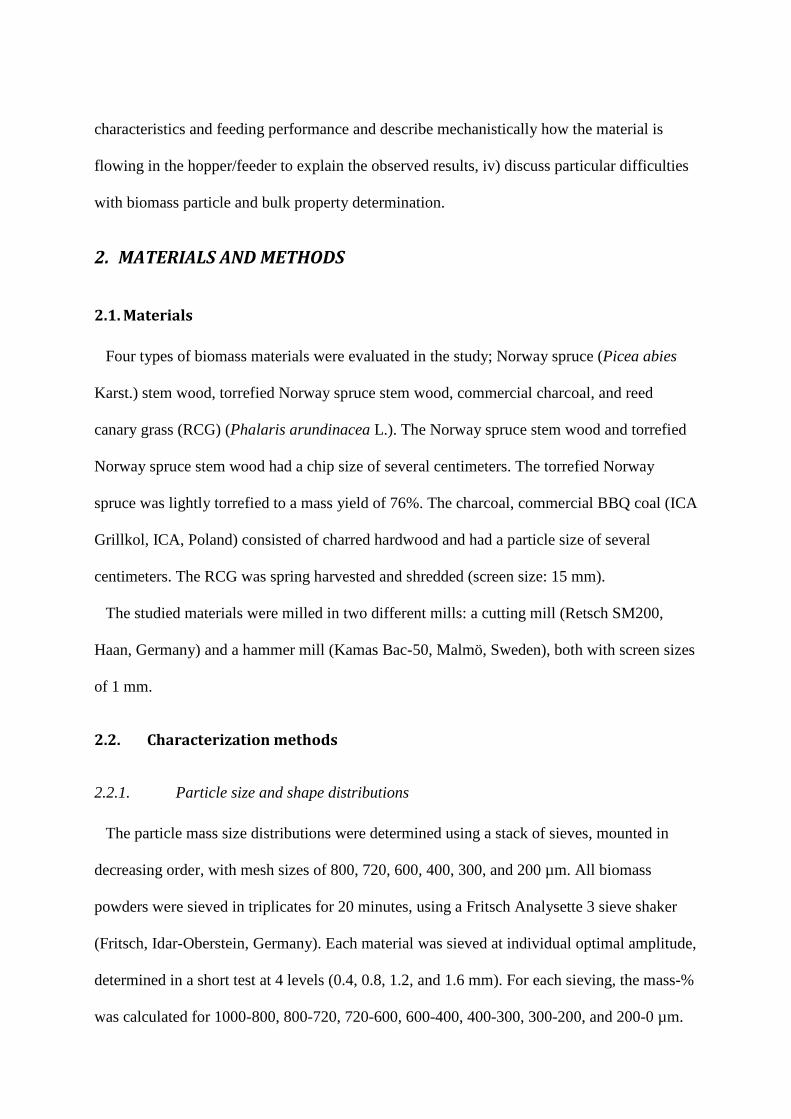
From the yield loci tests, the following flow properties were obtained for correlation
analysis (illustrated in Figure 1): major consolidation stress, MCS (Pa), unconfined yield
strength, UYS (Pa), angle of internal friction at steady flow, PHISF (°), linear angle of
internal friction, PHILIN (°), effective angle of internal friction, PHIE (°), cohesion, TAU C
(Pa), and FFC (). Of these, the primary flow property is the flow function, a plot of the major
consolidation stress (i.e. the maximum consolidation stress that the material experiences
during storage, typically the vertical stress at the base of the vessel) versus the unconfined
yield strength (i.e. the strength of material at a stress free surface such as an arch over the
outlet). The flow function can be reduced to a single number by dividing the major
consolation stress with the unconfined yield strength (at a specific consolidation stress) to get
a ranking for the flowability of the material (FFC), as follows: <1 not flowing, 1-2 very
cohesive, 2-4 cohesive, 4-10 easy flowing, 10< free flowing. Taking the extremes, the
significance of the ranking is that for a non-flowing material (FFC < 1) the strength of
material is greater than the stress applied during consolidation, while for a free flowing
material (FFC >10) the strength is less than a tenth of the consolidation stress.
The wall friction angle (PHIX) was determined by calculating the angle between the normal
stress axis and a straight line drawn from the origin through the observations of normal stress
and shear stress at these settings.
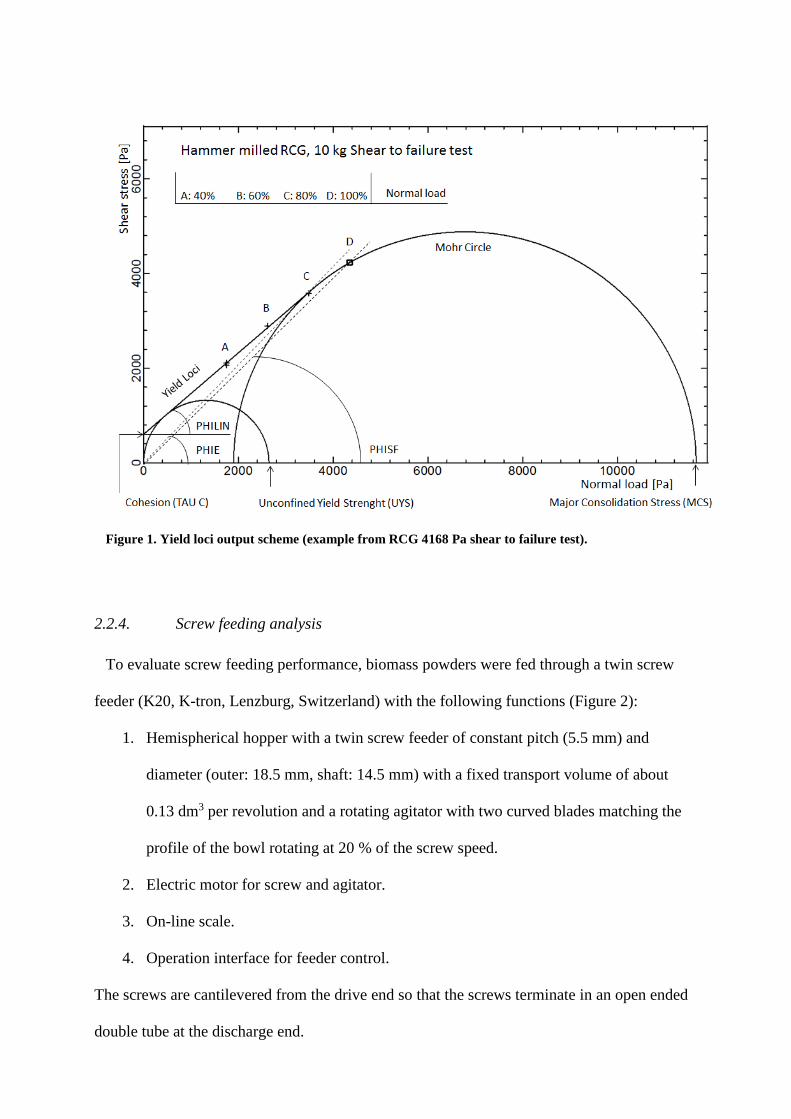
Figure 1. Yield loci output scheme (example from RCG 4168 Pa shear to failure test).
2.2.4. Screw feeding analysis
To evaluate screw feeding performance, biomass powders were fed through a twin screw
feeder (K20, K-tron, Lenzburg, Switzerland) with the following functions (Figure 2):
1. Hemispherical hopper with a twin screw feeder of constant pitch (5.5 mm) and
diameter (outer: 18.5 mm, shaft: 14.5 mm) with a fixed transport volume of about
0.13 dm3 per revolution and a rotating agitator with two curved blades matching the
profile of the bowl rotating at 20 % of the screw speed.
2. Electric motor for screw and agitator.
3. On-line scale.
4. Operation interface for feeder control.
The screws are cantilevered from the drive end so that the screws terminate in an open ended
double tube at the discharge end.
Figure 2. Schematic overview of the screw feeder.
To reduce the influence of hopper level, each feeding test was performed with the same
mass of material in the hopper (700 g). Material was fed for 166 seconds when feeding was
stopped and fed material was put back into the hopper. This was repeated three times (n=3).
By keeping a full head, an indication of the highest level of repeatability was obtained as the
feed rate generally tends to reduce with inventory level, dropping off significantly as the
inventory level descends to the point where the screw is exposed.
Feeding tests were performed at two different conditions (with the built in loss-in-weight
function turned off):
i) constant screw speed of 60 rpm (with loss in weight functions turned off) and
ii) constant mass flow of 1 kg/h
For tests at constant rpm, the test procedure was repeated three times for each material
(n=9).

The powder discharge flow was monitored by feeding onto a digital scale (XP 404 s,
Mettler Toledo, Columbus, Ohio) and data was continuously logged with an acquisition
frequency of 10.5 Hz on a PC (BalanceLink, Mettler Toledo, Columbus, USA). Mass flow
variability was calculated for three different time steps (0.1, 0.4, and 2 s). The variability,
representing the variation around the average mass flow and covering 95% of all values in the
observed data set was calculated as the mean value of variation for every 30 data observations
at time steps of 0.1 s, 0.4 s and 2 s (data acquisition at 10.5 Hz) over the whole 166 second
period, according to:
𝑉𝑉𝑡𝑡𝑉𝑉𝑉𝑉𝑡𝑡𝑉𝑉𝑉𝑉𝑉𝑉𝑉𝑉𝑡𝑡𝑉𝑉 (x, i) =2 ∗ 𝑀𝑀𝑡𝑡𝑀𝑀𝑀𝑀 𝑓𝑓𝑉𝑉𝐴𝐴𝑓𝑓𝑠𝑠𝑠𝑠𝑠𝑠𝑠𝑠𝑠𝑠 (𝑥𝑥)(𝑉𝑉) ∗ 100
𝑀𝑀𝑡𝑡𝑀𝑀𝑀𝑀 𝑓𝑓𝑉𝑉𝐴𝐴𝑓𝑓𝐴𝐴𝑠𝑠𝐴𝐴 (𝑥𝑥)(𝑉𝑉) 𝐸𝐸𝐸𝐸𝐸𝐸𝑡𝑡𝑡𝑡𝑉𝑉𝐴𝐴𝑡𝑡 (1)
where x is the time step (0.1, 0.4, and 2 s), i = 0, 1, 2, ..., z, representing a moving average
over the whole dataset.
The average mass flow for each subset of 30 consequtive values was calculated as:
𝑀𝑀𝑡𝑡𝑀𝑀𝑀𝑀 𝑓𝑓𝑉𝑉𝐴𝐴𝑓𝑓𝐴𝐴𝑠𝑠𝐴𝐴 (𝑥𝑥)(𝑉𝑉) =1
30∗ � 𝑊𝑊𝑊𝑊𝑉𝑉𝑊𝑊ℎ𝑡𝑡(𝑠𝑠+1)𝑥𝑥 −𝑊𝑊𝑊𝑊𝑉𝑉𝑊𝑊ℎ𝑡𝑡𝑠𝑠∗𝑥𝑥
𝑠𝑠=30+𝑖𝑖
𝑠𝑠=0+𝑖𝑖
𝐸𝐸𝐸𝐸𝐸𝐸𝑡𝑡𝑡𝑡𝑉𝑉𝐴𝐴𝑡𝑡 (2)
where Weight(z) is the observed weight at time z.
The standard deviation of the mass flow was calculated as:
𝑀𝑀𝑡𝑡𝑀𝑀𝑀𝑀 𝑓𝑓𝑉𝑉𝐴𝐴𝑓𝑓𝑠𝑠𝑠𝑠𝑠𝑠𝑠𝑠𝑠𝑠 (𝑥𝑥)(𝑉𝑉) = �∑ ((𝑊𝑊𝑊𝑊𝑉𝑉𝑊𝑊ℎ𝑡𝑡(𝑠𝑠+1)𝑥𝑥 −𝑊𝑊𝑊𝑊𝑉𝑉𝑊𝑊ℎ𝑡𝑡𝑠𝑠∗𝑥𝑥) −𝑀𝑀𝑡𝑡𝑀𝑀𝑀𝑀 𝑓𝑓𝑉𝑉𝐴𝐴𝑓𝑓𝐴𝐴𝑠𝑠𝐴𝐴 (𝑥𝑥)(𝑉𝑉))2𝑠𝑠=30+𝑖𝑖𝑠𝑠=0+𝑖𝑖
29 𝐸𝐸𝐸𝐸𝐸𝐸𝑡𝑡𝑡𝑡𝑉𝑉𝐴𝐴𝑡𝑡 (3)
By using a local average mass flow for each 30 observations, influence of a possible global
mass flow drift on the variability data was reduced.

2.3. Data evaluation and modelling
All gathered data on powder characteristics, flowability, and feeding properties was
compiled in a data matrix and imported to the software SIMCA 13.0.3 (Umetrics, Umeå,
Sweden) for correlation and principal component analysis. Particle and powder flow
properties were considered as variables while mass flow and feeding variability terms were
treated as responses.
The correlation coefficient value represents the extent of linear association between two
terms (both variables and responses). Correlation coefficient values can range from -1 to 1
where a negative sign denotes negative relation between terms. The higher the absolute value
of a correlation coefficient, the closer the linear relationship between the terms. Correlations
were also visualized through a plot of the loadings of the two first principal components from
a Principal Component Analysis (PCA-X&Y) of the variables and responses. In a loadings
plot from PCA analysis, clustering of variables and responses denotes a high level of positive
correlation, whereas terms placed far away opposite to each other through the origin have a
strong negative correlations.
At first, all measured factors and responses were included in the correlation analyses but, to
make patterns clearer, yield and wall yield loci derived terms at intermediate normal stresses
and particle size and shape measurements at intermediate levels were excluded from the data
sheet. Hence, the following variables and responses were used in the correlation analysis:
loose density (kg/m3); Hausner ratio (); min and max Feret diameter of particles representing
10 and 90 % of the cumulative undersize distribution (μm); weight-% of particles for the
smallest (200-0 µm) and largest (1000-800 µm) sieve apertures (%); yield loci responses for
for the minium (0.2 kPa) and maximum (4.2 kPa Pa) pre-shear stresses; wall yield loci
responses for the minimum (0.4 kPa) and maximum (8.7 kPa) wall shear normal stresses,
mass flow at constant rpm (kg/h); variability in mass flow at constant rpm (%) and at constant
mass flow (%) at time steps of 0.1, 0.4, and 2 s.
3. RESULTS AND DISCUSSION
Biomass particle, bulk, and feeding characteristics are presented in Section 3.1. Results of
correlation and principal component analyses of particle and bulk characteristics and feeding
properties are presented in Section 3.2. Qualitative comparisons between mass flow and mass
flow variability with the particle and bulk characteristics are presented in Section 3.3. Some
concerns regarding biomass bulk material characterization measurements are discussed in
Section 3.4.
3.1. Biomass particle, bulk, and feeding characteristics
3.1.1. Particle size distributions
For all raw materials, hammer milling produced a finer powder than cutting milling (Figure
3a). This is in line with what Paulrud and Mattsson [13] found for Norway spruce powders.
Compared to the other materials, torrefied spruce stood out with a greater similarity between
hammer milled and cutting milled material, and by having the smallest particle sizes in the
group.
The cumulative frequency (Figure 3b), measured by the optical analyzer, showed results
comparable with the cumulative mass size distribution. When visually inspecting the
materials, it was obvious that the sieves contained particles a lot longer than the aperture size
would allow. This was observed by Igathinathane and Pordesimo who compared the length of
sieved materials with aperture size using sieveless particle size distribution analysis [14].
Others have also concluded that sieving is unable to separate fibrous particles based on length
[15], as technique only separates based on the minor and intermediate dimensions.
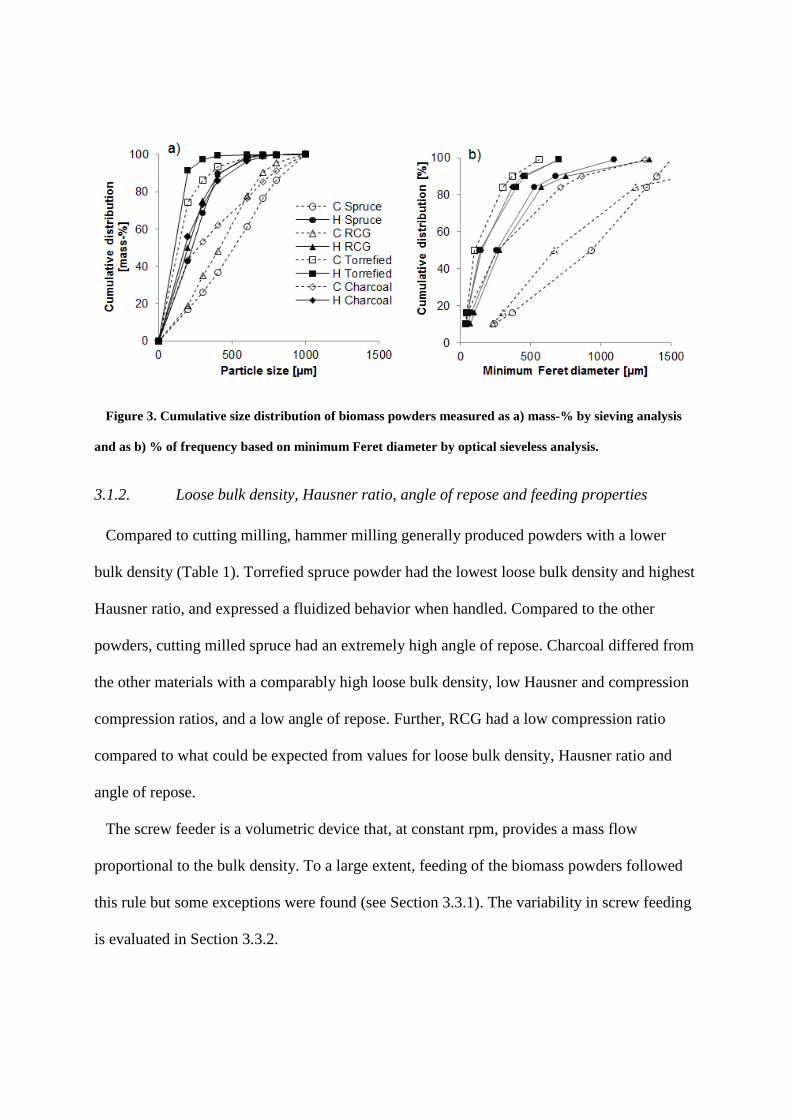
Figure 3. Cumulative size distribution of biomass powders measured as a) mass-% by sieving analysis
and as b) % of frequency based on minimum Feret diameter by optical sieveless analysis.
3.1.2. Loose bulk density, Hausner ratio, angle of repose and feeding properties
Compared to cutting milling, hammer milling generally produced powders with a lower
bulk density (Table 1). Torrefied spruce powder had the lowest loose bulk density and highest
Hausner ratio, and expressed a fluidized behavior when handled. Compared to the other
powders, cutting milled spruce had an extremely high angle of repose. Charcoal differed from
the other materials with a comparably high loose bulk density, low Hausner and compression
compression ratios, and a low angle of repose. Further, RCG had a low compression ratio
compared to what could be expected from values for loose bulk density, Hausner ratio and
angle of repose.
The screw feeder is a volumetric device that, at constant rpm, provides a mass flow
proportional to the bulk density. To a large extent, feeding of the biomass powders followed
this rule but some exceptions were found (see Section 3.3.1). The variability in screw feeding
is evaluated in Section 3.3.2.

Table 1. 3.1. Biomass particle, bulk, and feeding characteristics (standard deviations within brackets)
Material Mill type
Loose
bulk
density
(kg/m3)
(n=3)
Hausner
ratio ()
n=3
Compression
ratio ()
n=1
Angle of
repose (°)
(n=5)
Mass flow (g/h) Feeding variability (%)
Constant
rpm
(n=9)
Constant
mass flow
(n=3)
Constant rpm (n=9) Constant mass flow (n=3)
Time step
0.1 s
Time step
0.4 s
Time
step 2 s
Time step
0.1 s
Time
step 0.4 s
Time
step 2 s
Norway
spruce
Cutting 187
(5.8)
1.56
(0.09) 1.36
52.6
(1.39)
1636
(179)
965
(11.3)
129
(5.50)
43.5
(3.30)
13.61
(1.78)
178
(1.31)
78.9
(3.20)
19.53
(1.34)
Hammer 172
(6.6)
1.59
(0.02) 1.41
46.3
(0.92)
1218
(25.4)
958
(15.7)
128
(3.58)
39.2
(3.54)
10.31
(4.40)
137
(2.00)
43.2
(1.20)
10.03
(0.57)
Reed
canary
grass
Cutting 206
(1.3)
1.48
(0.02) 1.24
44.2
(1.44)
2445
(11.8)
1006
(8.65)
113
(0.50)
25.9
(0.42)
7.69
(0.47)
139
(0.70)
54.6
(1.07)
12.07
(0.47)
Hammer 183
(1.1)
1.49
(0.02) 1.23
47.6
(1.99)
2259
(18.4)
985
(2.72)
111
(1.09)
25.6
(0.91)
8.70
(0.43)
141
(1.52)
52.3
(0.98)
13.29
(0.54)
Torrefied
Norway
spruce
Cutting 132
(1.3)
2.02
(0.05) 1.49
47.4
(1.45)
1089
(91.5)
946
(15.5)
134
(2.18)
41.4
(1.85)
9.82
(0.90)
142
(0.86)
43.3
(1.77)
10.02
(1.09)
Hammer 87.4
(1.1)
2.04
(0.01) 1.58
48.0
(1.86)
625
(17.9)
1058
(42.8)
156
(2.51)
43.1
(1.74)
11.28
(0.65)
131
(2.76)
42.9
(1.37)
9.67
(0.81)
Charcoal
Cutting 385
(3.5)
1.44
(0.01) 1.11
40.0
(1.79)
4095
(55.7)
949
(2.36)
117
(0.70)
31.3
(0.57)
5.78
(0.22)
142
(2.23)
53.9
(0.69)
9.01
(1.00)
Hammer 379 (12) 1.38
(0.08) 1.14
37.6
(0.34)
3419
(52.5)
935
(8.92)
119
(1.42)
30.9
(0.51)
3.22
(0.51)
140
(0.89)
53.8
(0.81)
11.72
(0.27)

3.2. Correlation analysis
3.2.1. Correlation coefficient analysis
Correlation coefficients for powder variables and feeding responses are shown in Appendix
A. Screw feeding mass flow at constant rpm had correlation coefficient (R2) values of 0.95
with loose density and -0.96 with compression ratio. At constant rpm and a time step of 0.1 s,
compression and Hausner ratios were correlated to feeding variability (0.88 and 0.86,
respectively) whereas at a time step of 2 s, strong correlations with the angle of repose (0.97)
and yield loci terms and flow functions at low normal stress (0.82-0.93) were found. At
constant mass flow, feeding variability was positively correlated to a large particle size (sieve
1000-800, xmin and xmax factors).
3.2.2. PCA analysis
A PCA model was formed from all data, covering both powder variables and feeding
responses, where the first and second principal component explained 55 and 27 % of the
variation in the data. In a loadings plot (Figure 4), four distinctive groupings of variables and
responses were identified for which measures in the dataset showed strong co-variation. The
five groups were related to i) low stress internal friction and angle of repose, ii) high stress
internal friction, compressibility, and Hausner ratio, iii) particle size, and iv) wall friction.

Figure 4. PCA loadings plot for measured biomass powder variables (green dots) and feeding responses
(red dots).
3.3. Qualitative comparisons between mass flow and mass flow variability with
particle and bulk characteristics
In operation the flow of the powder in the agitated feeder was as follows: The fixed
transport volume of the constant pitch and diameter screws dictated that material was fed into
the first pitch of the screw and transported forward. A core flow channel then formed up at the
back wall of the hopper, interposed by a global rotation of the stored material as imposed by
the agitator. At the end of the screw, the powder discharged down a dynamic angle of repose

formed at the end of the open tube if free-flowing or extruded out of the open tube as a plug
which broke under its self-weight if cohesive.
3.3.1. Correlating the measured feed rates from the feeder trials with particle and bulk
property measurements
Comparing the theoretical mass flow rates based on loose, compressed, and tapped bulk
densities (assuming 100% filling and conveying efficiencies for the twin screws) with actual
mass flow shows that, for spruce and torrefied spruce, the feeding rates correspond to the
loose bulk density while the feeding rates of charcoal and RCG correspond to bulk density
values at compressed and tapped conditions. There could have been two reasons for this: a)
screw filling efficiency decreased as a function of increasing cohesive strength and angle of
repose, (i.e. by arching over the pockets of the screw) or b) mass flow rates were increased by
powder compression (due to the elasticity of the powders and the stresses generated by the
agitator sweep it may be possible that the screw filling could exceed 100% based on loose
bulk densities).
However, relative to their theoretical mass flow rates at different bulk densities, the less
compressible charcoal and RCG had significantly higher mass flow rates than the more
compressible spruce and torrefied spruce (Figure 5). This contradicts the behaviour of a high
relative throughput of more compressible materials due to compaction found by i.e. Dai et al
[9]. Rather it was the poor flowability of the more compressible spruce and torrefied spruce
which restricted their flow into the screw and lead to disparity in the measurements. The latter
is further supported by negative correlations between mass flow and flow variables (angle of
repose and cohesion related yield loci variables) in Appendix A, a pattern also illustrated in
Figure 4.

Figure 5. Theoretical massflow based on loose, compressed, and tapped bulk density compared to actual
massflow and the inverted compression ratio.
Inspection of the flow functions of materials in Figure 6 shows that, in order of reduced
flowability, materials are ranked; charcoal, RCG, torrefied spruce (all classed as easy flowing)
and finally spruce (classed as cohesive). Qualitatively the above assessment could explain the
non-linearity in the feeder discharge rates based on bulk density. A free flowing material will
tend to overfill the screw under gravity (irrespective of the presence of the agitator) whereas;
easy flowing, cohesive, very cohesive and non-flowing materials will each require increasing
levels of assistance from the agitator to flow into the screw as the effective outlet area will be
less than that required from gravity flow. The easy flowing charcoal (FFC 7.4 -6.5) and RCG
(FFC 4.4 - 4.0) were both fed at theoretical bulk densities that were close to their packed or
tapped densities. The cohesive torrefied spruce (FFC 3.9 – 3.6) and spruce (FFC 3.2 -2.9)
were fed at theoretical bulk densities close to or below the loose packing conditions.
The relationship between the cutting and hammer milled products and flow functions are
inconsistent, regarding materials and consolidation stress. However, for the highest stress
level tested, the hammer milled product has more strength for all products except for charcoal.

This is likely due to the lower mean particle size generated by hammer milling. Note that the
cutting milled spruce which has the largest particle size and greatest Feret diameter (Figure 3)
also has the worst flowability - highest FFC ranking - at low stresses, maybe due to a potential
for nesting.
Figure 6. Flow functions for the eight biomass powders.
3.3.2. Correlating the measured feed rate variations from the feeder trials with particle
and bulk property measurements
For evaluation of powder feeding characteristics, the actual needs of accurateness in the
application has to be considered and an appropriate time scale chosen accordingly. The
importance of choosing the right time scale for mass flow variability evaluation is illustrated
in Figure 7.

Figure 7. Variation in mass flow at constant rpm for feeding of cutting milled torrefied spruce using
central moving averages with different widths (time step 0.1, 0.4, and 2 s).
Since the end of the screw is an open tube, the dynamic angle of repose controls the
instantaneous large discharge variation as material builds up and falls off at the end of the
screw. In Figure 8, the angle of repose is qualitatively compared to the instantaneous
discharge variations at different time steps when feeding at constant rpm. Mass flow
variability at shorter time steps (0.1 and 0.4 s) shows no obvious correlations with the angle of
repose, whereas a clear correlation pattern is found for the 2 s time step. From this, we draw
the conclusion that avalanching is the major source for variability at time steps longer than 0.4
seconds and that it generally takes between 0.4 and 2 seconds to get enough material for an
avalanche of material to build up at the screw outlet). High angle of repose increases the
variation during feeding due to an increase in the pulsating behavior in a screw feeder.
Materials with high angle of repose built up at the end of the screw until collapsing, leading to
a large variation in flow rate. For materials with low angle of repose the buildup was
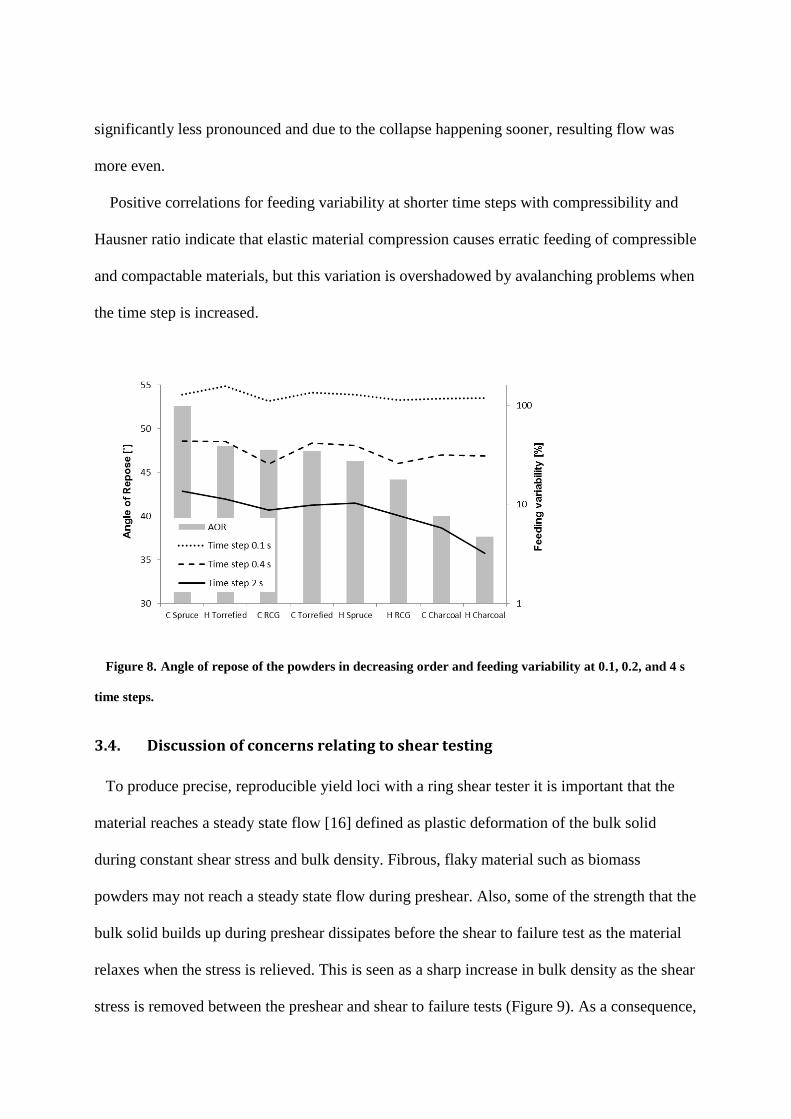
significantly less pronounced and due to the collapse happening sooner, resulting flow was
more even.
Positive correlations for feeding variability at shorter time steps with compressibility and
Hausner ratio indicate that elastic material compression causes erratic feeding of compressible
and compactable materials, but this variation is overshadowed by avalanching problems when
the time step is increased.
Figure 8. Angle of repose of the powders in decreasing order and feeding variability at 0.1, 0.2, and 4 s
time steps.
3.4. Discussion of concerns relating to shear testing
To produce precise, reproducible yield loci with a ring shear tester it is important that the
material reaches a steady state flow [16] defined as plastic deformation of the bulk solid
during constant shear stress and bulk density. Fibrous, flaky material such as biomass
powders may not reach a steady state flow during preshear. Also, some of the strength that the
bulk solid builds up during preshear dissipates before the shear to failure test as the material
relaxes when the stress is relieved. This is seen as a sharp increase in bulk density as the shear
stress is removed between the preshear and shear to failure tests (Figure 9). As a consequence,

the material is not overconsolidated as it is sheared to failure which results in a lower the yield
loci, and an underestimation of the unconfined yield strength. Instead of a sharp maximum
when shearing to failure, the curve looks like another preshear but at lower consolidation
stress. For each subsequent step of the shear test, the bulk density is increased. As a result of
the progressive consolidation, both preshear and shear to failure stresses either increase
(spruce, torrefied spruce, charcoal) or decrease (RCG). To yield reproducible results it is
likely necessary to perform just one preshear and shear to failure test on each sample, which is
very time consuming. This behavior for biomass powder was also observed by Miccio et al
[5]. Their conclusion was that biomass could potentially have entirely different flow behavior
than the conventional bulk solids and that any information gained from the Mohr circle
analysis is of questionable use for fibrous materials. However, even though the theoretical
basis of the test could be in error, the flow function showed correlations that fitted well with
the feeding tests.
Figure 9. Shear strenght and height of lid during shear test of cutting milled RCG at 2.5 kg preshear
weight.

The method used in this study for angle of repose determination was a fixed funnel method
utilising Geldarts AoR tester mark 4. This analysis method is made for quick comparative
tests and not for detailed laboratory analysis. The test is operator dependent and not
considered to be very precise. Howevever, it still produced results that correlated extremly
well with the variation in the instantaneous feeding rate.
4. CONCLUSIONS
In biomass powder screw feeding, mass flow was ruled by powder density. However, in
addition, screw feeding efficiency was considerably higher for non-compressible biomass
powders, compared to powders with high compression ratios. Screw feeding variability (%) at
constant rpm (60 rpm) showed strong positive correlation with angle of repose and low
normal stress shear test responses when the time step was 2 seconds and this was interpreted
as being caused by powder avalanching. Medium strong positive correlation with Hausner
ratio and compressibility was found for screw feeding variability at constant rpm when the
time step was 0.1 seconds, presumably as a result of uneven material compression in the
screw. Feeding variability at constant mass flow (1 kg/h), correlated positively with particle
size for all time steps.
ACKNOWLEDGEMENTS
Bioendev AB (Sweden) is acknowledged for kindly supplying the torrefied spruce that was
treated in their 20 kg/h pilot scale torrefaction reactor. We also thank Bio4Energy, a strategic
research environment appointed by the Swedish government, for supporting this work. We
thank Dietmar Schulze for his friendly support regarding shear measurements.
5. REFERENCES
[1] I.M.F. Wouters, D. Geldart, Characterising semi-cohesive powders using angle of repose,
Particle & Particle Systems Characterization, 13 (1996) 254-259.
[2] K.E. Ileleji, B. Zhou, The angle of repose of bulk corn stover particles, Powder Technol.,
187 (2008) 110-118.
[3] D. Geldart, N. Harnby, A.C. Wong, Fluidization of cohesive powders, Powder
Technology, 37 (1984) 25-37.
[4] A. Santomaso, P. Lazzaro, P. Canu, Powder flowability and density ratios: the impact of
granules packing, Chem. Eng. Sci., 58 (2003) 2857-2874.
[5] F. Miccio, D. Barletta, M. Poletto, Flow properties and arching behavior of biomass
particulate solids, Powder Technology, 235 (2013) 312-321.
[6] D. Schulze, Fliesseigenschaften von Schüttgütern mit faser- und plättchenförmigen
Partikeln., Schüttgut, 8 (2002) 538-546.
[7] A.W. Jenike, Storage and flow of solids, University of Utah, Salt Lake City, Utah, USA,
1964.
[8] D. Barletta, R.J. Berry, S.H. Larsson, T.A. Lestander, M. Poletto, Á. Ramírez-Gómez, Can
bulk solids best practice techniques for flow characterization and storage/handling equipment
design be used reliably for biomass materials of different classes, 07th International
Conferance for Conveying and Handling of Particulate SolidsFriedrichschafen/Germany,
2012.
[9] J.J. Dai, J.R. Grace, Biomass granular screw feeding: An experimental investigation,
Biomass & Bioenergy, 35 (2011) 942-955.
[10] K-TRON Process Group, Short Timescale Feeding in Critical Process
Applications, www.ktron.com, 2009.

[11] S. Wold, K. Esbensen, P. Geladi, Principal component analysis, Chemometrics and
Intelligent Laboratory Systems, 2 (1987) 37-52.
[12] ASTM, Standard shear test method for bulk solids using the Schulze ring shear tester.
Ref. No. D6773-08, 2008.
[13] S. Paulrud, J.E. Mattsson, C. Nilsson, Particle and handling characteristics of wood fuel
powder: effects of different mills, Fuel Process. Technol., 76 (2002) 23-39.
[14] C. Igathinathane, L.O. Pordesimo, E.P. Columbus, W.D. Batchelor, S. Sokhansanj,
Sieveless particle size distribution analysis of particulate materials through computer vision,
Comput. Electron. Agric., 66 (2009) 147-158.
[15] C.F. Mora, A.K.H. Kwan, H.C. Chan, Particle size distribution analysis of coarse
aggregate using digital image processing, Cement and Concrete Research, 28 (1998) 921-932.
[16] J. Schwedes, Consolidation and flow of cohesive bulk solids, Chem. Eng. Sci., 57 (2002)
287-294.

Appendix A. Correlation table of powder variables and screw feeding responses
Loose density
Hausner ratio
Compression ratio
AoR xmin10 xmin90 xmax10 xmax90 1000-800
200-0 MCS 0.2
MCS 4.2
UYS 0.2
UYS 4.2
TAU C 0.2
TAU C 4.2
FFC 0.2
FFC 4.2
PHIE 0.2
PHIE 4.2 PHILIN 0.2
PHILIN 4.2
PHISF 0.2
PHISF 4.2
PHIX 0.4
PHIX 8.7
Mass flow rpm (g/h)
0.1s rpm
var (%)
0.4s rpm
var (%)
2s rpm var (%)
0.1s mass
var (%)
0.4s mass
var (%)
2s mass
var (%)
Loose density 1.00 -0.76 -0.89 -0.83 -0.15 0.04 -0.34 -0.22 0.26 -0.32 -0.92 -0.76 -0.84 -0.79 -0.78 -0.79 0.75 0.79 -0.76 -0.72 -0.50 -0.57 -0.90 -0.75 0.48 0.61 0.95 -0.60 -0.51 -0.82 0.03 0.23 -0.10
Hausner ratio
1.00 0.91 0.49 -0.28 -0.46 -0.21 -0.30 -0.33 0.73 0.52 0.77 0.57 0.60 0.59 0.59 -0.54 -0.52 0.38 0.56 0.13 0.52 0.51 0.67 -0.23 -0.34 -0.79 0.86 0.70 0.54 -0.22 -0.46 -0.28
Compression ratio
1.00 0.68 -0.07 -0.29 0.03 -0.07 -0.26 0.54 0.71 0.81 0.78 0.81 0.77 0.81 -0.74 -0.69 0.61 0.72 0.28 0.58 0.71 0.77 -0.20 -0.32 -0.96 0.88 0.79 0.75 -0.07 -0.32 -0.06
AoR 1.00 0.43 0.25 0.55 0.51 0.25 -0.06 0.87 0.53 0.95 0.74 0.88 0.79 -0.79 -0.85 0.93 0.65 0.58 0.40 0.92 0.62 -0.57 -0.67 -0.78 0.42 0.56 0.97 0.50 0.30 0.56xmin10 1.00 0.93 0.96 0.96 0.66 -0.80 0.15 -0.45 0.40 -0.06 0.44 0.05 -0.42 -0.22 0.22 -0.29 -0.09 -0.57 0.20 -0.37 -0.65 -0.55 -0.05 -0.24 -0.05 0.39 0.66 0.75 0.76xmin90 1.00 0.89 0.94 0.70 -0.89 0.01 -0.52 0.12 -0.16 0.13 -0.06 -0.08 -0.18 0.10 -0.40 -0.01 -0.66 0.06 -0.45 -0.59 -0.51 0.18 -0.43 -0.27 0.22 0.53 0.68 0.58xmax10 1.00 0.98 0.48 -0.73 0.38 -0.27 0.48 0.08 0.48 0.17 -0.46 -0.36 0.38 -0.11 0.13 -0.38 0.41 -0.18 -0.73 -0.66 -0.20 -0.24 -0.12 0.48 0.53 0.61 0.71xmax90 1.00 0.60 -0.83 0.30 -0.32 0.40 0.05 0.39 0.15 -0.35 -0.36 0.36 -0.15 0.16 -0.43 0.35 -0.22 -0.68 -0.63 -0.09 -0.32 -0.14 0.45 0.60 0.67 0.71
1000-800 1.00 -0.69 -0.21 -0.46 0.15 -0.12 0.18 -0.01 -0.05 -0.16 0.12 -0.33 -0.08 -0.59 -0.08 -0.38 -0.32 -0.27 0.29 -0.17 0.15 0.29 0.83 0.87 0.64200-0 1.00 0.14 0.65 0.06 0.26 0.07 0.18 -0.08 -0.01 -0.02 0.40 0.00 0.60 0.09 0.52 0.26 0.19 -0.39 0.68 0.36 -0.03 -0.61 -0.74 -0.62
MCS 0.2 1.00 0.76 0.81 0.83 0.68 0.82 -0.64 -0.85 0.91 0.83 0.76 0.69 0.99 0.82 -0.40 -0.56 -0.85 0.36 0.37 0.82 0.08 -0.13 0.22MCS 4.2 1.00 0.51 0.87 0.40 0.82 -0.34 -0.72 0.67 0.92 0.67 0.89 0.74 0.97 0.05 -0.18 -0.79 0.66 0.56 0.59 -0.32 -0.58 -0.33UYS 0.2 1.00 0.70 0.98 0.75 -0.94 -0.73 0.84 0.62 0.37 0.39 0.85 0.58 -0.48 -0.53 -0.86 0.57 0.68 0.93 0.48 0.27 0.56UYS 4.2 1.00 0.58 0.99 -0.52 -0.90 0.85 0.93 0.73 0.74 0.86 0.92 0.00 -0.22 -0.85 0.60 0.69 0.83 0.05 -0.23 0.01
TAU C 0.2 1.00 0.64 -0.97 -0.60 0.70 0.48 0.16 0.25 0.73 0.44 -0.50 -0.51 -0.82 0.61 0.70 0.86 0.50 0.31 0.57TAU C 4.2 1.00 -0.56 -0.93 0.86 0.89 0.70 0.65 0.86 0.87 -0.08 -0.29 -0.84 0.61 0.72 0.88 0.13 -0.14 0.09
FFC 0.2 1.00 0.47 -0.62 -0.44 -0.07 -0.25 -0.67 -0.39 0.42 0.39 0.81 -0.56 -0.64 -0.76 -0.43 -0.26 -0.56FFC 4.2 1.00 -0.89 -0.77 -0.76 -0.50 -0.89 -0.77 0.37 0.59 0.74 -0.43 -0.54 -0.91 -0.22 0.02 -0.16
PHIE 0.2 1.00 0.83 0.81 0.62 0.96 0.78 -0.31 -0.47 -0.73 0.35 0.51 0.91 0.39 0.16 0.44PHIE 4.2 1.00 0.79 0.92 0.84 0.98 0.12 -0.10 -0.79 0.50 0.58 0.69 -0.04 -0.34 -0.04
PHILIN 0.2 1.00 0.70 0.77 0.76 -0.06 -0.29 -0.41 0.02 0.11 0.56 0.02 -0.14 0.05PHILIN 4.2 1.00 0.66 0.93 0.27 0.07 -0.63 0.40 0.38 0.39 -0.28 -0.54 -0.25PHISF 0.2 1.00 0.81 -0.40 -0.56 -0.84 0.38 0.45 0.89 0.20 -0.02 0.31PHISF 4.2 1.00 0.07 -0.16 -0.79 0.57 0.57 0.66 -0.16 -0.45 -0.18PHIX 0.4 1.00 0.96 0.26 0.01 0.08 -0.45 -0.31 -0.34 -0.43PHIX 8.7 1.00 0.38 -0.07 -0.01 -0.58 -0.25 -0.21 -0.32
Mass flow rpm (g/h)
1.00 -0.73 -0.69 -0.81 0.00 0.25 -0.09
0.1s rpm var (%)
1.00 0.84 0.55 -0.11 -0.29 -0.17
0.4s rpm var (%)
1.00 0.69 0.32 0.03 0.13
2s rpm var (%)
1.00 0.47 0.25 0.46
0.1s mass var (%)
1.00 0.93 0.90
0.4s mass var (%)
1.00 0.91
2s mass var (%)
1.00