mass spectrometry and elemental analysis - strona … · 2013-05-13 · 81br 49.31 80.91642....
TRANSCRIPT
Mass spectrometry and elemental analysis

A schematic representation of a single-focusing mass spectrometer
with an electron-impact (EI) ionization source.
M: + e_ M+. + 2e_
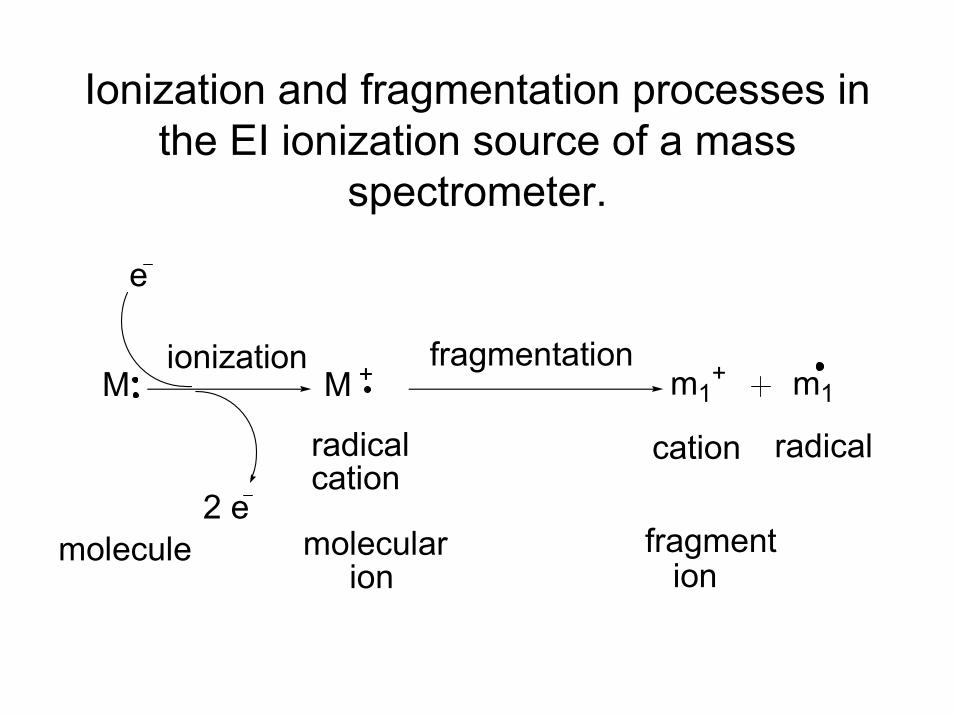
Ionization and fragmentation processes in the EI ionization source of a mass
spectrometer.
Mionization
M +fragmentation
m1+ m1
radical cation
cation radical
e
2 emolecule molecular
ionfragment ion
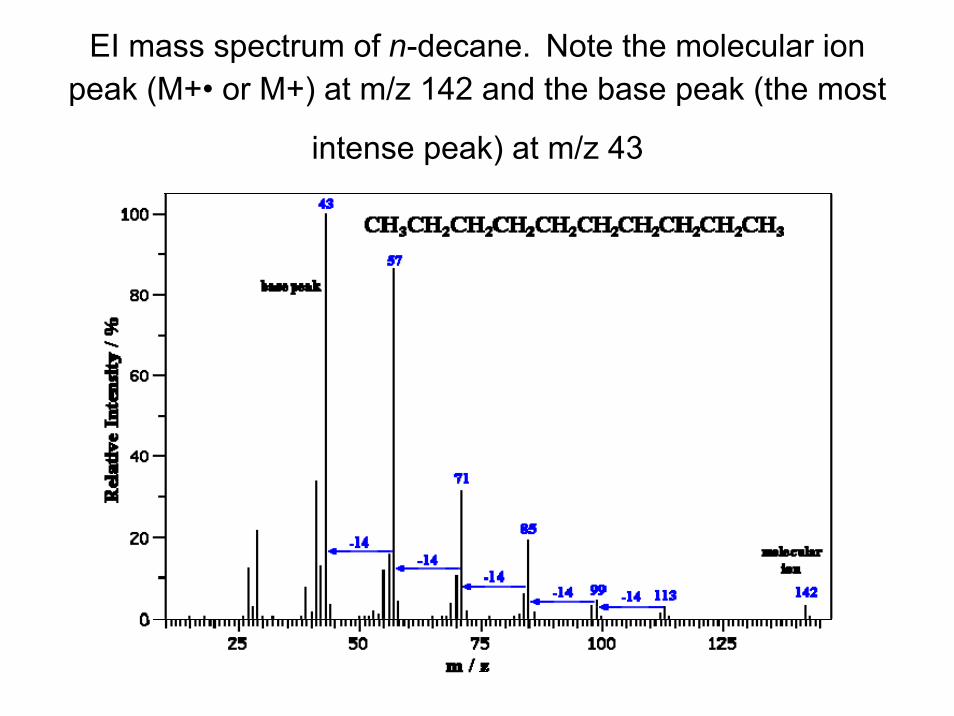
EI mass spectrum of n-decane. Note the molecular ion peak (M+• or M+) at m/z 142 and the base peak (the most
intense peak) at m/z 43
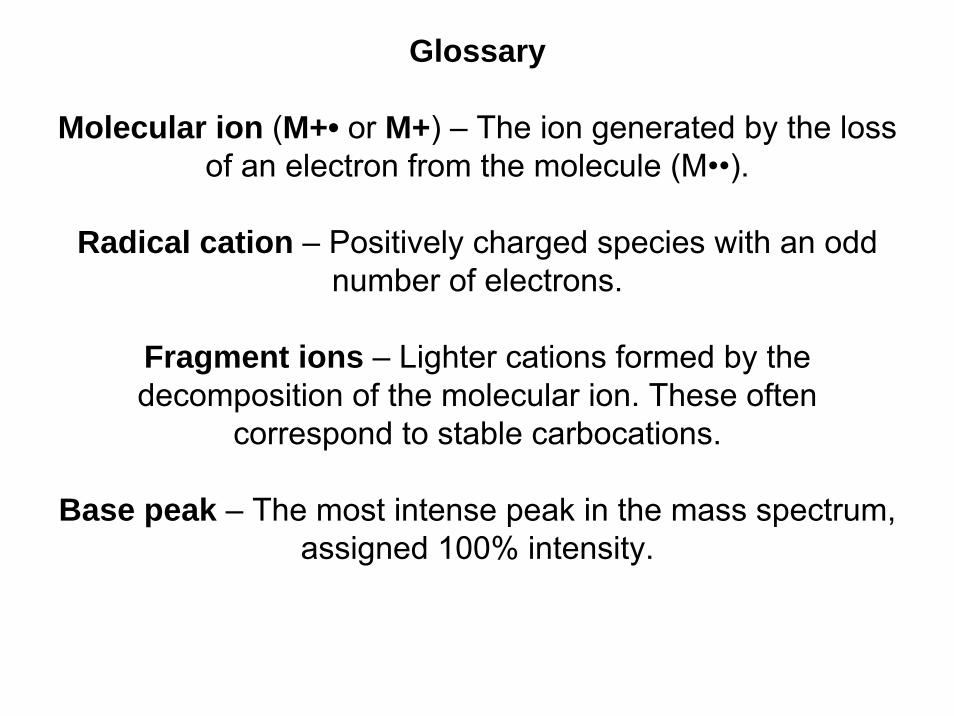
Glossary
Molecular ion (M+• or M+) – The ion generated by the loss of an electron from the molecule (M••).
Radical cation – Positively charged species with an odd number of electrons.
Fragment ions – Lighter cations formed by the decomposition of the molecular ion. These often
correspond to stable carbocations.
Base peak – The most intense peak in the mass spectrum, assigned 100% intensity.

EI mass spectrum of benzyl alcohol

The low resolution mass spectra of different compounds with the same nominal molecular weight are often similar and cannot be used to differentiate between them. Examples are the mass spectra of cyclohexane and 3,4-dihydro-2H-pyran with the molecular ion peak at m/z 84 and fragment ion peaks at m/z 69, 55, and 41 in both cases.
Cyclohexane 3,4-Dihydro-2H-pyran
O
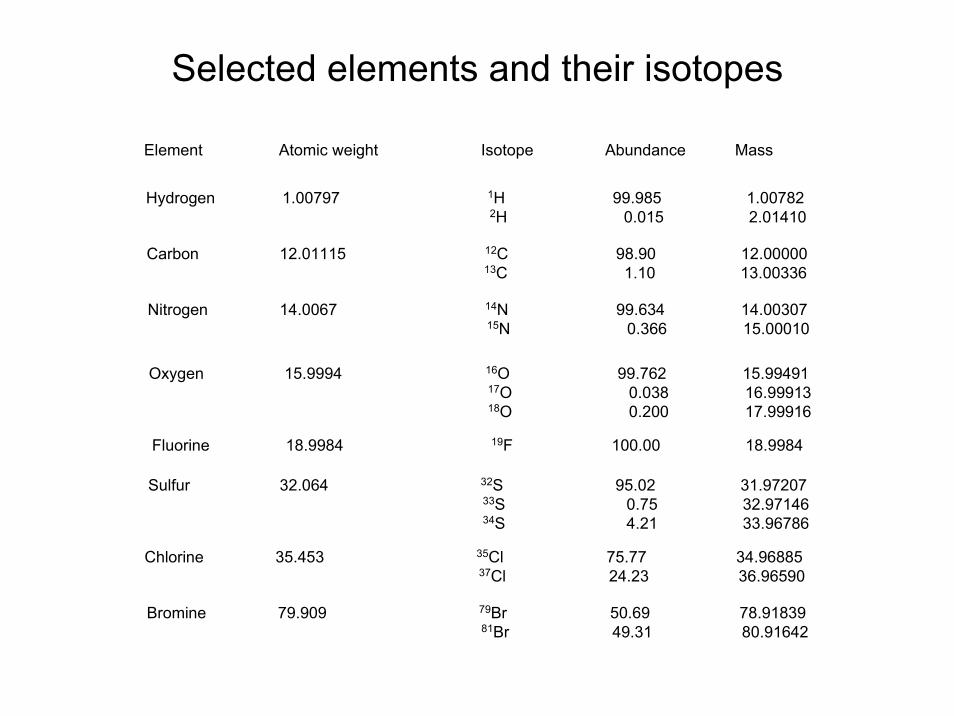
Selected elements and their isotopes
Element Atomic weight Isotope Abundance Mass
Hydrogen 1.00797 1H 99.985 1.007822H 0.015 2.01410
Carbon 12.01115 12C 98.90 12.0000013C 1.10 13.00336
Nitrogen 14.0067 14N 99.634 14.0030715N 0.366 15.00010
Oxygen 15.9994 16O 99.762 15.9949117O 0.038 16.9991318O 0.200 17.99916
Fluorine 18.9984 19F 100.00 18.9984
Sulfur 32.064 32S 95.02 31.97207 33S 0.75 32.9714634S 4.21 33.96786
Chlorine 35.453 35Cl 75.77 34.9688537Cl 24.23 36.96590
Bromine 79.909 79Br 50.69 78.91839 81Br 49.31 80.91642

Summary
Low-resolution mass spectrometer is capable of separating and detecting individual ions even those that only differ by a single atomic mass unit.As a result, molecules containing different isotopes can be distinguished.This is most apparent when atoms such as bromine or chlorine are present.Natural bromine contains two isotopes, 79Br and 81Br, with the relativeintensity of 1:1. Chlorine contains two isotopes, 35Cl and 37Cl, with therelative intensity of 3:1. Accordingly, the mass spectrum of a moleculecontaining a single chlorine atom will show two molecular ion peaks for
35Cl-M+• and 37Cl-M+• in the ratio of 3:1. The mass spectrum of a molecule containing a single bromine atom will show two molecular ion peaks for79Br-M+• and 81Br-M+• in the approximate ratio of 1:1. The intensity ratios in the isotope patterns are due to the natural abundance of the isotopes.The low-intensity "M+1" peaks are seen due the presence of 13C and 2H.

EI mass spectrum of 2-chloropropane.

EI mass spectrum of 1-bromopropane.
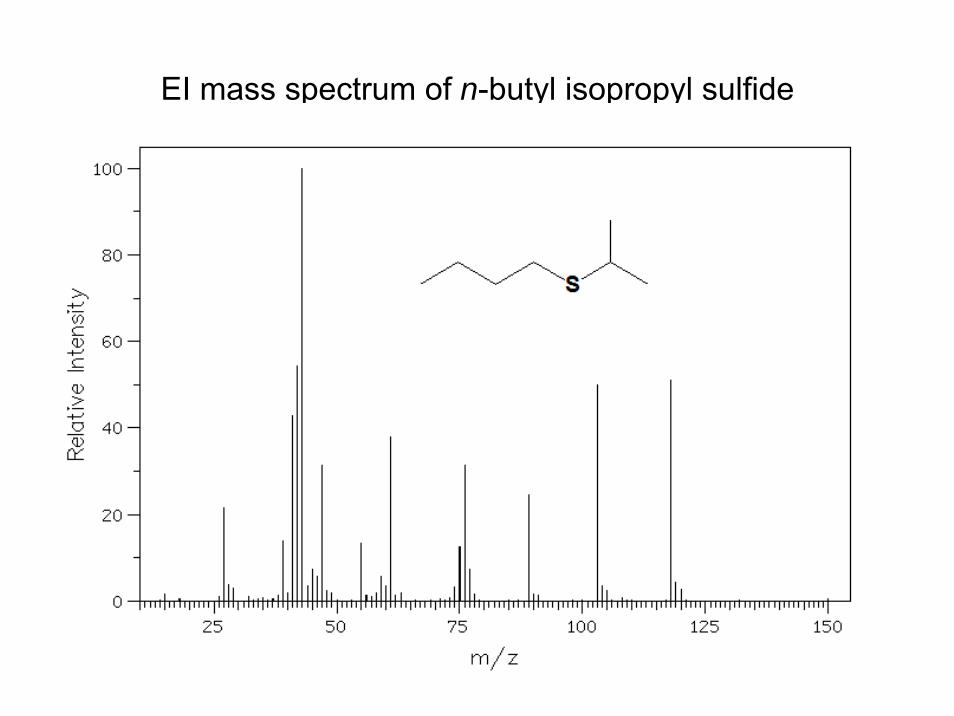
EI mass spectrum of n-butyl isopropyl sulfide
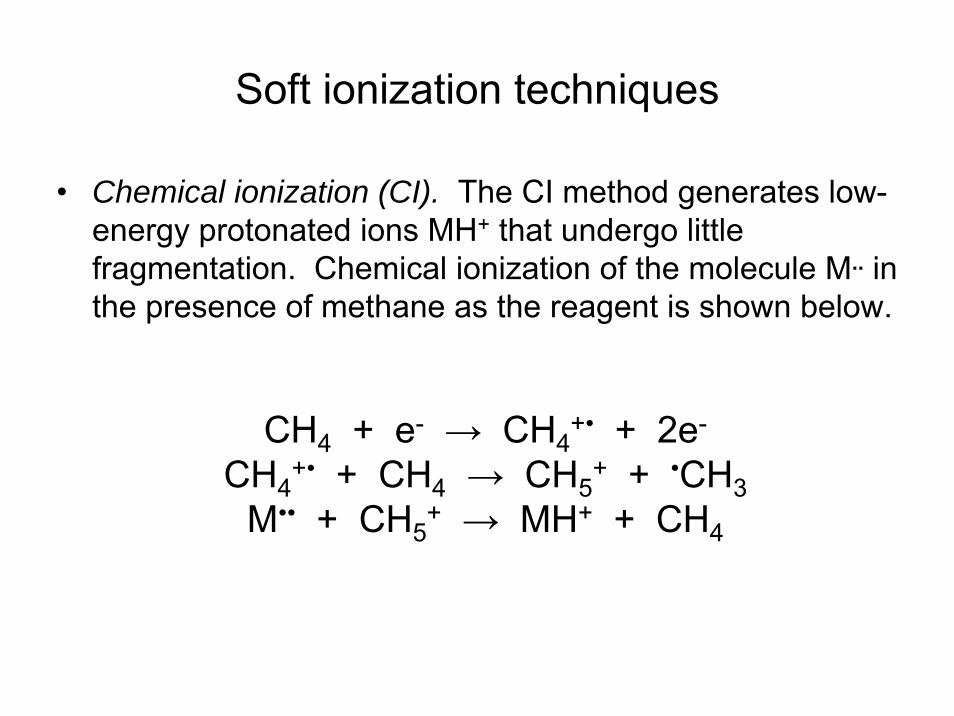
Soft ionization techniques
• Chemical ionization (CI). The CI method generates low-energy protonated ions MH+ that undergo little fragmentation. Chemical ionization of the molecule M.. in the presence of methane as the reagent is shown below.
CH4 + e- → CH4+• + 2e-
CH4+• + CH4 → CH5
+ + •CH3M•• + CH5
+ → MH+ + CH4
Soft ionization techniques (contd.)
• Electrospray ionization (ESI). ESI works by converting the high-performance-liquid-chromatography (HPLC) effluent (solution) into an aerosol in a chamber under high voltage conditions. The solvent is quickly evaporated and the charged sample, including polymers, enters the mass spectrometer. This technique often produces (M + H)+ ions.
Soft ionization techniques (contd.)
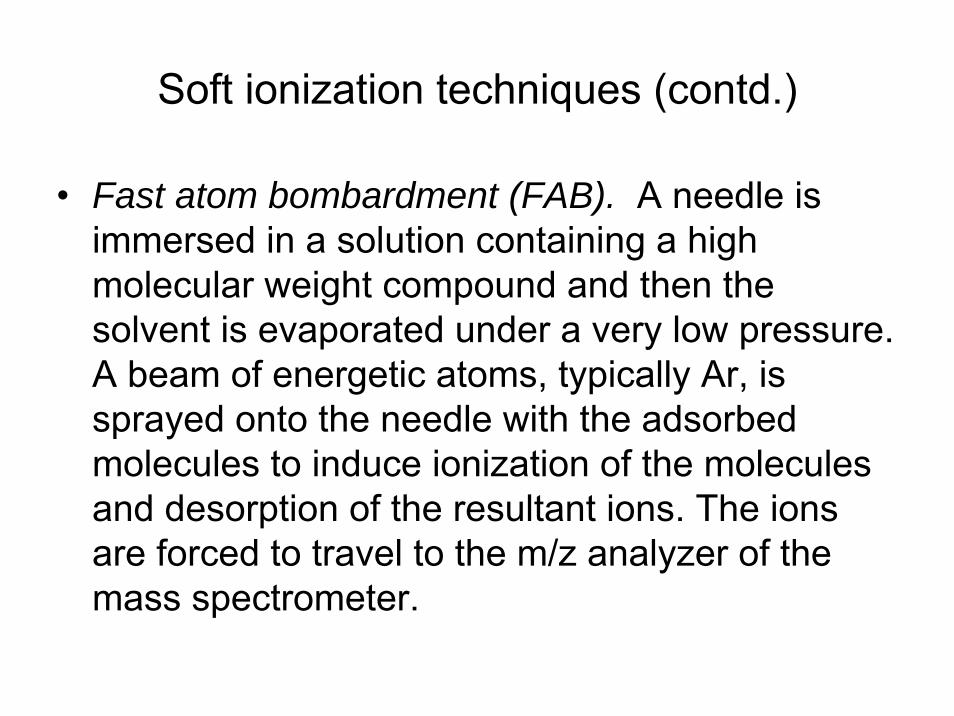
• Fast atom bombardment (FAB). A needle is immersed in a solution containing a high molecular weight compound and then the solvent is evaporated under a very low pressure. A beam of energetic atoms, typically Ar, is sprayed onto the needle with the adsorbed molecules to induce ionization of the molecules and desorption of the resultant ions. The ions are forced to travel to the m/z analyzer of the mass spectrometer.

Soft ionization techniques (contd.)
• Matrix-assisted laser desorption/ionization (MALDI). The sample, including large biopolymers (DNA fragment, protein), is irradiated with an intense beam of photons. Ionization of the molecules and desorption of the ions are facilitated by mixing the sample with a compound that enhances light absorption (matrix). The MALDI process generatesprotonated molecular ions MH+ that are relatively stable and which undergo little fragmentation.
High-resolution mass spectrometry (HR-MS)
• The single magnetic-sector mass spectrometer can unmistakably distinguish between ions differing in one mass unit. By adding an electric-field sector in tandem to the low resolution magnetic-field sector of the mass spectrometer, the resolution of ions is improved enormously (a double-focussing mass spectrometer). Its mass resolution can be accurate up to six decimal places. HR-MS can be used to identify atomic composition of a molecule (molecular formula).
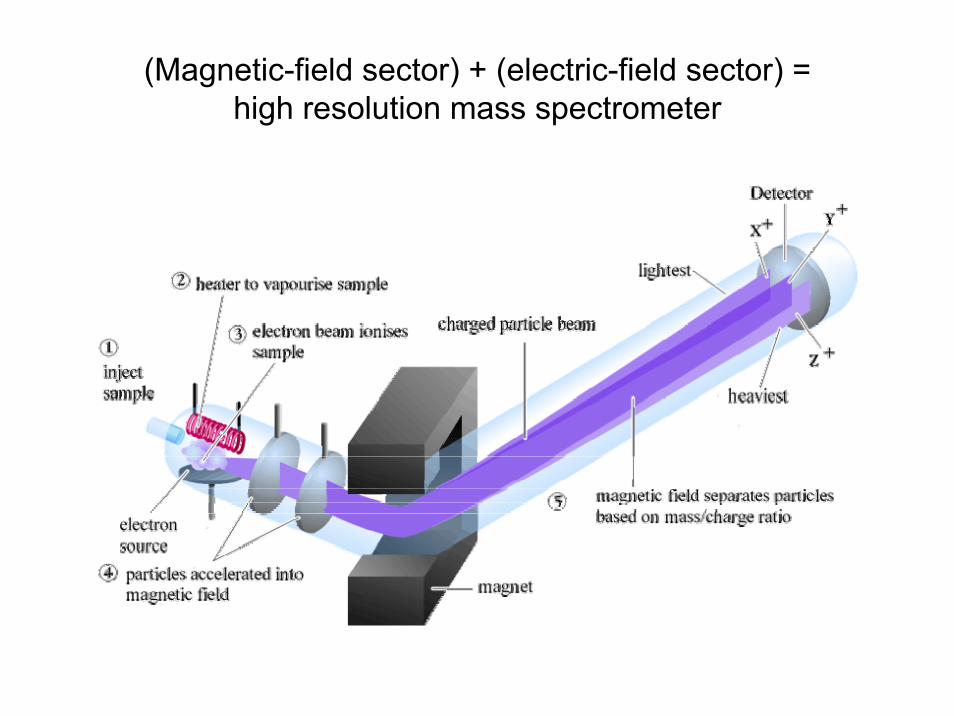
(Magnetic-field sector) + (electric-field sector) = high resolution mass spectrometer
Molecular formula by HR-MS
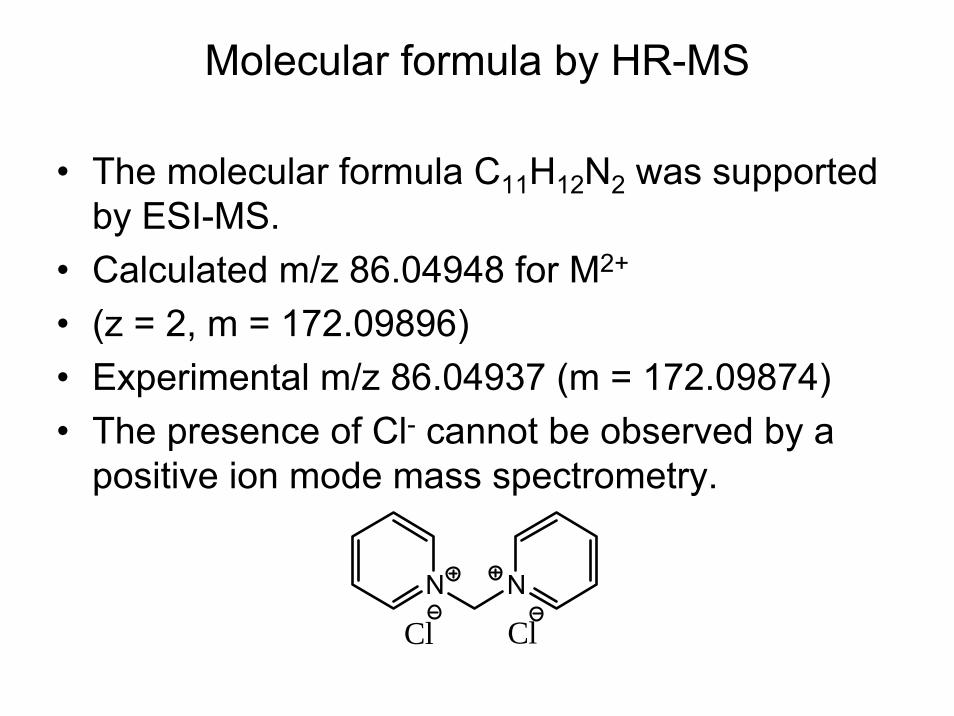
• The molecular formula C11H12N2 was supported by ESI-MS.
• Calculated m/z 86.04948 for M2+
• (z = 2, m = 172.09896)• Experimental m/z 86.04937 (m = 172.09874)• The presence of Cl- cannot be observed by a
positive ion mode mass spectrometry.
N N
ClCl
Elemental analysis (microanalysis or combustion analysis)
• A small sample (1-3 mg) is weighed on an electronic balance.• The sample is burned in the elemental analyzer.• The final gaseous products are CO2, H2O, and N2 only.• These products are separated on a gas chromatograph and
quantified.• The results are expressed as percentages of C, H, and N in the
original sample.• In the absence of other elements the oxygen content is calculated
by subtracting the percentage sum of C, H, and N from 100%.• The empirical formula can be calculated.

Elemental analysis: an example
• A student synthesized a new compound the spectral analysis of which by 19F NMR, 1H NMR, and 13C NMR suggested the structure given below.
• The elemental analysis gave the following results: C, 63.94; H, 3.48; N, 4.07. The fluorine content can be calculated as 100 – 63.94 – 3.48 – 4.07 = 28.51
N
CF3
FF Me
Me
Elemental analysis: an example (contd.)
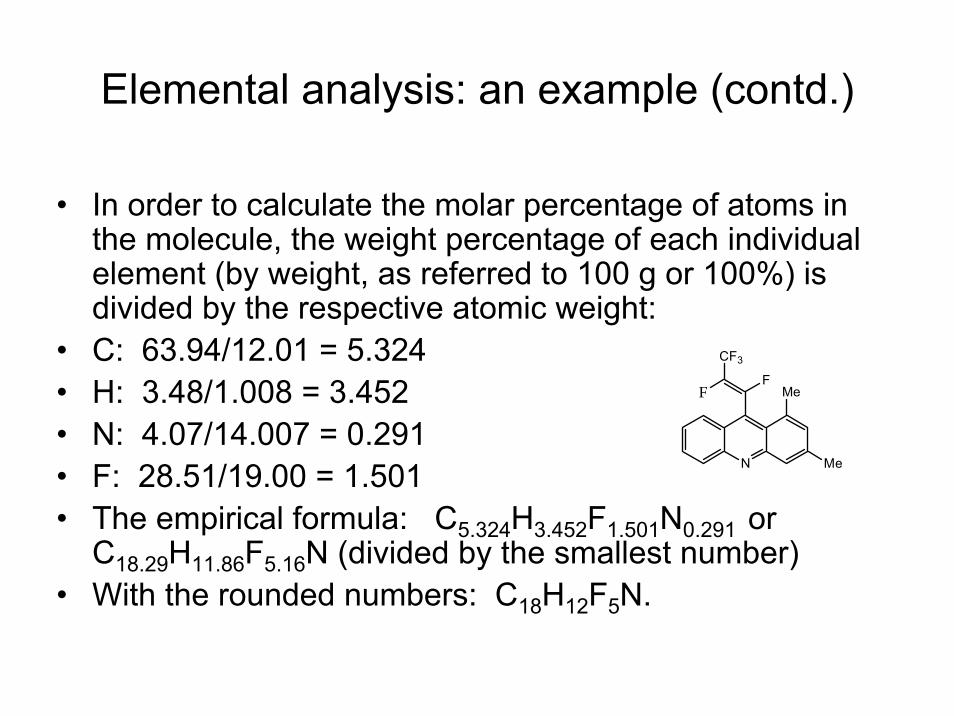
• In order to calculate the molar percentage of atoms in the molecule, the weight percentage of each individual element (by weight, as referred to 100 g or 100%) is divided by the respective atomic weight:
• C: 63.94/12.01 = 5.324• H: 3.48/1.008 = 3.452• N: 4.07/14.007 = 0.291• F: 28.51/19.00 = 1.501• The empirical formula: C5.324H3.452F1.501N0.291 or
C18.29H11.86F5.16N (divided by the smallest number)• With the rounded numbers: C18H12F5N.
N
CF3
FF Me
Me

Graduate Studies in ChemistryMS and PhD Programs offered in:
• Analytical• Biological / Biochemical• Biophysical / Computational• Organic / Medicinal
For more information:[email protected]
• Competitive stipends and fellowships; waived tuition; and assisted health insurance (PhD’s supported: 82)
• Ranked top 10 of 178 by National Research Council in “Student support and Outcomes” and “Faculty Diversity”http://www.nap.edu/rdp/
• Masters program ranked number 9 in the United States (number one in the Southeast) by the American Chemical Society for MS degrees conferred in 2008-2009http://pubs.acs.org/cen/email/html/8834acsnews1.html

24

25

26